pfc/rr-86-12 doe/et-51013-182 properties of reinforced
TRANSCRIPT

PFC/RR-86-12 DOE/ET-51013-182
STRUCTURAL PROPERTIES OF REINFORCED COPPER
H. Becker, M. Besen, E. Bobrov, J. Chen,and .B. Montgomery, Massachusetts Institute
of Technology/Plasma Fusion CenterD. Tognarelli and R. Walty, Manlabs

SUMMARY
Exploratory experimental studies were performed, and simple predic-
tion procedures were developed, to determine Young's moduli and yield
strengths of reinforced copper under inplane tension and under face con-
pression. The predictions are compared with the test data. Agreement
appears to be good enough to support the hypothesis that those properties
can be predicted by mixture rules. For the near-term, it appears reason-
able to employ the prediction procedures in Compact Ignition Magnet de-
sign. However, more testing is required to increase confidence in use of
the procedures. An example illustrates application of the method to CIT
magnet coil design.
The primary purpose of the study has been to explore the structural
response of reinforced-copper laminated composites when subjected to face
compression. Perhaps the most important results obtained so far are the
observations that the reinforced copper withstood face pressures much
greater than the copper yield strength, and that the copper did not ex-
trude laterally.
-1-
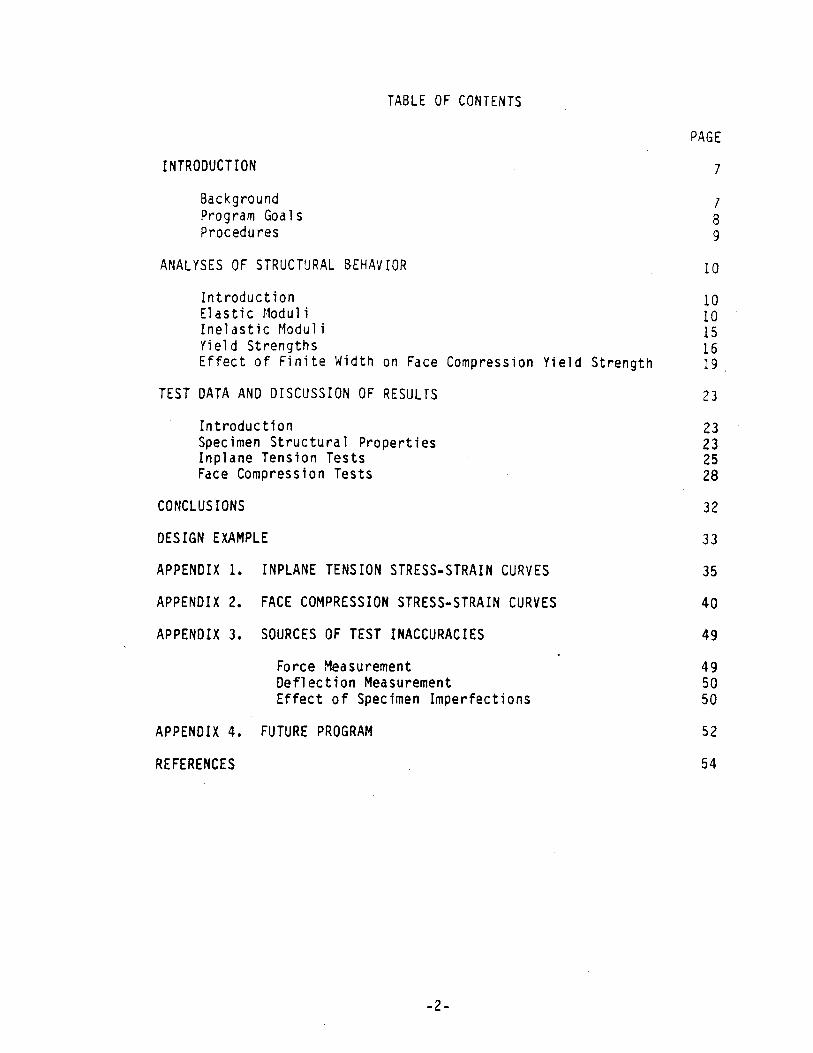
TABLE OF CONTENTS
INTRODUCTION
BackgroundProgram GoalsProcedures
ANALYSES OF STRUCTURAL BEHAVIOR
IntroductionElastic ModuliInelastic ModuliYield StrengthsEffect of Finite Width on Face Compression Yield Strength
TEST DATA AND DISCUSSION OF RESULTS
IntroductionSpecimen Structural PropertiesInplane Tension TestsFace Compression Tests
CONCLUSIONS
DESIGN EXAMPLE
APPENDIX 1. INPLANE TENSION STRESS-STRAIN CURVES
APPENDIX 2. FACE COMPRESSION STRESS-STRAIN CURVES
APPENDIX 3. SOURCES OF TEST INACCURACIES
Force MeasurementDeflection MeasurementEffect of Specimen Imperfections
APPENDIX 4. FUTURE PROGRAM
REFERENCES
-2-
PAGE
7
789
10
1010151619
23
23232528
32
33
35
40
49
495050
52
54
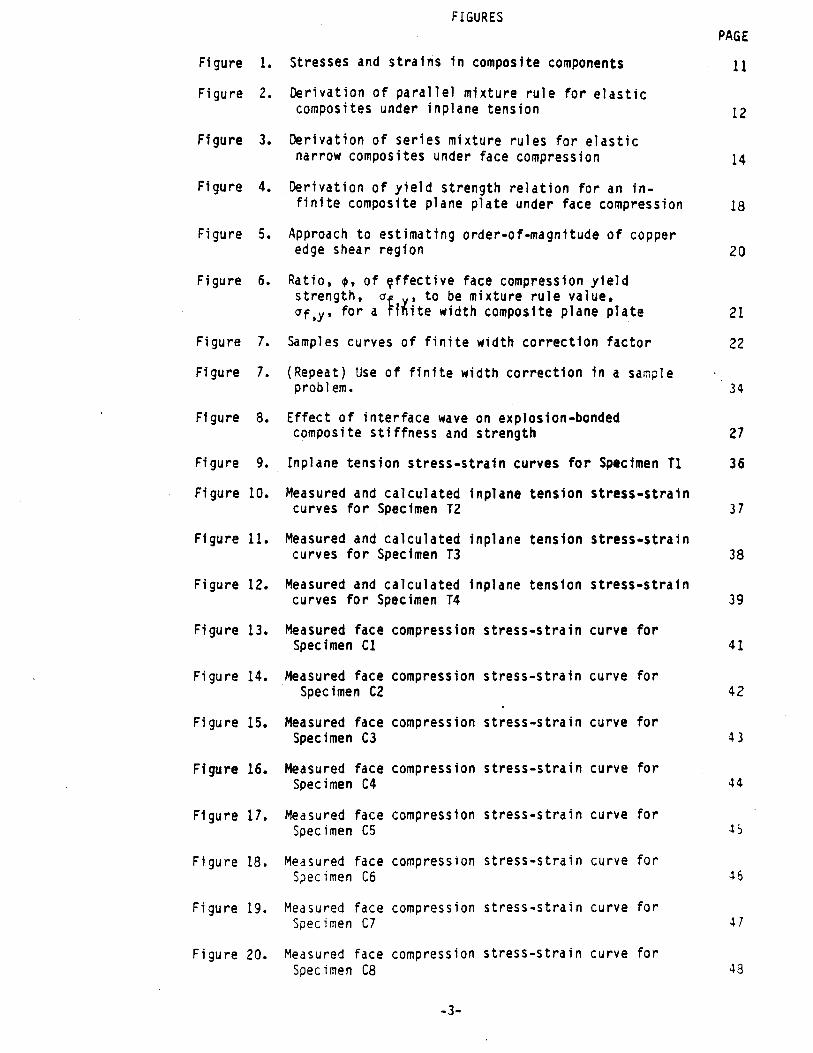
FIGURES
Figure 1. Stresses and strains in composite components
Figure 2. Derivation of parallel mixture rule for elasticcomposites under inplane tension
Figure 3. Derivation of series mixture rules for elasticnarrow composites under face compression
Figure 4. Derivation of yield strength relation for an in-finite composite plane plate under face compression
Figure 5. Approach to estimating order-of-magnitude of copperedge shear region
Figure 6. Ratio, o, of effective face compression yieldstrength, a , to be mixture rule value,af'Y, for a ;Itite width composite plane plate
Figure 7. Samples curves of finite width correction factor
Figure 7. (Repeat) Use of finite width correction in a sampleproblem.
Figure 8. Effect of interface wave on explosion-bondedcomposite stiffness and strength
Figure 9. Inplane tension stress-strain curves for Specimen TI
Measured and calculated inplane tensioncurves for Specimen T2
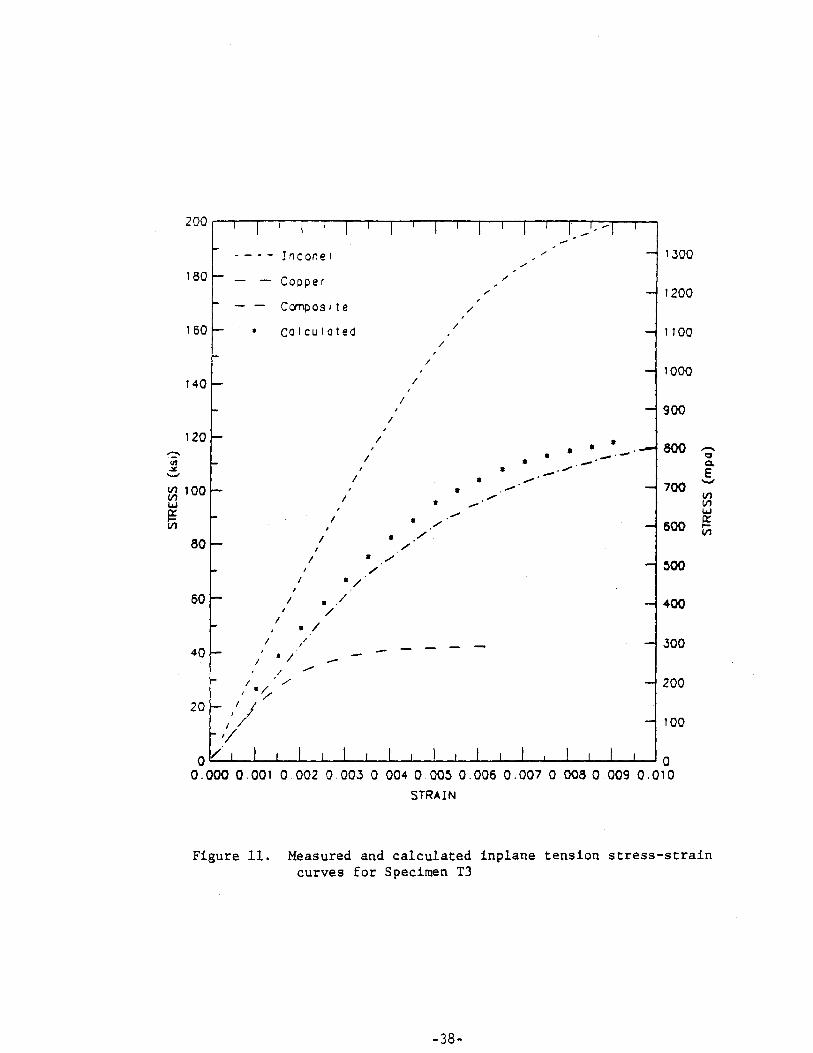
Measured and calculated inplane tensioncurves for Specimen T3
Measured and calculated inplane tensioncurves for Specimen T4
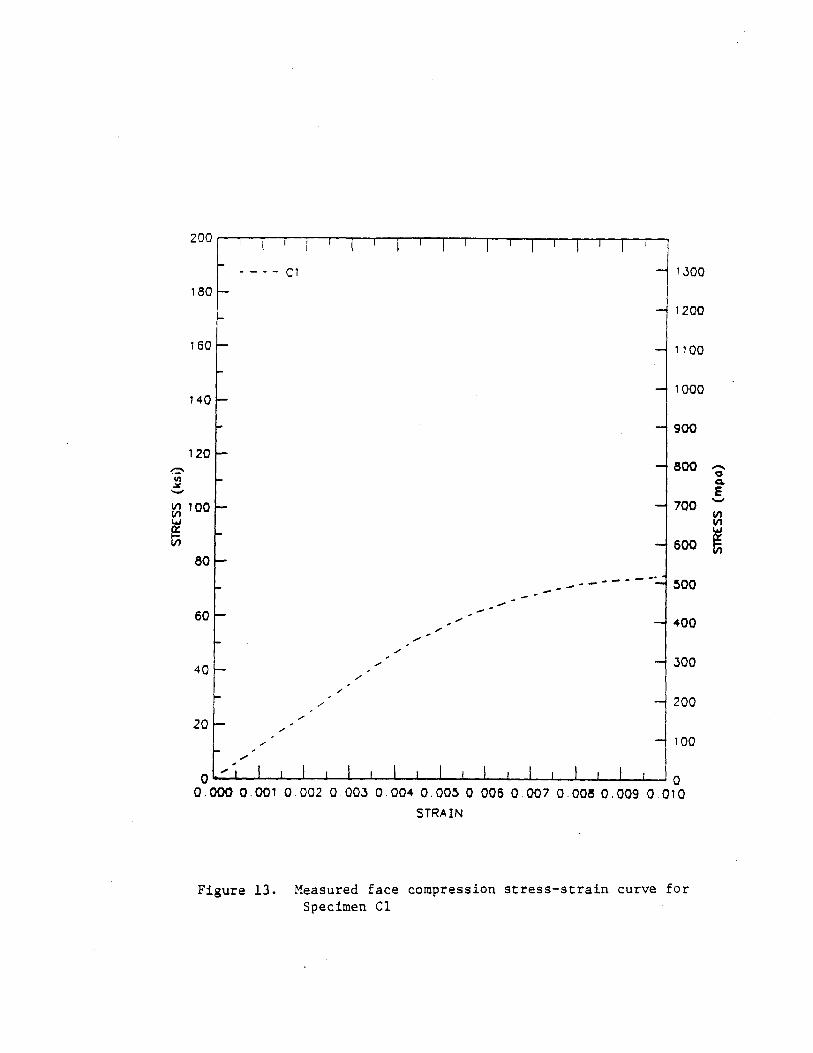
Measured face compression stress-strainSpecimen C1
Measured face compression stress-strainSpecimen C2
Measured face compression stress-strainSpecimen C3
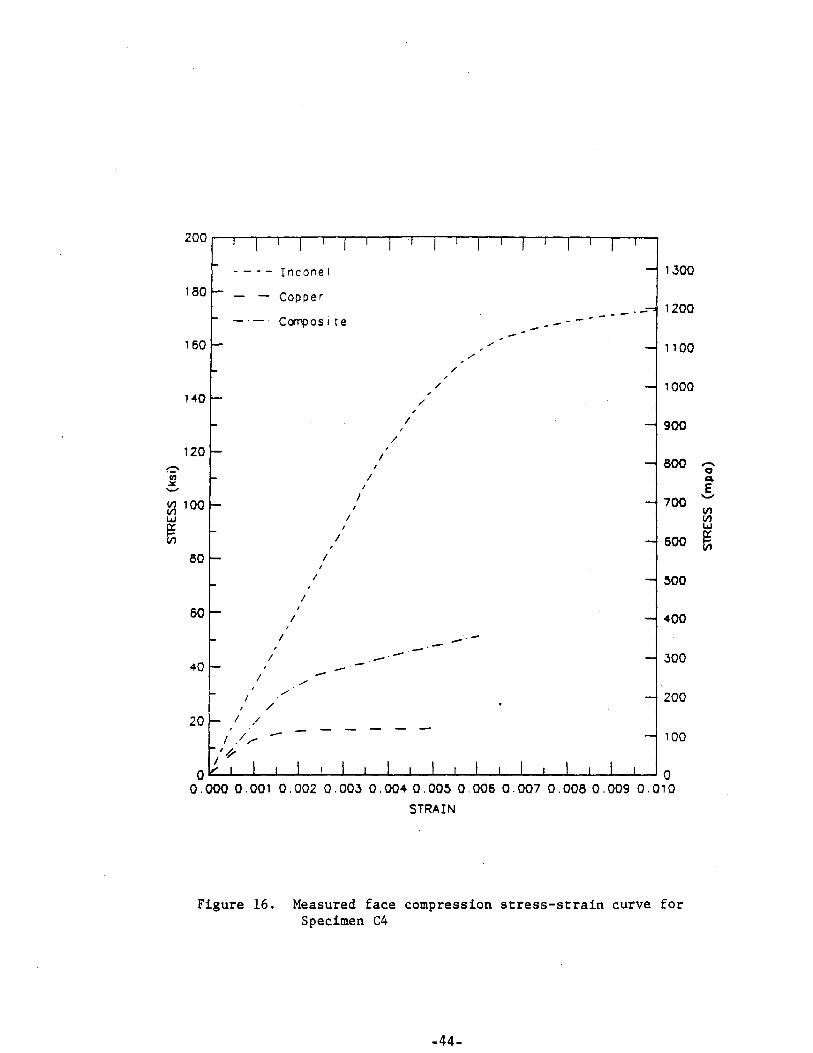
Measured face compression stress-strainSpecimen C4
Measured face compression stress-strainSpecimen C5
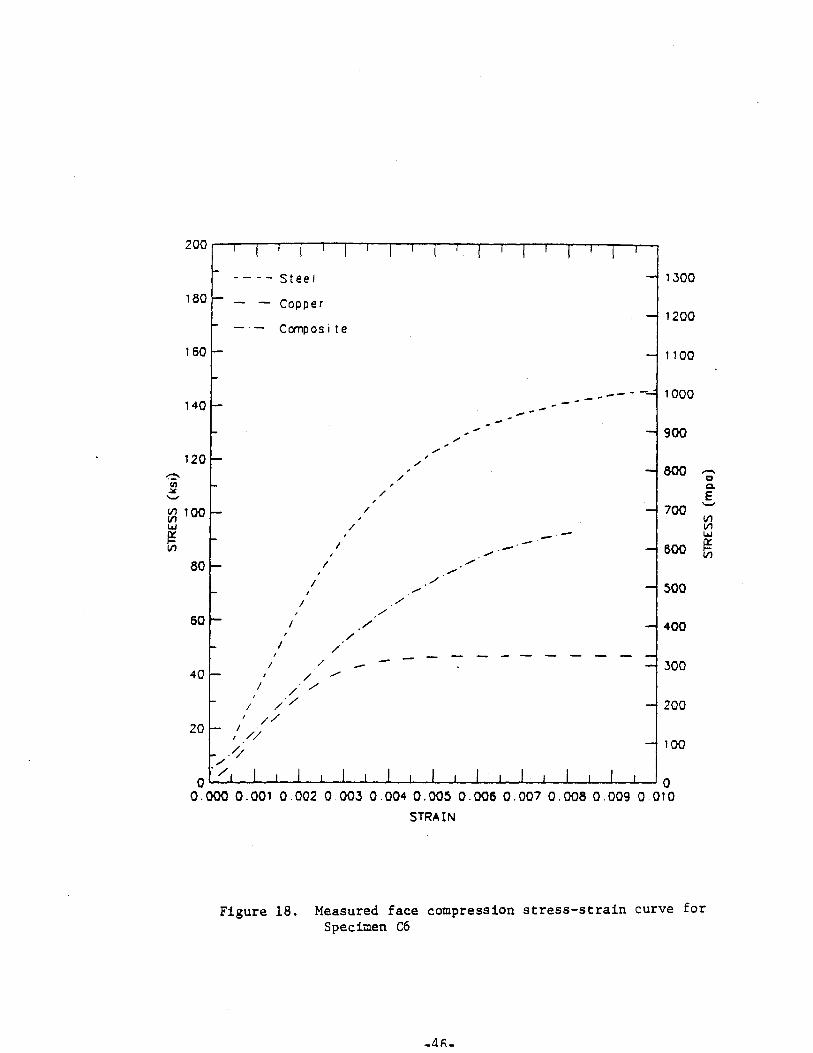
Measured face compression stress-strainSpecimen C6
Measured face compression stress-strainSpecimen C7
Measured face compression stress-strainSpecimen C8
stress-strain
stress-strain
stress-strain
curve for
curve for
curve for
curve for
curve for
curve for
curve for
curve for
-3-
PAGE
11
12
14
18
20
21
22
34
27
36
Figure
Figure
Figure
Figure
Figure
Figure
Figure
Figure
Figure
Figure
Figure
10.
11.
12.
13.
14.
15.
16.
17.
18.
19.
20.
TABLESPAGE
Table 1. Test specimen structural property data 24
Table 2. Composite inplane tension test and analysis results 25
Table 3. Composite face compression test and analysis results 29
-4-

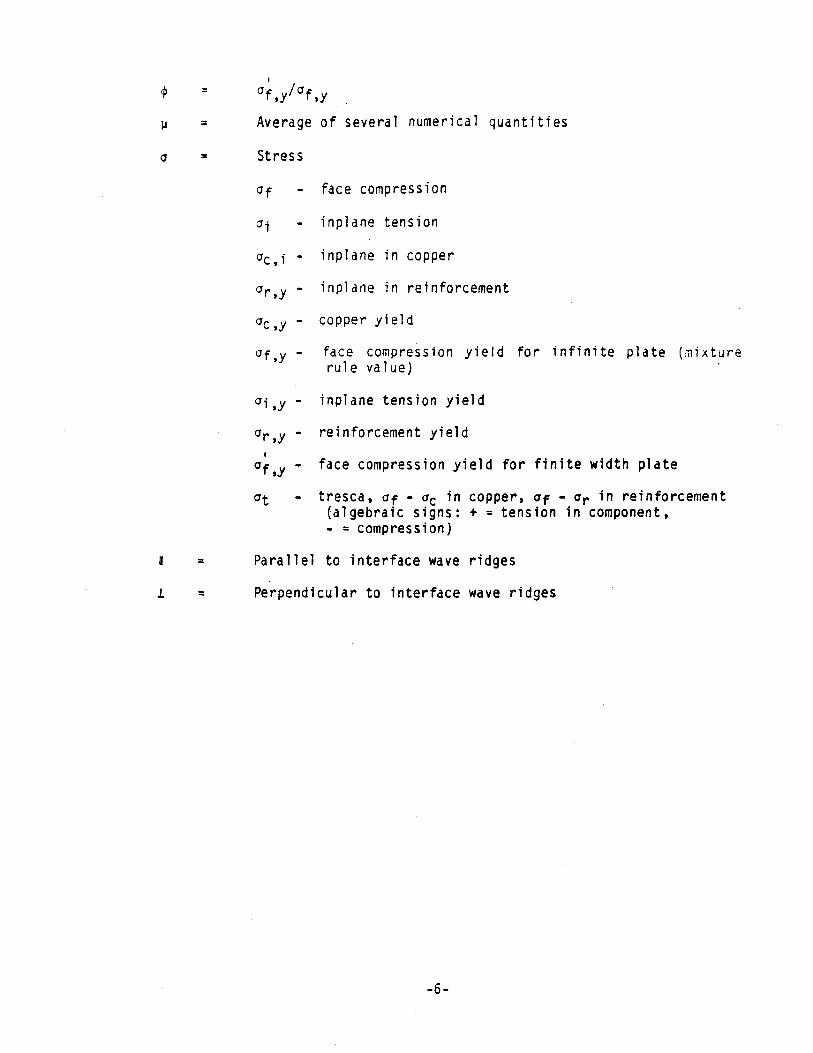
SYMBOLS
b = arbitrary length
E = Young's modulus:
Ec - copper
Ei - composite under inplane tension
Ef - composite under face compression
Er - reinforcement
Et = Tangent modulus
Et,c - copper
Et,i - composite under inplane tension
Et,f - composite under face compression
Etr - reinforcement
E-B = Explosion-bonded (Composite)
L = Length of edge shear zone on finite width plate
R = Aspect ratio of copper in stack, w/tc
R-B = Roll-bonded (composite)
tc = Total Thickness of copper component in composite
tr = Total Thickness of reinforcement component in composite
w = Width of square plate in stack
Xi = "umerical value of i-th quantity in statistical analysis
C = tc/(tc + tr)
£ = Strain
ec - in copper, through thickness
E~r - in reinforcement, through thickness
Ej - general inplane
ec,i - inplane in copper
erji - inplane in reinforcement
-5-
I'
a
-6-
-f,y/cf,y
= Average of several numerical quantities
= Stress
af - face compression
ai - inplane tension
ac,i - inplane in copper
ar,y - inplane in reinforcement
c ,y - copper yield
af'y - face compression yield for infinite plate (mixturerule value)
aiy - inplane tension yield
ar,y - reinforcement yield
af'- face compression yield for finite width plate
at- tresca, af - ac in copper, af - ar in reinforcement(algebraic signs: + = tension in component,- = compression)
= Parallel to interface wave ridges
= Perpendicular to interface wave ridges
II
I

INTRODUCTION
Background
Compact Ignition Magnets are being designed with copper conductors.
The high central toroidal fields (9 to 10 tesla) induce fields of the
order of 20 tesla at the outer radii of the inner legs on the TF coil.
The average toroidal compression stresses are in the 450 MPa range. The
free-standing OH coil has a 24 tesla field inside the winding, which in-
duces average toroidal tension stresses of 440 MPa. The fields from the
PF coil system induce vertical compression equal to 80 MPa.
This situation requires a conductor with high strength. It also re-
quires good electrical conductivity to minimize temperature rise during a
pulse. One method of producing plates with that combination is to gener-
ate a composite structure by bonding high conductivity copper to a high
strength metal such as Inconel (or perhaps stainless steel). The struc-
tural properties of such a combination have been explored in both inplane
tensionl, 2 , and in face compression 3 , in connection with magnet design.
The tests of Reference 3 were performed on unbonded copper/steel stacks in
which the components were a few mils thick and about 2 inches in diameter.
Observed yield strengths were of the order of twice that of cold worked un-
bonded copper. That situation may exist in Alcator C, although the plate
thicknesses are much greater.
Prediction of inplane behavior appears to be reasonably straight-
forward. However, response to face compression had not been explored
enough to permit defining a design procedure. Furthermore, many magnet
engineers have assumed that face compression behavior is limited by the
-7-

properties of the unreinforced copper, although evidence exists4 to indi-
cate that such an assumption may be overly conservative.
It is the purpose of this study to explore those types of structural
behavior and to reveal the gain in face compression yield strength when
copper is reinforced by a high strength metal.
Program Goals
The primary goal of the Composite Test Program is to provide struc-
tural property data for magnet coil design. In the CIT Program the TF coil
will be loaded only in toroidal compression, radial compression, and ver-
tical bending. The PF coils will be loaded in toroidal tension, vertical
compression, radial compression, and possibly in vertical and radial
bending. Consequently, both inplane tension and face compression data
are required.
It is desirable to develop a procedure for predicting the structural
behavior of the reinforced copper composite, not only as a fundamental
scientific activity, but also to calculatb the impact of likely design
changes as the program proceeds.
Another program goal is to determine whether a predictable relation
exists between the yield strengths for inplane tension and for face com-
pression. Inplane tension tests require relatively small amounts of ma-
terial. Furthermore, they can be performed quickly using more-or-less
standard specimens and measurement techniques in conjunction with testing
machines that produce loads in the 10,000 lb (70 KN) range. Face compres-
sion tests require large amounts of material arrayed in stacks, and loads
in the Multi-Mlb (tens of MN's) range. Use of large machines for com-
pression tests often require long lead times. Furthermore, no standards
-8-

exist for performing that type of test. As a result, there would be
value in being able to perform only tension tests to obtain both tension
and compression yield strength data.
Procedures
This program involves developmemt of methods for predicting composite
response to inplane tension and to face compression, conduct of tests to
reveal the general nature of the response, and comparison of prediction
with test data. Experiments were performed on roll-bonded, explosion-
bonded and unbonded composites. They included strip stress-strain tests
on the composite components and on the composites, as well as face com-
pression stress-strain tests on stacks of both bonded and loose plate
segments.
A simple procedure was developed for converting component tension
stress-strain curves into inplane tension stress-strain curves for a
reinforced copper composite. An hypothesis was employed that led to a
calculation method for face compression yield strength of an infinite
plane plate. A method also was developed for estimating the strength of
a finite width plate. Those procedures were combined into a method for
predicting the yield strengths of the test stacks. Measured yield
strengths were compared with the predictions for eight stacks with wide-
ly varying properties. The measured compression yields also were com-
pared with the measured tension yields of four bonded composites.
The results of the comparisons led to the conclusions at the end of
the report. Planned continuation activities also are presented.
-9-
ANALYSES OF STRUCTURAL BEHAVIORS
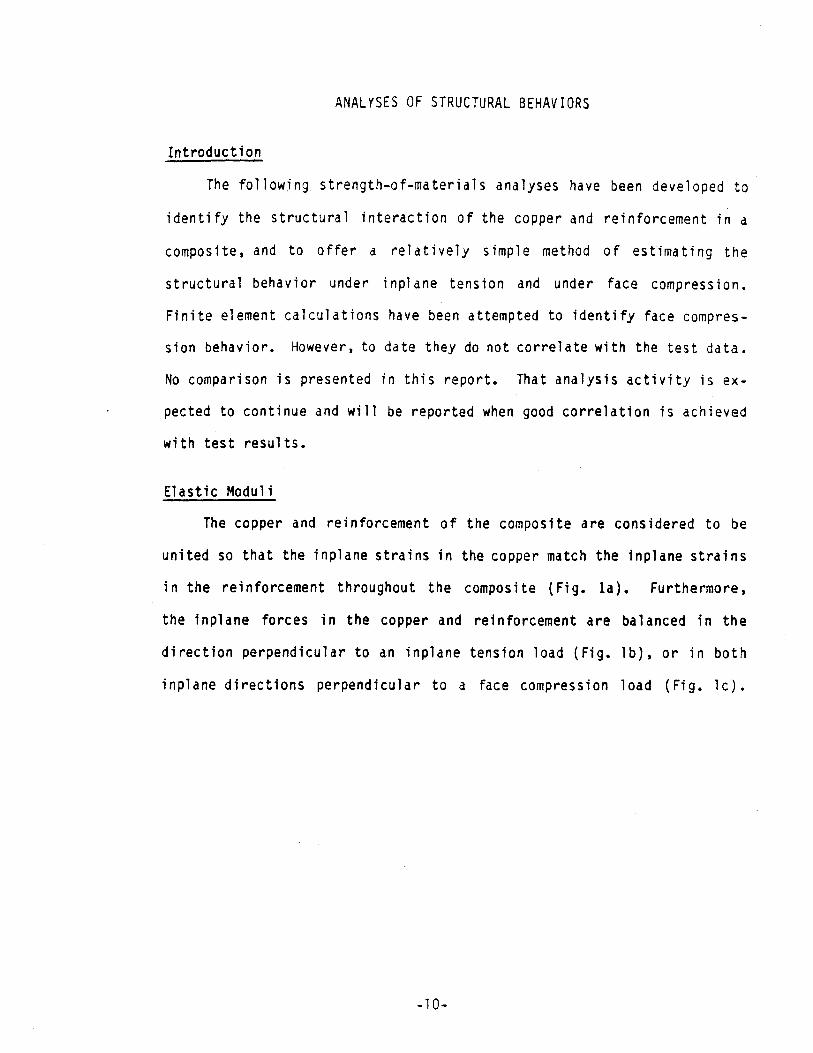
Introduction
The following strength-of-materials analyses have been developed to
identify the structural interaction of the copper and reinforcement in a
composite, and to offer a relatively simple method of estimating the
structural behavior under inplane tension and under face compression.
Finite element calculations have been attempted to identify face compres-
sion behavior. However, to date they do not correlate with the test data.
No comparison is presented in this report. That analysis activity is ex-
pected to continue and will be reported when good correlation is achieved
with test results.
Elastic Moduli
The copper and reinforcement of the composite are considered to be
united so that the inplane strains in the copper match the inplane strains
in the reinforcement throughout the composite (Fig. la). Furthermore,
the inplane forces in the copper and reinforcement are balanced in the
direction perpendicular to an inplane tension load (Fig. lb), or in both
inplane directions perpendicular to a face compression load (Fig. 1c).
-10-
b
REINFORCEMENT b*1
COPPER Awn
a. INPLANE STRAIN MATCH
b. INPLANE FORCEBALANCE DUETO INPLANE LOAD
(APPLIEDai INPLANE
STRESS)
Itsa,
C~
c. INPLANE FORCEBALANCE DUETO FACE LOAD
(APPLIEDaf FACE
COMPRESSION)
C,i
c,i
Figure 1. Stresses and Strains in Composite Components.
-11 -

a tc + t r
Reinforcement
b
Copper
t tr
bE
r tr
a tc c
a (tc + tr c,i + ar,i tr
or with a tc/(tc + tr (b)
a acC,i + a)ar,i
C, aci /Ec C r,i r (C)
E = a /E = aE + (1 - a)Er (d)
Figure 2. Derivation of Parallel Mixture Rulefor Elastic Narrow Composite UnderInplane Tension
-12-

For determination of the inplane Young's modulus, it is assumed that
Poisson's ratio is the same for the composite components. As a result, the
lateral strains would be the same in each component from the portion of ap-
plied load that it carries. In that case, no transverse forces would exist
and the inplane elastic modulus could be determined by a simple parallel
mixture rule (Fig. 2),
Ei - aEc + (1 - a) Er (1)
If the interfaces were not united, and were frictionless in addition,
the simple series mixture rule
1/Ef = a/Ec + (1 - a)/Er (2)
would apply to face compression as shown in Fig. 3a. However, the be-
havior of a united composite under elastic face compression would be more
complex (Fig. 3b). The face compression, a, would be the same on both
components. Consequently, the copper inplane Poisson expansion, vaf/Ec,
would exceed that of the steel, vaf/Es. This would induce equi-biaxial
inplane tension in the steel and compression in the copper such that the
inplane forces would balance in both inplane directions. As can be seen
in Fig. 3b, the effective Young's modulus for face compression would be
found from
2v2a(1 - cg)(1 - Ec/Es)2
1/Ef = a/Ec + (1 - a)/Es - ( - a(1 - EcEs) (3)(1 - v)Ec (I - a + (%EC/Es)
The first two terms are the same as the RHS of Eq. (2). The third term
will vanish when a = 1 or 0. It would be small in any case. For example,
if v = 0.3, a = 0.5, and Ec/Es = 1/2, then the term would be equal , ap-
proximately, to 0.02/Ec, which would have little effect on Ef.

t C, w ..... a..r r r
Wit
fCt ~ ~ ~ w 4 ) t£+
(ta + tc f cc rr+ t r
1/E - e - a/Ec + (1 - a)/Er
At V a V - V
r = f r
Ec -a /EC f c
r
cC
= va /E
va f/E
a. Behavior of Frictionless Interface, Non-united Components
t e _m
r r .1 -i r,i
t eC C tc c af
plane plate,
CC f/Ec - 2vci/Ect r a fO/E + 2va /Er
Sr,i r ci c
c,= v f/Ec - ( - v) aCi/Ec = Vf/Er + (1 - v) Or/Er ri.
(t + ts ) f = tc c + tr r
1/E - a/E + (1 - a)/E _ 2v 2a(l- o)(1 - Ec/Er) 2
f c r (1 - v)E (1 - a + a E c/E r
b. Behavior of Composite
Figure 3. Derivations of Series Mixture Rules for Elastic
Composites Under Face Compression.
-14-
(e)
(f)
For an infinite
(g)
(h)
Wi
(j )

Inelastic Moduli
The local slope of the composite stress-strain curve can be found
from Et = da/de. For inplane loads on a narrow strip (small w/t),
Et,i = Et,c + (1 - a) Etr (4)
Et,i will be zero for an elastic-plastic copper in the yield range. In
that case
Et,r = Et/(1 - a) (5)
In any case, the parallel mixture rule would apply at all strain levels.
A wide plate (w/t >> 1) will have inplane stresses perpendicular to
the load direction due to the different Poisson's ratios of the inelastic
copper and the still-elastic reinforcement. The theoretical prediction
of that behavior is being investigated. Intuitively, however, the tresca
stress in the reinforcement could be increased because of that condition.
As a result, the composite strain at any stress would be expected to in-
crease.
Face compression tangent moduli also could be computed from Et = da/
de. In that case
1/Et,f = a/Etc + (1 - a)/Et,r (6)
However, the problem is identifying Et,c and Et,r at any stress level
using the stress-strain curves of the composites. That problem also is
being investigated.

It it possible to determine ai,y from the parallel mixture rule if
Et,c is small. Another theroretical method is to construct the stress-
strain curve from th-e curves of the components, using the procedure de-
scribed above, and then finding the 0.002 strain offset stress level.
Yield Strengths
There can be little doubt that the joining process and subsequent
treatment will alter the yield strengths of the composite components.
Consequently, from a practical standpoint, the best way to determine the
composite inplane tensile yield (and ultimate, also) may be to measure
that property on samples of the composite with component proportions in
the range of anticipated design values.
Determination of the face compression yield may present a problem, as
discussed below. If a relation can be established between inplane tension
yield and face compression yield, the difficulty might be circumvented.
There may be a basis for believing that both those yield values would be
the same.
It is hypothesized that tresca yielding would occur in an infinite
composite plane plate under face compression when both components yield
simultaneously. That is, the tresca stress1 in the copper would reach
the uniaxial copper yield strength at the same time that the tresca stress
in the reinforcement reaches the uniaxial reinforcement yield strength
It should be noted that the equi-biaxial inplane stress field in eachcomponent, under face compression, leads to the same effective stresswhether the tresca or the von Mises criterion is used.
-16-

(Fig. 4). When the inplane force balance is included, it is found that
the face compression yield strength is
af,y ~ Iac,y + (1 - I)ar,y (7)
It is like the mixture rule for a parallel system, which could pertain
to the inplane tension yield strength of the composite. That implies,
that the face compression yield strength for an infinite plane plate
would be the same as the inplane tension yield strength of a narrow strip.
-17-

ra
r,y
c
tresca 0 fy (Basio Assumption) (k)
f~y -a .= a()c,i C,ya +a = a (M)f,y r,i r,y
c t C a t , or a (1 - a)a (n)c c r r C r
Then a = a a +C(Y -l )ary (o)
* NOTE: The tresca and von Mises stresses are equal, since the inplanestresses are the same in all directions.
Figure 4. Derivation of Yield Strength Relation for an InfiniteComposite Plane Plate Under Face Compression.
-18-

Effect of Finite Width on Face Compression Yield Strength
The aspect ratio, R = w/tc, of the copper component will determine
how closely the composite face-compression yield strength can approach
the mixture rule value in Eq. (7). An estimate of the effect is devel-
oped in this section. Use is made of that procedure subsequently in com-
paring predictions with test data.
An important factor is the ratio of reinforcement yield strength to
copper yield strength, as can be seen from the equations in Figs. 5 and 6.
If ar,y >> ac,y, that could offset the advantage of larger R.
Figure 7 illustrates how the various parameters atfect the tinite
width connection factor. The relations are
L (1 + c) + (1 - a)(ar,y/ac,y) (8)w + (1 - a)(ar,y/ ac,y)
where
L/w = (L/tc)/(w/tc)
and
L/tc = (0.866)(1 - c)(ar,y/ac,y -1) (9)
-1 %

f c,i
GC'i --- db.- t
-L 7
From inplane force balance,
2 Tc,yL = ac,tc
or
L/tc
Assume von Mises
TC'y
= aci/ 2TC,y
shear yield in copper,
= ac,y/(3) 1/2 = 0.577 ac'y
Then
L/tc = 0.866 ac,i/lc,y
From the mixture rule,
af,y = 44c,y + (1 - a)
The tresca criterion requires that
Combine (b), (d), (e) and (f) to o
L/tc = 0.866 (1 - a)(a
ar,y
af,y - ac,i = ac,y
btai n
r,y/ac,y - 1)
Figure 5. Approach to estimating order-or-magnitude of copperedge shear region, using simplified model.
-20-
( W)
( X)
( y)
( z)
(aa)
(bb)
(cc)

Assumed Linear
af'y
I !4j II
L
: ~-___~c~if-i - I
From face compression force balance,
af,yw = af,y(w - 2L) + ac,iL
af,yItf,y = 1 - (L/w)(2 - ac,i/ f,y)
From the mixture rule (e) and the tresca condition (f),
* = af,y/af,y = 1 - (L/w)(1 + a) + (1 - a)(ar,ylac,y)
a + (1 - a)(ar,ylac,y)
Figure 6. Ratio o, of effective face compression yield strength, affto the mixture rule value, of,y for a finite width composP eplane plate.
or
(dd)
(ee)
(ff)
r 141 1 1I a I I

-Ac
I/ Il
-W-- - --I!
Figure 7. Sample curves of finite width correctionfactor.

TEST DATA AND DISCUSSION OF RESULTS
Introduction
Experimental results are presented, and are compared with predic-
tions. There are many possible sources of inaccuracy in the measured be-
havior. Appendix 3 contains a discussion of some of those sources. It
contains indications of the accuracies inherent in the load and deflec-
tion measuring devices, and identifies the possible role of specimen im-
perfections on observed specimen behavior.
The behavior of a face-compression composite depends upon compression
stress-strain data in combination with inplane compression data for the
copper, and with inplane tension data for the reinforcement. However, in
this exploratory stage of the program it was convenient to confine the com-
ponent material property testing to inplane tension. Compression testing
of component material properties has been deferred to a later stage.
Specimen Structural Properties
The composite test specimen material and dimensional data appear in
Table 1. Inplane tension stress-strain curves for the component materials
are in the Appendices. They are the sources of the yield strengths and
Young's moduli shown in the table.

0n LAi mANJV.- * * * ~ enr * 01 V.s N - Nfl,) Nj - -
.0 .0~ ~ * * *
~ ~ NJ NJ NJ NJ NJ NJ NJ
a) -~ - C**~ ~ -~ ~a):LI
- -~ a- -~= -
- - -(A
u - - UM -- - L -
e %a aL am
P~LA.- fl "
en qr V.. m~ -% wr 0
Cl CN Ok -~ CV C.4 -4 L 4 L
LA LA "I "M LAr %a mA %06M 4 vi 6m U7 . "1
6n LA L L- U n %Q ~ q ~ca '0A J N 0 N "aNJ - - -
- A LA L L A LA LxC 2 ~ N J ~ JN JN
-4 L- Sn * Ci m .
00 0 0 0 0
CL.V)
j
V)
4A 0
It
vi
L
40
0
C6
It to o
I
5S
I
4I'
Ii
SaI'
SCIi
0~C C
.~ S~0 S'U
U I.
a) ~J 4
0. 1..~ 0 C'I'U £ *~~ 1.. .- Ia) C. '0
*0I... *V 'U So ~i -4- - U I
* a, oa) CI. Co 'UU 0
C *o L- 0.- a) -
o o~
~ LA II

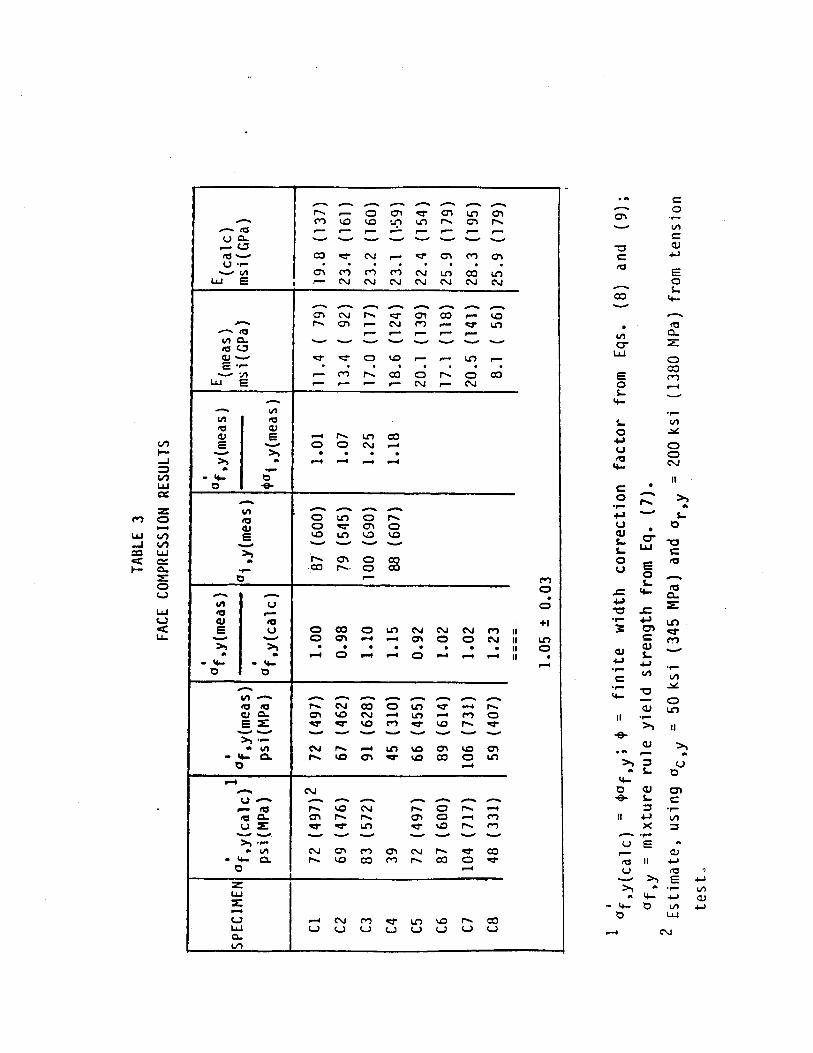
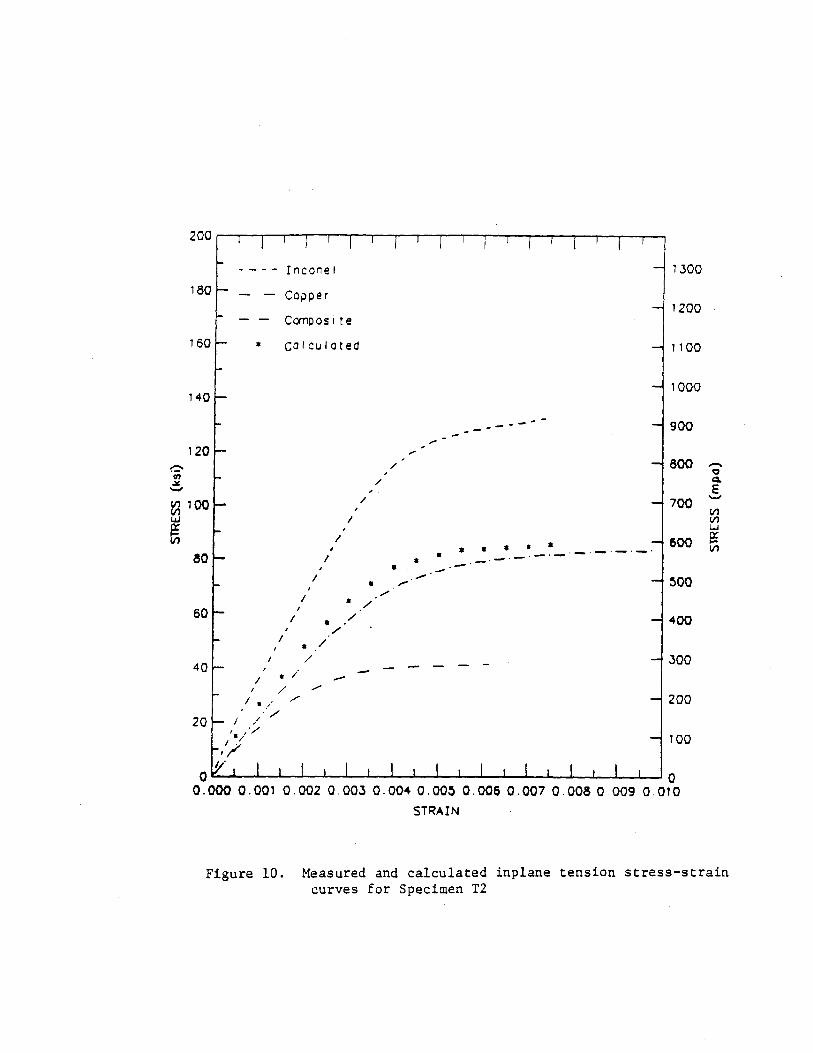
Inplane Tension Tests
Inplane tension stress-strain curves for the reinforced copper com-
posites appear in Figs. 9 through 12. Yield strengths and moduli are
presented in Table 2.
COMPOSITETABLE 2
INPLANE TENSION TEST AND ANALYSIS RESULTS
YIELD YOUNG'SSTRENGTH, MODULUS,
ajts i (MPa) msi (GPa)
SPECIMEN FIGURENUMBER MEASURED CALCULATED MEASURED CALCULATED
A B E_ E2 El E?
Ti 9 86.6 1 1 20.3 20.3
T2 10 79.2 82.0 83.9 20.5 23.4
T3 11 99.7 108.0 114.3 21.0 24.7
T4 12 88.3 88.3 90.4 20.4 15.9 23.1 15.2
A From the prediction (dashed curve) determined by calculating acompaac + (1 - a) ar at selected strains on the component stress-straincurves in Appendix 1.
B From the mixture rule oay = aoc,y + (1 - ) ary using the yieldstrengths shown in Table 1.
1 Steel stress-strain curve not available at strains in the yield region.Specimen too small to grip properly.

All theoretical curves were constructed from the parallel mixture
rule
'comp =aac + (1 - a) Gr (10)
which was applied at several strains to obtain the starred curves shown on
Figs. 9 through 12. In addition, primary moduli were calculated tram
Ei I = aEc + (1 - a)Ee (11)
Secondary moduli (for low-yield-strength copper) was found from Ei,2 ~
(1 - a)Er. However, only T4 exhibited a secondary modulus (Fig. 12.).
For the other composites, the copper strains at 0.002 offset yield were
within the yield region of the reinforcements, which prevented identifi-
cation of a secondary modulus.
The TI modulus and tension yield strengths agreed well with the pre-
dictions if assumed values for ac,y and Or,y are 50 ksi (345 MPa) and
200 ksi (1380 MPa) for the heavily cold rolled R-B strip. The component
properties could not be measured. The measured values for the E-B I-C-I
specimen were somewhat below the predictions. It is conceivable that the
interface wave may have been a factor, since the effect of the reinforce-
ment stiffness bond strengths would be less than the average perpendicular
to the waves and greater than the average parallel to the waves, causing
orthotropic behavior instead of isotropic behavior (Fig. 8). This condi-
tion did not exist in the roll-bonded specimen, T1, for which theory
agreed well with experiment. The wave-induced orthotropicity also may
have affected the behaviors of the face-compressed stacks.
The possibility of a wave effect requires measurement of E-B com-
ponent and composite properties parallel and perpendicular to the wave
directions, which was not done in this phase of the test program.
-26-

Interface Waves(Schematically)
A tt /2 Assumed
rf r
t Assumed Wave HeightI
I -
Wave Length Copper /Reinforcement
(Et /2)
(at r/2)
(Minimums)
Min.
Assubd (Et r/2)11t /2
(r at (Avg.) r
(Averages)
Figure 8 Effect of interface wave on explosion-bondedcomposite stiffness and strength.
Max.t r/2

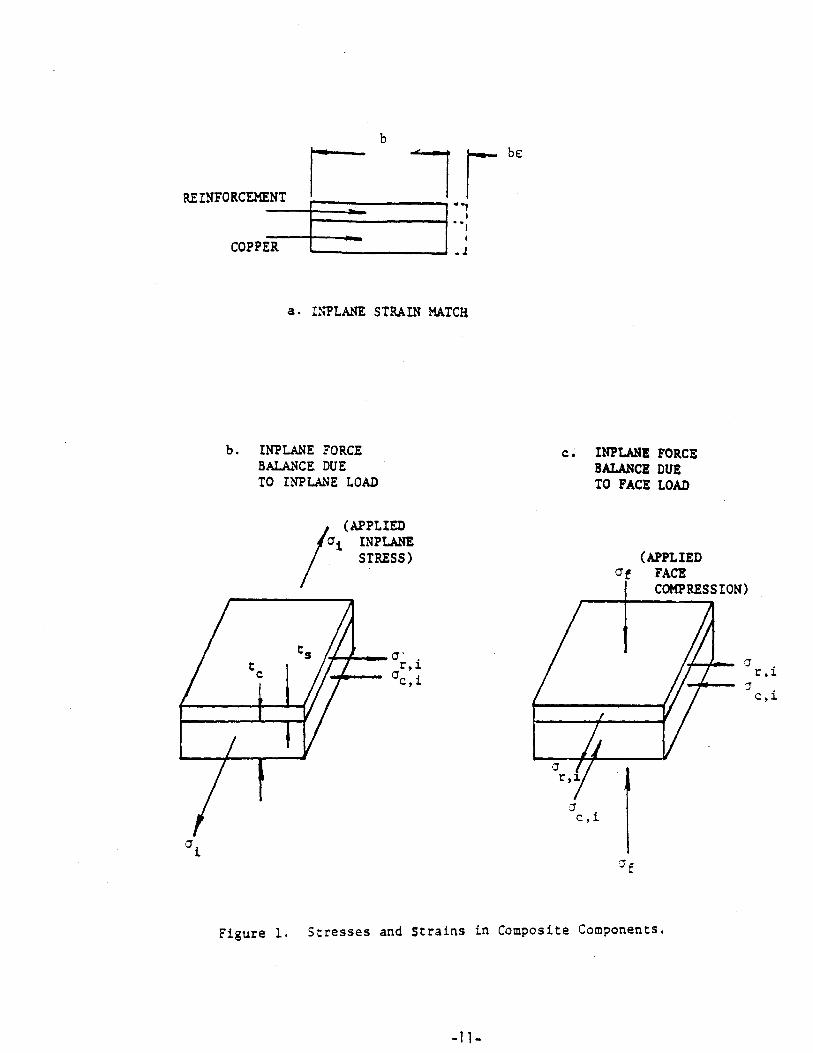
Face Compression Tests
Perhaps one of the most important features of the face compression
tests was the observation that the face compression yield strengths were
greater than the copper yield strengths (a ratio of 8/1 for C8). Another
important feature was the inability to detect visually any indication of
large bulging of the copper at the plate edges. At the most, it appeared
to be of the order of a few thousandths of a inch (possibly as much as
0.010 inch), including stack C5 which was loaded to 4.4 percent face-com-
pression strain. That observation would seem to bolster the view that
copper yielding is inhibited by the reinforcement.
The face compression tests were performed on stacks of composite with
no insulation between plates (except for C4 for which the plates were ce-
mented together). The tests data and predictions appear in Table 3. The
yield strengths and Young's moduli were obtained from the stress-strain
curves in Figs. 13 though 20.
The eight stack face compression tests produced an average ratio,
u = 1.05, of measured effective yield strength to theoretical effectiveI I
yield strength, * = af,y(meas)/If,y(calc). The standard deviation (z[xi
- u]2/8, was 0.03.
r, - 0C % (1 TI, M n LOm -) t.0 '0 n k. 0%l r-.
F F- - F- 9- F F ON
- l 5- i - 1 -~ - i
- r- 0%-. C~J CI) 04
EU C. -
2-e
'-A- r. O 00 r. 0
%5 CD C%= uCD>1 > 0 0 0 -:
C -4 L.4 -4
m m-l w L
-4--
m-
01
-4 mr 'U n '. I-- C
'UU 0..
'U -U --
S.-. (flu-i S
CL
0 -- L
CD
LUJ
0
L. r41
T3
o &-
4- C.
I,
.. ) 5-)X
Lm
4-J)
LLJ.
Ca-
LUJLUj
LUj
Q.
-. I

The Young's moduli were derived from the linear regions of the stress-
strain curves. The low values (relative to the theoretical value) may
have resulted from the often-observed phenomenon of interface effect be-
tween plates. It could consist of general out-of-flatness and nonuniform
thickness of the stack plates possibly augmented by surface roughness of
each plate face. The relatively flat initial portion of the stress-strain
curves for C2 and C3 (Figs. 14 and 15) may reflect the influence of those
phenomena. The variations of initial slope among the eight face compres-
sion stack curves could indicate the uncertainties in the magnitudes of
those influences.
The first two runs on C5 (Fig. 17) indicate good reproducibility of
the "linear" slope at 19.3 msi (133 GPa), which is 94% of the theoretical
value of 20.5 msi (150 GPa). However, the initial nonlinearity persisted
in all three runs. The curve for the third run had an elastic-region
slope of 17.7 msi (122 GPa). That change from the 19.3 msi value may have
been due to use of the single extensometer, in addition to the other
stack imperfections. In any case, it is 86% of the theoretical value.
The composite stress-strain curves do not appear to indicate second-
ary modulus behavior. Nonlinear behavior of C4 (Fig. 16) did not begin
before 20 ksi (138 MPa), which is well beyond the copper yield of 16.4
ksi (113 MPa) in that plate.
Table 3 shows that most of the measured face compression yield
strengths exceeded the predicted values. That reveals inaccuracy in the
edge correction factor, 0, and in the mixture rule strength calculation,
af,y. The two specimens, C6 and C7, had large aspect ratios (R = w/tr)
-30-

and high copper yields relative to the reinforcement. They revealed spec-
imen yield strengths close to af,y. However, the C8 yield was 23 percent
above prediction with R = 23, but with ar,y/ac,y = 17.5. If C6 and C7
can be assumed to substantiate the mixture rule (which applies to an in-
finite plate), then the 23 percent error may be an overestimate of the
edge correction factor, p. A similar situation occurred for C4 (with
ar,ylac,y = 9.6, a = 0.51 and w/tc = 7.8) which exhibited a face compres-
sion yield strength 15 percent above the predicted value. Those cases
were balanced by C2 and C5, for which the measured strengths were below
prediction.
The results from C1 through C8 appear to indicate that afy/af,y in-
creases with ar,y/ac,y. It may be argued that 8 tests are two few to per-
mit reliable identification of trends. In any event, it is clear that
more study of 0 is warranted. It also follows that only test data on full
scale configurations should be used for final design.
Specimen C5 was loaded beyond yield in an attempt to determine the na-
ture of a possible compression failure mode. At 80 ksi (552 MPa) the test
was stopped. The strain was 0.044, which approached the 5% limit of the
extensometer. Also, the specimen exhibited the onset of buckling, which
was anticipated to be one possible failure mode. The observed half-cosine
buckle shape, and approximate slope of the stress-strain curve (0.2 msi,
or 1.4 GPa), provided reasonable correlation of the observed value with
an order-of-magnitude estimate of the plastic critical stress.
Table 3 indicates that afy may be equal to, or greater than, the
product of the inplane tension yield and the edge correction factor,
0ai,y. Again, it may be too early to define trends.

CONCLUSIONS
1. The copper cannot begin to display large strains that are associatedwith yielding until the reinforcement does so.
2. Composite tension stress-strain curves can be constructed with reason-able reliability using the mixture rule
ai =4 ac + (1 -a)ar
at several simultaneous strain levels on the copper and reinforcementstress-strain curves. Young's moduli and yield can be measured on theconstructed curve. However, the reliability of the procedure mightbe degraded for an E-B composite if the interface wave height is. alarge fraction of the thickness of either component.
3. Composite face compression yield strength apparently is determinableby using the mixture rule for an infinite plate,
af,y = mac,y + (1 - a)ar,y
together with the finite width correction factor, *, shown in Eqs.(8) and (9).
4. Inplane tension yield strength of a narrow composite strip shouldagree with compression yield strength of an infinite plate com-posite if the finite width correction factor is applied to the in-plane value.
5. More testing is required to broaden the data base from which thoseconclusions were drawn.

DESIGN EXAMPLE
Assume that a tapered plate of the CIT TF coil can be modeled at the
throat region as a constant-thickness plate with tc = 0.375 in (9.52 mm)
and tr = 0.250 in (6.35 mm). Assume, also, that those dimensions occur
in the midsection of the 7.55 in (192 mm) tapered zone, so that w = 3.775
in (95.88 mm). Then a = 0.60 and w/tc = 10. If the inconel yield strength
is 177 ksi (1218 MPa) and that of the copper is 44.7 ksi (308 MPa) at
293 K, then ar,y/ac,y = 4.
Enter Fig. 7 (repeated on the following page) with ar,y/ac,y 4,
a = 0.6, and w/tc = 10. It is found that 0 = 0.85. From the mixture
rule,
afy = 0.6x44.7 + 0.4x177
= 97.6 ksi (673 MPa)
thenafy = Oaf,y = 0.85x97.6
= 83.0 ksi (572 MPa)
If the allowable stress were to be chosen at 85% of yield, then
aall = 0.85x83.0
= 70.6 ksi (487 MPa)
The above calculation may be conservative since the actual plate width is
twice the value arbitrarily selected for the example. A full scale test
on an actual plate would be required to identify the real behavior.

-.-
~1~777~~~
t -- I
~vvI t.~2.
Figure 7. (Repeat) Use of finite width correction in a sample
problem.
-34-
fAOO
c.o
'C. d

APPENDIX 1
INPLANE TENSIONSTRESS-STRAIN CURVES
NOTE: Tension stress-strain curves for composite components are dis-played on Figs. 10, 11, and 12.
The stress-strain curves in this report were generated by straight
line segments joining load-deflection data points (scaled appropriately)
as measured by the various testing machines at MANLAB, INC. The plots
were produced by GraphMG, a graphic package installed on the MIT Alcator
Vax.

200T
TI 1300180 -
1200
160 - 1100
1000140 -
- 900
120-800-
E"100 700
- ~ -50080
500
60 - 400
40 30040
2200
20 100
/0
0.000 0.001 0.002 0.003 0.004 0 005 0.006 0.007 0 008 0 009 0.010
STRAIN
Figure 9. Inplane tension stress-strain curve for Specimen Tl
-36-
- - - - Inconel
-- - Copper
Composite
calculated
120-
100
80
60-
40
20
/
/
'/
a a S SS
*
* -
5,
a
/
900
800 -
E70V
VI)0
600
500
400
-1 300/ 5/
7 -
-
/ 3
I I I I . I II . I
200
100
0 ' ' ' ' 1 ' I ' ''0.000 0.001 0.002 0 003 0.004 0.005 0.006 0.007 0.008 0 009 0 010
STRAIN
Figure 10. Measured and calculated inplane tension stress-straincurves for Specimen T2
200
180
160 I-
140k-
1300
1200
2 11001000
'I
'I1
I I I
200I -I
Inconel - 1300
180 - - Copper
- - Composite
150 * Calculated -- 1100
-1000140 /
- 900
120 /
/ s* a* -- 800 -
(C0
C,) / . L
V.) 600U.
/ a80 4
500
40 -- -- 300
- . 200
20 /
100
0.000 0.001 0 002 0 003 0 004 0 005 0.006 0.007 0 008 0 009 0.010
STRAIN
Figure 11. Measured and calculated inplane tension stress-straincurves for Specimen T3
-38-

200
- - - - Inconel 1300
180 - - Copper
-- Conposite -- 1200
160 - Calculated 1100
- 1000140 -
900
120 -80
EV1V 100 - -70
* -- 700v,1050080 w 0
50 - ,' * 4-'
*
-300
200
20
100
0.000 0.001 0.002 0 003 0 004 0.005 0.006 0 007 0 008 0.009 0 010
STRAIN
Figure 12. Measured and calculated inplane tension stress-strain curves
for Specimen T4

APPENDIX 2
FACE COMPRESSIONSTRESS-STRAIN CURVES
(NOTE): Tension stress-strain curves for composite components are dis-played on Figs. 14 through 20).
-40-
200
---- Cl 1300
1801200
160 1100
1000140
- 900
120
EV1 100 - 700 _
800-
-500
60 400
47O
200
20
- ---- 100
0 00.000 0.001 0 002 0 003 0 004 0.005 0 006 0. 007 0.008 0 .009 0 010
STRAIN
Figure 13. Measured face compression stress-strain curve for
Specimen Cl

200 1 I I j I
- Inconel - 1300
180 - - Copper1200
- -- Composite
160 - - 1100
1000140 -
-- -- - 900
120 -800
EV)100 - 7000 V1
/L V1)LAJ
80 /
500
0 300
200
20 -100
0 I00.000 0.001 0 002 0.003 0.004 0.005 0.006 0 .007 0.008 0 009 0.010
STRAIN
Figure 14. Measured face compression stress-strain curve forSpecimen C2

200T-I T
- Incone 1 1300
180 - -Copper1200
Composite
150 / 1100
1000140 -
900
120 0800
E
100 700
F5 U.1
V) 6500K80 -
V11
500
60 ,/400
40 - 300
200
20 -100
00.000 0.001 0 002 0 003 0 004 0.005 0 006 0.007 0.008 0.009 0.010
STRAIN
Figure 15. Measured face compression stress-strain curves for
Specimen C3
200 11 1 1 1 1 1 1 1 1 1 1 1 1 1 1 1
Inconel 1300
180 - - Copper
10 - - Composite - - - - 1200
150 -- 1100
- 1000140 -
- 900
120 --800
/ EV100 - 700
V7
W - 600
80 -
/- 500
80.- - 400
40 - -300
20 200
20 -/ /~. -100
0 00.000 0.001 0.002 0.003 0.004 0.005 0.006 0.007 0.008 0.009 0 010
STRAIN
Figure 16. Measured face compression stress-strain curve forSpecimen C4
-44-

200 1
- Steel - 1300180 - - Copper
1200Composite; run
150 Composite; run 1100
- Composite; run
140 - #2 - - - 1000
900
120 -800
EV1100 - - 700
Li,,
V - 60080 -
- .500
60-- 400
40 - 300
- 200
20 -- 100
0-0.000 0.001 0.002 0 003 0.004 0.005 0.006 0.007 0.008 0.009 0.010
STRAIN
Figure 17. Measured face compression stress-strain curve for
Specimen C5
-- -- Steel - 1300
180 - - Copper-1200
- Composite
160 - ~ 1100
- - - - - 1000
140 - -
- 900
1 2 0 -CLE
100 - 700(/1
- 60080 -
500
60 - 400
4/ - - 30040 '-
~- 200
202 100
0 '0
0.000 0.001 0.002 0 003 0.004 0.005 0.006 0.007 0.008 0.009 0.010
STRAIN
Figure 18. Measured face compression stress-strain curve for
Specimen C6

2100
- Steel 1300
180 - Copper1200
Composite
160 1100
- -- ~ 1000140 - -
- 900
120 --, -,- 800 -93M
E)100 - ..- 700
60080 -
- 500
60 - 400
40 - - 300
- 200
20 - 200/ 100
0 00.000 0.001 0.002 0.003 0.004 0.005 0.006 0.007 0.008 0.009 0.010
STRAIN
Figure 19. Measured face compression stress-straincurve for Specimen C7
_.d7_

I Ij I I I
- -- tee 1
180 - - Copper
1~ - Cornpos i t e
150 -
1
I I I I I I I I I I I F
40 F-
120 H-
/
/
/100-
80 - /
/
1300
1200
1100
1000
900
800
E700
r,00
500
60 - ....- -- 400
-- j30040
2- --
20100
0 00.000 0.001 0 .002 0.003 0.004 0 005 0.006 0 007 0.008 0 .009 0 010
STRAIN
Figure 20. Measured face compression stress-strain curvefor Specimen C8
-48-
(I)
200

APPENDIX 3
SOURCES OF TEST INACCURACIES
Force Measurement
The various tests were performed in several machines at Manlabs.
Their Mlb (7 MN) and 0.3 Mlb (2 MN) presses were used to apply face com-
pression to the stacks. The 60,000 lb (0.4 MN) Baldwin Universal lester
and the 20,000 lb (0.14 MN) MTS testing machine were used for loading com-
posites and composite components in tension. All the machines were cali-
brated to an accuracy of better than one-half percent throughout the re-
spective load ranges. The minimum direct reading on the Mlb press was
2,000 pounds. It was 1,000 pounds on the 0.3 Mlb press. They were noted
visually and recorded. The loads on the other two machines were display-
ed as ordinates on the X-Y recorder used to acquire load deflection data.
The precision was 10 pounds on the Baldwin and 20 pounds on the MTS.
The crossheads on the presses were not free to swivel, which could
have caused some unevenness in pressure across a stack face. The anvil
faces were ground, and were oriented parallel, as closely as possible.
Also, several sheets of fiberglass were inserted between each loading an-
vil and stack face to help distribute the load evenly across a stack
face.

Deflection Measurement
Compression deflections were measured with an Instron one-inch
gauge-length extensometer which senses movements that are multiples of
10-5 inch. They are displayed digitally for hand recording. Tension de-
flections were acquired as the abscissa of the X-Y recorder. The pre-
cision was 4x10- 4 inch on the Baldwin recorder and 10-4 on the MTS. The
extensometers were calibrated several times during the program and were
found to agree with the reference micrometer that read to 10- 4 inch.
Effects of Specimen Imperfections
The force and deflection measurement accuracies presumably were good
enough to provide reliable data on specimen behavior. It is likely that
specimen imperfections led to such stress-strain curve features as non-
linearity at low stresses and deviations of measured Young's moduli from
commonly reported values. The extensometers were mounted on one side of
each specimen. That could result in a nonlinear stress-strain curve for
a thin strip that was not perfectly flat, or that was not gripped proper-
ly in the testing machine. In a compression stack, tolerances could be
built up making one stack edge higher than another. Plate waviness
(particularly in explosion-bonded plates) could have been the cause of
uncertainties in Young's modulus values, and also may have affected 0.002
offset yield strengths. The Specimen C4 plates, for example, were found
to be as much as 0.012 inch (1/3 mm) out of flat relative to the edges
of the 2-inch squares from which the stack was constructed.
-50-

The interface waves on the E-B plates made it difficult to measure
reliably the thicknesses of the components in the composite. The mid-
line of the wave was chosen for that purpoose. It was identified by
magnification of a region polished as for metallurgical analysis. That
thickness agreed to a few percent with the value obtained by removing the
copper from an Inconel face strip, weighing the strip, and calculating
the volume using the specific gravity of the Inconel as obtained from a
flat strip. It is not known how that geometric thickness relates to the
"structural" thickness of the component in a composite. Furthermore, the
effective thickness for inplane loads parallel to the wave ridges would
be greater than the effective thickness for inplane loads across the
ridges. That would lead to orthotropic structural behavior in both stiff-
ness and strength.
-51-

APPENDIX 4
FUTURE PROGRAM
The test data and theory/experiment correlations in this report are
encouraging, but only can be considered preliminary. The specimens were
smaller than the full scale dimensions of CIT TF coils. hull scale E-B
plates have not yet been produced.. All tests were performed at 293 K
under short-time static load. All component stress-strain curved were ob-
tained in inplane tension although the stack tests were conducted in face
compression. Compression stress-strain data must be obtained. It .i s
necessary to determine the impact on E-B properties of scale, elevated
temperature, and cyclic loading. E-B bond strength must be measured. Fu-
ture goals will be addressed to those problems. In addition, the role of
insulation must be explored.
Face compression tests will be performed on stacks with several
widths in the range from 100 to 200 mm. A few preliminary creep tests
have been performed and will be reported shortly. Cyclic compression and
tension tests will be performed, simulating CIT performance. Stacks of
copper plates and inconel plates wil I be compressed to obtain Young's
modulus and yield strength data for the composite components. Bond shear
strength will be measured in combination with various amounts of face
compression, for which a test specimen has been designed. Tension and
compression tests will be performed at 393 K. Throughout the program,
the effect of insulation on face-compression behavior will be studied.
-52-

Prediction methods will be reviewed critically, and limitations of
use will be identified. Inevitably, there will be feedback from the mag-
net design activities, which may require parameters outside the range of
parameters explored to date and currently planned for the additional
tests.
-53-

REFERENCES
1. Internal memorandums to MIT from Teledyne Engineering Services, 1980.
2. D.R. Cohn, et al., "Engineering Design Considerations for Compact Ig-nition Test Reactors," PFC Report PFC/CP-81-2, February 26, 1982.
3. M. Leupold, "Strength Tests of Composite Structures as Applied toHigh Field Magnet Windings." MIT FBNML memorandum, January 24, 1966.
4. P.W. Bridgman, "The Physics of High Pressure," G. Bell and Sons,London, 1949.
-54-
