pg-roi for powerplants v61
TRANSCRIPT
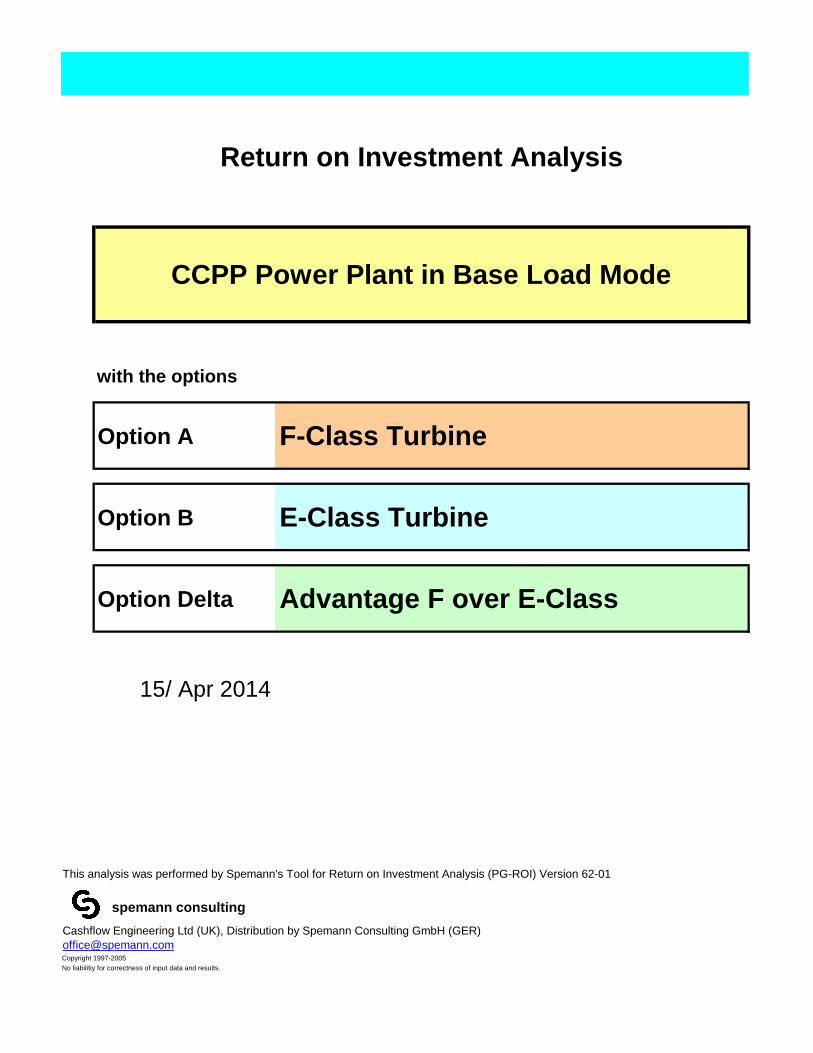
Option A
Option B
Option Delta
15/ Apr 2014
This analysis was performed by Spemann's Tool for Return on Investment Analysis (PG-ROI) Version 62-01
Cashflow Engineering Ltd (UK), Distribution by Spemann Consulting GmbH (GER)
[email protected] 1997-2005
No liabilitiy for correctness of input data and results.
E-Class Turbine
Advantage F over E-Class
CCPP Power Plant in Base Load Mode
Return on Investment Analysis
with the options
F-Class Turbine
spemann consulting

Currency EUR
Start Date 01/ 01 2005
Period under Review [Years] 22
Discount Rate 10.0%
Date for Present Value 01/ 01 2005
Income Tax Rate 35.0%
Delta
Power Value Min % Max % Distr. Value Min % Max % Distr.
Electrical Net Power MW 700 95.0% 102.0% 640 96.0% 103.0% F 60
El. Full Load oper. Hours h/a 8000 93.0% 101.0% 8250 92.0% 103.0% F -250El. net Efficiency % 56.00% 99.0% 100.5% 52.00% 99.0% 100.5% 4.00%
Operating Costs Value Min % Max % Distr. Incrs. Value Min % Max % Distr. Incrs. Value
Personnel mill. EUR/a 2.5 90.0% 110.0% 3.0% 2.5 90.0% 110.0% F 3.0%
Insurance mill. EUR/a 2 90.0% 110.0% 1.5 90.0% 110.0% F 0.5
Fixed Maintenance mill. EUR/a 13 70.0% 130.0% 3.0% 8 70.0% 130.0% 3.0% 5
Other Costs A mill. EUR/a
Other Costs B mill. EUR/a
Variable Maintenance EUR/MWh 0.1 90.0% 110.0% 3.0% 0.1 90.0% 110.0% 3.0%
Fuel EUR/GJ 3.5 3.5
Consumables EUR/MWh 0.25 2.0% 0.25 2.0%
Operating Revenues Value Min % Max % Distr. Incrs. Value Min % Max % Distr. Incrs. Value
Fixed Revenues Electricity mill. EUR/a
Other Revenues D mill. EUR/a
Other Revenues E mill. EUR/a
Other Revenues F mill. EUR/a
Variable Rev. Electr. EUR/MWh 35 1.0% 35 1.0%
Investment Min % Max % Distr. Min % Max % Distr.
Investment Volume mill. EUR 400 95.0% 105.0% 340 95.0% 105.0% 60.000
LifetimeHand over (End of Commiss.) Date 01/ 01 2007 01/ 01 2007
Lifetime from Commiss. Years 20 20
Tax Depreciation Time Years 15 15
FinancingDebt Share 1 --- 70.00% -16 10.0% 40.000 70.00% -16 10.0% 34.000
Debt interest Rate --- 8.00% -6 20.0% 80.000 8.00% -6 20.0% 68.000
Start of Debt Service Date 01/ 01 2009 -2 20.0% 80.000 01/ 01 2009 -2 20.0% 68.000
Debt Service Years 15 -1 10.0% 40.000 15 -1 10.0% 34.000
Debt Share 2 --- 1 10.0% 40.000 1 10.0% 34.000
Debt interest Rate --- 13 30.0% 120.000 13 30.0% 102.000
Start of Debt Service Date
Debt Service Years
Calc. Equity CostsEquity Share --- 30% 30%
interest Rate --- 10.00% 10.00%
Equity Service Years 15 Total 100.0% 400.000 15 Total 100.0% 340.000
CCPP Power Plant in Base Load Mode
F-Class Turbine E-Class Turbine
Project Description: Natural Gas fired Power Plant. Turbine Configuration: F-Class 2x1; E-Class 3x1
Advantage of F-Class: higher power output, higher efficiency. Advantage of E-Class: lower
investment volume
Investment Schedule
Month
s b
ef. C
om
m.
Month
s a
fter
Com
m.
Month
s b
ef. C
om
m.
Month
s a
fter
Com
m.
Investment Schedule

Equ. op-
hrs
Equ. op-
hrs
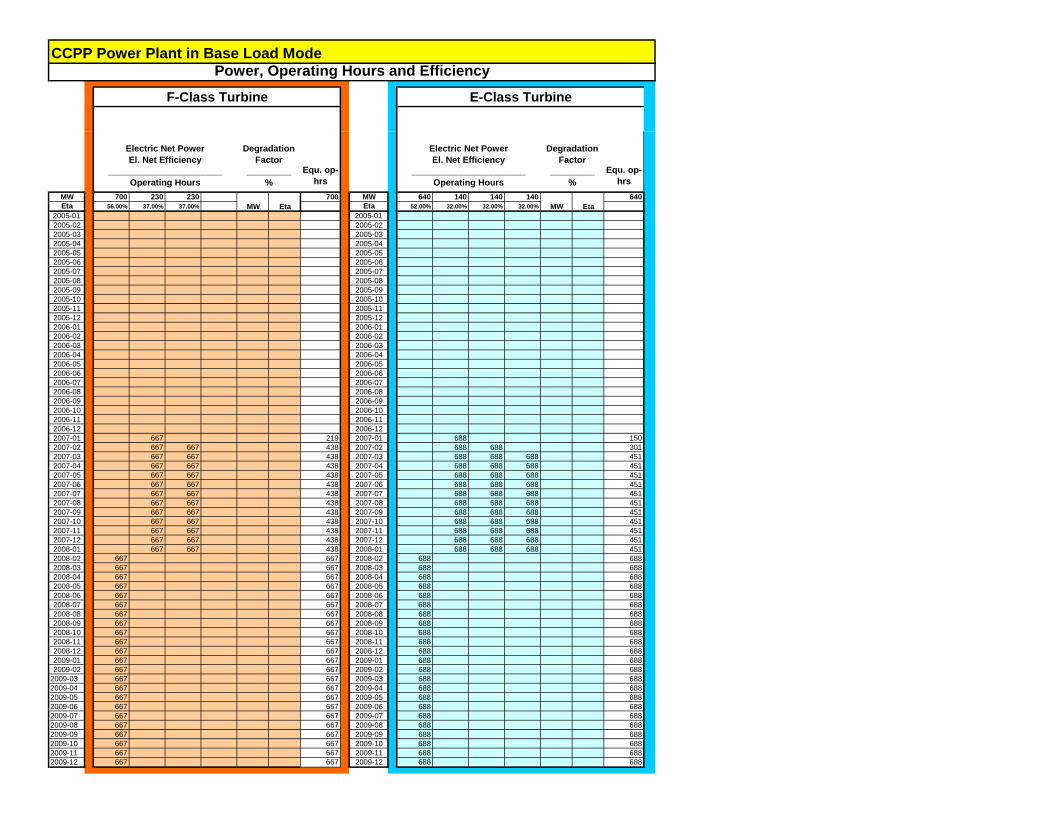
MW 700 230 230 700 MW 640 140 140 140 640
Eta 56.00% 37.00% 37.00% Eta 52.00% 32.00% 32.00% 32.00%
2005 2005
2006 2006
2007 8,000 7,333 5,038 2007 8,250 7,563 6,875 4,963
2008 7,333 667 667 7,771 2008 7,563 688 688 688 8,014
2009 8,000 99.80% 99.90% 7,984 2009 8,250 99.70% 99.80% 8,225
2010 8,000 99.30% 99.60% 7,944 2010 8,250 99.10% 99.50% 8,176
2011 8,000 99.00% 99.40% 7,920 2011 8,250 98.60% 99.20% 8,135
2012 8,000 98.70% 99.20% 7,896 2012 8,250 98.20% 98.90% 8,102
2013 8,000 98.90% 99.20% 7,912 2013 8,250 98.50% 99.00% 8,126
2014 8,000 98.80% 99.20% 7,904 2014 8,250 98.30% 98.90% 8,110
2015 8,000 98.50% 99.10% 7,880 2015 8,250 98.10% 98.80% 8,093
2016 8,000 98.30% 99.00% 7,864 2016 8,250 97.80% 98.70% 8,069
2017 8,000 98.10% 98.90% 7,848 2017 8,250 97.50% 98.50% 8,044
2018 8,000 98.50% 99.00% 7,880 2018 8,250 98.00% 98.70% 8,085
2019 8,000 98.40% 99.00% 7,872 2019 8,250 97.90% 98.70% 8,077
2020 8,000 98.30% 98.90% 7,864 2020 8,250 97.70% 98.60% 8,060
2021 8,000 98.10% 98.90% 7,848 2021 8,250 97.50% 98.50% 8,044
2022 8,000 98.00% 98.80% 7,840 2022 8,250 97.30% 98.40% 8,027
2023 8,000 98.20% 98.90% 7,856 2023 8,250 97.60% 98.50% 8,052
2024 8,000 98.10% 98.90% 7,848 2024 8,250 97.50% 98.50% 8,044
2025 8,000 98.00% 98.80% 7,840 2025 8,250 97.30% 98.40% 8,027
2026 8,000 97.90% 98.80% 7,832 2026 8,250 97.20% 98.40% 8,019
2027 8,000 97.80% 98.70% 7,824 2027 8,250 97.10% 98.30% 8,011
2028 8,000 98.20% 98.90% 7,856 2028 8,250 97.60% 98.50% 8,052
2029 8,000 98.10% 98.90% 7,848 2029 8,250 97.50% 98.50% 8,044
2030 8,000 98.00% 98.80% 7,840 2030 8,250 97.30% 98.40% 8,027
2031 8,000 97.90% 98.80% 7,832 2031 8,250 97.20% 98.40% 8,019
2032 8,000 97.80% 98.70% 7,824 2032 8,250 97.10% 98.30% 8,011
2033 2033
2034 2034
2035 2035
2036 2036
2037 2037
2038 2038
2039 2039
2040 2040
2041 2041
2042 2042
2043 2043
2044 2044
2045 2045
2046 2046
2047 2047
2048 2048
2049 2049
2050 2050
2051 2051
2052 2052
2053 2053
2054 2054
CCPP Power Plant in Base Load Mode
F-Class Turbine E-Class Turbine
Power, Operating Hours and Efficiency
Electric Net Power
El. Net Efficiency
_______________________
Operating Hours
Degradation
Factor
_________
%
MW Eta
Electric Net Power
El. Net Efficiency
_______________________
Operating Hours
Degradation
Factor
_________
%
MW Eta
Equ. op-
hrs
Equ. op-
hrs
MW 700 230 230 700 MW 640 140 140 140 640
Eta 56.00% 37.00% 37.00% Eta 52.00% 32.00% 32.00% 32.00%
2005-01 2005-01
2005-02 2005-02
2005-03 2005-03
2005-04 2005-04
2005-05 2005-05
2005-06 2005-06
2005-07 2005-07
2005-08 2005-08
2005-09 2005-09
2005-10 2005-10
2005-11 2005-11
2005-12 2005-12
2006-01 2006-01
2006-02 2006-02
2006-03 2006-03
2006-04 2006-04
2006-05 2006-05
2006-06 2006-06
2006-07 2006-07
2006-08 2006-08
2006-09 2006-09
2006-10 2006-10
2006-11 2006-11
2006-12 2006-12
2007-01 667 219 2007-01 688 150
2007-02 667 667 438 2007-02 688 688 301
2007-03 667 667 438 2007-03 688 688 688 451
2007-04 667 667 438 2007-04 688 688 688 451
2007-05 667 667 438 2007-05 688 688 688 451
2007-06 667 667 438 2007-06 688 688 688 451
2007-07 667 667 438 2007-07 688 688 688 451
2007-08 667 667 438 2007-08 688 688 688 451
2007-09 667 667 438 2007-09 688 688 688 451
2007-10 667 667 438 2007-10 688 688 688 451
2007-11 667 667 438 2007-11 688 688 688 451
2007-12 667 667 438 2007-12 688 688 688 451
2008-01 667 667 438 2008-01 688 688 688 451
2008-02 667 667 2008-02 688 688
2008-03 667 667 2008-03 688 688
2008-04 667 667 2008-04 688 688
2008-05 667 667 2008-05 688 688
2008-06 667 667 2008-06 688 688
2008-07 667 667 2008-07 688 688
2008-08 667 667 2008-08 688 688
2008-09 667 667 2008-09 688 688
2008-10 667 667 2008-10 688 688
2008-11 667 667 2008-11 688 688
2008-12 667 667 2008-12 688 688
2009-01 667 667 2009-01 688 688
2009-02 667 667 2009-02 688 688
2009-03 667 667 2009-03 688 688
2009-04 667 667 2009-04 688 688
2009-05 667 667 2009-05 688 688
2009-06 667 667 2009-06 688 688
2009-07 667 667 2009-07 688 688
2009-08 667 667 2009-08 688 688
2009-09 667 667 2009-09 688 688
2009-10 667 667 2009-10 688 688
2009-11 667 667 2009-11 688 688
2009-12 667 667 2009-12 688 688
Power, Operating Hours and Efficiency
CCPP Power Plant in Base Load Mode
E-Class TurbineF-Class Turbine
Electric Net Power
El. Net Efficiency
_______________________
Operating Hours
Degradation
Factor
_________
%
Electric Net Power
El. Net Efficiency
_______________________
Operating Hours
Degradation
Factor
_________
%
MW Eta MW Eta
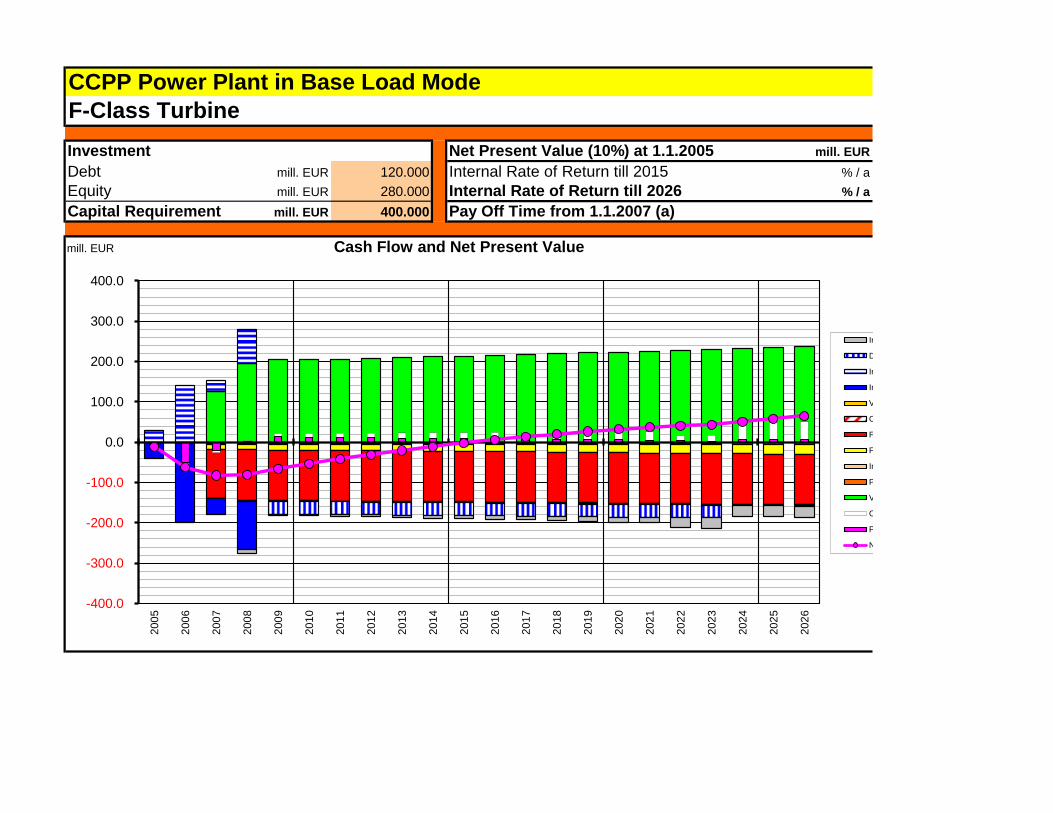
Investment Net Present Value (10%) at 1.1.2005 mill. EUR
Debt mill. EUR 120.000 Internal Rate of Return till 2015 % / a
Equity mill. EUR 280.000 Internal Rate of Return till 2026 % / a
Capital Requirement mill. EUR 400.000 Pay Off Time from 1.1.2007 (a)
mill. EUR Cash Flow and Net Present Value
F-Class Turbine
CCPP Power Plant in Base Load Mode
-400.0
-300.0
-200.0
-100.0
0.0
100.0
200.0
300.0
400.0
20
05
20
06
20
07
20
08
20
09
20
10
20
11
20
12
20
13
20
14
20
15
201
6
201
7
201
8
201
9
202
0
202
1
20
22
20
23
20
24
20
25
20
26
Income Tax
Debt Service
Income from Credit
Investment Volume
Variable Maintenance
Consumables
Fuel
Fixed Maintenance
Insurance
Personnel
Variable Rev. Electr.
Cash Flow
Present Value of Cash Flow
Net Present Value

F-Class Turbine
CCPP Power Plant in Base Load Mode
mill. EUR Cash Flow and Net Present Value
-150.0
-100.0
-50.0
0.0
50.0
100.0
150.0
2005-01 2006-01 2007-01 2008-01 2009-01
Variable Rev. Electr. Personnel Insurance Fixed Maintenance Fuel
Consumables Variable Maintenance Investment Volume Income from Credit Debt Service
Income Tax Cash Flow Present Value of Cash Flow Net Present Value

64.832
9.5%
17.5%
9.2
F-Class Turbine
CCPP Power Plant in Base Load Mode
Income Tax
Debt Service
Income from Credit
Investment Volume
Variable Maintenance
Consumables
Fuel
Fixed Maintenance
Insurance
Personnel
Variable Rev. Electr.
Cash Flow
Present Value of Cash Flow
Net Present Value

F-Class Turbine
CCPP Power Plant in Base Load Mode
Debt Service
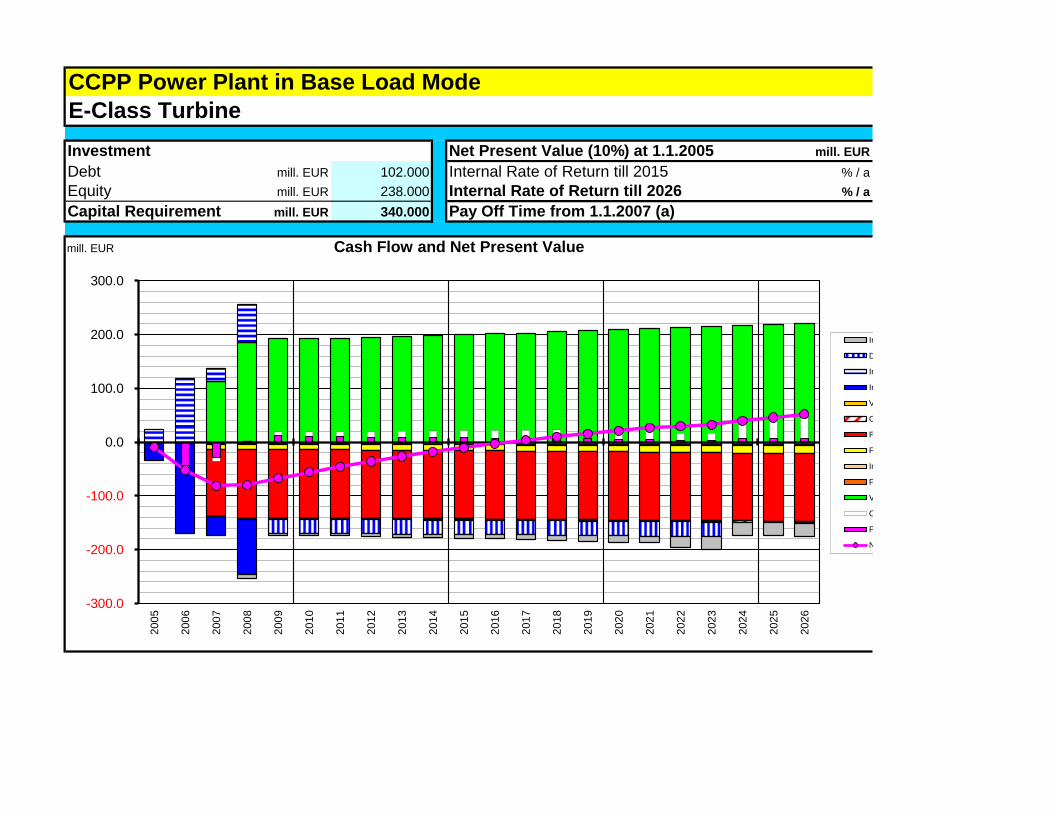
Investment Net Present Value (10%) at 1.1.2005 mill. EUR
Debt mill. EUR 102.000 Internal Rate of Return till 2015 % / a
Equity mill. EUR 238.000 Internal Rate of Return till 2026 % / a
Capital Requirement mill. EUR 340.000 Pay Off Time from 1.1.2007 (a)
mill. EUR Cash Flow and Net Present Value
CCPP Power Plant in Base Load Mode
E-Class Turbine
-300.0
-200.0
-100.0
0.0
100.0
200.0
300.0
20
05
20
06
20
07
20
08
20
09
20
10
20
11
20
12
20
13
20
14
20
15
201
6
201
7
201
8
201
9
202
0
202
1
20
22
20
23
20
24
20
25
20
26
Income Tax
Debt Service
Income from Credit
Investment Volume
Variable Maintenance
Consumables
Fuel
Fixed Maintenance
Insurance
Personnel
Variable Rev. Electr.
Cash Flow
Present Value of Cash Flow
Net Present Value

CCPP Power Plant in Base Load Mode
E-Class Turbine
mill. EUR Cash Flow and Net Present Value
-150.0
-100.0
-50.0
0.0
50.0
100.0
2005-01 2006-01 2007-01 2008-01 2009-01
Variable Rev. Electr. Personnel Insurance Fixed Maintenance Fuel
Consumables Variable Maintenance Investment Volume Income from Credit Debt Service
Income Tax Cash Flow Present Value of Cash Flow Net Present Value

51.899
7.3%
16.3%
10.3
CCPP Power Plant in Base Load Mode
E-Class Turbine
Income Tax
Debt Service
Income from Credit
Investment Volume
Variable Maintenance
Consumables
Fuel
Fixed Maintenance
Insurance
Personnel
Variable Rev. Electr.
Cash Flow
Present Value of Cash Flow
Net Present Value
CCPP Power Plant in Base Load Mode
E-Class Turbine
Debt Service
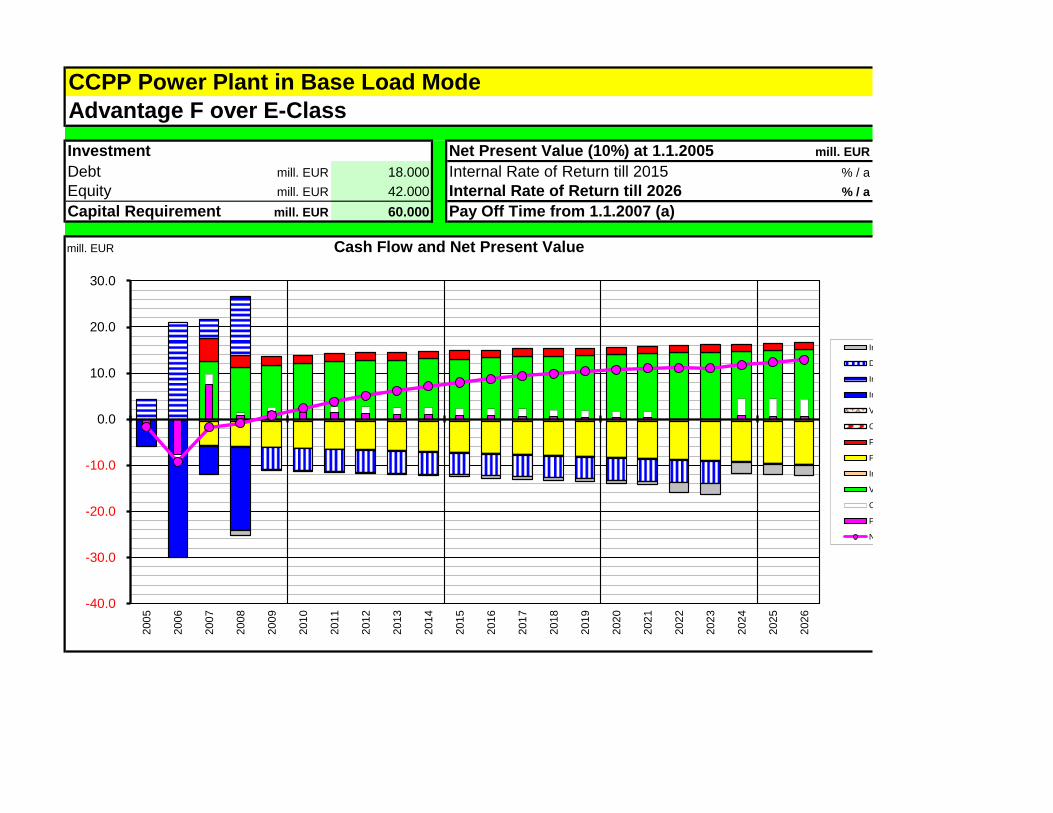
Investment Net Present Value (10%) at 1.1.2005 mill. EUR
Debt mill. EUR 18.000 Internal Rate of Return till 2015 % / a
Equity mill. EUR 42.000 Internal Rate of Return till 2026 % / a
Capital Requirement mill. EUR 60.000 Pay Off Time from 1.1.2007 (a)
mill. EUR Cash Flow and Net Present Value
CCPP Power Plant in Base Load Mode
Advantage F over E-Class
-40.0
-30.0
-20.0
-10.0
0.0
10.0
20.0
30.0
200
5
20
06
20
07
200
8
20
09
20
10
20
11
20
12
201
3
20
14
20
15
20
16
20
17
201
8
20
19
20
20
202
1
20
22
20
23
20
24
20
25
202
6
Income Tax
Debt Service
Income from Credit
Investment Volume
Variable Maintenance
Consumables
Fuel
Fixed Maintenance
Insurance
Variable Rev. Electr.
Cash Flow
Present Value of Cash Flow
Net Present Value

CCPP Power Plant in Base Load Mode
Advantage F over E-Class
mill. EUR Cash Flow and Net Present Value
-25.0
-20.0
-15.0
-10.0
-5.0
0.0
5.0
10.0
15.0
20.0
2005-01 2006-01 2007-01 2008-01 2009-01
Variable Rev. Electr. Insurance Fixed Maintenance Fuel Consumables
Variable Maintenance Investment Volume Income from Credit Debt Service Income Tax
Cash Flow Present Value of Cash Flow Net Present Value

12.933
36.7%
38.2%
2.4
CCPP Power Plant in Base Load Mode
Advantage F over E-Class
Income Tax
Debt Service
Income from Credit
Investment Volume
Variable Maintenance
Consumables
Fuel
Fixed Maintenance
Insurance
Variable Rev. Electr.
Cash Flow
Present Value of Cash Flow
Net Present Value
CCPP Power Plant in Base Load Mode
Advantage F over E-Class
Consumables
Income Tax

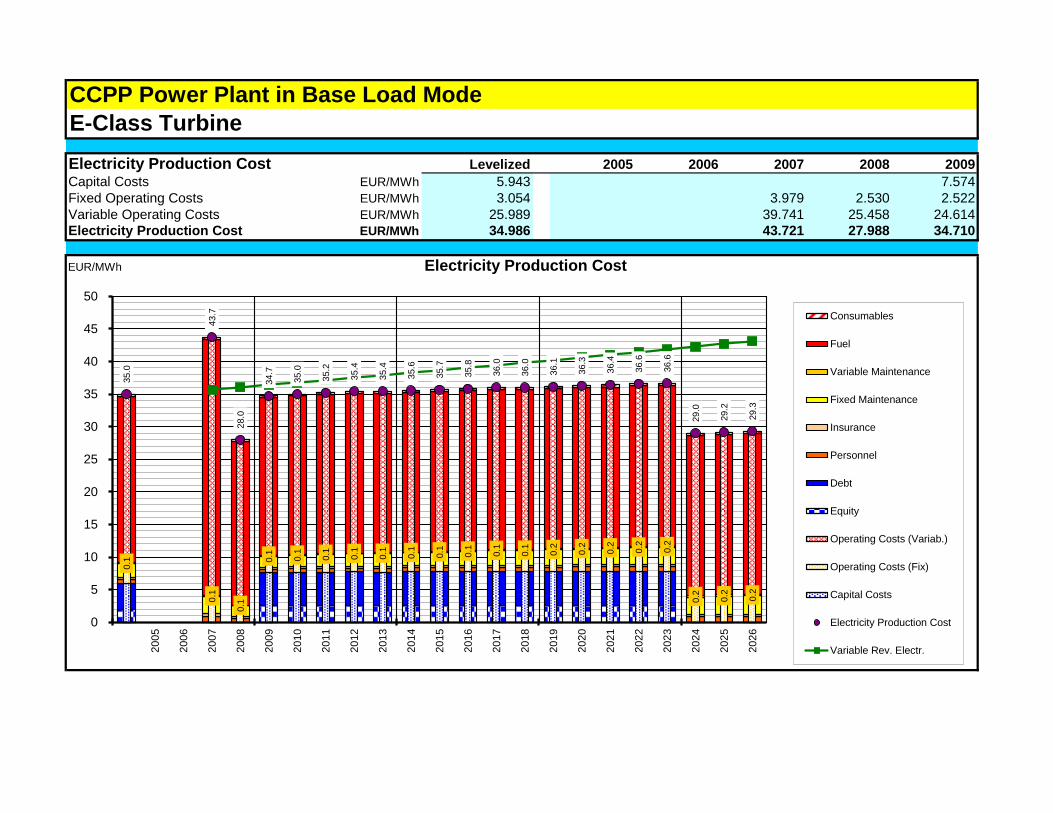
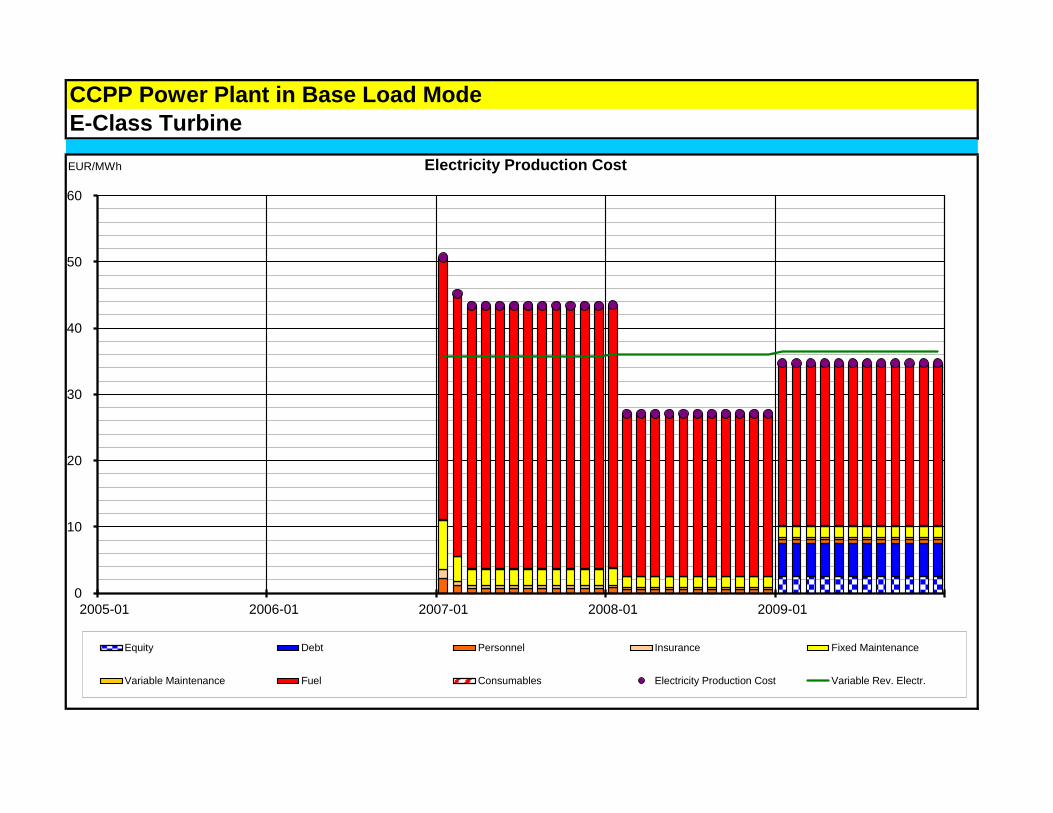
Electricity Production Cost Levelized 2005 2006 2007 2008 2009
Capital Costs EUR/MWh 6.547 8.401
Fixed Operating Costs EUR/MWh 4.181 5.230 3.481 3.472
Variable Operating Costs EUR/MWh 23.962 34.420 23.526 22.883
Electricity Production Cost EUR/MWh 34.690 39.650 27.007 34.756
EUR/MWh Electricity Production Cost
CCPP Power Plant in Base Load Mode
F-Class Turbine34.7
39.7
27.0
34.8
35.0
35.2
35.4
35.5
35.6
35.8
36.0
36.2
36.2
36.4
36.5
36.7
36.9
37.0
28.6
28.8
29.0
0
5
10
15
20
25
30
35
40
45
50
20
05
20
06
20
07
20
08
20
09
20
10
20
11
20
12
20
13
20
14
20
15
20
16
20
17
20
18
20
19
20
20
20
21
20
22
20
23
20
24
20
25
20
26
Consumables
Fuel
Variable Maintenance
Fixed Maintenance
Insurance
Personnel
Debt
Equity
Operating Costs (Variab.)
Operating Costs (Fix)
Capital Costs
Electricity Production Cost
Variable Rev. Electr.

CCPP Power Plant in Base Load Mode
F-Class Turbine
EUR/MWh Electricity Production Cost
0
5
10
15
20
25
30
35
40
45
50
2005-01 2006-01 2007-01 2008-01 2009-01
Equity Debt Personnel Insurance Fixed Maintenance
Variable Maintenance Fuel Consumables Electricity Production Cost Variable Rev. Electr.
Electricity Production Cost Levelized 2005 2006 2007 2008 2009
Capital Costs EUR/MWh 5.943 7.574
Fixed Operating Costs EUR/MWh 3.054 3.979 2.530 2.522
Variable Operating Costs EUR/MWh 25.989 39.741 25.458 24.614
Electricity Production Cost EUR/MWh 34.986 43.721 27.988 34.710
EUR/MWh Electricity Production Cost
CCPP Power Plant in Base Load Mode
E-Class Turbine0.1
0.1
0.1
0.1
0.1
0.1
0.1
0.1
0.1
0.1
0.1
0.1
0.1
0.2
0.2
0.2
0.2
0.2
0.2
0.2
0.2
35.0
43.7
28.0
34.7
35.0
35.2
35.4
35.4
35.6
35.7
35.8
36.0
36.0
36.1
36.3
36.4
36.6
36.6
29.0
29.2
29.3
0
5
10
15
20
25
30
35
40
45
50
20
05
20
06
20
07
20
08
20
09
20
10
20
11
20
12
20
13
20
14
20
15
20
16
20
17
20
18
20
19
20
20
20
21
20
22
20
23
20
24
20
25
20
26
Consumables
Fuel
Variable Maintenance
Fixed Maintenance
Insurance
Personnel
Debt
Equity
Operating Costs (Variab.)
Operating Costs (Fix)
Capital Costs
Electricity Production Cost
Variable Rev. Electr.
CCPP Power Plant in Base Load Mode
E-Class Turbine
EUR/MWh Electricity Production Cost
0
10
20
30
40
50
60
2005-01 2006-01 2007-01 2008-01 2009-01
Equity Debt Personnel Insurance Fixed Maintenance
Variable Maintenance Fuel Consumables Electricity Production Cost Variable Rev. Electr.

Electricity Production Cost Levelized 2005 2006 2007 2008 2009
Capital Costs EUR/MWh 15.434 22.052
Fixed Operating Costs EUR/MWh 20.769 16.565 19.160 19.149
Variable Operating Costs EUR/MWh -5.869 -13.810 -8.310 -5.675
Electricity Production Cost EUR/MWh 30.335 2.755 10.850 35.526
EUR/MWh Electricity Production Cost
CCPP Power Plant in Base Load Mode
Advantage F over E-Class0.1
0.1
0.1
0.1
0.1
0.1
0.1
0.1
0.1
0.1
0.1
0.1
0.1
0.2
0.2
0.2
0.2
0.2
0.2
0.2
0.2
30.335
2.755
10.850
35.526 35.569 35.484 35.585 36.608 36.657 37.551 38.035 38.153 39.206 39.905 40.382 40.786 41.286 42.178
22.556 23.379 24.193
-20
-10
0
10
20
30
40
50
60
20
05
20
06
20
07
20
08
20
09
20
10
20
11
20
12
20
13
20
14
20
15
20
16
20
17
20
18
20
19
20
20
20
21
20
22
20
23
20
24
20
25
20
26
Consumables
Fuel
Variable Maintenance
Fixed Maintenance
Insurance
Debt
Equity
Operating Costs (Variab.)
Operating Costs (Fix)
Capital Costs
Electricity Production Cost
Variable Rev. Electr.

CCPP Power Plant in Base Load Mode
Advantage F over E-Class
EUR/MWh Electricity Production Cost
-60
-40
-20
0
20
40
60
2005-01 2006-01 2007-01 2008-01 2009-01
Equity Debt Insurance Fixed Maintenance Variable Maintenance
Fuel Consumables Electricity Production Cost Variable Rev. Electr. Variable Rev. Heat

CCPP Power Plant in Base Load ModeF-Class Turbine
Operating Result mill. EUR 2005 2006 2007 2008 2009 2010 2011 2012 2013 2014 2015 2016 2017
Operating Revenues Present valueFixed Revenues Electricity
Fixed Revenues Heat
Other Revenues D
Other Revenues E
Other Revenues F
Operating Revenues (Fix)
Variable Rev. Electr. 1,491.790 125.914 196.169 203.958 204.556 205.977 207.407 209.905 211.790 213.258 214.954 216.661
Variable Rev. Heat
Operating Revenues (Variab.) 1,491.790 125.914 196.169 203.958 204.556 205.977 207.407 209.905 211.790 213.258 214.954 216.661
Operating Revenues 1,491.790 125.914 196.169 203.958 204.556 205.977 207.407 209.905 211.790 213.258 214.954 216.661
Operating CostsPersonnel 23.939 2.652 2.732 2.814 2.898 2.985 3.075 3.167 3.262 3.360 3.461 3.564
Insurance 14.706 2.000 2.000 2.000 2.000 2.000 2.000 2.000 2.000 2.000 2.000 2.000
Fixed Maintenance 124.481 13.792 14.205 14.632 15.071 15.523 15.988 16.468 16.962 17.471 17.995 18.535
Other Costs A
Other Costs B
Operating Costs (Fix) 163.126 18.444 18.937 19.445 19.969 20.508 21.063 21.635 22.224 22.831 23.456 24.099
Variable Maintenance 5.117 0.374 0.594 0.630 0.645 0.662 0.680 0.702 0.722 0.741 0.762 0.783
Fuel 918.004 120.097 125.943 126.000 125.620 125.493 125.365 125.619 125.492 125.237 125.109 124.981
Consumables 11.664 0.917 1.443 1.515 1.535 1.561 1.587 1.622 1.653 1.681 1.711 1.742
Operating Costs (Variab.) 934.784 121.389 127.981 128.146 127.800 127.716 127.632 127.943 127.867 127.659 127.582 127.506
Operating Costs 1,097.910 139.833 146.918 147.591 147.769 148.224 148.695 149.578 150.091 150.490 151.038 151.605
Operating ResultOperating Result 393.881 -13.918 49.251 56.367 56.787 57.754 58.712 60.328 61.699 62.768 63.916 65.056

CCPP Power Plant in Base Load ModeF-Class Turbine
Operating Result
Operating RevenuesFixed Revenues Electricity
Fixed Revenues Heat
Other Revenues D
Other Revenues E
Other Revenues F
Operating Revenues (Fix)
Variable Rev. Electr.
Variable Rev. Heat
Operating Revenues (Variab.)
Operating Revenues
Operating CostsPersonnel
Insurance
Fixed Maintenance
Other Costs A
Other Costs B
Operating Costs (Fix)
Variable Maintenance
Fuel
Consumables
Operating Costs (Variab.)
Operating Costs
Operating ResultOperating Result
2018 2019 2020 2021 2022 2023 2024 2025 2026
219.720 221.692 223.682 225.459 227.481 230.225 232.290 234.374 236.476
219.720 221.692 223.682 225.459 227.481 230.225 232.290 234.374 236.476
219.720 221.692 223.682 225.459 227.481 230.225 232.290 234.374 236.476
3.671 3.781 3.895 4.012 4.132 4.256 4.384 4.515 4.651
2.000 2.000 2.000 2.000 2.000 2.000 2.000 2.000 2.000
19.091 19.664 20.254 20.861 21.487 22.132 22.796 23.479 24.184
24.762 25.445 26.148 26.873 27.619 28.388 29.179 29.995 30.835
0.810 0.833 0.858 0.882 0.907 0.936 0.963 0.991 1.020
125.364 125.236 125.236 124.981 124.980 125.108 124.981 124.980 124.852
1.784 1.818 1.852 1.885 1.921 1.964 2.001 2.039 2.077
127.958 127.888 127.945 127.748 127.808 128.008 127.945 128.010 127.949
152.720 153.333 154.094 154.621 155.427 156.396 157.124 158.004 158.784
67.000 68.359 69.588 70.838 72.054 73.829 75.166 76.370 77.692

CCPP Power Plant in Base Load ModeE-Class Turbine
Operating Result mill. EUR 2005 2006 2007 2008 2009 2010 2011 2012 2013 2014 2015 2016 2017
Operating Revenues Present valueFixed Revenues Electricity
Fixed Revenues Heat
Other Revenues D
Other Revenues E
Other Revenues F
Operating Revenues (Fix)
Variable Rev. Electr. 1,397.022 113.403 184.945 192.304 192.479 193.423 194.564 197.110 198.677 200.256 201.640 203.031
Variable Rev. Heat
Operating Revenues (Variab.) 1,397.022 113.403 184.945 192.304 192.479 193.423 194.564 197.110 198.677 200.256 201.640 203.031
Operating Revenues 1,397.022 113.403 184.945 192.304 192.479 193.423 194.564 197.110 198.677 200.256 201.640 203.031
Operating CostsPersonnel 23.939 2.652 2.732 2.814 2.898 2.985 3.075 3.167 3.262 3.360 3.461 3.564
Insurance 11.029 1.500 1.500 1.500 1.500 1.500 1.500 1.500 1.500 1.500 1.500 1.500
Fixed Maintenance 76.604 8.487 8.742 9.004 9.274 9.552 9.839 10.134 10.438 10.751 11.074 11.406
Other Costs AOperating Costs (Fix) 111.572 12.639 12.974 13.318 13.672 14.038 14.414 14.801 15.200 15.611 16.034 16.470
Variable Maintenance 4.792 0.337 0.560 0.594 0.607 0.622 0.638 0.659 0.677 0.696 0.715 0.734
Fuel 933.636 125.065 128.646 127.938 127.424 127.165 127.033 127.292 127.162 127.032 126.772 126.640
Consumables 10.924 0.826 1.361 1.429 1.444 1.466 1.489 1.523 1.551 1.579 1.605 1.632
Operating Costs (Variab.) 949.352 126.228 130.568 129.962 129.475 129.252 129.160 129.475 129.390 129.307 129.092 129.006
Operating Costs 1,060.924 138.867 143.541 143.279 143.147 143.290 143.573 144.276 144.590 144.918 145.126 145.476
Operating ResultOperating Result 336.098 -25.464 41.404 49.024 49.331 50.133 50.991 52.835 54.087 55.338 56.513 57.555

CCPP Power Plant in Base Load ModeE-Class Turbine
Operating Result
Operating RevenuesFixed Revenues Electricity
Fixed Revenues Heat
Other Revenues D
Other Revenues E
Other Revenues F
Operating Revenues (Fix)
Variable Rev. Electr.
Variable Rev. Heat
Operating Revenues (Variab.)
Operating Revenues
Operating CostsPersonnel
Insurance
Fixed Maintenance
Other Costs AOperating Costs (Fix)
Variable Maintenance
Fuel
Consumables
Operating Costs (Variab.)
Operating Costs
Operating ResultOperating Result
2018 2019 2020 2021 2022 2023 2024 2025 2026
206.113 207.962 209.612 211.275 212.950 215.743 217.677 219.403 221.369
206.113 207.962 209.612 211.275 212.950 215.743 217.677 219.403 221.369
206.113 207.962 209.612 211.275 212.950 215.743 217.677 219.403 221.369
3.671 3.781 3.895 4.012 4.132 4.256 4.384 4.515 4.651
1.500 1.500 1.500 1.500 1.500 1.500 1.500 1.500 1.500
11.748 12.101 12.464 12.838 13.223 13.619 14.028 14.449 14.882
16.920 17.382 17.859 18.349 18.855 19.376 19.912 20.464 21.033
0.760 0.782 0.804 0.826 0.849 0.877 0.903 0.928 0.955
127.031 126.901 126.771 126.640 126.508 126.769 126.640 126.508 126.378
1.673 1.705 1.736 1.767 1.798 1.840 1.875 1.908 1.945
129.464 129.388 129.310 129.232 129.156 129.487 129.417 129.345 129.278
146.384 146.771 147.169 147.582 148.011 148.862 149.329 149.809 150.311
59.729 61.191 62.444 63.693 64.940 66.881 68.348 69.594 71.058
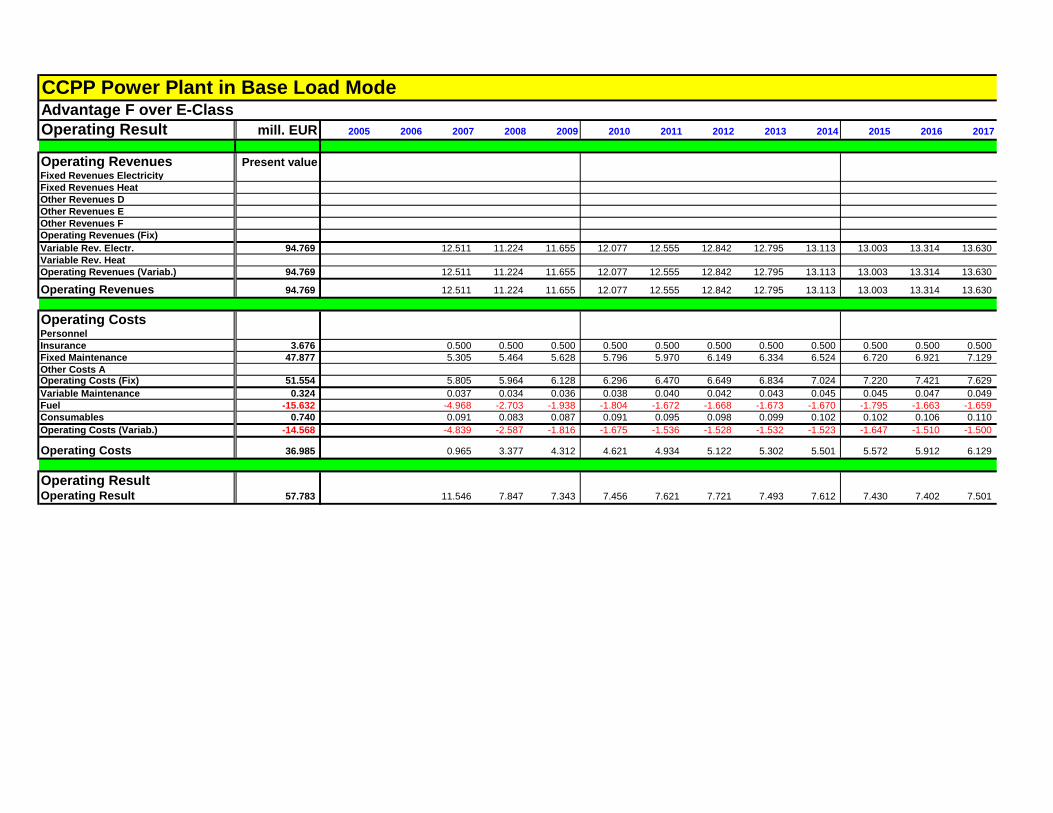
CCPP Power Plant in Base Load ModeAdvantage F over E-Class
Operating Result mill. EUR 2005 2006 2007 2008 2009 2010 2011 2012 2013 2014 2015 2016 2017
Operating Revenues Present valueFixed Revenues Electricity
Fixed Revenues Heat
Other Revenues D
Other Revenues E
Other Revenues F
Operating Revenues (Fix)
Variable Rev. Electr. 94.769 12.511 11.224 11.655 12.077 12.555 12.842 12.795 13.113 13.003 13.314 13.630
Variable Rev. Heat
Operating Revenues (Variab.) 94.769 12.511 11.224 11.655 12.077 12.555 12.842 12.795 13.113 13.003 13.314 13.630
Operating Revenues 94.769 12.511 11.224 11.655 12.077 12.555 12.842 12.795 13.113 13.003 13.314 13.630
Operating CostsPersonnel
Insurance 3.676 0.500 0.500 0.500 0.500 0.500 0.500 0.500 0.500 0.500 0.500 0.500
Fixed Maintenance 47.877 5.305 5.464 5.628 5.796 5.970 6.149 6.334 6.524 6.720 6.921 7.129
Other Costs AOperating Costs (Fix) 51.554 5.805 5.964 6.128 6.296 6.470 6.649 6.834 7.024 7.220 7.421 7.629
Variable Maintenance 0.324 0.037 0.034 0.036 0.038 0.040 0.042 0.043 0.045 0.045 0.047 0.049
Fuel -15.632 -4.968 -2.703 -1.938 -1.804 -1.672 -1.668 -1.673 -1.670 -1.795 -1.663 -1.659
Consumables 0.740 0.091 0.083 0.087 0.091 0.095 0.098 0.099 0.102 0.102 0.106 0.110
Operating Costs (Variab.) -14.568 -4.839 -2.587 -1.816 -1.675 -1.536 -1.528 -1.532 -1.523 -1.647 -1.510 -1.500
Operating Costs 36.985 0.965 3.377 4.312 4.621 4.934 5.122 5.302 5.501 5.572 5.912 6.129
Operating ResultOperating Result 57.783 11.546 7.847 7.343 7.456 7.621 7.721 7.493 7.612 7.430 7.402 7.501

CCPP Power Plant in Base Load ModeAdvantage F over E-Class
Operating Result
Operating RevenuesFixed Revenues Electricity
Fixed Revenues Heat
Other Revenues D
Other Revenues E
Other Revenues F
Operating Revenues (Fix)
Variable Rev. Electr.
Variable Rev. Heat
Operating Revenues (Variab.)
Operating Revenues
Operating CostsPersonnel
Insurance
Fixed Maintenance
Other Costs AOperating Costs (Fix)
Variable Maintenance
Fuel
Consumables
Operating Costs (Variab.)
Operating Costs
Operating ResultOperating Result
2018 2019 2020 2021 2022 2023 2024 2025 2026
13.607 13.730 14.069 14.184 14.531 14.482 14.613 14.971 15.107
13.607 13.730 14.069 14.184 14.531 14.482 14.613 14.971 15.107
13.607 13.730 14.069 14.184 14.531 14.482 14.613 14.971 15.107
0.500 0.500 0.500 0.500 0.500 0.500 0.500 0.500 0.500
7.343 7.563 7.790 8.024 8.264 8.512 8.768 9.031 9.301
7.843 8.063 8.290 8.524 8.764 9.012 9.268 9.531 9.801
0.050 0.052 0.054 0.055 0.058 0.059 0.061 0.063 0.065
-1.667 -1.665 -1.535 -1.659 -1.528 -1.661 -1.659 -1.528 -1.526
0.110 0.113 0.116 0.119 0.123 0.124 0.126 0.130 0.133
-1.507 -1.501 -1.365 -1.485 -1.348 -1.479 -1.472 -1.335 -1.328
6.336 6.562 6.925 7.039 7.416 7.533 7.795 8.196 8.473
7.271 7.168 7.144 7.145 7.115 6.949 6.818 6.776 6.634
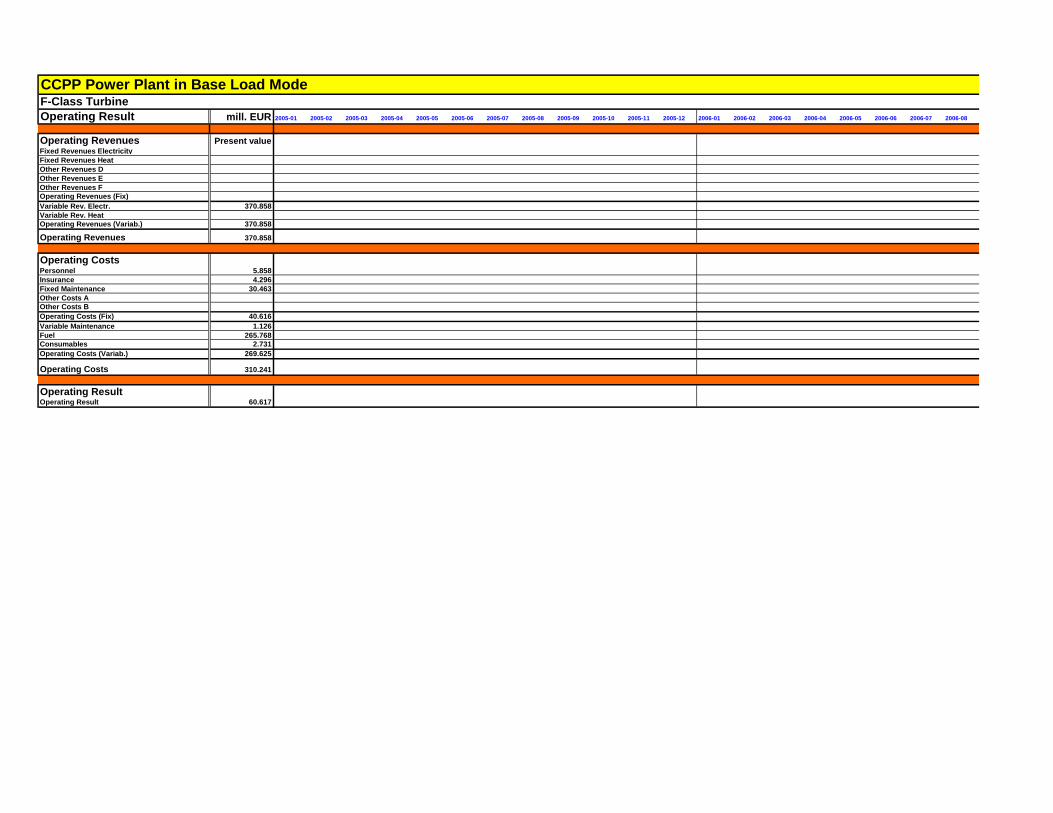
CCPP Power Plant in Base Load ModeF-Class Turbine
Operating Result mill. EUR 2005-01 2005-02 2005-03 2005-04 2005-05 2005-06 2005-07 2005-08 2005-09 2005-10 2005-11 2005-12 2006-01 2006-02 2006-03 2006-04 2006-05 2006-06 2006-07 2006-08
Operating Revenues Present valueFixed Revenues Electricity
Fixed Revenues Heat
Other Revenues D
Other Revenues E
Other Revenues F
Operating Revenues (Fix)
Variable Rev. Electr. 370.858
Variable Rev. Heat
Operating Revenues (Variab.) 370.858
Operating Revenues 370.858
Operating CostsPersonnel 5.858
Insurance 4.296
Fixed Maintenance 30.463
Other Costs A
Other Costs B
Operating Costs (Fix) 40.616
Variable Maintenance 1.126
Fuel 265.768
Consumables 2.731
Operating Costs (Variab.) 269.625
Operating Costs 310.241
Operating ResultOperating Result 60.617

CCPP Power Plant in Base Load ModeF-Class Turbine
Operating Result
Operating RevenuesFixed Revenues Electricity
Fixed Revenues Heat
Other Revenues D
Other Revenues E
Other Revenues F
Operating Revenues (Fix)
Variable Rev. Electr.
Variable Rev. Heat
Operating Revenues (Variab.)
Operating Revenues
Operating CostsPersonnel
Insurance
Fixed Maintenance
Other Costs A
Other Costs B
Operating Costs (Fix)
Variable Maintenance
Fuel
Consumables
Operating Costs (Variab.)
Operating Costs
Operating ResultOperating Result
2006-09 2006-10 2006-11 2006-12 2007-01 2007-02 2007-03 2007-04 2007-05 2007-06 2007-07 2007-08 2007-09 2007-10 2007-11 2007-12 2008-01 2008-02 2008-03 2008-04 2008-05 2008-06
5.475 10.949 10.949 10.949 10.949 10.949 10.949 10.949 10.949 10.949 10.949 10.949 11.059 16.828 16.828 16.828 16.828 16.828
5.475 10.949 10.949 10.949 10.949 10.949 10.949 10.949 10.949 10.949 10.949 10.949 11.059 16.828 16.828 16.828 16.828 16.828
5.475 10.949 10.949 10.949 10.949 10.949 10.949 10.949 10.949 10.949 10.949 10.949 11.059 16.828 16.828 16.828 16.828 16.828
0.221 0.221 0.221 0.221 0.221 0.221 0.221 0.221 0.221 0.221 0.221 0.221 0.228 0.228 0.228 0.228 0.228 0.228
0.167 0.167 0.167 0.167 0.167 0.167 0.167 0.167 0.167 0.167 0.167 0.167 0.167 0.167 0.167 0.167 0.167 0.167
1.149 1.149 1.149 1.149 1.149 1.149 1.149 1.149 1.149 1.149 1.149 1.149 1.184 1.184 1.184 1.184 1.184 1.184
1.537 1.537 1.537 1.537 1.537 1.537 1.537 1.537 1.537 1.537 1.537 1.537 1.578 1.578 1.578 1.578 1.578 1.578
0.016 0.033 0.033 0.033 0.033 0.033 0.033 0.033 0.033 0.033 0.033 0.033 0.034 0.051 0.051 0.051 0.051 0.051
5.222 10.443 10.443 10.443 10.443 10.443 10.443 10.443 10.443 10.443 10.443 10.443 10.443 10.500 10.500 10.500 10.500 10.500
0.040 0.080 0.080 0.080 0.080 0.080 0.080 0.080 0.080 0.080 0.080 0.080 0.081 0.124 0.124 0.124 0.124 0.124
5.278 10.556 10.556 10.556 10.556 10.556 10.556 10.556 10.556 10.556 10.556 10.556 10.558 10.675 10.675 10.675 10.675 10.675
6.815 12.093 12.093 12.093 12.093 12.093 12.093 12.093 12.093 12.093 12.093 12.093 12.136 12.253 12.253 12.253 12.253 12.253
-1.340 -1.143 -1.143 -1.143 -1.143 -1.143 -1.143 -1.143 -1.143 -1.143 -1.143 -1.143 -1.078 4.575 4.575 4.575 4.575 4.575

CCPP Power Plant in Base Load ModeF-Class Turbine
Operating Result
Operating RevenuesFixed Revenues Electricity
Fixed Revenues Heat
Other Revenues D
Other Revenues E
Other Revenues F
Operating Revenues (Fix)
Variable Rev. Electr.
Variable Rev. Heat
Operating Revenues (Variab.)
Operating Revenues
Operating CostsPersonnel
Insurance
Fixed Maintenance
Other Costs A
Other Costs B
Operating Costs (Fix)
Variable Maintenance
Fuel
Consumables
Operating Costs (Variab.)
Operating Costs
Operating ResultOperating Result
2008-07 2008-08 2008-09 2008-10 2008-11 2008-12 2009-01 2009-02 2009-03 2009-04 2009-05 2009-06 2009-07 2009-08 2009-09 2009-10 2009-11 2009-12
16.828 16.828 16.828 16.828 16.828 16.828 16.997 16.997 16.997 16.997 16.997 16.997 16.997 16.997 16.997 16.997 16.997 16.997
16.828 16.828 16.828 16.828 16.828 16.828 16.997 16.997 16.997 16.997 16.997 16.997 16.997 16.997 16.997 16.997 16.997 16.997
16.828 16.828 16.828 16.828 16.828 16.828 16.997 16.997 16.997 16.997 16.997 16.997 16.997 16.997 16.997 16.997 16.997 16.997
0.228 0.228 0.228 0.228 0.228 0.228 0.234 0.234 0.234 0.234 0.234 0.234 0.234 0.234 0.234 0.234 0.234 0.234
0.167 0.167 0.167 0.167 0.167 0.167 0.167 0.167 0.167 0.167 0.167 0.167 0.167 0.167 0.167 0.167 0.167 0.167
1.184 1.184 1.184 1.184 1.184 1.184 1.219 1.219 1.219 1.219 1.219 1.219 1.219 1.219 1.219 1.219 1.219 1.219
1.578 1.578 1.578 1.578 1.578 1.578 1.620 1.620 1.620 1.620 1.620 1.620 1.620 1.620 1.620 1.620 1.620 1.620
0.051 0.051 0.051 0.051 0.051 0.051 0.053 0.053 0.053 0.053 0.053 0.053 0.053 0.053 0.053 0.053 0.053 0.053
10.500 10.500 10.500 10.500 10.500 10.500 10.500 10.500 10.500 10.500 10.500 10.500 10.500 10.500 10.500 10.500 10.500 10.500
0.124 0.124 0.124 0.124 0.124 0.124 0.126 0.126 0.126 0.126 0.126 0.126 0.126 0.126 0.126 0.126 0.126 0.126
10.675 10.675 10.675 10.675 10.675 10.675 10.679 10.679 10.679 10.679 10.679 10.679 10.679 10.679 10.679 10.679 10.679 10.679
12.253 12.253 12.253 12.253 12.253 12.253 12.299 12.299 12.299 12.299 12.299 12.299 12.299 12.299 12.299 12.299 12.299 12.299
4.575 4.575 4.575 4.575 4.575 4.575 4.697 4.697 4.697 4.697 4.697 4.697 4.697 4.697 4.697 4.697 4.697 4.697
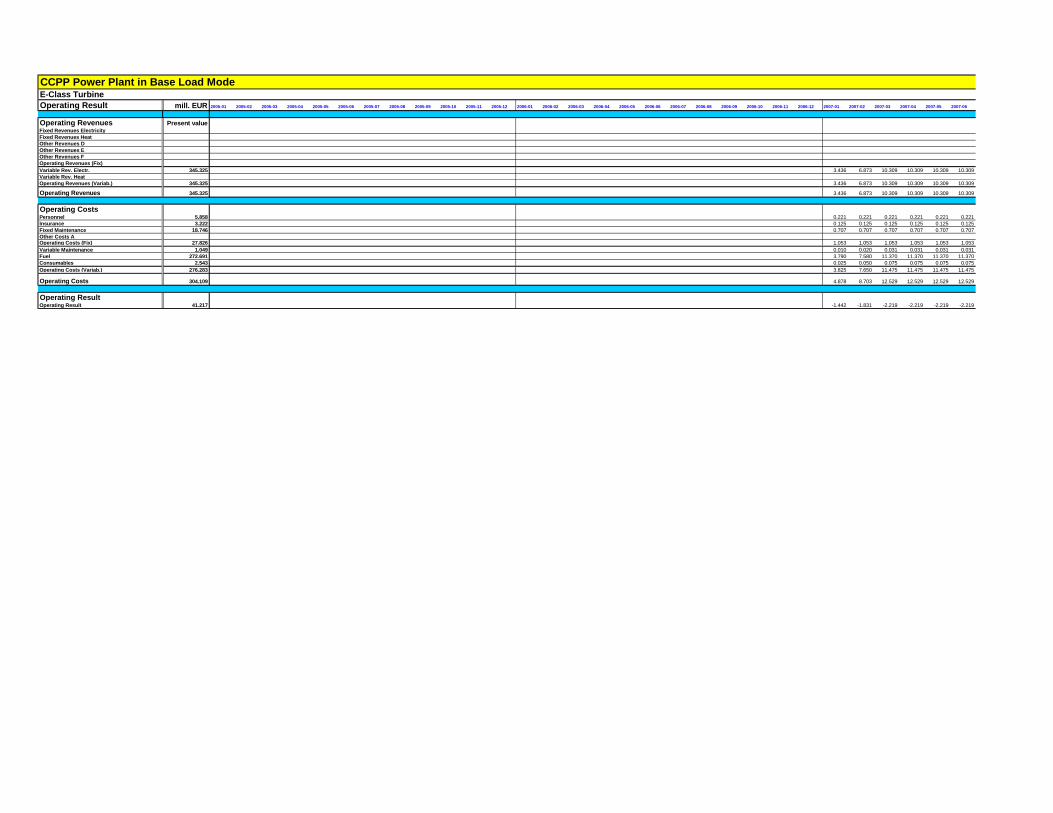
CCPP Power Plant in Base Load ModeE-Class Turbine
Operating Result mill. EUR 2005-01 2005-02 2005-03 2005-04 2005-05 2005-06 2005-07 2005-08 2005-09 2005-10 2005-11 2005-12 2006-01 2006-02 2006-03 2006-04 2006-05 2006-06 2006-07 2006-08 2006-09 2006-10 2006-11 2006-12 2007-01 2007-02 2007-03 2007-04 2007-05 2007-06
Operating Revenues Present valueFixed Revenues Electricity
Fixed Revenues Heat
Other Revenues D
Other Revenues E
Other Revenues F
Operating Revenues (Fix)
Variable Rev. Electr. 345.325 3.436 6.873 10.309 10.309 10.309 10.309
Variable Rev. Heat
Operating Revenues (Variab.) 345.325 3.436 6.873 10.309 10.309 10.309 10.309
Operating Revenues 345.325 3.436 6.873 10.309 10.309 10.309 10.309
Operating CostsPersonnel 5.858 0.221 0.221 0.221 0.221 0.221 0.221
Insurance 3.222 0.125 0.125 0.125 0.125 0.125 0.125
Fixed Maintenance 18.746 0.707 0.707 0.707 0.707 0.707 0.707
Other Costs AOperating Costs (Fix) 27.826 1.053 1.053 1.053 1.053 1.053 1.053
Variable Maintenance 1.049 0.010 0.020 0.031 0.031 0.031 0.031
Fuel 272.691 3.790 7.580 11.370 11.370 11.370 11.370
Consumables 2.543 0.025 0.050 0.075 0.075 0.075 0.075
Operating Costs (Variab.) 276.283 3.825 7.650 11.475 11.475 11.475 11.475
Operating Costs 304.109 4.878 8.703 12.529 12.529 12.529 12.529
Operating ResultOperating Result 41.217 -1.442 -1.831 -2.219 -2.219 -2.219 -2.219

CCPP Power Plant in Base Load ModeE-Class Turbine
Operating Result
Operating RevenuesFixed Revenues Electricity
Fixed Revenues Heat
Other Revenues D
Other Revenues E
Other Revenues F
Operating Revenues (Fix)
Variable Rev. Electr.
Variable Rev. Heat
Operating Revenues (Variab.)
Operating Revenues
Operating CostsPersonnel
Insurance
Fixed Maintenance
Other Costs AOperating Costs (Fix)
Variable Maintenance
Fuel
Consumables
Operating Costs (Variab.)
Operating Costs
Operating ResultOperating Result
2007-07 2007-08 2007-09 2007-10 2007-11 2007-12 2008-01 2008-02 2008-03 2008-04 2008-05 2008-06 2008-07 2008-08 2008-09 2008-10 2008-11 2008-12 2009-01 2009-02 2009-03 2009-04 2009-05 2009-06 2009-07 2009-08 2009-09 2009-10 2009-11 2009-12
10.309 10.309 10.309 10.309 10.309 10.309 10.412 15.867 15.867 15.867 15.867 15.867 15.867 15.867 15.867 15.867 15.867 15.867 16.025 16.025 16.025 16.025 16.025 16.025 16.025 16.025 16.025 16.025 16.025 16.025
10.309 10.309 10.309 10.309 10.309 10.309 10.412 15.867 15.867 15.867 15.867 15.867 15.867 15.867 15.867 15.867 15.867 15.867 16.025 16.025 16.025 16.025 16.025 16.025 16.025 16.025 16.025 16.025 16.025 16.025
10.309 10.309 10.309 10.309 10.309 10.309 10.412 15.867 15.867 15.867 15.867 15.867 15.867 15.867 15.867 15.867 15.867 15.867 16.025 16.025 16.025 16.025 16.025 16.025 16.025 16.025 16.025 16.025 16.025 16.025
0.221 0.221 0.221 0.221 0.221 0.221 0.228 0.228 0.228 0.228 0.228 0.228 0.228 0.228 0.228 0.228 0.228 0.228 0.234 0.234 0.234 0.234 0.234 0.234 0.234 0.234 0.234 0.234 0.234 0.234
0.125 0.125 0.125 0.125 0.125 0.125 0.125 0.125 0.125 0.125 0.125 0.125 0.125 0.125 0.125 0.125 0.125 0.125 0.125 0.125 0.125 0.125 0.125 0.125 0.125 0.125 0.125 0.125 0.125 0.125
0.707 0.707 0.707 0.707 0.707 0.707 0.728 0.728 0.728 0.728 0.728 0.728 0.728 0.728 0.728 0.728 0.728 0.728 0.750 0.750 0.750 0.750 0.750 0.750 0.750 0.750 0.750 0.750 0.750 0.750
1.053 1.053 1.053 1.053 1.053 1.053 1.081 1.081 1.081 1.081 1.081 1.081 1.081 1.081 1.081 1.081 1.081 1.081 1.110 1.110 1.110 1.110 1.110 1.110 1.110 1.110 1.110 1.110 1.110 1.110
0.031 0.031 0.031 0.031 0.031 0.031 0.032 0.048 0.048 0.048 0.048 0.048 0.048 0.048 0.048 0.048 0.048 0.048 0.050 0.050 0.050 0.050 0.050 0.050 0.050 0.050 0.050 0.050 0.050 0.050
11.370 11.370 11.370 11.370 11.370 11.370 11.370 10.662 10.662 10.662 10.662 10.662 10.662 10.662 10.662 10.662 10.662 10.662 10.662 10.662 10.662 10.662 10.662 10.662 10.662 10.662 10.662 10.662 10.662 10.662
0.075 0.075 0.075 0.075 0.075 0.075 0.077 0.117 0.117 0.117 0.117 0.117 0.117 0.117 0.117 0.117 0.117 0.117 0.119 0.119 0.119 0.119 0.119 0.119 0.119 0.119 0.119 0.119 0.119 0.119
11.475 11.475 11.475 11.475 11.475 11.475 11.478 10.826 10.826 10.826 10.826 10.826 10.826 10.826 10.826 10.826 10.826 10.826 10.830 10.830 10.830 10.830 10.830 10.830 10.830 10.830 10.830 10.830 10.830 10.830
12.529 12.529 12.529 12.529 12.529 12.529 12.559 11.907 11.907 11.907 11.907 11.907 11.907 11.907 11.907 11.907 11.907 11.907 11.940 11.940 11.940 11.940 11.940 11.940 11.940 11.940 11.940 11.940 11.940 11.940
-2.219 -2.219 -2.219 -2.219 -2.219 -2.219 -2.146 3.959 3.959 3.959 3.959 3.959 3.959 3.959 3.959 3.959 3.959 3.959 4.085 4.085 4.085 4.085 4.085 4.085 4.085 4.085 4.085 4.085 4.085 4.085

CCPP Power Plant in Base Load ModeAdvantage F over E-Class
Operating Result mill. EUR 2005-01 2005-02 2005-03 2005-04 2005-05 2005-06 2005-07 2005-08 2005-09 2005-10 2005-11 2005-12 2006-01 2006-02 2006-03 2006-04 2006-05 2006-06 2006-07 2006-08 2006-09 2006-10 2006-11 2006-12 2007-01 2007-02 2007-03 2007-04 2007-05 2007-06
Operating Revenues Present valueFixed Revenues Electricity
Fixed Revenues Heat
Other Revenues D
Other Revenues E
Other Revenues F
Operating Revenues (Fix)
Variable Rev. Electr. 25.533 2.038 4.076 0.640 0.640 0.640 0.640
Variable Rev. Heat
Operating Revenues (Variab.) 25.533 2.038 4.076 0.640 0.640 0.640 0.640
Operating Revenues 25.533 2.038 4.076 0.640 0.640 0.640 0.640
Operating CostsPersonnel
Insurance 1.074 0.042 0.042 0.042 0.042 0.042 0.042
Fixed Maintenance 11.716 0.442 0.442 0.442 0.442 0.442 0.442
Other Costs AOperating Costs (Fix) 12.790 0.484 0.484 0.484 0.484 0.484 0.484
Variable Maintenance 0.077 0.006 0.012 0.002 0.002 0.002 0.002
Fuel -6.923 1.432 2.864 -0.926 -0.926 -0.926 -0.926
Consumables 0.188 0.015 0.030 0.005 0.005 0.005 0.005
Operating Costs (Variab.) -6.658 1.453 2.905 -0.920 -0.920 -0.920 -0.920
Operating Costs 6.132 1.936 3.389 -0.436 -0.436 -0.436 -0.436
Operating ResultOperating Result 19.401 0.102 0.687 1.076 1.076 1.076 1.076

CCPP Power Plant in Base Load ModeAdvantage F over E-Class
Operating Result
Operating RevenuesFixed Revenues Electricity
Fixed Revenues Heat
Other Revenues D
Other Revenues E
Other Revenues F
Operating Revenues (Fix)
Variable Rev. Electr.
Variable Rev. Heat
Operating Revenues (Variab.)
Operating Revenues
Operating CostsPersonnel
Insurance
Fixed Maintenance
Other Costs AOperating Costs (Fix)
Variable Maintenance
Fuel
Consumables
Operating Costs (Variab.)
Operating Costs
Operating ResultOperating Result
2007-07 2007-08 2007-09 2007-10 2007-11 2007-12 2008-01 2008-02 2008-03 2008-04 2008-05 2008-06 2008-07 2008-08 2008-09 2008-10 2008-11 2008-12 2009-01 2009-02 2009-03 2009-04 2009-05 2009-06 2009-07 2009-08 2009-09 2009-10 2009-11 2009-12
0.640 0.640 0.640 0.640 0.640 0.640 0.646 0.962 0.962 0.962 0.962 0.962 0.962 0.962 0.962 0.962 0.962 0.962 0.971 0.971 0.971 0.971 0.971 0.971 0.971 0.971 0.971 0.971 0.971 0.971
0.640 0.640 0.640 0.640 0.640 0.640 0.646 0.962 0.962 0.962 0.962 0.962 0.962 0.962 0.962 0.962 0.962 0.962 0.971 0.971 0.971 0.971 0.971 0.971 0.971 0.971 0.971 0.971 0.971 0.971
0.640 0.640 0.640 0.640 0.640 0.640 0.646 0.962 0.962 0.962 0.962 0.962 0.962 0.962 0.962 0.962 0.962 0.962 0.971 0.971 0.971 0.971 0.971 0.971 0.971 0.971 0.971 0.971 0.971 0.971
0.042 0.042 0.042 0.042 0.042 0.042 0.042 0.042 0.042 0.042 0.042 0.042 0.042 0.042 0.042 0.042 0.042 0.042 0.042 0.042 0.042 0.042 0.042 0.042 0.042 0.042 0.042 0.042 0.042 0.042
0.442 0.442 0.442 0.442 0.442 0.442 0.455 0.455 0.455 0.455 0.455 0.455 0.455 0.455 0.455 0.455 0.455 0.455 0.469 0.469 0.469 0.469 0.469 0.469 0.469 0.469 0.469 0.469 0.469 0.469
0.484 0.484 0.484 0.484 0.484 0.484 0.497 0.497 0.497 0.497 0.497 0.497 0.497 0.497 0.497 0.497 0.497 0.497 0.511 0.511 0.511 0.511 0.511 0.511 0.511 0.511 0.511 0.511 0.511 0.511
0.002 0.002 0.002 0.002 0.002 0.002 0.002 0.003 0.003 0.003 0.003 0.003 0.003 0.003 0.003 0.003 0.003 0.003 0.003 0.003 0.003 0.003 0.003 0.003 0.003 0.003 0.003 0.003 0.003 0.003
-0.926 -0.926 -0.926 -0.926 -0.926 -0.926 -0.926 -0.162 -0.162 -0.162 -0.162 -0.162 -0.162 -0.162 -0.162 -0.162 -0.162 -0.162 -0.162 -0.162 -0.162 -0.162 -0.162 -0.162 -0.162 -0.162 -0.162 -0.162 -0.162 -0.162
0.005 0.005 0.005 0.005 0.005 0.005 0.005 0.007 0.007 0.007 0.007 0.007 0.007 0.007 0.007 0.007 0.007 0.007 0.007 0.007 0.007 0.007 0.007 0.007 0.007 0.007 0.007 0.007 0.007 0.007
-0.920 -0.920 -0.920 -0.920 -0.920 -0.920 -0.920 -0.152 -0.152 -0.152 -0.152 -0.152 -0.152 -0.152 -0.152 -0.152 -0.152 -0.152 -0.151 -0.151 -0.151 -0.151 -0.151 -0.151 -0.151 -0.151 -0.151 -0.151 -0.151 -0.151
-0.436 -0.436 -0.436 -0.436 -0.436 -0.436 -0.423 0.345 0.345 0.345 0.345 0.345 0.345 0.345 0.345 0.345 0.345 0.345 0.359 0.359 0.359 0.359 0.359 0.359 0.359 0.359 0.359 0.359 0.359 0.359
1.076 1.076 1.076 1.076 1.076 1.076 1.069 0.616 0.616 0.616 0.616 0.616 0.616 0.616 0.616 0.616 0.616 0.616 0.612 0.612 0.612 0.612 0.612 0.612 0.612 0.612 0.612 0.612 0.612 0.612

CCPP Power Plant in Base Load Mode
F-Class Turbine
Return on Investment mill. EUR 2005 2006 2007 2008 2009 2010 2011 2012 2013 2014 2015 2016 2017
Investment Present valueEquity 98.103 12.000 60.000 12.000 36.000
Debt 228.906 28.000 140.000 28.000 84.000
interest during construction
Investment Volume 327.009 40.000 200.000 40.000 120.000
Debt ServiceDebt Payback 88.498 10.312 11.137 12.028 12.990 14.030 15.152 16.364 17.673 19.087
Debt interest 82.901 21.258 20.434 19.543 18.580 17.541 16.419 15.206 13.897 12.483
Debt Service 171.400 31.571 31.571 31.571 31.571 31.571 31.571 31.571 31.571 31.571
Income Tax Rate and ProfitOperating Result 393.881 -13.918 49.251 56.367 56.787 57.754 58.712 60.328 61.699 62.768 63.916 65.056
Depreciation -175.178 -26.667 -26.667 -26.667 -26.667 -26.667 -26.667 -26.667 -26.667 -26.667 -26.667 -26.667
Debt interest -82.901 -21.258 -20.434 -19.543 -18.580 -17.541 -16.419 -15.206 -13.897 -12.483
Profit before Tax 135.802 -40.585 22.584 8.442 9.687 11.545 13.465 16.120 18.614 20.895 23.352 25.906
Income Tax -59.547 -9.060 -2.955 -3.390 -4.041 -4.713 -5.642 -6.515 -7.313 -8.173 -9.067
Profit after Tax 76.255 -40.585 13.525 5.487 6.297 7.504 8.752 10.478 12.099 13.582 15.179 16.839
Cash FlowVariable Rev. Electr. 1,491.790 125.914 196.169 203.958 204.556 205.977 207.407 209.905 211.790 213.258 214.954 216.661
Operating Revenues (Variab.) 1,491.790 125.914 196.169 203.958 204.556 205.977 207.407 209.905 211.790 213.258 214.954 216.661
Operating Revenues 1,491.790 125.914 196.169 203.958 204.556 205.977 207.407 209.905 211.790 213.258 214.954 216.661
Personnel -23.939 -2.652 -2.732 -2.814 -2.898 -2.985 -3.075 -3.167 -3.262 -3.360 -3.461 -3.564
Insurance -14.706 -2.000 -2.000 -2.000 -2.000 -2.000 -2.000 -2.000 -2.000 -2.000 -2.000 -2.000
Fixed Maintenance -124.481 -13.792 -14.205 -14.632 -15.071 -15.523 -15.988 -16.468 -16.962 -17.471 -17.995 -18.535
Operating Costs (Fix) -163.126 -18.444 -18.937 -19.445 -19.969 -20.508 -21.063 -21.635 -22.224 -22.831 -23.456 -24.099
Variable Maintenance -5.117 -0.374 -0.594 -0.630 -0.645 -0.662 -0.680 -0.702 -0.722 -0.741 -0.762 -0.783
Fuel -918.004 -120.097 -125.943 -126.000 -125.620 -125.493 -125.365 -125.619 -125.492 -125.237 -125.109 -124.981
Consumables -11.664 -0.917 -1.443 -1.515 -1.535 -1.561 -1.587 -1.622 -1.653 -1.681 -1.711 -1.742
Operating Costs (Variab.) -934.784 -121.389 -127.981 -128.146 -127.800 -127.716 -127.632 -127.943 -127.867 -127.659 -127.582 -127.506
Operating Costs -1,097.910 -139.833 -146.918 -147.591 -147.769 -148.224 -148.695 -149.578 -150.091 -150.490 -151.038 -151.605
Investment Volume -327.009 -40.000 -200.000 -40.000 -120.000
Income from Credit 228.906 28.000 140.000 28.000 84.000
Debt Service -171.400 -31.571 -31.571 -31.571 -31.571 -31.571 -31.571 -31.571 -31.571 -31.571
Income Tax -59.547 -9.060 -2.955 -3.390 -4.041 -4.713 -5.642 -6.515 -7.313 -8.173 -9.067
Cash Flow 64.832 -12.000 -60.000 -25.918 4.192 21.842 21.826 22.142 22.428 23.115 23.614 23.884 24.172 24.418
Cash Flow, accumulated -12.000 -72.000 -97.918 -93.727 -71.885 -50.059 -27.917 -5.488 17.627 41.240 65.124 89.296 113.714
Internal Rate of Return 17.5% 3.5% 7.0% 9.5% 11.3% 12.7%
Present Value of Cash Flow 64.832 -11.172 -50.548 -20.696 1.914 14.174 12.877 11.876 10.936 10.246 9.515 8.750 8.050 7.393
Net Present Value 9.2 a -11.172 -61.721 -82.417 -80.502 -66.328 -53.451 -41.576 -30.640 -20.394 -10.879 -2.129 5.921 13.314
Debt Service Cover RatioOperating Result -13.918 49.251 56.367 56.787 57.754 58.712 60.328 61.699 62.768 63.916 65.056
Income Tax -9.060 -2.955 -3.390 -4.041 -4.713 -5.642 -6.515 -7.313 -8.173 -9.067
Cash Flow for DSCR -13.918 40.192 53.413 53.397 53.713 53.999 54.686 55.184 55.455 55.743 55.989
Debt Service 31.571 31.571 31.571 31.571 31.571 31.571 31.571 31.571 31.571
Debt Service Cover Ratio 1.69 1.69 1.70 1.71 1.73 1.75 1.76 1.77 1.77

CCPP Power Plant in Base Load Mode
F-Class Turbine
Return on Investment
InvestmentEquity
Debt
interest during construction
Investment Volume
Debt ServiceDebt Payback
Debt interest
Debt Service
Income Tax Rate and ProfitOperating Result
Depreciation
Debt interest
Profit before Tax
Income Tax
Profit after Tax
Cash FlowVariable Rev. Electr.
Operating Revenues (Variab.)
Operating Revenues
Personnel
Insurance
Fixed Maintenance
Operating Costs (Fix)
Variable Maintenance
Fuel
Consumables
Operating Costs (Variab.)
Operating Costs
Investment Volume
Income from Credit
Debt Service
Income Tax
Cash FlowCash Flow, accumulated
Internal Rate of ReturnPresent Value of Cash Flow
Net Present Value
Debt Service Cover RatioOperating Result
Income Tax
Cash Flow for DSCR
Debt Service
Debt Service Cover Ratio
2018 2019 2020 2021 2022 2023 2024 2025 2026
20.614 22.263 24.044 25.968 28.046 30.289
10.956 9.307 7.526 5.603 3.525 1.282
31.571 31.571 31.571 31.571 31.571 31.571
67.000 68.359 69.588 70.838 72.054 73.829 75.166 76.370 77.692
-26.667 -26.667 -26.667 -26.667
-10.956 -9.307 -7.526 -5.603 -3.525 -1.282
29.377 32.385 35.395 38.569 68.529 72.548 75.166 76.370 77.692
-10.282 -11.335 -12.388 -13.499 -23.985 -25.392 -26.308 -26.729 -27.192
19.095 21.051 23.007 25.070 44.544 47.156 48.858 49.640 50.500
219.720 221.692 223.682 225.459 227.481 230.225 232.290 234.374 236.476
219.720 221.692 223.682 225.459 227.481 230.225 232.290 234.374 236.476
219.720 221.692 223.682 225.459 227.481 230.225 232.290 234.374 236.476
-3.671 -3.781 -3.895 -4.012 -4.132 -4.256 -4.384 -4.515 -4.651
-2.000 -2.000 -2.000 -2.000 -2.000 -2.000 -2.000 -2.000 -2.000
-19.091 -19.664 -20.254 -20.861 -21.487 -22.132 -22.796 -23.479 -24.184
-24.762 -25.445 -26.148 -26.873 -27.619 -28.388 -29.179 -29.995 -30.835
-0.810 -0.833 -0.858 -0.882 -0.907 -0.936 -0.963 -0.991 -1.020
-125.364 -125.236 -125.236 -124.981 -124.980 -125.108 -124.981 -124.980 -124.852
-1.784 -1.818 -1.852 -1.885 -1.921 -1.964 -2.001 -2.039 -2.077
-127.958 -127.888 -127.945 -127.748 -127.808 -128.008 -127.945 -128.010 -127.949
-152.720 -153.333 -154.094 -154.621 -155.427 -156.396 -157.124 -158.004 -158.784
-31.571 -31.571 -31.571 -31.571 -31.571 -31.571
-10.282 -11.335 -12.388 -13.499 -23.985 -25.392 -26.308 -26.729 -27.192
25.148 25.454 25.629 25.768 16.498 16.867 48.858 49.640 50.500
138.862 164.316 189.945 215.713 232.211 249.078 297.936 347.576 398.076
13.8% 14.6% 15.3% 15.8% 16.1% 16.3% 16.8% 17.2% 17.5%
6.922 6.369 5.830 5.329 3.102 2.883 7.590 7.010 6.483
20.236 26.605 32.435 37.763 40.866 43.749 51.338 58.348 64.832
67.000 68.359 69.588 70.838 72.054 73.829 75.166 76.370 77.692
-10.282 -11.335 -12.388 -13.499 -23.985 -25.392 -26.308 -26.729 -27.192
56.718 57.025 57.200 57.339 48.069 48.438 48.858 49.640 50.500
31.571 31.571 31.571 31.571 31.571 31.571
1.80 1.81 1.81 1.82 1.52 1.53
CCPP Power Plant in Base Load Mode
E-Class Turbine
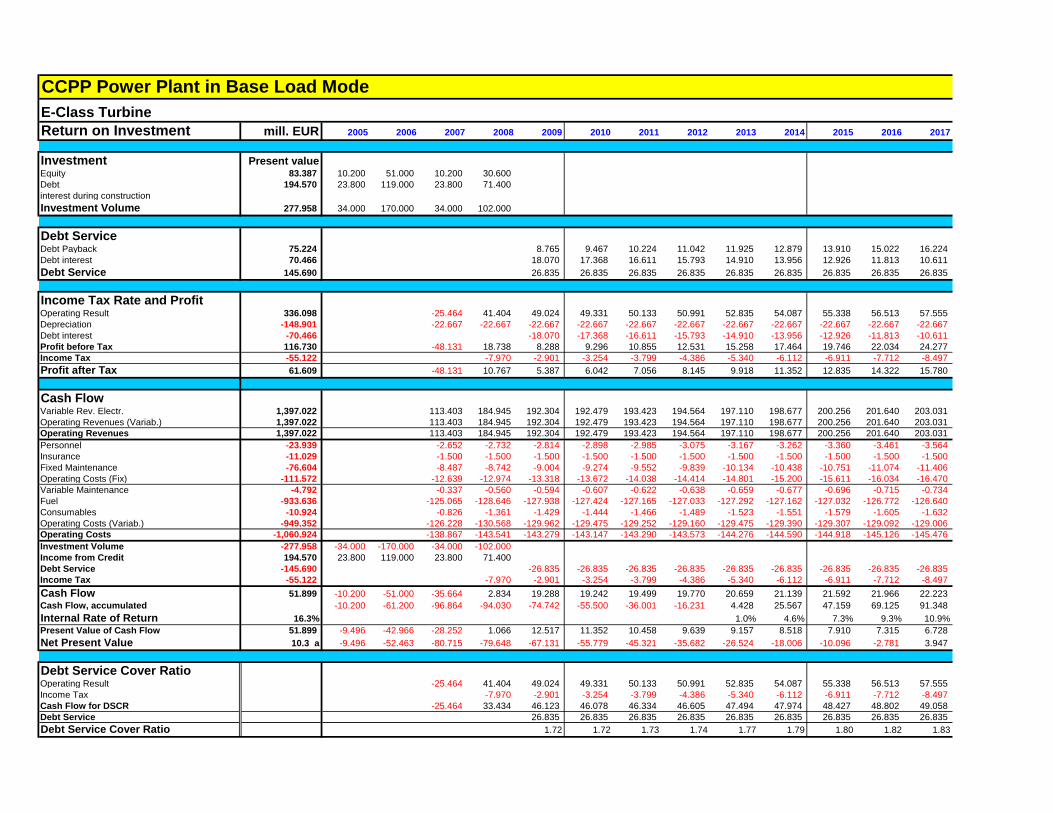
Return on Investment mill. EUR 2005 2006 2007 2008 2009 2010 2011 2012 2013 2014 2015 2016 2017
Investment Present valueEquity 83.387 10.200 51.000 10.200 30.600
Debt 194.570 23.800 119.000 23.800 71.400
interest during construction
Investment Volume 277.958 34.000 170.000 34.000 102.000
Debt ServiceDebt Payback 75.224 8.765 9.467 10.224 11.042 11.925 12.879 13.910 15.022 16.224
Debt interest 70.466 18.070 17.368 16.611 15.793 14.910 13.956 12.926 11.813 10.611
Debt Service 145.690 26.835 26.835 26.835 26.835 26.835 26.835 26.835 26.835 26.835
Income Tax Rate and ProfitOperating Result 336.098 -25.464 41.404 49.024 49.331 50.133 50.991 52.835 54.087 55.338 56.513 57.555
Depreciation -148.901 -22.667 -22.667 -22.667 -22.667 -22.667 -22.667 -22.667 -22.667 -22.667 -22.667 -22.667
Debt interest -70.466 -18.070 -17.368 -16.611 -15.793 -14.910 -13.956 -12.926 -11.813 -10.611
Profit before Tax 116.730 -48.131 18.738 8.288 9.296 10.855 12.531 15.258 17.464 19.746 22.034 24.277
Income Tax -55.122 -7.970 -2.901 -3.254 -3.799 -4.386 -5.340 -6.112 -6.911 -7.712 -8.497
Profit after Tax 61.609 -48.131 10.767 5.387 6.042 7.056 8.145 9.918 11.352 12.835 14.322 15.780
Cash FlowVariable Rev. Electr. 1,397.022 113.403 184.945 192.304 192.479 193.423 194.564 197.110 198.677 200.256 201.640 203.031
Operating Revenues (Variab.) 1,397.022 113.403 184.945 192.304 192.479 193.423 194.564 197.110 198.677 200.256 201.640 203.031
Operating Revenues 1,397.022 113.403 184.945 192.304 192.479 193.423 194.564 197.110 198.677 200.256 201.640 203.031
Personnel -23.939 -2.652 -2.732 -2.814 -2.898 -2.985 -3.075 -3.167 -3.262 -3.360 -3.461 -3.564
Insurance -11.029 -1.500 -1.500 -1.500 -1.500 -1.500 -1.500 -1.500 -1.500 -1.500 -1.500 -1.500
Fixed Maintenance -76.604 -8.487 -8.742 -9.004 -9.274 -9.552 -9.839 -10.134 -10.438 -10.751 -11.074 -11.406
Operating Costs (Fix) -111.572 -12.639 -12.974 -13.318 -13.672 -14.038 -14.414 -14.801 -15.200 -15.611 -16.034 -16.470
Variable Maintenance -4.792 -0.337 -0.560 -0.594 -0.607 -0.622 -0.638 -0.659 -0.677 -0.696 -0.715 -0.734
Fuel -933.636 -125.065 -128.646 -127.938 -127.424 -127.165 -127.033 -127.292 -127.162 -127.032 -126.772 -126.640
Consumables -10.924 -0.826 -1.361 -1.429 -1.444 -1.466 -1.489 -1.523 -1.551 -1.579 -1.605 -1.632
Operating Costs (Variab.) -949.352 -126.228 -130.568 -129.962 -129.475 -129.252 -129.160 -129.475 -129.390 -129.307 -129.092 -129.006
Operating Costs -1,060.924 -138.867 -143.541 -143.279 -143.147 -143.290 -143.573 -144.276 -144.590 -144.918 -145.126 -145.476
Investment Volume -277.958 -34.000 -170.000 -34.000 -102.000
Income from Credit 194.570 23.800 119.000 23.800 71.400
Debt Service -145.690 -26.835 -26.835 -26.835 -26.835 -26.835 -26.835 -26.835 -26.835 -26.835
Income Tax -55.122 -7.970 -2.901 -3.254 -3.799 -4.386 -5.340 -6.112 -6.911 -7.712 -8.497
Cash Flow 51.899 -10.200 -51.000 -35.664 2.834 19.288 19.242 19.499 19.770 20.659 21.139 21.592 21.966 22.223
Cash Flow, accumulated -10.200 -61.200 -96.864 -94.030 -74.742 -55.500 -36.001 -16.231 4.428 25.567 47.159 69.125 91.348
Internal Rate of Return 16.3% 1.0% 4.6% 7.3% 9.3% 10.9%
Present Value of Cash Flow 51.899 -9.496 -42.966 -28.252 1.066 12.517 11.352 10.458 9.639 9.157 8.518 7.910 7.315 6.728
Net Present Value 10.3 a -9.496 -52.463 -80.715 -79.648 -67.131 -55.779 -45.321 -35.682 -26.524 -18.006 -10.096 -2.781 3.947
Debt Service Cover RatioOperating Result -25.464 41.404 49.024 49.331 50.133 50.991 52.835 54.087 55.338 56.513 57.555
Income Tax -7.970 -2.901 -3.254 -3.799 -4.386 -5.340 -6.112 -6.911 -7.712 -8.497
Cash Flow for DSCR -25.464 33.434 46.123 46.078 46.334 46.605 47.494 47.974 48.427 48.802 49.058
Debt Service 26.835 26.835 26.835 26.835 26.835 26.835 26.835 26.835 26.835
Debt Service Cover Ratio 1.72 1.72 1.73 1.74 1.77 1.79 1.80 1.82 1.83

CCPP Power Plant in Base Load Mode
E-Class Turbine
Return on Investment
InvestmentEquity
Debt
interest during construction
Investment Volume
Debt ServiceDebt Payback
Debt interest
Debt Service
Income Tax Rate and ProfitOperating Result
Depreciation
Debt interest
Profit before Tax
Income Tax
Profit after Tax
Cash FlowVariable Rev. Electr.
Operating Revenues (Variab.)
Operating Revenues
Personnel
Insurance
Fixed Maintenance
Operating Costs (Fix)
Variable Maintenance
Fuel
Consumables
Operating Costs (Variab.)
Operating Costs
Investment Volume
Income from Credit
Debt Service
Income Tax
Cash FlowCash Flow, accumulated
Internal Rate of ReturnPresent Value of Cash Flow
Net Present Value
Debt Service Cover RatioOperating Result
Income Tax
Cash Flow for DSCR
Debt Service
Debt Service Cover Ratio
2018 2019 2020 2021 2022 2023 2024 2025 2026
17.522 18.924 20.438 22.073 23.839 25.746
9.313 7.911 6.397 4.762 2.996 1.089
26.835 26.835 26.835 26.835 26.835 26.835
59.729 61.191 62.444 63.693 64.940 66.881 68.348 69.594 71.058
-22.667 -22.667 -22.667 -22.667
-9.313 -7.911 -6.397 -4.762 -2.996 -1.089
27.750 30.613 33.380 36.264 61.943 65.791 68.348 69.594 71.058
-9.712 -10.715 -11.683 -12.693 -21.680 -23.027 -23.922 -24.358 -24.870
18.037 19.899 21.697 23.572 40.263 42.764 44.426 45.236 46.188
206.113 207.962 209.612 211.275 212.950 215.743 217.677 219.403 221.369
206.113 207.962 209.612 211.275 212.950 215.743 217.677 219.403 221.369
206.113 207.962 209.612 211.275 212.950 215.743 217.677 219.403 221.369
-3.671 -3.781 -3.895 -4.012 -4.132 -4.256 -4.384 -4.515 -4.651
-1.500 -1.500 -1.500 -1.500 -1.500 -1.500 -1.500 -1.500 -1.500
-11.748 -12.101 -12.464 -12.838 -13.223 -13.619 -14.028 -14.449 -14.882
-16.920 -17.382 -17.859 -18.349 -18.855 -19.376 -19.912 -20.464 -21.033
-0.760 -0.782 -0.804 -0.826 -0.849 -0.877 -0.903 -0.928 -0.955
-127.031 -126.901 -126.771 -126.640 -126.508 -126.769 -126.640 -126.508 -126.378
-1.673 -1.705 -1.736 -1.767 -1.798 -1.840 -1.875 -1.908 -1.945
-129.464 -129.388 -129.310 -129.232 -129.156 -129.487 -129.417 -129.345 -129.278
-146.384 -146.771 -147.169 -147.582 -148.011 -148.862 -149.329 -149.809 -150.311
-26.835 -26.835 -26.835 -26.835 -26.835 -26.835
-9.712 -10.715 -11.683 -12.693 -21.680 -23.027 -23.922 -24.358 -24.870
23.182 23.641 23.926 24.166 16.424 17.018 44.426 45.236 46.188
114.530 138.171 162.097 186.263 202.687 219.705 264.132 309.368 355.556
12.1% 13.0% 13.7% 14.3% 14.6% 14.9% 15.5% 15.9% 16.3%
6.380 5.916 5.442 4.997 3.088 2.909 6.901 6.388 5.930
10.328 16.243 21.686 26.683 29.771 32.680 39.581 45.969 51.899
59.729 61.191 62.444 63.693 64.940 66.881 68.348 69.594 71.058
-9.712 -10.715 -11.683 -12.693 -21.680 -23.027 -23.922 -24.358 -24.870
50.017 50.477 50.761 51.001 43.259 43.854 44.426 45.236 46.188
26.835 26.835 26.835 26.835 26.835 26.835
1.86 1.88 1.89 1.90 1.61 1.63
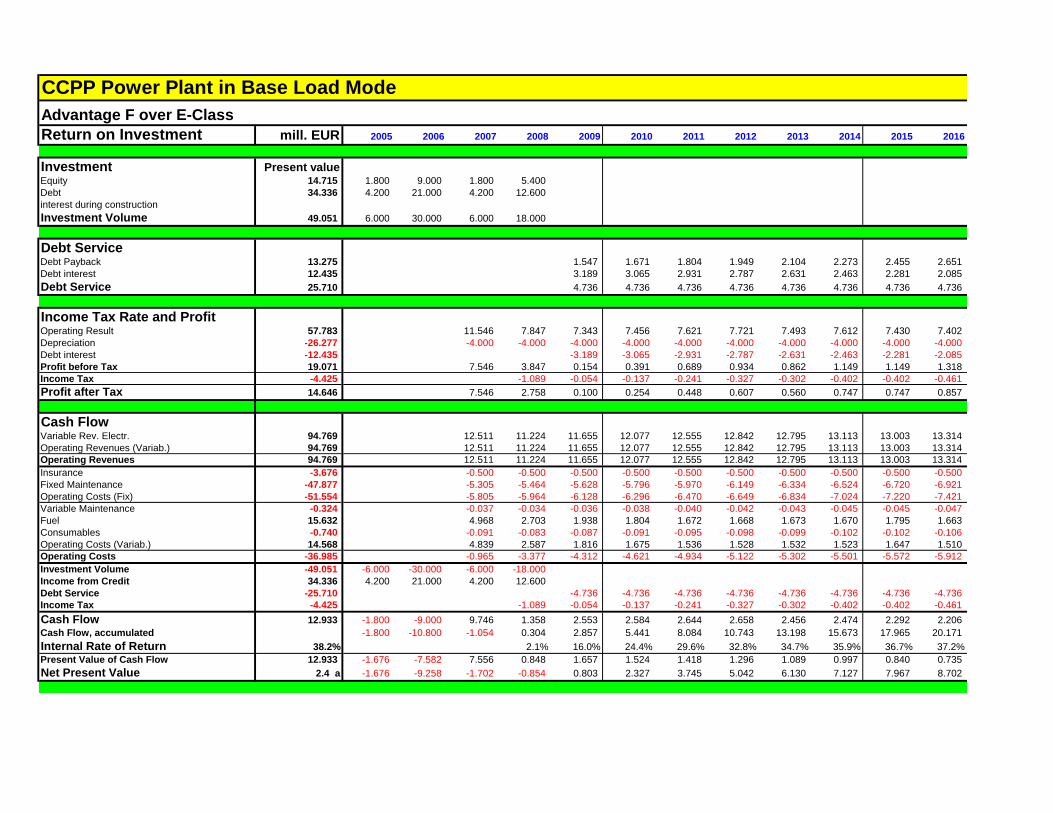
CCPP Power Plant in Base Load Mode
Advantage F over E-Class
Return on Investment mill. EUR 2005 2006 2007 2008 2009 2010 2011 2012 2013 2014 2015 2016
Investment Present valueEquity 14.715 1.800 9.000 1.800 5.400
Debt 34.336 4.200 21.000 4.200 12.600
interest during construction
Investment Volume 49.051 6.000 30.000 6.000 18.000
Debt ServiceDebt Payback 13.275 1.547 1.671 1.804 1.949 2.104 2.273 2.455 2.651
Debt interest 12.435 3.189 3.065 2.931 2.787 2.631 2.463 2.281 2.085
Debt Service 25.710 4.736 4.736 4.736 4.736 4.736 4.736 4.736 4.736
Income Tax Rate and ProfitOperating Result 57.783 11.546 7.847 7.343 7.456 7.621 7.721 7.493 7.612 7.430 7.402
Depreciation -26.277 -4.000 -4.000 -4.000 -4.000 -4.000 -4.000 -4.000 -4.000 -4.000 -4.000
Debt interest -12.435 -3.189 -3.065 -2.931 -2.787 -2.631 -2.463 -2.281 -2.085
Profit before Tax 19.071 7.546 3.847 0.154 0.391 0.689 0.934 0.862 1.149 1.149 1.318
Income Tax -4.425 -1.089 -0.054 -0.137 -0.241 -0.327 -0.302 -0.402 -0.402 -0.461
Profit after Tax 14.646 7.546 2.758 0.100 0.254 0.448 0.607 0.560 0.747 0.747 0.857
Cash FlowVariable Rev. Electr. 94.769 12.511 11.224 11.655 12.077 12.555 12.842 12.795 13.113 13.003 13.314
Operating Revenues (Variab.) 94.769 12.511 11.224 11.655 12.077 12.555 12.842 12.795 13.113 13.003 13.314
Operating Revenues 94.769 12.511 11.224 11.655 12.077 12.555 12.842 12.795 13.113 13.003 13.314
Insurance -3.676 -0.500 -0.500 -0.500 -0.500 -0.500 -0.500 -0.500 -0.500 -0.500 -0.500
Fixed Maintenance -47.877 -5.305 -5.464 -5.628 -5.796 -5.970 -6.149 -6.334 -6.524 -6.720 -6.921
Operating Costs (Fix) -51.554 -5.805 -5.964 -6.128 -6.296 -6.470 -6.649 -6.834 -7.024 -7.220 -7.421
Variable Maintenance -0.324 -0.037 -0.034 -0.036 -0.038 -0.040 -0.042 -0.043 -0.045 -0.045 -0.047
Fuel 15.632 4.968 2.703 1.938 1.804 1.672 1.668 1.673 1.670 1.795 1.663
Consumables -0.740 -0.091 -0.083 -0.087 -0.091 -0.095 -0.098 -0.099 -0.102 -0.102 -0.106
Operating Costs (Variab.) 14.568 4.839 2.587 1.816 1.675 1.536 1.528 1.532 1.523 1.647 1.510
Operating Costs -36.985 -0.965 -3.377 -4.312 -4.621 -4.934 -5.122 -5.302 -5.501 -5.572 -5.912
Investment Volume -49.051 -6.000 -30.000 -6.000 -18.000
Income from Credit 34.336 4.200 21.000 4.200 12.600
Debt Service -25.710 -4.736 -4.736 -4.736 -4.736 -4.736 -4.736 -4.736 -4.736
Income Tax -4.425 -1.089 -0.054 -0.137 -0.241 -0.327 -0.302 -0.402 -0.402 -0.461
Cash Flow 12.933 -1.800 -9.000 9.746 1.358 2.553 2.584 2.644 2.658 2.456 2.474 2.292 2.206
Cash Flow, accumulated -1.800 -10.800 -1.054 0.304 2.857 5.441 8.084 10.743 13.198 15.673 17.965 20.171
Internal Rate of Return 38.2% 2.1% 16.0% 24.4% 29.6% 32.8% 34.7% 35.9% 36.7% 37.2%
Present Value of Cash Flow 12.933 -1.676 -7.582 7.556 0.848 1.657 1.524 1.418 1.296 1.089 0.997 0.840 0.735
Net Present Value 2.4 a -1.676 -9.258 -1.702 -0.854 0.803 2.327 3.745 5.042 6.130 7.127 7.967 8.702

CCPP Power Plant in Base Load Mode
Advantage F over E-Class
Return on Investment
InvestmentEquity
Debt
interest during construction
Investment Volume
Debt ServiceDebt Payback
Debt interest
Debt Service
Income Tax Rate and ProfitOperating Result
Depreciation
Debt interest
Profit before Tax
Income Tax
Profit after Tax
Cash FlowVariable Rev. Electr.
Operating Revenues (Variab.)
Operating Revenues
Insurance
Fixed Maintenance
Operating Costs (Fix)
Variable Maintenance
Fuel
Consumables
Operating Costs (Variab.)
Operating Costs
Investment Volume
Income from Credit
Debt Service
Income Tax
Cash FlowCash Flow, accumulated
Internal Rate of ReturnPresent Value of Cash Flow
Net Present Value
2017 2018 2019 2020 2021 2022 2023 2024 2025 2026
2.863 3.092 3.340 3.607 3.895 4.207 4.543
1.873 1.643 1.396 1.129 0.840 0.529 0.192
4.736 4.736 4.736 4.736 4.736 4.736 4.736
7.501 7.271 7.168 7.144 7.145 7.115 6.949 6.818 6.776 6.634
-4.000 -4.000 -4.000 -4.000 -4.000
-1.873 -1.643 -1.396 -1.129 -0.840 -0.529 -0.192
1.629 1.628 1.772 2.015 2.304 6.586 6.756 6.818 6.776 6.634
-0.570 -0.570 -0.620 -0.705 -0.807 -2.305 -2.365 -2.386 -2.371 -2.322
1.059 1.058 1.152 1.310 1.498 4.281 4.392 4.432 4.404 4.312
13.630 13.607 13.730 14.069 14.184 14.531 14.482 14.613 14.971 15.107
13.630 13.607 13.730 14.069 14.184 14.531 14.482 14.613 14.971 15.107
13.630 13.607 13.730 14.069 14.184 14.531 14.482 14.613 14.971 15.107
-0.500 -0.500 -0.500 -0.500 -0.500 -0.500 -0.500 -0.500 -0.500 -0.500
-7.129 -7.343 -7.563 -7.790 -8.024 -8.264 -8.512 -8.768 -9.031 -9.301
-7.629 -7.843 -8.063 -8.290 -8.524 -8.764 -9.012 -9.268 -9.531 -9.801
-0.049 -0.050 -0.052 -0.054 -0.055 -0.058 -0.059 -0.061 -0.063 -0.065
1.659 1.667 1.665 1.535 1.659 1.528 1.661 1.659 1.528 1.526
-0.110 -0.110 -0.113 -0.116 -0.119 -0.123 -0.124 -0.126 -0.130 -0.133
1.500 1.507 1.501 1.365 1.485 1.348 1.479 1.472 1.335 1.328
-6.129 -6.336 -6.562 -6.925 -7.039 -7.416 -7.533 -7.795 -8.196 -8.473
-4.736 -4.736 -4.736 -4.736 -4.736 -4.736 -4.736
-0.570 -0.570 -0.620 -0.705 -0.807 -2.305 -2.365 -2.386 -2.371 -2.322
2.196 1.966 1.812 1.703 1.603 0.074 -0.152 4.432 4.404 4.312
22.366 24.332 26.145 27.848 29.450 29.524 29.372 33.804 38.208 42.520
37.5% 37.8% 37.9% 38.0% 38.1% 38.1% 38.1% 38.1% 38.2% 38.2%
0.665 0.541 0.454 0.387 0.332 0.014 -0.026 0.688 0.622 0.554
9.367 9.908 10.361 10.749 11.080 11.094 11.069 11.757 12.379 12.933
CCPP Power Plant in Base Load Mode
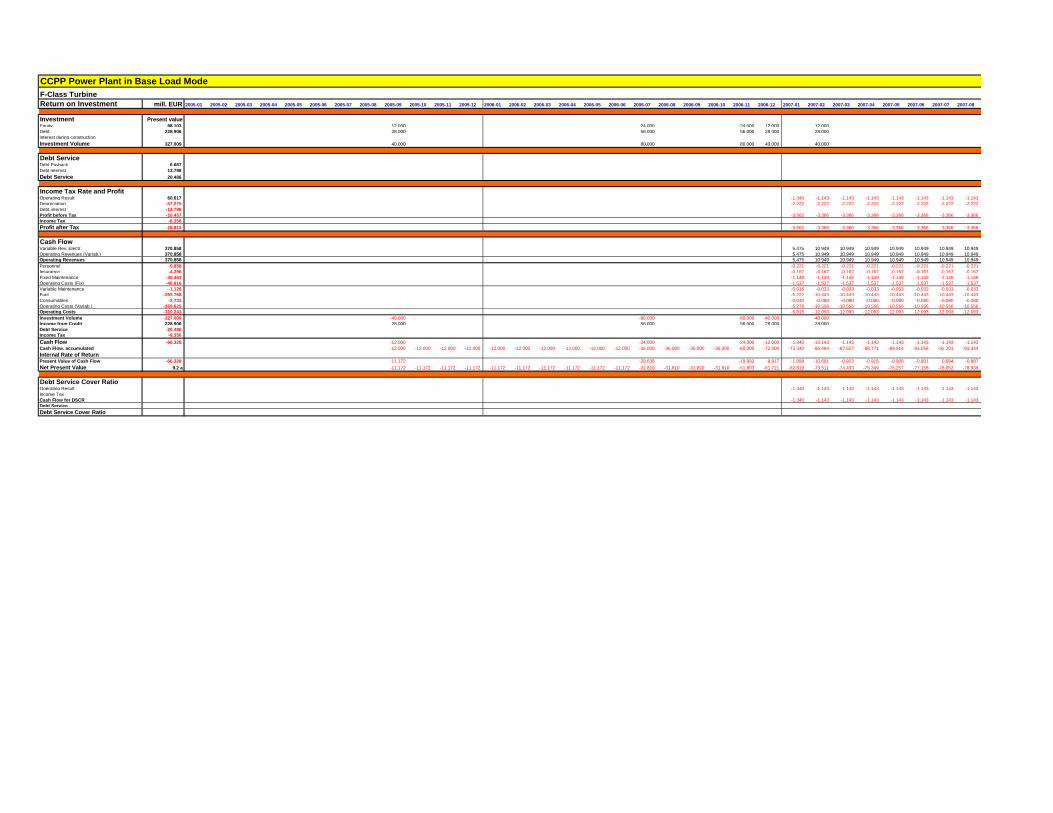
F-Class Turbine
Return on Investment mill. EUR 2005-01 2005-02 2005-03 2005-04 2005-05 2005-06 2005-07 2005-08 2005-09 2005-10 2005-11 2005-12 2006-01 2006-02 2006-03 2006-04 2006-05 2006-06 2006-07 2006-08 2006-09 2006-10 2006-11 2006-12 2007-01 2007-02 2007-03 2007-04 2007-05 2007-06 2007-07 2007-08
Investment Present valueEquity 98.103 12.000 24.000 24.000 12.000 12.000
Debt 228.906 28.000 56.000 56.000 28.000 28.000
interest during construction
Investment Volume 327.009 40.000 80.000 80.000 40.000 40.000
Debt ServiceDebt Payback 6.687
Debt interest 13.798
Debt Service 20.486
Income Tax Rate and ProfitOperating Result 60.617 -1.340 -1.143 -1.143 -1.143 -1.143 -1.143 -1.143 -1.143
Depreciation -57.275 -2.222 -2.222 -2.222 -2.222 -2.222 -2.222 -2.222 -2.222
Debt interest -13.798
Profit before Tax -10.457 -3.562 -3.366 -3.366 -3.366 -3.366 -3.366 -3.366 -3.366
Income Tax -8.356
Profit after Tax -18.813 -3.562 -3.366 -3.366 -3.366 -3.366 -3.366 -3.366 -3.366
Cash FlowVariable Rev. Electr. 370.858 5.475 10.949 10.949 10.949 10.949 10.949 10.949 10.949
Operating Revenues (Variab.) 370.858 5.475 10.949 10.949 10.949 10.949 10.949 10.949 10.949
Operating Revenues 370.858 5.475 10.949 10.949 10.949 10.949 10.949 10.949 10.949
Personnel -5.858 -0.221 -0.221 -0.221 -0.221 -0.221 -0.221 -0.221 -0.221
Insurance -4.296 -0.167 -0.167 -0.167 -0.167 -0.167 -0.167 -0.167 -0.167
Fixed Maintenance -30.463 -1.149 -1.149 -1.149 -1.149 -1.149 -1.149 -1.149 -1.149
Operating Costs (Fix) -40.616 -1.537 -1.537 -1.537 -1.537 -1.537 -1.537 -1.537 -1.537
Variable Maintenance -1.126 -0.016 -0.033 -0.033 -0.033 -0.033 -0.033 -0.033 -0.033
Fuel -265.768 -5.222 -10.443 -10.443 -10.443 -10.443 -10.443 -10.443 -10.443
Consumables -2.731 -0.040 -0.080 -0.080 -0.080 -0.080 -0.080 -0.080 -0.080
Operating Costs (Variab.) -269.625 -5.278 -10.556 -10.556 -10.556 -10.556 -10.556 -10.556 -10.556
Operating Costs -310.241 -6.815 -12.093 -12.093 -12.093 -12.093 -12.093 -12.093 -12.093
Investment Volume -327.009 -40.000 -80.000 -80.000 -40.000 -40.000
Income from Credit 228.906 28.000 56.000 56.000 28.000 28.000
Debt Service -20.486
Income Tax -8.356
Cash Flow -66.328 -12.000 -24.000 -24.000 -12.000 -1.340 -13.143 -1.143 -1.143 -1.143 -1.143 -1.143 -1.143
Cash Flow, accumulated -12.000 -12.000 -12.000 -12.000 -12.000 -12.000 -12.000 -12.000 -12.000 -12.000 -36.000 -36.000 -36.000 -36.000 -60.000 -72.000 -73.340 -86.484 -87.627 -88.771 -89.914 -91.058 -92.201 -93.344
Internal Rate of ReturnPresent Value of Cash Flow -66.328 -11.172 -20.638 -19.993 -9.917 -1.099 -10.691 -0.923 -0.915 -0.908 -0.901 -0.894 -0.887
Net Present Value 9.2 a -11.172 -11.172 -11.172 -11.172 -11.172 -11.172 -11.172 -11.172 -11.172 -11.172 -31.810 -31.810 -31.810 -31.810 -51.803 -61.721 -62.819 -73.511 -74.433 -75.349 -76.257 -77.158 -78.052 -78.939
Debt Service Cover RatioOperating Result -1.340 -1.143 -1.143 -1.143 -1.143 -1.143 -1.143 -1.143
Income Tax
Cash Flow for DSCR -1.340 -1.143 -1.143 -1.143 -1.143 -1.143 -1.143 -1.143
Debt Service
Debt Service Cover Ratio

CCPP Power Plant in Base Load Mode
F-Class Turbine
Return on Investment
InvestmentEquity
Debt
interest during construction
Investment Volume
Debt ServiceDebt Payback
Debt interest
Debt Service
Income Tax Rate and ProfitOperating Result
Depreciation
Debt interest
Profit before Tax
Income Tax
Profit after Tax
Cash FlowVariable Rev. Electr.
Operating Revenues (Variab.)
Operating Revenues
Personnel
Insurance
Fixed Maintenance
Operating Costs (Fix)
Variable Maintenance
Fuel
Consumables
Operating Costs (Variab.)
Operating Costs
Investment Volume
Income from Credit
Debt Service
Income Tax
Cash FlowCash Flow, accumulated
Internal Rate of ReturnPresent Value of Cash Flow
Net Present Value
Debt Service Cover RatioOperating Result
Income Tax
Cash Flow for DSCR
Debt Service
Debt Service Cover Ratio
2007-09 2007-10 2007-11 2007-12 2008-01 2008-02 2008-03 2008-04 2008-05 2008-06 2008-07 2008-08 2008-09 2008-10 2008-11 2008-12 2009-01 2009-02 2009-03 2009-04 2009-05 2009-06 2009-07 2009-08 2009-09 2009-10 2009-11 2009-12
36.000
84.000
120.000
0.829 0.835 0.840 0.845 0.851 0.856 0.862 0.867 0.873 0.879 0.884 0.890
1.802 1.796 1.791 1.785 1.780 1.775 1.769 1.763 1.758 1.752 1.747 1.741
2.631 2.631 2.631 2.631 2.631 2.631 2.631 2.631 2.631 2.631 2.631 2.631
-1.143 -1.143 -1.143 -1.143 -1.078 4.575 4.575 4.575 4.575 4.575 4.575 4.575 4.575 4.575 4.575 4.575 4.697 4.697 4.697 4.697 4.697 4.697 4.697 4.697 4.697 4.697 4.697 4.697
-2.222 -2.222 -2.222 -2.222 -2.222 -2.222 -2.222 -2.222 -2.222 -2.222 -2.222 -2.222 -2.222 -2.222 -2.222 -2.222 -2.222 -2.222 -2.222 -2.222 -2.222 -2.222 -2.222 -2.222 -2.222 -2.222 -2.222 -2.222
-1.802 -1.796 -1.791 -1.785 -1.780 -1.775 -1.769 -1.763 -1.758 -1.752 -1.747 -1.741
-3.366 -3.366 -3.366 -3.366 -3.300 2.353 2.353 2.353 2.353 2.353 2.353 2.353 2.353 2.353 2.353 2.353 0.674 0.679 0.684 0.690 0.695 0.701 0.706 0.712 0.717 0.723 0.728 0.734
-0.824 -0.824 -0.824 -0.824 -0.824 -0.824 -0.824 -0.824 -0.824 -0.824 -0.824 -0.236 -0.238 -0.239 -0.241 -0.243 -0.245 -0.247 -0.249 -0.251 -0.253 -0.255 -0.257
-3.366 -3.366 -3.366 -3.366 -3.300 1.530 1.530 1.530 1.530 1.530 1.530 1.530 1.530 1.530 1.530 1.530 0.438 0.441 0.445 0.448 0.452 0.455 0.459 0.463 0.466 0.470 0.473 0.477
10.949 10.949 10.949 10.949 11.059 16.828 16.828 16.828 16.828 16.828 16.828 16.828 16.828 16.828 16.828 16.828 16.997 16.997 16.997 16.997 16.997 16.997 16.997 16.997 16.997 16.997 16.997 16.997
10.949 10.949 10.949 10.949 11.059 16.828 16.828 16.828 16.828 16.828 16.828 16.828 16.828 16.828 16.828 16.828 16.997 16.997 16.997 16.997 16.997 16.997 16.997 16.997 16.997 16.997 16.997 16.997
10.949 10.949 10.949 10.949 11.059 16.828 16.828 16.828 16.828 16.828 16.828 16.828 16.828 16.828 16.828 16.828 16.997 16.997 16.997 16.997 16.997 16.997 16.997 16.997 16.997 16.997 16.997 16.997
-0.221 -0.221 -0.221 -0.221 -0.228 -0.228 -0.228 -0.228 -0.228 -0.228 -0.228 -0.228 -0.228 -0.228 -0.228 -0.228 -0.234 -0.234 -0.234 -0.234 -0.234 -0.234 -0.234 -0.234 -0.234 -0.234 -0.234 -0.234
-0.167 -0.167 -0.167 -0.167 -0.167 -0.167 -0.167 -0.167 -0.167 -0.167 -0.167 -0.167 -0.167 -0.167 -0.167 -0.167 -0.167 -0.167 -0.167 -0.167 -0.167 -0.167 -0.167 -0.167 -0.167 -0.167 -0.167 -0.167
-1.149 -1.149 -1.149 -1.149 -1.184 -1.184 -1.184 -1.184 -1.184 -1.184 -1.184 -1.184 -1.184 -1.184 -1.184 -1.184 -1.219 -1.219 -1.219 -1.219 -1.219 -1.219 -1.219 -1.219 -1.219 -1.219 -1.219 -1.219
-1.537 -1.537 -1.537 -1.537 -1.578 -1.578 -1.578 -1.578 -1.578 -1.578 -1.578 -1.578 -1.578 -1.578 -1.578 -1.578 -1.620 -1.620 -1.620 -1.620 -1.620 -1.620 -1.620 -1.620 -1.620 -1.620 -1.620 -1.620
-0.033 -0.033 -0.033 -0.033 -0.034 -0.051 -0.051 -0.051 -0.051 -0.051 -0.051 -0.051 -0.051 -0.051 -0.051 -0.051 -0.053 -0.053 -0.053 -0.053 -0.053 -0.053 -0.053 -0.053 -0.053 -0.053 -0.053 -0.053
-10.443 -10.443 -10.443 -10.443 -10.443 -10.500 -10.500 -10.500 -10.500 -10.500 -10.500 -10.500 -10.500 -10.500 -10.500 -10.500 -10.500 -10.500 -10.500 -10.500 -10.500 -10.500 -10.500 -10.500 -10.500 -10.500 -10.500 -10.500
-0.080 -0.080 -0.080 -0.080 -0.081 -0.124 -0.124 -0.124 -0.124 -0.124 -0.124 -0.124 -0.124 -0.124 -0.124 -0.124 -0.126 -0.126 -0.126 -0.126 -0.126 -0.126 -0.126 -0.126 -0.126 -0.126 -0.126 -0.126
-10.556 -10.556 -10.556 -10.556 -10.558 -10.675 -10.675 -10.675 -10.675 -10.675 -10.675 -10.675 -10.675 -10.675 -10.675 -10.675 -10.679 -10.679 -10.679 -10.679 -10.679 -10.679 -10.679 -10.679 -10.679 -10.679 -10.679 -10.679
-12.093 -12.093 -12.093 -12.093 -12.136 -12.253 -12.253 -12.253 -12.253 -12.253 -12.253 -12.253 -12.253 -12.253 -12.253 -12.253 -12.299 -12.299 -12.299 -12.299 -12.299 -12.299 -12.299 -12.299 -12.299 -12.299 -12.299 -12.299
-120.000
84.000
-2.631 -2.631 -2.631 -2.631 -2.631 -2.631 -2.631 -2.631 -2.631 -2.631 -2.631 -2.631
-0.824 -0.824 -0.824 -0.824 -0.824 -0.824 -0.824 -0.824 -0.824 -0.824 -0.824 -0.236 -0.238 -0.239 -0.241 -0.243 -0.245 -0.247 -0.249 -0.251 -0.253 -0.255 -0.257
-1.143 -1.143 -1.143 -1.143 -1.078 -32.248 3.752 3.752 3.752 3.752 3.752 3.752 3.752 3.752 3.752 3.752 1.831 1.829 1.827 1.825 1.823 1.821 1.819 1.817 1.815 1.813 1.811 1.809
-94.488 -95.631 -96.775 -97.918 -98.996 -131.244 -127.492 -123.741 -119.989 -116.237 -112.485 -108.734 -104.982 -101.230 -97.478 -93.727 -91.896 -90.067 -88.240 -86.415 -84.592 -82.771 -80.952 -79.135 -77.319 -75.506 -73.694 -71.885
-0.880 -0.873 -0.866 -0.859 -0.803 -23.847 2.752 2.731 2.709 2.688 2.666 2.645 2.624 2.604 2.583 2.562 1.240 1.229 1.218 1.208 1.197 1.186 1.175 1.165 1.154 1.144 1.134 1.124
-79.819 -80.692 -81.558 -82.417 -83.220 -107.067 -104.314 -101.584 -98.875 -96.187 -93.521 -90.876 -88.251 -85.648 -83.065 -80.502 -79.262 -78.032 -76.814 -75.607 -74.410 -73.224 -72.048 -70.884 -69.729 -68.585 -67.451 -66.328
-1.143 -1.143 -1.143 -1.143 -1.078 4.575 4.575 4.575 4.575 4.575 4.575 4.575 4.575 4.575 4.575 4.575 4.697 4.697 4.697 4.697 4.697 4.697 4.697 4.697 4.697 4.697 4.697 4.697
-0.824 -0.824 -0.824 -0.824 -0.824 -0.824 -0.824 -0.824 -0.824 -0.824 -0.824 -0.236 -0.238 -0.239 -0.241 -0.243 -0.245 -0.247 -0.249 -0.251 -0.253 -0.255 -0.257
-1.143 -1.143 -1.143 -1.143 -1.078 3.752 3.752 3.752 3.752 3.752 3.752 3.752 3.752 3.752 3.752 3.752 4.462 4.460 4.458 4.456 4.454 4.452 4.450 4.448 4.446 4.444 4.442 4.440
2.631 2.631 2.631 2.631 2.631 2.631 2.631 2.631 2.631 2.631 2.631 2.631
1.70 1.70 1.69 1.69 1.69 1.69 1.69 1.69 1.69 1.69 1.69 1.69

CCPP Power Plant in Base Load Mode
E-Class Turbine
Return on Investment mill. EUR 2005-01 2005-02 2005-03 2005-04 2005-05 2005-06 2005-07 2005-08 2005-09 2005-10 2005-11 2005-12 2006-01 2006-02 2006-03 2006-04 2006-05 2006-06 2006-07 2006-08 2006-09 2006-10 2006-11 2006-12 2007-01 2007-02 2007-03 2007-04 2007-05 2007-06 2007-07 2007-08
Investment Present valueEquity 83.387 10.200 20.400 20.400 10.200 10.200
Debt 194.570 23.800 47.600 47.600 23.800 23.800
interest during construction
Investment Volume 277.958 34.000 68.000 68.000 34.000 34.000
Debt ServiceDebt Payback 5.684
Debt interest 11.729
Debt Service 17.413
Income Tax Rate and ProfitOperating Result 41.217 -1.442 -1.831 -2.219 -2.219 -2.219 -2.219 -2.219 -2.219
Depreciation -48.684 -1.889 -1.889 -1.889 -1.889 -1.889 -1.889 -1.889 -1.889
Debt interest -11.729
Profit before Tax -19.196 -3.331 -3.719 -4.108 -4.108 -4.108 -4.108 -4.108 -4.108
Income Tax -7.547
Profit after Tax -26.744 -3.331 -3.719 -4.108 -4.108 -4.108 -4.108 -4.108 -4.108
Cash FlowVariable Rev. Electr. 345.325 3.436 6.873 10.309 10.309 10.309 10.309 10.309 10.309
Operating Revenues (Variab.) 345.325 3.436 6.873 10.309 10.309 10.309 10.309 10.309 10.309
Operating Revenues 345.325 3.436 6.873 10.309 10.309 10.309 10.309 10.309 10.309
Personnel -5.858 -0.221 -0.221 -0.221 -0.221 -0.221 -0.221 -0.221 -0.221
Insurance -3.222 -0.125 -0.125 -0.125 -0.125 -0.125 -0.125 -0.125 -0.125
Fixed Maintenance -18.746 -0.707 -0.707 -0.707 -0.707 -0.707 -0.707 -0.707 -0.707
Operating Costs (Fix) -27.826 -1.053 -1.053 -1.053 -1.053 -1.053 -1.053 -1.053 -1.053
Variable Maintenance -1.049 -0.010 -0.020 -0.031 -0.031 -0.031 -0.031 -0.031 -0.031
Fuel -272.691 -3.790 -7.580 -11.370 -11.370 -11.370 -11.370 -11.370 -11.370
Consumables -2.543 -0.025 -0.050 -0.075 -0.075 -0.075 -0.075 -0.075 -0.075
Operating Costs (Variab.) -276.283 -3.825 -7.650 -11.475 -11.475 -11.475 -11.475 -11.475 -11.475
Operating Costs -304.109 -4.878 -8.703 -12.529 -12.529 -12.529 -12.529 -12.529 -12.529
Investment Volume -277.958 -34.000 -68.000 -68.000 -34.000 -34.000
Income from Credit 194.570 23.800 47.600 47.600 23.800 23.800
Debt Service -17.413
Income Tax -7.547
Cash Flow -67.131 -10.200 -20.400 -20.400 -10.200 -1.442 -12.031 -2.219 -2.219 -2.219 -2.219 -2.219 -2.219
Cash Flow, accumulated -10.200 -10.200 -10.200 -10.200 -10.200 -10.200 -10.200 -10.200 -10.200 -10.200 -30.600 -30.600 -30.600 -30.600 -51.000 -61.200 -62.642 -74.672 -76.892 -79.111 -81.330 -83.549 -85.768 -87.987
Internal Rate of ReturnPresent Value of Cash Flow -67.131 -9.496 -17.543 -16.994 -8.430 -1.182 -9.786 -1.791 -1.777 -1.763 -1.749 -1.735 -1.721
Net Present Value 10.3 a -9.496 -9.496 -9.496 -9.496 -9.496 -9.496 -9.496 -9.496 -9.496 -9.496 -27.039 -27.039 -27.039 -27.039 -44.033 -52.463 -53.645 -63.431 -65.222 -66.998 -68.761 -70.509 -72.244 -73.965
Debt Service Cover RatioOperating Result -1.442 -1.831 -2.219 -2.219 -2.219 -2.219 -2.219 -2.219
Income Tax
Cash Flow for DSCR -1.442 -1.831 -2.219 -2.219 -2.219 -2.219 -2.219 -2.219
Debt Service
Debt Service Cover Ratio

CCPP Power Plant in Base Load Mode
E-Class Turbine
Return on Investment
InvestmentEquity
Debt
interest during construction
Investment Volume
Debt ServiceDebt Payback
Debt interest
Debt Service
Income Tax Rate and ProfitOperating Result
Depreciation
Debt interest
Profit before Tax
Income Tax
Profit after Tax
Cash FlowVariable Rev. Electr.
Operating Revenues (Variab.)
Operating Revenues
Personnel
Insurance
Fixed Maintenance
Operating Costs (Fix)
Variable Maintenance
Fuel
Consumables
Operating Costs (Variab.)
Operating Costs
Investment Volume
Income from Credit
Debt Service
Income Tax
Cash FlowCash Flow, accumulated
Internal Rate of ReturnPresent Value of Cash Flow
Net Present Value
Debt Service Cover RatioOperating Result
Income Tax
Cash Flow for DSCR
Debt Service
Debt Service Cover Ratio
2007-09 2007-10 2007-11 2007-12 2008-01 2008-02 2008-03 2008-04 2008-05 2008-06 2008-07 2008-08 2008-09 2008-10 2008-11 2008-12 2009-01 2009-02 2009-03 2009-04 2009-05 2009-06 2009-07 2009-08 2009-09 2009-10 2009-11 2009-12
30.600
71.400
102.000
0.705 0.709 0.714 0.719 0.723 0.728 0.733 0.737 0.742 0.747 0.752 0.756
1.531 1.527 1.522 1.518 1.513 1.508 1.504 1.499 1.494 1.489 1.485 1.480
2.236 2.236 2.236 2.236 2.236 2.236 2.236 2.236 2.236 2.236 2.236 2.236
-2.219 -2.219 -2.219 -2.219 -2.146 3.959 3.959 3.959 3.959 3.959 3.959 3.959 3.959 3.959 3.959 3.959 4.085 4.085 4.085 4.085 4.085 4.085 4.085 4.085 4.085 4.085 4.085 4.085
-1.889 -1.889 -1.889 -1.889 -1.889 -1.889 -1.889 -1.889 -1.889 -1.889 -1.889 -1.889 -1.889 -1.889 -1.889 -1.889 -1.889 -1.889 -1.889 -1.889 -1.889 -1.889 -1.889 -1.889 -1.889 -1.889 -1.889 -1.889
-1.531 -1.527 -1.522 -1.518 -1.513 -1.508 -1.504 -1.499 -1.494 -1.489 -1.485 -1.480
-4.108 -4.108 -4.108 -4.108 -4.035 2.070 2.070 2.070 2.070 2.070 2.070 2.070 2.070 2.070 2.070 2.070 0.665 0.670 0.674 0.679 0.683 0.688 0.693 0.698 0.702 0.707 0.712 0.717
-0.725 -0.725 -0.725 -0.725 -0.725 -0.725 -0.725 -0.725 -0.725 -0.725 -0.725 -0.233 -0.234 -0.236 -0.238 -0.239 -0.241 -0.242 -0.244 -0.246 -0.247 -0.249 -0.251
-4.108 -4.108 -4.108 -4.108 -4.035 1.346 1.346 1.346 1.346 1.346 1.346 1.346 1.346 1.346 1.346 1.346 0.432 0.435 0.438 0.441 0.444 0.447 0.450 0.453 0.456 0.460 0.463 0.466
10.309 10.309 10.309 10.309 10.412 15.867 15.867 15.867 15.867 15.867 15.867 15.867 15.867 15.867 15.867 15.867 16.025 16.025 16.025 16.025 16.025 16.025 16.025 16.025 16.025 16.025 16.025 16.025
10.309 10.309 10.309 10.309 10.412 15.867 15.867 15.867 15.867 15.867 15.867 15.867 15.867 15.867 15.867 15.867 16.025 16.025 16.025 16.025 16.025 16.025 16.025 16.025 16.025 16.025 16.025 16.025
10.309 10.309 10.309 10.309 10.412 15.867 15.867 15.867 15.867 15.867 15.867 15.867 15.867 15.867 15.867 15.867 16.025 16.025 16.025 16.025 16.025 16.025 16.025 16.025 16.025 16.025 16.025 16.025
-0.221 -0.221 -0.221 -0.221 -0.228 -0.228 -0.228 -0.228 -0.228 -0.228 -0.228 -0.228 -0.228 -0.228 -0.228 -0.228 -0.234 -0.234 -0.234 -0.234 -0.234 -0.234 -0.234 -0.234 -0.234 -0.234 -0.234 -0.234
-0.125 -0.125 -0.125 -0.125 -0.125 -0.125 -0.125 -0.125 -0.125 -0.125 -0.125 -0.125 -0.125 -0.125 -0.125 -0.125 -0.125 -0.125 -0.125 -0.125 -0.125 -0.125 -0.125 -0.125 -0.125 -0.125 -0.125 -0.125
-0.707 -0.707 -0.707 -0.707 -0.728 -0.728 -0.728 -0.728 -0.728 -0.728 -0.728 -0.728 -0.728 -0.728 -0.728 -0.728 -0.750 -0.750 -0.750 -0.750 -0.750 -0.750 -0.750 -0.750 -0.750 -0.750 -0.750 -0.750
-1.053 -1.053 -1.053 -1.053 -1.081 -1.081 -1.081 -1.081 -1.081 -1.081 -1.081 -1.081 -1.081 -1.081 -1.081 -1.081 -1.110 -1.110 -1.110 -1.110 -1.110 -1.110 -1.110 -1.110 -1.110 -1.110 -1.110 -1.110
-0.031 -0.031 -0.031 -0.031 -0.032 -0.048 -0.048 -0.048 -0.048 -0.048 -0.048 -0.048 -0.048 -0.048 -0.048 -0.048 -0.050 -0.050 -0.050 -0.050 -0.050 -0.050 -0.050 -0.050 -0.050 -0.050 -0.050 -0.050
-11.370 -11.370 -11.370 -11.370 -11.370 -10.662 -10.662 -10.662 -10.662 -10.662 -10.662 -10.662 -10.662 -10.662 -10.662 -10.662 -10.662 -10.662 -10.662 -10.662 -10.662 -10.662 -10.662 -10.662 -10.662 -10.662 -10.662 -10.662
-0.075 -0.075 -0.075 -0.075 -0.077 -0.117 -0.117 -0.117 -0.117 -0.117 -0.117 -0.117 -0.117 -0.117 -0.117 -0.117 -0.119 -0.119 -0.119 -0.119 -0.119 -0.119 -0.119 -0.119 -0.119 -0.119 -0.119 -0.119
-11.475 -11.475 -11.475 -11.475 -11.478 -10.826 -10.826 -10.826 -10.826 -10.826 -10.826 -10.826 -10.826 -10.826 -10.826 -10.826 -10.830 -10.830 -10.830 -10.830 -10.830 -10.830 -10.830 -10.830 -10.830 -10.830 -10.830 -10.830
-12.529 -12.529 -12.529 -12.529 -12.559 -11.907 -11.907 -11.907 -11.907 -11.907 -11.907 -11.907 -11.907 -11.907 -11.907 -11.907 -11.940 -11.940 -11.940 -11.940 -11.940 -11.940 -11.940 -11.940 -11.940 -11.940 -11.940 -11.940
-102.000
71.400
-2.236 -2.236 -2.236 -2.236 -2.236 -2.236 -2.236 -2.236 -2.236 -2.236 -2.236 -2.236
-0.725 -0.725 -0.725 -0.725 -0.725 -0.725 -0.725 -0.725 -0.725 -0.725 -0.725 -0.233 -0.234 -0.236 -0.238 -0.239 -0.241 -0.242 -0.244 -0.246 -0.247 -0.249 -0.251
-2.219 -2.219 -2.219 -2.219 -2.146 -27.365 3.235 3.235 3.235 3.235 3.235 3.235 3.235 3.235 3.235 3.235 1.616 1.615 1.613 1.611 1.610 1.608 1.607 1.605 1.603 1.602 1.600 1.598
-90.207 -92.426 -94.645 -96.864 -99.011 -126.376 -123.141 -119.907 -116.672 -113.438 -110.203 -106.969 -103.734 -100.499 -97.265 -94.030 -92.414 -90.799 -89.186 -87.575 -85.965 -84.357 -82.750 -81.145 -79.542 -77.940 -76.340 -74.742
-1.708 -1.694 -1.681 -1.667 -1.600 -20.236 2.373 2.354 2.336 2.317 2.299 2.281 2.263 2.245 2.227 2.209 1.095 1.085 1.076 1.066 1.057 1.047 1.038 1.029 1.020 1.010 1.001 0.992
-75.673 -77.367 -79.048 -80.715 -82.315 -102.551 -100.178 -97.824 -95.488 -93.171 -90.872 -88.592 -86.329 -84.084 -81.858 -79.648 -78.553 -77.468 -76.392 -75.326 -74.269 -73.222 -72.184 -71.155 -70.135 -69.125 -68.124 -67.131
-2.219 -2.219 -2.219 -2.219 -2.146 3.959 3.959 3.959 3.959 3.959 3.959 3.959 3.959 3.959 3.959 3.959 4.085 4.085 4.085 4.085 4.085 4.085 4.085 4.085 4.085 4.085 4.085 4.085
-0.725 -0.725 -0.725 -0.725 -0.725 -0.725 -0.725 -0.725 -0.725 -0.725 -0.725 -0.233 -0.234 -0.236 -0.238 -0.239 -0.241 -0.242 -0.244 -0.246 -0.247 -0.249 -0.251
-2.219 -2.219 -2.219 -2.219 -2.146 3.235 3.235 3.235 3.235 3.235 3.235 3.235 3.235 3.235 3.235 3.235 3.853 3.851 3.849 3.848 3.846 3.845 3.843 3.841 3.840 3.838 3.836 3.835
2.236 2.236 2.236 2.236 2.236 2.236 2.236 2.236 2.236 2.236 2.236 2.236
1.72 1.72 1.72 1.72 1.72 1.72 1.72 1.72 1.72 1.72 1.72 1.71
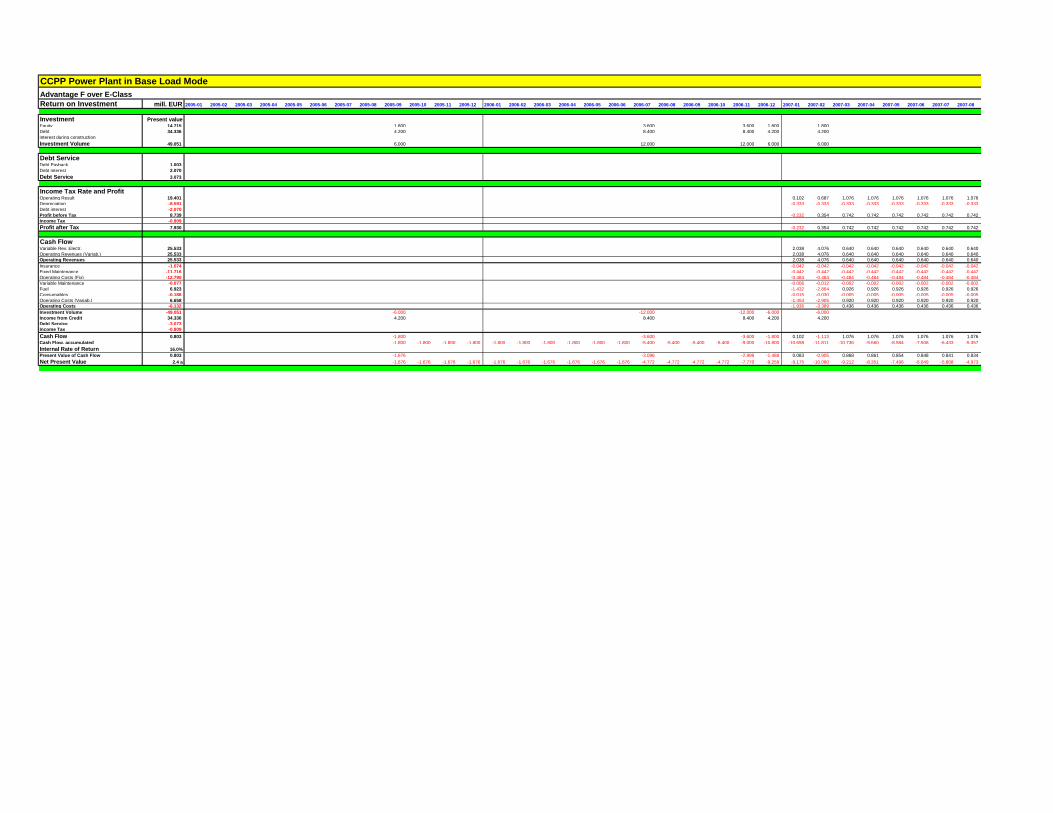
CCPP Power Plant in Base Load Mode
Advantage F over E-Class
Return on Investment mill. EUR 2005-01 2005-02 2005-03 2005-04 2005-05 2005-06 2005-07 2005-08 2005-09 2005-10 2005-11 2005-12 2006-01 2006-02 2006-03 2006-04 2006-05 2006-06 2006-07 2006-08 2006-09 2006-10 2006-11 2006-12 2007-01 2007-02 2007-03 2007-04 2007-05 2007-06 2007-07 2007-08
Investment Present valueEquity 14.715 1.800 3.600 3.600 1.800 1.800
Debt 34.336 4.200 8.400 8.400 4.200 4.200
interest during construction
Investment Volume 49.051 6.000 12.000 12.000 6.000 6.000
Debt ServiceDebt Payback 1.003
Debt interest 2.070
Debt Service 3.073
Income Tax Rate and ProfitOperating Result 19.401 0.102 0.687 1.076 1.076 1.076 1.076 1.076 1.076
Depreciation -8.591 -0.333 -0.333 -0.333 -0.333 -0.333 -0.333 -0.333 -0.333
Debt interest -2.070
Profit before Tax 8.739 -0.232 0.354 0.742 0.742 0.742 0.742 0.742 0.742
Income Tax -0.809
Profit after Tax 7.930 -0.232 0.354 0.742 0.742 0.742 0.742 0.742 0.742
Cash FlowVariable Rev. Electr. 25.533 2.038 4.076 0.640 0.640 0.640 0.640 0.640 0.640
Operating Revenues (Variab.) 25.533 2.038 4.076 0.640 0.640 0.640 0.640 0.640 0.640
Operating Revenues 25.533 2.038 4.076 0.640 0.640 0.640 0.640 0.640 0.640
Insurance -1.074 -0.042 -0.042 -0.042 -0.042 -0.042 -0.042 -0.042 -0.042
Fixed Maintenance -11.716 -0.442 -0.442 -0.442 -0.442 -0.442 -0.442 -0.442 -0.442
Operating Costs (Fix) -12.790 -0.484 -0.484 -0.484 -0.484 -0.484 -0.484 -0.484 -0.484
Variable Maintenance -0.077 -0.006 -0.012 -0.002 -0.002 -0.002 -0.002 -0.002 -0.002
Fuel 6.923 -1.432 -2.864 0.926 0.926 0.926 0.926 0.926 0.926
Consumables -0.188 -0.015 -0.030 -0.005 -0.005 -0.005 -0.005 -0.005 -0.005
Operating Costs (Variab.) 6.658 -1.453 -2.905 0.920 0.920 0.920 0.920 0.920 0.920
Operating Costs -6.132 -1.936 -3.389 0.436 0.436 0.436 0.436 0.436 0.436
Investment Volume -49.051 -6.000 -12.000 -12.000 -6.000 -6.000
Income from Credit 34.336 4.200 8.400 8.400 4.200 4.200
Debt Service -3.073
Income Tax -0.809
Cash Flow 0.803 -1.800 -3.600 -3.600 -1.800 0.102 -1.113 1.076 1.076 1.076 1.076 1.076 1.076
Cash Flow, accumulated -1.800 -1.800 -1.800 -1.800 -1.800 -1.800 -1.800 -1.800 -1.800 -1.800 -5.400 -5.400 -5.400 -5.400 -9.000 -10.800 -10.698 -11.811 -10.736 -9.660 -8.584 -7.508 -6.433 -5.357
Internal Rate of Return 16.0%
Present Value of Cash Flow 0.803 -1.676 -3.096 -2.999 -1.488 0.083 -0.905 0.868 0.861 0.854 0.848 0.841 0.834
Net Present Value 2.4 a -1.676 -1.676 -1.676 -1.676 -1.676 -1.676 -1.676 -1.676 -1.676 -1.676 -4.772 -4.772 -4.772 -4.772 -7.770 -9.258 -9.175 -10.080 -9.212 -8.351 -7.496 -6.649 -5.808 -4.973

CCPP Power Plant in Base Load Mode
Advantage F over E-Class
Return on Investment
InvestmentEquity
Debt
interest during construction
Investment Volume
Debt ServiceDebt Payback
Debt interest
Debt Service
Income Tax Rate and ProfitOperating Result
Depreciation
Debt interest
Profit before Tax
Income Tax
Profit after Tax
Cash FlowVariable Rev. Electr.
Operating Revenues (Variab.)
Operating Revenues
Insurance
Fixed Maintenance
Operating Costs (Fix)
Variable Maintenance
Fuel
Consumables
Operating Costs (Variab.)
Operating Costs
Investment Volume
Income from Credit
Debt Service
Income Tax
Cash FlowCash Flow, accumulated
Internal Rate of ReturnPresent Value of Cash Flow
Net Present Value
2007-09 2007-10 2007-11 2007-12 2008-01 2008-02 2008-03 2008-04 2008-05 2008-06 2008-07 2008-08 2008-09 2008-10 2008-11 2008-12 2009-01 2009-02 2009-03 2009-04 2009-05 2009-06 2009-07 2009-08 2009-09 2009-10 2009-11 2009-12
5.400
12.600
18.000
0.124 0.125 0.126 0.127 0.128 0.128 0.129 0.130 0.131 0.132 0.133 0.133
0.270 0.269 0.269 0.268 0.267 0.266 0.265 0.265 0.264 0.263 0.262 0.261
0.395 0.395 0.395 0.395 0.395 0.395 0.395 0.395 0.395 0.395 0.395 0.395
1.076 1.076 1.076 1.076 1.069 0.616 0.616 0.616 0.616 0.616 0.616 0.616 0.616 0.616 0.616 0.616 0.612 0.612 0.612 0.612 0.612 0.612 0.612 0.612 0.612 0.612 0.612 0.612
-0.333 -0.333 -0.333 -0.333 -0.333 -0.333 -0.333 -0.333 -0.333 -0.333 -0.333 -0.333 -0.333 -0.333 -0.333 -0.333 -0.333 -0.333 -0.333 -0.333 -0.333 -0.333 -0.333 -0.333 -0.333 -0.333 -0.333 -0.333
-0.270 -0.269 -0.269 -0.268 -0.267 -0.266 -0.265 -0.265 -0.264 -0.263 -0.262 -0.261
0.742 0.742 0.742 0.742 0.735 0.283 0.283 0.283 0.283 0.283 0.283 0.283 0.283 0.283 0.283 0.283 0.008 0.009 0.010 0.011 0.012 0.012 0.013 0.014 0.015 0.016 0.017 0.017
-0.099 -0.099 -0.099 -0.099 -0.099 -0.099 -0.099 -0.099 -0.099 -0.099 -0.099 -0.003 -0.003 -0.003 -0.004 -0.004 -0.004 -0.005 -0.005 -0.005 -0.006 -0.006 -0.006
0.742 0.742 0.742 0.742 0.735 0.184 0.184 0.184 0.184 0.184 0.184 0.184 0.184 0.184 0.184 0.184 0.005 0.006 0.006 0.007 0.008 0.008 0.009 0.009 0.010 0.010 0.011 0.011
0.640 0.640 0.640 0.640 0.646 0.962 0.962 0.962 0.962 0.962 0.962 0.962 0.962 0.962 0.962 0.962 0.971 0.971 0.971 0.971 0.971 0.971 0.971 0.971 0.971 0.971 0.971 0.971
0.640 0.640 0.640 0.640 0.646 0.962 0.962 0.962 0.962 0.962 0.962 0.962 0.962 0.962 0.962 0.962 0.971 0.971 0.971 0.971 0.971 0.971 0.971 0.971 0.971 0.971 0.971 0.971
0.640 0.640 0.640 0.640 0.646 0.962 0.962 0.962 0.962 0.962 0.962 0.962 0.962 0.962 0.962 0.962 0.971 0.971 0.971 0.971 0.971 0.971 0.971 0.971 0.971 0.971 0.971 0.971
-0.042 -0.042 -0.042 -0.042 -0.042 -0.042 -0.042 -0.042 -0.042 -0.042 -0.042 -0.042 -0.042 -0.042 -0.042 -0.042 -0.042 -0.042 -0.042 -0.042 -0.042 -0.042 -0.042 -0.042 -0.042 -0.042 -0.042 -0.042
-0.442 -0.442 -0.442 -0.442 -0.455 -0.455 -0.455 -0.455 -0.455 -0.455 -0.455 -0.455 -0.455 -0.455 -0.455 -0.455 -0.469 -0.469 -0.469 -0.469 -0.469 -0.469 -0.469 -0.469 -0.469 -0.469 -0.469 -0.469
-0.484 -0.484 -0.484 -0.484 -0.497 -0.497 -0.497 -0.497 -0.497 -0.497 -0.497 -0.497 -0.497 -0.497 -0.497 -0.497 -0.511 -0.511 -0.511 -0.511 -0.511 -0.511 -0.511 -0.511 -0.511 -0.511 -0.511 -0.511
-0.002 -0.002 -0.002 -0.002 -0.002 -0.003 -0.003 -0.003 -0.003 -0.003 -0.003 -0.003 -0.003 -0.003 -0.003 -0.003 -0.003 -0.003 -0.003 -0.003 -0.003 -0.003 -0.003 -0.003 -0.003 -0.003 -0.003 -0.003
0.926 0.926 0.926 0.926 0.926 0.162 0.162 0.162 0.162 0.162 0.162 0.162 0.162 0.162 0.162 0.162 0.162 0.162 0.162 0.162 0.162 0.162 0.162 0.162 0.162 0.162 0.162 0.162
-0.005 -0.005 -0.005 -0.005 -0.005 -0.007 -0.007 -0.007 -0.007 -0.007 -0.007 -0.007 -0.007 -0.007 -0.007 -0.007 -0.007 -0.007 -0.007 -0.007 -0.007 -0.007 -0.007 -0.007 -0.007 -0.007 -0.007 -0.007
0.920 0.920 0.920 0.920 0.920 0.152 0.152 0.152 0.152 0.152 0.152 0.152 0.152 0.152 0.152 0.152 0.151 0.151 0.151 0.151 0.151 0.151 0.151 0.151 0.151 0.151 0.151 0.151
0.436 0.436 0.436 0.436 0.423 -0.345 -0.345 -0.345 -0.345 -0.345 -0.345 -0.345 -0.345 -0.345 -0.345 -0.345 -0.359 -0.359 -0.359 -0.359 -0.359 -0.359 -0.359 -0.359 -0.359 -0.359 -0.359 -0.359
-18.000
12.600
-0.395 -0.395 -0.395 -0.395 -0.395 -0.395 -0.395 -0.395 -0.395 -0.395 -0.395 -0.395
-0.099 -0.099 -0.099 -0.099 -0.099 -0.099 -0.099 -0.099 -0.099 -0.099 -0.099 -0.003 -0.003 -0.003 -0.004 -0.004 -0.004 -0.005 -0.005 -0.005 -0.006 -0.006 -0.006
1.076 1.076 1.076 1.076 1.069 -4.883 0.517 0.517 0.517 0.517 0.517 0.517 0.517 0.517 0.517 0.517 0.214 0.214 0.214 0.214 0.213 0.213 0.213 0.212 0.212 0.212 0.211 0.211
-4.281 -3.206 -2.130 -1.054 0.015 -4.868 -4.351 -3.834 -3.317 -2.800 -2.282 -1.765 -1.248 -0.731 -0.214 0.304 0.518 0.732 0.946 1.159 1.373 1.586 1.798 2.011 2.223 2.434 2.646 2.857
0.1% 2.1% 3.6% 5.0% 6.3% 7.6% 8.8% 10.0% 11.1% 12.2% 13.2% 14.2% 15.1% 16.0%
0.828 0.821 0.815 0.808 0.797 -3.611 0.379 0.376 0.373 0.370 0.368 0.365 0.362 0.359 0.356 0.353 0.145 0.144 0.143 0.141 0.140 0.139 0.137 0.136 0.135 0.134 0.132 0.131
-4.146 -3.325 -2.510 -1.702 -0.905 -4.516 -4.137 -3.760 -3.387 -3.016 -2.649 -2.284 -1.922 -1.563 -1.207 -0.854 -0.709 -0.565 -0.422 -0.281 -0.141 -0.002 0.135 0.271 0.406 0.540 0.672 0.803

CCPP Power Plant in Base Load Mode
F-Class Turbine
Electricity Production Cost 2005 2006 2007 2008 2009 2010 2011 2012 2013 2014 2015 2016 2017
Capital Costs Present value
Equity mill. EUR 84.011 15.474 15.474 15.474 15.474 15.474 15.474 15.474 15.474 15.474
Debt mill. EUR 171.400 31.571 31.571 31.571 31.571 31.571 31.571 31.571 31.571 31.571
Capital Costs mill. EUR 255.411 47.045 47.045 47.045 47.045 47.045 47.045 47.045 47.045 47.045
Operating CostsPersonnel mill. EUR 23.939 2.652 2.732 2.814 2.898 2.985 3.075 3.167 3.262 3.360 3.461 3.564
Insurance mill. EUR 14.706 2.000 2.000 2.000 2.000 2.000 2.000 2.000 2.000 2.000 2.000 2.000
Fixed Maintenance mill. EUR 124.481 13.792 14.205 14.632 15.071 15.523 15.988 16.468 16.962 17.471 17.995 18.535
Operating Costs (Fix) mill. EUR 163.126 18.444 18.937 19.445 19.969 20.508 21.063 21.635 22.224 22.831 23.456 24.099
Variable Maintenance mill. EUR 5.117 0.374 0.594 0.630 0.645 0.662 0.680 0.702 0.722 0.741 0.762 0.783
Fuel mill. EUR 918.004 120.097 125.943 126.000 125.620 125.493 125.365 125.619 125.492 125.237 125.109 124.981
Consumables mill. EUR 11.664 0.917 1.443 1.515 1.535 1.561 1.587 1.622 1.653 1.681 1.711 1.742
Operating Costs (Variab.) mill. EUR 934.784 121.389 127.981 128.146 127.800 127.716 127.632 127.943 127.867 127.659 127.582 127.506
Operating Costs mill. EUR 1,097.910 139.833 146.918 147.591 147.769 148.224 148.695 149.578 150.091 150.490 151.038 151.605
Electricity Production CostElectricity Production Cost mill. EUR 1,353.320 139.833 146.918 194.636 194.814 195.269 195.740 196.623 197.136 197.535 198.083 198.650
Capital Costs Levelized
Equity EUR/MWh 2.154 2.763 2.783 2.791 2.800 2.794 2.797 2.805 2.811 2.817
Debt EUR/MWh 4.394 5.638 5.677 5.695 5.712 5.700 5.706 5.723 5.735 5.747
Capital Costs EUR/MWh 6.547 8.401 8.460 8.486 8.512 8.494 8.503 8.529 8.546 8.564
Operating Costs Levelized
Personnel EUR/MWh 0.614 0.752 0.502 0.502 0.521 0.538 0.556 0.572 0.590 0.609 0.629 0.649
Insurance EUR/MWh 0.377 0.567 0.368 0.357 0.360 0.361 0.362 0.361 0.361 0.363 0.363 0.364
Fixed Maintenance EUR/MWh 3.191 3.911 2.611 2.613 2.710 2.800 2.893 2.973 3.066 3.167 3.269 3.374
Operating Costs (Fix) EUR/MWh 4.181 5.230 3.481 3.472 3.591 3.699 3.811 3.906 4.017 4.139 4.261 4.387
Variable Maintenance EUR/MWh 0.131 0.106 0.109 0.113 0.116 0.119 0.123 0.127 0.130 0.134 0.138 0.143
Fuel EUR/MWh 23.532 34.054 23.151 22.500 22.590 22.636 22.681 22.681 22.681 22.704 22.727 22.750
Consumables EUR/MWh 0.299 0.260 0.265 0.271 0.276 0.282 0.287 0.293 0.299 0.305 0.311 0.317
Operating Costs (Variab.) EUR/MWh 23.962 34.420 23.526 22.883 22.982 23.037 23.092 23.101 23.111 23.143 23.177 23.210
Operating Costs EUR/MWh 28.143 39.650 27.007 26.356 26.573 26.736 26.902 27.007 27.127 27.282 27.437 27.597
Electricity Production Cost Levelized
Electricity Production Cost EUR/MWh 34.690 39.650 27.007 34.756 35.033 35.222 35.414 35.502 35.630 35.811 35.984 36.160
Electricity Production MWh 39,011,371 3,526,667 5,440,000 5,600,000 5,560,800 5,544,000 5,527,200 5,538,400 5,532,800 5,516,000 5,504,800 5,493,600

CCPP Power Plant in Base Load Mode
F-Class Turbine
Electricity Production Cost
Capital CostsEquity
Debt
Capital Costs
Operating CostsPersonnel
Insurance
Fixed Maintenance
Operating Costs (Fix)
Variable Maintenance
Fuel
Consumables
Operating Costs (Variab.)
Operating Costs
Electricity Production CostElectricity Production Cost
Capital CostsEquity
Debt
Capital Costs
Operating CostsPersonnel
Insurance
Fixed Maintenance
Operating Costs (Fix)
Variable Maintenance
Fuel
Consumables
Operating Costs (Variab.)
Operating Costs
Electricity Production CostElectricity Production Cost
Electricity Production
2018 2019 2020 2021 2022 2023 2024 2025 2026
15.474 15.474 15.474 15.474 15.474 15.474
31.571 31.571 31.571 31.571 31.571 31.571
47.045 47.045 47.045 47.045 47.045 47.045
3.671 3.781 3.895 4.012 4.132 4.256 4.384 4.515 4.651
2.000 2.000 2.000 2.000 2.000 2.000 2.000 2.000 2.000
19.091 19.664 20.254 20.861 21.487 22.132 22.796 23.479 24.184
24.762 25.445 26.148 26.873 27.619 28.388 29.179 29.995 30.835
0.810 0.833 0.858 0.882 0.907 0.936 0.963 0.991 1.020
125.364 125.236 125.236 124.981 124.980 125.108 124.981 124.980 124.852
1.784 1.818 1.852 1.885 1.921 1.964 2.001 2.039 2.077
127.958 127.888 127.945 127.748 127.808 128.008 127.945 128.010 127.949
152.720 153.333 154.094 154.621 155.427 156.396 157.124 158.004 158.784
199.765 200.378 201.139 201.666 202.472 203.441 157.124 158.004 158.784
2.805 2.808 2.811 2.817 2.820 2.814
5.723 5.729 5.735 5.747 5.753 5.741
8.529 8.538 8.546 8.564 8.572 8.555
0.666 0.686 0.708 0.730 0.753 0.774 0.798 0.823 0.848
0.363 0.363 0.363 0.364 0.364 0.364 0.364 0.364 0.365
3.461 3.568 3.679 3.797 3.915 4.025 4.149 4.278 4.411
4.489 4.618 4.750 4.892 5.033 5.162 5.312 5.466 5.624
0.147 0.151 0.156 0.160 0.165 0.170 0.175 0.181 0.186
22.727 22.727 22.750 22.750 22.773 22.750 22.750 22.773 22.773
0.323 0.330 0.336 0.343 0.350 0.357 0.364 0.371 0.379
23.198 23.208 23.243 23.254 23.289 23.278 23.290 23.325 23.338
27.687 27.826 27.993 28.146 28.321 28.440 28.601 28.791 28.963
36.216 36.364 36.539 36.709 36.894 36.995 28.601 28.791 28.963
5,516,000 5,510,400 5,504,800 5,493,600 5,488,000 5,499,200 5,493,600 5,488,000 5,482,400
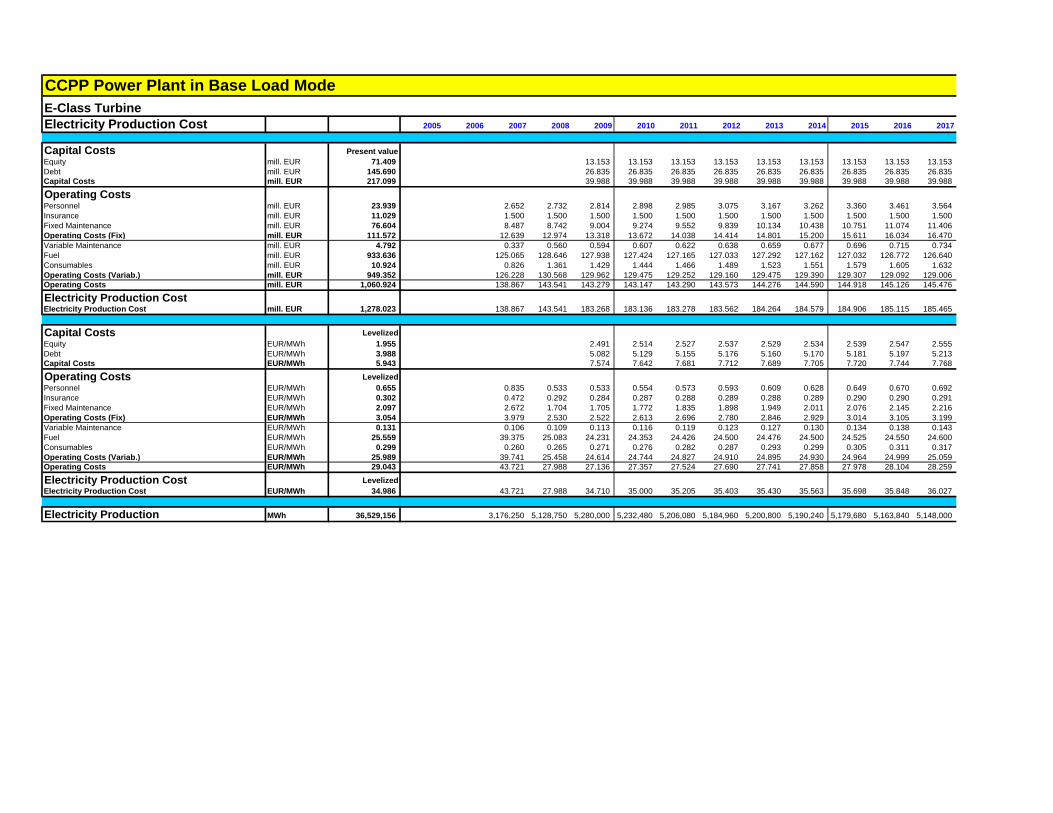
CCPP Power Plant in Base Load Mode
E-Class Turbine
Electricity Production Cost 2005 2006 2007 2008 2009 2010 2011 2012 2013 2014 2015 2016 2017
Capital Costs Present value
Equity mill. EUR 71.409 13.153 13.153 13.153 13.153 13.153 13.153 13.153 13.153 13.153
Debt mill. EUR 145.690 26.835 26.835 26.835 26.835 26.835 26.835 26.835 26.835 26.835
Capital Costs mill. EUR 217.099 39.988 39.988 39.988 39.988 39.988 39.988 39.988 39.988 39.988
Operating CostsPersonnel mill. EUR 23.939 2.652 2.732 2.814 2.898 2.985 3.075 3.167 3.262 3.360 3.461 3.564
Insurance mill. EUR 11.029 1.500 1.500 1.500 1.500 1.500 1.500 1.500 1.500 1.500 1.500 1.500
Fixed Maintenance mill. EUR 76.604 8.487 8.742 9.004 9.274 9.552 9.839 10.134 10.438 10.751 11.074 11.406
Operating Costs (Fix) mill. EUR 111.572 12.639 12.974 13.318 13.672 14.038 14.414 14.801 15.200 15.611 16.034 16.470
Variable Maintenance mill. EUR 4.792 0.337 0.560 0.594 0.607 0.622 0.638 0.659 0.677 0.696 0.715 0.734
Fuel mill. EUR 933.636 125.065 128.646 127.938 127.424 127.165 127.033 127.292 127.162 127.032 126.772 126.640
Consumables mill. EUR 10.924 0.826 1.361 1.429 1.444 1.466 1.489 1.523 1.551 1.579 1.605 1.632
Operating Costs (Variab.) mill. EUR 949.352 126.228 130.568 129.962 129.475 129.252 129.160 129.475 129.390 129.307 129.092 129.006
Operating Costs mill. EUR 1,060.924 138.867 143.541 143.279 143.147 143.290 143.573 144.276 144.590 144.918 145.126 145.476
Electricity Production CostElectricity Production Cost mill. EUR 1,278.023 138.867 143.541 183.268 183.136 183.278 183.562 184.264 184.579 184.906 185.115 185.465
Capital Costs Levelized
Equity EUR/MWh 1.955 2.491 2.514 2.527 2.537 2.529 2.534 2.539 2.547 2.555
Debt EUR/MWh 3.988 5.082 5.129 5.155 5.176 5.160 5.170 5.181 5.197 5.213
Capital Costs EUR/MWh 5.943 7.574 7.642 7.681 7.712 7.689 7.705 7.720 7.744 7.768
Operating Costs Levelized
Personnel EUR/MWh 0.655 0.835 0.533 0.533 0.554 0.573 0.593 0.609 0.628 0.649 0.670 0.692
Insurance EUR/MWh 0.302 0.472 0.292 0.284 0.287 0.288 0.289 0.288 0.289 0.290 0.290 0.291
Fixed Maintenance EUR/MWh 2.097 2.672 1.704 1.705 1.772 1.835 1.898 1.949 2.011 2.076 2.145 2.216
Operating Costs (Fix) EUR/MWh 3.054 3.979 2.530 2.522 2.613 2.696 2.780 2.846 2.929 3.014 3.105 3.199
Variable Maintenance EUR/MWh 0.131 0.106 0.109 0.113 0.116 0.119 0.123 0.127 0.130 0.134 0.138 0.143
Fuel EUR/MWh 25.559 39.375 25.083 24.231 24.353 24.426 24.500 24.476 24.500 24.525 24.550 24.600
Consumables EUR/MWh 0.299 0.260 0.265 0.271 0.276 0.282 0.287 0.293 0.299 0.305 0.311 0.317
Operating Costs (Variab.) EUR/MWh 25.989 39.741 25.458 24.614 24.744 24.827 24.910 24.895 24.930 24.964 24.999 25.059
Operating Costs EUR/MWh 29.043 43.721 27.988 27.136 27.357 27.524 27.690 27.741 27.858 27.978 28.104 28.259
Electricity Production Cost Levelized
Electricity Production Cost EUR/MWh 34.986 43.721 27.988 34.710 35.000 35.205 35.403 35.430 35.563 35.698 35.848 36.027
Electricity Production MWh 36,529,156 3,176,250 5,128,750 5,280,000 5,232,480 5,206,080 5,184,960 5,200,800 5,190,240 5,179,680 5,163,840 5,148,000

CCPP Power Plant in Base Load Mode
E-Class Turbine
Electricity Production Cost
Capital CostsEquity
Debt
Capital Costs
Operating CostsPersonnel
Insurance
Fixed Maintenance
Operating Costs (Fix)
Variable Maintenance
Fuel
Consumables
Operating Costs (Variab.)
Operating Costs
Electricity Production CostElectricity Production Cost
Capital CostsEquity
Debt
Capital Costs
Operating CostsPersonnel
Insurance
Fixed Maintenance
Operating Costs (Fix)
Variable Maintenance
Fuel
Consumables
Operating Costs (Variab.)
Operating Costs
Electricity Production CostElectricity Production Cost
Electricity Production
2018 2019 2020 2021 2022 2023 2024 2025 2026
13.153 13.153 13.153 13.153 13.153 13.153
26.835 26.835 26.835 26.835 26.835 26.835
39.988 39.988 39.988 39.988 39.988 39.988
3.671 3.781 3.895 4.012 4.132 4.256 4.384 4.515 4.651
1.500 1.500 1.500 1.500 1.500 1.500 1.500 1.500 1.500
11.748 12.101 12.464 12.838 13.223 13.619 14.028 14.449 14.882
16.920 17.382 17.859 18.349 18.855 19.376 19.912 20.464 21.033
0.760 0.782 0.804 0.826 0.849 0.877 0.903 0.928 0.955
127.031 126.901 126.771 126.640 126.508 126.769 126.640 126.508 126.378
1.673 1.705 1.736 1.767 1.798 1.840 1.875 1.908 1.945
129.464 129.388 129.310 129.232 129.156 129.487 129.417 129.345 129.278
146.384 146.771 147.169 147.582 148.011 148.862 149.329 149.809 150.311
186.372 186.759 187.157 187.570 187.999 188.851 149.329 149.809 150.311
2.542 2.545 2.550 2.555 2.560 2.552
5.186 5.191 5.202 5.213 5.223 5.207
7.728 7.736 7.752 7.768 7.784 7.760
0.710 0.732 0.755 0.779 0.804 0.826 0.852 0.879 0.906
0.290 0.290 0.291 0.291 0.292 0.291 0.291 0.292 0.292
2.270 2.341 2.416 2.494 2.574 2.643 2.725 2.812 2.900
3.270 3.363 3.462 3.564 3.670 3.760 3.868 3.983 4.098
0.147 0.151 0.156 0.160 0.165 0.170 0.175 0.181 0.186
24.550 24.550 24.575 24.600 24.625 24.600 24.600 24.625 24.625
0.323 0.330 0.336 0.343 0.350 0.357 0.364 0.371 0.379
25.020 25.031 25.067 25.103 25.140 25.127 25.139 25.177 25.190
28.290 28.394 28.529 28.668 28.810 28.887 29.007 29.160 29.288
36.018 36.130 36.281 36.436 36.594 36.647 29.007 29.160 29.288
5,174,400 5,169,120 5,158,560 5,148,000 5,137,440 5,153,280 5,148,000 5,137,440 5,132,160

CCPP Power Plant in Base Load Mode
Advantage F over E-Class
Electricity Production Cost 2005 2006 2007 2008 2009 2010 2011 2012 2013 2014 2015 2016 2017
Capital Costs Present value
Equity mill. EUR 12.602 2.321 2.321 2.321 2.321 2.321 2.321 2.321 2.321 2.321
Debt mill. EUR 25.710 4.736 4.736 4.736 4.736 4.736 4.736 4.736 4.736 4.736
Capital Costs mill. EUR 38.312 7.057 7.057 7.057 7.057 7.057 7.057 7.057 7.057 7.057
Operating CostsInsurance mill. EUR 3.676 0.500 0.500 0.500 0.500 0.500 0.500 0.500 0.500 0.500 0.500 0.500
Fixed Maintenance mill. EUR 47.877 5.305 5.464 5.628 5.796 5.970 6.149 6.334 6.524 6.720 6.921 7.129
Operating Costs (Fix) mill. EUR 51.554 5.805 5.964 6.128 6.296 6.470 6.649 6.834 7.024 7.220 7.421 7.629
Variable Maintenance mill. EUR 0.324 0.037 0.034 0.036 0.038 0.040 0.042 0.043 0.045 0.045 0.047 0.049
Fuel mill. EUR -15.632 -4.968 -2.703 -1.938 -1.804 -1.672 -1.668 -1.673 -1.670 -1.795 -1.663 -1.659
Consumables mill. EUR 0.740 0.091 0.083 0.087 0.091 0.095 0.098 0.099 0.102 0.102 0.106 0.110
Operating Costs (Variab.) mill. EUR -14.568 -4.839 -2.587 -1.816 -1.675 -1.536 -1.528 -1.532 -1.523 -1.647 -1.510 -1.500
Operating Costs mill. EUR 36.985 0.965 3.377 4.312 4.621 4.934 5.122 5.302 5.501 5.572 5.912 6.129
Electricity Production CostElectricity Production Cost mill. EUR 75.297 0.965 3.377 11.368 11.678 11.991 12.178 12.359 12.557 12.629 12.968 13.186
Capital Costs Levelized
Equity EUR/MWh 5.077 7.254 7.070 6.869 6.782 6.875 6.776 6.902 6.808 6.716
Debt EUR/MWh 10.358 14.799 14.424 14.014 13.837 14.027 13.824 14.081 13.889 13.703
Capital Costs EUR/MWh 15.434 22.052 21.494 20.883 20.619 20.903 20.600 20.982 20.697 20.419
Operating Costs Levelized
Insurance EUR/MWh 1.481 1.427 1.606 1.563 1.523 1.480 1.461 1.481 1.460 1.487 1.466 1.447
Fixed Maintenance EUR/MWh 19.288 15.138 17.554 17.586 17.655 17.668 17.968 18.761 19.044 19.980 20.299 20.627
Operating Costs (Fix) EUR/MWh 20.769 16.565 19.160 19.149 19.178 19.147 19.429 20.242 20.504 21.466 21.766 22.074
Variable Maintenance EUR/MWh 0.131 0.106 0.109 0.113 0.116 0.119 0.123 0.127 0.130 0.134 0.138 0.143
Fuel EUR/MWh -6.298 -14.176 -8.685 -6.058 -5.494 -4.947 -4.874 -4.957 -4.876 -5.337 -4.877 -4.800
Consumables EUR/MWh 0.298 0.260 0.265 0.271 0.276 0.282 0.287 0.293 0.299 0.305 0.311 0.317
Operating Costs (Variab.) EUR/MWh -5.869 -13.810 -8.310 -5.675 -5.102 -4.546 -4.464 -4.537 -4.447 -4.898 -4.427 -4.340
Operating Costs EUR/MWh 14.900 2.755 10.850 13.474 14.076 14.601 14.965 15.705 16.057 16.569 17.338 17.734
Electricity Production Cost Levelized
Electricity Production Cost EUR/MWh 30.335 2.755 10.850 35.526 35.569 35.484 35.585 36.608 36.657 37.551 38.035 38.153
Electricity Production MWh 2,482,215 350,417 311,250 320,000 328,320 337,920 342,240 337,600 342,560 336,320 340,960 345,600

CCPP Power Plant in Base Load Mode
Advantage F over E-Class
Electricity Production Cost
Capital CostsEquity
Debt
Capital Costs
Operating CostsInsurance
Fixed Maintenance
Operating Costs (Fix)
Variable Maintenance
Fuel
Consumables
Operating Costs (Variab.)
Operating Costs
Electricity Production CostElectricity Production Cost
Capital CostsEquity
Debt
Capital Costs
Operating CostsInsurance
Fixed Maintenance
Operating Costs (Fix)
Variable Maintenance
Fuel
Consumables
Operating Costs (Variab.)
Operating Costs
Electricity Production CostElectricity Production Cost
Electricity Production
2018 2019 2020 2021 2022 2023 2024 2025 2026
2.321 2.321 2.321 2.321 2.321 2.321
4.736 4.736 4.736 4.736 4.736 4.736
7.057 7.057 7.057 7.057 7.057 7.057
0.500 0.500 0.500 0.500 0.500 0.500 0.500 0.500 0.500
7.343 7.563 7.790 8.024 8.264 8.512 8.768 9.031 9.301
7.843 8.063 8.290 8.524 8.764 9.012 9.268 9.531 9.801
0.050 0.052 0.054 0.055 0.058 0.059 0.061 0.063 0.065
-1.667 -1.665 -1.535 -1.659 -1.528 -1.661 -1.659 -1.528 -1.526
0.110 0.113 0.116 0.119 0.123 0.124 0.126 0.130 0.133
-1.507 -1.501 -1.365 -1.485 -1.348 -1.479 -1.472 -1.335 -1.328
6.336 6.562 6.925 7.039 7.416 7.533 7.795 8.196 8.473
13.393 13.619 13.982 14.096 14.473 14.590 7.795 8.196 8.473
6.795 6.801 6.704 6.716 6.621 6.710
13.863 13.876 13.677 13.703 13.509 13.690
20.658 20.677 20.381 20.419 20.130 20.400
1.464 1.465 1.444 1.447 1.426 1.445 1.447 1.426 1.428
21.495 22.161 22.498 23.216 23.574 24.607 25.369 25.760 26.557
22.959 23.626 23.942 24.663 25.001 26.053 26.816 27.187 27.985
0.147 0.151 0.156 0.160 0.165 0.170 0.175 0.181 0.186
-4.881 -4.879 -4.434 -4.800 -4.360 -4.803 -4.800 -4.360 -4.357
0.323 0.330 0.336 0.343 0.350 0.357 0.364 0.371 0.379
-4.411 -4.398 -3.941 -4.296 -3.845 -4.275 -4.260 -3.808 -3.792
18.548 19.228 20.001 20.367 21.156 21.778 22.556 23.379 24.193
39.206 39.905 40.382 40.786 41.286 42.178 22.556 23.379 24.193
341,600 341,280 346,240 345,600 350,560 345,920 345,600 350,560 350,240
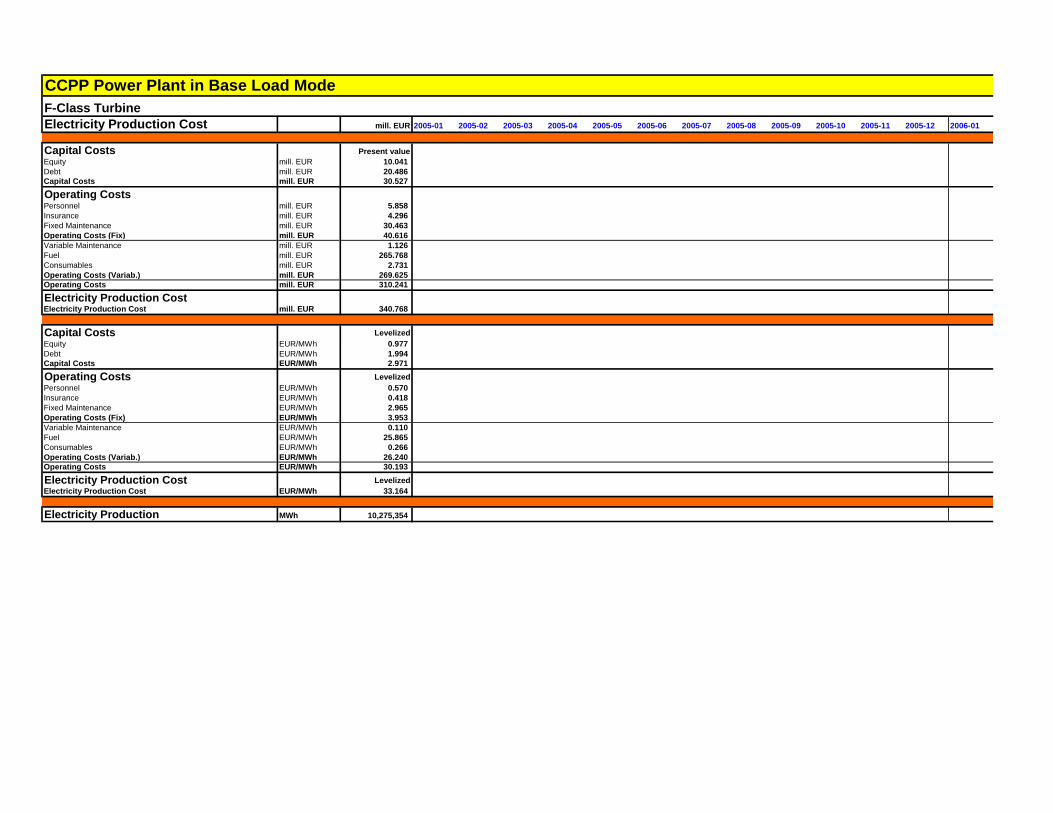
CCPP Power Plant in Base Load Mode
F-Class Turbine
Electricity Production Cost mill. EUR 2005-01 2005-02 2005-03 2005-04 2005-05 2005-06 2005-07 2005-08 2005-09 2005-10 2005-11 2005-12 2006-01
Capital Costs Present value
Equity mill. EUR 10.041
Debt mill. EUR 20.486
Capital Costs mill. EUR 30.527
Operating CostsPersonnel mill. EUR 5.858
Insurance mill. EUR 4.296
Fixed Maintenance mill. EUR 30.463
Operating Costs (Fix) mill. EUR 40.616
Variable Maintenance mill. EUR 1.126
Fuel mill. EUR 265.768
Consumables mill. EUR 2.731
Operating Costs (Variab.) mill. EUR 269.625
Operating Costs mill. EUR 310.241
Electricity Production CostElectricity Production Cost mill. EUR 340.768
Capital Costs Levelized
Equity EUR/MWh 0.977
Debt EUR/MWh 1.994
Capital Costs EUR/MWh 2.971
Operating Costs Levelized
Personnel EUR/MWh 0.570
Insurance EUR/MWh 0.418
Fixed Maintenance EUR/MWh 2.965
Operating Costs (Fix) EUR/MWh 3.953
Variable Maintenance EUR/MWh 0.110
Fuel EUR/MWh 25.865
Consumables EUR/MWh 0.266
Operating Costs (Variab.) EUR/MWh 26.240
Operating Costs EUR/MWh 30.193
Electricity Production Cost Levelized
Electricity Production Cost EUR/MWh 33.164
Electricity Production MWh 10,275,354
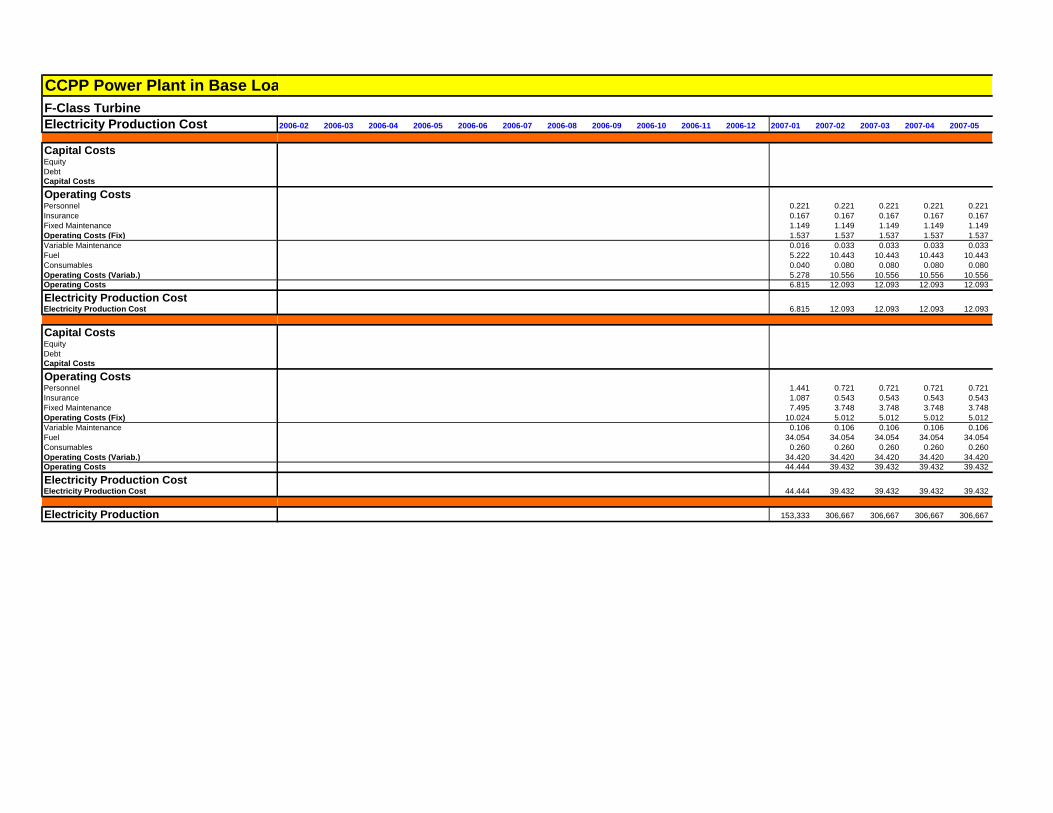
CCPP Power Plant in Base Load Mode
F-Class Turbine
Electricity Production Cost
Capital CostsEquity
Debt
Capital Costs
Operating CostsPersonnel
Insurance
Fixed Maintenance
Operating Costs (Fix)
Variable Maintenance
Fuel
Consumables
Operating Costs (Variab.)
Operating Costs
Electricity Production CostElectricity Production Cost
Capital CostsEquity
Debt
Capital Costs
Operating CostsPersonnel
Insurance
Fixed Maintenance
Operating Costs (Fix)
Variable Maintenance
Fuel
Consumables
Operating Costs (Variab.)
Operating Costs
Electricity Production CostElectricity Production Cost
Electricity Production
2006-02 2006-03 2006-04 2006-05 2006-06 2006-07 2006-08 2006-09 2006-10 2006-11 2006-12 2007-01 2007-02 2007-03 2007-04 2007-05
0.221 0.221 0.221 0.221 0.221
0.167 0.167 0.167 0.167 0.167
1.149 1.149 1.149 1.149 1.149
1.537 1.537 1.537 1.537 1.537
0.016 0.033 0.033 0.033 0.033
5.222 10.443 10.443 10.443 10.443
0.040 0.080 0.080 0.080 0.080
5.278 10.556 10.556 10.556 10.556
6.815 12.093 12.093 12.093 12.093
6.815 12.093 12.093 12.093 12.093
1.441 0.721 0.721 0.721 0.721
1.087 0.543 0.543 0.543 0.543
7.495 3.748 3.748 3.748 3.748
10.024 5.012 5.012 5.012 5.012
0.106 0.106 0.106 0.106 0.106
34.054 34.054 34.054 34.054 34.054
0.260 0.260 0.260 0.260 0.260
34.420 34.420 34.420 34.420 34.420
44.444 39.432 39.432 39.432 39.432
44.444 39.432 39.432 39.432 39.432
153,333 306,667 306,667 306,667 306,667

CCPP Power Plant in Base Load Mode
F-Class Turbine
Electricity Production Cost
Capital CostsEquity
Debt
Capital Costs
Operating CostsPersonnel
Insurance
Fixed Maintenance
Operating Costs (Fix)
Variable Maintenance
Fuel
Consumables
Operating Costs (Variab.)
Operating Costs
Electricity Production CostElectricity Production Cost
Capital CostsEquity
Debt
Capital Costs
Operating CostsPersonnel
Insurance
Fixed Maintenance
Operating Costs (Fix)
Variable Maintenance
Fuel
Consumables
Operating Costs (Variab.)
Operating Costs
Electricity Production CostElectricity Production Cost
Electricity Production
2007-06 2007-07 2007-08 2007-09 2007-10 2007-11 2007-12 2008-01 2008-02 2008-03 2008-04 2008-05 2008-06 2008-07 2008-08 2008-09
0.221 0.221 0.221 0.221 0.221 0.221 0.221 0.228 0.228 0.228 0.228 0.228 0.228 0.228 0.228 0.228
0.167 0.167 0.167 0.167 0.167 0.167 0.167 0.167 0.167 0.167 0.167 0.167 0.167 0.167 0.167 0.167
1.149 1.149 1.149 1.149 1.149 1.149 1.149 1.184 1.184 1.184 1.184 1.184 1.184 1.184 1.184 1.184
1.537 1.537 1.537 1.537 1.537 1.537 1.537 1.578 1.578 1.578 1.578 1.578 1.578 1.578 1.578 1.578
0.033 0.033 0.033 0.033 0.033 0.033 0.033 0.034 0.051 0.051 0.051 0.051 0.051 0.051 0.051 0.051
10.443 10.443 10.443 10.443 10.443 10.443 10.443 10.443 10.500 10.500 10.500 10.500 10.500 10.500 10.500 10.500
0.080 0.080 0.080 0.080 0.080 0.080 0.080 0.081 0.124 0.124 0.124 0.124 0.124 0.124 0.124 0.124
10.556 10.556 10.556 10.556 10.556 10.556 10.556 10.558 10.675 10.675 10.675 10.675 10.675 10.675 10.675 10.675
12.093 12.093 12.093 12.093 12.093 12.093 12.093 12.136 12.253 12.253 12.253 12.253 12.253 12.253 12.253 12.253
12.093 12.093 12.093 12.093 12.093 12.093 12.093 12.136 12.253 12.253 12.253 12.253 12.253 12.253 12.253 12.253
0.721 0.721 0.721 0.721 0.721 0.721 0.721 0.742 0.488 0.488 0.488 0.488 0.488 0.488 0.488 0.488
0.543 0.543 0.543 0.543 0.543 0.543 0.543 0.543 0.357 0.357 0.357 0.357 0.357 0.357 0.357 0.357
3.748 3.748 3.748 3.748 3.748 3.748 3.748 3.860 2.537 2.537 2.537 2.537 2.537 2.537 2.537 2.537
5.012 5.012 5.012 5.012 5.012 5.012 5.012 5.146 3.382 3.382 3.382 3.382 3.382 3.382 3.382 3.382
0.106 0.106 0.106 0.106 0.106 0.106 0.106 0.109 0.109 0.109 0.109 0.109 0.109 0.109 0.109 0.109
34.054 34.054 34.054 34.054 34.054 34.054 34.054 34.054 22.500 22.500 22.500 22.500 22.500 22.500 22.500 22.500
0.260 0.260 0.260 0.260 0.260 0.260 0.260 0.265 0.265 0.265 0.265 0.265 0.265 0.265 0.265 0.265
34.420 34.420 34.420 34.420 34.420 34.420 34.420 34.429 22.875 22.875 22.875 22.875 22.875 22.875 22.875 22.875
39.432 39.432 39.432 39.432 39.432 39.432 39.432 39.575 26.256 26.256 26.256 26.256 26.256 26.256 26.256 26.256
39.432 39.432 39.432 39.432 39.432 39.432 39.432 39.575 26.256 26.256 26.256 26.256 26.256 26.256 26.256 26.256
306,667 306,667 306,667 306,667 306,667 306,667 306,667 306,667 466,667 466,667 466,667 466,667 466,667 466,667 466,667 466,667

CCPP Power Plant in Base Load Mode
F-Class Turbine
Electricity Production Cost
Capital CostsEquity
Debt
Capital Costs
Operating CostsPersonnel
Insurance
Fixed Maintenance
Operating Costs (Fix)
Variable Maintenance
Fuel
Consumables
Operating Costs (Variab.)
Operating Costs
Electricity Production CostElectricity Production Cost
Capital CostsEquity
Debt
Capital Costs
Operating CostsPersonnel
Insurance
Fixed Maintenance
Operating Costs (Fix)
Variable Maintenance
Fuel
Consumables
Operating Costs (Variab.)
Operating Costs
Electricity Production CostElectricity Production Cost
Electricity Production
2008-10 2008-11 2008-12 2009-01 2009-02 2009-03 2009-04 2009-05 2009-06 2009-07 2009-08 2009-09 2009-10 2009-11 2009-12
1.290 1.290 1.290 1.290 1.290 1.290 1.290 1.290 1.290 1.290 1.290 1.290
2.631 2.631 2.631 2.631 2.631 2.631 2.631 2.631 2.631 2.631 2.631 2.631
3.920 3.920 3.920 3.920 3.920 3.920 3.920 3.920 3.920 3.920 3.920 3.920
0.228 0.228 0.228 0.234 0.234 0.234 0.234 0.234 0.234 0.234 0.234 0.234 0.234 0.234 0.234
0.167 0.167 0.167 0.167 0.167 0.167 0.167 0.167 0.167 0.167 0.167 0.167 0.167 0.167 0.167
1.184 1.184 1.184 1.219 1.219 1.219 1.219 1.219 1.219 1.219 1.219 1.219 1.219 1.219 1.219
1.578 1.578 1.578 1.620 1.620 1.620 1.620 1.620 1.620 1.620 1.620 1.620 1.620 1.620 1.620
0.051 0.051 0.051 0.053 0.053 0.053 0.053 0.053 0.053 0.053 0.053 0.053 0.053 0.053 0.053
10.500 10.500 10.500 10.500 10.500 10.500 10.500 10.500 10.500 10.500 10.500 10.500 10.500 10.500 10.500
0.124 0.124 0.124 0.126 0.126 0.126 0.126 0.126 0.126 0.126 0.126 0.126 0.126 0.126 0.126
10.675 10.675 10.675 10.679 10.679 10.679 10.679 10.679 10.679 10.679 10.679 10.679 10.679 10.679 10.679
12.253 12.253 12.253 12.299 12.299 12.299 12.299 12.299 12.299 12.299 12.299 12.299 12.299 12.299 12.299
12.253 12.253 12.253 16.220 16.220 16.220 16.220 16.220 16.220 16.220 16.220 16.220 16.220 16.220 16.220
2.763 2.763 2.763 2.763 2.763 2.763 2.763 2.763 2.763 2.763 2.763 2.763
5.638 5.638 5.638 5.638 5.638 5.638 5.638 5.638 5.638 5.638 5.638 5.638
8.401 8.401 8.401 8.401 8.401 8.401 8.401 8.401 8.401 8.401 8.401 8.401
0.488 0.488 0.488 0.502 0.502 0.502 0.502 0.502 0.502 0.502 0.502 0.502 0.502 0.502 0.502
0.357 0.357 0.357 0.357 0.357 0.357 0.357 0.357 0.357 0.357 0.357 0.357 0.357 0.357 0.357
2.537 2.537 2.537 2.613 2.613 2.613 2.613 2.613 2.613 2.613 2.613 2.613 2.613 2.613 2.613
3.382 3.382 3.382 3.472 3.472 3.472 3.472 3.472 3.472 3.472 3.472 3.472 3.472 3.472 3.472
0.109 0.109 0.109 0.113 0.113 0.113 0.113 0.113 0.113 0.113 0.113 0.113 0.113 0.113 0.113
22.500 22.500 22.500 22.500 22.500 22.500 22.500 22.500 22.500 22.500 22.500 22.500 22.500 22.500 22.500
0.265 0.265 0.265 0.271 0.271 0.271 0.271 0.271 0.271 0.271 0.271 0.271 0.271 0.271 0.271
22.875 22.875 22.875 22.883 22.883 22.883 22.883 22.883 22.883 22.883 22.883 22.883 22.883 22.883 22.883
26.256 26.256 26.256 26.356 26.356 26.356 26.356 26.356 26.356 26.356 26.356 26.356 26.356 26.356 26.356
26.256 26.256 26.256 34.756 34.756 34.756 34.756 34.756 34.756 34.756 34.756 34.756 34.756 34.756 34.756
466,667 466,667 466,667 466,667 466,667 466,667 466,667 466,667 466,667 466,667 466,667 466,667 466,667 466,667 466,667
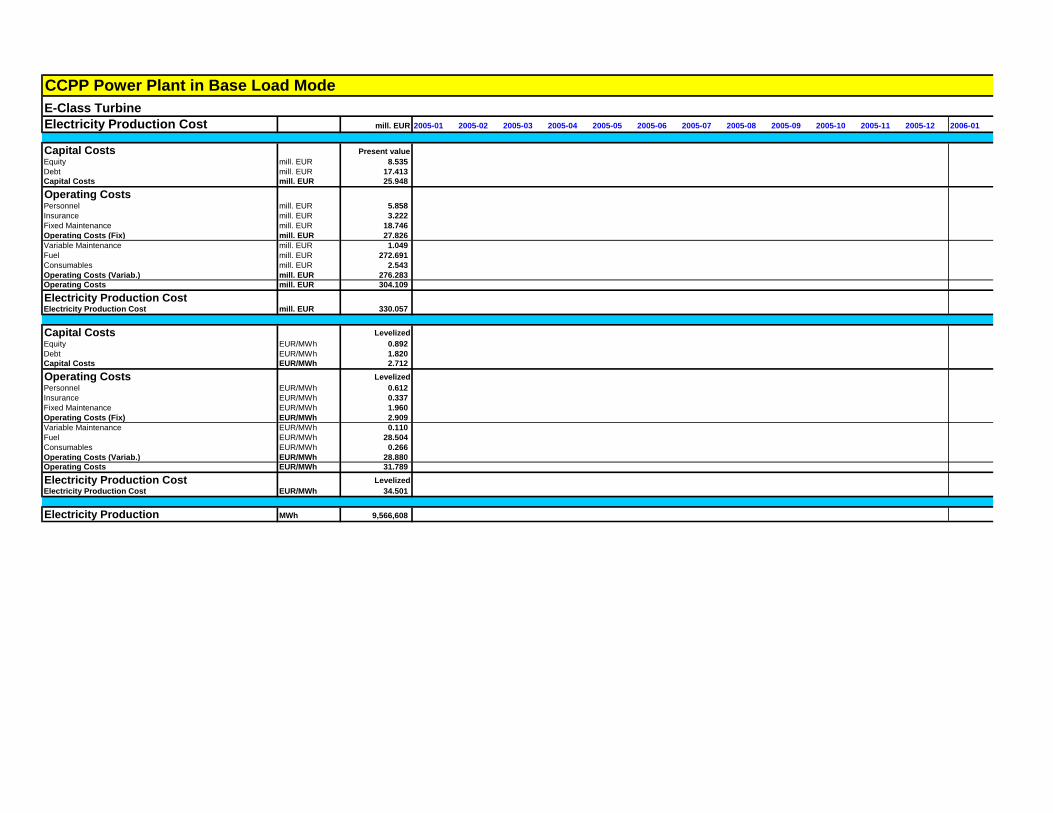
CCPP Power Plant in Base Load Mode
E-Class Turbine
Electricity Production Cost mill. EUR 2005-01 2005-02 2005-03 2005-04 2005-05 2005-06 2005-07 2005-08 2005-09 2005-10 2005-11 2005-12 2006-01
Capital Costs Present value
Equity mill. EUR 8.535
Debt mill. EUR 17.413
Capital Costs mill. EUR 25.948
Operating CostsPersonnel mill. EUR 5.858
Insurance mill. EUR 3.222
Fixed Maintenance mill. EUR 18.746
Operating Costs (Fix) mill. EUR 27.826
Variable Maintenance mill. EUR 1.049
Fuel mill. EUR 272.691
Consumables mill. EUR 2.543
Operating Costs (Variab.) mill. EUR 276.283
Operating Costs mill. EUR 304.109
Electricity Production CostElectricity Production Cost mill. EUR 330.057
Capital Costs Levelized
Equity EUR/MWh 0.892
Debt EUR/MWh 1.820
Capital Costs EUR/MWh 2.712
Operating Costs Levelized
Personnel EUR/MWh 0.612
Insurance EUR/MWh 0.337
Fixed Maintenance EUR/MWh 1.960
Operating Costs (Fix) EUR/MWh 2.909
Variable Maintenance EUR/MWh 0.110
Fuel EUR/MWh 28.504
Consumables EUR/MWh 0.266
Operating Costs (Variab.) EUR/MWh 28.880
Operating Costs EUR/MWh 31.789
Electricity Production Cost Levelized
Electricity Production Cost EUR/MWh 34.501
Electricity Production MWh 9,566,608
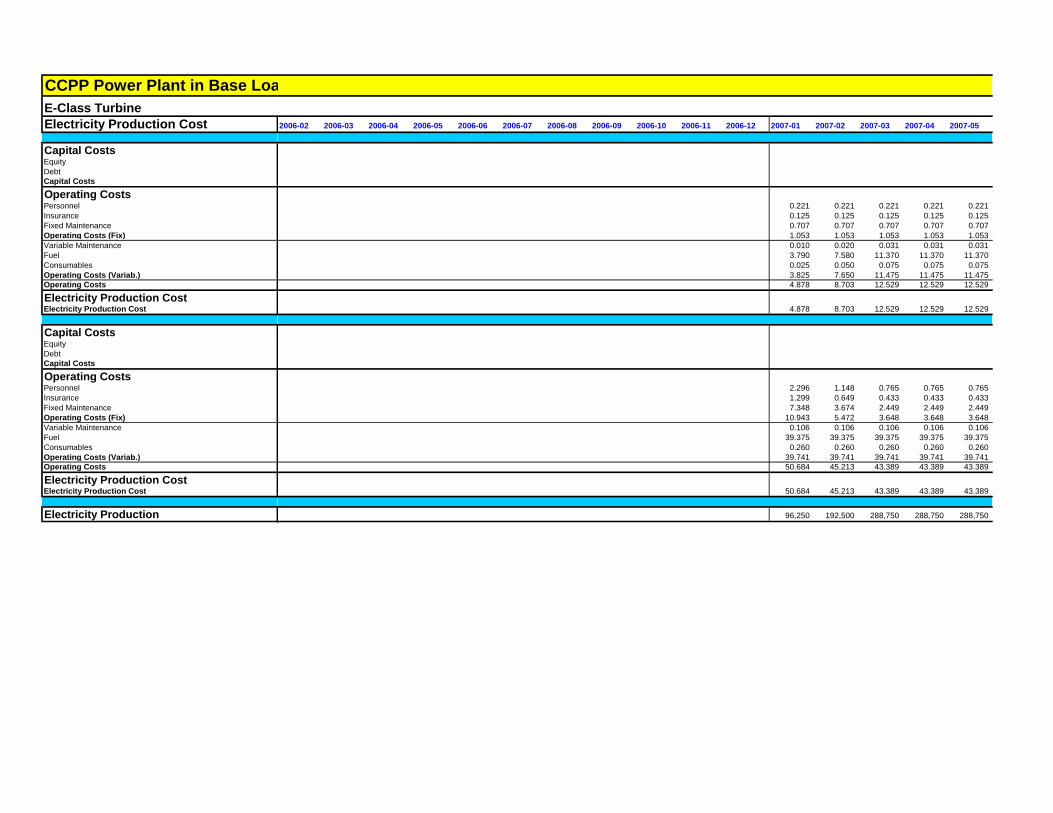
CCPP Power Plant in Base Load Mode
E-Class Turbine
Electricity Production Cost
Capital CostsEquity
Debt
Capital Costs
Operating CostsPersonnel
Insurance
Fixed Maintenance
Operating Costs (Fix)
Variable Maintenance
Fuel
Consumables
Operating Costs (Variab.)
Operating Costs
Electricity Production CostElectricity Production Cost
Capital CostsEquity
Debt
Capital Costs
Operating CostsPersonnel
Insurance
Fixed Maintenance
Operating Costs (Fix)
Variable Maintenance
Fuel
Consumables
Operating Costs (Variab.)
Operating Costs
Electricity Production CostElectricity Production Cost
Electricity Production
2006-02 2006-03 2006-04 2006-05 2006-06 2006-07 2006-08 2006-09 2006-10 2006-11 2006-12 2007-01 2007-02 2007-03 2007-04 2007-05
0.221 0.221 0.221 0.221 0.221
0.125 0.125 0.125 0.125 0.125
0.707 0.707 0.707 0.707 0.707
1.053 1.053 1.053 1.053 1.053
0.010 0.020 0.031 0.031 0.031
3.790 7.580 11.370 11.370 11.370
0.025 0.050 0.075 0.075 0.075
3.825 7.650 11.475 11.475 11.475
4.878 8.703 12.529 12.529 12.529
4.878 8.703 12.529 12.529 12.529
2.296 1.148 0.765 0.765 0.765
1.299 0.649 0.433 0.433 0.433
7.348 3.674 2.449 2.449 2.449
10.943 5.472 3.648 3.648 3.648
0.106 0.106 0.106 0.106 0.106
39.375 39.375 39.375 39.375 39.375
0.260 0.260 0.260 0.260 0.260
39.741 39.741 39.741 39.741 39.741
50.684 45.213 43.389 43.389 43.389
50.684 45.213 43.389 43.389 43.389
96,250 192,500 288,750 288,750 288,750

CCPP Power Plant in Base Load Mode
E-Class Turbine
Electricity Production Cost
Capital CostsEquity
Debt
Capital Costs
Operating CostsPersonnel
Insurance
Fixed Maintenance
Operating Costs (Fix)
Variable Maintenance
Fuel
Consumables
Operating Costs (Variab.)
Operating Costs
Electricity Production CostElectricity Production Cost
Capital CostsEquity
Debt
Capital Costs
Operating CostsPersonnel
Insurance
Fixed Maintenance
Operating Costs (Fix)
Variable Maintenance
Fuel
Consumables
Operating Costs (Variab.)
Operating Costs
Electricity Production CostElectricity Production Cost
Electricity Production
2007-06 2007-07 2007-08 2007-09 2007-10 2007-11 2007-12 2008-01 2008-02 2008-03 2008-04 2008-05 2008-06 2008-07 2008-08 2008-09
0.221 0.221 0.221 0.221 0.221 0.221 0.221 0.228 0.228 0.228 0.228 0.228 0.228 0.228 0.228 0.228
0.125 0.125 0.125 0.125 0.125 0.125 0.125 0.125 0.125 0.125 0.125 0.125 0.125 0.125 0.125 0.125
0.707 0.707 0.707 0.707 0.707 0.707 0.707 0.728 0.728 0.728 0.728 0.728 0.728 0.728 0.728 0.728
1.053 1.053 1.053 1.053 1.053 1.053 1.053 1.081 1.081 1.081 1.081 1.081 1.081 1.081 1.081 1.081
0.031 0.031 0.031 0.031 0.031 0.031 0.031 0.032 0.048 0.048 0.048 0.048 0.048 0.048 0.048 0.048
11.370 11.370 11.370 11.370 11.370 11.370 11.370 11.370 10.662 10.662 10.662 10.662 10.662 10.662 10.662 10.662
0.075 0.075 0.075 0.075 0.075 0.075 0.075 0.077 0.117 0.117 0.117 0.117 0.117 0.117 0.117 0.117
11.475 11.475 11.475 11.475 11.475 11.475 11.475 11.478 10.826 10.826 10.826 10.826 10.826 10.826 10.826 10.826
12.529 12.529 12.529 12.529 12.529 12.529 12.529 12.559 11.907 11.907 11.907 11.907 11.907 11.907 11.907 11.907
12.529 12.529 12.529 12.529 12.529 12.529 12.529 12.559 11.907 11.907 11.907 11.907 11.907 11.907 11.907 11.907
0.765 0.765 0.765 0.765 0.765 0.765 0.765 0.788 0.517 0.517 0.517 0.517 0.517 0.517 0.517 0.517
0.433 0.433 0.433 0.433 0.433 0.433 0.433 0.433 0.284 0.284 0.284 0.284 0.284 0.284 0.284 0.284
2.449 2.449 2.449 2.449 2.449 2.449 2.449 2.523 1.656 1.656 1.656 1.656 1.656 1.656 1.656 1.656
3.648 3.648 3.648 3.648 3.648 3.648 3.648 3.744 2.457 2.457 2.457 2.457 2.457 2.457 2.457 2.457
0.106 0.106 0.106 0.106 0.106 0.106 0.106 0.109 0.109 0.109 0.109 0.109 0.109 0.109 0.109 0.109
39.375 39.375 39.375 39.375 39.375 39.375 39.375 39.375 24.231 24.231 24.231 24.231 24.231 24.231 24.231 24.231
0.260 0.260 0.260 0.260 0.260 0.260 0.260 0.265 0.265 0.265 0.265 0.265 0.265 0.265 0.265 0.265
39.741 39.741 39.741 39.741 39.741 39.741 39.741 39.750 24.605 24.605 24.605 24.605 24.605 24.605 24.605 24.605
43.389 43.389 43.389 43.389 43.389 43.389 43.389 43.494 27.062 27.062 27.062 27.062 27.062 27.062 27.062 27.062
43.389 43.389 43.389 43.389 43.389 43.389 43.389 43.494 27.062 27.062 27.062 27.062 27.062 27.062 27.062 27.062
288,750 288,750 288,750 288,750 288,750 288,750 288,750 288,750 440,000 440,000 440,000 440,000 440,000 440,000 440,000 440,000

CCPP Power Plant in Base Load Mode
E-Class Turbine
Electricity Production Cost
Capital CostsEquity
Debt
Capital Costs
Operating CostsPersonnel
Insurance
Fixed Maintenance
Operating Costs (Fix)
Variable Maintenance
Fuel
Consumables
Operating Costs (Variab.)
Operating Costs
Electricity Production CostElectricity Production Cost
Capital CostsEquity
Debt
Capital Costs
Operating CostsPersonnel
Insurance
Fixed Maintenance
Operating Costs (Fix)
Variable Maintenance
Fuel
Consumables
Operating Costs (Variab.)
Operating Costs
Electricity Production CostElectricity Production Cost
Electricity Production
2008-10 2008-11 2008-12 2009-01 2009-02 2009-03 2009-04 2009-05 2009-06 2009-07 2009-08 2009-09 2009-10 2009-11 2009-12
1.096 1.096 1.096 1.096 1.096 1.096 1.096 1.096 1.096 1.096 1.096 1.096
2.236 2.236 2.236 2.236 2.236 2.236 2.236 2.236 2.236 2.236 2.236 2.236
3.332 3.332 3.332 3.332 3.332 3.332 3.332 3.332 3.332 3.332 3.332 3.332
0.228 0.228 0.228 0.234 0.234 0.234 0.234 0.234 0.234 0.234 0.234 0.234 0.234 0.234 0.234
0.125 0.125 0.125 0.125 0.125 0.125 0.125 0.125 0.125 0.125 0.125 0.125 0.125 0.125 0.125
0.728 0.728 0.728 0.750 0.750 0.750 0.750 0.750 0.750 0.750 0.750 0.750 0.750 0.750 0.750
1.081 1.081 1.081 1.110 1.110 1.110 1.110 1.110 1.110 1.110 1.110 1.110 1.110 1.110 1.110
0.048 0.048 0.048 0.050 0.050 0.050 0.050 0.050 0.050 0.050 0.050 0.050 0.050 0.050 0.050
10.662 10.662 10.662 10.662 10.662 10.662 10.662 10.662 10.662 10.662 10.662 10.662 10.662 10.662 10.662
0.117 0.117 0.117 0.119 0.119 0.119 0.119 0.119 0.119 0.119 0.119 0.119 0.119 0.119 0.119
10.826 10.826 10.826 10.830 10.830 10.830 10.830 10.830 10.830 10.830 10.830 10.830 10.830 10.830 10.830
11.907 11.907 11.907 11.940 11.940 11.940 11.940 11.940 11.940 11.940 11.940 11.940 11.940 11.940 11.940
11.907 11.907 11.907 15.272 15.272 15.272 15.272 15.272 15.272 15.272 15.272 15.272 15.272 15.272 15.272
2.491 2.491 2.491 2.491 2.491 2.491 2.491 2.491 2.491 2.491 2.491 2.491
5.082 5.082 5.082 5.082 5.082 5.082 5.082 5.082 5.082 5.082 5.082 5.082
7.574 7.574 7.574 7.574 7.574 7.574 7.574 7.574 7.574 7.574 7.574 7.574
0.517 0.517 0.517 0.533 0.533 0.533 0.533 0.533 0.533 0.533 0.533 0.533 0.533 0.533 0.533
0.284 0.284 0.284 0.284 0.284 0.284 0.284 0.284 0.284 0.284 0.284 0.284 0.284 0.284 0.284
1.656 1.656 1.656 1.705 1.705 1.705 1.705 1.705 1.705 1.705 1.705 1.705 1.705 1.705 1.705
2.457 2.457 2.457 2.522 2.522 2.522 2.522 2.522 2.522 2.522 2.522 2.522 2.522 2.522 2.522
0.109 0.109 0.109 0.113 0.113 0.113 0.113 0.113 0.113 0.113 0.113 0.113 0.113 0.113 0.113
24.231 24.231 24.231 24.231 24.231 24.231 24.231 24.231 24.231 24.231 24.231 24.231 24.231 24.231 24.231
0.265 0.265 0.265 0.271 0.271 0.271 0.271 0.271 0.271 0.271 0.271 0.271 0.271 0.271 0.271
24.605 24.605 24.605 24.614 24.614 24.614 24.614 24.614 24.614 24.614 24.614 24.614 24.614 24.614 24.614
27.062 27.062 27.062 27.136 27.136 27.136 27.136 27.136 27.136 27.136 27.136 27.136 27.136 27.136 27.136
27.062 27.062 27.062 34.710 34.710 34.710 34.710 34.710 34.710 34.710 34.710 34.710 34.710 34.710 34.710
440,000 440,000 440,000 440,000 440,000 440,000 440,000 440,000 440,000 440,000 440,000 440,000 440,000 440,000 440,000
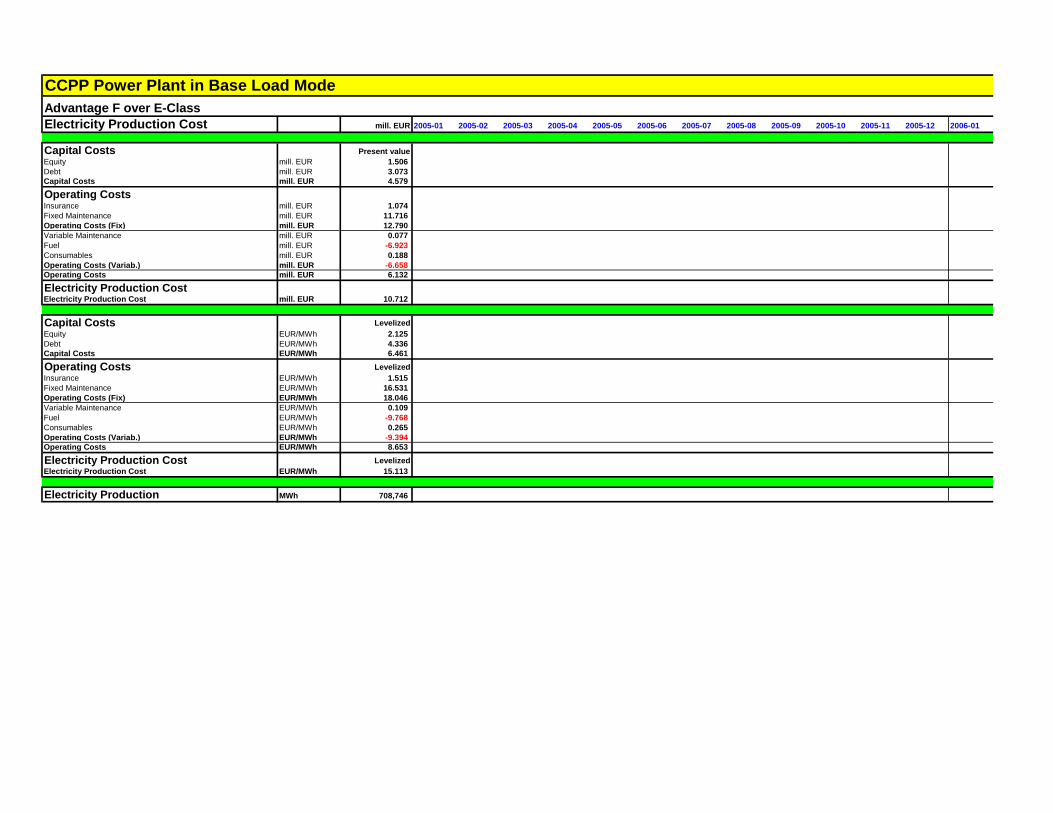
CCPP Power Plant in Base Load Mode
Advantage F over E-Class
Electricity Production Cost mill. EUR 2005-01 2005-02 2005-03 2005-04 2005-05 2005-06 2005-07 2005-08 2005-09 2005-10 2005-11 2005-12 2006-01
Capital Costs Present value
Equity mill. EUR 1.506
Debt mill. EUR 3.073
Capital Costs mill. EUR 4.579
Operating CostsInsurance mill. EUR 1.074
Fixed Maintenance mill. EUR 11.716
Operating Costs (Fix) mill. EUR 12.790
Variable Maintenance mill. EUR 0.077
Fuel mill. EUR -6.923
Consumables mill. EUR 0.188
Operating Costs (Variab.) mill. EUR -6.658
Operating Costs mill. EUR 6.132
Electricity Production CostElectricity Production Cost mill. EUR 10.712
Capital Costs Levelized
Equity EUR/MWh 2.125
Debt EUR/MWh 4.336
Capital Costs EUR/MWh 6.461
Operating Costs Levelized
Insurance EUR/MWh 1.515
Fixed Maintenance EUR/MWh 16.531
Operating Costs (Fix) EUR/MWh 18.046
Variable Maintenance EUR/MWh 0.109
Fuel EUR/MWh -9.768
Consumables EUR/MWh 0.265
Operating Costs (Variab.) EUR/MWh -9.394
Operating Costs EUR/MWh 8.653
Electricity Production Cost Levelized
Electricity Production Cost EUR/MWh 15.113
Electricity Production MWh 708,746

CCPP Power Plant in Base Load Mode
Advantage F over E-Class
Electricity Production Cost
Capital CostsEquity
Debt
Capital Costs
Operating CostsInsurance
Fixed Maintenance
Operating Costs (Fix)
Variable Maintenance
Fuel
Consumables
Operating Costs (Variab.)
Operating Costs
Electricity Production CostElectricity Production Cost
Capital CostsEquity
Debt
Capital Costs
Operating CostsInsurance
Fixed Maintenance
Operating Costs (Fix)
Variable Maintenance
Fuel
Consumables
Operating Costs (Variab.)
Operating Costs
Electricity Production CostElectricity Production Cost
Electricity Production
2006-02 2006-03 2006-04 2006-05 2006-06 2006-07 2006-08 2006-09 2006-10 2006-11 2006-12 2007-01 2007-02 2007-03 2007-04 2007-05
0.042 0.042 0.042 0.042 0.042
0.442 0.442 0.442 0.442 0.442
0.484 0.484 0.484 0.484 0.484
0.006 0.012 0.002 0.002 0.002
1.432 2.864 -0.926 -0.926 -0.926
0.015 0.030 0.005 0.005 0.005
1.453 2.905 -0.920 -0.920 -0.920
1.936 3.389 -0.436 -0.436 -0.436
1.936 3.389 -0.436 -0.436 -0.436
0.730 0.365 2.326 2.326 2.326
7.744 3.872 24.672 24.672 24.672
8.474 4.237 26.998 26.998 26.998
0.106 0.106 0.106 0.106 0.106
25.082 25.082 -51.700 -51.700 -51.700
0.260 0.260 0.260 0.260 0.260
25.448 25.448 -51.334 -51.334 -51.334
33.922 29.685 -24.336 -24.336 -24.336
33.922 29.685 -24.336 -24.336 -24.336
57,083 114,167 17,917 17,917 17,917

CCPP Power Plant in Base Load Mode
Advantage F over E-Class
Electricity Production Cost
Capital CostsEquity
Debt
Capital Costs
Operating CostsInsurance
Fixed Maintenance
Operating Costs (Fix)
Variable Maintenance
Fuel
Consumables
Operating Costs (Variab.)
Operating Costs
Electricity Production CostElectricity Production Cost
Capital CostsEquity
Debt
Capital Costs
Operating CostsInsurance
Fixed Maintenance
Operating Costs (Fix)
Variable Maintenance
Fuel
Consumables
Operating Costs (Variab.)
Operating Costs
Electricity Production CostElectricity Production Cost
Electricity Production
2007-06 2007-07 2007-08 2007-09 2007-10 2007-11 2007-12 2008-01 2008-02 2008-03 2008-04 2008-05 2008-06 2008-07 2008-08 2008-09
0.042 0.042 0.042 0.042 0.042 0.042 0.042 0.042 0.042 0.042 0.042 0.042 0.042 0.042 0.042 0.042
0.442 0.442 0.442 0.442 0.442 0.442 0.442 0.455 0.455 0.455 0.455 0.455 0.455 0.455 0.455 0.455
0.484 0.484 0.484 0.484 0.484 0.484 0.484 0.497 0.497 0.497 0.497 0.497 0.497 0.497 0.497 0.497
0.002 0.002 0.002 0.002 0.002 0.002 0.002 0.002 0.003 0.003 0.003 0.003 0.003 0.003 0.003 0.003
-0.926 -0.926 -0.926 -0.926 -0.926 -0.926 -0.926 -0.926 -0.162 -0.162 -0.162 -0.162 -0.162 -0.162 -0.162 -0.162
0.005 0.005 0.005 0.005 0.005 0.005 0.005 0.005 0.007 0.007 0.007 0.007 0.007 0.007 0.007 0.007
-0.920 -0.920 -0.920 -0.920 -0.920 -0.920 -0.920 -0.920 -0.152 -0.152 -0.152 -0.152 -0.152 -0.152 -0.152 -0.152
-0.436 -0.436 -0.436 -0.436 -0.436 -0.436 -0.436 -0.423 0.345 0.345 0.345 0.345 0.345 0.345 0.345 0.345
-0.436 -0.436 -0.436 -0.436 -0.436 -0.436 -0.436 -0.423 0.345 0.345 0.345 0.345 0.345 0.345 0.345 0.345
2.326 2.326 2.326 2.326 2.326 2.326 2.326 2.326 1.563 1.563 1.563 1.563 1.563 1.563 1.563 1.563
24.672 24.672 24.672 24.672 24.672 24.672 24.672 25.412 17.074 17.074 17.074 17.074 17.074 17.074 17.074 17.074
26.998 26.998 26.998 26.998 26.998 26.998 26.998 27.738 18.636 18.636 18.636 18.636 18.636 18.636 18.636 18.636
0.106 0.106 0.106 0.106 0.106 0.106 0.106 0.109 0.109 0.109 0.109 0.109 0.109 0.109 0.109 0.109
-51.700 -51.700 -51.700 -51.700 -51.700 -51.700 -51.700 -51.700 -6.058 -6.058 -6.058 -6.058 -6.058 -6.058 -6.058 -6.058
0.260 0.260 0.260 0.260 0.260 0.260 0.260 0.265 0.265 0.265 0.265 0.265 0.265 0.265 0.265 0.265
-51.334 -51.334 -51.334 -51.334 -51.334 -51.334 -51.334 -51.325 -5.683 -5.683 -5.683 -5.683 -5.683 -5.683 -5.683 -5.683
-24.336 -24.336 -24.336 -24.336 -24.336 -24.336 -24.336 -23.587 12.953 12.953 12.953 12.953 12.953 12.953 12.953 12.953
-24.336 -24.336 -24.336 -24.336 -24.336 -24.336 -24.336 -23.587 12.953 12.953 12.953 12.953 12.953 12.953 12.953 12.953
17,917 17,917 17,917 17,917 17,917 17,917 17,917 17,917 26,667 26,667 26,667 26,667 26,667 26,667 26,667 26,667
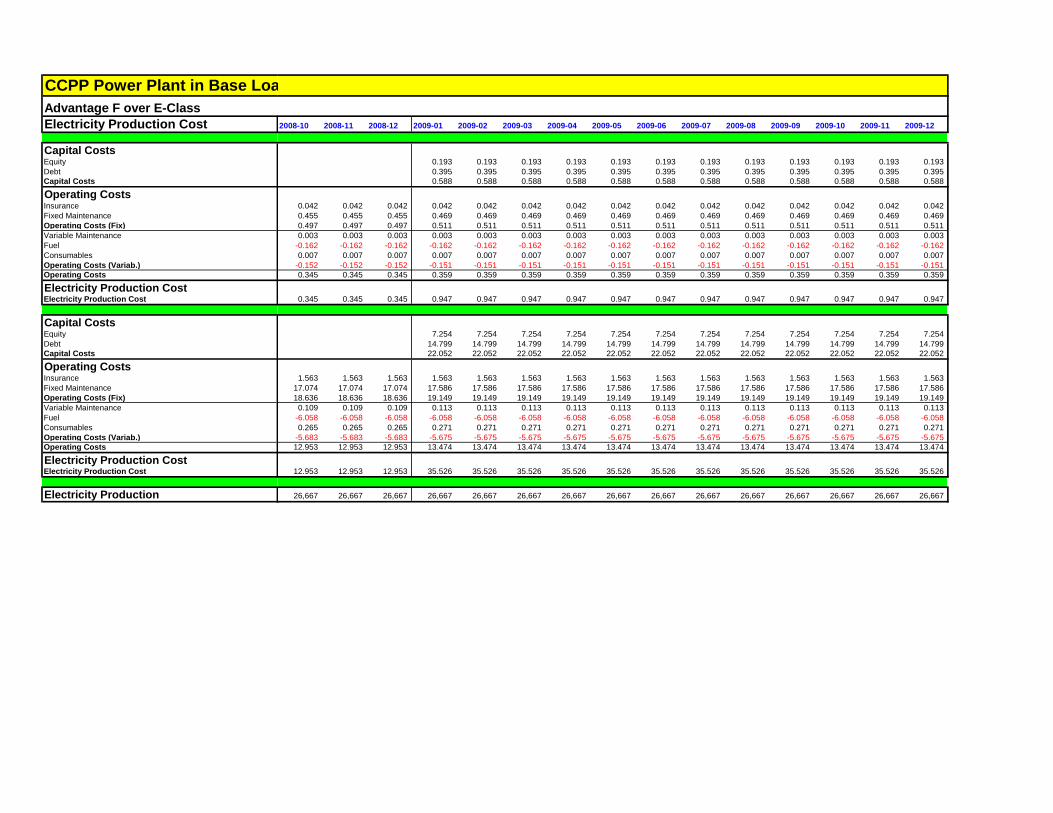
CCPP Power Plant in Base Load Mode
Advantage F over E-Class
Electricity Production Cost
Capital CostsEquity
Debt
Capital Costs
Operating CostsInsurance
Fixed Maintenance
Operating Costs (Fix)
Variable Maintenance
Fuel
Consumables
Operating Costs (Variab.)
Operating Costs
Electricity Production CostElectricity Production Cost
Capital CostsEquity
Debt
Capital Costs
Operating CostsInsurance
Fixed Maintenance
Operating Costs (Fix)
Variable Maintenance
Fuel
Consumables
Operating Costs (Variab.)
Operating Costs
Electricity Production CostElectricity Production Cost
Electricity Production
2008-10 2008-11 2008-12 2009-01 2009-02 2009-03 2009-04 2009-05 2009-06 2009-07 2009-08 2009-09 2009-10 2009-11 2009-12
0.193 0.193 0.193 0.193 0.193 0.193 0.193 0.193 0.193 0.193 0.193 0.193
0.395 0.395 0.395 0.395 0.395 0.395 0.395 0.395 0.395 0.395 0.395 0.395
0.588 0.588 0.588 0.588 0.588 0.588 0.588 0.588 0.588 0.588 0.588 0.588
0.042 0.042 0.042 0.042 0.042 0.042 0.042 0.042 0.042 0.042 0.042 0.042 0.042 0.042 0.042
0.455 0.455 0.455 0.469 0.469 0.469 0.469 0.469 0.469 0.469 0.469 0.469 0.469 0.469 0.469
0.497 0.497 0.497 0.511 0.511 0.511 0.511 0.511 0.511 0.511 0.511 0.511 0.511 0.511 0.511
0.003 0.003 0.003 0.003 0.003 0.003 0.003 0.003 0.003 0.003 0.003 0.003 0.003 0.003 0.003
-0.162 -0.162 -0.162 -0.162 -0.162 -0.162 -0.162 -0.162 -0.162 -0.162 -0.162 -0.162 -0.162 -0.162 -0.162
0.007 0.007 0.007 0.007 0.007 0.007 0.007 0.007 0.007 0.007 0.007 0.007 0.007 0.007 0.007
-0.152 -0.152 -0.152 -0.151 -0.151 -0.151 -0.151 -0.151 -0.151 -0.151 -0.151 -0.151 -0.151 -0.151 -0.151
0.345 0.345 0.345 0.359 0.359 0.359 0.359 0.359 0.359 0.359 0.359 0.359 0.359 0.359 0.359
0.345 0.345 0.345 0.947 0.947 0.947 0.947 0.947 0.947 0.947 0.947 0.947 0.947 0.947 0.947
7.254 7.254 7.254 7.254 7.254 7.254 7.254 7.254 7.254 7.254 7.254 7.254
14.799 14.799 14.799 14.799 14.799 14.799 14.799 14.799 14.799 14.799 14.799 14.799
22.052 22.052 22.052 22.052 22.052 22.052 22.052 22.052 22.052 22.052 22.052 22.052
1.563 1.563 1.563 1.563 1.563 1.563 1.563 1.563 1.563 1.563 1.563 1.563 1.563 1.563 1.563
17.074 17.074 17.074 17.586 17.586 17.586 17.586 17.586 17.586 17.586 17.586 17.586 17.586 17.586 17.586
18.636 18.636 18.636 19.149 19.149 19.149 19.149 19.149 19.149 19.149 19.149 19.149 19.149 19.149 19.149
0.109 0.109 0.109 0.113 0.113 0.113 0.113 0.113 0.113 0.113 0.113 0.113 0.113 0.113 0.113
-6.058 -6.058 -6.058 -6.058 -6.058 -6.058 -6.058 -6.058 -6.058 -6.058 -6.058 -6.058 -6.058 -6.058 -6.058
0.265 0.265 0.265 0.271 0.271 0.271 0.271 0.271 0.271 0.271 0.271 0.271 0.271 0.271 0.271
-5.683 -5.683 -5.683 -5.675 -5.675 -5.675 -5.675 -5.675 -5.675 -5.675 -5.675 -5.675 -5.675 -5.675 -5.675
12.953 12.953 12.953 13.474 13.474 13.474 13.474 13.474 13.474 13.474 13.474 13.474 13.474 13.474 13.474
12.953 12.953 12.953 35.526 35.526 35.526 35.526 35.526 35.526 35.526 35.526 35.526 35.526 35.526 35.526
26,667 26,667 26,667 26,667 26,667 26,667 26,667 26,667 26,667 26,667 26,667 26,667 26,667 26,667 26,667

mill. EUR Net Present Value Internal Rate of Return
El. Full Load oper. Hours h/a El. Full Load oper. Hours h/a
Years Pay Off Time EUR/MWh Electricity Production Cost
El. Full Load oper. Hours h/a El. Full Load oper. Hours h/a
CCPP Power Plant in Base Load Mode
F-Class TurbineSensitivity Analysis - El. Full Load oper. Hours
64.832
-20.0
0.0
20.0
40.0
60.0
80.0
100.0
120.0
7400 7500 7600 7700 7800 7900 8000 8100 8200
17.5%
0%
5%
10%
15%
20%
25%
7400 7500 7600 7700 7800 7900 8000 8100 8200
9.2
0.0
5.0
10.0
15.0
20.0
25.0
7400 7500 7600 7700 7800 7900 8000 8100 8200
34.69
0.0
5.0
10.0
15.0
20.0
25.0
30.0
35.0
40.0
7400 7500 7600 7700 7800 7900 8000 8100 8200

mill. EUR Net Present Value Internal Rate of Return
El. Full Load oper. Hours h/a El. Full Load oper. Hours h/a
Years Pay Off Time EUR/MWh Electricity Production Cost
El. Full Load oper. Hours h/a El. Full Load oper. Hours h/a
CCPP Power Plant in Base Load Mode
E-Class TurbineSensitivity Analysis
51.899
0.0
10.0
20.0
30.0
40.0
50.0
60.0
70.0
80.0
7600 7700 7800 7900 8000 8100 8200 8300 8400
16.3%
0%
2%
4%
6%
8%
10%
12%
14%
16%
18%
20%
7600 7700 7800 7900 8000 8100 8200 8300 8400
10.3
0.0
5.0
10.0
15.0
20.0
25.0
7600 7700 7800 7900 8000 8100 8200 8300 8400
34.99
0.0
5.0
10.0
15.0
20.0
25.0
30.0
35.0
40.0
7600 7700 7800 7900 8000 8100 8200 8300 8400
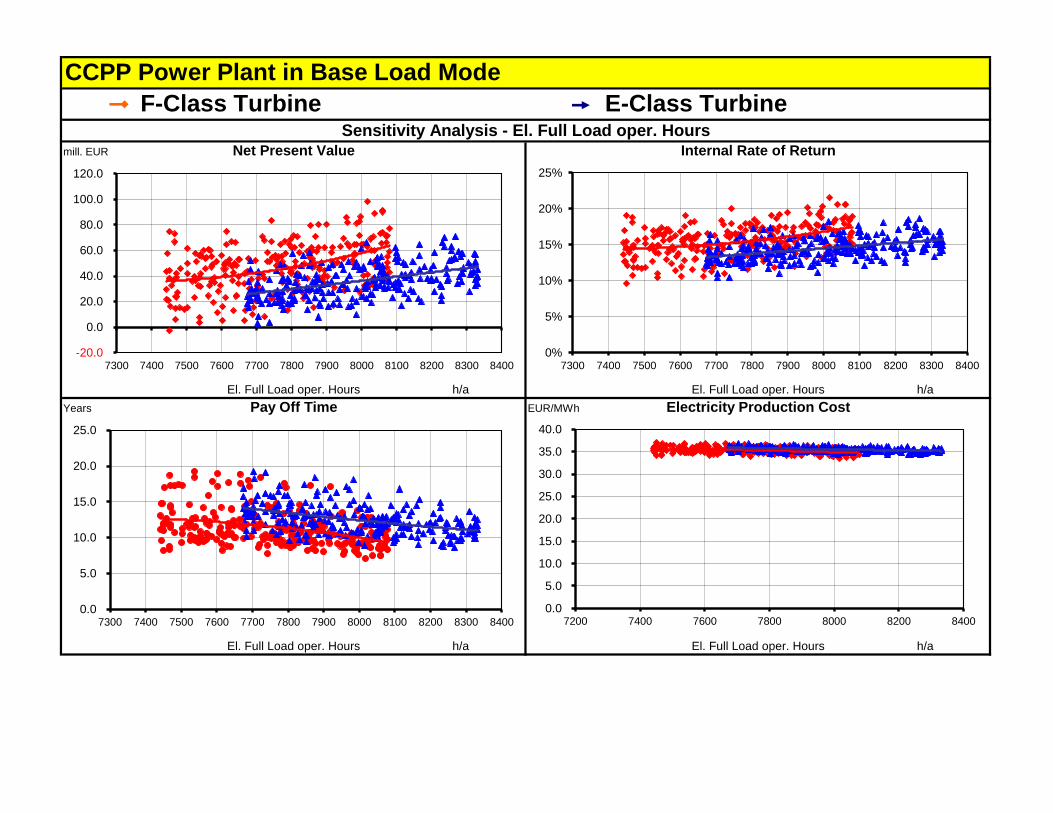
mill. EUR Net Present Value Internal Rate of Return
El. Full Load oper. Hours h/a El. Full Load oper. Hours h/a
Years Pay Off Time EUR/MWh Electricity Production Cost
El. Full Load oper. Hours h/a El. Full Load oper. Hours h/a
CCPP Power Plant in Base Load Mode
Sensitivity Analysis - El. Full Load oper. Hours
E-Class TurbineF-Class Turbine
-20.0
0.0
20.0
40.0
60.0
80.0
100.0
120.0
7300 7400 7500 7600 7700 7800 7900 8000 8100 8200 8300 84000%
5%
10%
15%
20%
25%
7300 7400 7500 7600 7700 7800 7900 8000 8100 8200 8300 8400
0.0
5.0
10.0
15.0
20.0
25.0
7300 7400 7500 7600 7700 7800 7900 8000 8100 8200 8300 8400
0.0
5.0
10.0
15.0
20.0
25.0
30.0
35.0
40.0
7200 7400 7600 7800 8000 8200 8400

mill. EUR Net Present Value Internal Rate of Return
El. Full Load oper. Hours h/a El. Full Load oper. Hours h/a
Years Pay Off Time EUR/MWh Electricity Production Cost
El. Full Load oper. Hours h/a El. Full Load oper. Hours h/a
CCPP Power Plant in Base Load Mode
Advantage F over E-ClassSensitivity Analysis
12.933
-40.0
-30.0
-20.0
-10.0
0.0
10.0
20.0
30.0
40.0
50.0
60.0
-255 -250 -245 -240 -235 -230
38.2%
0%
20%
40%
60%
80%
100%
120%
-255 -250 -245 -240 -235 -230
2.4
0.0
2.0
4.0
6.0
8.0
10.0
12.0
14.0
16.0
18.0
20.0
-255 -250 -245 -240 -235 -230
30.33
0.0
10.0
20.0
30.0
40.0
50.0
60.0
70.0
-255 -250 -245 -240 -235 -230

mill. EUR Net Present Value Internal Rate of Return
Years Pay Off Time EUR/MWh Electricity Production Cost
CCPP Power Plant in Base Load Mode
F-Class TurbineMultiple Sensitivity Analysis
-100.0
-50.0
0.0
50.0
100.0
150.0
200.0
90% 92% 94% 96% 98% 100% 102% 104% 106% 108% 110%
0.0
5.0
10.0
15.0
20.0
25.0
90% 92% 94% 96% 98% 100% 102% 104% 106% 108% 110%
0.0%
5.0%
10.0%
15.0%
20.0%
25.0%
30.0%
35.0%
90% 92% 94% 96% 98% 100% 102% 104% 106% 108% 110%
32.0
33.0
34.0
35.0
36.0
37.0
38.0
90% 92% 94% 96% 98% 100% 102% 104% 106% 108% 110%
Electrical Net Power El. Full Load oper. Hours El. net Efficiency Investment Volume Fuel Variable Rev. Electr.

mill. EUR Net Present Value Internal Rate of Return
Years Pay Off Time EUR/MWh Electricity Production Cost
CCPP Power Plant in Base Load Mode
E-Class TurbineMultiple Sensitivity Analysis
-100.0
-50.0
0.0
50.0
100.0
150.0
200.0
90% 92% 94% 96% 98% 100% 102% 104% 106% 108% 110%
0.0
2.0
4.0
6.0
8.0
10.0
12.0
14.0
16.0
18.0
20.0
90% 92% 94% 96% 98% 100% 102% 104% 106% 108% 110%
0.0%
5.0%
10.0%
15.0%
20.0%
25.0%
30.0%
90% 92% 94% 96% 98% 100% 102% 104% 106% 108% 110%
32.0
33.0
34.0
35.0
36.0
37.0
38.0
90% 92% 94% 96% 98% 100% 102% 104% 106% 108% 110%
Electrical Net Power El. Full Load oper. Hours El. net Efficiency Investment Volume Fuel Variable Rev. Electr.

mill. EUR Net Present Value Internal Rate of Return
Years Pay Off Time EUR/MWh Electricity Production Cost
CCPP Power Plant in Base Load Mode
Advantage F over E-ClassMultiple Sensitivity Analysis
0.0
5.0
10.0
15.0
20.0
25.0
90% 92% 94% 96% 98% 100% 102% 104% 106% 108% 110%
0.0
1.0
2.0
3.0
4.0
5.0
6.0
90% 92% 94% 96% 98% 100% 102% 104% 106% 108% 110%
0.0%
10.0%
20.0%
30.0%
40.0%
50.0%
60.0%
90% 92% 94% 96% 98% 100% 102% 104% 106% 108% 110%
0.0
5.0
10.0
15.0
20.0
25.0
30.0
35.0
40.0
90% 92% 94% 96% 98% 100% 102% 104% 106% 108% 110%
Electrical Net Power El. Full Load oper. Hours El. net Efficiency Investment Volume Fuel Variable Rev. Electr.
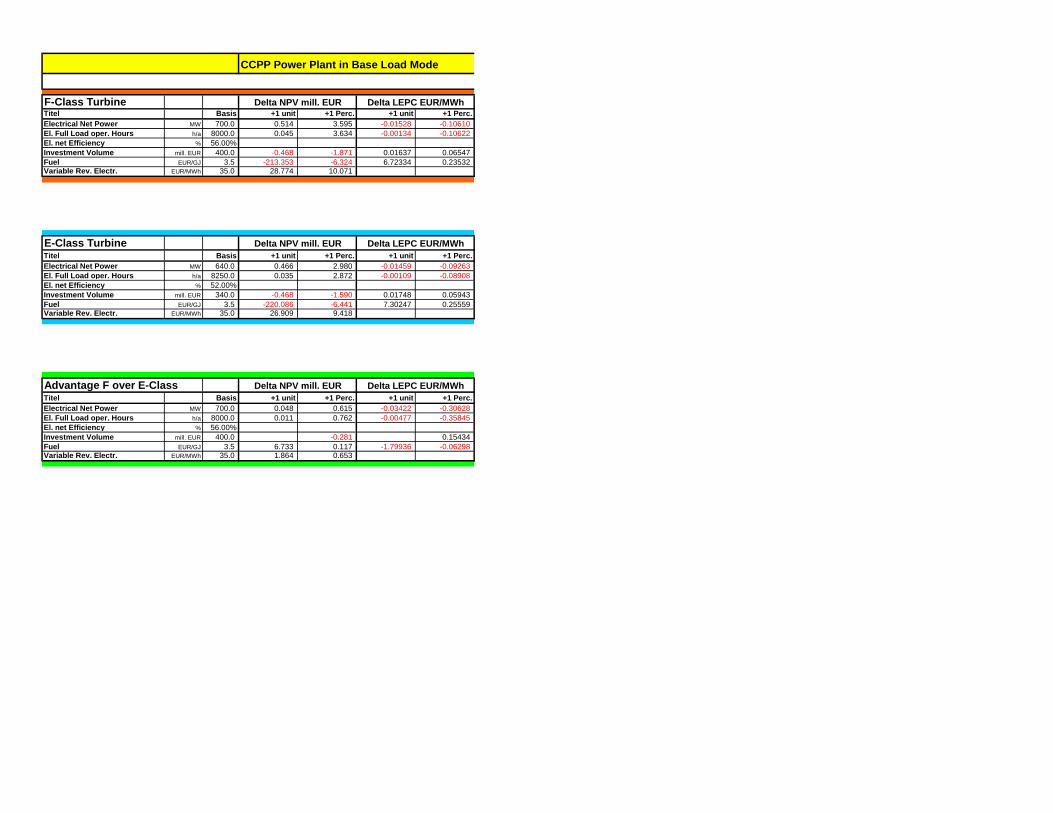
F-Class TurbineTitel Basis +1 unit +1 Perc. +1 unit +1 Perc.
Electrical Net Power MW 700.0 0.514 3.595 -0.01528 -0.10610
El. Full Load oper. Hours h/a 8000.0 0.045 3.634 -0.00134 -0.10622
El. net Efficiency % 56.00%
Investment Volume mill. EUR 400.0 -0.468 -1.871 0.01637 0.06547
Fuel EUR/GJ 3.5 -213.353 -6.324 6.72334 0.23532Variable Rev. Electr. EUR/MWh 35.0 28.774 10.071
E-Class TurbineTitel Basis +1 unit +1 Perc. +1 unit +1 Perc.
Electrical Net Power MW 640.0 0.466 2.980 -0.01459 -0.09263
El. Full Load oper. Hours h/a 8250.0 0.035 2.872 -0.00109 -0.08908
El. net Efficiency % 52.00%
Investment Volume mill. EUR 340.0 -0.468 -1.590 0.01748 0.05943
Fuel EUR/GJ 3.5 -220.086 -6.441 7.30247 0.25559Variable Rev. Electr. EUR/MWh 35.0 26.909 9.418
Advantage F over E-ClassTitel Basis +1 unit +1 Perc. +1 unit +1 Perc.
Electrical Net Power MW 700.0 0.048 0.615 -0.03422 -0.30628
El. Full Load oper. Hours h/a 8000.0 0.011 0.762 -0.00477 -0.35845
El. net Efficiency % 56.00%
Investment Volume mill. EUR 400.0 -0.281 0.15434
Fuel EUR/GJ 3.5 6.733 0.117 -1.79936 -0.06298 Variable Rev. Electr. EUR/MWh 35.0 1.864 0.653
Delta NPV mill. EUR Delta LEPC EUR/MWh
Delta NPV mill. EUR Delta LEPC EUR/MWh
Delta NPV mill. EUR Delta LEPC EUR/MWh
CCPP Power Plant in Base Load Mode

F-Class TurbineTitel Basis
Electrical Net Power MW 700.0
El. Full Load oper. Hours h/a 8000.0
El. net Efficiency % 56.00%
Investment Volume mill. EUR 400.0
Fuel EUR/GJ 3.5Variable Rev. Electr. EUR/MWh 35.0
E-Class TurbineTitel Basis
Electrical Net Power MW 640.0
El. Full Load oper. Hours h/a 8250.0
El. net Efficiency % 52.00%
Investment Volume mill. EUR 340.0
Fuel EUR/GJ 3.5Variable Rev. Electr. EUR/MWh 35.0
Advantage F over E-ClassTitel Basis
Electrical Net Power MW 700.0
El. Full Load oper. Hours h/a 8000.0
El. net Efficiency % 56.00%
Investment Volume mill. EUR 400.0
Fuel EUR/GJ 3.5Variable Rev. Electr. EUR/MWh 35.0
Net Present Value 64.83 mill. EUR Pay Off Time 9.2 Years90.0% 92.0% 94.0% 96.0% 98.0% 99.0% 100.0% 101.0% 102.0% 104.0% 106.0% 108.0% 110.0% 90.0% 92.0% 94.0% 96.0% 98.0% 99.0% 100.0% 101.0% 102.0% 104.0% 106.0%
28.881 36.071 43.261 50.451 57.641 61.237 64.832 68.427 72.022 79.212 86.402 93.592 100.782 13.20 12.08 11.17 10.39 9.74 9.44 9.17 8.92 8.68 8.24 7.86
28.489 35.758 43.026 50.295 57.563 61.197 64.832 68.466 72.100 79.369 86.637 93.906 101.174 13.29 12.14 11.20 10.42 9.75 9.45 9.17 8.91 8.67 8.23 7.84
83.540 79.798 76.057 72.315 68.573 66.702 64.832 62.961 61.090 57.348 53.607 49.865 46.123 7.60 7.88 8.18 8.49 8.82 8.99 9.17 9.35 9.54 9.94 10.36
128.068 115.421 102.774 90.126 77.479 71.155 64.832 58.508 52.184 39.537 26.890 13.792 -0.136 5.68 6.17 6.73 7.40 8.19 8.66 9.17 9.75 10.39 11.97 14.07-44.940 -20.473 2.854 24.546 44.690 54.761 64.832 74.902 84.973 105.115 125.257 145.398 165.540 19.37 14.37 11.18 10.07 9.17 8.42 7.79 6.77 5.98
Net Present Value 51.9 mill. EUR Pay Off Time 10.3 Years
90.0% 92.0% 94.0% 96.0% 98.0% 99.0% 100.0% 101.0% 102.0% 104.0% 106.0% 108.0% 110.0% 90.0% 92.0% 94.0% 96.0% 98.0% 99.0% 100.0% 101.0% 102.0% 104.0% 106.0%
22.097 28.057 34.018 39.978 45.939 48.919 51.899 54.879 57.859 63.820 69.780 75.741 81.701 14.56 13.39 12.43 11.63 10.94 10.61 10.32 10.04 9.78 9.30 8.88
23.179 28.923 34.667 40.411 46.155 49.027 51.899 54.771 57.643 63.387 69.131 74.875 80.619 14.28 13.20 12.31 11.55 10.90 10.60 10.32 10.05 9.81 9.35 8.95
67.801 64.621 61.440 58.260 55.079 53.489 51.899 50.309 48.719 45.538 42.358 39.177 35.997 8.63 8.93 9.25 9.59 9.94 10.13 10.32 10.51 10.72 11.13 11.57
116.306 103.424 90.543 77.662 64.780 58.340 51.899 45.458 39.018 26.136 13.255 -0.257 -14.632 5.98 6.55 7.23 8.05 9.05 9.65 10.32 11.08 11.94 14.10 17.54-50.676 -27.788 -5.958 14.226 33.062 42.481 51.899 61.317 70.735 89.572 108.409 127.245 146.082 17.33 12.75 11.41 10.32 9.41 8.65 7.45 6.54
Net Present Value 12.93 mill. EUR Pay Off Time 2.4 Years
90.0% 92.0% 94.0% 96.0% 98.0% 99.0% 100.0% 101.0% 102.0% 104.0% 106.0% 108.0% 110.0% 90.0% 92.0% 94.0% 96.0% 98.0% 99.0% 100.0% 101.0% 102.0% 104.0% 106.0%
6.784 8.014 9.244 10.473 11.703 12.318 12.933 13.547 14.162 15.392 16.622 17.851 19.081 3.24 3.01 2.82 2.66 2.53 2.47 2.42 2.37 2.32 2.24 2.16
5.310 6.834 8.359 9.883 11.408 12.170 12.933 13.695 14.457 15.982 17.506 19.031 20.556 4.78 4.08 3.53 3.09 2.73 2.57 2.42 2.28 2.16 1.94 1.84
15.739 15.178 14.616 14.055 13.494 13.213 12.933 12.652 12.371 11.810 11.249 10.688 10.126 1.79 1.86 1.93 2.08 2.25 2.33 2.42 2.51 2.60 2.79 2.99
11.762 11.996 12.231 12.465 12.699 12.816 12.933 13.050 13.167 13.401 13.635 14.049 14.497 2.78 2.71 2.63 2.56 2.49 2.45 2.42 2.38 2.35 2.29 2.225.736 7.315 8.812 10.321 11.627 12.280 12.933 13.585 14.238 15.543 16.848 18.153 19.458 4.55 3.88 3.36 2.92 2.65 2.53 2.42 2.31 2.22 2.04 1.90
CCPP Power Plant in Base Load ModeMultiple Sensitivity Analysis

F-Class TurbineTitel Basis
Electrical Net Power MW 700.0
El. Full Load oper. Hours h/a 8000.0
El. net Efficiency % 56.00%
Investment Volume mill. EUR 400.0
Fuel EUR/GJ 3.5Variable Rev. Electr. EUR/MWh 35.0
E-Class TurbineTitel Basis
Electrical Net Power MW 640.0
El. Full Load oper. Hours h/a 8250.0
El. net Efficiency % 52.00%
Investment Volume mill. EUR 340.0
Fuel EUR/GJ 3.5Variable Rev. Electr. EUR/MWh 35.0
Advantage F over E-ClassTitel Basis
Electrical Net Power MW 700.0
El. Full Load oper. Hours h/a 8000.0
El. net Efficiency % 56.00%
Investment Volume mill. EUR 400.0
Fuel EUR/GJ 3.5Variable Rev. Electr. EUR/MWh 35.0
108.0% 110.0%
7.51 7.21
7.49 7.17
10.81 11.28
17.595.35 4.85
108.0% 110.0%
8.49 8.15
8.59 8.26
12.04 12.54
5.83 5.25
108.0% 110.0%
2.10 2.04
1.75 1.67
3.20 3.42
2.15 2.091.84 1.77
CCPP Power Plant in Base Load ModeMultiple Sensitivity Analysis
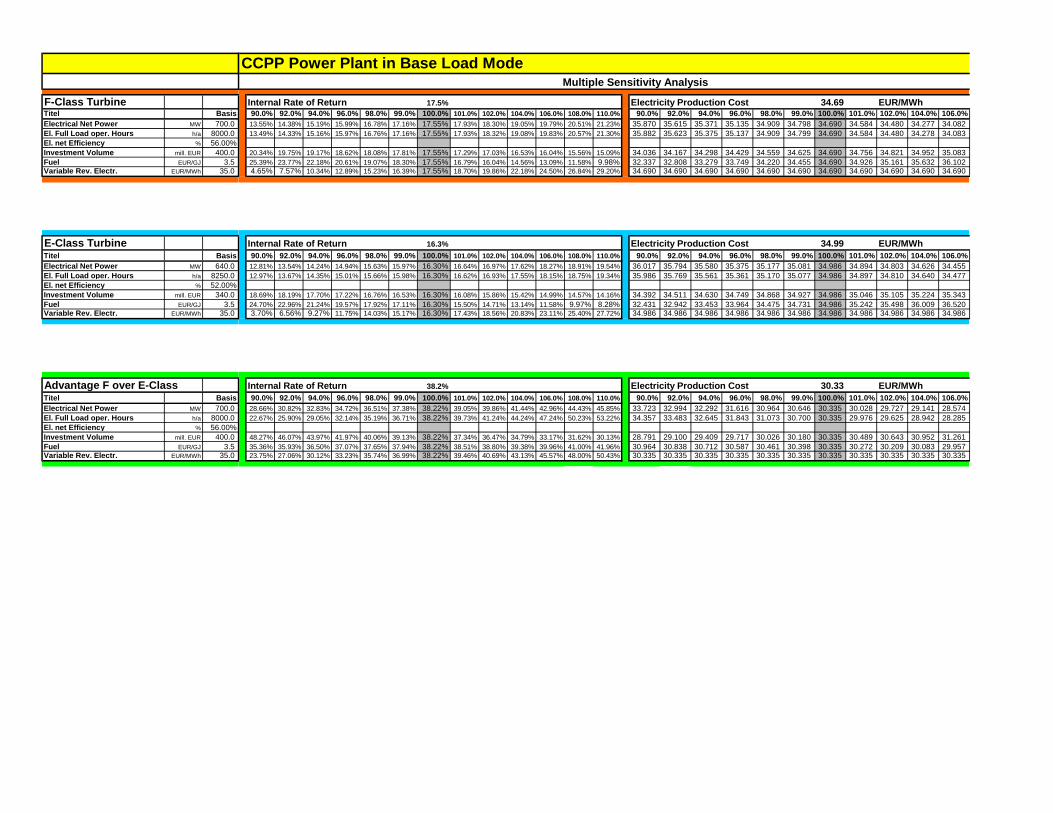
F-Class TurbineTitel Basis
Electrical Net Power MW 700.0
El. Full Load oper. Hours h/a 8000.0
El. net Efficiency % 56.00%
Investment Volume mill. EUR 400.0
Fuel EUR/GJ 3.5Variable Rev. Electr. EUR/MWh 35.0
E-Class TurbineTitel Basis
Electrical Net Power MW 640.0
El. Full Load oper. Hours h/a 8250.0
El. net Efficiency % 52.00%
Investment Volume mill. EUR 340.0
Fuel EUR/GJ 3.5Variable Rev. Electr. EUR/MWh 35.0
Advantage F over E-ClassTitel Basis
Electrical Net Power MW 700.0
El. Full Load oper. Hours h/a 8000.0
El. net Efficiency % 56.00%
Investment Volume mill. EUR 400.0
Fuel EUR/GJ 3.5Variable Rev. Electr. EUR/MWh 35.0
Internal Rate of Return 17.5% Electricity Production Cost 34.69 EUR/MWh90.0% 92.0% 94.0% 96.0% 98.0% 99.0% 100.0% 101.0% 102.0% 104.0% 106.0% 108.0% 110.0% 90.0% 92.0% 94.0% 96.0% 98.0% 99.0% 100.0% 101.0% 102.0% 104.0% 106.0%
13.55% 14.38% 15.19% 15.99% 16.78% 17.16% 17.55% 17.93% 18.30% 19.05% 19.79% 20.51% 21.23% 35.870 35.615 35.371 35.135 34.909 34.798 34.690 34.584 34.480 34.277 34.082
13.49% 14.33% 15.16% 15.97% 16.76% 17.16% 17.55% 17.93% 18.32% 19.08% 19.83% 20.57% 21.30% 35.882 35.623 35.375 35.137 34.909 34.799 34.690 34.584 34.480 34.278 34.083
20.34% 19.75% 19.17% 18.62% 18.08% 17.81% 17.55% 17.29% 17.03% 16.53% 16.04% 15.56% 15.09% 34.036 34.167 34.298 34.429 34.559 34.625 34.690 34.756 34.821 34.952 35.083
25.39% 23.77% 22.18% 20.61% 19.07% 18.30% 17.55% 16.79% 16.04% 14.56% 13.09% 11.58% 9.98% 32.337 32.808 33.279 33.749 34.220 34.455 34.690 34.926 35.161 35.632 36.1024.65% 7.57% 10.34% 12.89% 15.23% 16.39% 17.55% 18.70% 19.86% 22.18% 24.50% 26.84% 29.20% 34.690 34.690 34.690 34.690 34.690 34.690 34.690 34.690 34.690 34.690 34.690
Internal Rate of Return 16.3% Electricity Production Cost 34.99 EUR/MWh
90.0% 92.0% 94.0% 96.0% 98.0% 99.0% 100.0% 101.0% 102.0% 104.0% 106.0% 108.0% 110.0% 90.0% 92.0% 94.0% 96.0% 98.0% 99.0% 100.0% 101.0% 102.0% 104.0% 106.0%
12.81% 13.54% 14.24% 14.94% 15.63% 15.97% 16.30% 16.64% 16.97% 17.62% 18.27% 18.91% 19.54% 36.017 35.794 35.580 35.375 35.177 35.081 34.986 34.894 34.803 34.626 34.455
12.97% 13.67% 14.35% 15.01% 15.66% 15.98% 16.30% 16.62% 16.93% 17.55% 18.15% 18.75% 19.34% 35.986 35.769 35.561 35.361 35.170 35.077 34.986 34.897 34.810 34.640 34.477
18.69% 18.19% 17.70% 17.22% 16.76% 16.53% 16.30% 16.08% 15.86% 15.42% 14.99% 14.57% 14.16% 34.392 34.511 34.630 34.749 34.868 34.927 34.986 35.046 35.105 35.224 35.343
24.70% 22.96% 21.24% 19.57% 17.92% 17.11% 16.30% 15.50% 14.71% 13.14% 11.58% 9.97% 8.28% 32.431 32.942 33.453 33.964 34.475 34.731 34.986 35.242 35.498 36.009 36.5203.70% 6.56% 9.27% 11.75% 14.03% 15.17% 16.30% 17.43% 18.56% 20.83% 23.11% 25.40% 27.72% 34.986 34.986 34.986 34.986 34.986 34.986 34.986 34.986 34.986 34.986 34.986
Internal Rate of Return 38.2% Electricity Production Cost 30.33 EUR/MWh
90.0% 92.0% 94.0% 96.0% 98.0% 99.0% 100.0% 101.0% 102.0% 104.0% 106.0% 108.0% 110.0% 90.0% 92.0% 94.0% 96.0% 98.0% 99.0% 100.0% 101.0% 102.0% 104.0% 106.0%
28.66% 30.82% 32.83% 34.72% 36.51% 37.38% 38.22% 39.05% 39.86% 41.44% 42.96% 44.43% 45.85% 33.723 32.994 32.292 31.616 30.964 30.646 30.335 30.028 29.727 29.141 28.574
22.67% 25.90% 29.05% 32.14% 35.19% 36.71% 38.22% 39.73% 41.24% 44.24% 47.24% 50.23% 53.22% 34.357 33.483 32.645 31.843 31.073 30.700 30.335 29.976 29.625 28.942 28.285
48.27% 46.07% 43.97% 41.97% 40.06% 39.13% 38.22% 37.34% 36.47% 34.79% 33.17% 31.62% 30.13% 28.791 29.100 29.409 29.717 30.026 30.180 30.335 30.489 30.643 30.952 31.261
35.36% 35.93% 36.50% 37.07% 37.65% 37.94% 38.22% 38.51% 38.80% 39.38% 39.96% 41.00% 41.96% 30.964 30.838 30.712 30.587 30.461 30.398 30.335 30.272 30.209 30.083 29.95723.75% 27.06% 30.12% 33.23% 35.74% 36.99% 38.22% 39.46% 40.69% 43.13% 45.57% 48.00% 50.43% 30.335 30.335 30.335 30.335 30.335 30.335 30.335 30.335 30.335 30.335 30.335
CCPP Power Plant in Base Load ModeMultiple Sensitivity Analysis
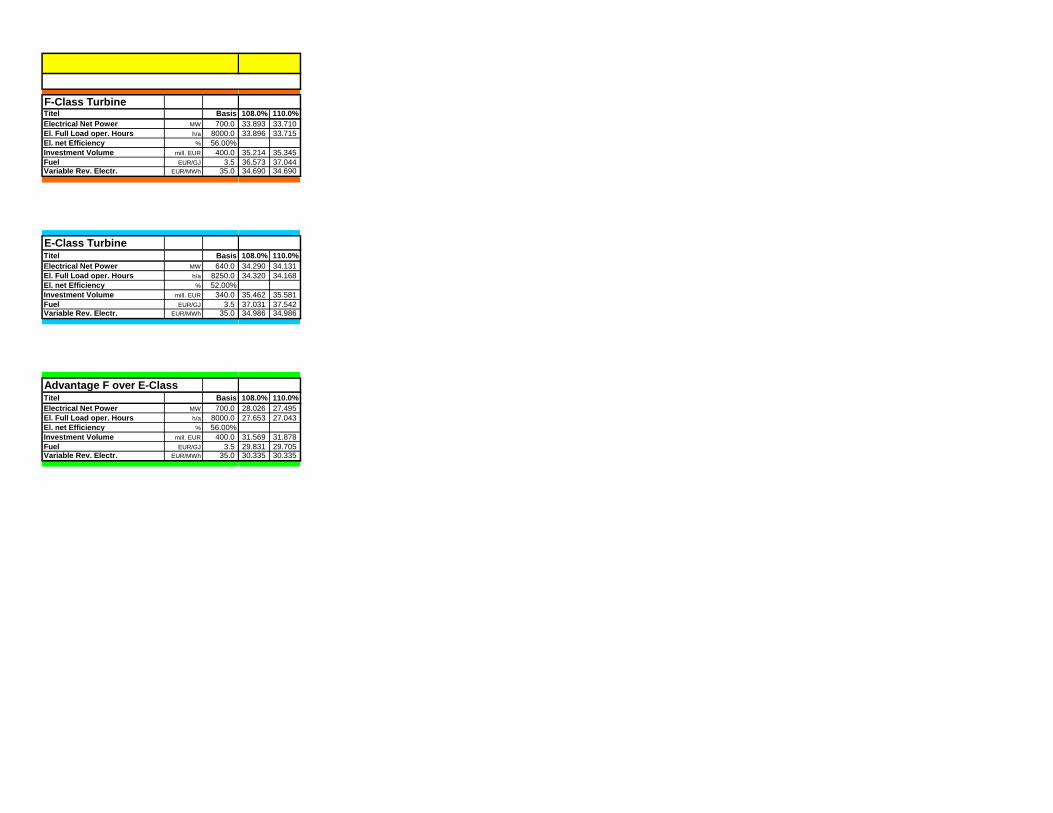
F-Class TurbineTitel Basis
Electrical Net Power MW 700.0
El. Full Load oper. Hours h/a 8000.0
El. net Efficiency % 56.00%
Investment Volume mill. EUR 400.0
Fuel EUR/GJ 3.5Variable Rev. Electr. EUR/MWh 35.0
E-Class TurbineTitel Basis
Electrical Net Power MW 640.0
El. Full Load oper. Hours h/a 8250.0
El. net Efficiency % 52.00%
Investment Volume mill. EUR 340.0
Fuel EUR/GJ 3.5Variable Rev. Electr. EUR/MWh 35.0
Advantage F over E-ClassTitel Basis
Electrical Net Power MW 700.0
El. Full Load oper. Hours h/a 8000.0
El. net Efficiency % 56.00%
Investment Volume mill. EUR 400.0
Fuel EUR/GJ 3.5Variable Rev. Electr. EUR/MWh 35.0
108.0% 110.0%
33.893 33.710
33.896 33.715
35.214 35.345
36.573 37.04434.690 34.690
108.0% 110.0%
34.290 34.131
34.320 34.168
35.462 35.581
37.031 37.54234.986 34.986
108.0% 110.0%
28.026 27.495
27.653 27.043
31.569 31.878
29.831 29.70530.335 30.335
CCPP Power Plant in Base Load ModeMultiple Sensitivity Analysis

mill. EUR Net Present Value X Y Internal Rate of Return X Y
EUR/GJ mill. EUR EUR/GJ %
3.15 128.07 3.15 25.4%
3.33 96.45 3.33 21.4%
3.47 71.16 3.47 18.3%
3.50 64.83 3.50 17.5%
3.54 58.51 3.54 16.8%
3.68 33.21 3.68 13.8%
3.85 -0.14 3.85 10.0%
4.38 -117.69 4.38
Fuel EUR/GJ Fuel EUR/GJ
Years Pay Off Time X Y EUR/MWh Electricity Production Cost X Y
EUR/GJ Years EUR/GJ EUR/MWh
3.15 5.68 3.15 32.34
3.33 7.05 3.33 33.51
3.47 8.66 3.47 34.46
3.50 9.17 3.50 34.69
3.54 9.75 3.54 34.93
3.68 12.93 3.68 35.87
3.85 3.85 37.04
4.38 4.38 40.57
Fuel EUR/GJ Fuel EUR/GJ
F-Class Turbine
CCPP Power Plant in Base Load Mode
Sensitivity Analysis - Fuel
-150.0
-100.0
-50.0
0.0
50.0
100.0
150.0
2.00 2.50 3.00 3.50 4.00 4.500%
5%
10%
15%
20%
25%
30%
2.00 2.50 3.00 3.50 4.00 4.50
0.0
2.0
4.0
6.0
8.0
10.0
12.0
14.0
2.00 2.50 3.00 3.50 4.00 4.50
0.0
5.0
10.0
15.0
20.0
25.0
30.0
35.0
40.0
45.0
2.00 2.50 3.00 3.50 4.00 4.50

mill. EUR Net Present Value X Y Internal Rate of Return X Y
EUR/GJ mill. EUR EUR/GJ %
3.15 116.31 3.15 24.7%
3.33 84.10 3.33 20.4%
3.47 58.34 3.47 17.1%
3.50 51.90 3.50 16.3%
3.54 45.46 3.54 15.5%
3.68 19.70 3.68 12.4%
3.85 -14.63 3.85 8.3%
4.38 -136.53 4.38
Fuel EUR/GJ Fuel EUR/GJ
Years Pay Off Time X Y EUR/MWh Electricity Production Cost X Y
EUR/GJ Years EUR/GJ EUR/MWh
3.15 5.98 3.15 32.43
3.33 7.62 3.33 33.71
3.47 9.65 3.47 34.73
3.50 10.32 3.50 34.99
3.54 11.08 3.54 35.24
3.68 15.91 3.68 36.26
3.85 3.85 37.54
4.38 4.38 41.38
Fuel EUR/GJ Fuel EUR/GJ
CCPP Power Plant in Base Load Mode
E-Class TurbineSensitivity Analysis - Fuel
-150.0
-100.0
-50.0
0.0
50.0
100.0
150.0
2.00 2.50 3.00 3.50 4.00 4.500%
5%
10%
15%
20%
25%
30%
2.00 2.50 3.00 3.50 4.00 4.50
0.0
2.0
4.0
6.0
8.0
10.0
12.0
14.0
16.0
18.0
2.00 2.50 3.00 3.50 4.00 4.500.0
5.0
10.0
15.0
20.0
25.0
30.0
35.0
40.0
45.0
2.00 2.50 3.00 3.50 4.00 4.50
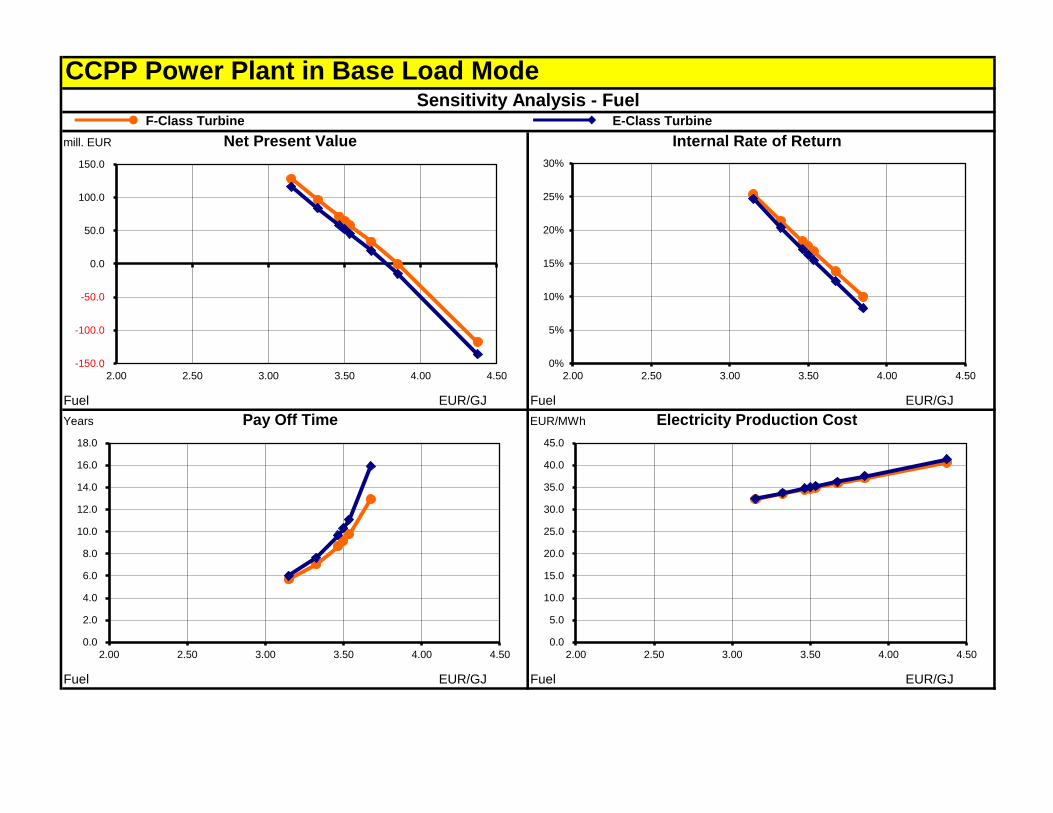
mill. EUR Net Present Value Internal Rate of Return
Fuel EUR/GJ Fuel EUR/GJ
Years Pay Off Time EUR/MWh Electricity Production Cost
Fuel EUR/GJ Fuel EUR/GJ
CCPP Power Plant in Base Load ModeSensitivity Analysis - Fuel
E-Class TurbineF-Class Turbine
-150.0
-100.0
-50.0
0.0
50.0
100.0
150.0
2.00 2.50 3.00 3.50 4.00 4.50
0%
5%
10%
15%
20%
25%
30%
2.00 2.50 3.00 3.50 4.00 4.50
0.0
2.0
4.0
6.0
8.0
10.0
12.0
14.0
16.0
18.0
2.00 2.50 3.00 3.50 4.00 4.50
0.0
5.0
10.0
15.0
20.0
25.0
30.0
35.0
40.0
45.0
2.00 2.50 3.00 3.50 4.00 4.50

mill. EUR Net Present Value X (A) X (B) Y Internal Rate of Return X (A) X (B) Y
EUR/GJ EUR/GJ mill. EUR EUR/GJ EUR/GJ %
3.15 3.15 11.76 3.15 3.15 35.4%
3.33 3.33 12.35 3.33 3.33 36.8%
3.47 3.47 12.82 3.47 3.47 37.9%
3.50 3.50 12.93 3.50 3.50 38.2%
3.54 3.54 13.05 3.54 3.54 38.5%
3.68 3.68 13.52 3.68 3.68 39.7%
3.85 3.85 14.50 3.85 3.85 42.0%
4.38 4.38 18.84 4.38 4.38 50.9%
Fuel EUR/GJ Fuel EUR/GJ
Years Pay Off Time X (A) X (B) Y EUR/MWh Electricity Production Cost X (A) X (B) Y
EUR/GJ EUR/GJ Years EUR/GJ EUR/GJ EUR/MWh
3.15 3.15 2.78 3.15 3.15 30.96
3.33 3.33 2.59 3.33 3.33 30.65
3.47 3.47 2.45 3.47 3.47 30.40
3.50 3.50 2.42 3.50 3.50 30.33
3.54 3.54 2.38 3.54 3.54 30.27
3.68 3.68 2.25 3.68 3.68 30.02
3.85 3.85 2.09 3.85 3.85 29.70
4.38 4.38 1.67 4.38 4.38 28.76
Fuel EUR/GJ Fuel EUR/GJ
CCPP Power Plant in Base Load Mode
Advantage F over E-ClassSensitivity Analysis - Fuel
0.0
2.0
4.0
6.0
8.0
10.0
12.0
14.0
16.0
18.0
20.0
2.00 2.50 3.00 3.50 4.00 4.50
0%
10%
20%
30%
40%
50%
60%
2.00 2.50 3.00 3.50 4.00 4.50
0.0
0.5
1.0
1.5
2.0
2.5
3.0
2.00 2.50 3.00 3.50 4.00 4.50
0.0
5.0
10.0
15.0
20.0
25.0
30.0
35.0
2.00 2.50 3.00 3.50 4.00 4.50
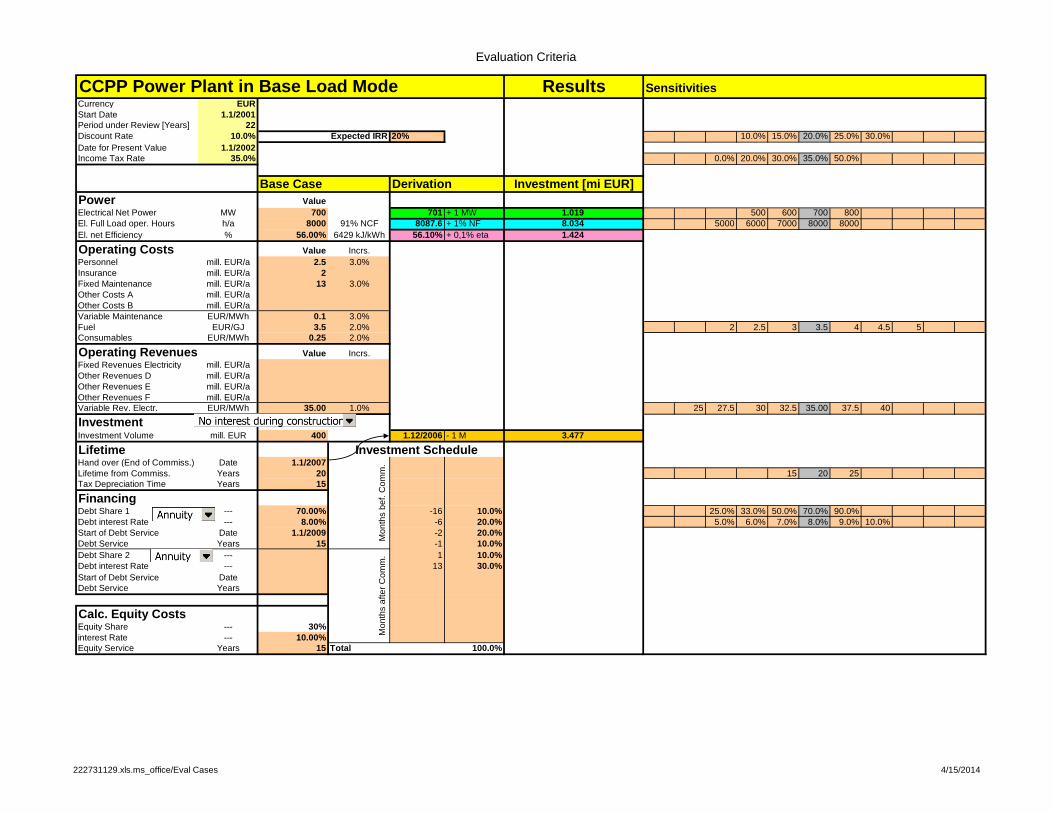
Evaluation Criteria
CCPP Power Plant in Base Load Mode ResultsCurrency EUR
Start Date 1.1/2001
Period under Review [Years] 22
Discount Rate 10.0% Expected IRR 20% 10.0% 15.0% 20.0% 25.0% 30.0%
Date for Present Value 1.1/2002
Income Tax Rate 35.0% 0.0% 20.0% 30.0% 35.0% 50.0%
Base Case Investment [mi EUR]
Power Value
Electrical Net Power MW 700 701 + 1 MW 1.019 500 600 700 800
El. Full Load oper. Hours h/a 8000 91% NCF 8087.6 + 1% NF 8.034 5000 6000 7000 8000 8000
El. net Efficiency % 56.00% 6429 kJ/kWh 56.10% + 0,1% eta 1.424
Operating Costs Value Incrs.
Personnel mill. EUR/a 2.5 3.0%
Insurance mill. EUR/a 2
Fixed Maintenance mill. EUR/a 13 3.0%
Other Costs A mill. EUR/a
Other Costs B mill. EUR/a
Variable Maintenance EUR/MWh 0.1 3.0%
Fuel EUR/GJ 3.5 2.0% 2 2.5 3 3.5 4 4.5 5
Consumables EUR/MWh 0.25 2.0%
Operating Revenues Value Incrs.
Fixed Revenues Electricity mill. EUR/a
Other Revenues D mill. EUR/a
Other Revenues E mill. EUR/a
Other Revenues F mill. EUR/a
Variable Rev. Electr. EUR/MWh 35.00 1.0% 25 27.5 30 32.5 35.00 37.5 40
InvestmentInvestment Volume mill. EUR 400 1.12/2006 - 1 M 3.477
LifetimeHand over (End of Commiss.) Date 1.1/2007
Lifetime from Commiss. Years 20 15 20 25
Tax Depreciation Time Years 15
FinancingDebt Share 1 --- 70.00% -16 10.0% 25.0% 33.0% 50.0% 70.0% 90.0%
Debt interest Rate --- 8.00% -6 20.0% 5.0% 6.0% 7.0% 8.0% 9.0% 10.0%
Start of Debt Service Date 1.1/2009 -2 20.0%
Debt Service Years 15 -1 10.0%
Debt Share 2 --- 1 10.0%
Debt interest Rate --- 13 30.0%
Start of Debt Service Date
Debt Service Years
Calc. Equity CostsEquity Share --- 30%
interest Rate --- 10.00%
Equity Service Years 15 Total 100.0%
Sensitivities
Mo
nth
s a
fte
r C
om
m.
Mo
nth
s b
ef. C
om
m.
Derivation
Investment Schedule
222731129.xls.ms_office/Eval Cases 4/15/2014

Evaluation Criteria: Results
Variation Sensitivity +1 MW Power Sensitivity +0.1% EfficiencyExpected IRR
Investment [mi EUR]
Income Tax Rate
Investment [mi EUR]
Electrical Net Power
Investment [mi EUR]
El. Full Load oper. Hours
Investment [mi EUR]
Fuel
Investment [mi EUR]
Variable Rev. Electr.
Investment [mi EUR]
Lifetime from Commiss.
Investment [mi EUR]
Debt Share 1
Investment [mi EUR]
Debt interest Rate
Investment [mi EUR]
Variation Sensitivity +1% NCF Sensitivity -1 Month lead timeExpected IRR
Investment [mi EUR]
Income Tax Rate
Investment [mi EUR]
Electrical Net Power
Investment [mi EUR]
El. Full Load oper. Hours
Investment [mi EUR]
Fuel
Investment [mi EUR]
Variable Rev. Electr.
Investment [mi EUR]
Lifetime from Commiss.
Investment [mi EUR]
Debt Share 1
Investment [mi EUR]
Debt interest Rate
Investment [mi EUR]
222731129.xls.ms_office/Eval Table 4/15/2014

222731129.xls.ms_office/Eval ETA-IRR 4/15/2014
0.0
0.2
0.4
0.6
0.8
1.0
1.2
0.0% 20.0% 40.0% 60.0% 80.0% 100.0% 120.0%
Inv
estm
en
t [m
i E
UR
]
Expected IRR
Sensitivity +0.1% Efficiency: Expected IRR
EUR