pgem q2 2015 earnings slides final
TRANSCRIPT

August 10, 2015
Ply Gem Holdings
Second Quarter 2015 Results
Gary E. Robinette Shawn K. Poe Chairman & Chief Executive Officer Chief Financial Officer

Legal Disclaimer
1
These slides and the accompanying oral discussion may contain “forward-looking statements” within the meaning of the Private Securities Litigation Reform Act of 1995. Such statements involve known and unknown risks, uncertainties and other factors that could cause the actual results of Ply Gem Holdings, Inc. (the “Company”) to differ materially from the results expressed or implied, including: downturns in the home repair and remodeling or the new construction end markets, or the economy or the availability of consumer credit; competition from other exterior building products manufacturers and alternative building materials; inability to successfully develop new products or improve existing products; changes in the costs and availability of raw materials; consolidation and further growth of our customers; loss of, or a reduction in orders from, any of our significant customers; inclement weather conditions; increases in union organizing activity and work stoppages at our facilities or the facilities of our suppliers; our ability to employ, train and retain qualified personnel at a competitive cost; claims arising from the operations of our various businesses prior to our acquisitions; product liability claims, including class action claims, relating to the products we manufacture; litigation outside of product liability claims; loss of certain key personnel; interruptions in deliveries of raw materials or finished goods; environmental costs and liabilities; inability to realize anticipated synergies and cost savings with respect to acquisitions; manufacturing or assembly realignments; threats to, or impairments of, our intellectual property rights; increases in fuel costs; changes in foreign currency exchange and interest rates; material non-cash impairment charges; our significant amount of indebtedness; covenants in the ABL Facility, the credit agreement governing our Senior Secured Term Loan Facility and the indenture governing the 6.50% Senior Notes; limitations on our net operating losses and payments under the tax receivable agreement to our current stockholders; failure to successfully consummate and integrate future acquisitions; actual or perceived security vulnerabilities or cyberattacks on our networks; failure to effectively manage labor inefficiencies associated with increased productions and new employees added to the Company; failure to generate sufficient cash to service all of our indebtedness and make capital expenditures; control by the CI Partnerships; failure to maintain effective internal controls over financial reporting; and the risks set forth in the Company’s filings with the Securities and Exchange Commission. Consequently such forward-looking statements should be regarded as the Company’s current plans, estimates and beliefs. Except as required by law, the Company does not undertake and specifically declines any obligation to publicly release the results of any revisions to these forward-looking statements that may be made to reflect any future events or circumstances after the date of such statements or to reflect the occurrence of anticipated or unanticipated events.
In addition, these slides and the accompanying oral discussion reference non-GAAP financial measures, such as adjusted EBITDA. A reconciliation of non-GAAP financial measures to the most directly comparable GAAP financial measure is provided in the Appendix to
these slides and is included in our press release issued on August 10, 2015 and posted on www.plygem.com.

2
41%
55% 45%
2
Second Quarter 2015 Results Today’s Presentation
90%
10%
Agenda
• Second Quarter Review Gary Robinette
• Financial Results Shawn Poe
• Acquisition Synergies and Cost Savings Shawn Poe
• Margin Initiatives Gary Robinette
• Economic Outlook Gary Robinette
• Questions and Answers Gary Robinette & Shawn Poe
• Closing Remarks Gary Robinette
3
41%
55% 45%
3
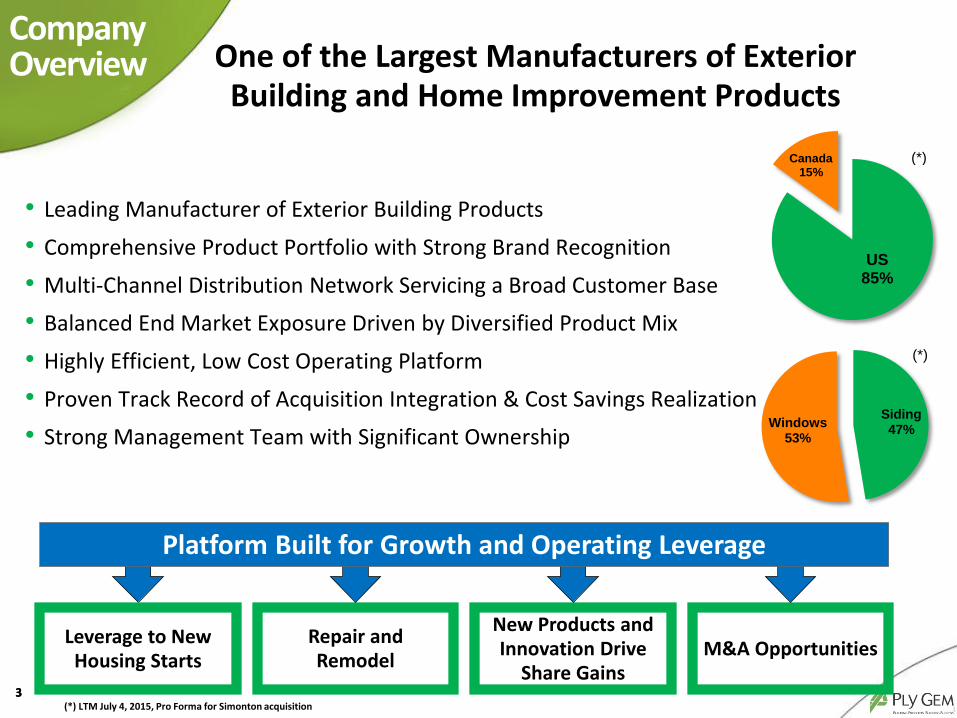
One of the Largest Manufacturers of Exterior Building and Home Improvement Products
90%
10%
Company Overview
Repair and Remodel
Leverage to New Housing Starts
New Products and Innovation Drive
Share Gains M&A Opportunities
Platform Built for Growth and Operating Leverage
• Leading Manufacturer of Exterior Building Products
• Comprehensive Product Portfolio with Strong Brand Recognition
• Multi-Channel Distribution Network Servicing a Broad Customer Base
• Balanced End Market Exposure Driven by Diversified Product Mix
• Highly Efficient, Low Cost Operating Platform
• Proven Track Record of Acquisition Integration & Cost Savings Realization
• Strong Management Team with Significant Ownership
US 85%
Canada 15%
(*)
Siding 47%
Windows 53%
(*)
(*) LTM July 4, 2015, Pro Forma for Simonton acquisition
4
Ply Gem Results
Key Highlights Second Quarter Results
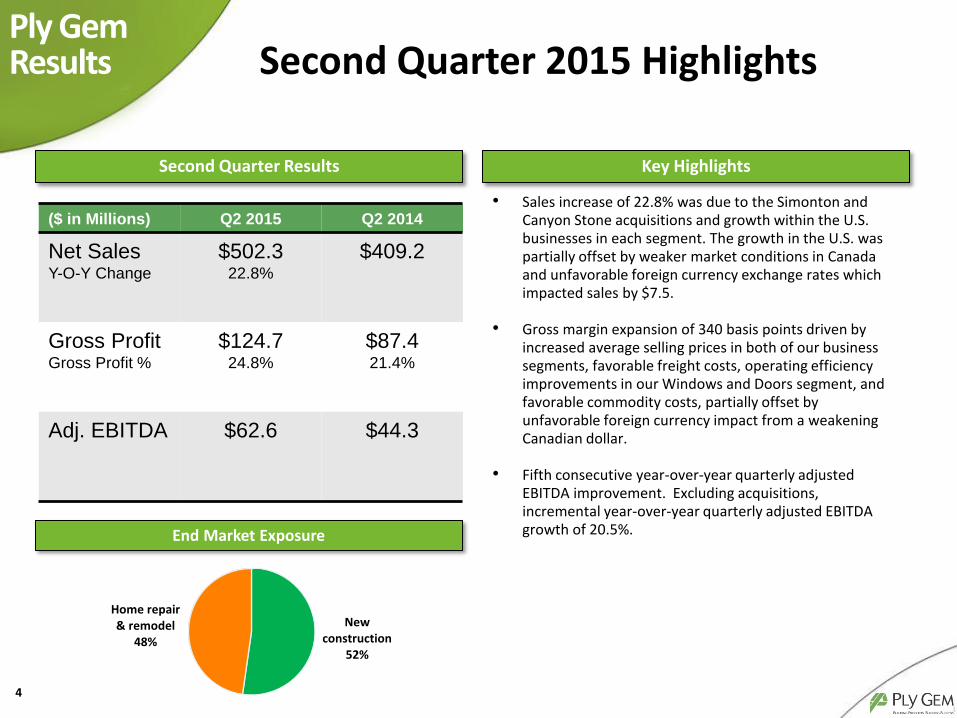
Second Quarter 2015 Highlights
• Sales increase of 22.8% was due to the Simonton and Canyon Stone acquisitions and growth within the U.S. businesses in each segment. The growth in the U.S. was partially offset by weaker market conditions in Canada and unfavorable foreign currency exchange rates which impacted sales by $7.5.
• Gross margin expansion of 340 basis points driven by increased average selling prices in both of our business segments, favorable freight costs, operating efficiency improvements in our Windows and Doors segment, and favorable commodity costs, partially offset by unfavorable foreign currency impact from a weakening Canadian dollar.
• Fifth consecutive year-over-year quarterly adjusted EBITDA improvement. Excluding acquisitions, incremental year-over-year quarterly adjusted EBITDA growth of 20.5%.
($ in Millions) Q2 2015 Q2 2014
Net Sales Y-O-Y Change
$502.3 22.8%
$409.2
Gross Profit Gross Profit %
$124.7 24.8%
$87.4 21.4%
Adj. EBITDA
$62.6 $44.3
New construction
52%
Home repair & remodel
48%
End Market Exposure

5
Windows & Doors (W&D) Segment
Key Highlights Second Quarter Results
Leader in Vinyl and Aluminum Windows
$233.7
$139.2
$30.1
$42.1
Q2 2015 Q2 2014
Net Sales
U.S. Canada
$181.3
$263.8
End Market Exposure (*)
• 45.5% increase in sales due largely to the Simonton acquisition which accounted for $86.5 of the sales growth. Excluding Simonton, sales for the U.S. business increased 5.8% due to higher average selling prices, improved product mix, and improvement in U.S. market conditions. Growth in the U.S. was partially offset by weaker market conditions in Western Canada and unfavorable foreign currency exchange rates which negatively impacted sales by $3.0.
• Gross margin improved by 660 basis points driven by $24.1 of Simonton gross margin and a 300 basis point gross margin improvement in our legacy windows businesses due to improved pricing, product mix and manufacturing efficiencies partially offset by unfavorable foreign currency.
• SG&A expense includes $17.9 of expense attributable to Simonton. Excluding Simonton, SG&A expense as a percent of net sales decreased from 13.4% to 13.2%.
Q2 2015 (**) Q2 2014
U.S. 20.4% 12.6%
Canada 20.9% 18.3%
W&D Segment 20.5% 13.9%
Gross Margin %
New construction
66%
Home repair & remodel
34%
(*) For the three months ended July 4, 2015 (**) Includes the impact of Simonton

Q2 2014 Gross Margin 13.9%
Selling Price/Product Mix 2.3%
Conversion Improvements 1.0%
Simonton Acquisition Impact 3.6%
Freight Costs 0.3%
Unfavorable FX/Other -0.6%
Q2 2015 Gross Margin 20.5%
W&D Gross Margin
Less operating leverage due to sales volume decreases driven by weather and pull-back in new construction demand
6
W&D Segment Gross Margin Bridge and Historical Performance
Reflects favorable product mix and pricing. As noted during previous price increases, the pull through of pricing changes occur over a 90 to 120 day period.
20.9% 15.4% 14.0% 15.4% 13.1% 13.8%
9.7% 12.9% 15.4%
1,046
622
445 471 431 535
618 648 677
2007 2008 2009 2010 2011 2012 2013 2014 LTM
Historical Gross Margin Performance
Annual Gross Profit % U.S. SFHS (*)
Note: Includes Simonton from date of acquisition
Simonton favorable impact on overall segment gross margin for the quarter.
Improved operational efficiency improvements within our U.S. and Western Canadian manufacturing facilities.
Favorable freight costs due to decline in fuel pricing partially offset by rising driver and freight insurance costs.

7
Siding, Fencing & Stone (SFS) Segment
Key Highlights Second Quarter Results
Market Leader in Vinyl Siding
$204.6 $191.3
$34.0 $36.6
Q2 2015 Q2 2014
Net Sales
U.S. Canada
$227.9
New construction
37%
Home repair & remodel
63%
End Market Exposure (*)
• 4.7% increase in sales driven by favorable market demand for our products in the U.S. and higher selling prices for our products, partially offset by $4.5 in unfavorable foreign currency exchange rates. In addition, on May 29, 2015, we acquired the assets of Canyon Stone which resulted in incremental sales of $2.9 during the quarter.
• Gross margin expanded by 230 basis points, driven by improved operating leverage from the sales increase, improved selling prices, favorable material cost pricing, and favorable freight expense, partially offset by unfavorable foreign currency.
• SG&A expense as a percentage of sales increased slightly from 9.3% to 9.6% during the period.
Gross Margin %
Q2 2015 Q2 2014
U.S. 29.5% 27.0%
Canada 30.4% 29.1%
SFS Segment 29.6% 27.3%
$238.6
(*) For the three months ended July 4, 2015

Q2 2014 Gross Margin 27.3%
Selling Price/Product Mix 1.1%
Commodity Costs 1.3%
Freight Costs 0.4%
Unfavorable Fx/Other -0.5%
Q2 2015 Gross Margin 29.6%
SFS Gross Margin
Favorable raw material costs, mainly PVC resin and aluminum commodity costs.
8
SFS Segment Gross Margin Bridge and Historical Performance
Reflects favorable product mix and pricing. As noted during previous price increases, the pull through of pricing changes occur over a 30 to 60 day period.
20.4% 18.4% 25.9% 25.7% 24.8% 27.4% 26.8% 26.1% 26.5%
.5208 .6200 .5288 .6458 .6971 .6975 .7134
.7534 .7459
2007 2008 2009 2010 2011 2012 2013 2014 LTM
Historical Gross Margin Performance
Annual Gross Profit % PVC Resin Price (*)
Favorable freight costs due to decline in fuel pricing partially offset by rising driver and freight insurance costs.

0.176.80
255,128,0
102,102,102
193,0,0
226,133,131
192,192,192
245,171,088
102,179,97
9
Acquisition Synergies
(1) Improved procurement economics as a result of increased purchasing power (2) Freight cost maximization and improved fixed overhead as a result of various manufacturing cost reductions from rationalizations (3) SG&A leverage scale and back office efficiencies (4) Expand vertical integration efficiency
Impact of Expected Simonton Synergies and Cost Savings
$8 Million Original
Savings
Raw material sourcing (1)
$3.6M Mfg. efficiencies (2)
$2.7M
Insourcing products (4)
$1.5M SG&A (3)
$0.2M
Simonton Acquisition Synergies and Cost Savings
$10 Million
Additional Incremental Savings $2.0M

10
Margin Initiatives
The Market Innovator
The Leading Brand
Lean through Technology
Our Future Leaders
New Channels and Markets
Selling Price Increases
Q1 2015 announced price increases are effective for both business segments. W&D Segment selling price increases range from 6% to 15%. SFS Segment selling price increases range from 6% to 8%
Continued Implementation of Enterprise Lean and Sales & Operations Planning (S&OP) System in U.S. Windows and Doors
Enterprise Lean provides product simplification and improves manufacturing flexibility. Realized approximately $4.5 of benefit in 2014 and will provide for an estimated annual savings of approximately $10.0 when fully implemented in 2016
S&OP system provides enhanced capacity and resource planning system which will reduce future ramp-up costs and maximize fixed manufacturing investments
Ply Gem Margin Enhancement Initiatives
Cross Selling Opportunities
Continue to integrate our extensive product categories across our legacy customer base and acquired Simonton customer base
11
Ply Gem Outlook
The Market Innovator
The Leading Brand
Lean through Technology
Our Future Leaders
New Channels and Markets
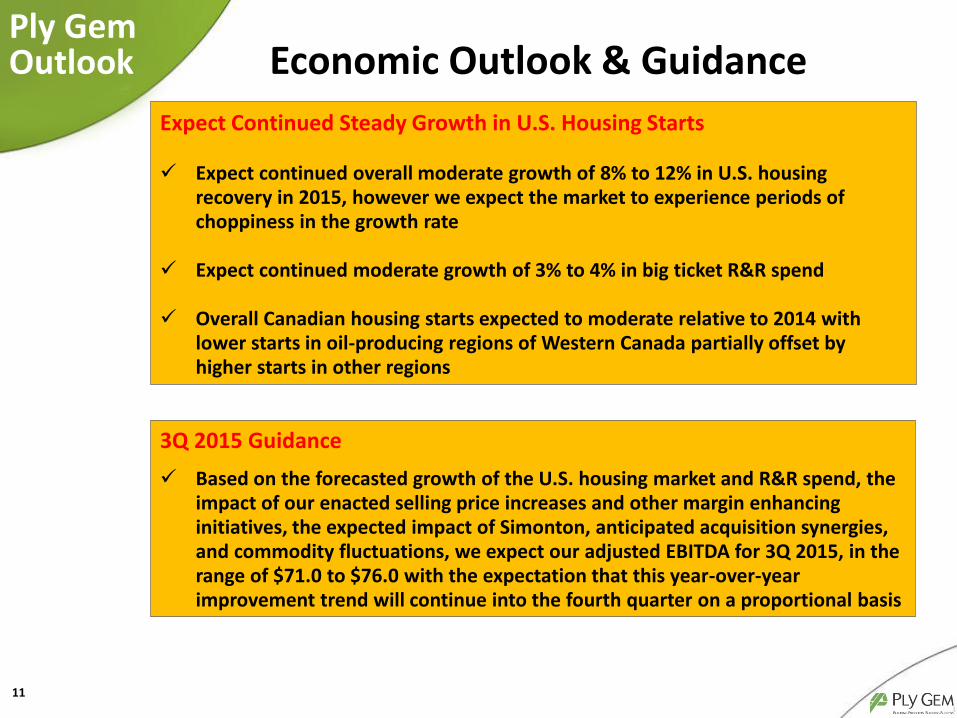
3Q 2015 Guidance
Based on the forecasted growth of the U.S. housing market and R&R spend, the impact of our enacted selling price increases and other margin enhancing initiatives, the expected impact of Simonton, anticipated acquisition synergies, and commodity fluctuations, we expect our adjusted EBITDA for 3Q 2015, in the range of $71.0 to $76.0 with the expectation that this year-over-year improvement trend will continue into the fourth quarter on a proportional basis
Economic Outlook & Guidance Expect Continued Steady Growth in U.S. Housing Starts
Expect continued overall moderate growth of 8% to 12% in U.S. housing
recovery in 2015, however we expect the market to experience periods of choppiness in the growth rate
Expect continued moderate growth of 3% to 4% in big ticket R&R spend
Overall Canadian housing starts expected to moderate relative to 2014 with lower starts in oil-producing regions of Western Canada partially offset by higher starts in other regions

Q&A
12
Appendix:
Non-GAAP Adjusted EBITDA Reconciliation
13

(amounts in thousands) For the three months ended
July 4, 2015 For the three months ended
June 28, 2014
Net income $30,372 $11,380
Interest expense, net 18,682 17,225
Provision (benefit) for income taxes (1,482) 7,051
Depreciation and amortization 14,576 11,254
EBITDA $62,148 $46,910
Non cash loss (gain) on foreign currency transactions 98 (477)
Acquisition costs 339 -
Customer inventory buybacks 80 359
Restructuring/integration expense 1,857 1,462
Non cash charge of purchase price allocated to inventories 54 -
Tax receivable agreement liability adjustment (2,006) (3,942)
Adjusted EBITDA $62,570 $44,312
14
Second Quarter Adjusted EBITDA Reconciliation Appendix

(amounts in thousands) For the six months ended
July 4, 2015 For the six months ended
June 28, 2014
Net loss ($18,487) ($40,198)
Interest expense, net 37,766 35,719
Benefit for income taxes (3,876) (5,419)
Depreciation and amortization 29,397 22,538
EBITDA $44,800 $12,640
Non cash loss (gain) on foreign currency transactions 1,032 (249)
Acquisition costs 625 -
Customer inventory buybacks 132 482
Restructuring/integration expense 3,020 3,179
Non cash charge of purchase price allocated to inventories 54 -
Litigation settlement - 5,000
Loss on modification or extinguishment of debt - 21,364
Tax receivable agreement liability adjustment 15,179 431
Adjusted EBITDA $64,842 $42,847
15
Six Months Adjusted EBITDA Reconciliation Appendix
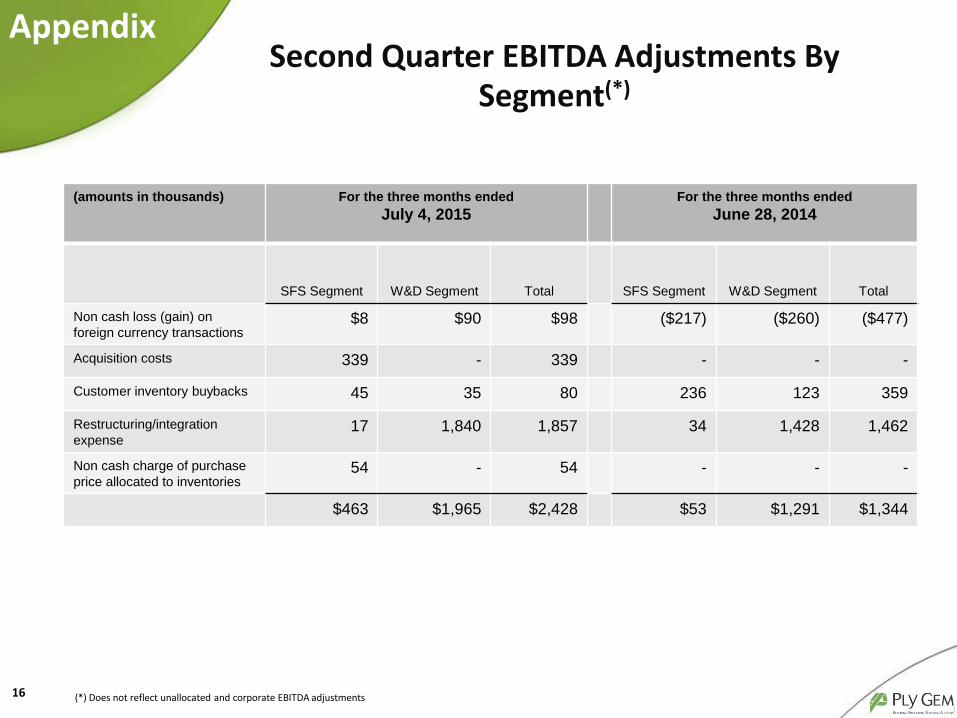
(amounts in thousands) For the three months ended
July 4, 2015 For the three months ended
June 28, 2014
SFS Segment W&D Segment Total SFS Segment W&D Segment Total
Non cash loss (gain) on
foreign currency transactions $8 $90 $98 ($217) ($260) ($477)
Acquisition costs 339 - 339 - - -
Customer inventory buybacks 45 35 80 236 123 359
Restructuring/integration
expense 17 1,840 1,857 34 1,428 1,462
Non cash charge of purchase
price allocated to inventories 54 - 54 - - -
$463 $1,965 $2,428 $53 $1,291 $1,344
16
Second Quarter EBITDA Adjustments By Segment(*)
Appendix
(*) Does not reflect unallocated and corporate EBITDA adjustments

(amounts in thousands) For the six months ended
July 4, 2015 For the six months ended
June 28, 2014
SFS Segment W&D Segment Total SFS Segment W&D Segment Total
Non cash loss (gain) on
foreign currency transactions $261 $771 $1,032 ($74) ($175) ($249)
Acquisition costs 337 261 598 - - -
Customer inventory buybacks 97 35 132 359 123 482
Restructuring/integration
expense 175 2,845 3,020 34 3,145 3,179
Non cash charge of purchase
price allocated to inventories 54 - 54 - - -
Litigation settlement - - - - 5,000 5,000
$924 $3,912 $4,836 $319 $8,093 $8,412
17
Six Months EBITDA Adjustments By Segment(*) Appendix
(*) Does not reflect unallocated and corporate EBITDA adjustments