pgplot graphics subroutine library - pamocpamoc.eu/istm/pgplot_official_manual.pdf · 1....
TRANSCRIPT

PGPLOT Graphics Subroutine Library
T. J. Pearson
Copyright © 1988-1997 by California Institute of Technology
Contents
● Acknowledgments
● Chapter 1 Introduction
❍ 1.1 PGPLOT ❍ 1.2 This Manual ❍ 1.3 Using PGPLOT ❍ 1.4 Graphics Devices ❍ 1.5 Environment Variables
● Chapter 2 Simple Use of PGPLOT
❍ 2.1 Introduction ❍ 2.2 An Example ❍ 2.3 Data Initialization ❍ 2.4 Starting PGPLOT ❍ 2.5 Defining Plot Scales and Drawing Axes ❍ 2.6 Labeling the Axes ❍ 2.7 Drawing Graph Markers ❍ 2.8 Drawing Lines ❍ 2.9 Ending the Plot ❍ 2.10 Compiling and Running the Program ❍ Figure 2.1: Output of Example Program
● Chapter 3 Windows and Viewports
❍ 3.1 Introduction ❍ 3.2 Selecting a View Surface ❍ 3.3 Defining the Viewport ❍ 3.4 Defining the Window ❍ 3.5 Annotating the Viewport ❍ 3.6 Routine PGENV
● Chapter 4 Primitives

❍ 4.1 Introduction ❍ 4.2 Clipping ❍ 4.3 Lines ❍ 4.4 Graph Markers ❍ 4.5 Text ❍ 4.6 Area Fill: Polygons, Rectangles, and Circles ❍ Figure 4.1: PGPLOT standard graph markers
❍ Figure 4.2: Text Examples
❍ Figure 4.3: Escape Sequences for Greek Letters
● Chapter 5 Attributes
❍ 5.1 Introduction ❍ 5.2 Color Index ❍ 5.3 Color Representation ❍ 5.4 Line Style ❍ 5.5 Line Width ❍ 5.6 Character Height ❍ 5.6 Character Font ❍ 5.7 Text Background ❍ 5.8 Fill-Area Style ❍ 5.9 The Inquiry Routines ❍ 5.10 Saving and Restoring Attributes ❍ Figure 5.1: Default color representations of color indices 0-15
❍ Figure 5.2: Fill-area styles
● Chapter 6 Higher-Level Routines
❍ Introduction ❍ XY-plots ❍ Histograms ❍ Functions of two variables
● Chapter 7 Interactive Graphics
❍ 7.1 Introduction ❍ 7.2 The Cursor ❍ 7.3 Using the Cursor ❍ 7.4 Buffering
● Appendix A Subroutine Descriptions
● Appendix B PGPLOT Symbols
❍ B.1 Character Encoding ❍ B.2 Additional Symbols ❍ Figure B.0: Character Encoding

❍ Figure B.1: Symbols 1-527
❍ Figure B.2: Symbols 528-713
❍ Figure B.3: Symbols 714-2017
❍ Figure B.4: Symbols 2018-2192
❍ Figure B.5: Symbols 2193-2400
❍ Figure B.6: Symbols 2401-2747
❍ Figure B.7: Symbols 2748-2932
● Appendix C Calling PGPLOT from a C Program
❍ C.1 Introduction ❍ C.2 Using the CPGPLOT library ❍ C.3 Limitations ❍ C.4 Other Machine Dependencies ❍ C.5 Examples
● Appendix D Supported Devices
❍ Introduction ❍ Available Devices
● Appendix E Writing a Device Handler
❍ E.1 Introduction ❍ E.2 The device dispatch routine GREXEC ❍ E.3 Device handler interface ❍ E.4 Handler state ❍ E.5 Summary of operations
● Appendix F Installation Instructions
● Appendix G Porting PGPLOT
❍ G.1 General Notes ❍ G.2 Porting to UNIX systems
Tim Pearson, California Institute of Technology, tjp戢stro.caltech.edu
Copyright © 1995-6 California Institute of Technology

Acknowledgments
Many people have contributed to PGPLOT over the years, and I thank all who have contributed code and device drivers or who have helped in debugging PGPLOT on a variety of systems. I am particularly grateful to the following for their major contributions: Klaus-Georg Adams, Scott Allendorf, Robert Deverill, C. T. Dum, Alan Fey, Karl Glazebrook, Diab Jerius, Chris Jacobs, Neil Killeen, Harry Lehto, Colin Lonsdale, Grant McIntosh, Massimo Manghi, Michael Michelsen, Jim Morgan, Martin Shepherd, Sam Southard, Allyn Tennant, David Terrett, Peter Teuben, Jean-Marc Zucconi.

1. Introduction
1.1 PGPLOT
PGPLOT is a Fortran subroutine package for drawing simple scientific graphs on various graphics display devices. It was originally developed for use with astronomical data reduction programs in the Caltech Astronomy department.
This manual is intended for the Fortran programmer who wishes to write a program generating graphical output. For most applications, the program can be device-independent, and the output can be directed to the appropriate device at run time. The output device is described by a ``device specification,'' discussed below. The programmer can build a specific device specification into the program, but it is better to make this a parameter which the user of the program can supply.
All the examples in this manual use standard Fortran-77. PGPLOT itself is written mostly in standard Fortran-77, with a few non-standard, system-dependent subroutines.
1.2 This Manual
This manual is intended both as a tutorial introduction to PGPLOT and as a reference manual. The remainder of this chapter describes some fundamentals: how to include the PGPLOT library in your program, and the types of graphic devices that PGPLOT can use.
Chapter 2 is tutorial: it presents a Fortran program for drawing a graph using the
minimum number of PGPLOT subroutines, and explains what each of these subroutines does. After reading this chapter, you should be able to write your own PGPLOT program, although it may be helpful to refer to the individual subroutine descriptions in Appendix A.
The basic features of PGPLOT are introduced in Chapters 3, 4, and 5. Chapter 3
explains the positioning and scaling of plots on the page, Chapter 4 describes the
basic (``primitive'') routines for drawing lines, writing text, drawing graph markers, and shading areas, and Chapter 5 describes the routines for changing the
``attributes'' of these primitives: color, line-style, line-width, text font, etc.
Chapter 6 describes some ``high level'' routines that use the primitive routines to
build up more complicated pictures: e.g., function plots, histograms, bar charts, and contour maps.

Chapter 7 describes PGPLOT's capabilities for ``interactive'' graphics, whereby the
user of the PGPLOT program can control its action with a cursor, joystick, mouse, etc.
There are seven appendices. Appendix A is a list of all the PGPLOT routines, with
detailed instructions for their use. Appendix B shows the complete set of PGPLOT
characters and symbols that can be used for annotating graphs. Appendix C is
intended for those who want to call PGPLOT subroutines from a program written in C. Appendix D gives details of the devices supported by PGPLOT. Appendix E
provides instructions for programmers who want to extend PGPLOT to support other devices. Appendix F provides installation instructions, and Appendix G gives
some hints for porting PGPLOT to a new operating system.
1.3 Using PGPLOT
In order to use PGPLOT subroutines, you will need to link your program with the graphics subroutine library.
1.3.1 UNIX
The following assumes that the PGPLOT library libpgplot.a has been installed in a standard location where the loader can find it. To compile, link, and run a graphics program example.f:
f77 -o example example.f -lpgplotexample
In some installations, it may be necessary to include other libraries, such as the Xwindow library, and specify a directory to search for the PGPLOT library; e.g.
f77 -o example example.f -L /usr/local/pgplot -lpgplot -lX11example
1.3.2 VMS
On most VMS computers, the graphics subroutine library is scanned automatically by the LINK command, so the following sequence of instructions suffices to compile, link, and run a graphics program EXAMPLE.FOR:
$ FORTRAN EXAMPLE$ LINK EXAMPLE$ RUN EXAMPLE

On other VMS computers, the automatic search of the graphics library may not occur. You will then need to include the graphics library explicitly by using a LINK commands like the following:
$ LINK EXAMPLE,PGPLOT_DIR:GRPSHR/LIB
The PGPLOT subroutines are not included in your .EXE file, but are fetched from a shareable image when you execute the RUN command. This makes the .EXE file much smaller, and means that the program need not be relinked when changes are made to the graphics subroutines; but the .EXE file can only be run on a machine that has a copy of the shareable image and is running a compatible version of VMS. To make a transportable .EXE file, use the non-shared library as follows (the XLIB library is not required if your version of PGPLOT does not include an X-window driver):
$ LINK EXAMPLE,PGPLOT_DIR:GRPCKG/LIB,SYS$INPUT:/OPTSYS$SHARE:DECW$XLIBSHR.EXE/SHARE[ctrl-Z]$
1.4 Graphics Devices
Graphics devices fall into two classes: devices which produce a hardcopy output, usually on paper; and interactive devices, which usually display the plot on a TV monitor. Some of the interactive devices allow modification to the displayed picture, and some have a movable cursor which can be used as a graphical input device. There is also a ``null device,'' to which unwanted graphical output can be directed. Hardcopy devices are not used interactively. One must first create a disk file and then send it to the appropriate device with a print or copy command. Consult Appendix D (or your System Manager) to determine the appropriate device-specific command.
A PGPLOT graphical output device is described by a ``device specification'' that consists of two parts, separated by a slash (/): the device name or file name, and the device type.
1.4.1 Device Name
device name or file name is the name by which the output device is known to the operating system. For most hardcopy devices, this should be the name of a disk file, while for interactive devices, it should be the name of a device of the appropriate type; in both cases, the name should be specified according to the syntax of the operating system in use. If the device or file name includes a slash (/), enclose the

name in double quotation marks ("). If the device name is omitted from the device specification, a default device is used, the default depending on the device type (see Appendix D). In Unix, device and file names are case-sensitive.
1.4.2 Device Type
device type tells PGPLOT what sort of graphical device it is. Appendix D lists the device types available at the time of writing, together with the names by which they are known to PGPLOT. If the device type is omitted, a system-dependent default type is assumed (this is the value of the ``environment variable'' PGPLOT_TYPE). The device type is not case-sensitive: you can use uppercase or lowercase letters, or a mixture of the two.
1.4.3 Examples
A window on the default Xwindow display screen:
● /XWINDOW
Tektronix 4006/4010 terminal:
● /TEK (the logged-in terminal) ● tta4/TEK (VMS device _TTA4:) ● "/dev/tty6"/TEK (Unix device tty6)
Disk file, PostScript format:
● plot.ps/PS (in the current default directory) ● plot.ps/VPS (the same, but in portrait orientation) ● "/scr/tjp/plot.ps"/PS (in a specified directory)
1.5 Environment Variables
Some aspects of the behavior of PGPLOT can be modified at run time by specifying environment variables. The variables have names which begin with PGPLOT_.
In UNIX systems, environment variables can be defined using the shell. For the bash, bourne (sh), or korn (ksh) shell, use commands like the following:
PGPLOT_DIR="/usr/local/pgplot"; export PGPLOT_DIR
For the c-shell and tcsh, use

setenv PGPLOT_DIR "/usr/local/pgplot/"
Note that the names of PGPLOT environment variables are specified using upper case characters, e.g. PGPLOT_DIR, not pgplot_dir.
In VMS systems, environment variables are ``logical names'' and can be defined with the DEFINE or ASSIGN command, e.g.
$ DEFINE PGPLOT_DIR user_disk:[local.pgplot]$ DEASSIGN PGPLOT_DIR
The following environment variables affect all PGPLOT programs:
PGPLOT_DIR Directory name. Unless told otherwise by environment variables PGPLOT_FONT and PGPLOT_RGB, PGPLOT looks for the files it needs at run-time in this directory. The binary font file is grfont.dat and the color-name database is rgb.txt. If this variable is undefined, or if the specified file does not exist in this directory, PGPLOT looks in the current default directory. e.g.
setenv PGPLOT_DIR /usr/local/lib/pgplot/
PGPLOT_FONT File name for the binary font file. If this variable is defined, PGPLOT will interpret the value as a file name for the binary font file. If it is not defined, PGPLOT will look for the binary font file under name grfont.dat in the directory specified by PGPLOT_DIR. e.g.
setenv PGPLOT_FONT /usr/local/pgplot/grfont.dat
PGPLOT_RGB File name for the color-name database. If this variable is defined, PGPLOT will interpret the value as a file name for the color-name database. If it is not defined, PGPLOT will look for the binary font file under name rgb.txt in the directory specified by PGPLOT_DIR. The color-name database is only used by programs that call PGSCRN, or when environment variable PGPLOT_BACKGROUND or PGPLOT_FOREGROUND is defined. e.g.
setenv PGPLOT_RGB /usr/local/pgplot/rgb.txt
PGPLOT_DEV Device specification. If this variable is defined, it is used as the default device specification: if the device specification given to PGBEG (or supplied

by the user in response to the PGPLOT prompt) is a blank string, this device specification is used, e.g.
setenv PGPLOT_DEV /xwin
PGPLOT_TYPE Device type. If this variable is defined, it is used as the default device type: if the device specification supplied to PGBEG consists of a file name without a trailing slash (/) and device type, this device type is assumed. e.g.
setenv PGPLOT_TYPE ps
PGPLOT_ENVOPT Character string. This affects programs that call routine PGENV. The characters supplied are options for PGBOX (in addition to those assumed by default by PGENV, i.e., `BCNST'. Useful options include `G' to draw a grid, `V' to draw y-axis labels upright, `I' to draw axis tick marks outside the box instead of inside, `1' or `2' to change the numeric label style. e.g.
setenv PGPLOT_ENVOPT IVG
PGPLOT_FOREGROUND Color name. This variable can be used to change the color representation of color index 1 (the ``foreground'' color) from its device-dependent default (usually white or black). The value of the variable should be a color name defined in the color-name database. If the variable is defined, the effect is the same as a call to PGSCRN with this name as argument immediately after the graphics device is opened. Color names are case-insensitive and embedded spaces are ignored. e.g.
setenv PGPLOT_FOREGROUND springgreen
PGPLOT_BACKGROUND Color name. This variable can be used to change the color representation of color index 0 (the ``background'' color) from its device-dependent default (usually black or white). The value of the variable should be a color name defined in the color-name database. If the variable is defined, the effect is the same as a call to PGSCRN with this name as argument immediately after the graphics device is opened. On devices without a color lookup table, changing the background color only affects the color of elements explicitly drawn in color index 0. To ensure that the background of the entire view surface changes to the new color, it is also necessary to call PGERAS at the start of each page. e.g.

setenv PGPLOT_BACKGROUND slateblue
PGPLOT_BUFFER Switch. If this variable is defined, with any non-null value, PGPLOT buffers output. The effect is the same as if PGBBUF is called immediately after opening the graphics device, and PGEBUF immediately before closing it. It will have no effect on programs that already include these calls. On some devices, buffering output can lead to large improvements in speed, but enabling buffering may upset synchronization between graphical output and other program activity. e.g.
setenv PGPLOT_BUFFER yes
PGPLOT_DEBUG Switch. If this variable is defined, with any non-null value, PGPLOT will print some debugging information on the standard output. Currently this includes attempts to open input files (binary font file and color-name database), and, when the null device is selected for output, statistics of device-driver calls. e.g.
setenv PGPLOT_DEBUG yes
In addition to these environment variables, several device drivers use device-specific environment variables. See the device descriptions for details.
Next: Chapter 2
PGPLOT
Tim Pearson, California Institute of Technology, tjp戢stro.caltech.edu
Copyright © 1995 California Institute of Technology

2. Simple Use of PGPLOT
2.1 Introduction
This chapter introduces the basic subroutines needed to create a graph using PGPLOT, by way of a concrete example. It does not describe all the capabilities of PGPLOT; these are presented in later chapters.
A graph is composed of several elements: a box or axes delineating the graph and indicating the scale, labels if required, and one or more points or lines. To draw a graph you need to call at least four of the PGPLOT functions and subroutines:
1. PGBEG, to start up PGPLOT and specify the device you want to plot on;
2. PGENV, to define the range and scale of the graph, and draw labels, axes etc;
3. one or more calls to PGPT or PGLINE or both, or other drawing routines, to
draw points or lines. 4. PGEND to close the plot.
To draw more than one graph on the same device, repeat steps (2) and (3). It is only necessary to call PGBEG and PGEND once each, unless you want to plot on more than one device.
This chapter presents a very simple example program to demonstrate the above four steps.
2.2 An Example
A typical application of PGPLOT is to draw a set of measured data points and a theoretical curve for comparison. This chapter describes a simple program for drawing such a plot; in this case there are five data points and the theoretical curve is y = x². Here is the complete Fortran code for the program:
PROGRAM SIMPLE INTEGER I, IER, PGBEG REAL XR(100), YR(100) REAL XS(5), YS(5) DATA XS/1.,2.,3.,4.,5./ DATA YS/1.,4.,9.,16.,25./ IER = PGBEG(0,'?',1,1) IF (IER.NE.1) STOP CALL PGENV(0.,10.,0.,20.,0,1)

CALL PGLAB('(x)', '(y)', 'A Simple Graph') CALL PGPT(5,XS,YS,9) DO 10 I=1,60 XR(I) = 0.1*I YR(I) = XR(I)**2 10 CONTINUE CALL PGLINE(60,XR,YR) CALL PGEND END
The following sections of this chapter describe how the program works, and the resulting plot is shown in Figure 2.1.
2.3 Data Initialization
We shall store the x and y coordinates of the five data points in arrays XS and YS. For convenience, this program defines the values in DATA statements, but a more realistic program might read them from a file. Arrays XR and YR will be used later in the program for the theoretical curve.
REAL XR(100), YR(100) REAL XS(5), YS(5) DATA XS/1.,2.,3.,4.,5./ DATA YS/1.,4.,9.,16.,25./
2.4 Starting PGPLOT
The first thing the program must do is to start up PGPLOT and select the graphics device for output:
INTEGER PGBEG IER = PGBEG(0,'?',1,1) IF (IER.NE.1) STOP
Note that PGBEG is a Fortran function, not a subroutine, and must be declared
INTEGER. It has four arguments, and returns an integer code which will have value 1 if the device was opened successfully.
● The first argument is present for historical reasons. It should always be set to zero (0).
● The second argument is a character string which gives a ``device specification'' for the interactive graphics device or disk file for hardcopy graphics (see Chapter 1 and Appendix D). This program makes use of a special

shorthand feature of PGPLOT, however: if this argument is set to '?', the program will ask the user to supply the device specification at run-time.
● The last two arguments are described in Section 3.2. Usually they are both set to 1, as in this example.
2.5 Defining Plot Scales and Drawing Axes
Subroutine PGENV starts a new picture and defines the range of variables and the
scale of the plot. PGENV also draws and labels the enclosing box and the axes if requested. In this case, the x-axis of the plot will run from 0.0 to 10.0 and the y-axis will run from 0.0 to 20.0.
CALL PGENV(0.,10.,0.,20.,0,1)
PGENV has six arguments:
● the left and right limits for the x (horizontal) axis (real numbers, not integers). ● the bottom and top limits for the y (vertical) axis (also real numbers). ● An integer argument: if this is 1, the scales of the x-axis and y-axis (in units
per inch) will be equal; otherwise the axes will be scaled independently. In this case we have not requested equal scales.
● Another integer argument, that controls whether an enclosing box, tick-marks, numeric labels, and/or a grid will be put on the graph. The recommended value is 0. Some of the allowed values are: -2: no annotation; -1: draw box only; 0: draw box, and label it with coordinate values around the edge;1: in addition to the box and labels, draw the two axes (lines x=0, y=0) with tick marks; 2: in addition to the box, labels, and axes, draw a grid at major increments of the x and y coordinates.
2.6 Labeling the Axes
Subroutine PGLAB may (optionally) be called after PGENV to write identifying
labels on the x and y axes, and at the top of the picture:
CALL PGLAB('(x)', '(y)', 'A Simple Graph')
All three arguments are character variables or constants; any of them can be blank (' ').
● A label for the x-axis (bottom of picture). ● A label for the y-axis (left-hand edge). ● A label for the plot (top of picture).

2.7 Drawing Graph Markers
Subroutine PGPT draws graph markers at one or more points on the graph. Here we
use it to mark the five data points:
CALL PGPT(5,XS,YS,9)
If any of the specified points fall outside the window defined in the call to PGENV, they will not be plotted. The arguments to PGPT are:
● The number of points to be marked (integer). ● The x and y coordinates of the points (real arrays). ● The number of the symbol to be used to mark the points. In this example, we
use symbol number 9 which is a circle with a central dot. The available symbols are shown in Chapter 4.
2.8 Drawing Lines
The following code draws the ``theoretical curve'' through the data points:
DO 10 I=1,60 XR(I) = 0.1*I YR(I) = XR(I)**2 10 CONTINUE CALL PGLINE(60,XR,YR)
We compute the x and y coordinates at 60 points on the theoretical curve, and use subroutine PGLINE to draw a curve through them. PGLINE joins up the points with
straight-line segments, so it is necessary to compute coordinates at fairly close intervals in order to get a smooth curve. Any lines which cross the boundary of the window defined in PGENV are ``clipped'' at the boundary, and lines which lie outside the boundary are not drawn. The arguments of PGLINE are like those of PGPT:
● The number of points defining the line (integer). ● The x and y coordinates of the points (real arrays).
2.9 Ending the Plot
Subroutine PGEND must be called to complete the graph properly, otherwise some
pending output may not get sent to the device:

CALL PGEND
2.10 Compiling and Running the Program
To compile the program and link it with the PGPLOT library, see Chapter 1. For example, under Unix:
emacs simple.f...f77 -o simple simple.f -lpgplot -lX11
Under VMS:
$ EDIT SIMPLE.FOR...$ FORTRAN SIMPLE$ LINK SIMPLE
When you run the program, it will ask you to supply the graphics device specification. Type in any allowed device specification, or type a question-mark (?) to get a list of the available device types. For example, if you are using an X Window display, type /XWIN: the graph will appear on the terminal screen.
If you want a hard copy, you can run the program again, and specify a different device type, e.g., simple.ps/PS to make a disk file in PostScript format. To obtain the hard copy, print the file (but first check with your system manager what the correct print command is; it is possible to waste a lot of paper by using the wrong command or sending a file to the wrong sort of printer!).
Next: Chapter 3
PGPLOT
Tim Pearson, California Institute of Technology, tjp戢stro.caltech.edu
Copyright © 1995 California Institute of Technology
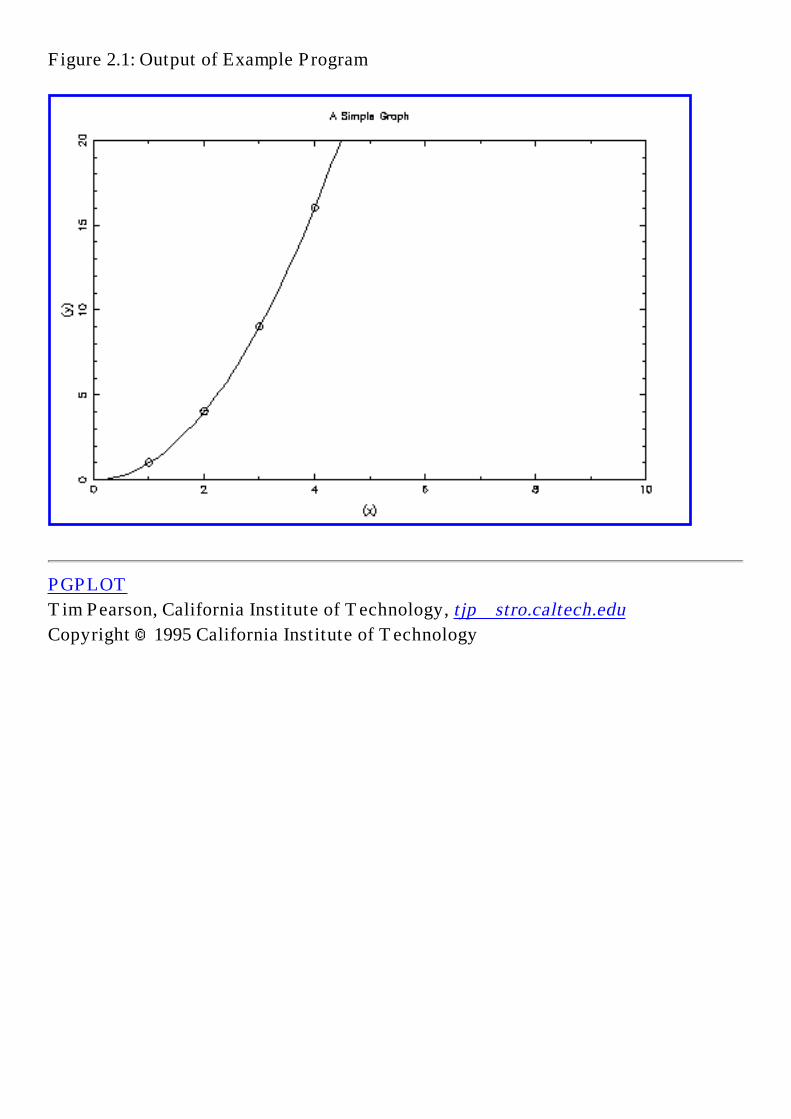
Figure 2.1: Output of Example Program
PGPLOT
Tim Pearson, California Institute of Technology, tjp戢stro.caltech.edu
Copyright © 1995 California Institute of Technology
3. Windows and Viewports
3.1 Introduction
This chapter is concerned with positioning a graph on the screen or hardcopy page, and controlling its scale. In simple applications, the position and scale of the graph are controlled more-or-less automatically by the routine PGENV, but in order to obtain complete control of positioning and scaling, it is necessary to understand the concepts of the View Surface, the Window, and the Viewport, and two coordinate systems: World Coordinates and Device Coordinates.
A simple PGPLOT picture might be a two-dimensional graph showing the dependence of one variable on another. A typical graph has data points, represented by error bars or special markers such as dots or diamonds, possibly connected by lines, or perhaps plotted on the same scale as a theoretical model drawn as a smooth curve. The graph must be labeled with two axes to indicate the coordinate scales.
The programmer must describe to PGPLOT the various elements of the graph in terms of rectangular Cartesian coordinates. The only limitation on the coordinates is that they be represented as floating-point (REAL or REAL*4) numbers; otherwise we are totally free to choose the meaning of the coordinates. For example, in a graph showing the temporal variation of a radio source, the abscissa (x-coordinate) might be Epoch (in years) and the ordinate (y-coordinate) Flux Density (in Jy).
In accordance with common practice in graphics programming, these coordinates, chosen by the programmer, are termed world coordinates. PGPLOT maps a selected rectangular region of the world-coordinate space (termed the window) onto a specified rectangle (termed the viewport) on the view surface (the screen of an interactive display or a sheet of paper on a hardcopy plotter). The program must make calls to PGPLOT routines to define both the window and the viewport. For complete descriptions of the routines and their arguments, refer to Appendix A.
3.2 Selecting a View Surface
The first thing a graphics program must do is to tell PGPLOT what device it is going to use. This is done by calling function PGBEG. For example, to create a plot file for a PostScript printer:
INTEGER PGBEGIER = PGBEG (0, 'plotfile.ps/PS', 1, 1)
Equally important, when all plotting has been completed, it is necessary to call

PGEND to flush any pending plot requests:
CALL PGEND
Note that only one device can be used at a time. If PGBEG is called while a plot is in progress, the old plot is closed and a new one is begun.
After calling PGBEG the program has access to a view surface. For workstations, it is a window on the workstation screen. For interactive devices, this is the full screen of the device. For hardcopy devices, it is a standard page, usually about 10 inches (width) by 8 inches (height) on a device used in ``landscape'' mode (e.g, device type /PS or /QMS), or 8 inches by 10 inches on a device used in ``portrait'' mode (e.g., device type /VPS and /VQMS).
On some devices, it is possible to plot on a larger or smaller piece of paper than the standard page; see the description of routine PGPAP, which must be called immediately after PGBEG to change the size of the view surface. The different devices differ not only in the size of the view surface, but also in its aspect ratio (height/width). PGPAP can be called to ensure that a plot has the same aspect ratio no matter what device it is plotted on.
After completing a graph, it is possible to advance to a new page to start a new graph (without closing the plot file) by calling PGPAGE:
CALL PGPAGE
This clears the screen on interactive devices, or gives a new piece of paper on hardcopy devices. It does not change the viewport or window.
The last two arguments of PGBEG (NX and NY) can be used to subdivide the view surface into smaller pieces called panels, each of which can then be used separately. The view-surface is divided into NX (horizontally) by NY (vertically) panels. When the view surface has been subdivided in this way, PGPAGE moves the plotter to the next panel, and only clears the screen or loads a new piece of paper if there are no panels left on the current page. In addition to selecting the view surface, PGBEG also defines a default viewport and window. It is good practice, however, to define the viewport and window explicitly as described below.
3.3 Defining the Viewport
A viewport is a rectangular portion of the plotting surface onto which the graph is mapped. PGPLOT has a default viewport which is centered on the plotting surface and leaves sufficient space around it for annotation. The application program can redefine the viewport by calling routine PGSVP or PGVSIZ.

PGSVP defines the viewport in a device-independent manner, using a coordinate system whose coordinates run from 0 to 1 in both x and y. This coordinate system is called normalized device coordinate space. For example, if we wish to divide the view surface into four quadrants and map a different plot onto each quadrant, we can define a new viewport before starting each plot. PGSVP has the format:
CALL PGSVP (XMIN, XMAX, YMIN, YMAX)
For example, to map the viewport onto the upper left quadrant of the view surface:
CALL PGSVP (0.0, 0.5, 0.5, 1.0)
(Note that this does not leave room around the edge of the viewport for annotation.)
PGVSIZ defines the viewport in absolute coordinates (inches); it should only be used when it is known how big the view surface is and a definite plot scale is required. The arguments are the same as for PGSVP, but measured in inches from the bottom left corner of the view surface. For example:
CALL PGVSIZ (1.5, 9.5, 1.5, 6.5)
defines a rectangular viewport 8 by 5 inches, offset 1.5 inches from the bottom and left edges of the view surface.
PGVSTD defines a standard viewport, the size of which depends on the particular device being used, and on the current character size (it uses the whole view surface excluding a margin of four character heights all around):
CALL PGVSTD
This is the default viewport set up by PGBEG.
Note that the viewport must be defined before calling any routines that would actually generate a display. The viewport may, however, be changed at any time: this will affect the appearance of objects drawn later in the program.
3.4 Defining the Window
The program defines the window by calling routine PGSWIN, whose arguments specify the world-coordinate limits of the window along each coordinate axis, e.g.
CALL PGSWIN (1975.0, 1984.0, 5.0, 20.0)

specifies that the x-axis (epoch) is going to run (left to right) from 1975 to 1984, and the y-axis (flux density) is going to run (bottom to top) from 5 to 20~Jy. Note that the arguments are floating-point numbers (Fortran REAL variables or constants), and require decimal points. If the order of either the x pair or the y pair is reversed, the corresponding axis will point in the opposite sense, \ie, right to left for x or top to bottom for y. PGPLOT uses the window specification to construct a mapping that causes the image of the window to coincide with the viewport on the view surface. Furthermore, PGPLOT ``clips'' lines so that only those portions of objects that lie within the window are displayed on the view surface.
Like the viewport, the window must be defined before drawing any objects. The window can be defined either before or after the viewport: the effect will be the same. The default window, set up by PGBEG, has x limits 0.0--1.0 and y limits 0.0--1.0.
If the ratio of the sides of the window does not equal the ratio of the sides of the viewport, the mapping of the world coordinates onto the view surface results in an image whose shape is compressed in either x or y. One way to avoid this compression is to carefully choose the viewport to have the same aspect ratio as the window. Routine PGWNAD can do this: it defines the window and simultaneously adjusts the viewport to have the same aspect ratio as the window. The new viewport is the largest that can fit inside the old one, and is centered in the old one.
3.5 Annotating the Viewport
For a simple graph, it is usually necessary to draw a frame around the viewport and label the frame with tick marks and numeric labels. This can be done with the routine PGBOX. For our sample graph, the call might be:
CALL PGBOX ('BCTN', 0.0, 0, 'BCNST', 0.0, 0)
Another routine, PGLAB, provides text labels for the bottom, left hand side, and top of the viewport:
CALL PGLAB ('Epoch', 'Flux Density (Jy)', 'Variation of 3C345 at 10.7 GHz')
The first two arguments provide explanations for the two axes; the third provides a title for the whole plot. Note that unlike all the other plotting routines, the lines and characters drawn by PGBOX and PGLAB are not clipped at the boundaries of the window. PGLAB actually calls a more general routine, PGMTXT, which can be used for plotting labels at any point relative to the viewport.

The amount of space needed outside the viewport for annotation depends on the exact options specified in PGBOX; usually four character heights will be sufficient, and this is the amount allowed when the standard viewport (created by PGVSTD) is used. The character height can be changed by using routine PGSCH.
3.6 Routine PGENV
Having to specify calls to PGPAGE, PGSVP, PGSWIN, and PGBOX is excessively cumbersome for drawing simple graphs. Routine PGENV (for PGplot ENVironment) combines all four of these in one subroutine, using the standard viewport, and a limited set of the capabilities of PGBOX. For example, the graph described above could be initiated by the following call:
CALL PGENV (1975.0, 1984.0, 5.0, 20.0, 0, 0)
which is equivalent to the following series of calls:
CALL PGPAGECALL PGVSTDCALL PGSWIN (1975.0, 1984.0, 5.0, 20.0)CALL PGBOX ('BCNST', 0.0, 0, 'BCNST', 0.0, 0)
PGENV uses the standard viewport. The first four arguments define the world-coordinate limits of the window. The fifth argument can be 0 or 1; if it is 1, PGENV calls PGWNAD instead of PGSWIN so that the plot has equal scales in x and y. The sixth argument controls the amount of annotation.
Next: Chapter 4
PGPLOT
Tim Pearson, California Institute of Technology, tjp戢stro.caltech.edu
Copyright © 1995 California Institute of Technology

4. Primitives
4.1 Introduction
Having selected a view surface and defined the viewport and the window, we are ready to draw the substance of the image that is to appear within the viewport. This chapter describes the most basic routines, called primitives, that can be used for drawing elements of the image. There are four different sorts of primitive: lines, graph-markers, text, and area fill. Chapter 5 explains how to change the attributes of these primitives, e.g., color, line-style, text font; and Chapter 6 describes some higher-level routines that simplify the composition of images that would require a large number of calls to the primitive routines.
The primitive routines can be used in any combination and order after the viewport and window have been defined. They all indicate where the primitive is to appear on the view surface by specifying world coordinates. See the subroutine descriptions in Appendix A for more details.
4.2 Clipping
The primitives are ``clipped'' at the edge of the viewport: any parts of the image that would appear outside the viewport are suppressed. The various primitives behave slightly differently. A line is clipped where it crosses the edge of the viewport. A graph marker is plotted if the center (the point marked) lies within or on the edge of the viewport; otherwise it is suppressed. Text, which is usually used for annotation, is not clipped (except at the edge of the view surface. A filled area is clipped at the edge of the viewport.
4.3 Lines
The primitive line-drawing routine is PGLINE. This draws one or more connected
straight-line segments (generally called a polyline in computer graphics). It has three arguments: the number (N) of points defining the polyline, and two arrays (XPTS and YPTS) containing the world x and y-coordinates of the points. The polyline consists of N-1 straight-line segments connecting points 1--2, 2--3, ..., (N-1)--N:
CALL PGLINE (N, XPTS, YPTS)
The two routines PGMOVE and PGDRAW are even more primitive than PGLINE, in
the sense that any line graph can be produced by calling these two routines alone. In

general, PGLINE should be preferred, as it is more modular. PGMOVE and PGDRAW are provided for those who are used to Calcomp-style plotting packages. PGMOVE moves the plotter ``pen'' to a specified point, without drawing a line (``pen up''). It has two arguments: the world-coordinates of the required new pen position. PGDRAW moves the plotter ``pen'' from its current position (defined by the last call of PGMOVE or PGDRAW) to a new point, drawing a straight line as it goes (``pen down''). The above call to PGLINE could be replaced by the following:
CALL PGMOVE (XPTS(1), YPTS(1)) DO I=2,N CALL PGDRAW (XPTS(I), YPTS(I)) END DO
4.4 Graph Markers
A Graph Marker is a symbol, such as a cross, dot, or circle, drawn on a graph to mark a specific point. Usually the symbol used will be chosen to be symmetrical with a well-defined center. The routine PGPT draws one or more graph markers
(sometimes called a polymarker). It has four arguments: the number (N) of points to mark, two arrays (XPTS and YPTS) containing the world x and y-coordinates of the points, and a number (NSYM) identifying the symbol to use:
CALL PGPT (N, XPTS, YPTS, NSYM)
The symbol number can be: -1, to draw a dot of the smallest possible size (one pixel); 0--31, to draw any one of the symbols in Figure 4.1; -3 - -8, to draw regular polygon
with 3--8 sides; 33--127, to draw the corresponding ASCII character (the character is taken from the currently selected text font); or >127, to draw one of the Hershey symbols from Appendix B. The Fortran ICHAR function can be used to obtain the
ASCII value; e.g., to use letter F :
CALL PGPT (1, 0.5, 0.75, ICHAR('F') )
4.5 Text
The Text primitive routine is used for writing labels and titles on the image. It converts an internal computer representation of the text (ASCII codes) into readable text. The simplest routine for writing text is PGTEXT, which writes a horizontal
character string starting at a specific (x,y) world coordinate position, e.g.,
CALL PGTEXT (X, Y, 'A text string')

PGTEXT is actually a simplified interface to the more general primitive routine PGPTXT, which allows one to change orientation and justification of the text, e.g.,
CALL PGPTXT (X, Y, 45.0, 0.5, 'A text string')
writes the text at an angle of 45 degrees to the horizontal, centered at (x,y).
Both PGTEXT and PGPTXT require the position of the text string to be specified in world coordinates. When annotating a graph, it is usually more convenient to position the text relative to the edge of the viewport, rather than in world-coordinate space. The routine PGMTXT is provided for this, and PGLAB provides
a simple interface to PGMTXT for the normal job of annotating an (x,y) graph.
The appearance of text can be altered by specifying a number of attributes, described in the next chapter. In particular, the character size and character font can be changed. Figure 4.2 illustrates some of the possibilities.
To include one of the graph marker symbols (0--32) in a text string, use the Fortran CHAR function, e.g.,
CALL PGTEXT (X, Y, 'Points marked with '//CHAR(17))
4.5.1 Escape Sequences
The routine PGPTXT (and all the PGPLOT routines which call it, e.g., PGTEXT, PGLAB) allows one to include escape sequences in the text string to be plotted. These are character-sequences that are not plotted, but are interpreted as instructions to change font, draw superscripts or subscripts, draw non-ASCII characters (e.g., Greek letters), etc. All escape sequences start with a backslash character (\). The following escape sequences are defined (the letter following the \ may be either upper or lower case):
\u start a superscript, or end a subscript
\dstart a subscript, or end a superscript (note that \u and \d must always be used in pairs)
\bbackspace (i.e., do not advance text pointer after plotting the previous character)
\fn switch to Normal font (1)
\fr switch to Roman font (2)
\fi switch to Italic font (3)

\fs switch to Script font (4)
\\ backslash character (\)
\x multiplication sign (×)
\. centered dot (·)
\A ångström symbol (Å)
\gx greek letter corresponding to roman letter x, as indicated in Figure 4.3
\mn \mnn
graph marker number n or nn (1-31), as indicated in Figure 4.1
\(nnnn)
character number nnnn (1 to 4 decimal digits) from the Hershey character set; the closing parenthesis may be omitted if the next character is neither a digit nor ``)''. This makes a number of special characters (e.g., mathematical, musical, astronomical, and cartographical symbols) available. See Appendix B for a list of available characters.
4.6 Area Fill: Polygons, Rectangles, and Circles
The Area Fill primitives allow the programmer to shade the interior of an arbitrary polygonal or circular region. The appearance of the primitive is controlled by attributes fill area style and color index (see Chapter 5). Note that one fill-style option is hollow, i.e., draw the outline only.
The routine PGPOLY is used to fill an area defined as a polygon. It has three
arguments: the number (N) of vertices defining the polygon, and two arrays (XPTS and YPTS) containing the world x and y-coordinates of the vertices:
CALL PGPOLY (N, XPTS, YPTS)
If the polygon is not convex, it may not be obvious which points in the image are inside the polygon. PGPLOT assumes that a point is inside the polygon if a straight line drawn from the point to infinity intersects an odd number of the polygon's edges.
For the special case of a rectangle with edges parallel to the coordinate axes, it is better to use routine PGRECT instead of PGPOLY; this routine will use the
hardware rectangle-fill capability if available. PGRECT has four arguments: the (x,y) world coordinates of two opposite corners (note the order of the arguments):
CALL PGRECT (X1, X2, Y1, Y2)
To draw a circle use routine PGIRC. This routine has three arguments: the (x,y),
world coordinates of the center, and the radius in world coordinates. Note that a

circle may appear elliptical if the world-coordinate scaling is not the same in x and y.
CALL PGCIRC (X, Y, RADIUS)
Next: Chapter 5
PGPLOT
Tim Pearson, California Institute of Technology, tjp戢stro.caltech.edu
Copyright © 1995 California Institute of Technology

Figure 4.1: PGPLOT standard graph markers
PGPLOT
Tim Pearson, California Institute of Technology, tjp戢stro.caltech.edu

Copyright © 1995 California Institute of Technology

Figure 4.2: Text Examples
PGPLOT
Tim Pearson, California Institute of Technology, tjp戢stro.caltech.edu
Copyright © 1995 California Institute of Technology

Figure 4.3: Escape Sequences for Greek Letters
PGPLOT
Tim Pearson, California Institute of Technology, tjp戢stro.caltech.edu
Copyright © 1995 California Institute of Technology

5. Attributes
5.1 Introduction
The appearance of the primitive elements of a graphical image (lines, graph-markers, text, and area-fill) can be changed by specifying primitive attributes. The attributes, and the corresponding routines for changing them, are:
Color Index: PGSCI.
Color Representation: PGSCR, PGSCRN, and PGSHLS.
Line Style: PGSLS.
Line Width: PGSLW.
Character Height: PGSCH.
Character Font: PGSCF.
Text Background: PGSTBG.
Fill-area Style: PGSFS, PGSHS.
The routines to change attributes can be freely intermixed with the PGPLOT drawing routines. Once an attribute has been changed by a call to the appropriate routine, it remains in effect for all subsequent plotting until it is changed again. In addition to the routines that set attributes (PGSxx) there are routines for determining the current value of each attribute (PGQxx). These make it possible to write subroutines which change attribute values temporarily but restore the old attributes before returning to the calling program.
5.2 Color Index
This attribute affects all the primitives: lines, graph-markers, text, and area-fill, and is controlled by routine PGSCI.
Devices differ considerably in their ability to draw in more than one color. On most hardcopy devices, the default color is black on a white background, while on most CRT devices, it is white on a black background. Color is selected using an integer

parameter called the color index. Color index 1 is the default color, and color index 0 is the background color. The number of different color indices available depends on the device. On most monochrome devices, only color indices 0 and 1 are available, while some color CRT devices may permit color indices from 0 to 255. On some monochrome devices, color index can be used to select different brightnesses (intensities).
Color index 0, the background color, can be used to ``erase'' elements from a picture by overwriting them with color index 0. Note that not all devices are capable of this: e.g., Tektronix storage-tube terminals and pen-plotters cannot erase part of a displayed picture.
To select a new color index for subsequent plotting, use routine PGSCI (Set Color
Index), e.g..
CALL PGSCI(2) CALL PGLINE(100, XP, YP) CALL PGSCI(3) CALL PGPT(15, XP, YP, 17)
Appendix D lists the capabilities of the devices for plotting in color and variable
intensity. The default color index is 1; all devices accept this. Most devices also accept color index 0 (background or erase), and several accept color index up to 15 or more. The maximum color index is the number of different colors that can be displayed at once. Some devices permit the assignment of colors to color indices to be changed (by calling PGSCR, see below). The range of color indices available on
the active device can be determined by calling routine PGQCOL. The lower limit is
always either 0 or 1, and the upper limit can be in the range 1 to 255.
5.3 Color Representation
Each color index has an associated Color Representation, which defines the associated color and intensity. Color Representation may be expressed by a set of three numbers, either the Hue, Lightness, and Saturation (H,L,S) components or the Red, Green, and Blue (R,G,B) components. (R,G,B) are quantities in the range 0.0 to 1.0, with 1.0 being maximum intensity; if R=G=B the color is a shade of gray. In the (H,L,S) system, hue is a cyclic quantity expressed as an angle in the range 0 to 360, while L and S are in the range 0.0 to 1.0.
The following table and Figure 5.1 show how the color indices are defined on most
devices when PGPLOT is started. Note that these assignments are device-dependent, and in particular some devices plot in black on white background (color index 0 = white, color index 1 = black), while others plot in white on black background (color index 0 = black, color index 1 = white). Color indices 0-15 have

these predefined color representations, but these may be changed with by calling PGSCR, PGSCRN, or PGSHLS. Color indices 16-maximum have no predefined representations: if these indices are used, one of these routines must be called to define the representation.
Table 5.1. Default Color Representation
ColorIndex Color (H, L, S) (R, G, B)
0 Black (background) 0, 0.00, 0.00 0.00, 0.00, 0.00 1 White (default) 0, 1.00, 0.00 1.00, 1.00, 1.00 2 Red 120, 0.50, 1.00 1.00, 0.00, 0.00 3 Green 240, 0.50, 1.00 0.00, 1.00, 0.00 4 Blue 0, 0.50, 1.00 0.00, 0.00, 1.00 5 Cyan (Green + Blue) 300, 0.50, 1.00 0.00, 1.00, 1.00 6 Magenta (Red + Blue) 60, 0.50, 1.00 1.00, 0.00, 1.00 7 Yellow (Red + Green) 180, 0.50, 1.00 1.00, 1.00, 0.00 8 Red + Yellow (Orange) 150, 0.50, 1.00 1.00, 0.50, 0.00 9 Green + Yellow 210, 0.50, 1.00 0.50, 1.00, 0.0010 Green + Cyan 270, 0.50, 1.00 0.00, 1.00, 0.5011 Blue + Cyan 330, 0.50, 1.00 0.00, 0.50, 1.0012 Blue + Magenta 30, 0.50, 1.00 0.50, 0.00, 1.0013 Red + Magenta 90, 0.50, 1.00 1.00, 0.00, 0.5014 Dark Gray 0, 0.33, 0.00 0.33, 0.33, 0.3315 Light Gray 0, 0.66, 0.00 0.66, 0.66, 0.6616--255 Undefined
On some devices, but not all, the assignments of colors to color indices can be changed by calling routine PGSCR, to specify the color in terms of its (R,G,B)
components, PGSHLS, to specify the color in terms of its (H,L,S) components, or
PGSCRN, to specify the color by name. Note that color-index 0, the background
color, can be redefined in this way.
The effect of changing color representation is device-dependent. Devices usually fall into one of three classes: static color (unchangeable representation), pseudo-color (color lookup table), and direct color. On static color devices (e.g., pen plotters, Printronix printer, Tektronix terminal), attempts to change the color representation are ignored. On pseudo-color devices (e.g., most X Window devices), changing the color representation of index J changes the lookup table. Pixels already drawn with index J change to the new color, as do subsequent ones. On direct color devices (e.g., PostScript color printers, some X Window devices), changing color representation only affects the color of pixels drawn with that color index later in the program.

On monochrome devices which can display a range of intensities, the displayed intensity I is calculated from the requested (R,G,B) intensities by the following formula:
I = 0.30 R + 0.59 G + 0.11 B
as in the NTSC encoding used by US color television systems.
Setting Color Representation in the RGB System
Use routine PGSCR, which requires red, green, and blue values in the range 0.0
(dark) to 1.0 (maximum intensity). The following example changes color index 2 to dark blue:
CALL PGSCR(2, 0.0, 0.0, 0.3)
Note that most devices do not have an infinite range of colors or monochrome intensities available; the nearest available color is used. Examples: for black, set R = G = B = 0.0; for white, set R = G = B = 1.0; for medium gray, set R = G = B = 0.5; for medium yellow, set R = G = 0.5, B = 0.0.
Setting Color Representation in the HLS System
The HLS, or Hue-Saturation-Lightness, system is an alternative to RGB for specifying color representation. Use routine PGSHLS instead of PGSCR. Hue is
represented by an angle in degrees, with red at 120, green at 240, and blue at 0 (or 360). Lightness ranges from 0.0 to 1.0, with black at lightness 0.0 and white at lightness 1.0. Saturation ranges from 0.0 (gray) to 1.0 (pure color). Hue is irrelevant when saturation is 0.0.
Examples: H L S R G B black any 0.0 0.0 0.0 0.0 0.0 white any 1.0 0.0 1.0 1.0 1.0 medium gray any 0.5 0.0 0.5 0.5 0.5 red 120 0.5 1.0 1.0 0.0 0.0 yellow 180 0.5 1.0 1.0 1.0 0.0 pink 120 0.7 0.8 0.94 0.46 0.46
Reference: SIGGRAPH Status Report of the Graphic Standards Planning Committee, Computer Graphics, Vol.13, No.3, Association for Computing Machinery, New York, NY, 1979. See also: J. D. Foley et al., ``Computer Graphics: Principles and Practice'', second edition, Addison-Wesley, 1990, section 13.3.5.
Setting Color Representation by Name

A third alternative to PGSCR and PGSHLS is routine PGSCRN, which specifies
color by name. For example,
CALL PGSCRN(2, 'MediumOrchid', IER)
The name is converted to R,G,B intensities by consulting an external file which is read the first time that PGSCRN is called. The name of the external file is found as follows:
1. if environment variable (logical name) PGPLOT_RGB is defined, ts value is used as the file name;
2. otherwise, if environment variable PGPLOT_DIR is defined, a file rgb.txt in the directory named by this environment variable is used;
3. otherwise, file rgb.txt in the current directory is used. 4. If all of these fail to find a file, an error is reported and the routine does
nothing.
Each line of the file defines one color, with four blank- or tab-separated fields per line. The first three fields are the R, G, B components, which are integers in the range 0 (zero intensity) to 255 (maximum intensity). The fourth field is the color name. The color name may include embedded blanks. The file rgb.txt distributed
with PGPLOT is based on the standard list of color names supported by the X-window system.
Setting Background and Foreground colors at run time
The device-dependent default color representation of color indices 0 (background) and 1 (foreground) can be overridden at run time by defining environment variables PGPLOT_BACKGROUND and PGPOLOT_FOREGROUND. The values of these variables are color names, as used by routine PGSCRN. For example, to ensure that all devices use a black foreground on a white background, on a UNIX system, type
setenv PGPLOT_FOREGROUND black setenv PGPLOT_BACKGROUND white
before running the PGPLOT program. Or you can be more creative, e.g.,
setenv PGPLOT_FOREGROUND goldsetenv PGPLOT_BACKGROUND slategrey
On direct color devices (e.g., PostScript), it is necessary to fill the view surface with the background color (by calling routine PGERAS) for a change in color

representation to affect the whole view surface.
5.4 Line Style
Line Style can be, e.g., solid, dashed, or dotted. The attribute affects only lines, not the other primitives. It is controlled by subroutine PGSLS. The default line style is
a full, unbroken line. Line style is described by an integer code:
● 1: full line, ● 2: long dashes, ● 3: dash-dot-dash-dot, ● 4: dotted, ● 5: dash-dot-dot-dot.
To change the line style, use routine PGSLS. For example, to draw a dashed line:
CALL PGSLS(2) CALL PGLINE(620, X, Y) CALL PGSLS(1)
5.5 Line Width
Line Width affects lines, graph-markers, and text. It is specified with routinePGSLS, which takes an integer argument specifying the line-width
multilpier. The exact appearance of thick lines is device-dependent---it depends on the resolution of the device---but on most devices PGPLOT attempts to make the line-width unit equal to 0.005 inches (0.13 mm). The default width is 1, and the maximum that may be specified is 201. Requesting a line-width of 10, say, will give lines that are approximately 1/20 inch thick. e.g.,
CALL PGSLW(5)
5.6 Character Height
Character Height affects graph-markers and text. Character height is specified as a multiple of the default character height; the default character height one-fortieth of the height or width of the view surface (whichever is less). To change the character height, use routine PGSCH. Note that the argument is a real variable or constant, not
an integer like the other attribute routines. The following example is part of the program used to draw Figure 4.2:
CALL PGSCH(1.5)

CALL PGSLW(3) CALL PGTEXT(0.05,10.0,'Bigger (1.5)') CALL PGSCH(0.5) CALL PGSLW(1) CALL PGTEXT(0.5,10.0,'Smaller (0.5)') CALL PGSCH(1.0)
5.7 Character Font
Character Font affects text only. Four fonts are available. The default font (1) is simple and is the fastest to draw. The font is defined by an integer code:
● 1: normal (simple) font (default), ● 2: roman font, ● 3: italic font, ● 4: script font.
To change the character font, use routine PGSCF; it is also possible to change the
font temporarily by using escape sequences (see Chapter 4). For example, the following code generates text in roman font:
INTEGER ROMAN PARAMETER (ROMAN=2) ... CALL PGSCF(ROMAN) CALL PGTEXT(X, Y, 'SPQR')
5.8 Text Background
This attribute affects the appearance of text. Text may be either transparent (the default), in which case underlying graphics show between the characters of the text, or opaque, in which case the bounding box of the text is filled with a specified color before drawing the text characters. Use routine PGSTBG to specify the text
background; the argument is an integer which may be
● -1: to select transparent text (the default), or ● 0 - 255: to select opaque text, with the argument specifying the color index of
the text background. Use color index 0 to erase underlying graphics before drawing text.
If the color index specified by PGSTBG is the same as that specified by PGSCI, then text will be written on a background of the same color and will be unreadable.

The following code draws yellow test on a blue background:
INTEGER YELLOW, BLUE PARAMETER (BLUE=4, YELLOW=7) ... CALL PGSCI(YELLOW) CALL PGSTBG(BLUE) CALL PGTEXT(X, Y, 'SPQR')
5.9 Fill-Area Style
Fill-Area Style can be solid (fill the area with the current color), outline (only the outline of the polygon is drawn), hatched (the region is shaded with parallel lines) or cross-hatched (the region is shaded with two sets of perpendicular lines). The style is defined by an integer code:
● 1: solid (default), ● 2: outline, ● 3: hatched, ● 4: cross-hatched.
These are illustrated in Figure 5.2.
Fill-area style applies to polygons (PGPOLY), circles (PGCIRC), and rectangles
(PGRECT).
To change the fill-area style, use routine PGSFS. The following example uses both
outline and solid fill: it first erases a rectangle (using color index 0 and fill-area style 1), and then draws a frame around it (using color index 1 and fill-area style 2):
CALL PGSCI(0) CALL PGSFS(1) CALL PGRECT(0.31, 0.69, 0.85, 0.97) CALL PGSCI(1) CALL PGSFS(2) CALL PGRECT(0.31, 0.69, 0.85, 0.97)
The spacing and orientation of the hatching lines in styles 3 and 4 can be changed by calling routine PGSHS.
5.10 The Inquiry Routines
The current setting of each attribute can be determined with an inquiry routine, e.g.,
PGQCH to determine the current character height. A general-purpose subroutine
that needs to change attributes temporarily should first determine the current settings and then restore them before finishing, e.g.,
INTEGER LW, CI* save the current attributes CALL PGQLW(LW) CALL PGQCI(CI)* change the attributes and draw something CALL PGSLW(2) CALL PGSCI(11) CALL PGLINE(7, X, Y)* restore the attributes CALL PGSLW(LW) CALL PGSCI(CI) RETURN
There are also inquiry routines for determining the current window (PGQWIN),
current viewport (PGQVP), and current pen position for use with PGMOVE and
PGDRAW (PGQPOS).
5.11 Saving and Restoring Attributes
It is sometimes convenient to change the current attributes temporarily, to draw a small prt of a picture, for example, and then restore them to their previous settings. This can be accomplished with the routines PGSAVE and PGUNSA.
PGSAVE saves the current PGPLOT attributes in a private storage area. They can
be restored by calling PGUNSA (unsave). Attributes saved are: character font,
character height, color index, fill-area style, line style, line width, pen position, arrow-head style, hatching style. Color representation is not saved.
Calls to PGSAVE and PGUNSA should always be paired. Up to 20 copies of the attributes may be saved. PGUNSA always retrieves the last-saved values (last-in first-out stack).
Note that when multiple devices are in use, PGUNSA retrieves the values saved by the last PGSAVE call, even if they were for a different device.
The example in the previous section can be written more simply as:
* save the current attributes CALL PGSAVE

* change the attributes and draw something CALL PGSLW(2) CALL PGSCI(11) CALL PGLINE(7, X, Y)* restore the attributes CALL PGUNSA RETURN
Next: Chapter 6
PGPLOT
Tim Pearson, California Institute of Technology, tjp戢stro.caltech.edu
Copyright © 1995-1997 California Institute of Technology

Figure 5.1 Default color representations of color indices 0-15 on most color and gray-scale devices.
Note: Some Web browsers may not display the colors correctly. The PostScript
version of the figure may be more reliable.

PGPLOT
Tim Pearson, California Institute of Technology, tjp戢stro.caltech.edu
Copyright © 1995 California Institute of Technology

Figure 5.2 Fill-Area Styles: illustrated with PGPOLY, PGCIRC, and PGRECT.
PGPLOT
Tim Pearson, California Institute of Technology, tjp戢stro.caltech.edu
Copyright © 1995 California Institute of Technology

Higher-Level Routines
Introduction
This chapter describes a number of ``high level'' routines that simplify the composition of complicated graphical images. They include routines for drawing graphs of one variable or function against another (``xy-plots''), histograms, and display of two-dimensional data (functions of two variables). Rather than giving complete details of all the available routines, this chapter just points out some of the ways that they can be used. See Appendix A for details of the calling sequences.
XY-plots
The basic technique for drawing xy-plots is described in Chapter 2, which showed how to make scatter plots using graph markers produced by PGPT and line plots produced by PGLINE. Considerable variation in the appearance of the graph can be achieved using the following techniques.
Attributes
Use different attributes to distinguish different datasets. Graph markers can be distinguished by choosing different markers, different colors, or different sizes (character height attribute). Lines and curves can be distinguished by line-style, color, or line-width.
Box parameters
If routine PGENV is replaced by calls to the more basic routines (see Section 3.6), including PGBOX, considerable variety in the appearance of the graph can be achieved. For example, one can suppress the tick marks, draw the tick marks projecting out of the box instead of into it, or draw a grid over the whole viewport. Note that PGBOX may be called many times: one might call it once to draw a grid using thin dotted lines, and again to draw the frame and tick marks using thick lines:
CALL PGSLW(1) CALL PGSLS(4) CALL PGBOX('G',30.0,0,'G',0.2,0) CALL PGSLW(3) CALL PGSLS(1) CALL PGBOX('ABCTSN',90.0,3,'ABCTSNV',0.0,0)

Note that in this example we have also specified tick intervals explicitly. If the horizontal axis is to represent an angle in degrees, it is convenient to choose a tick interval that is a simple fraction of 360; here we have a major tick interval of 90 degrees and a minor tick interval of 30 degrees.
Stepped-line plots
As an alternative to PGLINE, which ``joins up the dots'' using straight line segments, it is sometimes appropriate to use PGBIN which produces a ``stepped line plot'' (sometimes misleadingly called a histogram) with horizontal line segments at each data point and vertical line segments joining them. This is often used, for example, in displaying digitized spectra.
Error bars
Graphs of real data often require the inclusion of error bars. The two routines PGERRX and PGERRY draw horizontal and vertical error bars, respectively. These routines are usually used in combination with PGPT, e.g., to draw a set of points with 2-sigma error-bars:
DO 10 I=1,15 YHI = YPTS(I) + 2.0*ERR(I) YLO = YPTS(I) - 2.0*ERR(I) CALL PGPT(1, XPTS(I), YPTS(I), 17) CALL PGERRY(1, XPTS(I), YLO, YHI, 1.0) 10 CONTINUE
Logarithmic axes
It is commonly required that the x-axis, the y-axis, or both, be logarithmic instead of linear; that is, one wishes to plot the logarithm of the quantity instead of its actual value. PGPLOT doesn't provide any automatic mechanism to do this: one has to adopt log10 x and/or log10 y instead of x and y as world-coordinates; i.e., if the range
of x is to be 1 to 1000, choose as world-coordinate limits for the window log 1 = 0.0 and log 1000 = 3.0, and supply the logarithms of x to PGPT and PGLINE. However, PGENV and PGBOX have options for labeling the axis logarithmically; if this option is used in our example, the axis will have labeled major tick marks at 1, 10, 100, and 1000, with logarithmically-spaced minor tick marks at 2, 3, 4, ..., 20, 30, 40, etc. An example may make this clearer:
CALL PGENV(-2.0,2.0,-0.5,2.5,1,30) CALL PGLAB('Frequency, \gn (GHz)', 1 'Flux Density, S\d\gn\u (Jy)', ' ') DO 10 I=1,15

XPTS(I) = ALOG10(FREQ(I)) YPTS(I) = ALOG10(FLUX(I)) 10 CONTINUE CALL PGPT(15, XPTS, YPTS, 17)
This is a fragment of a program to draw the spectrum of a radio source, which is usually plotted as a log--log plot of flux density v. frequency. It first calls PGENV to initialize the viewport and window; the AXIS argument is 30 so both axes will be logarithmic. The x-axis (frequency) runs from 0.01 to 100 GHz, the y-axis (flux density) runs from 0.3 to 300 Jy. Note that it is necessary to specify the logarithms of these limits in the call to PGENV. The penultimate argument requests equal scales in x and y so that slopes will be correct. The program then marks 15 data points, supplying the logarithms of frequency and flux density to PGPT.
Histograms
The routine PGHIST draws a histogram, that is, the frequency distribution of measured values in a dataset. Suppose we have 500 measurements of a quantity (the sky brightness temperature at 20 GHz, say, in mK) stored in Fortran array VALUES. The following program-fragment draws a histogram of the distribution of these values in the range 0.0 to 5.0, using 25 bins (so that each bin is 0.2 K wide, the first running from 0.0 to 0.2, the second from 0.2 to 0.4, etc.):
DO 10 I=1,500 VALUES(I) = .... 10 CONTINUE CALL PGHIST(500, VALUES, 0.00, 5.00, 25, 0) CALL PGLAB('Temperature (K)', 1 'Number of measurements', 2 'Sky Brightness at 20 GHz' )
The histogram does not depend on the order of the values within the array.
Functions of two variables
A function of two variables, f(x,y), really needs a three-dimensional display. PGPLOT does not have any three-dimensional display capability, but it provides three methods for two-dimensional display of three-dimensional data.
Contour maps
In a contour map of f(x,y), the world-coordinates are x and y and the contours are lines of constant f. The PGPLOT contouring routines (PGCONT and PGCONS)

require the input data to be stored in a two-dimensional Fortran array F, with element F(I,J) containing the value of the function f(x,y) for a point (xi, yj).
Furthermore, the function must be sampled on a regular grid: the (x,y) coordinates corresponding to (I,J) must be related to I and J by:
x = a + bI + cJ,y = d + eI + fJ.
The constants a, b, c, d, e, f are supplied to PGCONT in a six-element Fortran array. The other input required is an array containing the contour values, i.e., the constant values of f corresponding to each contour to be drawn. In the following example, we assume that values have been assigned to the elements of array F. We first find the maximum and minimum values of F, and choose 10 contour levels evenly spaced between the maximum and minimum:
REAL F(50,50), ALEV(10), TR(6) ... FMIN = F(1,1) FMAX = F(1,1) DO 300 I=1,50 DO 200 J=1,50 FMIN = MIN(F(I,J),FMIN) FMAX = MAX(F(I,J),FMAX) 200 CONTINUE 300 CONTINUE DO 400 I=1,10 ALEV(I) = FMIN + (I-1)*(FMAX-FMIN)/9.0 400 CONTINUE
Next, we choose a window and viewport, and set up an array TR containing the 6 constants in the transformation between array indices and world coordinates. In this case, the transformation is simple, as we want x = I, y = J:
CALL PGENV(0.,50.,5.,45.,0,2) TR(1) = 0.0 TR(2) = 1.0 TR(3) = 0.0 TR(4) = 0.0 TR(5) = 0.0 TR(6) = 1.0
Finally, we call PGCONT; actually, we call it twice, to draw the first five contours in color index 2 (red) and the remaining 5 in color index 3 (green):

CALL PGSCI(2) CALL PGCONT(F,50,50,1,50,1,50,ALEV,5,TR) CALL PGSCI(3) CALL PGCONT(F,50,50,1,50,1,50,ALEV(6),5,TR)
Normally PGCONT is preferable to PGCONS. See the description in Appendix A for suggestions as to when PGCONS should be used.
Gray-scale plots
The routine PGGRAY is used in a similar way to PGCONT. Instead of drawing contours, it shades the interior of the viewport, the intensity of shading representing the value of the function at each point. The exact appearance of the resulting ``image'' is device-dependent. On some devices, PGGRAY does the shading by drawing many dots, so it can be very slow.
Cross sections
Routine PGHI2D draws a series of cross-sections through a two-dimensional data array. Each cross-section ``hides'' those that appear behind it, giving a three-dimensional effect. See Appendix A for details.

7. Interactive Graphics
7.1 Introduction
The previous chapters have described how to produce a static graphical image: if the same program is run twice with the same input parameters, the same image will result. An interactive program allows the user to control the behavior of the program with a graphical input device. PGPLOT supports a limited interactive capability on devices with a cursor for graphical input (e.g., Xwindow workstations, some Tektronix terminals and emulators). The capabilities are necessarily limited by the aim to keep PGPLOT device-independent.
7.2 The Cursor
Some of the graphics devices supported by PGPLOT have a graphics cursor. This appears on the view surface as a plus sign, a cross-hair, or a diamond, and can be moved around the view surface with a mouse, joy-stick, or trackball attached to the graphics device. If the hardware does not provide this mechanism, PGPLOT allows the user to move the cursor using the arrow keys on his terminal. See Appendix D for
instructions for using the cursor on a specific device.
7.3 Using the Cursor
The basic routines for cursor input are PGCURS and PGBAND. Routine PGCURS
enables the cursor on the selected device, positions it at a specified location within the viewport, and allows the user to move it. When the user has positioned the cursor, he types a key on his terminal; PGCURS returns the cursor position (in world coordinates) and the character that was typed. On some devices the user can also click (depress and release) a mouse button. Buttons 1, 2, 3 have the same effect as typing A, D, or X. Routine PGBAND is similar to PGCURS but has additional
options that request that a visible line (``rubber band'') or rectangle join the cursor position to a fixed point and track it as it moves. These options are not available on every device that supports a cursor.
In addition, PGPLOT provides three higher-level routines for cursor input: PGOLIN, PGNCUR, and PGLCUR. These three routines require that the device has erase capability.
PGOLIN allows the user to specify a set of points within the viewport, with the
capability of correcting mistakes. Interactive commands (single characters [A, D, or X] typed on the keyboard) allow the user to add a point at the current cursor
position, delete the last-entered point, or exit from the subroutine. The world-coordinates of the entered points are returned to the calling program. The following program fragment illustrates the use of PGOLIN; the user supplies NPT (up to 50) points with world-coordinates X() and Y(), and the program then shades the polygon defined by these points by calling PGPOLY:
INTEGER NPT REAL X(50), Y(50) ... WRITE (6,*) 'Use the cursor to draw a polygon' WRITE (6,*) 'Type A to add point, D to delete, X to exit' NPT = 0 CALL PGOLIN (50, NPT, X, Y, 0) IF (NPT.GE.3) CALL PGPOLY (NPT, X, Y)
PGNCUR is similar to PGOLIN, but the points are sorted into increasing order of x
before being returned to the calling program. In addition, the delete command deletes the point nearest to the cursor, rather than the last-entered point. It can be used, for example, to allow the user to supply a set of points to represent the continuum level on a spectrum.
PGLCUR is similar to PGOLIN but instead of using a graph marker to mark each
entered point it draws a polyline through them.
7.4 Buffering
By default, PGPLOT ensures that the image seen on the view surface is up to date at all times; that is, each PGPLOT subroutine updates the image before returning control to the calling program. To improve efficiency, PGPLOT can save instructions for controlling the graphics device in a buffer, and only send them to the device when the buffer is filled up. This means that at any given moment, the image displayed on the screen may not be completely up to date. This can be a problem in an interactive program, where, for example, the user has to tell the program what to do next based on his interpretation of the current display. Three PGPLOT routines (PGBBUF, PGEBUF, and PGUPDT) are provided for controlling the buffering of output. All three routines have no arguments.
The routine PGBBUF causes PGPLOT to begin saving graphical output in a buffer.
The output is saved until (1) a matching PGEBUF call is made, or (2) the buffer fills up, or (3) the buffer is emptied by a call to PGUPDT, or (4) PGEND is called. The routine PGEBUF stops buffering and causes the buffered commands to be sent to the
output device. Calls to PGBBUF and PGEBUF should always be paired. PGBBUF increments an internal counter, while PGEBUF decrements this counter and flushes the buffer to the output device when the counter drops to zero. This allows a

subroutine to turn on and turn off buffering without disturbing any buffering that may have been established by the calling program.
Routine PGUPDT empties the buffer created by PGBBUF, but it does not alter the
internal counter. The routine should be called when it is essential that the display be completely up-to-date (before interaction with the user, for example) but it is not known if output is being buffered.
Usually output is not buffered; this is the default state established by PGBEG. The default behavior can be changed, however, by defining an environment variable
PGPLOT_BUFFER. If this variable is defined, with any value, PGBEG will start buffering output (by calling PGBBUF).
The following example shows how routine PGLAB might be implemented in terms of routine PGMTXT:
SUBROUTINE PGLAB (XLBL, YLBL, TOPLBL) CHARACTER*(*) XLBL, YLBL, TOPLBL CALL PGBBUF CALL PGMTXT('T', 2.0, 0.5, 0.5, TOPLBL) CALL PGMTXT('B', 3.2, 0.5, 0.5, XLBL) CALL PGMTXT('L', 2.2, 0.5, 0.5, YLBL) CALL PGEBUF END
The calls to PGBBUF and PGEBUF ensure that the output generated by the three calls to PGMTXT is buffered (i.e., sent to the output device as a single command instead of three separate ones). If buffering is already enabled by the program which calls PGLAB, the calls to PGBBUF and PGEBUF have no effect.
On some devices (e.g., X-Window workstations) use of buffering can greatly speed up the execution of a program.
Next: Appendix A
PGPLOT
Tim Pearson, California Institute of Technology, tjp戢stro.caltech.edu
Copyright © 1995 California Institute of Technology

PGPLOT Subroutine Descriptions
Introduction
This appendix includes a list of all the PGPLOT subroutines, and then gives detailed instructions for the use of each routine. The subroutine descriptions are in alphabetical order. For more information about PGPLOT, see the PGPLOT home
page.
Fortran Usage
The subroutine descriptions indicate the data type of each argument. When arguments are described as input, they may be replaced with constants or expressions in the CALL statement, but make sure that the constant or expression has the correct data type.
INTEGER arguments: these should be declared INTEGER or INTEGER*4 in the calling program, not INTEGER*2.
REAL arguments: these should be declared REAL or REAL*4 in the calling program, not REAL*8 or DOUBLE PRECISION.
LOGICAL arguments: these should be declared LOGICAL or LOGICAL*4 in the calling program.
CHARACTER arguments: any valid Fortran CHARACTER variable may be used (declared CHARACTER*n for some integer n).
C usage
A standard C synopsis indicating argument types is provided for each subroutine that has a C binding. The PGPLOT header file should be included in all programs that use these subroutines:
#include "cpgplot.h"
int arguments Input int arguments are passed by value, and non-int values will be converted to int; for output arguments, supply a pointer to int
float arguments Single-valued float arguments are passed by value, and non-float values (e.g.,

double) will be converted to float; for output arguments, supply a pointer to float. Array arguments are passed by address.
char* arguments For input, supply a pointer to a null-terminated string; for an output argument char *value, there is another argument int * value_length. value_length should be set to the maximum number of characters that may be stored in value before entry to the routine; it receives the actual number of characters used.
2-dimensional arrays Two-dimensional arrays should be packed in a one-dimensional C array, with the first index changing fastest.
Index of Routines
● PGARRO -- draw an arrow
● PGASK -- control new page prompting
● PGAXIS -- draw an axis
● PGBAND -- read cursor position, with anchor
● PGBBUF -- begin batch of output (buffer)
● PGBEG -- open a graphics device
● PGBIN -- histogram of binned data
● PGBOX -- draw labeled frame around viewport
● PGCIRC -- draw a circle, using fill-area attributes
● PGCLOS -- close the selected graphics device
● PGCONB -- contour map of a 2D data array, with blanking
● PGCONF -- fill between two contours
● PGCONL -- label contour map of a 2D data array
● PGCONS -- contour map of a 2D data array (fast algorithm)
● PGCONT -- contour map of a 2D data array (contour-following)
● PGCONX -- contour map of a 2D data array (non rectangular)
● PGCTAB -- install the color table to be used by PGIMAG
● PGCURS -- read cursor position
● PGDRAW -- draw a line from the current pen position to a point
● PGEBUF -- end batch of output (buffer)
● PGEND -- close all open graphics devices
● PGENV -- set window and viewport and draw labeled frame
● PGERAS -- erase all graphics from current page
● PGERR1 -- horizontal or vertical error bar
● PGERRB -- horizontal or vertical error bar
● PGERRX -- horizontal error bar
● PGERRY -- vertical error bar
● PGETXT -- erase text from graphics display

● PGFUNT -- function defined by X = F(T), Y = G(T)
● PGFUNX -- function defined by Y = F(X)
● PGFUNY -- function defined by X = F(Y)
● PGGRAY -- gray-scale map of a 2D data array
● PGHI2D -- cross-sections through a 2D data array
● PGHIST -- histogram of unbinned data
● PGIDEN -- write username, date, and time at bottom of plot
● PGIMAG -- color image from a 2D data array
● PGLAB -- write labels for x-axis, y-axis, and top of plot
● PGLCUR -- draw a line using the cursor
● PGLDEV -- list available device types on standard output
● PGLEN -- find length of a string in a variety of units
● PGLINE -- draw a polyline (curve defined by line-segments)
● PGMOVE -- move pen (change current pen position)
● PGMTXT -- write text at position relative to viewport
● PGNCUR -- mark a set of points using the cursor
● PGNUMB -- convert a number into a plottable character string
● PGOLIN -- mark a set of points using the cursor
● PGOPEN -- open a graphics device
● PGPAGE -- advance to new page
● PGPANL -- switch to a different panel on the view surface
● PGPAP -- change the size of the view surface
● PGPIXL -- draw pixels
● PGPNTS -- draw several graph markers, not all the same
● PGPOLY -- draw a polygon, using fill-area attributes
● PGPT -- draw several graph markers
● PGPT1 -- draw one graph marker
● PGPTXT -- write text at arbitrary position and angle
● PGQAH -- inquire arrow-head style
● PGQCF -- inquire character font
● PGQCH -- inquire character height
● PGQCI -- inquire color index
● PGQCIR -- inquire color index range
● PGQCLP -- inquire clipping status
● PGQCOL -- inquire color capability
● PGQCR -- inquire color representation
● PGQCS -- inquire character height in a variety of units
● PGQDT -- inquire name of nth available device type
● PGQFS -- inquire fill-area style
● PGQHS -- inquire hatching style
● PGQID -- inquire current device identifier
● PGQINF -- inquire PGPLOT general information
● PGQITF -- inquire image transfer function
● PGQLS -- inquire line style
● PGQLW -- inquire line width
● PGQNDT -- inquire number of available device types
● PGQPOS -- inquire current pen position
● PGQTBG -- inquire text background color index
● PGQTXT -- find bounding box of text string
● PGQVP -- inquire viewport size and position
● PGQVSZ -- inquire size of view surface
● PGQWIN -- inquire window boundary coordinates
● PGRECT -- draw a rectangle, using fill-area attributes
● PGRND -- find the smallest `round' number greater than x
● PGRNGE -- choose axis limits
● PGSAH -- set arrow-head style
● PGSAVE -- save PGPLOT attributes
● PGUNSA -- restore PGPLOT attributes
● PGSCF -- set character font
● PGSCH -- set character height
● PGSCI -- set color index
● PGSCIR -- set color index range
● PGSCLP -- enable or disable clipping at edge of viewport
● PGSCR -- set color representation
● PGSCRL -- scroll window
● PGSCRN -- set color representation by name
● PGSFS -- set fill-area style
● PGSHLS -- set color representation using HLS system
● PGSHS -- set hatching style
● PGSITF -- set image transfer function
● PGSLCT -- select an open graphics device
● PGSLS -- set line style
● PGSLW -- set line width
● PGSTBG -- set text background color index
● PGSUBP -- subdivide view surface into panels
● PGSVP -- set viewport (normalized device coordinates)
● PGSWIN -- set window
● PGTBOX -- draw frame and write (DD) HH MM SS.S labelling
● PGTEXT -- write text (horizontal, left-justified)
● PGTICK -- draw a single tick mark on an axis
● PGUPDT -- update display
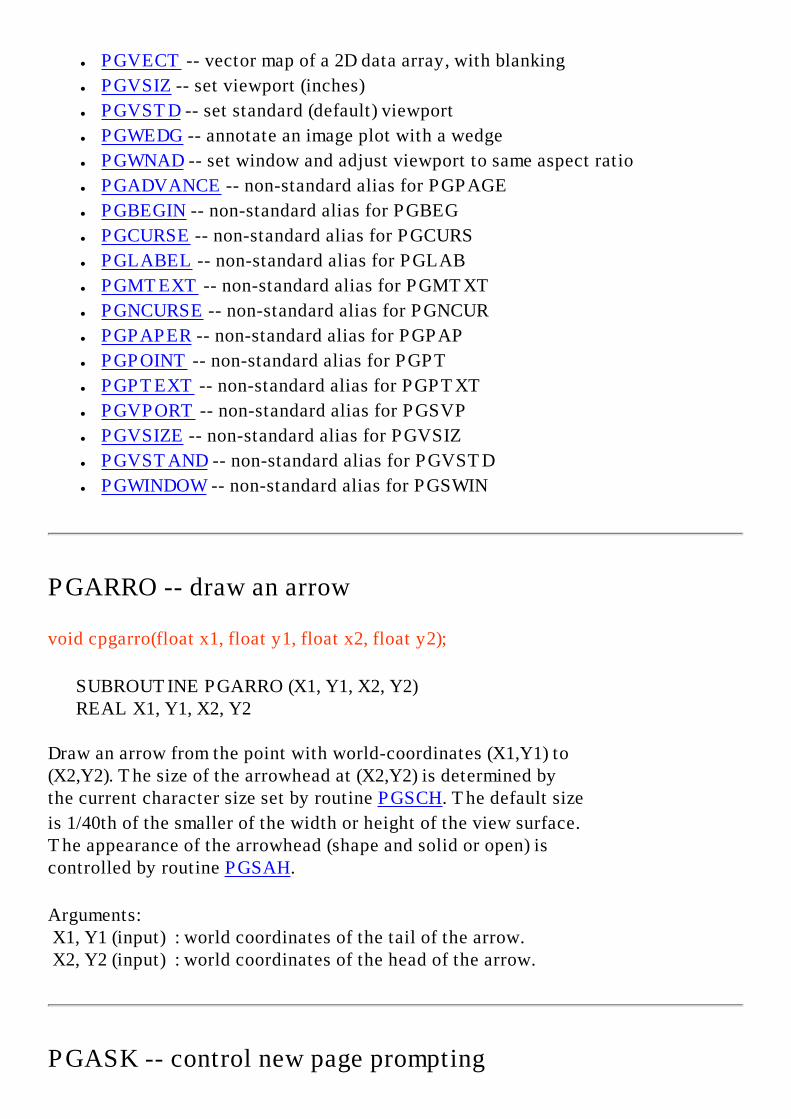
● PGVECT -- vector map of a 2D data array, with blanking
● PGVSIZ -- set viewport (inches)
● PGVSTD -- set standard (default) viewport
● PGWEDG -- annotate an image plot with a wedge
● PGWNAD -- set window and adjust viewport to same aspect ratio
● PGADVANCE -- non-standard alias for PGPAGE
● PGBEGIN -- non-standard alias for PGBEG
● PGCURSE -- non-standard alias for PGCURS
● PGLABEL -- non-standard alias for PGLAB
● PGMTEXT -- non-standard alias for PGMTXT
● PGNCURSE -- non-standard alias for PGNCUR
● PGPAPER -- non-standard alias for PGPAP
● PGPOINT -- non-standard alias for PGPT
● PGPTEXT -- non-standard alias for PGPTXT
● PGVPORT -- non-standard alias for PGSVP
● PGVSIZE -- non-standard alias for PGVSIZ
● PGVSTAND -- non-standard alias for PGVSTD
● PGWINDOW -- non-standard alias for PGSWIN
PGARRO -- draw an arrow
void cpgarro(float x1, float y1, float x2, float y2);
SUBROUTINE PGARRO (X1, Y1, X2, Y2) REAL X1, Y1, X2, Y2
Draw an arrow from the point with world-coordinates (X1,Y1) to (X2,Y2). The size of the arrowhead at (X2,Y2) is determined by the current character size set by routine PGSCH. The default size
is 1/40th of the smaller of the width or height of the view surface.The appearance of the arrowhead (shape and solid or open) iscontrolled by routine PGSAH.
Arguments: X1, Y1 (input) : world coordinates of the tail of the arrow. X2, Y2 (input) : world coordinates of the head of the arrow.
PGASK -- control new page prompting

void cpgask(Logical flag);
SUBROUTINE PGASK (FLAG) LOGICAL FLAG
Change the ``prompt state'' of PGPLOT. If the prompt state isON, PGPAGE will type ``Type RETURN for next page:'' and will wait
for the user to type a carriage-return before starting a new page.The initial prompt state (after the device has been opened) is ONfor interactive devices. Prompt state is always OFF fornon-interactive devices.
Arguments: FLAG (input) : if .TRUE., and if the device is an interactive device, the prompt state will be set to ON. If .FALSE., the prompt state will be set to OFF.
PGAXIS -- draw an axis
void cpgaxis(const char *opt, float x1, float y1, float x2, float y2, \ float v1, float v2, float step, int nsub, float dmajl, \ float dmajr, float fmin, float disp, float orient);
SUBROUTINE PGAXIS (OPT, X1, Y1, X2, Y2, V1, V2, STEP, NSUB, : DMAJL, DMAJR, FMIN, DISP, ORIENT) CHARACTER*(*) OPT REAL X1, Y1, X2, Y2, V1, V2, STEP, DMAJL, DMAJR, FMIN, DISP REAL ORIENT INTEGER NSUB
Draw a labelled graph axis from world-coordinate position (X1,Y1) to(X2,Y2).
Normally, this routine draws a standard LINEAR axis with equalsubdivisions. The quantity described by the axis runs from V1 to V2;this may be, but need not be, the same as X or Y.
If the 'L' option is specified, the routine draws a LOGARITHMIC axis.In this case, the quantity described by the axis runs from 10**V1 to10**V2. A logarithmic axis always has major, labeled, tick marks spaced by one or more decades. If the major tick marks are spaced

by one decade (as specified by the STEP argument), then minortick marks are placed at 2, 3, .., 9 times each power of 10;otherwise minor tick marks are spaced by one decade. If the axisspans less than two decades, numeric labels are placed at 1, 2, and5 times each power of ten.
If the axis spans less than one decade, or if it spans many decades,it is preferable to use a linear axis labeled with the logarithm ofthe quantity of interest.
Arguments: OPT (input) : a string containing single-letter codes for various options. The options currently recognized are: L : draw a logarithmic axis N : write numeric labels 1 : force decimal labelling, instead of automatic choice (see PGNUMB).
2 : force exponential labelling, instead of automatic. X1, Y1 (input) : world coordinates of one endpoint of the axis. X2, Y2 (input) : world coordinates of the other endpoint of the axis. V1 (input) : axis value at first endpoint. V2 (input) : axis value at second endpoint. STEP (input) : major tick marks are drawn at axis value 0.0 plus or minus integer multiples of STEP. If STEP=0.0, a value is chosen automatically. NSUB (input) : minor tick marks are drawn to divide the major divisions into NSUB equal subdivisions (ignored if STEP=0.0). If NSUB <= 1, no minor tick marks are drawn. NSUB is ignored for a logarithmic axis. DMAJL (input) : length of major tick marks drawn to left of axis (as seen looking from first endpoint to second), in units of the character height. DMAJR (input) : length of major tick marks drawn to right of axis, in units of the character height. FMIN (input) : length of minor tick marks, as fraction of major. DISP (input) : displacement of baseline of tick labels to right of axis, in units of the character height. ORIENT (input) : orientation of label text, in degrees; angle between baseline of text and direction of axis (0-360.
PGBAND -- read cursor position, with anchor
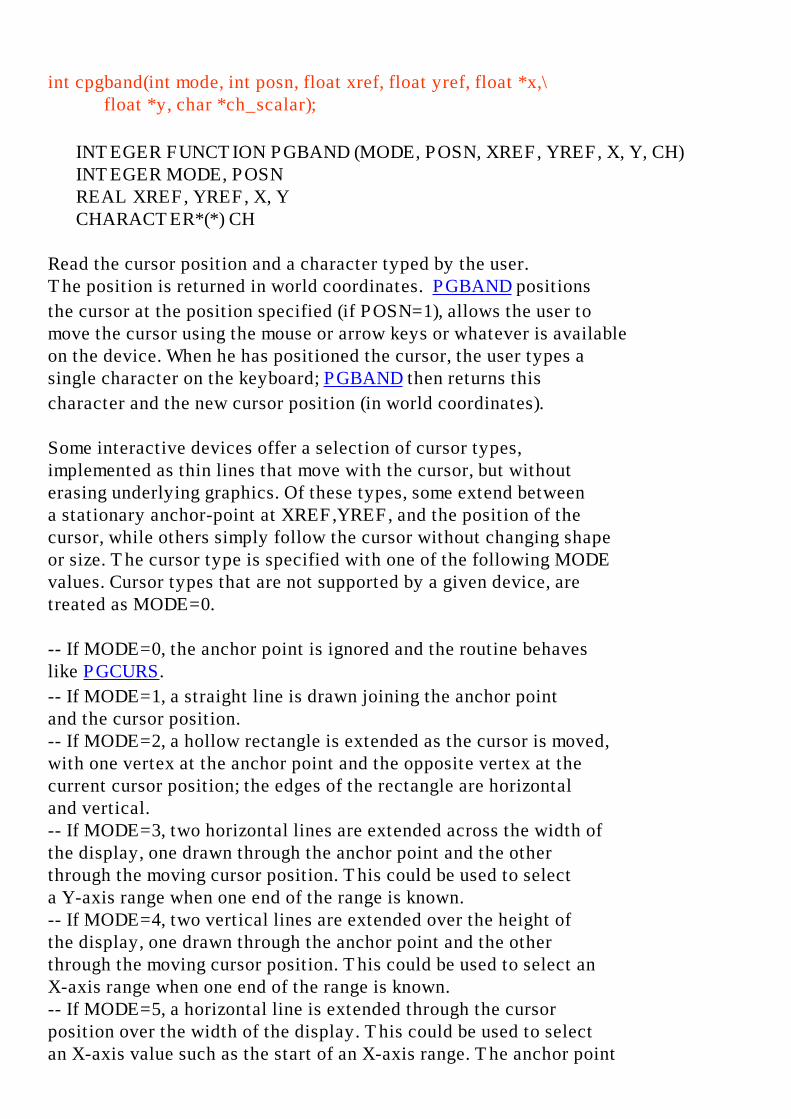
int cpgband(int mode, int posn, float xref, float yref, float *x,\ float *y, char *ch_scalar);
INTEGER FUNCTION PGBAND (MODE, POSN, XREF, YREF, X, Y, CH) INTEGER MODE, POSN REAL XREF, YREF, X, Y CHARACTER*(*) CH
Read the cursor position and a character typed by the user.The position is returned in world coordinates. PGBAND positions
the cursor at the position specified (if POSN=1), allows the user tomove the cursor using the mouse or arrow keys or whatever is availableon the device. When he has positioned the cursor, the user types asingle character on the keyboard; PGBAND then returns this
character and the new cursor position (in world coordinates).
Some interactive devices offer a selection of cursor types,implemented as thin lines that move with the cursor, but withouterasing underlying graphics. Of these types, some extend betweena stationary anchor-point at XREF,YREF, and the position of thecursor, while others simply follow the cursor without changing shapeor size. The cursor type is specified with one of the following MODEvalues. Cursor types that are not supported by a given device, aretreated as MODE=0.
-- If MODE=0, the anchor point is ignored and the routine behaveslike PGCURS.
-- If MODE=1, a straight line is drawn joining the anchor point and the cursor position.-- If MODE=2, a hollow rectangle is extended as the cursor is moved,with one vertex at the anchor point and the opposite vertex at thecurrent cursor position; the edges of the rectangle are horizontaland vertical.-- If MODE=3, two horizontal lines are extended across the width ofthe display, one drawn through the anchor point and the otherthrough the moving cursor position. This could be used to selecta Y-axis range when one end of the range is known.-- If MODE=4, two vertical lines are extended over the height ofthe display, one drawn through the anchor point and the otherthrough the moving cursor position. This could be used to select anX-axis range when one end of the range is known.-- If MODE=5, a horizontal line is extended through the cursorposition over the width of the display. This could be used to selectan X-axis value such as the start of an X-axis range. The anchor point
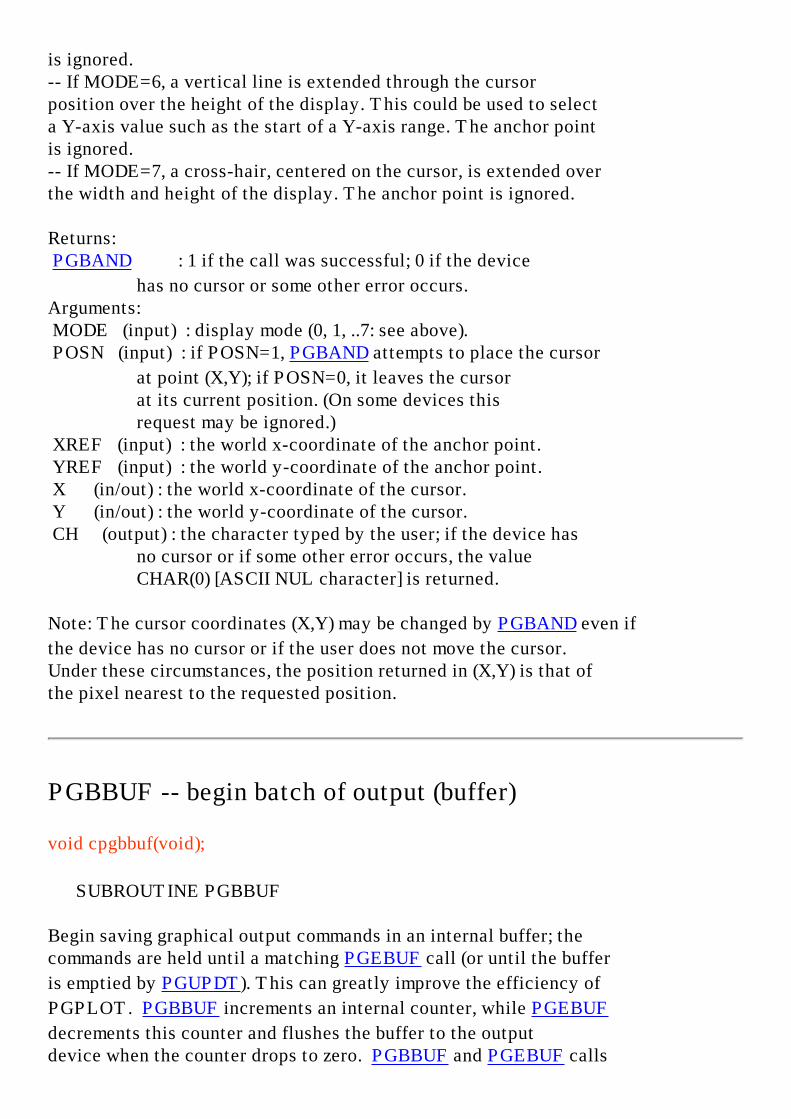
is ignored.-- If MODE=6, a vertical line is extended through the cursorposition over the height of the display. This could be used to selecta Y-axis value such as the start of a Y-axis range. The anchor pointis ignored.-- If MODE=7, a cross-hair, centered on the cursor, is extended overthe width and height of the display. The anchor point is ignored.
Returns: PGBAND : 1 if the call was successful; 0 if the device
has no cursor or some other error occurs.Arguments: MODE (input) : display mode (0, 1, ..7: see above). POSN (input) : if POSN=1, PGBAND attempts to place the cursor
at point (X,Y); if POSN=0, it leaves the cursor at its current position. (On some devices this request may be ignored.) XREF (input) : the world x-coordinate of the anchor point. YREF (input) : the world y-coordinate of the anchor point. X (in/out) : the world x-coordinate of the cursor. Y (in/out) : the world y-coordinate of the cursor. CH (output) : the character typed by the user; if the device has no cursor or if some other error occurs, the value CHAR(0) [ASCII NUL character] is returned.
Note: The cursor coordinates (X,Y) may be changed by PGBAND even if
the device has no cursor or if the user does not move the cursor.Under these circumstances, the position returned in (X,Y) is that ofthe pixel nearest to the requested position.
PGBBUF -- begin batch of output (buffer)
void cpgbbuf(void);
SUBROUTINE PGBBUF
Begin saving graphical output commands in an internal buffer; thecommands are held until a matching PGEBUF call (or until the buffer
is emptied by PGUPDT). This can greatly improve the efficiency of
PGPLOT. PGBBUF increments an internal counter, while PGEBUF
decrements this counter and flushes the buffer to the outputdevice when the counter drops to zero. PGBBUF and PGEBUF calls

should always be paired.
Arguments: none
PGBEG -- open a graphics device
int cpgbeg(int unit, const char *file, int nxsub, int nysub);
INTEGER FUNCTION PGBEG (UNIT, FILE, NXSUB, NYSUB) INTEGER UNIT CHARACTER*(*) FILE INTEGER NXSUB, NYSUB
Note: new programs should use PGOPEN rather than PGBEG. PGOPEN
is retained for compatibility with existing programs. Unlike PGOPEN,
PGBEG closes any graphics devices that are already open, so it
cannot be used to open devices to be used in parallel.
PGBEG opens a graphical device or file and prepares it for
subsequent plotting. A device must be opened with PGBEG or PGOPEN
before any other calls to PGPLOT subroutines for the device.
If any device is already open for PGPLOT output, it is closed beforethe new device is opened.
Returns: PGBEG : a status return value. A value of 1 indicates
successful completion, any other value indicates an error. In the event of error a message is written on the standard error unit. To test the return value, call PGBEG as a function, eg IER=PGBEG(...); note
that PGBEG must be declared INTEGER in the
calling program. Some Fortran compilers allow you to use CALL PGBEG(...) and discard the
return value, but this is not standard Fortran.Arguments: UNIT (input) : this argument is ignored by PGBEG (use zero).
FILE (input) : the "device specification" for the plot device. (For explanation, see description of PGOPEN.)
NXSUB (input) : the number of subdivisions of the view surface in

X (>0 or <0). NYSUB (input) : the number of subdivisions of the view surface in Y (>0). PGPLOT puts NXSUB x NYSUB graphs on each plot page or screen; when the view surface is sub- divided in this way, PGPAGE moves to the next
panel, not the next physical page. If NXSUB > 0, PGPLOT uses the panels in row order; if <0, PGPLOT uses them in column order.
PGBIN -- histogram of binned data
void cpgbin(int nbin, const float *x, const float *data, \ Logical center);
SUBROUTINE PGBIN (NBIN, X, DATA, CENTER) INTEGER NBIN REAL X(*), DATA(*) LOGICAL CENTER
Plot a histogram of NBIN values with X(1..NBIN) values alongthe ordinate, and DATA(1...NBIN) along the abscissa. Bin width isspacing between X values.
Arguments: NBIN (input) : number of values. X (input) : abscissae of bins. DATA (input) : data values of bins. CENTER (input) : if .TRUE., the X values denote the center of the bin; if .FALSE., the X values denote the lower edge (in X) of the bin.
PGBOX -- draw labeled frame around viewport
void cpgbox(const char *xopt, float xtick, int nxsub, \ const char *yopt, float ytick, int nysub);
SUBROUTINE PGBOX (XOPT, XTICK, NXSUB, YOPT, YTICK, NYSUB) CHARACTER*(*) XOPT, YOPT REAL XTICK, YTICK

INTEGER NXSUB, NYSUB
Annotate the viewport with frame, axes, numeric labels, etc.PGBOX is called by on the user's behalf by PGENV, but may also be
called explicitly.
Arguments: XOPT (input) : string of options for X (horizontal) axis of plot. Options are single letters, and may be in any order (see below). XTICK (input) : world coordinate interval between major tick marks on X axis. If XTICK=0.0, the interval is chosen by PGBOX, so that there will be at least 3 major tick
marks along the axis. NXSUB (input) : the number of subintervals to divide the major coordinate interval into. If XTICK=0.0 or NXSUB=0, the number is chosen by PGBOX.
YOPT (input) : string of options for Y (vertical) axis of plot. Coding is the same as for XOPT. YTICK (input) : like XTICK for the Y axis. NYSUB (input) : like NXSUB for the Y axis.
Options (for parameters XOPT and YOPT): A : draw Axis (X axis is horizontal line Y=0, Y axis is vertical line X=0). B : draw bottom (X) or left (Y) edge of frame. C : draw top (X) or right (Y) edge of frame. G : draw Grid of vertical (X) or horizontal (Y) lines. I : Invert the tick marks; ie draw them outside the viewport instead of inside. L : label axis Logarithmically (see below). N : write Numeric labels in the conventional location below the viewport (X) or to the left of the viewport (Y). P : extend ("Project") major tick marks outside the box (ignored if option I is specified). M : write numeric labels in the unconventional location above the viewport (X) or to the right of the viewport (Y). T : draw major Tick marks at the major coordinate interval. S : draw minor tick marks (Subticks). V : orient numeric labels Vertically. This is only applicable to Y. The default is to write Y-labels parallel to the axis. 1 : force decimal labelling, instead of automatic choice (see PGNUMB).
2 : force exponential labelling, instead of automatic.
To get a complete frame, specify BC in both XOPT and YOPT.

Tick marks, if requested, are drawn on the axes or frameor both, depending which are requested. If none of ABC is specified,tick marks will not be drawn. When PGENV calls PGBOX, it sets both
XOPT and YOPT according to the value of its parameter AXIS:-1: 'BC', 0: 'BCNST', 1: 'ABCNST', 2: 'ABCGNST'.
For a logarithmic axis, the major tick interval is always 1.0. Thenumeric label is 10**(x) where x is the world coordinate at thetick mark. If subticks are requested, 8 subticks are drawn betweeneach major tick at equal logarithmic intervals.
To label an axis with time (days, hours, minutes, seconds) orangle (degrees, arcmin, arcsec), use routine PGTBOX.
PGCIRC -- draw a circle, using fill-area attributes
void cpgcirc(float xcent, float ycent, float radius);
SUBROUTINE PGCIRC (XCENT, YCENT, RADIUS) REAL XCENT, YCENT, RADIUS
Draw a circle. The action of this routine dependson the setting of the Fill-Area Style attribute. If Fill-Area Styleis SOLID (the default), the interior of the circle is solid-filledusing the current Color Index. If Fill-Area Style is HOLLOW, theoutline of the circle is drawn using the current line attributes(color index, line-style, and line-width).
Arguments: XCENT (input) : world x-coordinate of the center of the circle. YCENT (input) : world y-coordinate of the center of the circle. RADIUS (input) : radius of circle (world coordinates).
PGCLOS -- close the selected graphics device
void cpgclos(void);
SUBROUTINE PGCLOS
Close the currently selected graphics device. After the device has
been closed, either another open device must be selected with PGSLCT
or another device must be opened with PGOPEN before any further
plotting can be done. If the call to PGCLOS is omitted, some or all
of the plot may be lost.
[This routine was added to PGPLOT in Version 5.1.0. Older programsuse PGEND instead.]
Arguments: none
PGCONB -- contour map of a 2D data array, with blanking
void cpgconb(const float *a, int idim, int jdim, int i1, int i2, \ int j1, int j2, const float *c, int nc, const float *tr, \ float blank);
SUBROUTINE PGCONB (A, IDIM, JDIM, I1, I2, J1, J2, C, NC, TR, 1 BLANK) INTEGER IDIM, JDIM, I1, I2, J1, J2, NC REAL A(IDIM,JDIM), C(*), TR(6), BLANK
Draw a contour map of an array. This routine is the same as PGCONS,
except that array elements that have the "magic value" defined byargument BLANK are ignored, making gaps in the contour map. Theroutine may be useful for data measured on most but not all of thepoints of a grid.
Arguments: A (input) : data array. IDIM (input) : first dimension of A. JDIM (input) : second dimension of A. I1,I2 (input) : range of first index to be contoured (inclusive). J1,J2 (input) : range of second index to be contoured (inclusive). C (input) : array of contour levels (in the same units as the data in array A); dimension at least NC. NC (input) : number of contour levels (less than or equal to dimension of C). The absolute value of this argument is used (for compatibility with PGCONT,
where the sign of NC is significant). TR (input) : array defining a transformation between the I,J grid of the array and the world coordinates. The world coordinates of the array point A(I,J) are

given by: X = TR(1) + TR(2)*I + TR(3)*J Y = TR(4) + TR(5)*I + TR(6)*J Usually TR(3) and TR(5) are zero - unless the coordinate transformation involves a rotation or shear. BLANK (input) : elements of array A that are exactly equal to this value are ignored (blanked).
PGCONF -- fill between two contours
void cpgconf(const float *a, int idim, int jdim, int i1, int i2, \ int j1, int j2, float c1, float c2, const float *tr);
SUBROUTINE PGCONF (A, IDIM, JDIM, I1, I2, J1, J2, C1, C2, TR) INTEGER IDIM, JDIM, I1, I2, J1, J2 REAL A(IDIM,JDIM), C1, C2, TR(6)
Shade the region between two contour levels of a function defined onthe nodes of a rectangular grid. The routine uses the current fillattributes, hatching style (if appropriate), and color index.
If you want to both shade between contours and draw the contourlines, call this routine first (once for each pair of levels) and then CALL PGCONT (or PGCONS) to draw the contour lines on top of the
shading.
Note 1: This routine is not very efficient: it generates a polygonfill command for each cell of the mesh that intersects the desiredarea, rather than consolidating adjacent cells into a single polygon.
Note 2: If both contours intersect all four edges of a particularmesh cell, the program behaves badly and may consider some partsof the cell to lie in more than one contour range.
Note 3: If a contour crosses all four edges of a cell, thisroutine may not generate the same contours as PGCONT or PGCONS
(these two routines may not agree either). Such cases are alwaysambiguous and the routines use different approaches to resolvingthe ambiguity.
Arguments:

A (input) : data array. IDIM (input) : first dimension of A. JDIM (input) : second dimension of A. I1,I2 (input) : range of first index to be contoured (inclusive). J1,J2 (input) : range of second index to be contoured (inclusive). C1, C2 (input) : contour levels; note that C1 must be less than C2. TR (input) : array defining a transformation between the I,J grid of the array and the world coordinates. The world coordinates of the array point A(I,J) are given by: X = TR(1) + TR(2)*I + TR(3)*J Y = TR(4) + TR(5)*I + TR(6)*J Usually TR(3) and TR(5) are zero - unless the coordinate transformation involves a rotation or shear.
PGCONL -- label contour map of a 2D data array
void cpgconl(const float *a, int idim, int jdim, int i1, int i2, \ int j1, int j2, float c, const float *tr, const char *label, \ int intval, int minint);
SUBROUTINE PGCONL (A, IDIM, JDIM, I1, I2, J1, J2, C, TR, 1 LABEL, INTVAL, MININT) INTEGER IDIM, JDIM, I1, J1, I2, J2, INTVAL, MININT REAL A(IDIM,JDIM), C, TR(6) CHARACTER*(*) LABEL
Label a contour map drawn with routine PGCONT. Routine PGCONT should
be called first to draw the contour lines, then this routine should becalled to add the labels. Labels are written at intervals along thecontour lines, centered on the contour lines with lettering alignedin the up-hill direction. Labels are opaque, so a part of the under-lying contour line is obscured by the label. Labels use the currentattributes (character height, line width, color index, characterfont).
The first 7 arguments, and the 9th argument (TR), are the same asthe corresponding arguments to PGCONT, and they should normally be
identical to those used with PGCONT. Note that the argument C is not
an array (unlike PGCONT): only one contour level can be specified;
to label more contours, call PGCONL for each level.

The label is supplied as a character string in argument LABEL.
The spacing of labels along the contour is specified by parametersINTVAL and MININT. The routine follows the contour through thearray, counting the number of cells that the contour crosses. Thefirst label will be written in the MININT'th cell, and additionallabels will be written every INTVAL cells thereafter. A contourthat crosses less than MININT cells will not be labelled. Someexperimentation may be needed to get satisfactory results; a goodplace to start is INTVAL=20, MININT=10.
Arguments: A (input) : data array. IDIM (input) : first dimension of A. JDIM (input) : second dimension of A. I1, I2 (input) : range of first index to be contoured (inclusive). J1, J2 (input) : range of second index to be contoured (inclusive). C (input) : the level of the contour to be labelled (one of the values given to PGCONT).
TR (input) : array defining a transformation between the I,J grid of the array and the world coordinates. The world coordinates of the array point A(I,J) are given by: X = TR(1) + TR(2)*I + TR(3)*J Y = TR(4) + TR(5)*I + TR(6)*J Usually TR(3) and TR(5) are zero - unless the coordinate transformation involves a rotation or shear. LABEL (input) : character strings to be used to label the specified contour. Leading and trailing blank spaces are ignored. INTVAL (input) : spacing along the contour between labels, in grid cells. MININT (input) : contours that cross less than MININT cells will not be labelled.
PGCONS -- contour map of a 2D data array (fast algorithm)
void cpgcons(const float *a, int idim, int jdim, int i1, int i2, \ int j1, int j2, const float *c, int nc, const float *tr);
SUBROUTINE PGCONS (A, IDIM, JDIM, I1, I2, J1, J2, C, NC, TR)
INTEGER IDIM, JDIM, I1, I2, J1, J2, NC REAL A(IDIM,JDIM), C(*), TR(6)
Draw a contour map of an array. The map is truncated ifnecessary at the boundaries of the viewport. Each contour line isdrawn with the current line attributes (color index, style, andwidth). This routine, unlike PGCONT, does not draw each contour as a
continuous line, but draws the straight line segments composing eachcontour in a random order. It is thus not suitable for use on penplotters, and it usually gives unsatisfactory results with dashed ordotted lines. It is, however, faster than PGCONT, especially if
several contour levels are drawn with one call of PGCONS.
Arguments: A (input) : data array. IDIM (input) : first dimension of A. JDIM (input) : second dimension of A. I1,I2 (input) : range of first index to be contoured (inclusive). J1,J2 (input) : range of second index to be contoured (inclusive). C (input) : array of contour levels (in the same units as the data in array A); dimension at least NC. NC (input) : number of contour levels (less than or equal to dimension of C). The absolute value of this argument is used (for compatibility with PGCONT,
where the sign of NC is significant). TR (input) : array defining a transformation between the I,J grid of the array and the world coordinates. The world coordinates of the array point A(I,J) are given by: X = TR(1) + TR(2)*I + TR(3)*J Y = TR(4) + TR(5)*I + TR(6)*J Usually TR(3) and TR(5) are zero - unless the coordinate transformation involves a rotation or shear.
PGCONT -- contour map of a 2D data array (contour-following)
void cpgcont(const float *a, int idim, int jdim, int i1, int i2, \ int j1, int j2, const float *c, int nc, const float *tr);
SUBROUTINE PGCONT (A, IDIM, JDIM, I1, I2, J1, J2, C, NC, TR)
INTEGER IDIM, JDIM, I1, J1, I2, J2, NC REAL A(IDIM,JDIM), C(*), TR(6)
Draw a contour map of an array. The map is truncated ifnecessary at the boundaries of the viewport. Each contour lineis drawn with the current line attributes (color index, style, andwidth); except that if argument NC is positive (see below), the linestyle is set by PGCONT to 1 (solid) for positive contours or 2
(dashed) for negative contours.
Arguments: A (input) : data array. IDIM (input) : first dimension of A. JDIM (input) : second dimension of A. I1, I2 (input) : range of first index to be contoured (inclusive). J1, J2 (input) : range of second index to be contoured (inclusive). C (input) : array of NC contour levels; dimension at least NC. NC (input) : +/- number of contour levels (less than or equal to dimension of C). If NC is positive, it is the number of contour levels, and the line-style is chosen automatically as described above. If NC is negative, it is minus the number of contour levels, and the current setting of line-style is used for all the contours. TR (input) : array defining a transformation between the I,J grid of the array and the world coordinates. The world coordinates of the array point A(I,J) are given by: X = TR(1) + TR(2)*I + TR(3)*J Y = TR(4) + TR(5)*I + TR(6)*J Usually TR(3) and TR(5) are zero - unless the coordinate transformation involves a rotation or shear.
PGCONX -- contour map of a 2D data array (non rectangular)
SUBROUTINE PGCONX (A, IDIM, JDIM, I1, I2, J1, J2, C, NC, PLOT) INTEGER IDIM, JDIM, I1, J1, I2, J2, NC REAL A(IDIM,JDIM), C(*) EXTERNAL PLOT
Draw a contour map of an array using a user-supplied plotting

routine. This routine should be used instead of PGCONT when the
data are defined on a non-rectangular grid. PGCONT permits only
a linear transformation between the (I,J) grid of the arrayand the world coordinate system (x,y), but PGCONX permits any
transformation to be used, the transformation being defined by auser-supplied subroutine. The nature of the contouring algorithm,however, dictates that the transformation should maintain therectangular topology of the grid, although grid-points may beallowed to coalesce. As an example of a deformed rectangulargrid, consider data given on the polar grid theta=0.1n(pi/2),for n=0,1,...,10, and r=0.25m, for m=0,1,..,4. This gridcontains 55 points, of which 11 are coincident at the origin.The input array for PGCONX should be dimensioned (11,5), and
data values should be provided for all 55 elements. PGCONX can
also be used for special applications in which the height of thecontour affects its appearance, e.g., stereoscopic views.
The map is truncated if necessary at the boundaries of the viewport.Each contour line is drawn with the current line attributes (colorindex, style, and width); except that if argument NC is positive(see below), the line style is set by PGCONX to 1 (solid) for
positive contours or 2 (dashed) for negative contours. Attributesfor the contour lines can also be set in the user-suppliedsubroutine, if desired.
Arguments: A (input) : data array. IDIM (input) : first dimension of A. JDIM (input) : second dimension of A. I1, I2 (input) : range of first index to be contoured (inclusive). J1, J2 (input) : range of second index to be contoured (inclusive). C (input) : array of NC contour levels; dimension at least NC. NC (input) : +/- number of contour levels (less than or equal to dimension of C). If NC is positive, it is the number of contour levels, and the line-style is chosen automatically as described above. If NC is negative, it is minus the number of contour levels, and the current setting of line-style is used for all the contours. PLOT (input) : the address (name) of a subroutine supplied by the user, which will be called by PGCONX to do
the actual plotting. This must be declared EXTERNAL in the program unit calling PGCONX.
The subroutine PLOT will be called with four arguments:

CALL PLOT(VISBLE,X,Y,Z)where X,Y (input) are real variables corresponding toI,J indices of the array A. If VISBLE (input, integer) is 1,PLOT should draw a visible line from the current penposition to the world coordinate point corresponding to (X,Y);if it is 0, it should move the pen to (X,Y). Z is the valueof the current contour level, and may be used by PLOT if desired.Example: SUBROUTINE PLOT (VISBLE,X,Y,Z) REAL X, Y, Z, XWORLD, YWORLD INTEGER VISBLE XWORLD = X*COS(Y) ! this is the user-defined YWORLD = X*SIN(Y) ! transformation IF (VISBLE.EQ.0) THEN CALL PGMOVE (XWORLD, YWORLD)
ELSE CALL PGDRAW (XWORLD, YWORLD)
END IF END
PGCTAB -- install the color table to be used by PGIMAG
void cpgctab(const float *l, const float *r, const float *g, \ const float *b, int nc, float contra, float bright);
SUBROUTINE PGCTAB(L, R, G, B, NC, CONTRA, BRIGHT) INTEGER NC REAL L(NC), R(NC), G(NC), B(NC), CONTRA, BRIGHT
Use the given color table to change the color representations ofall color indexes marked for use by PGIMAG. To change which
color indexes are thus marked, call PGSCIR before calling PGCTAB
or PGIMAG. On devices that can change the color representations
of previously plotted graphics, PGCTAB will also change the colors
of existing graphics that were plotted with the marked colorindexes. This feature can then be combined with PGBAND to
interactively manipulate the displayed colors of data previouslyplotted with PGIMAG.
Limitations: 1. Some devices do not propagate color representation changes to previously drawn graphics.

2. Some devices ignore requests to change color representations. 3. The appearance of specific color representations on grey-scale devices is device-dependent.
Notes: To reverse the sense of a color table, change the chosen contrast and brightness to -CONTRA and 1-BRIGHT.
In the following, the term 'color table' refers to the input L,R,G,B arrays, whereas 'color ramp' refers to the resulting ramp of colors that would be seen with PGWEDG.
Arguments: L (input) : An array of NC normalized ramp-intensity levels corresponding to the RGB primary color intensities in R(),G(),B(). Colors on the ramp are linearly interpolated from neighbouring levels. Levels must be sorted in increasing order. 0.0 places a color at the beginning of the ramp. 1.0 places a color at the end of the ramp. Colors outside these limits are legal, but will not be visible if CONTRA=1.0 and BRIGHT=0.5. R (input) : An array of NC normalized red intensities. G (input) : An array of NC normalized green intensities. B (input) : An array of NC normalized blue intensities. NC (input) : The number of color table entries. CONTRA (input) : The contrast of the color ramp (normally 1.0). Negative values reverse the direction of the ramp. BRIGHT (input) : The brightness of the color ramp. This is normally 0.5, but can sensibly hold any value between 0.0 and 1.0. Values at or beyond the latter two extremes, saturate the color ramp with the colors of the respective end of the color table.
PGCURS -- read cursor position
int cpgcurs(float *x, float *y, char *ch_scalar);
INTEGER FUNCTION PGCURS (X, Y, CH) REAL X, Y CHARACTER*(*) CH
Read the cursor position and a character typed by the user.The position is returned in world coordinates. PGCURS positions
the cursor at the position specified, allows the user to move thecursor using the joystick or arrow keys or whatever is available onthe device. When he has positioned the cursor, the user types asingle character on the keyboard; PGCURS then returns this
character and the new cursor position (in world coordinates).
Returns: PGCURS : 1 if the call was successful; 0 if the device
has no cursor or some other error occurs.Arguments: X (in/out) : the world x-coordinate of the cursor. Y (in/out) : the world y-coordinate of the cursor. CH (output) : the character typed by the user; if the device has no cursor or if some other error occurs, the value CHAR(0) [ASCII NUL character] is returned.
Note: The cursor coordinates (X,Y) may be changed by PGCURS even if
the device has no cursor or if the user does not move the cursor.Under these circumstances, the position returned in (X,Y) is that ofthe pixel nearest to the requested position.
PGDRAW -- draw a line from the current pen position to a point
void cpgdraw(float x, float y);
SUBROUTINE PGDRAW (X, Y) REAL X, Y
Draw a line from the current pen position to the pointwith world-coordinates (X,Y). The line is clipped at the edge of thecurrent window. The new pen position is (X,Y) in world coordinates.
Arguments: X (input) : world x-coordinate of the end point of the line. Y (input) : world y-coordinate of the end point of the line.
PGEBUF -- end batch of output (buffer)
void cpgebuf(void);
SUBROUTINE PGEBUF
A call to PGEBUF marks the end of a batch of graphical output begun
with the last call of PGBBUF. PGBBUF and PGEBUF calls should always
be paired. Each call to PGBBUF increments a counter, while each call
to PGEBUF decrements the counter. When the counter reaches 0, the
batch of output is written on the output device.
Arguments: none
PGEND -- close all open graphics devices
void cpgend(void);
SUBROUTINE PGEND
Close and release any open graphics devices. All devices must beclosed by calling either PGCLOS (for each device) or PGEND before
the program terminates. If a device is not closed properly, someor all of the graphical output may be lost.
Arguments: none
PGENV -- set window and viewport and draw labeled frame
void cpgenv(float xmin, float xmax, float ymin, float ymax, \ int just, int axis);
SUBROUTINE PGENV (XMIN, XMAX, YMIN, YMAX, JUST, AXIS) REAL XMIN, XMAX, YMIN, YMAX INTEGER JUST, AXIS
Set PGPLOT "Plotter Environment". PGENV establishes the scaling
for subsequent calls to PGPT, PGLINE, etc. The plotter is

advanced to a new page or panel, clearing the screen if necessary.If the "prompt state" is ON (see PGASK), confirmation
is requested from the user before clearing the screen.If requested, a box, axes, labels, etc. are drawn according tothe setting of argument AXIS.
Arguments: XMIN (input) : the world x-coordinate at the bottom left corner of the viewport. XMAX (input) : the world x-coordinate at the top right corner of the viewport (note XMAX may be less than XMIN). YMIN (input) : the world y-coordinate at the bottom left corner of the viewport. YMAX (input) : the world y-coordinate at the top right corner of the viewport (note YMAX may be less than YMIN). JUST (input) : if JUST=1, the scales of the x and y axes (in world coordinates per inch) will be equal, otherwise they will be scaled independently. AXIS (input) : controls the plotting of axes, tick marks, etc: AXIS = -2 : draw no box, axes or labels; AXIS = -1 : draw box only; AXIS = 0 : draw box and label it with coordinates; AXIS = 1 : same as AXIS=0, but also draw the coordinate axes (X=0, Y=0); AXIS = 2 : same as AXIS=1, but also draw grid lines at major increments of the coordinates; AXIS = 10 : draw box and label X-axis logarithmically; AXIS = 20 : draw box and label Y-axis logarithmically; AXIS = 30 : draw box and label both axes logarithmically.
For other axis options, use routine PGBOX. PGENV can be persuaded to
call PGBOX with additional axis options by defining an environment
parameter PGPLOT_ENVOPT containing the required option codes. Examples: PGPLOT_ENVOPT=P ! draw Projecting tick marks PGPLOT_ENVOPT=I ! Invert the tick marks PGPLOT_ENVOPT=IV ! Invert tick marks and label y Vertically
PGERAS -- erase all graphics from current page
void cpgeras(void);

SUBROUTINE PGERAS
Erase all graphics from the current page (or current panel, ifthe view surface has been divided into panels with PGSUBP).
Arguments: none
PGERR1 -- horizontal or vertical error bar
void cpgerr1(int dir, float x, float y, float e, float t);
SUBROUTINE PGERR1 (DIR, X, Y, E, T) INTEGER DIR REAL X, Y, E REAL T
Plot a single error bar in the direction specified by DIR.This routine draws an error bar only; to mark the data point atthe start of the error bar, an additional call to PGPT is required.
To plot many error bars, use PGERRB.
Arguments: DIR (input) : direction to plot the error bar relative to the data point. One-sided error bar: DIR is 1 for +X (X to X+E); 2 for +Y (Y to Y+E); 3 for -X (X to X-E); 4 for -Y (Y to Y-E). Two-sided error bar: DIR is 5 for +/-X (X-E to X+E); 6 for +/-Y (Y-E to Y+E). X (input) : world x-coordinate of the data. Y (input) : world y-coordinate of the data. E (input) : value of error bar distance to be added to the data position in world coordinates. T (input) : length of terminals to be drawn at the ends of the error bar, as a multiple of the default length; if T = 0.0, no terminals will be drawn.

PGERRB -- horizontal or vertical error bar
void cpgerrb(int dir, int n, const float *x, const float *y, \ const float *e, float t);
SUBROUTINE PGERRB (DIR, N, X, Y, E, T) INTEGER DIR, N REAL X(*), Y(*), E(*) REAL T
Plot error bars in the direction specified by DIR.This routine draws an error bar only; to mark the data point atthe start of the error bar, an additional call to PGPT is required.
Arguments: DIR (input) : direction to plot the error bar relative to the data point. One-sided error bar: DIR is 1 for +X (X to X+E); 2 for +Y (Y to Y+E); 3 for -X (X to X-E); 4 for -Y (Y to Y-E). Two-sided error bar: DIR is 5 for +/-X (X-E to X+E); 6 for +/-Y (Y-E to Y+E). N (input) : number of error bars to plot. X (input) : world x-coordinates of the data. Y (input) : world y-coordinates of the data. E (input) : value of error bar distance to be added to the data position in world coordinates. T (input) : length of terminals to be drawn at the ends of the error bar, as a multiple of the default length; if T = 0.0, no terminals will be drawn.
Note: the dimension of arrays X, Y, and E must be greaterthan or equal to N. If N is 1, X, Y, and E may be scalarvariables, or expressions.
PGERRX -- horizontal error bar
void cpgerrx(int n, const float *x1, const float *x2, \ const float *y, float t);
SUBROUTINE PGERRX (N, X1, X2, Y, T) INTEGER N REAL X1(*), X2(*), Y(*) REAL T
Plot horizontal error bars.This routine draws an error bar only; to mark the data point inthe middle of the error bar, an additional call to PGPT or
PGERRY is required.
Arguments: N (input) : number of error bars to plot. X1 (input) : world x-coordinates of lower end of the error bars. X2 (input) : world x-coordinates of upper end of the error bars. Y (input) : world y-coordinates of the data. T (input) : length of terminals to be drawn at the ends of the error bar, as a multiple of the default length; if T = 0.0, no terminals will be drawn.
Note: the dimension of arrays X1, X2, and Y must be greaterthan or equal to N. If N is 1, X1, X2, and Y may be scalarvariables, or expressions, eg: CALL PGERRX(1,X-SIGMA,X+SIGMA,Y)
PGERRY -- vertical error bar
void cpgerry(int n, const float *x, const float *y1, \ const float *y2, float t);
SUBROUTINE PGERRY (N, X, Y1, Y2, T) INTEGER N REAL X(*), Y1(*), Y2(*) REAL T
Plot vertical error bars.This routine draws an error bar only; to mark the data point inthe middle of the error bar, an additional call to PGPT or
PGERRX is required.
Arguments: N (input) : number of error bars to plot. X (input) : world x-coordinates of the data. Y1 (input) : world y-coordinates of top end of the error bars. Y2 (input) : world y-coordinates of bottom end of the error bars. T (input) : length of terminals to be drawn at the ends of the error bar, as a multiple of the default length; if T = 0.0, no terminals will be drawn.
Note: the dimension of arrays X, Y1, and Y2 must be greaterthan or equal to N. If N is 1, X, Y1, and Y2 may be scalarvariables or expressions, eg: CALL PGERRY(1,X,Y+SIGMA,Y-SIGMA)
PGETXT -- erase text from graphics display
void cpgetxt(void);
SUBROUTINE PGETXT
Some graphics terminals display text (the normal interactive dialog)on the same screen as graphics. This routine erases the text from theview surface without affecting the graphics. It does nothing ondevices which do not display text on the graphics screen, and ondevices which do not have this capability.
Arguments: None
PGFUNT -- function defined by X = F(T), Y = G(T)
SUBROUTINE PGFUNT (FX, FY, N, TMIN, TMAX, PGFLAG) REAL FX, FY EXTERNAL FX, FY INTEGER N REAL TMIN, TMAX INTEGER PGFLAG

Draw a curve defined by parametric equations X = FX(T), Y = FY(T).
Arguments: FX (external real function): supplied by the user, evaluates X-coordinate. FY (external real function): supplied by the user, evaluates Y-coordinate. N (input) : the number of points required to define the curve. The functions FX and FY will each be called N+1 times. TMIN (input) : the minimum value for the parameter T. TMAX (input) : the maximum value for the parameter T. PGFLAG (input) : if PGFLAG = 1, the curve is plotted in the current window and viewport; if PGFLAG = 0, PGENV is called automatically by PGFUNT to
start a new plot with automatic scaling.
Note: The functions FX and FY must be declared EXTERNAL in theFortran program unit that calls PGFUNT.
PGFUNX -- function defined by Y = F(X)
SUBROUTINE PGFUNX (FY, N, XMIN, XMAX, PGFLAG) REAL FY EXTERNAL FY INTEGER N REAL XMIN, XMAX INTEGER PGFLAG
Draw a curve defined by the equation Y = FY(X), where FY is auser-supplied subroutine.
Arguments: FY (external real function): supplied by the user, evaluates Y value at a given X-coordinate. N (input) : the number of points required to define the curve. The function FY will be called N+1 times. If PGFLAG=0 and N is greater than 1000, 1000 will be used instead. If N is less than 1, nothing will be drawn. XMIN (input) : the minimum value of X. XMAX (input) : the maximum value of X. PGFLAG (input) : if PGFLAG = 1, the curve is plotted in the

current window and viewport; if PGFLAG = 0, PGENV is called automatically by PGFUNX to
start a new plot with X limits (XMIN, XMAX) and automatic scaling in Y.
Note: The function FY must be declared EXTERNAL in the Fortranprogram unit that calls PGFUNX. It has one argument, the
x-coordinate at which the y value is required, e.g. REAL FUNCTION FY(X) REAL X FY = ..... END
PGFUNY -- function defined by X = F(Y)
SUBROUTINE PGFUNY (FX, N, YMIN, YMAX, PGFLAG) REAL FX EXTERNAL FX INTEGER N REAL YMIN, YMAX INTEGER PGFLAG
Draw a curve defined by the equation X = FX(Y), where FY is auser-supplied subroutine.
Arguments: FX (external real function): supplied by the user, evaluates X value at a given Y-coordinate. N (input) : the number of points required to define the curve. The function FX will be called N+1 times. If PGFLAG=0 and N is greater than 1000, 1000 will be used instead. If N is less than 1, nothing will be drawn. YMIN (input) : the minimum value of Y. YMAX (input) : the maximum value of Y. PGFLAG (input) : if PGFLAG = 1, the curve is plotted in the current window and viewport; if PGFLAG = 0, PGENV is called automatically by PGFUNY to
start a new plot with Y limits (YMIN, YMAX) and automatic scaling in X.
Note: The function FX must be declared EXTERNAL in the Fortran

program unit that calls PGFUNY. It has one argument, the
y-coordinate at which the x value is required, e.g. REAL FUNCTION FX(Y) REAL Y FX = ..... END
PGGRAY -- gray-scale map of a 2D data array
void cpggray(const float *a, int idim, int jdim, int i1, int i2, \ int j1, int j2, float fg, float bg, const float *tr);
SUBROUTINE PGGRAY (A, IDIM, JDIM, I1, I2, J1, J2, 1 FG, BG, TR) INTEGER IDIM, JDIM, I1, I2, J1, J2 REAL A(IDIM,JDIM), FG, BG, TR(6)
Draw gray-scale map of an array in current window. The subsectionof the array A defined by indices (I1:I2, J1:J2) is mapped ontothe view surface world-coordinate system by the transformationmatrix TR. The resulting quadrilateral region is clipped at the edgeof the window and shaded with the shade at each point determinedby the corresponding array value. The shade is a number in therange 0 to 1 obtained by linear interpolation between the backgroundlevel (BG) and the foreground level (FG), i.e.,
shade = [A(i,j) - BG] / [FG - BG]
The background level BG can be either less than or greater than theforeground level FG. Points in the array that are outside the rangeBG to FG are assigned shade 0 or 1 as appropriate.
PGGRAY uses two different algorithms, depending how many color
indices are available in the color index range specified for images.(This range is set with routine PGSCIR, and the current or default
range can be queried by calling routine PGQCIR).
If 16 or more color indices are available, PGGRAY first assigns
color representations to these color indices to give a linear rampbetween the background color (color index 0) and the foreground color(color index 1), and then calls PGIMAG to draw the image using these
color indices. In this mode, the shaded region is "opaque": every

pixel is assigned a color.
If less than 16 color indices are available, PGGRAY uses only
color index 1, and uses a "dithering" algorithm to fill in pixels,with the shade (computed as above) determining the faction of pixelsthat are filled. In this mode the shaded region is "transparent" andallows previously-drawn graphics to show through.
The transformation matrix TR is used to calculate the worldcoordinates of the center of the "cell" that represents eacharray element. The world coordinates of the center of the cellcorresponding to array element A(I,J) are given by:
X = TR(1) + TR(2)*I + TR(3)*J Y = TR(4) + TR(5)*I + TR(6)*J
Usually TR(3) and TR(5) are zero -- unless the coordinatetransformation involves a rotation or shear. The corners of thequadrilateral region that is shaded by PGGRAY are given by
applying this transformation to (I1-0.5,J1-0.5), (I2+0.5, J2+0.5).
Arguments: A (input) : the array to be plotted. IDIM (input) : the first dimension of array A. JDIM (input) : the second dimension of array A. I1, I2 (input) : the inclusive range of the first index (I) to be plotted. J1, J2 (input) : the inclusive range of the second index (J) to be plotted. FG (input) : the array value which is to appear with the foreground color (corresponding to color index 1). BG (input) : the array value which is to appear with the background color (corresponding to color index 0). TR (input) : transformation matrix between array grid and world coordinates.
PGHI2D -- cross-sections through a 2D data array
void cpghi2d(const float *data, int nxv, int nyv, int ix1, \ int ix2, int iy1, int iy2, const float *x, int ioff, float bias, \ Logical center, float *ylims);

SUBROUTINE PGHI2D (DATA, NXV, NYV, IX1, IX2, IY1, IY2, X, IOFF, 1 BIAS, CENTER, YLIMS) INTEGER NXV, NYV, IX1, IX2, IY1, IY2 REAL DATA(NXV,NYV) REAL X(IX2-IX1+1), YLIMS(IX2-IX1+1) INTEGER IOFF REAL BIAS LOGICAL CENTER
Plot a series of cross-sections through a 2D data array.Each cross-section is plotted as a hidden line histogram. The plotcan be slanted to give a pseudo-3D effect - if this is done, thecall to PGENV may have to be changed to allow for the increased X
range that will be needed.
Arguments: DATA (input) : the data array to be plotted. NXV (input) : the first dimension of DATA. NYV (input) : the second dimension of DATA. IX1 (input) IX2 (input) IY1 (input) IY2 (input) : PGHI2D plots a subset of the input array DATA.
This subset is delimited in the first (x) dimension by IX1 and IX2 and the 2nd (y) by IY1 and IY2, inclusively. Note: IY2 < IY1 is permitted, resulting in a plot with the cross-sections plotted in reverse Y order. However, IX2 must be => IX1. X (input) : the abscissae of the bins to be plotted. That is, X(1) should be the X value for DATA(IX1,IY1), and X should have (IX2-IX1+1) elements. The program has to assume that the X value for DATA(x,y) is the same for all y. IOFF (input) : an offset in array elements applied to successive cross-sections to produce a slanted effect. A plot with IOFF > 0 slants to the right, one with IOFF < 0 slants left. BIAS (input) : a bias value applied to each successive cross- section in order to raise it above the previous cross-section. This is in the same units as the data. CENTER (input) : if .true., the X values denote the center of the bins; if .false. the X values denote the lower edges (in X) of the bins.

YLIMS (input) : workspace. Should be an array of at least (IX2-IX1+1) elements.
PGHIST -- histogram of unbinned data
void cpghist(int n, const float *data, float datmin, float datmax, \ int nbin, int pgflag);
SUBROUTINE PGHIST(N, DATA, DATMIN, DATMAX, NBIN, PGFLAG) INTEGER N REAL DATA(*) REAL DATMIN, DATMAX INTEGER NBIN, PGFLAG
Draw a histogram of N values of a variable in arrayDATA(1...N) in the range DATMIN to DATMAX using NBIN bins. Notethat array elements which fall exactly on the boundary betweentwo bins will be counted in the higher bin rather than thelower one; and array elements whose value is less than DATMIN orgreater than or equal to DATMAX will not be counted at all.
Arguments: N (input) : the number of data values. DATA (input) : the data values. Note: the dimension of array DATA must be greater than or equal to N. The first N elements of the array are used. DATMIN (input) : the minimum data value for the histogram. DATMAX (input) : the maximum data value for the histogram. NBIN (input) : the number of bins to use: the range DATMIN to DATMAX is divided into NBIN equal bins and the number of DATA values in each bin is determined by PGHIST. NBIN may not exceed 200.
PGFLAG (input) : if PGFLAG = 1, the histogram is plotted in the current window and viewport; if PGFLAG = 0, PGENV is called automatically by PGHIST to start
a new plot (the x-limits of the window will be DATMIN and DATMAX; the y-limits will be chosen automatically. IF PGFLAG = 2,3 the histogram will be in the same window and viewport but with a filled area style. If pgflag=4,5 as for pgflag = 0,1, but simple line drawn as for PGBIN

PGIDEN -- write username, date, and time at bottom of plot
void cpgiden(void);
SUBROUTINE PGIDEN
Write username, date, and time at bottom of plot.
Arguments: none.
PGIMAG -- color image from a 2D data array
void cpgimag(const float *a, int idim, int jdim, int i1, int i2, \ int j1, int j2, float a1, float a2, const float *tr);
SUBROUTINE PGIMAG (A, IDIM, JDIM, I1, I2, J1, J2, 1 A1, A2, TR) INTEGER IDIM, JDIM, I1, I2, J1, J2 REAL A(IDIM,JDIM), A1, A2, TR(6)
Draw a color image of an array in current window. The subsectionof the array A defined by indices (I1:I2, J1:J2) is mapped ontothe view surface world-coordinate system by the transformationmatrix TR. The resulting quadrilateral region is clipped at the edgeof the window. Each element of the array is represented in the imageby a small quadrilateral, which is filled with a color specified bythe corresponding array value.
The subroutine uses color indices in the range C1 to C2, which canbe specified by calling PGSCIR before PGIMAG. The default values
for C1 and C2 are device-dependent; these values can be determined bycalling PGQCIR. Note that color representations should be assigned to
color indices C1 to C2 by calling PGSCR before calling PGIMAG. On some
devices (but not all), the color representation can be changed afterthe call to PGIMAG by calling PGSCR again.
Array values in the range A1 to A2 are mapped on to the range of
color indices C1 to C2, with array values <= A1 being given colorindex C1 and values >= A2 being given color index C2. The mappingfunction for intermediate array values can be specified bycalling routine PGSITF before PGIMAG; the default is linear.
On devices which have no available color indices (C1 > C2),PGIMAG will return without doing anything. On devices with only
one color index (C1=C2), all array values map to the same colorwhich is rather uninteresting. An image is always "opaque",i.e., it obscures all graphical elements previously drawn inthe region.
The transformation matrix TR is used to calculate the worldcoordinates of the center of the "cell" that represents eacharray element. The world coordinates of the center of the cellcorresponding to array element A(I,J) are given by:
X = TR(1) + TR(2)*I + TR(3)*J Y = TR(4) + TR(5)*I + TR(6)*J
Usually TR(3) and TR(5) are zero -- unless the coordinatetransformation involves a rotation or shear. The corners of thequadrilateral region that is shaded by PGIMAG are given by
applying this transformation to (I1-0.5,J1-0.5), (I2+0.5, J2+0.5).
Arguments: A (input) : the array to be plotted. IDIM (input) : the first dimension of array A. JDIM (input) : the second dimension of array A. I1, I2 (input) : the inclusive range of the first index (I) to be plotted. J1, J2 (input) : the inclusive range of the second index (J) to be plotted. A1 (input) : the array value which is to appear with shade C1. A2 (input) : the array value which is to appear with shade C2. TR (input) : transformation matrix between array grid and world coordinates.
PGLAB -- write labels for x-axis, y-axis, and top of plot
void cpglab(const char *xlbl, const char *ylbl, const char *toplbl);

SUBROUTINE PGLAB (XLBL, YLBL, TOPLBL) CHARACTER*(*) XLBL, YLBL, TOPLBL
Write labels outside the viewport. This routine is a simpleinterface to PGMTXT, which should be used if PGLAB is inadequate.
Arguments: XLBL (input) : a label for the x-axis (centered below the viewport). YLBL (input) : a label for the y-axis (centered to the left of the viewport, drawn vertically). TOPLBL (input) : a label for the entire plot (centered above the viewport).
PGLCUR -- draw a line using the cursor
void cpglcur(int maxpt, int *npt, float *x, float *y);
SUBROUTINE PGLCUR (MAXPT, NPT, X, Y) INTEGER MAXPT, NPT REAL X(*), Y(*)
Interactive routine for user to enter a polyline by use ofthe cursor. Routine allows user to Add and Delete vertices;vertices are joined by straight-line segments.
Arguments: MAXPT (input) : maximum number of points that may be accepted. NPT (in/out) : number of points entered; should be zero on first call. X (in/out) : array of x-coordinates (dimension at least MAXPT). Y (in/out) : array of y-coordinates (dimension at least MAXPT).
Notes:
(1) On return from the program, cursor points are returned inthe order they were entered. Routine may be (re-)called with pointsalready defined in X,Y (# in NPT), and they will be plottedfirst, before editing.
(2) User commands: the user types single-character commandsafter positioning the cursor: the following are accepted: A (Add) - add point at current cursor location.

D (Delete) - delete last-entered point. X (eXit) - leave subroutine.
PGLDEV -- list available device types on standard output
void cpgldev(void);
SUBROUTINE PGLDEV
Writes (to standard output) a list of all device types available inthe current PGPLOT installation.
Arguments: none.
PGLEN -- find length of a string in a variety of units
void cpglen(int units, const char *string, float *xl, float *yl);
SUBROUTINE PGLEN (UNITS, STRING, XL, YL) REAL XL, YL INTEGER UNITS CHARACTER*(*) STRING
Work out length of a string in x and y directions
Input UNITS : 0 => answer in normalized device coordinates 1 => answer in inches 2 => answer in mm 3 => answer in absolute device coordinates (dots) 4 => answer in world coordinates 5 => answer as a fraction of the current viewport size
STRING : String of interestOutput XL : Length of string in x direction YL : Length of string in y direction

PGLINE -- draw a polyline (curve defined by line-segments)
void cpgline(int n, const float *xpts, const float *ypts);
SUBROUTINE PGLINE (N, XPTS, YPTS) INTEGER N REAL XPTS(*), YPTS(*)
Primitive routine to draw a Polyline. A polyline is one or moreconnected straight-line segments. The polyline is drawn usingthe current setting of attributes color-index, line-style, andline-width. The polyline is clipped at the edge of the window.
Arguments: N (input) : number of points defining the line; the line consists of (N-1) straight-line segments. N should be greater than 1 (if it is 1 or less, nothing will be drawn). XPTS (input) : world x-coordinates of the points. YPTS (input) : world y-coordinates of the points.
The dimension of arrays X and Y must be greater than or equal to N.The "pen position" is changed to (X(N),Y(N)) in world coordinates(if N > 1).
PGMOVE -- move pen (change current pen position)
void cpgmove(float x, float y);
SUBROUTINE PGMOVE (X, Y) REAL X, Y
Primitive routine to move the "pen" to the point with worldcoordinates (X,Y). No line is drawn.
Arguments: X (input) : world x-coordinate of the new pen position. Y (input) : world y-coordinate of the new pen position.

PGMTXT -- write text at position relative to viewport
void cpgmtxt(const char *side, float disp, float coord, \ float fjust, const char *text);
SUBROUTINE PGMTXT (SIDE, DISP, COORD, FJUST, TEXT) CHARACTER*(*) SIDE, TEXT REAL DISP, COORD, FJUST
Write text at a position specified relative to the viewport (outsideor inside). This routine is useful for annotating graphs. It is usedby routine PGLAB. The text is written using the current values of
attributes color-index, line-width, character-height, andcharacter-font.
Arguments: SIDE (input) : must include one of the characters 'B', 'L', 'T', or 'R' signifying the Bottom, Left, Top, or Right margin of the viewport. If it includes 'LV' or 'RV', the string is written perpendicular to the frame rather than parallel to it. DISP (input) : the displacement of the character string from the specified edge of the viewport, measured outwards from the viewport in units of the character height. Use a negative value to write inside the viewport, a positive value to write outside. COORD (input) : the location of the character string along the specified edge of the viewport, as a fraction of the length of the edge. FJUST (input) : controls justification of the string parallel to the specified edge of the viewport. If FJUST = 0.0, the left-hand end of the string will be placed at COORD; if JUST = 0.5, the center of the string will be placed at COORD; if JUST = 1.0, the right-hand end of the string will be placed at at COORD. Other values between 0 and 1 give inter- mediate placing, but they are not very useful. TEXT (input) : the text string to be plotted. Trailing spaces are ignored when justifying the string, but leading spaces are significant.

PGNCUR -- mark a set of points using the cursor
void cpgncur(int maxpt, int *npt, float *x, float *y, int symbol);
SUBROUTINE PGNCUR (MAXPT, NPT, X, Y, SYMBOL) INTEGER MAXPT, NPT REAL X(*), Y(*) INTEGER SYMBOL
Interactive routine for user to enter data points by use ofthe cursor. Routine allows user to Add and Delete points. Thepoints are returned in order of increasing x-coordinate, not in theorder they were entered.
Arguments: MAXPT (input) : maximum number of points that may be accepted. NPT (in/out) : number of points entered; should be zero on first call. X (in/out) : array of x-coordinates. Y (in/out) : array of y-coordinates. SYMBOL (input) : code number of symbol to use for marking entered points (see PGPT).
Note (1): The dimension of arrays X and Y must be greater than orequal to MAXPT.
Note (2): On return from the program, cursor points are returned inincreasing order of X. Routine may be (re-)called with pointsalready defined in X,Y (number in NPT), and they will be plottedfirst, before editing.
Note (3): User commands: the user types single-character commandsafter positioning the cursor: the following are accepted:A (Add) - add point at current cursor location.D (Delete) - delete nearest point to cursor.X (eXit) - leave subroutine.
PGNUMB -- convert a number into a plottable character string
void cpgnumb(int mm, int pp, int form, char *string, \ int *string_length);
SUBROUTINE PGNUMB (MM, PP, FORM, STRING, NC) INTEGER MM, PP, FORM CHARACTER*(*) STRING INTEGER NC
This routine converts a number into a decimal characterrepresentation. To avoid problems of floating-point roundoff, thenumber must be provided as an integer (MM) multiplied by a power of 10(10**PP). The output string retains only significant digits of MM,and will be in either integer format (123), decimal format (0.0123),or exponential format (1.23x10**5). Standard escape sequences \u, \d raise the exponent and \x is used for the multiplication sign.This routine is used by PGBOX to create numeric labels for a plot.
Formatting rules: (a) Decimal notation (FORM=1): - Trailing zeros to the right of the decimal sign are omitted - The decimal sign is omitted if there are no digits to the right of it - When the decimal sign is placed before the first digit of the number, a zero is placed before the decimal sign - The decimal sign is a period (.) - No spaces are placed between digits (ie digits are not grouped in threes as they should be) - A leading minus (-) is added if the number is negative (b) Exponential notation (FORM=2): - The exponent is adjusted to put just one (non-zero) digit before the decimal sign - The mantissa is formatted as in (a), unless its value is 1 in which case it and the multiplication sign are omitted - If the power of 10 is not zero and the mantissa is not zero, an exponent of the form \x10\u[-]nnn is appended, where \x is a multiplication sign (cross), \u is an escape sequence to raise the exponent, and as many digits nnn are used as needed (c) Automatic choice (FORM=0): Decimal notation is used if the absolute value of the number is greater than or equal to 0.01 and less than 10000. Otherwise exponential notation is used.
Arguments: MM (input) PP (input) : the value to be formatted is MM*10**PP.

FORM (input) : controls how the number is formatted: FORM = 0 -- use either decimal or exponential FORM = 1 -- use decimal notation FORM = 2 -- use exponential notation STRING (output) : the formatted character string, left justified. If the length of STRING is insufficient, a single asterisk is returned, and NC=1. NC (output) : the number of characters used in STRING: the string to be printed is STRING(1:NC).
PGOLIN -- mark a set of points using the cursor
void cpgolin(int maxpt, int *npt, float *x, float *y, int symbol);
SUBROUTINE PGOLIN (MAXPT, NPT, X, Y, SYMBOL) INTEGER MAXPT, NPT REAL X(*), Y(*) INTEGER SYMBOL
Interactive routine for user to enter data points by use ofthe cursor. Routine allows user to Add and Delete points. Thepoints are returned in the order that they were entered (unlikePGNCUR).
Arguments: MAXPT (input) : maximum number of points that may be accepted. NPT (in/out) : number of points entered; should be zero on first call. X (in/out) : array of x-coordinates. Y (in/out) : array of y-coordinates. SYMBOL (input) : code number of symbol to use for marking entered points (see PGPT).
Note (1): The dimension of arrays X and Y must be greater than orequal to MAXPT.
Note (2): On return from the program, cursor points are returned inthe order they were entered. Routine may be (re-)called with pointsalready defined in X,Y (number in NPT), and they will be plottedfirst, before editing.
Note (3): User commands: the user types single-character commands

after positioning the cursor: the following are accepted:A (Add) - add point at current cursor location.D (Delete) - delete the last point entered.X (eXit) - leave subroutine.
PGOPEN -- open a graphics device
int cpgopen(const char *device);
INTEGER FUNCTION PGOPEN (DEVICE) CHARACTER*(*) DEVICE
Open a graphics device for PGPLOT output. If the device isopened successfully, it becomes the selected device to whichgraphics output is directed until another device is selectedwith PGSLCT or the device is closed with PGCLOS.
The value returned by PGOPEN should be tested to ensure that
the device was opened successfully, e.g.,
ISTAT = PGOPEN('plot.ps/PS')
IF (ISTAT .LE. 0 ) STOP
Note that PGOPEN must be declared INTEGER in the calling program.
The DEVICE argument is a character constant or variable; its valueshould be one of the following:
(1) A complete device specification of the form 'device/type' or 'file/type', where 'type' is one of the allowed PGPLOT device types (installation-dependent) and 'device' or 'file' is the name of a graphics device or disk file appropriate for this type. The 'device' or 'file' may contain '/' characters; the final '/' delimits the 'type'. If necessary to avoid ambiguity, the 'device' part of the string may be enclosed in double quotation marks.(2) A device specification of the form '/type', where 'type' is one of the allowed PGPLOT device types. PGPLOT supplies a default file or device name appropriate for this device type.(3) A device specification with '/type' omitted; in this case the type is taken from the environment variable PGPLOT_TYPE, if defined (e.g., setenv PGPLOT_TYPE PS). Because of possible

confusion with '/' in file-names, omitting the device type in this way is not recommended.(4) A blank string (' '); in this case, PGOPEN will use the value
of environment variable PGPLOT_DEV as the device specification, or '/NULL' if the environment variable is undefined.(5) A single question mark, with optional trailing spaces ('?'); in this case, PGPLOT will prompt the user to supply the device specification, with a prompt string of the form 'Graphics device/type (? to see list, default XXX):' where 'XXX' is the default (value of environment variable PGPLOT_DEV).(6) A non-blank string in which the first character is a question mark (e.g., '?Device: '); in this case, PGPLOT will prompt the user to supply the device specification, using the supplied string as the prompt (without the leading question mark but including any trailing spaces).
In cases (5) and (6), the device specification is read from thestandard input. The user should respond to the prompt with a devicespecification of the form (1), (2), or (3). If the user types a question-mark in response to the prompt, a list of available devicetypes is displayed and the prompt is re-issued. If the user suppliesan invalid device specification, the prompt is re-issued. If the userresponds with an end-of-file character, e.g., ctrl-D in UNIX, programexecution is aborted; this avoids the possibility of an infiniteprompting loop. A programmer should avoid use of PGPLOT-promptingif this behavior is not desirable.
The device type is case-insensitive (e.g., '/ps' and '/PS' are equivalent). The device or file name may be case-sensitive in someoperating systems.
Examples of valid DEVICE arguments:
(1) 'plot.ps/ps', 'dir/plot.ps/ps', '"dir/plot.ps"/ps', 'user:[tjp.plots]plot.ps/PS'(2) '/ps' (PGPLOT interprets this as 'pgplot.ps/ps')(3) 'plot.ps' (if PGPLOT_TYPE is defined as 'ps', PGPLOT interprets this as 'plot.ps/ps')(4) ' ' (if PGPLOT_DEV is defined)(5) '? '(6) '?Device specification for PGPLOT: '
[This routine was added to PGPLOT in Version 5.1.0. Older programsuse PGBEG instead.]

Returns: PGOPEN : returns either a positive value, the
identifier of the graphics device for use with PGSLCT, or a 0 or negative value indicating an
error. In the event of error a message is written on the standard error unit.Arguments: DEVICE (input) : the 'device specification' for the plot device (see above).
PGPAGE -- advance to new page
void cpgpage(void);
SUBROUTINE PGPAGE
Advance plotter to a new page or panel, clearing the screen ifnecessary. If the "prompt state" is ON (see PGASK), confirmation is
requested from the user before clearing the screen. If the viewsurface has been subdivided into panels with PGBEG or PGSUBP, then
PGPAGE advances to the next panel, and if the current panel is the
last on the page, PGPAGE clears the screen or starts a new sheet of
paper. PGPAGE does not change the PGPLOT window or the viewport
(in normalized device coordinates); but note that if the size of theview-surface is changed externally (e.g., by a workstation windowmanager) the size of the viewport is changed in proportion.
Arguments: none
PGPANL -- switch to a different panel on the view surface
void cpgpanl(int nxc, int nyc);
SUBROUTINE PGPANL(IX, IY) INTEGER IX, IY
Start plotting in a different panel. If the view surface has beendivided into panels by PGBEG or PGSUBP, this routine can be used to
move to a different panel. Note that PGPLOT does not remember whatviewport and window were in use in each panel; these should be resetif necessary after calling PGPANL. Nor does PGPLOT clear the panel:
call PGERAS after calling PGPANL to do this.
Arguments: IX (input) : the horizontal index of the panel (in the range 1 <= IX <= number of panels in horizontal direction). IY (input) : the vertical index of the panel (in the range 1 <= IY <= number of panels in horizontal direction).
PGPAP -- change the size of the view surface
void cpgpap(float width, float aspect);
SUBROUTINE PGPAP (WIDTH, ASPECT) REAL WIDTH, ASPECT
This routine changes the size of the view surface ("paper size") to aspecified width and aspect ratio (height/width), in so far as this ispossible on the specific device. It is always possible to obtain aview surface smaller than the default size; on some devices (e.g.,printers that print on roll or fan-feed paper) it is possible to obtain a view surface larger than the default.
This routine should be called either immediately after PGBEG or
immediately before PGPAGE. The new size applies to all subsequent
images until the next call to PGPAP.
Arguments: WIDTH (input) : the requested width of the view surface in inches; if WIDTH=0.0, PGPAP will obtain the largest view
surface available consistent with argument ASPECT. (1 inch = 25.4 mm.) ASPECT (input) : the aspect ratio (height/width) of the view surface; e.g., ASPECT=1.0 gives a square view surface, ASPECT=0.618 gives a horizontal rectangle, ASPECT=1.618 gives a vertical rectangle.

PGPIXL -- draw pixels
void cpgpixl(const int *ia, int idim, int jdim, int i1, int i2, \ int j1, int j2, float x1, float x2, float y1, float y2);
SUBROUTINE PGPIXL (IA, IDIM, JDIM, I1, I2, J1, J2, 1 X1, X2, Y1, Y2) INTEGER IDIM, JDIM, I1, I2, J1, J2 INTEGER IA(IDIM,JDIM) REAL X1, X2, Y1, Y2
Draw lots of solid-filled (tiny) rectangles aligned with thecoordinate axes. Best performance is achieved when output isdirected to a pixel-oriented device and the rectangles coincidewith the pixels on the device. In other cases, pixel output isemulated.
The subsection of the array IA defined by indices (I1:I2, J1:J2)is mapped onto world-coordinate rectangle defined by X1, X2, Y1and Y2. This rectangle is divided into (I2 - I1 + 1) * (J2 - J1 + 1)small rectangles. Each of these small rectangles is solid-filledwith the color index specified by the corresponding element of IA.
On most devices, the output region is "opaque", i.e., it obscuresall graphical elements previously drawn in the region. But ondevices that do not have erase capability, the background shadeis "transparent" and allows previously-drawn graphics to showthrough.
Arguments: IA (input) : the array to be plotted. IDIM (input) : the first dimension of array A. JDIM (input) : the second dimension of array A. I1, I2 (input) : the inclusive range of the first index (I) to be plotted. J1, J2 (input) : the inclusive range of the second index (J) to be plotted. X1, Y1 (input) : world coordinates of one corner of the output region X2, Y2 (input) : world coordinates of the opposite corner of the output region
PGPNTS -- draw several graph markers, not all the same
void cpgpnts(int n, const float *x, const float *y, \ const int *symbol, int ns);
SUBROUTINE PGPNTS (N, X, Y, SYMBOL, NS) INTEGER N, NS REAL X(*), Y(*) INTEGER SYMBOL(*)
Draw Graph Markers. Unlike PGPT, this routine can draw a different
symbol at each point. The markers are drawn using the current valuesof attributes color-index, line-width, and character-height(character-font applies if the symbol number is >31). If the pointto be marked lies outside the window, no marker is drawn. The "pen position" is changed to (XPTS(N),YPTS(N)) in world coordinates(if N > 0).
Arguments: N (input) : number of points to mark. X (input) : world x-coordinate of the points. Y (input) : world y-coordinate of the points. SYMBOL (input) : code number of the symbol to be plotted at each point (see PGPT).
NS (input) : number of values in the SYMBOL array. If NS <= N, then the first NS points are drawn using the value of SYMBOL(I) at (X(I), Y(I)) and SYMBOL(1) for all the values of (X(I), Y(I)) where I > NS.
Note: the dimension of arrays X and Y must be greater than or equalto N and the dimension of the array SYMBOL must be greater than orequal to NS. If N is 1, X and Y may be scalars (constants orvariables). If NS is 1, then SYMBOL may be a scalar. If N isless than 1, nothing is drawn.
PGPOLY -- draw a polygon, using fill-area attributes
void cpgpoly(int n, const float *xpts, const float *ypts);
SUBROUTINE PGPOLY (N, XPTS, YPTS) INTEGER N
REAL XPTS(*), YPTS(*)
Fill-area primitive routine: shade the interior of a closedpolygon in the current window. The action of this routine dependson the setting of the Fill-Area Style attribute (see PGSFS).
The polygon is clipped at the edge of thewindow. The pen position is changed to (XPTS(1),YPTS(1)) in worldcoordinates (if N > 1). If the polygon is not convex, a point isassumed to lie inside the polygon if a straight line drawn toinfinity intersects and odd number of the polygon's edges.
Arguments: N (input) : number of points defining the polygon; the line consists of N straight-line segments, joining points 1 to 2, 2 to 3,... N-1 to N, N to 1. N should be greater than 2 (if it is 2 or less, nothing will be drawn). XPTS (input) : world x-coordinates of the vertices. YPTS (input) : world y-coordinates of the vertices. Note: the dimension of arrays XPTS and YPTS must be greater than or equal to N.
PGPT -- draw several graph markers
void cpgpt(int n, const float *xpts, const float *ypts, int symbol);
SUBROUTINE PGPT (N, XPTS, YPTS, SYMBOL) INTEGER N REAL XPTS(*), YPTS(*) INTEGER SYMBOL
Primitive routine to draw Graph Markers (polymarker). The markersare drawn using the current values of attributes color-index,line-width, and character-height (character-font applies if the symbolnumber is >31). If the point to be marked lies outside the window,no marker is drawn. The "pen position" is changed to(XPTS(N),YPTS(N)) in world coordinates (if N > 0).
Arguments: N (input) : number of points to mark. XPTS (input) : world x-coordinates of the points. YPTS (input) : world y-coordinates of the points. SYMBOL (input) : code number of the symbol to be drawn at each

point: -1, -2 : a single dot (diameter = current line width). -3..-31 : a regular polygon with ABS(SYMBOL) edges (style set by current fill style). 0..31 : standard marker symbols. 32..127 : ASCII characters (in current font). e.g. to use letter F as a marker, let SYMBOL = ICHAR('F'). > 127 : a Hershey symbol number.
Note: the dimension of arrays X and Y must be greater than or equalto N. If N is 1, X and Y may be scalars (constants or variables). IfN is less than 1, nothing is drawn.
PGPT1 -- draw one graph marker
void cpgpt1(float xpt, float ypt, int symbol);
SUBROUTINE PGPT1 (XPT, YPT, SYMBOL) REAL XPT, YPT INTEGER SYMBOL
Primitive routine to draw a single Graph Marker at a specified point.The marker is drawn using the current values of attributescolor-index, line-width, and character-height (character-font appliesif the symbol number is >31). If the point to be marked lies outsidethe window, no marker is drawn. The "pen position" is changed to(XPT,YPT) in world coordinates.
To draw several markers with coordinates specified by X and Yarrays, use routine PGPT.
Arguments: XPT (input) : world x-coordinate of the point. YPT (input) : world y-coordinate of the point. SYMBOL (input) : code number of the symbol to be drawn: -1, -2 : a single dot (diameter = current line width). -3..-31 : a regular polygon with ABS(SYMBOL) edges (style set by current fill style). 0..31 : standard marker symbols.

32..127 : ASCII characters (in current font). e.g. to use letter F as a marker, let SYMBOL = ICHAR('F'). > 127 : a Hershey symbol number.
PGPTXT -- write text at arbitrary position and angle
void cpgptxt(float x, float y, float angle, float fjust, \ const char *text);
SUBROUTINE PGPTXT (X, Y, ANGLE, FJUST, TEXT) REAL X, Y, ANGLE, FJUST CHARACTER*(*) TEXT
Primitive routine for drawing text. The text may be drawn at anyangle with the horizontal, and may be centered or left- or right-justified at a specified position. Routine PGTEXT provides a
simple interface to PGPTXT for horizontal strings. Text is drawn
using the current values of attributes color-index, line-width,character-height, and character-font. Text is NOT subject toclipping at the edge of the window.
Arguments: X (input) : world x-coordinate. Y (input) : world y-coordinate. The string is drawn with the baseline of all the characters passing through point (X,Y); the positioning of the string along this line is controlled by argument FJUST. ANGLE (input) : angle, in degrees, that the baseline is to make with the horizontal, increasing counter-clockwise (0.0 is horizontal). FJUST (input) : controls horizontal justification of the string. If FJUST = 0.0, the string will be left-justified at the point (X,Y); if FJUST = 0.5, it will be centered, and if FJUST = 1.0, it will be right justified. [Other values of FJUST give other justifications.] TEXT (input) : the character string to be plotted.
PGQAH -- inquire arrow-head style

void cpgqah(int *fs, float *angle, float *barb);
SUBROUTINE PGQAH (FS, ANGLE, BARB) INTEGER FS REAL ANGLE, BARB
Query the style to be used for arrowheads drawn with routine PGARRO.
Argument: FS (output) : FS = 1 => filled; FS = 2 => outline. ANGLE (output) : the acute angle of the arrow point, in degrees. BARB (output) : the fraction of the triangular arrow-head that is cut away from the back.
PGQCF -- inquire character font
void cpgqcf(int *font);
SUBROUTINE PGQCF (FONT) INTEGER FONT
Query the current Character Font (set by routine PGSCF).
Argument: FONT (output) : the current font number (in range 1-4).
PGQCH -- inquire character height
void cpgqch(float *size);
SUBROUTINE PGQCH (SIZE) REAL SIZE
Query the Character Size attribute (set by routine PGSCH).
Argument: SIZE (output) : current character size (dimensionless multiple of the default size).

PGQCI -- inquire color index
void cpgqci(int *ci);
SUBROUTINE PGQCI (CI) INTEGER CI
Query the Color Index attribute (set by routine PGSCI).
Argument: CI (output) : the current color index (in range 0-max). This is the color index actually in use, and may differ from the color index last requested by PGSCI if
that index is not available on the output device.
PGQCIR -- inquire color index range
void cpgqcir(int *icilo, int *icihi);
SUBROUTINE PGQCIR(ICILO, ICIHI) INTEGER ICILO, ICIHI
Query the color index range to be used for producing images withPGGRAY or PGIMAG, as set by routine PGSCIR or by device default.
Arguments: ICILO (output) : the lowest color index to use for images ICIHI (output) : the highest color index to use for images
PGQCLP -- inquire clipping status
void cpgqclp(int *state);
SUBROUTINE PGQCLP(STATE) INTEGER STATE
Query the current clipping status (set by routine PGSCLP).
Argument: STATE (output) : receives the clipping status (0 => disabled, 1 => enabled).
PGQCOL -- inquire color capability
void cpgqcol(int *ci1, int *ci2);
SUBROUTINE PGQCOL (CI1, CI2) INTEGER CI1, CI2
Query the range of color indices available on the current device.
Argument: CI1 (output) : the minimum available color index. This will be either 0 if the device can write in the background color, or 1 if not. CI2 (output) : the maximum available color index. This will be 1 if the device has no color capability, or a larger number (e.g., 3, 7, 15, 255).
PGQCR -- inquire color representation
void cpgqcr(int ci, float *cr, float *cg, float *cb);
SUBROUTINE PGQCR (CI, CR, CG, CB) INTEGER CI REAL CR, CG, CB
Query the RGB colors associated with a color index.
Arguments: CI (input) : color index CR (output) : red, green and blue intensities CG (output) in the range 0.0 to 1.0 CB (output)

PGQCS -- inquire character height in a variety of units
void cpgqcs(int units, float *xch, float *ych);
SUBROUTINE PGQCS(UNITS, XCH, YCH) INTEGER UNITS REAL XCH, YCH
Return the current PGPLOT character height in a variety of units.This routine provides facilities that are not available via PGQCH.
Use PGQCS if the character height is required in units other than
those used in PGSCH.
The PGPLOT "character height" is a dimension that scales with thesize of the view surface and with the scale-factor specified withroutine PGSCH. The default value is 1/40th of the height or width
of the view surface (whichever is less); this value is thenmultiplied by the scale-factor supplied with PGSCH. Note that it
is a nominal height only; the actual character size depends on thefont and is usually somewhat smaller.
Arguments: UNITS (input) : Used to specify the units of the output value: UNITS = 0 : normalized device coordinates UNITS = 1 : inches UNITS = 2 : millimeters UNITS = 3 : pixels UNITS = 4 : world coordinates Other values give an error message, and are treated as 0. XCH (output) : The character height for text written with a vertical baseline. YCH (output) : The character height for text written with a horizontal baseline (the usual case).
The character height is returned in both XCH and YCH.
If UNITS=1 or UNITS=2, XCH and YCH both receive the same value.
If UNITS=3, XCH receives the height in horizontal pixel units, and YCHreceives the height in vertical pixel units; on devices for which thepixels are not square, XCH and YCH will be different.
If UNITS=4, XCH receives the height in horizontal world coordinates(as used for the x-axis), and YCH receives the height in verticalworld coordinates (as used for the y-axis). Unless special care hasbeen taken to achive equal world-coordinate scales on both axes, thevalues of XCH and YCH will be different.
If UNITS=0, XCH receives the character height as a fraction of thehorizontal dimension of the view surface, and YCH receives thecharacter height as a fraction of the vertical dimension of the viewsurface.
PGQDT -- inquire name of nth available device type
void cpgqdt(int n, char *type, int *type_length, char *descr, \ int *descr_length, int *inter);
SUBROUTINE PGQDT(N, TYPE, TLEN, DESCR, DLEN, INTER) INTEGER N CHARACTER*(*) TYPE, DESCR INTEGER TLEN, DLEN, INTER
Return the name of the Nth available device type as a characterstring. The number of available types can be determined by callingPGQNDT. If the value of N supplied is outside the range from 1 to
the number of available types, the routine returns DLEN=TLEN=0.
Arguments: N (input) : the number of the device type (1..maximum). TYPE (output) : receives the character device-type code of the Nth device type. The argument supplied should be large enough for at least 8 characters. The first character in the string is a '/' character. TLEN (output) : receives the number of characters in TYPE, excluding trailing blanks. DESCR (output) : receives a description of the device type. The argument supplied should be large enough for at least 64 characters. DLEN (output) : receives the number of characters in DESCR, excluding trailing blanks. INTER (output) : receives 1 if the device type is an interactive one, 0 otherwise.

PGQFS -- inquire fill-area style
void cpgqfs(int *fs);
SUBROUTINE PGQFS (FS) INTEGER FS
Query the current Fill-Area Style attribute (set by routinePGSFS).
Argument: FS (output) : the current fill-area style: FS = 1 => solid (default) FS = 2 => outline FS = 3 => hatched FS = 4 => cross-hatched
PGQHS -- inquire hatching style
void cpgqhs(float *angle, float *sepn, float* phase);
SUBROUTINE PGQHS (ANGLE, SEPN, PHASE) REAL ANGLE, SEPN, PHASE
Query the style to be used hatching (fill area with fill-style 3).
Arguments: ANGLE (output) : the angle the hatch lines make with the horizontal, in degrees, increasing counterclockwise (this is an angle on the view surface, not in world-coordinate space). SEPN (output) : the spacing of the hatch lines. The unit spacing is 1 percent of the smaller of the height or width of the view surface. PHASE (output) : a real number between 0 and 1; the hatch lines are displaced by this fraction of SEPN from a fixed reference. Adjacent regions hatched with the same PHASE have contiguous hatch lines.

PGQID -- inquire current device identifier
void cpgqid(int *id);
SUBROUTINE PGQID (ID) INTEGER ID
This subroutine returns the identifier of the currentlyselected device, or 0 if no device is selected. The identifier isassigned when PGOPEN is called to open the device, and may be used
as an argument to PGSLCT. Each open device has a different
identifier.
[This routine was added to PGPLOT in Version 5.1.0.]
Argument: ID (output) : the identifier of the current device, or 0 if no device is currently selected.
PGQINF -- inquire PGPLOT general information
void cpgqinf(const char *item, char *value, int *value_length);
SUBROUTINE PGQINF (ITEM, VALUE, LENGTH) CHARACTER*(*) ITEM, VALUE INTEGER LENGTH
This routine can be used to obtain miscellaneous information aboutthe PGPLOT environment. Input is a character string defining theinformation required, and output is a character string containing therequested information.
The following item codes are accepted (note that the strings mustmatch exactly, except for case, but only the first 8 characters aresignificant). For items marked *, PGPLOT must be in the OPEN statefor the inquiry to succeed. If the inquiry is unsuccessful, eitherbecause the item code is not recognized or because the informationis not available, a question mark ('?') is returned.
'VERSION' - version of PGPLOT software in use. 'STATE' - status of PGPLOT ('OPEN' if a graphics device

is open for output, 'CLOSED' otherwise). 'USER' - the username associated with the calling program. 'NOW' - current date and time (e.g., '17-FEB-1986 10:04'). 'DEVICE' * - current PGPLOT device or file. 'FILE' * - current PGPLOT device or file. 'TYPE' * - device-type of the current PGPLOT device. 'DEV/TYPE' * - current PGPLOT device and type, in a form which is acceptable as an argument for PGBEG.
'HARDCOPY' * - is the current device a hardcopy device? ('YES' or 'NO'). 'TERMINAL' * - is the current device the user's interactive terminal? ('YES' or 'NO'). 'CURSOR' * - does the current device have a graphics cursor? ('YES' or 'NO'). 'SCROLL' * - does current device have rectangle-scroll capability ('YES' or 'NO'); see PGSCRL.
Arguments: ITEM (input) : character string defining the information to be returned; see above for a list of possible values. VALUE (output) : returns a character-string containing the requested information, truncated to the length of the supplied string or padded on the right with spaces if necessary. LENGTH (output): the number of characters returned in VALUE (excluding trailing blanks).
PGQITF -- inquire image transfer function
void cpgqitf(int *itf);
SUBROUTINE PGQITF (ITF) INTEGER ITF
Return the Image Transfer Function as set by default or by a previouscall to PGSITF. The Image Transfer Function is used by routines
PGIMAG, PGGRAY, and PGWEDG.
Argument: ITF (output) : type of transfer function (see PGSITF)

PGQLS -- inquire line style
void cpgqls(int *ls);
SUBROUTINE PGQLS (LS) INTEGER LS
Query the current Line Style attribute (set by routine PGSLS).
Argument: LS (output) : the current line-style attribute (in range 1-5).
PGQLW -- inquire line width
void cpgqlw(int *lw);
SUBROUTINE PGQLW (LW) INTEGER LW
Query the current Line-Width attribute (set by routine PGSLW).
Argument: LW (output) : the line-width (in range 1-201).
PGQNDT -- inquire number of available device types
void cpgqndt(int *n);
SUBROUTINE PGQNDT(N) INTEGER N
Return the number of available device types. This routine isusually used in conjunction with PGQDT to get a list of the
available device types.
Arguments: N (output) : the number of available device types.
PGQPOS -- inquire current pen position
void cpgqpos(float *x, float *y);
SUBROUTINE PGQPOS (X, Y) REAL X, Y
Query the current "pen" position in world C coordinates (X,Y).
Arguments: X (output) : world x-coordinate of the pen position. Y (output) : world y-coordinate of the pen position.
PGQTBG -- inquire text background color index
void cpgqtbg(int *tbci);
SUBROUTINE PGQTBG (TBCI) INTEGER TBCI
Query the current Text Background Color Index (set by routinePGSTBG).
Argument: TBCI (output) : receives the current text background color index.
PGQTXT -- find bounding box of text string
void cpgqtxt(float x, float y, float angle, float fjust, \ const char *text, float *xbox, float *ybox);
SUBROUTINE PGQTXT (X, Y, ANGLE, FJUST, TEXT, XBOX, YBOX) REAL X, Y, ANGLE, FJUST CHARACTER*(*) TEXT REAL XBOX(4), YBOX(4)

This routine returns a bounding box for a text string. Insteadof drawing the string as routine PGPTXT does, it returns in XBOX
and YBOX the coordinates of the corners of a rectangle parallelto the string baseline that just encloses the string. The fourcorners are in the order: lower left, upper left, upper right,lower right (where left and right refer to the first and lastcharacters in the string).
If the string is blank or contains no drawable characters, allfour elements of XBOX and YBOX are assigned the starting pointof the string, (X,Y).
Arguments: X, Y, ANGLE, FJUST, TEXT (input) : these arguments are the same as the corrresponding arguments in PGPTXT.
XBOX, YBOX (output) : arrays of dimension 4; on output, they contain the world coordinates of the bounding box in (XBOX(1), YBOX(1)), ..., (XBOX(4), YBOX(4)).
PGQVP -- inquire viewport size and position
void cpgqvp(int units, float *x1, float *x2, float *y1, float *y2);
SUBROUTINE PGQVP (UNITS, X1, X2, Y1, Y2) INTEGER UNITS REAL X1, X2, Y1, Y2
Inquiry routine to determine the current viewport setting.The values returned may be normalized device coordinates, inches, mm,or pixels, depending on the value of the input parameter CFLAG.
Arguments: UNITS (input) : used to specify the units of the output parameters: UNITS = 0 : normalized device coordinates UNITS = 1 : inches UNITS = 2 : millimeters UNITS = 3 : pixels Other values give an error message, and are treated as 0. X1 (output) : the x-coordinate of the bottom left corner of the viewport. X2 (output) : the x-coordinate of the top right corner of the

viewport. Y1 (output) : the y-coordinate of the bottom left corner of the viewport. Y2 (output) : the y-coordinate of the top right corner of the viewport.
PGQVSZ -- inquire size of view surface
void cpgqvsz(int units, float *x1, float *x2, float *y1, float *y2);
SUBROUTINE PGQVSZ (UNITS, X1, X2, Y1, Y2) INTEGER UNITS REAL X1, X2, Y1, Y2
This routine returns the dimensions of the view surface (the maximumplottable area) of the currently selected graphics device, in a variety of units. The size of the view surface is device-dependentand is established when the graphics device is opened. On some devices, it can be changed by calling PGPAP before starting a new
page with PGPAGE. On some devices, the size can be changed (e.g.,
by a workstation window manager) outside PGPLOT, and PGPLOT detectsthe change when PGPAGE is used. Call this routine after PGPAGE to
find the current size.
Note 1: the width and the height of the view surface in normalizeddevice coordinates are both always equal to 1.0.
Note 2: when the device is divided into panels (see PGSUBP), the
view surface is a single panel.
Arguments: UNITS (input) : 0,1,2,3 for output in normalized device coords, inches, mm, or device units (pixels) X1 (output) : always returns 0.0 X2 (output) : width of view surface Y1 (output) : always returns 0.0 Y2 (output) : height of view surface
PGQWIN -- inquire window boundary coordinates
void cpgqwin(float *x1, float *x2, float *y1, float *y2);
SUBROUTINE PGQWIN (X1, X2, Y1, Y2) REAL X1, X2, Y1, Y2
Inquiry routine to determine the current window setting.The values returned are world coordinates.
Arguments: X1 (output) : the x-coordinate of the bottom left corner of the window. X2 (output) : the x-coordinate of the top right corner of the window. Y1 (output) : the y-coordinate of the bottom left corner of the window. Y2 (output) : the y-coordinate of the top right corner of the window.
PGRECT -- draw a rectangle, using fill-area attributes
void cpgrect(float x1, float x2, float y1, float y2);
SUBROUTINE PGRECT (X1, X2, Y1, Y2) REAL X1, X2, Y1, Y2
This routine can be used instead of PGPOLY for the special case of
drawing a rectangle aligned with the coordinate axes; only twovertices need be specified instead of four. On most devices, it isfaster to use PGRECT than PGPOLY for drawing rectangles. The
rectangle has vertices at (X1,Y1), (X1,Y2), (X2,Y2), and (X2,Y1).
Arguments: X1, X2 (input) : the horizontal range of the rectangle. Y1, Y2 (input) : the vertical range of the rectangle.
PGRND -- find the smallest `round' number greater than x
float cpgrnd(float x, int *nsub);

REAL FUNCTION PGRND (X, NSUB) REAL X INTEGER NSUB
Routine to find the smallest "round" number larger than x, a"round" number being 1, 2 or 5 times a power of 10. If X is negative,PGRND(X) = -PGRND(ABS(X)). eg PGRND(8.7) = 10.0,
PGRND(-0.4) = -0.5. If X is zero, the value returned is zero.
This routine is used by PGBOX for choosing tick intervals.
Returns: PGRND : the "round" number.
Arguments: X (input) : the number to be rounded. NSUB (output) : a suitable number of subdivisions for subdividing the "nice" number: 2 or 5.
PGRNGE -- choose axis limits
void cpgrnge(float x1, float x2, float *xlo, float *xhi);
SUBROUTINE PGRNGE (X1, X2, XLO, XHI) REAL X1, X2, XLO, XHI
Choose plotting limits XLO and XHI which encompass the datarange X1 to X2.
Arguments: X1, X2 (input) : the data range (X1<X2), ie, the min and max values to be plotted. XLO, XHI (output) : suitable values to use as the extremes of a graph axis (XLO <= X1, XHI >= X2).
PGSAH -- set arrow-head style
void cpgsah(int fs, float angle, float barb);
SUBROUTINE PGSAH (FS, ANGLE, BARB) INTEGER FS
REAL ANGLE, BARB
Set the style to be used for arrowheads drawn with routine PGARRO.
Argument: FS (input) : FS = 1 => filled; FS = 2 => outline. Other values are treated as 2. Default 1. ANGLE (input) : the acute angle of the arrow point, in degrees; angles in the range 20.0 to 90.0 give reasonable results. Default 45.0. BARB (input) : the fraction of the triangular arrow-head that is cut away from the back. 0.0 gives a triangular wedge arrow-head; 1.0 gives an open >. Values 0.3 to 0.7 give reasonable results. Default 0.3.
PGSAVE -- save PGPLOT attributes
void cpgsave(void);
SUBROUTINE PGSAVE
This routine saves the current PGPLOT attributes in a private storagearea. They can be restored by calling PGUNSA (unsave). Attributes
saved are: character font, character height, color index, fill-areastyle, line style, line width, pen position, arrow-head style, hatching style, and clipping state. Color representation is not saved.
Calls to PGSAVE and PGUNSA should always be paired. Up to 20 copies
of the attributes may be saved. PGUNSA always retrieves the last-saved
values (last-in first-out stack).
Note that when multiple devices are in use, PGUNSA retrieves the
values saved by the last PGSAVE call, even if they were for a
different device.
Arguments: none
PGUNSA -- restore PGPLOT attributes

void cpgunsa(void);
ENTRY PGUNSA
This routine restores the PGPLOT attributes saved in the last call toPGSAVE. Usage: CALL PGUNSA (no arguments). See PGSAVE.
Arguments: none
PGSCF -- set character font
void cpgscf(int font);
SUBROUTINE PGSCF (FONT) INTEGER FONT
Set the Character Font for subsequent text plotting. Four differentfonts are available: 1: (default) a simple single-stroke font ("normal" font) 2: roman font 3: italic font 4: script fontThis call determines which font is in effect at the beginning ofeach text string. The font can be changed (temporarily) within a textstring by using the escape sequences \fn, \fr, \fi, and \fs for fonts1, 2, 3, and 4, respectively.
Argument: FONT (input) : the font number to be used for subsequent text plotting (in range 1-4).
PGSCH -- set character height
void cpgsch(float size);
SUBROUTINE PGSCH (SIZE) REAL SIZE
Set the character size attribute. The size affects all text and graphmarkers drawn later in the program. The default character size is

1.0, corresponding to a character height about 1/40 the height ofthe view surface. Changing the character size also scales the lengthof tick marks drawn by PGBOX and terminals drawn by PGERRX and PGERRY.
Argument: SIZE (input) : new character size (dimensionless multiple of the default size).
PGSCI -- set color index
void cpgsci(int ci);
SUBROUTINE PGSCI (CI) INTEGER CI
Set the Color Index for subsequent plotting, if the output devicepermits this. The default color index is 1, usually white on a blackbackground for video displays or black on a white background forprinter plots. The color index is an integer in the range 0 to adevice-dependent maximum. Color index 0 corresponds to the backgroundcolor; lines may be "erased" by overwriting them with color index 0(if the device permits this).
If the requested color index is not available on the selected device,color index 1 will be substituted.
The assignment of colors to color indices can be changed withsubroutine PGSCR (set color representation). Color indices 0-15
have predefined color representations (see the PGPLOT manual), butthese may be changed with PGSCR. Color indices above 15 have no
predefined representations: if these indices are used, PGSCR must
be called to define the representation.
Argument: CI (input) : the color index to be used for subsequent plotting on the current device (in range 0-max). If the index exceeds the device-dependent maximum, the default color index (1) is used.
PGSCIR -- set color index range
void cpgscir(int icilo, int icihi);
SUBROUTINE PGSCIR(ICILO, ICIHI) INTEGER ICILO, ICIHI
Set the color index range to be used for producing images withPGGRAY or PGIMAG. If the range is not all within the range supported
by the device, a smaller range will be used. The number ofdifferent colors available for images is ICIHI-ICILO+1.
Arguments: ICILO (input) : the lowest color index to use for images ICIHI (input) : the highest color index to use for images
PGSCLP -- enable or disable clipping at edge of viewport
void cpgsclp(int state);
SUBROUTINE PGSCLP(STATE) INTEGER STATE
Normally all PGPLOT primitives except text are ``clipped'' at theedge of the viewport: parts of the primitives that lie outsidethe viewport are not drawn. If clipping is disabled by calling thisroutine, primitives are visible wherever they lie on the viewsurface. The default (clipping enabled) is appropriate for almostall applications.
Argument: STATE (input) : 0 to disable clipping, or 1 to enable clipping.
25-Feb-1997 [TJP] - new routine.
PGSCR -- set color representation
void cpgscr(int ci, float cr, float cg, float cb);

SUBROUTINE PGSCR (CI, CR, CG, CB) INTEGER CI REAL CR, CG, CB
Set color representation: i.e., define the color to beassociated with a color index. Ignored for devices which do notsupport variable color or intensity. Color indices 0-15have predefined color representations (see the PGPLOT manual), butthese may be changed with PGSCR. Color indices 16-maximum have no
predefined representations: if these indices are used, PGSCR must
be called to define the representation. On monochrome outputdevices (e.g. VT125 terminals with monochrome monitors), themonochrome intensity is computed from the specified Red, Green, Blueintensities as 0.30*R + 0.59*G + 0.11*B, as in US color televisionsystems, NTSC encoding. Note that most devices do not have aninfinite range of colors or monochrome intensities available;the nearest available color is used. Examples: for black,set CR=CG=CB=0.0; for white, set CR=CG=CB=1.0; for medium gray,set CR=CG=CB=0.5; for medium yellow, set CR=CG=0.5, CB=0.0.
Argument: CI (input) : the color index to be defined, in the range 0-max. If the color index greater than the device maximum is specified, the call is ignored. Color index 0 applies to the background color. CR (input) : red, green, and blue intensities, CG (input) in range 0.0 to 1.0. CB (input)
PGSCRL -- scroll window
void cpgscrl(float dx, float dy);
SUBROUTINE PGSCRL (DX, DY) REAL DX, DY
This routine moves the window in world-coordinate space whileleaving the viewport unchanged. On devices that have thecapability, the pixels within the viewport are scrolledhorizontally, vertically or both in such a way that graphicspreviously drawn in the window are shifted so that their worldcoordinates are unchanged.
If the old window coordinate range was (X1, X2, Y1, Y2), the newcoordinate range will be approximately (X1+DX, X2+DX, Y1+DY, Y2+DY).The size and scale of the window are unchanged.
Thee window can only be shifted by a whole number of pixels(device coordinates). If DX and DY do not correspond to integralnumbers of pixels, the shift will be slightly different from thatrequested. The new window-coordinate range, and hence the exactamount of the shift, can be determined by calling PGQWIN after this
routine.
Pixels that are moved out of the viewport by this operation arelost completely; they cannot be recovered by scrolling back.Pixels that are ``scrolled into'' the viewport are filled withthe background color (color index 0).
If the absolute value of DX is bigger than the width of the window,or the aboslute value of DY is bigger than the height of the window,the effect will be the same as zeroing all the pixels in theviewport.
Not all devices have the capability to support this routine.It is only available on some interactive devices that have discretepixels. To determine whether the current device has scroll capability,call PGQINF.
Arguments: DX (input) : distance (in world coordinates) to shift the window horizontally (positive shifts window to the right and scrolls to the left). DY (input) : distance (in world coordinates) to shift the window vertically (positive shifts window up and scrolls down).
PGSCRN -- set color representation by name
void cpgscrn(int ci, const char *name, int *ier);
SUBROUTINE PGSCRN(CI, NAME, IER) INTEGER CI CHARACTER*(*) NAME

INTEGER IER
Set color representation: i.e., define the color to beassociated with a color index. Ignored for devices which do notsupport variable color or intensity. This is an alternative toroutine PGSCR. The color representation is defined by name instead
of (R,G,B) components.
Color names are defined in an external file which is read the firsttime that PGSCRN is called. The name of the external file is
found as follows:1. if environment variable (logical name) PGPLOT_RGB is defined, its value is used as the file name;2. otherwise, if environment variable PGPLOT_DIR is defined, a file "rgb.txt" in the directory named by this environment variable is used;3. otherwise, file "rgb.txt" in the current directory is used.If all of these fail to find a file, an error is reported andthe routine does nothing.
Each line of the filedefines one color, with four blank- or tab-separated fields perline. The first three fields are the R, G, B components, whichare integers in the range 0 (zero intensity) to 255 (maximumintensity). The fourth field is the color name. The color namemay include embedded blanks. Example:
255 0 0 red255 105 180 hot pink255 255 255 white 0 0 0 black
Arguments: CI (input) : the color index to be defined, in the range 0-max. If the color index greater than the device maximum is specified, the call is ignored. Color index 0 applies to the background color. NAME (input) : the name of the color to be associated with this color index. This name must be in the external file. The names are not case-sensitive. If the color is not listed in the file, the color representation is not changed. IER (output) : returns 0 if the routine was successful, 1 if an error occurred (either the external file could not be read, or the requested color was

not defined in the file).
PGSFS -- set fill-area style
void cpgsfs(int fs);
SUBROUTINE PGSFS (FS) INTEGER FS
Set the Fill-Area Style attribute for subsequent area-fill byPGPOLY, PGRECT, or PGCIRC. Four different styles are available:
solid (fill polygon with solid color of the current color-index), outline (draw outline of polygon only, using current line attributes),hatched (shade interior of polygon with parallel lines, usingcurrent line attributes), or cross-hatched. The orientation andspacing of hatch lines can be specified with routine PGSHS (set
hatch style).
Argument: FS (input) : the fill-area style to be used for subsequent plotting: FS = 1 => solid (default) FS = 2 => outline FS = 3 => hatched FS = 4 => cross-hatched Other values give an error message and are treated as 2.
PGSHLS -- set color representation using HLS system
void cpgshls(int ci, float ch, float cl, float cs);
SUBROUTINE PGSHLS (CI, CH, CL, CS) INTEGER CI REAL CH, CL, CS
Set color representation: i.e., define the color to beassociated with a color index. This routine is equivalent toPGSCR, but the color is defined in the Hue-Lightness-Saturation

model instead of the Red-Green-Blue model. Hue is representedby an angle in degrees, with red at 120, green at 240,and blue at 0 (or 360). Lightness ranges from 0.0 to 1.0, with blackat lightness 0.0 and white at lightness 1.0. Saturation ranges from0.0 (gray) to 1.0 (pure color). Hue is irrelevant when saturationis 0.0.
Examples: H L S R G B black any 0.0 0.0 0.0 0.0 0.0 white any 1.0 0.0 1.0 1.0 1.0 medium gray any 0.5 0.0 0.5 0.5 0.5 red 120 0.5 1.0 1.0 0.0 0.0 yellow 180 0.5 1.0 1.0 1.0 0.0 pink 120 0.7 0.8 0.94 0.46 0.46
Reference: SIGGRAPH Status Report of the Graphic Standards PlanningCommittee, Computer Graphics, Vol.13, No.3, Association forComputing Machinery, New York, NY, 1979. See also: J. D. Foley et al,``Computer Graphics: Principles and Practice'', second edition,Addison-Wesley, 1990, section 13.3.5.
Argument: CI (input) : the color index to be defined, in the range 0-max. If the color index greater than the device maximum is specified, the call is ignored. Color index 0 applies to the background color. CH (input) : hue, in range 0.0 to 360.0. CL (input) : lightness, in range 0.0 to 1.0. CS (input) : saturation, in range 0.0 to 1.0.
PGSHS -- set hatching style
void cpgshs(float angle, float sepn, float phase);
SUBROUTINE PGSHS (ANGLE, SEPN, PHASE) REAL ANGLE, SEPN, PHASE
Set the style to be used for hatching (fill area with fill-style 3).The default style is ANGLE=45.0, SEPN=1.0, PHASE=0.0.
Arguments: ANGLE (input) : the angle the hatch lines make with the horizontal, in degrees, increasing

counterclockwise (this is an angle on the view surface, not in world-coordinate space). SEPN (input) : the spacing of the hatch lines. The unit spacing is 1 percent of the smaller of the height or width of the view surface. This should not be zero. PHASE (input) : a real number between 0 and 1; the hatch lines are displaced by this fraction of SEPN from a fixed reference. Adjacent regions hatched with the same PHASE have contiguous hatch lines. To hatch a region with alternating lines of two colors, fill the area twice, with PHASE=0.0 for one color and PHASE=0.5 for the other color.
PGSITF -- set image transfer function
void cpgsitf(int itf);
SUBROUTINE PGSITF (ITF) INTEGER ITF
Set the Image Transfer Function for subsequent images drawn byPGIMAG, PGGRAY, or PGWEDG. The Image Transfer Function is used
to map array values into the available range of color indicesspecified with routine PGSCIR or (for PGGRAY on some devices)
into dot density.
Argument: ITF (input) : type of transfer function: ITF = 0 : linear ITF = 1 : logarithmic ITF = 2 : square-root
PGSLCT -- select an open graphics device
void cpgslct(int id);
SUBROUTINE PGSLCT(ID) INTEGER ID

Select one of the open graphics devices and direct subsequentplotting to it. The argument is the device identifier returned byPGOPEN when the device was opened. If the supplied argument is not a
valid identifier of an open graphics device, a warning message isissued and the current selection is unchanged.
[This routine was added to PGPLOT in Version 5.1.0.]
Arguments:
ID (input, integer): identifier of the device to be selected.
PGSLS -- set line style
void cpgsls(int ls);
SUBROUTINE PGSLS (LS) INTEGER LS
Set the line style attribute for subsequent plotting. Thisattribute affects line primitives only; it does not affect graphmarkers, text, or area fill.Five different line styles are available, with the following codes:1 (full line), 2 (dashed), 3 (dot-dash-dot-dash), 4 (dotted),5 (dash-dot-dot-dot). The default is 1 (normal full line).
Argument: LS (input) : the line-style code for subsequent plotting (in range 1-5).
PGSLW -- set line width
void cpgslw(int lw);
SUBROUTINE PGSLW (LW) INTEGER LW
Set the line-width attribute. This attribute affects lines, graphmarkers, and text. The line width is specified in units of 1/200 (0.005) inch (about 0.13 mm) and must be an integer in the range

1-201. On some devices, thick lines are generated by tracing eachline with multiple strokes offset in the direction perpendicular tothe line.
Argument: LW (input) : width of line, in units of 0.005 inch (0.13 mm) in range 1-201.
PGSTBG -- set text background color index
void cpgstbg(int tbci);
SUBROUTINE PGSTBG (TBCI) INTEGER TBCI
Set the Text Background Color Index for subsequent text. By defaulttext does not obscure underlying graphics. If the text backgroundcolor index is positive, however, text is opaque: the bounding boxof the text is filled with the color specified by PGSTBG before
drawing the text characters in the current color index set by PGSCI.
Use color index 0 to erase underlying graphics before drawing text.
Argument: TBCI (input) : the color index to be used for the background for subsequent text plotting: TBCI < 0 => transparent (default) TBCI >= 0 => text will be drawn on an opaque background with color index TBCI.
PGSUBP -- subdivide view surface into panels
void cpgsubp(int nxsub, int nysub);
SUBROUTINE PGSUBP (NXSUB, NYSUB) INTEGER NXSUB, NYSUB
PGPLOT divides the physical surface of the plotting device (screen,window, or sheet of paper) into NXSUB x NYSUB `panels'. When the view surface is sub-divided in this way, PGPAGE moves to the next

panel, not the next physical page. The initial subdivision of theview surface is set in the call to PGBEG. When PGSUBP is called,
it forces the next call to PGPAGE to start a new physical page,
subdivided in the manner indicated. No plotting should be donebetween a call of PGSUBP and a call of PGPAGE (or PGENV, which calls
PGPAGE).
If NXSUB > 0, PGPLOT uses the panels in row order; if <0, PGPLOT uses them in column order, e.g.,
NXSUB=3, NYSUB=2 NXSUB=-3, NYSUB=2
+-----+-----+-----+ +-----+-----+-----+| 1 | 2 | 3 | | 1 | 3 | 5 |+-----+-----+-----+ +-----+-----+-----+| 4 | 5 | 6 | | 2 | 4 | 6 |+-----+-----+-----+ +-----+-----+-----+
PGPLOT advances from one panels to the next when PGPAGE is called,
clearing the screen or starting a new page when the last panel hasbeen used. It is also possible to jump from one panel to anotherin random order by calling PGPANL.
Arguments: NXSUB (input) : the number of subdivisions of the view surface in X (>0 or <0). NYSUB (input) : the number of subdivisions of the view surface in Y (>0).
PGSVP -- set viewport (normalized device coordinates)
void cpgsvp(float xleft, float xright, float ybot, float ytop);
SUBROUTINE PGSVP (XLEFT, XRIGHT, YBOT, YTOP) REAL XLEFT, XRIGHT, YBOT, YTOP
Change the size and position of the viewport, specifyingthe viewport in normalized device coordinates. Normalizeddevice coordinates run from 0 to 1 in each dimension. Theviewport is the rectangle on the view surface "through"which one views the graph. All the PG routines which plot linesetc. plot them within the viewport, and lines are truncated at

the edge of the viewport (except for axes, labels etc drawn withPGBOX or PGLAB). The region of world space (the coordinate
space of the graph) which is visible through the viewport isspecified by a call to PGSWIN. It is legal to request a
viewport larger than the view surface; only the part whichappears on the view surface will be plotted.
Arguments: XLEFT (input) : x-coordinate of left hand edge of viewport, in NDC. XRIGHT (input) : x-coordinate of right hand edge of viewport, in NDC. YBOT (input) : y-coordinate of bottom edge of viewport, in NDC. YTOP (input) : y-coordinate of top edge of viewport, in NDC.
PGSWIN -- set window
void cpgswin(float x1, float x2, float y1, float y2);
SUBROUTINE PGSWIN (X1, X2, Y1, Y2) REAL X1, X2, Y1, Y2
Change the window in world coordinate space that is to be mapped onto the viewport. Usually PGSWIN is called automatically by PGENV,
but it may be called directly by the user.
Arguments: X1 (input) : the x-coordinate of the bottom left corner of the viewport. X2 (input) : the x-coordinate of the top right corner of the viewport (note X2 may be less than X1). Y1 (input) : the y-coordinate of the bottom left corner of the viewport. Y2 (input) : the y-coordinate of the top right corner of the viewport (note Y2 may be less than Y1).
PGTBOX -- draw frame and write (DD) HH MM SS.S labelling
void cpgtbox(const char *xopt, float xtick, int nxsub, \
const char *yopt, float ytick, int nysub);
SUBROUTINE PGTBOX (XOPT, XTICK, NXSUB, YOPT, YTICK, NYSUB)
REAL XTICK, YTICK INTEGER NXSUB, NYSUB CHARACTER XOPT*(*), YOPT*(*)
Draw a box and optionally label one or both axes with (DD) HH MM SS style numeric labels (useful for time or RA - DEC plots). If this style of labelling is desired, then PGSWIN should have been called
previously with the extrema in SECONDS of time.
In the seconds field, you can have at most 3 places after the decimalpoint, so that 1 ms is the smallest time interval you can time label.
Large numbers are coped with by fields of 6 characters long. Thus you could have times with days or hours as big as 999999. However, in practice, you might have trouble with labels overwriting themselveswith such large numbers unless you a) use a small time INTERVAL, b) use a small character size or c) choose your own sparse ticks in the call to PGTBOX.
PGTBOX will attempt, when choosing its own ticks, not to overwrite
the labels, but this algorithm is not very bright and may fail.
Note that small intervals but large absolute times such asTMIN = 200000.0 s and TMAX=200000.1 s will cause the algorithmto fail. This is inherent in PGPLOT's use of single precisionand cannot be avoided. In such cases, you should use relativetimes if possible.
PGTBOX's labelling philosophy is that the left-most or bottom tick of
the axis contains a full label. Thereafter, only changing fields arelabelled. Negative fields are given a '-' label, positive fieldshave none. Axes that have the DD (or HH if the day field is notused) field on each major tick carry the sign on each field. If theaxis crosses zero, the zero tick will carry a full label and sign.
This labelling style can cause a little confusion with some specialcases, but as long as you know its philosophy, the truth can be divined.Consider an axis with TMIN=20s, TMAX=-20s. The labels will look like
+----------+----------+----------+----------+ 0h0m20s 10s -0h0m0s 10s 20s

Knowing that the left field always has a full label and thatpositive fields are unsigned, informs that time is decreasingfrom left to right, not vice versa. This can become very unclear if you have used the 'F' option, but that is your problem !
Exceptions to this labelling philosophy are when the finest timeincrement being displayed is hours (with option 'Y') or days. Then all fields carry a label. For example,
+----------+----------+----------+----------+ -10h -8h -6h -4h -2h
PGTBOX can be used in place of PGBOX; it calls PGBOX and only invokes
time labelling if requested. Other options are passed intact to PGBOX.
Inputs: XOPT : X-options for PGTBOX. Same as for PGBOX plus
'Z' for (DD) HH MM SS.S time labelling 'Y' means don't include the day field so that labels are HH MM SS.S rather than DD HH MM SS.S The hours will accumulate beyond 24 if necessary in this case. 'X' label the HH field as modulo 24. Thus, a label such as 25h 10m would come out as 1h 10m 'H' means superscript numbers with d, h, m, & s symbols 'D' means superscript numbers with o, ', & '' symbols 'F' causes the first label (left- or bottom-most) to be omitted. Useful for sub-panels that abut each other. Care is needed because first label carries sign as well. 'O' means omit leading zeros in numbers < 10 E.g. 3h 3m 1.2s rather than 03h 03m 01.2s Useful to help save space on X-axes. The day field does not use this facility.
YOPT : Y-options for PGTBOX. See above.
XTICK : X-axis major tick increment. 0.0 for default. YTICK : Y-axis major tick increment. 0.0 for default. If the 'Z' option is used then XTICK and/or YTICK must be in seconds. NXSUB : Number of intervals for minor ticks on X-axis. 0 for default NYSUB : Number of intervals for minor ticks on Y-axis. 0 for default
The regular XOPT and YOPT axis options for PGBOX are

A : draw Axis (X axis is horizontal line Y=0, Y axis is vertical line X=0). B : draw bottom (X) or left (Y) edge of frame. C : draw top (X) or right (Y) edge of frame. G : draw Grid of vertical (X) or horizontal (Y) lines. I : Invert the tick marks; ie draw them outside the viewport instead of inside. L : label axis Logarithmically (see below). N : write Numeric labels in the conventional location below the viewport (X) or to the left of the viewport (Y). P : extend ("Project") major tick marks outside the box (ignored if option I is specified). M : write numeric labels in the unconventional location above the viewport (X) or to the right of the viewport (Y). T : draw major Tick marks at the major coordinate interval. S : draw minor tick marks (Subticks). V : orient numeric labels Vertically. This is only applicable to Y. The default is to write Y-labels parallel to the axis. 1 : force decimal labelling, instead of automatic choice (see PGNUMB).
2 : force exponential labelling, instead of automatic.
The default is to write Y-labels parallel to the axis
****************** EXCEPTIONS *******************
Note that 1) PGBOX option 'L' (log labels) is ignored with option 'Z'
2) The 'O' option will be ignored for the 'V' option as it makes it impossible to align the labels nicely 3) Option 'Y' is forced with option 'D'
***************************************************************
PGTEXT -- write text (horizontal, left-justified)
void cpgtext(float x, float y, const char *text);
SUBROUTINE PGTEXT (X, Y, TEXT)
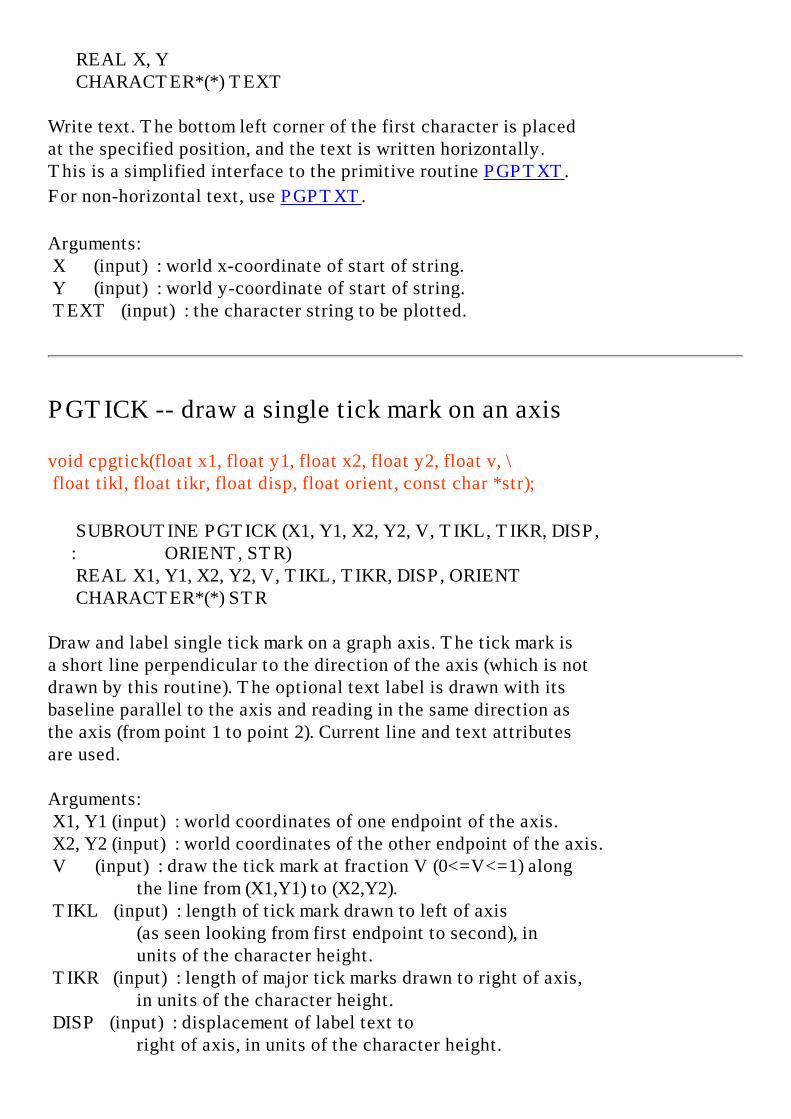
REAL X, Y CHARACTER*(*) TEXT
Write text. The bottom left corner of the first character is placedat the specified position, and the text is written horizontally.This is a simplified interface to the primitive routine PGPTXT.
For non-horizontal text, use PGPTXT.
Arguments: X (input) : world x-coordinate of start of string. Y (input) : world y-coordinate of start of string. TEXT (input) : the character string to be plotted.
PGTICK -- draw a single tick mark on an axis
void cpgtick(float x1, float y1, float x2, float y2, float v, \ float tikl, float tikr, float disp, float orient, const char *str);
SUBROUTINE PGTICK (X1, Y1, X2, Y2, V, TIKL, TIKR, DISP, : ORIENT, STR) REAL X1, Y1, X2, Y2, V, TIKL, TIKR, DISP, ORIENT CHARACTER*(*) STR
Draw and label single tick mark on a graph axis. The tick mark isa short line perpendicular to the direction of the axis (which is notdrawn by this routine). The optional text label is drawn with itsbaseline parallel to the axis and reading in the same direction asthe axis (from point 1 to point 2). Current line and text attributesare used.
Arguments: X1, Y1 (input) : world coordinates of one endpoint of the axis. X2, Y2 (input) : world coordinates of the other endpoint of the axis. V (input) : draw the tick mark at fraction V (0<=V<=1) along the line from (X1,Y1) to (X2,Y2). TIKL (input) : length of tick mark drawn to left of axis (as seen looking from first endpoint to second), in units of the character height. TIKR (input) : length of major tick marks drawn to right of axis, in units of the character height. DISP (input) : displacement of label text to right of axis, in units of the character height.

ORIENT (input) : orientation of label text, in degrees; angle between baseline of text and direction of axis (0-360. STR (input) : text of label (may be blank).
PGUPDT -- update display
void cpgupdt(void);
SUBROUTINE PGUPDT
Update the graphics display: flush any pending commands to theoutput device. This routine empties the buffer created by PGBBUF,
but it does not alter the PGBBUF/PGEBUF counter. The routine should
be called when it is essential that the display be completely up todate (before interaction with the user, for example) but it is notknown if output is being buffered.
Arguments: none
PGVECT -- vector map of a 2D data array, with blanking
void cpgvect(const float *a, const float *b, int idim, int jdim, \ int i1, int i2, int j1, int j2, float c, int nc, \ const float *tr, float blank);
SUBROUTINE PGVECT (A, B, IDIM, JDIM, I1, I2, J1, J2, C, NC, TR, 1 BLANK) INTEGER IDIM, JDIM, I1, I2, J1, J2, NC REAL A(IDIM,JDIM), B(IDIM, JDIM), TR(6), BLANK, C
Draw a vector map of two arrays. This routine is similar toPGCONB in that array elements that have the "magic value" defined by
the argument BLANK are ignored, making gaps in the vector map. Theroutine may be useful for data measured on most but not all of thepoints of a grid. Vectors are displayed as arrows; the style of thearrowhead can be set with routine PGSAH, and the the size of the
arrowhead is determined by the current character size, set by PGSCH.
Arguments:

A (input) : horizontal component data array. B (input) : vertical component data array. IDIM (input) : first dimension of A and B. JDIM (input) : second dimension of A and B. I1,I2 (input) : range of first index to be mapped (inclusive). J1,J2 (input) : range of second index to be mapped (inclusive). C (input) : scale factor for vector lengths, if 0.0, C will be set so that the longest vector is equal to the smaller of TR(2)+TR(3) and TR(5)+TR(6). NC (input) : vector positioning code. <0 vector head positioned on coordinates >0 vector base positioned on coordinates =0 vector centered on the coordinates TR (input) : array defining a transformation between the I,J grid of the array and the world coordinates. The world coordinates of the array point A(I,J) are given by: X = TR(1) + TR(2)*I + TR(3)*J Y = TR(4) + TR(5)*I + TR(6)*J Usually TR(3) and TR(5) are zero - unless the coordinate transformation involves a rotation or shear. BLANK (input) : elements of arrays A or B that are exactly equal to this value are ignored (blanked).
PGVSIZ -- set viewport (inches)
void cpgvsiz(float xleft, float xright, float ybot, float ytop);
SUBROUTINE PGVSIZ (XLEFT, XRIGHT, YBOT, YTOP) REAL XLEFT, XRIGHT, YBOT, YTOP
Change the size and position of the viewport, specifyingthe viewport in physical device coordinates (inches). Theviewport is the rectangle on the view surface "through"which one views the graph. All the PG routines which plot linesetc. plot them within the viewport, and lines are truncated atthe edge of the viewport (except for axes, labels etc drawn withPGBOX or PGLAB). The region of world space (the coordinate
space of the graph) which is visible through the viewport isspecified by a call to PGSWIN. It is legal to request a
viewport larger than the view surface; only the part which

appears on the view surface will be plotted.
Arguments: XLEFT (input) : x-coordinate of left hand edge of viewport, in inches from left edge of view surface. XRIGHT (input) : x-coordinate of right hand edge of viewport, in inches from left edge of view surface. YBOT (input) : y-coordinate of bottom edge of viewport, in inches from bottom of view surface. YTOP (input) : y-coordinate of top edge of viewport, in inches from bottom of view surface.
PGVSTD -- set standard (default) viewport
void cpgvstd(void);
SUBROUTINE PGVSTD
Define the viewport to be the standard viewport. The standardviewport is the full area of the view surface (or panel),less a margin of 4 character heights all round for labelling.It thus depends on the current character size, set by PGSCH.
Arguments: none.
PGWEDG -- annotate an image plot with a wedge
void cpgwedg(const char *side, float disp, float width, \ float fg, float bg, const char *label);
SUBROUTINE PGWEDG(SIDE, DISP, WIDTH, FG, BG, LABEL) CHARACTER *(*) SIDE,LABEL REAL DISP, WIDTH, FG, BG
Plot an annotated grey-scale or color wedge parallel to a given axisof the the current viewport. This routine is designed to provide abrightness/color scale for an image drawn with PGIMAG or PGGRAY.
The wedge will be drawn with the transfer function set by PGSITF
and using the color index range set by PGSCIR.

Arguments: SIDE (input) : The first character must be one of the characters 'B', 'L', 'T', or 'R' signifying the Bottom, Left, Top, or Right edge of the viewport. The second character should be 'I' to use PGIMAG
to draw the wedge, or 'G' to use PGGRAY.
DISP (input) : the displacement of the wedge from the specified edge of the viewport, measured outwards from the viewport in units of the character height. Use a negative value to write inside the viewport, a positive value to write outside. WIDTH (input) : The total width of the wedge including annotation, in units of the character height. FG (input) : The value which is to appear with shade 1 ("foreground"). Use the values of FG and BG that were supplied to PGGRAY or PGIMAG.
BG (input) : the value which is to appear with shade 0 ("background"). LABEL (input) : Optional units label. If no label is required use ' '.
PGWNAD -- set window and adjust viewport to same aspect ratio
void cpgwnad(float x1, float x2, float y1, float y2);
SUBROUTINE PGWNAD (X1, X2, Y1, Y2) REAL X1, X2, Y1, Y2
Change the window in world coordinate space that is to be mapped onto the viewport, and simultaneously adjust the viewport so that theworld-coordinate scales are equal in x and y. The new viewport isthe largest one that can fit within the previously set viewportwhile retaining the required aspect ratio.
Arguments: X1 (input) : the x-coordinate of the bottom left corner of the viewport. X2 (input) : the x-coordinate of the top right corner of the viewport (note X2 may be less than X1). Y1 (input) : the y-coordinate of the bottom left corner
of the viewport. Y2 (input) : the y-coordinate of the top right corner of the viewport (note Y2 may be less than Y1).
PGADVANCE -- non-standard alias for PGPAGE
SUBROUTINE PGADVANCE
See description of PGPAGE.
PGBEGIN -- non-standard alias for PGBEG
INTEGER FUNCTION PGBEGIN (UNIT, FILE, NXSUB, NYSUB) INTEGER UNIT CHARACTER*(*) FILE INTEGER NXSUB, NYSUB
See description of PGBEG.
PGCURSE -- non-standard alias for PGCURS
INTEGER FUNCTION PGCURSE (X, Y, CH) REAL X, Y CHARACTER*1 CH
See description of PGCURS.
PGLABEL -- non-standard alias for PGLAB
SUBROUTINE PGLABEL (XLBL, YLBL, TOPLBL) CHARACTER*(*) XLBL, YLBL, TOPLBL
See description of PGLAB.

PGMTEXT -- non-standard alias for PGMTXT
SUBROUTINE PGMTEXT (SIDE, DISP, COORD, FJUST, TEXT) CHARACTER*(*) SIDE, TEXT REAL DISP, COORD, FJUST
See description of PGMTXT.
PGNCURSE -- non-standard alias for PGNCUR
SUBROUTINE PGNCURSE (MAXPT, NPT, X, Y, SYMBOL) INTEGER MAXPT, NPT REAL X(*), Y(*) INTEGER SYMBOL
See description of PGNCUR.
PGPAPER -- non-standard alias for PGPAP
SUBROUTINE PGPAPER (WIDTH, ASPECT) REAL WIDTH, ASPECT
See description of PGPAP.
PGPOINT -- non-standard alias for PGPT
SUBROUTINE PGPOINT (N, XPTS, YPTS, SYMBOL) INTEGER N REAL XPTS(*), YPTS(*) INTEGER SYMBOL
See description of PGPT.

PGPTEXT -- non-standard alias for PGPTXT
SUBROUTINE PGPTEXT (X, Y, ANGLE, FJUST, TEXT) REAL X, Y, ANGLE, FJUST CHARACTER*(*) TEXT
See description of PGPTXT.
PGVPORT -- non-standard alias for PGSVP
SUBROUTINE PGVPORT (XLEFT, XRIGHT, YBOT, YTOP) REAL XLEFT, XRIGHT, YBOT, YTOP
See description of PGSVP.
PGVSIZE -- non-standard alias for PGVSIZ
SUBROUTINE PGVSIZE (XLEFT, XRIGHT, YBOT, YTOP) REAL XLEFT, XRIGHT, YBOT, YTOP
See description of PGVSIZ.
PGVSTAND -- non-standard alias for PGVSTD
SUBROUTINE PGVSTAND
See description of PGVSTD.
PGWINDOW -- non-standard alias for PGSWIN
SUBROUTINE PGWINDOW (X1, X2, Y1, Y2) REAL X1, X2, Y1, Y2

See description of PGSWIN.
PGPLOT
Tim Pearson, California Institute of Technology, tjp戢stro.caltech.edu
Copyright © 1995-2002 California Institute of Technology

Appendix B. PGPLOT Symbols
B.1 Character Encoding
The PGPLOT routines that display text, e.g., PGTEXT, PGMTXT, and PGMTXT, generate a visible representation of the characters supplied in a Fortran character variable or constant. On most computer systems, a Fortran character can take any of 256 values, numbered 0-255 (decimal). PGPLOT interprets the values as follows:
0-31 These are used for the standard graph markers. On most computer systems, they are non-printable control characters.
32-127 PGPLOT interprets these according to the US-ASCII character set, a subset of the ISO-Latin character sets, with one exception: character number 94, which should be a circumflex (^), is displayed as a degree symbol (°). The degree symbol is also available as character 176, which should be used in preference; eventually the display of character 94 will be corrected.
128-159 These are unassigned; in the ISO-Latin character sets, they are reserved for non-printable control characters.
160-255 As far as possible, PGPLOT interprets these according to the ISO-Latin-1 character set. In some cases, required accents are omitted. I hope to rectify the omissions in a later version of PGPLOT. Note that if your computer system does not use the ISO-Latin-1 character set, the output of a PGPLOT program will not correspond to the characters in the source code.
The complete character encoding is displayed in Figure B.0. This is for the standard
PGPLOT roman font (font number 2); some of the symbols will differ from font to font.
B.2 Additional Symbols
An escape code allows a large number of additional symbols to be displayed by PGPLOT. Each symbol is composed of a set of vectors, based on digitized type fonts devised by A. V. Hershey of the US Naval Postgraduate School, and is assigned a number in the range 0-4000.
Figures B.1 to B.7 show the graphical representation of all the available symbols arranged according to Hershey's numerical sequence; the blank spaces in this table represent ``space'' characters of various widths. Note that not every number has an
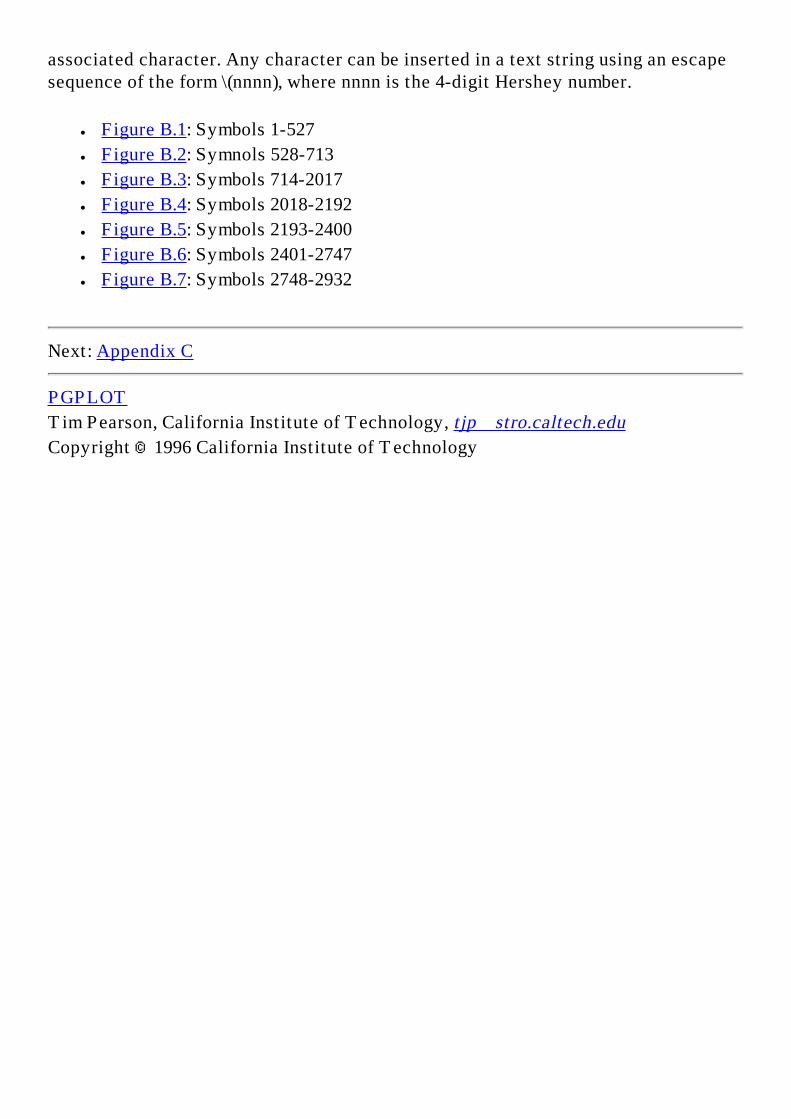
associated character. Any character can be inserted in a text string using an escape sequence of the form \(nnnn), where nnnn is the 4-digit Hershey number.
● Figure B.1: Symbols 1-527
● Figure B.2: Symnols 528-713
● Figure B.3: Symbols 714-2017
● Figure B.4: Symbols 2018-2192
● Figure B.5: Symbols 2193-2400
● Figure B.6: Symbols 2401-2747
● Figure B.7: Symbols 2748-2932
Next: Appendix C
PGPLOT
Tim Pearson, California Institute of Technology, tjp戢stro.caltech.edu
Copyright © 1996 California Institute of Technology
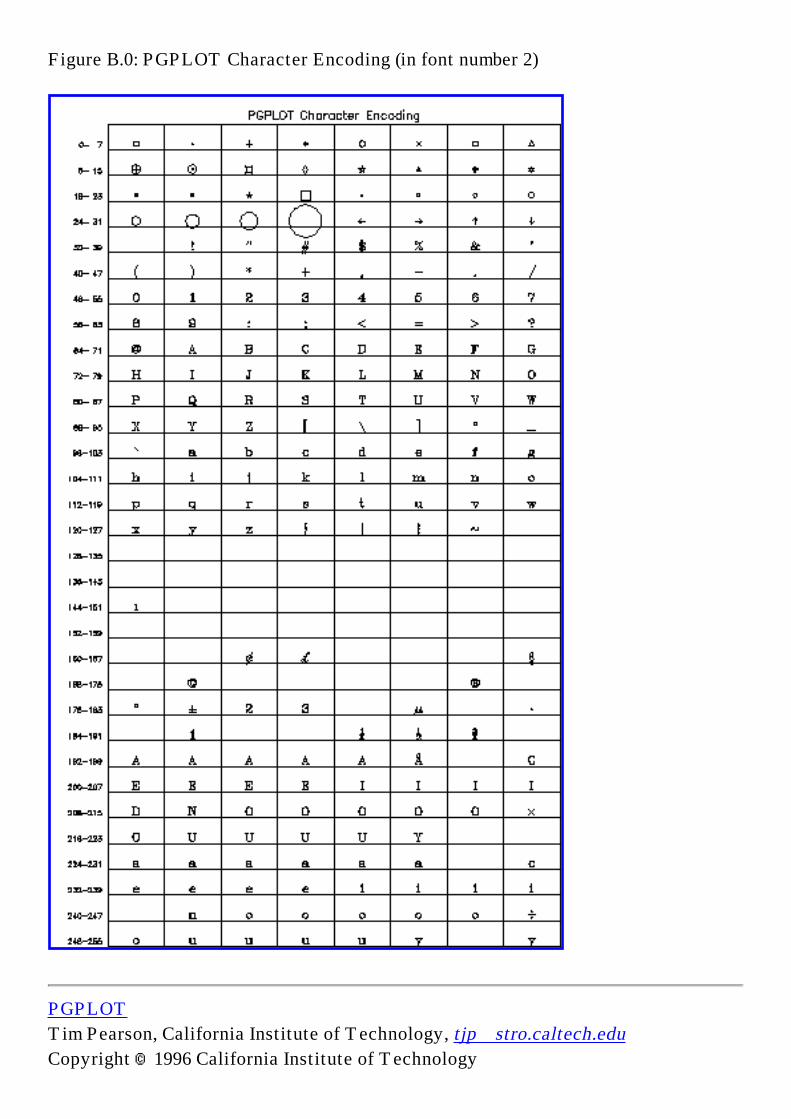
Figure B.0: PGPLOT Character Encoding (in font number 2)
PGPLOT
Tim Pearson, California Institute of Technology, tjp戢stro.caltech.edu
Copyright © 1996 California Institute of Technology

Figure B.1: PGPLOT Symbols

PGPLOT
Tim Pearson, California Institute of Technology, tjp戢stro.caltech.edu
Copyright © 1995 California Institute of Technology

Figure B.2: PGPLOT Symbols

PGPLOT
Tim Pearson, California Institute of Technology, tjp戢stro.caltech.edu
Copyright © 1995 California Institute of Technology
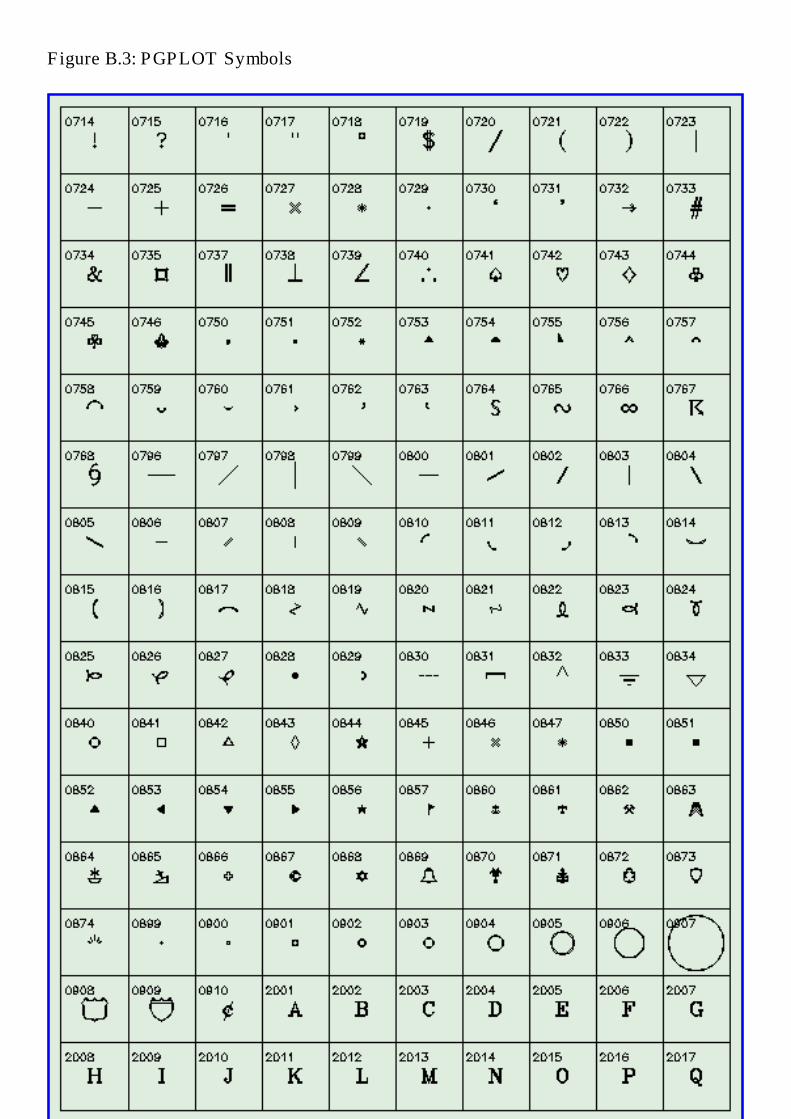
Figure B.3: PGPLOT Symbols

PGPLOT
Tim Pearson, California Institute of Technology, tjp戢stro.caltech.edu
Copyright © 1995 California Institute of Technology

Figure B.4: PGPLOT Symbols

PGPLOT
Tim Pearson, California Institute of Technology, tjp戢stro.caltech.edu
Copyright © 1995 California Institute of Technology
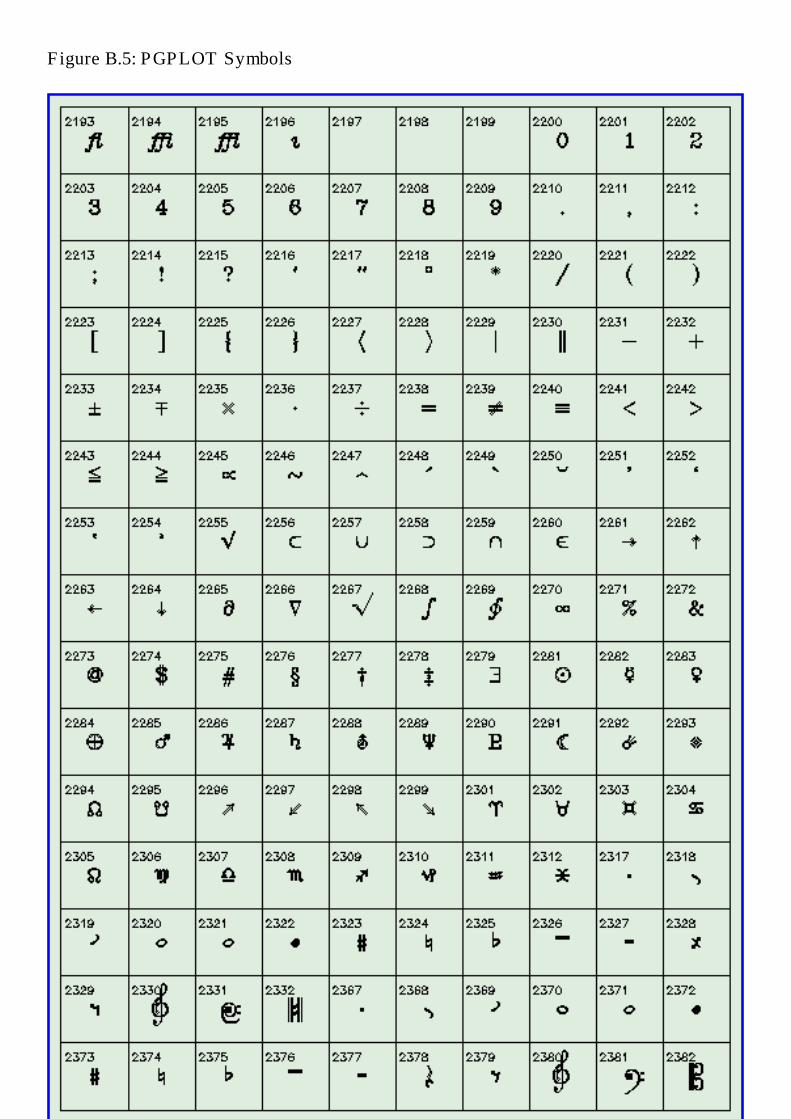
Figure B.5: PGPLOT Symbols
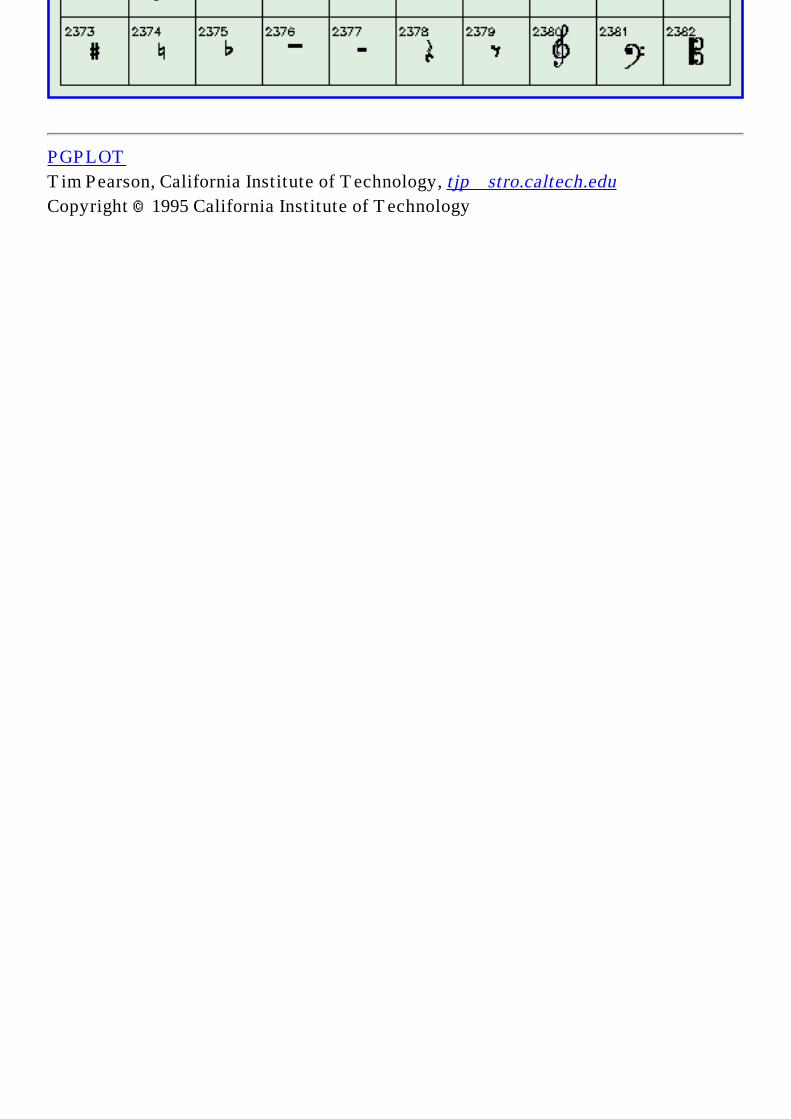
PGPLOT
Tim Pearson, California Institute of Technology, tjp戢stro.caltech.edu
Copyright © 1995 California Institute of Technology

Figure B.6: PGPLOT Symbols

PGPLOT
Tim Pearson, California Institute of Technology, tjp戢stro.caltech.edu
Copyright © 1995 California Institute of Technology
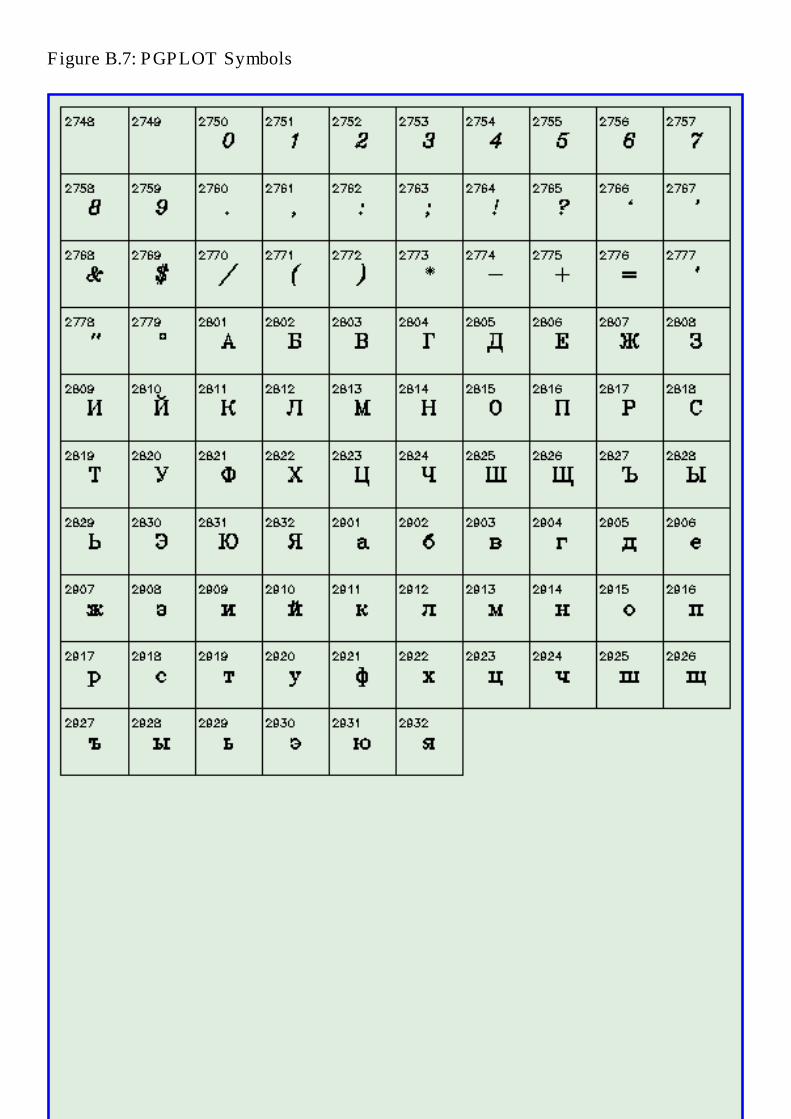
Figure B.7: PGPLOT Symbols
PGPLOT
Tim Pearson, California Institute of Technology, tjp戢stro.caltech.edu
Copyright © 1995 California Institute of Technology
Calling PGPLOT from a C or C++ Program
Introduction
PGPLOT is a Fortran subroutine library, and calling Fortran subroutines directly from C or C++ is a messy, difficult, and unportable exercise. This is due to the lack of a universal set of interlanguage calling conventions, and to the lack of a standard on how FORTRAN LOGICAL and CHARACTER types are represented in terms of basic machine types. Furthermore, since C implements call-by-value argument passing semantics, whereas FORTRAN uses pass-by-reference, there is the added complication that literal values must be sent indirectly by way of references to dummy variables.
The CPGPLOT library adds an intermediate level of wrapper functions between C programs and the PGPLOT library. These functions hide the system dependencies of calling PGPLOT behind a system-independent interface.
It is essential when using the CPGPLOT interface library to include the library header file cpgplot.h at the top of all C files containing calls to the library. Without
this file, the functions will not be correctly prototyped and your code will not work.
The CPGPLOT library can be used only with an ANSI-compatible C compiler that understands C function prototypes.
Using the CPGPLOT library
The names of the C interface library functions are the same as their PGPLOT counterparts, but are prefixed with a c and written in lower case, e.g., PGTEXT becomes cpgtext.
The header file cpgplot.h declares the types of the arguments of each CPGPLOT
routine. The types can usually be deduced from the FORTRAN subroutine descriptions in Appendix A, as described below, but cpgplot.h should be consulted
in case of doubt.
REAL and INTEGER arguments
Where the PGPLOT routine expects a REAL or INTEGER argument, supply the C routine with a float or int argument as appropriate. If the Fortran routine uses the argument for input only, it should be passed by value; but if it is used to return a value, supply a pointer to a variable of the appropriate type. If the FORTRAN

argument is an array, the C argument should be a pointer to an array. For two-dimensional arrays, supply a pointer to a one-dimensional C array in which the elements are packed with the first index changing fastest (see example below).
LOGICAL arguments
Where the PGPLOT routine expects a LOGICAL argument, the C routine requires an int argument. Zero is interpreted as FORTRAN .FALSE. and non-zero as FORTRAN .TRUE., e.g.,
FORTRAN call C equivalent call(s)
PGASK(.FALSE.) cpgask(0) PGASK(.TRUE.) cpgask(1) or cpgask(2) etc.
CHARACTER arguments
When the FORTRAN routine expects a CHARACTER argument for input, the C routine takes a normal C pointer to a nul-terminated string (char array, with end-of string marked by '\0').
Arguments that are used to return FORTRAN character strings must be treated with care. FORTRAN doesn't understand '\0' termination of strings and instead requires that the dimension of the character array be specified along with the array. The interface handles this transparently for input-only strings by using strlen() to determine the length of the string, but for return string arguments it needs to be told the length available in the passed char array. Fortunately all PGPLOT routines that return such strings also have an argument to return the unpadded length of the return string. In CPGPLOT, you must initialize this argument with the dimension of the string array that has been sent. In the prototypes listed in cpgplot.h the length
arguments are distinguishable by virtue of their having the name of the string to which they relate, postfixed with _length. For example, the PGPLOT routine PGQINF() is prototyped as
void cpgqinf(char *item, char *value, int *value_length);
where the value_length argument is the length argument for the string argument value.
For example, to write a C function to return 1 if a PGPLOT device is open, or 0 otherwise, one could write.
#include "cpgplot.h" int pgplot_is_open(void)

{ char answer[10]; /* The PGQINF return string */ int answer_len = sizeof(answer); /* allocated size of answer[] */ cpgqinf("STATE", answer, &answer_len); return strcmp(answer, "YES") == 0; }
Note that the dimension, sent as the third argument, is the total number of characters allocated to the answer[] array. The interface function actually subtracts one from this when it tells PGPLOT how long the string is. This leaves room for the interface function to terminate the returned string with a '\0'. All returned strings are terminated in this manner at the length returned by PGPLOT in the length argument.
Limitations
PGPLOT procedures that take FORTRAN SUBROUTINEs or FUNCTIONs as arguments (e.g., PGFUNX, PGCONX) are not represented in the CPGPLOT library. Such procedures cannot be handled on most systems.
Other Machine Dependencies
Many system vendors say that if you call FORTRAN functions that do any I/O, you should have a FORTRAN main program, so that the FORTRAN I/O module gets correctly initialized. Since PGPLOT uses FORTRAN I/O, this applies to C or C++ programs that call PGPLOT. However, this can be difficult to arrange, and in many systems it is not necessary. Consult the documentation for your operating system to determine how to write a C or C++ program that calls subroutines written in Fortran.
When you mix languages, it is usually necessary to include system support libraries for each language. Again, you will need to consult the documentation for your operating system and compilers to determine what libaries are needed and where they are located.
On UNIX systems, the compiler usually invokes the linker/loader itself, specifying the necessary libraries. However, with this method the linker/lodaer will not automatically find the libraries required by the other compilers involved.
Since FORTRAN usually has to be linked with a lot of support libraries, it is usually most convenient to use the FORTRAN compiler to link your C program. If your compiler is not the system-supplied compiler, then it is unlikely that the FORTRAN compiler will cite the correct C run-time library to the linker. This means that you will have to do it yourself (e.g., the gcc compiler requires programs to be linked with libgcc.a, e.g.,
gcc -c blob.c f77 -o blob blob.o -lcpgplot -lpgplot -lX11 -lgcc -lm
Example: Solaris
A C program calling PGPLOT; in this case it is easiest to use f77 to do the link:
cc -c -I/usr/local/pgplot ctest.cf77 -o ctest ctest.o -L/usr/local/pgplot -lcpgplot -lpgplot
(Replace /usr/local/pgplot with your PGPLOT directory.)
A C++ program calling PGPLOT; in this case we need both Fortran and C++ libraries, and it is easiest to use CC to do the link and to provide the Fortran libraries explicitly:
CC -c c++test.C CC c++test.o -L/usr/local/pgplot -lcpgplot -lpgplot \ /usr/local/lang/SUNWspro/SC3.0.1/lib/libM77.a -lX11 -lF77
Note that the names and locations of the Fortran libraries will depend on the version of the compiler in use.
Example: Digital UNIX
A C program calling PGPLOT:
cc -c -I/usr/local/pgplot ctest.cf77 -o ctest ctest.o -L/usr/local/pgplot -lcpgplot -lpgplot -lX11 -lm -nofor_main
Note the use of f77 to do the link step, and the use of the -nofor_main switch.
Examples
The following example shows some simple CPGPLOT calls:
#include "cpgplot.h"
#include <stdio.h>#include <stdlib.h>#include <math.h>

int main(){ int i; static float xs[] = {1.0, 2.0, 3.0, 4.0, 5.0 }; static float ys[] = {1.0, 4.0, 9.0, 16.0, 25.0 }; float xr[60], yr[60]; int n = sizeof(xr) / sizeof(xr[0]); /* * Call PGBEG to initiate PGPLOT and open the output device; PGBEG * will prompt the user to supply the device name and type. */ if(cpgbeg(0, "?", 1, 1) != 1) return EXIT_FAILURE; /* * Call PGENV to specify the range of the axes and to draw a box, and * PGLAB to label it. The x-axis runs from 0 to 10, and y from 0 to 20. */ cpgenv(0.0, 10.0, 0.0, 20.0, 0, 1); cpglab("(x)", "(y)", "PGPLOT Example 1: y = x\\u2\\d"); /* * Mark five points (coordinates in arrays XS and YS), using symbol * number 9. */ cpgpt(5, xs, ys, 9); /* * Compute the function at 'n=60' points, and use PGLINE to draw it. */ for(i=0; i<n; i++) { xr[i] = 0.1*i; yr[i] = xr[i]*xr[i]; } cpgline(n, xr, yr); /* * Finally, call PGEND to terminate things properly. */ cpgend(); return EXIT_SUCCESS;}
A second example shows how a two-dimensional FORTRAN array should be handled:
#include "cpgplot.h"
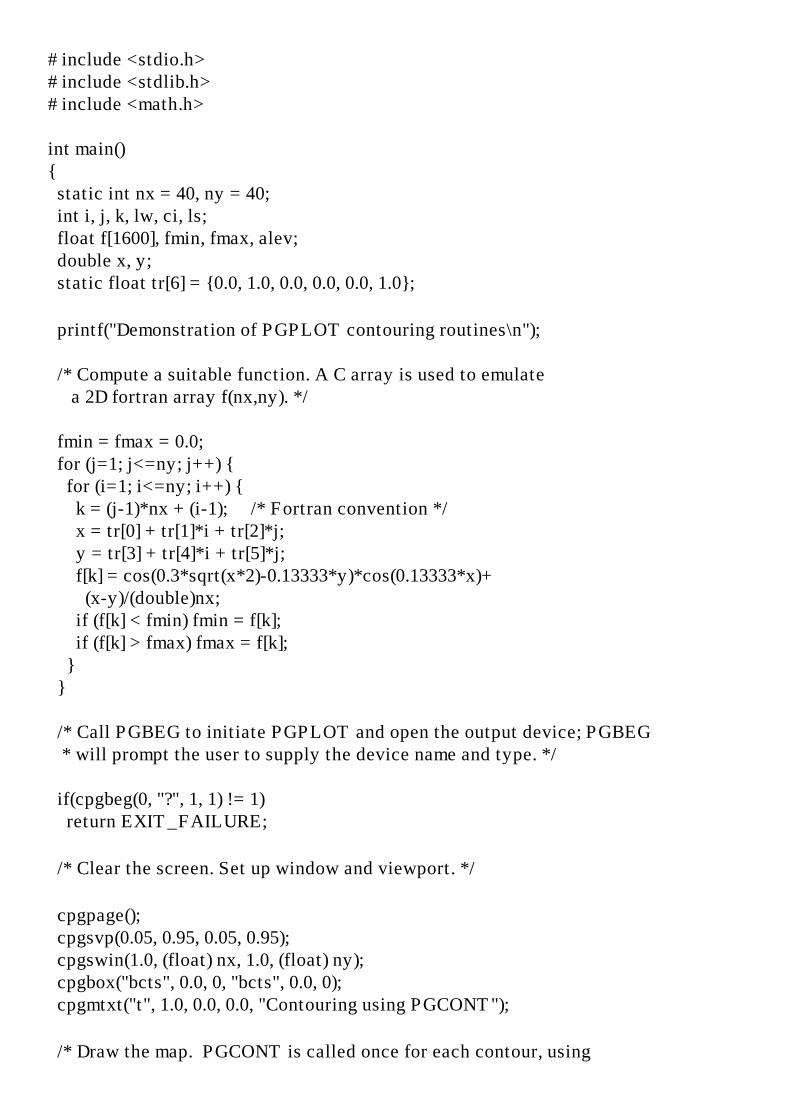
#include <stdio.h>#include <stdlib.h>#include <math.h>
int main(){ static int nx = 40, ny = 40; int i, j, k, lw, ci, ls; float f[1600], fmin, fmax, alev; double x, y; static float tr[6] = {0.0, 1.0, 0.0, 0.0, 0.0, 1.0};
printf("Demonstration of PGPLOT contouring routines\n");
/* Compute a suitable function. A C array is used to emulate a 2D fortran array f(nx,ny). */
fmin = fmax = 0.0; for (j=1; j<=ny; j++) { for (i=1; i<=ny; i++) { k = (j-1)*nx + (i-1); /* Fortran convention */ x = tr[0] + tr[1]*i + tr[2]*j; y = tr[3] + tr[4]*i + tr[5]*j; f[k] = cos(0.3*sqrt(x*2)-0.13333*y)*cos(0.13333*x)+ (x-y)/(double)nx; if (f[k] < fmin) fmin = f[k]; if (f[k] > fmax) fmax = f[k]; } }
/* Call PGBEG to initiate PGPLOT and open the output device; PGBEG * will prompt the user to supply the device name and type. */
if(cpgbeg(0, "?", 1, 1) != 1) return EXIT_FAILURE;
/* Clear the screen. Set up window and viewport. */
cpgpage(); cpgsvp(0.05, 0.95, 0.05, 0.95); cpgswin(1.0, (float) nx, 1.0, (float) ny); cpgbox("bcts", 0.0, 0, "bcts", 0.0, 0); cpgmtxt("t", 1.0, 0.0, 0.0, "Contouring using PGCONT");
/* Draw the map. PGCONT is called once for each contour, using

different line attributes to distinguish contour levels. */
cpgbbuf(); for (i=1; i<21; i++) { alev = fmin + i*(fmax-fmin)/20.0; lw = (i%5 == 0) ? 3 : 1; ci = (i < 10) ? 2 : 3; ls = (i < 10) ? 2 : 1; cpgslw(lw); cpgsci(ci); cpgsls(ls); cpgcont(f, nx, ny, 1, nx, 1, ny, &alev, -1, tr); } cpgslw(1); cpgsls(1); cpgsci(1); cpgebuf(); /* * Finally, call PGEND to terminate things properly. */ cpgend(); return EXIT_SUCCESS;}
Next: Appendix D
PGPLOT
Tim Pearson, California Institute of Technology, tjp戢stro.caltech.edu
Copyright © 1995-1998 California Institute of Technology
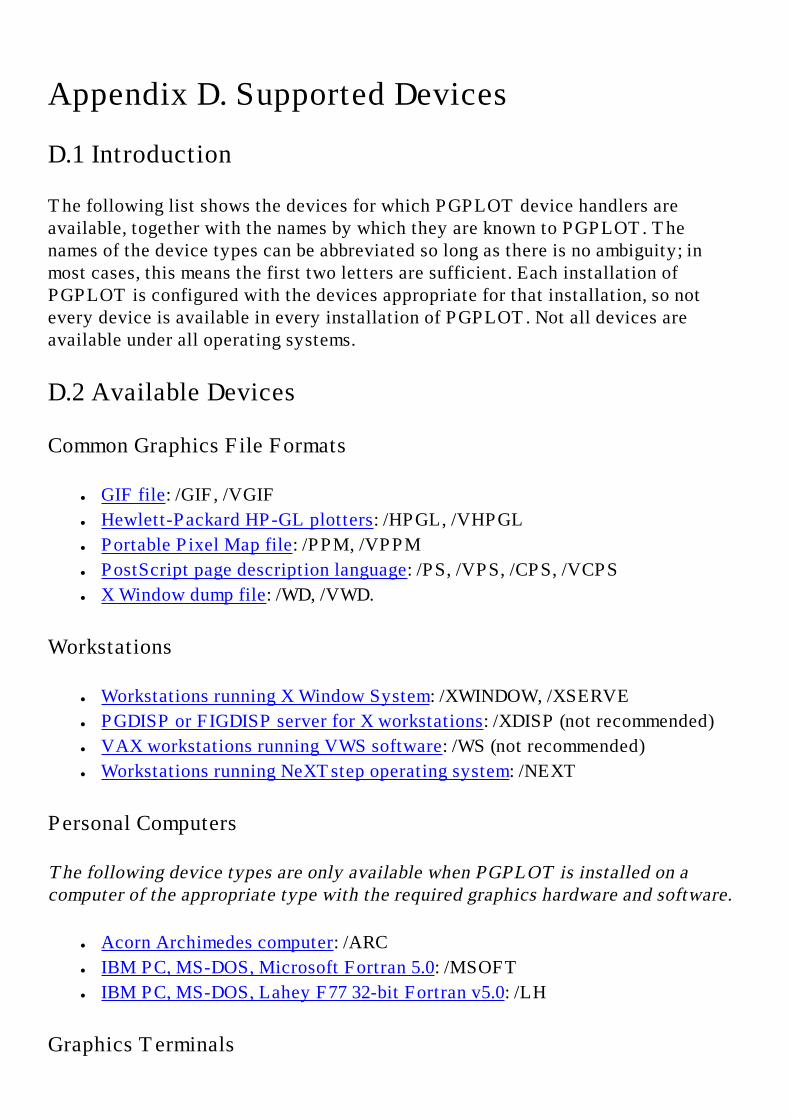
Appendix D. Supported Devices
D.1 Introduction
The following list shows the devices for which PGPLOT device handlers are available, together with the names by which they are known to PGPLOT. The names of the device types can be abbreviated so long as there is no ambiguity; in most cases, this means the first two letters are sufficient. Each installation of PGPLOT is configured with the devices appropriate for that installation, so not every device is available in every installation of PGPLOT. Not all devices are available under all operating systems.
D.2 Available Devices
Common Graphics File Formats
● GIF file: /GIF, /VGIF
● Hewlett-Packard HP-GL plotters: /HPGL, /VHPGL
● Portable Pixel Map file: /PPM, /VPPM
● PostScript page description language: /PS, /VPS, /CPS, /VCPS
● X Window dump file: /WD, /VWD.
Workstations
● Workstations running X Window System: /XWINDOW, /XSERVE
● PGDISP or FIGDISP server for X workstations: /XDISP (not recommended)
● VAX workstations running VWS software: /WS (not recommended)
● Workstations running NeXTstep operating system: /NEXT
Personal Computers
The following device types are only available when PGPLOT is installed on a computer of the appropriate type with the required graphics hardware and software.
● Acorn Archimedes computer: /ARC
● IBM PC, MS-DOS, Microsoft Fortran 5.0: /MSOFT
● IBM PC, MS-DOS, Lahey F77 32-bit Fortran v5.0: /LH
Graphics Terminals
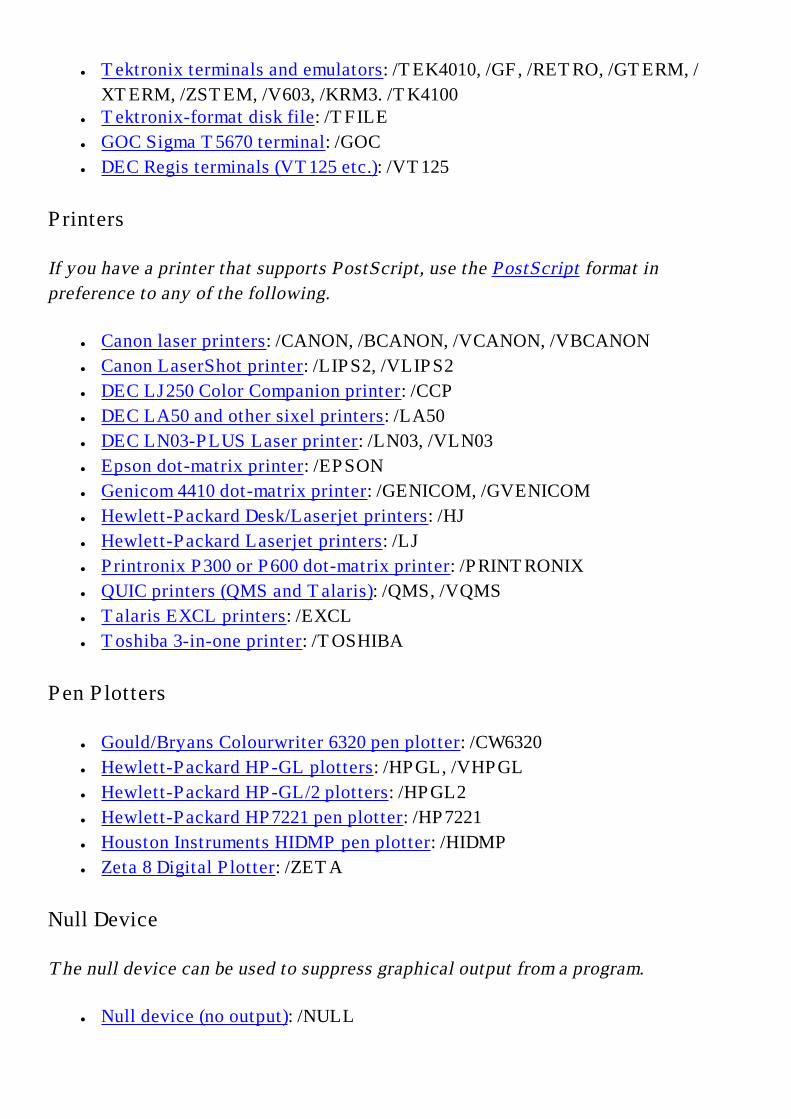
● Tektronix terminals and emulators: /TEK4010, /GF, /RETRO, /GTERM, /
XTERM, /ZSTEM, /V603, /KRM3. /TK4100 ● Tektronix-format disk file: /TFILE
● GOC Sigma T5670 terminal: /GOC
● DEC Regis terminals (VT125 etc.): /VT125
Printers
If you have a printer that supports PostScript, use the PostScript format in
preference to any of the following.
● Canon laser printers: /CANON, /BCANON, /VCANON, /VBCANON
● Canon LaserShot printer: /LIPS2, /VLIPS2
● DEC LJ250 Color Companion printer: /CCP
● DEC LA50 and other sixel printers: /LA50
● DEC LN03-PLUS Laser printer: /LN03, /VLN03
● Epson dot-matrix printer: /EPSON
● Genicom 4410 dot-matrix printer: /GENICOM, /GVENICOM
● Hewlett-Packard Desk/Laserjet printers: /HJ
● Hewlett-Packard Laserjet printers: /LJ
● Printronix P300 or P600 dot-matrix printer: /PRINTRONIX
● QUIC printers (QMS and Talaris): /QMS, /VQMS
● Talaris EXCL printers: /EXCL
● Toshiba 3-in-one printer: /TOSHIBA
Pen Plotters
● Gould/Bryans Colourwriter 6320 pen plotter: /CW6320
● Hewlett-Packard HP-GL plotters: /HPGL, /VHPGL
● Hewlett-Packard HP-GL/2 plotters: /HPGL2
● Hewlett-Packard HP7221 pen plotter: /HP7221
● Houston Instruments HIDMP pen plotter: /HIDMP
● Zeta 8 Digital Plotter: /ZETA
Null Device
The null device can be used to suppress graphical output from a program.
● Null device (no output): /NULL

Miscellaneous Devices
● PGPLOT metafile: /PGMF
● TeX PK Font Output files: /TX
● LaTeX picture environment: /LATEX
Special Applications
The following ``device'' drivers can be used to create PGPLOT graphics within an application that uses either the X-window Motif graphical user interface or a Tcl/Tk user interface. They cannot be used in other applications.
● Motif widget for X-window system: /XMOTIF
● Tcl/Tk widget for X-window system: /XTK
Next: Appendix E
PGPLOT
Tim Pearson, California Institute of Technology, tjp戢stro.caltech.edu
Copyright © 1995-1997 California Institute of Technology

Appendix E. Writing a Device Handler
E.1 Introduction
PGPLOT can be configured for a particular installation by adding or removing ``device handlers''. A device handler is a subroutine which handles all the device-specific aspects of graphical output for a particular device or class of devices.
To write a new device handler, it is simplest to start by modifying an existing one. This Appendix explains what the device handler must do, but it does not explain how to do it---which is, of course, very hardware-dependent.
E.2 The device dispatch routine GREXEC
All graphical output and input is handled by a ``device dispatch routine'' in PGPLOT, called GREXEC. Routine GREXEC is called whenever PGPLOT needs to determine device-specific information or perform graphical I/O. This routine in turn calls on the appropriate device handler. Reconfiguring PGPLOT involves modifying the GREXEC routine to use a different set of device handlers; no other changes to PGPLOT are needed.
Usually the Fortran code for GREXEC is created automatically from a list of selected device handlers during the installation of PGPLOT.
Table E.1: Example Device Dispatch Routine
C*GREXEC -- PGPLOT device handler dispatch routineC+ SUBROUTINE GREXEC(IDEV,IFUNC,RBUF,NBUF,CHR,LCHR) INTEGER IDEV, IFUNC, NBUF, LCHR REAL RBUF(*) CHARACTER*(*) CHRC--- INTEGER NDEV PARAMETER (NDEV=6) CHARACTER*10 MSGC--- GOTO(1,2,3,4,5,6) IDEV IF (IDEV.EQ.0) THEN RBUF(1) = NDEV NBUF = 1 ELSE
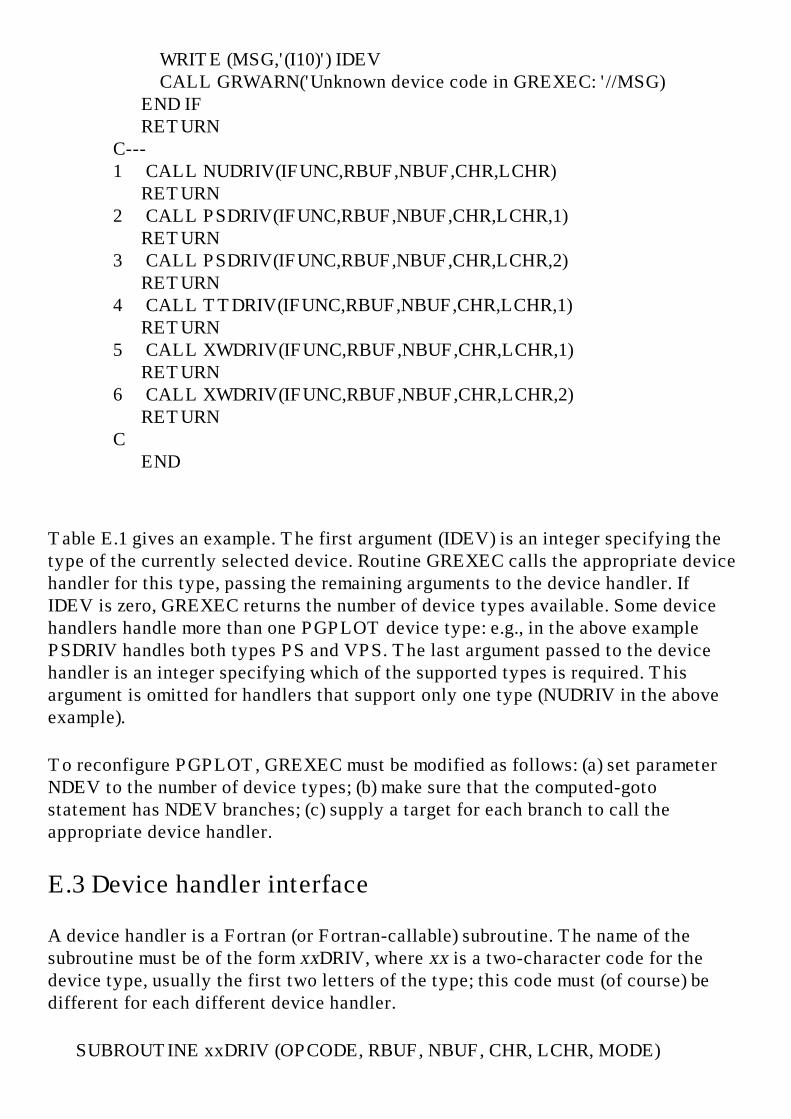
WRITE (MSG,'(I10)') IDEV CALL GRWARN('Unknown device code in GREXEC: '//MSG) END IF RETURNC---1 CALL NUDRIV(IFUNC,RBUF,NBUF,CHR,LCHR) RETURN2 CALL PSDRIV(IFUNC,RBUF,NBUF,CHR,LCHR,1) RETURN3 CALL PSDRIV(IFUNC,RBUF,NBUF,CHR,LCHR,2) RETURN4 CALL TTDRIV(IFUNC,RBUF,NBUF,CHR,LCHR,1) RETURN5 CALL XWDRIV(IFUNC,RBUF,NBUF,CHR,LCHR,1) RETURN6 CALL XWDRIV(IFUNC,RBUF,NBUF,CHR,LCHR,2) RETURNC END
Table E.1 gives an example. The first argument (IDEV) is an integer specifying the type of the currently selected device. Routine GREXEC calls the appropriate device handler for this type, passing the remaining arguments to the device handler. If IDEV is zero, GREXEC returns the number of device types available. Some device handlers handle more than one PGPLOT device type: e.g., in the above example PSDRIV handles both types PS and VPS. The last argument passed to the device handler is an integer specifying which of the supported types is required. This argument is omitted for handlers that support only one type (NUDRIV in the above example).
To reconfigure PGPLOT, GREXEC must be modified as follows: (a) set parameter NDEV to the number of device types; (b) make sure that the computed-goto statement has NDEV branches; (c) supply a target for each branch to call the appropriate device handler.
E.3 Device handler interface
A device handler is a Fortran (or Fortran-callable) subroutine. The name of the subroutine must be of the form xxDRIV, where xx is a two-character code for the device type, usually the first two letters of the type; this code must (of course) be different for each different device handler.
SUBROUTINE xxDRIV (OPCODE, RBUF, NBUF, CHR, LCHR, MODE)
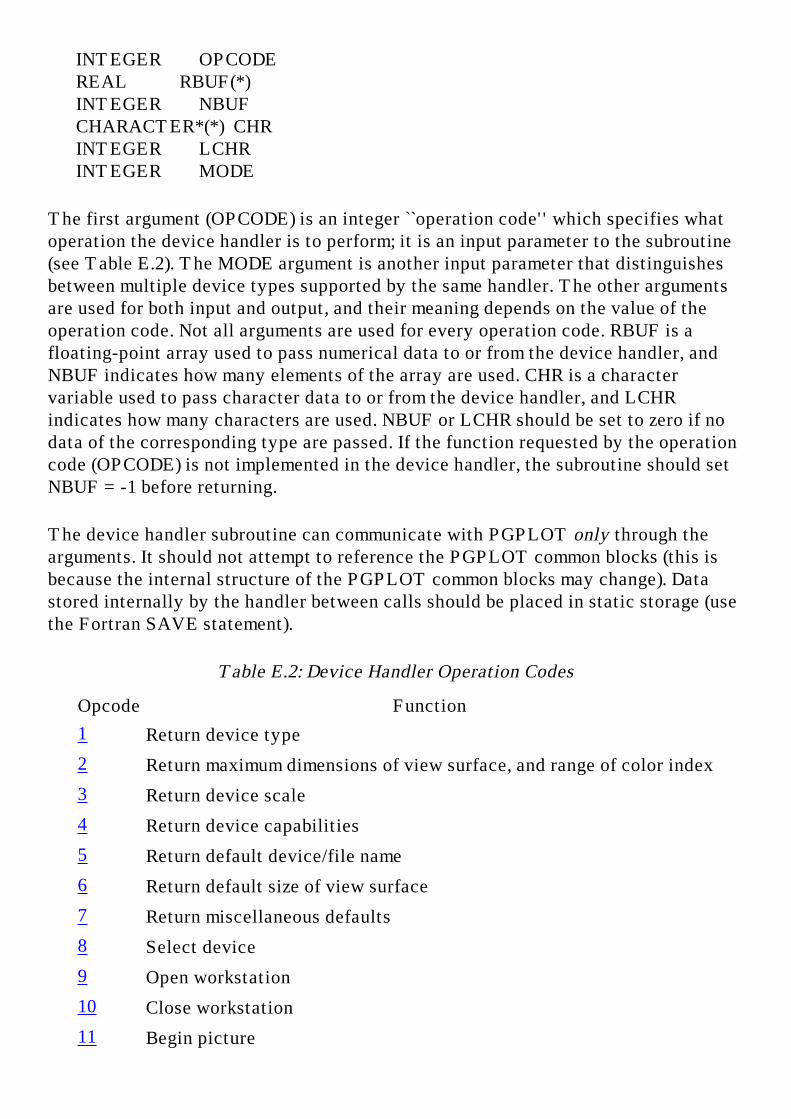
INTEGER OPCODE REAL RBUF(*) INTEGER NBUF CHARACTER*(*) CHR INTEGER LCHR INTEGER MODE
The first argument (OPCODE) is an integer ``operation code'' which specifies what operation the device handler is to perform; it is an input parameter to the subroutine (see Table E.2). The MODE argument is another input parameter that distinguishes between multiple device types supported by the same handler. The other arguments are used for both input and output, and their meaning depends on the value of the operation code. Not all arguments are used for every operation code. RBUF is a floating-point array used to pass numerical data to or from the device handler, and NBUF indicates how many elements of the array are used. CHR is a character variable used to pass character data to or from the device handler, and LCHR indicates how many characters are used. NBUF or LCHR should be set to zero if no data of the corresponding type are passed. If the function requested by the operation code (OPCODE) is not implemented in the device handler, the subroutine should set NBUF = -1 before returning.
The device handler subroutine can communicate with PGPLOT only through the arguments. It should not attempt to reference the PGPLOT common blocks (this is because the internal structure of the PGPLOT common blocks may change). Data stored internally by the handler between calls should be placed in static storage (use the Fortran SAVE statement).
Table E.2: Device Handler Operation Codes
Opcode Function
1 Return device type
2 Return maximum dimensions of view surface, and range of color index
3 Return device scale
4 Return device capabilities
5 Return default device/file name
6 Return default size of view surface
7 Return miscellaneous defaults
8 Select device
9 Open workstation
10 Close workstation
11 Begin picture

12 Draw line
13 Draw dot
14 End picture
15 Set color index
16 Flush buffer
17 Read cursor
18 Erase alpha screen
19 Set line style
20 Polygon fill
21 Set color representation
22 Set line width
23 Escape function
24 Rectangle fill
25 Set fill pattern
26 Line of pixels
27 Scaling information
28 Draw marker
29 Query color representation
30 Scroll rectangle
E.4 Handler state
PGPLOT will send commands to the device handler in a set sequence. Inquiry commands (opcodes 1--7 and 29) may be sent at any time, whether or not a device has been selected for output. The open workstation and close workstation commands are used to open and close a device. The begin picture and end picture commands are used to start and finish a ``frame'' (one page on a hardcopy device). Graphical output commands (opcodes 12--13, 16--20, and 22--28) are only used between begin picture and end picture. The set-color-representation command (opcode 21) can be used at any time that a device is open. Thus the sequence of commands for a plot consisting of two frames will be:
(query commands)open workstation (query commands, set color rep) begin picture (graphical output commands) end picture

(query commands, set color rep) begin picture (graphical output commands) end pictureclose workstation
Any violation of this sequence is due to a bug in PGPLOT. Device handlers should attempt to trap all errors, including I/O errors (e.g., insufficient disk space or insufficient memory), and issue a warning message rather than terminating execution of the program.
E.5 Summary of operations
OPCODE = 1, Return device type
This is an inquiry function; the handler returns the name by which the the user will refer to the device type, e.g., 'PS' for a PostScript device handler. This name must be different for each mode of each device handler installed in PGPLOT, and should preferably be unique in the first two or three characters. A descriptive character string (displayed by routine PGLDEV) should be included in parentheses after the name, e.g., 'PS (PostScript file, landscape orientation)'.
Parameters returned by handler:
● CHR(:LCHR): the device type supported by the handler in the specified mode.
OPCODE = 2, Return maximum dimensions of view surface, and range of color index
This is an inquiry function; the handler returns the maximum dimensions of the plot surface, and the range of color indices available. These will usually be the same as the default dimensions, but if it is possible to make a larger image, the maximum dimensions may be larger. If there is no set upper limit to a dimension, the corresponding maximum should be set to -1. All dimensions are in device coordinates. All devices should support color indices 0 and 1; color and gray-scale devices will allow color indices >1 up to a device-dependent maximum value (which should not exceed 255). Color index 0 is the background color and is used to erase; if it is not possible to erase by overwriting in the background color, then requests to write in color index 0 should be ignored.

Parameters returned by handler:
● RBUF(1): Minimum physical x value (set to zero). ● RBUF(2): Maximum physical x value (a value of -1 indicates no effective
maximum). ● RBUF(3): Minimum physical y value (set to zero). ● RBUF(4): Maximum physical y value (a value of -1 indicates no effective
maximum). ● RBUF(5): Minimum allowed color index (usually 0). ● RBUF(6): Maximum allowed color index (in range 1--255).
OPCODE = 3, Return device scale
This is an inquiry function; the handler returns the device scale in device coordinate units per inch (1 inch = 25.4 mm). Usually, the units of the device coordinates are pixels, so this also gives the physical resolution in pixels per inch. For hardcopy devices, the values should be as accurate as possible, to ensure that an image has the correct scale. For video display terminals and other devices where the scale is variable, nominal values should be returned.
Parameters returned by handler:
● RBUF(1): x scale in device coordinates per inch. ● RBUF(2): y scale in device coordinates per inch. ● RBUF(3): ``pen diameter'' in device coordinates (i.e., the width of a hardware
line); this value is used by PGPLOT when emulating thick lines and polygon fill (usually 1).
OPCODE = 4, Return device capabilities
This is an inquiry function which is used to inform PGPLOT of the device's capabilities. If the device lacks a capability in hardware, PGPLOT will try to emulate it.
Parameters returned by handler:
● LCHR : number of characters defined in CHR. Should be at least 10. Additional characters are assumed to be `N' if they are not supplied by the driver.

● CHR(1:1) = `H' if the device is a hardcopy device, `I' if it is an interactive device. On an interactive device, the image is visible as it is being drawn, while on a hardcopy device it cannot be viewed until the workstation is closed.
● CHR(2:2) = `C' if a cursor is available, `X' if a cursor is available and opcode 27 is accepted by the handler, `N' if there is no cursor. PGPLOT cannot emulate a cursor if none is available.
● CHR(3:3) = `D' if the hardware can draw dashed lines, `N' if it cannot. PGPLOT emulates dashed lines by drawing line segments. Software emulation is usually superior to hardware dashed lines, and not much slower, so CHR(3:3) = `N' is recommended.
● CHR(4:4) = `A' if the hardware can fill arbitrary polygons with solid color, `N' if it cannot. PGPLOT emulates polygon fill by drawing horizontal or vertical lines spaced by the pen diameter (see OPCODE = 3).
● CHR(5:5) = `T' if the hardware can draw lines of variable width, `N' if it cannot. PGPLOT emulates thick lines by drawing multiple strokes. Note that thick lines are supposed to have rounded ends, as if they had been drawn by a circular nib of the specified diameter.
● CHR(6:6) = `R' if the hardware can fill rectangles with solid color, `N' if it cannot. If this feature is not available, PGPLOT will treat the rectangle as an arbitrary polygon. In this context, a `rectangle' is assumed to have its edges parallel to the device-coordinate axes.
● CHR(7:7) = `P' if the handler understands the pixel primitives, 'Q' if it understands the image primitives (opcode 26), or `N' otherwise (see the description of opcode 26).
● CHR(8:8) = `V' if PGPLOT should issue an extra prompt to the user before closing the device (in PGCLOS), `N' otherwise. Use `V' for devices where the PGPLOT window is deleted from the screen when the device is closed.
● CHR(9:9) = `Y' if the handler accepts color representation queries (opcode 29), `N' if it does not.
● CHR(10:10) = `M' if the device handler accepts opcode 28 to draw graph markers; `N' otherwise.
● CHR(11:11) = `S' if the device handler accepts opcode 30 to scroll the underlying pixel map; `N' otherwise.
OPCODE = 5, Return default device/file name
This is an inquiry routine. The device handler returns the device or file name to be used if the PGPLOT device specification does not include one. (On VMS, the default file name may also be used to fill in missing fields of the supplied file name, e.g., disk, directory, and file type.)
Parameters returned by handler:

● CHR(:LCHR): default device/file name.
OPCODE = 6, Return default size of view surface
This is an inquiry function; the handler returns the default dimensions of the plot surface in device coordinates. At present, PGPLOT assumes that the device coordinates of the bottom left corner are (0,0). Note: on some devices the default size can change during PGPLOT execution; e.g., on windowing workstations the window manager may allow the user to change the size of the PGPLOT window. PGPLOT uses this opcode to determine the current the default size before starting each new page.
Parameters returned by handler:
● RBUF(1): default x-coordinate of bottom left corner (must be zero). ● RBUF(2): default x-coordinate of top right corner. ● RBUF(3): default y-coordinate of bottom left corner (must be zero). ● RBUF(4): default y-coordinate of top right corner.
OPCODE = 7, Return miscellaneous defaults
This is an inquiry routine. The handler returns a scale-factor to be used for the ``obsolete character set'' used by old GRPCKG routines but not by PGPLOT.
Parameters returned by handler:
● RBUF(1): character scale factor (integer, > 0).
OPCODE = 8, Select device
A PGPLOT device handler may handle more than one open device at once. All graphical I/O operations apply to the ``active'' device. This opcode is used to select a new active device; note that opcode 9 (open workstation) also changes the active device.
Parameters passed to handler:

● RBUF(1): plot ID. This is not needed by the handler, and can be ignored. ● RBUF(2): identification number of selected device (as returned by open
workstation).
OPCODE = 9, Open workstation
Allocate an I/O channel to the requested device and open the device. Any hardware resets that need to be done once for a plot session (which could consist of several frames) should be done here. Allocate buffer, if its size is fixed for the device. No visible I/O should be performed on an interactive device: e.g., the screen should not be cleared; this should be deferred until the begin picture call.
Parameters passed to handler:
● RBUF(3): if this is not 0.0, the device specification included the /APPEND flag. If this flag is specified, the device handler should suppress any initial screen erase so that the new image is superimposed on any previously displayed image. The device handler may ignore this if it is inappropriate (e.g., for a hardcopy device).
● CHR(:LCHR): the file/device to be opened. This may be a physical device name or the name of a disk file.
Parameters returned by handler:
● RBUF(1): identification number for the opened device; PGPLOT will use this number in subsequent select device calls for this device (see OPCODE = 8).
● RBUF(2): error flag; 1.0 indicates that the workstation was opened successfully; any other number indicates an error.
OPCODE = 10, Close workstation
Close the device opened by the open workstation command, and deallocate any resources allocated for the device (e.g., memory, I/O channels).
OPCODE = 11, Begin picture
Prepare the workstation for plotting. This command has two arguments which specify a size for the view surface overriding the default size; if the device handler

is unable to change the size of the view surface, it may ignore these arguments. On interactive devices, erase the screen. Note: this command has no way to return an error to the user; if an error occurs (e.g., insufficient memory for a frame buffer), the handler should issue an error message (with routine GRWARN) and ignore subsequent output commands, rather than terminating execution of the program.
Parameters passed to handler:
● RBUF(1): maximum x coordinate. ● RBUF(2): maximum y coordinate.
OPCODE = 12, Draw line
Draw a straight line from device coordinates (x1,y1) to (x2,y2) using the current line attributes (color index, line style, and line width). The coordinates are floating point, and may need to be rounded to the nearest integer before they are passed to the hardware; they are in the range (0,0) to the maxima specified with begin picture.
Parameters passed to handler:
● RBUF(1): x1. ● RBUF(2): y1. ● RBUF(3): x2. ● RBUF(4): y2.
OPCODE = 13, Draw dot
Draw a dot at device coordinates (x,y) using the current line attributes (color index and line width). The result should be an approximation to a filled circle of diameter equal to the line width, or a dot of minimum size if line width is 0. The coordinates are floating point, and may need to be rounded to the nearest integer before they are passed to the hardware.
Parameters passed to handler:
● RBUF(1): x. ● RBUF(2): y.

OPCODE = 14, End picture
Terminate the current frame. On hardcopy devices always advance the paper. On interactive devices, clear the screen only if requested. Deallocate buffers that were created by begin picture (OPCODE = 11).
Parameters passed to handler:
● RBUF(1): if not 0.0, clear screen.
OPCODE = 15, Set color index
Set the color index for subsequent plotting. The default color index is 1.
Parameters passed to handler:
● RBUF(1): color index; in range defined by OPCODE = 2.
OPCODE = 16, Flush buffer
If the handler is buffering output to an interactive device, it should flush its buffers to ensure that the displayed image is up to date. Hardcopy devices can ignore this opcode.
OPCODE = 17, Read cursor
This function is not used if OPCODE = 4 indicates that the device has no cursor.
The handler should make the cursor visible at position (x,y), allow the user to move the cursor, and wait for a key stroke. It should then return the new cursor (x,y) position and the character (key stroke) typed. (If it is not possible to make the cursor visible at a particular position, the handler may ignore the requested (x,y) coordinates.) On a device with a mouse or similar device, clicking mouse-button 1 should return character `A', mouse-button 2 should return `D', and mouse-button 3 should return `X'.
If the hardware permits, the handler should interpret the ``mode'' as specified in the description of routine PGBAND. The exact appearance of the dynamic ``rubber

band'' lines may be hardware specific; if possible, they should be drawn with the current color index, but they must not erase previously drawn graphics. Handlers that cannot draw the ``rubber band'' lines should treat all modes as mode = 0.
Parameters passed to handler:
● RBUF(1): initial x position of cursor. ● RBUF(2): initial y position of cursor. ● RBUF(3): x position of reference point. ● RBUF(4): y position of reference point. ● RBUF(5): mode = 0 (no feedback), 1 (rubber band), 2 (rubber rectangle), 3
(vertical range), 4 (horizontal range). 5 (horizontal line), 6 (vertical line), 7 (cross-hair).
Parameters returned by handler:
● RBUF(1): x position of cursor. ● RBUF(2): y position of cursor. ● CHR(1:1): character typed by user.
OPCODE = 18, Erase alpha screen
If the graphics device is a terminal that displays both graphics and text on the same screen, clear the text screen, leaving graphics unchanged. All other devices should ignore this opcode.
OPCODE = 19, Set line style
This opcode is not used if OPCODE = 4 indicates that the device does not support hardware dashing; PGPLOT will use software-generated dashed lines.
Parameters passed to handler:
● RBUF(1): requested line style (integer 1--5).
OPCODE = 20, Polygon fill
This function is not used if OPCODE = 4 indicates that the device does not support

hardware polygon fill. The polygon may be arbitrarily complex (concave or re-entrant); if the hardware cannot cope with this, the handler should set the OPCODE = 4 response to disable hardware fill. If hardware fill is enabled, the handler should respond to this function by filling the polygon with the current color index. To draw an N-sided polygon, PGPLOT uses this opcode N+1 times.
Parameters passed to handler on first call:
● RBUF(1): number of points N in polygon.
Parameters passed to handler on next N calls:
● RBUF(1): x value. ● RBUF(2): y value.
OPCODE = 21, Set color representation
Assign the specified (R,G,B) color, or the best available approximation, to the specified color index. If colors cannot be changed dynamically, ignore the request.
Parameters passed to handler:
● RBUF(1): color index (integer, in range defined by OPCODE = 2). ● RBUF(2): red component (0.0--1.0). ● RBUF(3): green component (0.0--1.0). ● RBUF(4): blue component (0.0--1.0).
OPCODE = 22, Set line width
This function is not used if OPCODE = 4 indicates that the device does not support hardware thick lines. Subsequent lines and dots should be drawn with the requested width, or the closest available approximation. The units of line-width are 0.005 inches. A requested line-width of zero should give the narrowest line available on the device (``hair line'').
Parameters passed to handler:
● RBUF(1): requested line width, in units of 0.005 inch.

OPCODE = 23, Escape function
This function allows an arbitrary character string to be sent to the device handler. The interpretation is up to the handler; usually, the string will be sent directly to the device or ignored. Use of this function should be avoided.
Parameters passed to handler:
● CHR(:LCHR): character string.
OPCODE = 24, Rectangle fill
This function is not used if OPCODE = 4 indicates that the device does not support hardware rectangle fill.
Parameters passed to handler:
● RBUF(1), RBUF(2): x,y coordinates of lower left corner of rectangle. ● RBUF(3), RBUF(4): x,y coordinates of upper right corner of rectangle.
OPCODE = 25, Set fill pattern
This function is not yet implemented.
OPCODE = 26, Line of pixels or Image
This operation is used for gray-scale and color imaging (e.g., routine PGGRAY). It is used in two different ways, depending whether OPCODE=4 reports CHR(7:7) = 'P' or 'Q'.
Case P
This function is used to write a horizontal line of pixels on the device screen with specified color indices; it should be more efficient to do this with one device handler call rather than separate calls for each pixel. If the device handler implements this operation, it is important that the device coordinates should be true pixel numbers.
Parameters passed to handler:
● RBUF(1), RBUF(2): x,y coordinates of the first pixel to be written. These should be integer pixel numbers in the device coordinate system (passed as REAL numbers).
● RBUF(3),...RBUF(NBUF): color indices for n pixels to be filled in, starting at (x,y) and ending at (x+n-1,y). The values should be valid integer color indices for the device (passed as REAL numbers). The number of pixels is specified by the argument NBUF: n = NBUF - 2.
Case Q
This case is used for devices like PostScript where PGPLOT cannot address individual device pixels; the handler, or the device, must map the image array onto hardware pixels, taking care of clipping. In this case, the first call specifies the parameters of the image, and subsequent calls pass color indices of image pixels, and a final call indicates the end of the image.
Parameters passed to handler on first call:
● RBUF(1): 0.0 (indicates start of image). ● RBUF(2,3): dimension of the image (image pixels in x and y). ● RBUF(4),...RBUF(7): the current clipping rectangle, in device coordinates. ● RBUF(8),...RBUF(13): a matrix used to transform image coordinates to device
coordinates.
Parameters passed to handler on first call:
● RBUF(1): number n of pixels in this call (> 0). ● RBUF(2),...RBUF(n+1): color indices for n pixels.
Parameters passed to handler on last call:
● RBUF(1): -1.0.
OPCODE = 27, Scaling information
This function is only used if OPCODE = 4 indicates a cursor of type X. It is used to tell the device handler what the user's (world) coordinate system is. The handler may ignore the information, or it may use it to generate a read-out of the cursor position in the world coordinate system.
Parameters passed to handler:
● RBUF(1)...RBUF(4): should be interpreted as follows: (xd,yd) are device coordinates, as used by the handler, (xw,yw) are user's world coordinates: xw = [xd - RBUF(1)]/RBUF(2), yw = [yd - RBUF(3)]/RBUF(4). The device handler may (but is not required to) display the current cursor location, in world coordinates. The display can be continuous or only while the PGPLOT cursor is active (during execution of opcode 17). Until opcode 27 is received, the handler should assume that (xw,yw)=(xd,yd).
OPCODE = 28, Draw marker
This function is only used if OPCODE = 4 indicates that the device handler can draw graph markers. If it is to be used, the device handler (or hardware) must know how to draw each of the markers numbered 0 to 31 (see Figure 4.1).
Parameters passed to handler:
● RBUF(1): the number of the marker symbol to be drawn (integer, 0--31). ● RBUF(2), RBUF(3): the x,y coordinates of the center of the marker (device
coordinates). ● RBUF(4): scale factor (number of device units per unit of ``marker coordinate
space''). The shapes of the marker symbols are defined in a coordinate system in which the radius of typical symbols is 10 units or less; for more information, see the Hershey definitions of the markers (Appendix B).
OPCODE = 29, Query color representation
This function ay be called at any time after open workstation (9) and before close workstation (10). It will not be called if the handler does not report itself as having this capability. The handler should attempt to return the actual color representation in use on the device, if it is possible that this is different from the values requested. Otherwise it should return the values requested in the last call with opcode 21 (set color representation) for this color index. (Re-calling opcode 21 with the values returned by opcode 29 should not change the actual color representation!) If the handler does not have this capability, PGQCR will return R=G=B=0.0 for color index 0 and R=G=B=1.0 for all other color indices.
Parameters passed to handler:

● NBUF = 1 ● RBUF(1) = color index to query (integer, passed as real), in the device range
reported by opcode 2.
Parameters returned by handler:
● NBUF = 4 ● RBUF(1) = unchanged from input, ● RBUF(2) = red component [real, 0.0--1.0], ● RBUF(3) = green component [real, 0.0--1.0], ● RBUF(4) = blue component [real, 0.0--1.0].
OPCODE = 30, Scroll rectangle
This function is not used if OPCODE = 4 indicates that the device does not support scrolling. If it is to be used, then the device handler should be capable of scrolling a rectangular region of the display-surface, both horizontally and vertically, by an integral number of device coordinates. A horizontal scroll of positive dx device pixels is defined to mean that all but the rightmost dx pixels of the rectangle should be copied dx pixels to the right of their original positions. The vacated dx pixels at the left edge of the rectangle are to be filled with the background color. Vertical scrolling is defined similarly.
Parameters passed to handler:
● NBUF = 6 ● RBUF(1), RBUF(2): x,y coordinates of lower left corner of rectangle. ● RBUF(3), RBUF(4): x,y coordinates of upper right corner of rectangle. ● RBUF(5), RBUF(6): dx,dy coordinate offsets of the scrolled rectangle.
All of these parameters are intended to be integral, and should be rounded to the nearest integer. Note that RBUF(5) and RBUF(6) are allowed to exceed the lengths of the corresponding sides of the scrolling region. In such cases the region should be completely filled with the background color.
Next: Appendix F
PGPLOT
Tim Pearson, California Institute of Technology, tjp戢stro.caltech.edu
Copyright © 1995-1996 California Institute of Technology
Introduction
These instructions are for Version 5.2.* of PGPLOT.
To install PGPLOT, you need to perform the following steps. These steps are described more fully below for each operating system.
Read the release notes (file ver520.txt) to see what is new in this version.
1. Copy the distribution file by anonymous ftp from Caltech. This is a gzipped tar archive: ftp://ftp.astro.caltech.edu/pub/pgplot/pgplot5.2.tar.gz.
2. Unpack the distribution file to create the ``PGPLOT distribution'' directory tree. This is identical for all implementations of PGPLOT and can be placed on any disk that is visible on the target system, including read-only network-mounted disks.
3. Create a writable directory in which the PGPLOT library and associated files will be created. One such directory is needed for each different operating system and compiler combination (``target system'') that you wish to support. This should not be the same directory as the directory containing the source code.
4. Configure PGPLOT by selecting device drivers from the available list.5. Execute the supplied scripts and makefiles to create the library and
demonstration programs.6. Install the optional C binding for PGPLOT, which provides a convenient way
to call PGPLOT subroutines from a program written in C or C++. This requires an ANSI C compiler (that understands function prototypes) and is not available on all systems.
7. Run the demonstration programs on your selected devices and verify that they run satisfactorily.
8. Install the optional documentation files.
You will need the following software, which is not distributed with PGPLOT:
● A Fortran-77 compiler for your computer system.
Consult your operating system vendor to see what Fortran-77 compilers are available for your system. A useful index of Fortran compilers can be found at The Fortran Market web site (http://www.fortran.com/fortran/compilers.html). The following are widely used;
❍ GNU Fortran compiler (g77): ftp://prep.ai.mit.edu/pub/gnu/ (g77-*).
❍ f2c Fortran-77 to C translator: ftp://ftp.netlib.org/f2c/.
I prefer g77, which works well on the systems I have tried. f2c is unable to compile many of

the PGPLOT device drivers that use non-standard extensions to Fortran-77.
● An ANSI C compiler for your computer system.● Utilities for retrieving and unpacking the distribution file: ftp (or a Web
browser), tar, and gunzip.● To use the PGPLOT X-window device drivers: the X Window System for
your computer, including the standard X header files (*.h) and the Xlib library.● To use the PGPLOT Motif (X-window) widget driver: the X Window System,
the Xm and Xt libraries, and associated header files.● To use the PGPLOT Tcl/Tk (X-window) widget driver: the X Window
System, the tk and tcl libraries, and associated header files.
Detailed installation instructions are available for the following operating systems:
● UNIX (all varieties)
● For LINUX systems, see the note about precompiled binaries.
● VMS [OpenVMS VAX or OpenVMS Alpha] (Digital Equipment Corp.)
● Windows 95/98/NT with Absoft Pro Fortran (Absoft Corp.)
● Windows 95/NT with Digital/Compaq Visual Fortran (Compaq Corp.)
● Windows 95/NT with PowerStation Fortran (Microsoft Corp.)
● Windows 95/NT with GNU-Win32 utilities
● For Acorn (RISCOS) machines, see the Fortran Friends web page. A zip file of
the RISCOS version can be downloaded from http://www.argonet.co.uk/users/
fortran/Demos/PGplot.zip.
For Windows 95/98/NT/2000 etc., I also recommend using a version of PGPLOT that includes a driver based on the GrWin graphics library. This can be used with many different compilers. See:
● GrWin Graphics Library by Tamaribuchi, Tsuguhiro.
● PGPLOT for Win32 with Microsoft VC++ v6.0 and Digital Visual Fortran 6.0
by Karl Glazebrook and Roberto Abraham.
This version has not yet been ported to MS-DOS, OS/2, or MacOS. For notes about earlier attempts to port PGPLOT to these operating systems, see the files called aaaread.me in the directories pgplot/sys_dos, pgplot/sys_msdos, pgplot/sys_salford, and pgplot/sys_mac in the tar file. I appreciate feedback from users.
PGPLOT Tim Pearson, California Institute of Technology, tjp·astro.caltech.edu
Copyright © 1995-1998 California Institute of Technology

Appendix G. Porting PGPLOT
G.1 General Notes
The PGPLOT library consists of the following routines:
1. The ``standard'' routines pgplot/src/pg*.f and pgplot/src/gr*.f. All of these routines should be compiled and put in the object-module library, although the ``obsolete'' routines may be omitted (they are not used by current PGPLOT programs and will not be included in future versions of PGPLOT). The obsolete routines are: grchar, grchr0, grdat2, grgtc0, grinqfont, grinqli, grinqpen, grlinr, grmark, grmovr, grsetfont, grsetli, grsetpen, grtran, grvect, pgsetc, pgsize. All routines in the pgplot/src directory are standard Fortran-77 with the following exceptions:
❍ Several routines use the non-standard INCLUDE statement; if your compiler does not accept this, you need to replace the INCLUDE statement with the contents of the named file (pgplot.inc or grpckg1.inc as appropriate).
❍ Some routines have names longer than 6 characters, the maximum allowed by the Fortran-77 standard: these routines can be omitted: all have shorter aliases that can be used in preference (e.g., PGPAGE instead of PGADVANCE).
❍ One routine, GRSYXD, uses a non-standard INTEGER*2 statement; you can replace this with INTEGER, but if you do so you must make the corresponding change in GRSY00 and PGPACK (see below).
❍ Routine GRCLPL uses function IAND(I,J) for bitwise logical and of two integers; most compilers recognize this as an intrinsic function and compile it inline, but if yours does not, you will need to supply this as an external function.
2. The system-dependent routines. Versions of these routines that work for many UNIX systems are provided in directory pgplot/sys, but for other systems these will need to be written. Some of the routines are used only by certain device drivers and will not be needed if you do not use these drivers.
❍ GRDATE -- get date and time as character string ❍ GRFILEIO -- routines GROFIL, GRCFIL, GRWFIL, GRWFCH for
binary file I/O ❍ GRFLUN -- free a Fortran logical unit number ❍ GRFMEM -- free memory ❍ GRGCOM -- read with prompt from user's terminal ❍ GRGENV -- get value of PGPLOT environment parameter ❍ GRGLUN -- get a Fortran logical unit number ❍ GRGMEM -- allocate memory

❍ GRGMSG -- print system message ❍ GRIBF1 -- fill buffer with a specified character ❍ GROPTX -- open input/output text file ❍ GRSY00 -- initialize font definition ❍ GRTERMIO -- routines GROTER, GRCTER, GRWTER, GRPTER,
GRRTER for I/O to terminals ❍ GRTRML -- get name of user's terminal ❍ GRTTER -- test whether device is user's terminal ❍ GRUSER -- get user name
3. The device-dispatch routine, grexec.f. This routine includes calls to all the selected device drivers. It is the only routine that needs to be modified to configure PGPLOT for a particular installation. It is usally generated automatically from drivers.list. For more information about this routine, see Appendix E.
4. The device drivers. Most device drivers are included in single files in the pgplot/drivers directory, with file name XXdriv.f or XXdriv.c. Some C drivers require additional .c or .h files. The drivers you wish to include in PGPLOT should be compiled and added to the object library. Many of the device drivers are written in portable, standard Fortran-77, but others cannot be written portably and either use Fortran-77 with extensions (such as BYTE and %VAL) or C. Some of the older drivers are sloppily written and could be made more portable. For driver written in C, it is necessary to pay careful attention to the system-dependent conventions for calling C subroutines from Fortran programs.
G.2 Porting to UNIX systems
Background
While no two UNIX systems are identical, the overall similarities allow for a single installation procedure. The procedure, embodied in pgplot/makemake, is implemented as a Bourne shell script whose job is to create makefiles specific to specific systems. The design goals of the script were:
1. To provide a uniform installation procedure for as many systems as possible. 2. To support PGPLOT compilation in directories other than the distribution
directory. If the disk containing the source code distribution is cross-mounted over a number of different UNIX systems, this allows one copy of the source code to be used to compile PGPLOT on each of those systems. It also allows the source-code directory to be placed on a read-only disk partition or CD-ROM.
3. To allow more than one compiler combination on systems that support

multiple compilers. Separate configuration files are provided for each compiler combination.
4. To avoid code duplication of system-specific routines where possible. The script allows one to selectively override generic routines with system specific versions.
5. To make the script behave as told by the user, rather than have it try to automatically determine its configuration from the system that it is run upon. This enables one to make makefiles for many systems without actually having to log in to those systems.
How to port PGPLOT to a new UNIX system
Create a system directory
The first thing to do when porting to a new system is to create a system directory for the port. This is where system-specific source-code and system attributes, will be placed. If the generic name for your system is say xxx, then the system directory must be called pgplot/sys_xxx. The xxx suffix is the name used by users to to specify a system type to the makemake script.
Create a configuration file
The next thing to do is to create a configuration file within the new system directory. This is a Bourne shell script containing assignments to the shell variables that determine how makemake will configure a makefile for your system.
Configuration files are distinguished from other files by a .conf file name extension. If you intend to support more than one FORTRAN and/or C compiler, then one configuration file will be needed per compiler combination. By convention, configuration files are named as a_b.conf, where a is the name of the FORTRAN compiler and b is the name of the C compiler.
The first line must be a short Bourne shell comment that describes how the configuration differs from other configuration files in the system directory. In most configuration files, the comment just ellaborates on which FORTRAN and C compilers are being configured. The comment is displayed alongside the configuration name when makemake users fail to specify a configuration name.
The easiest way to create a new configuration file is to copy one from another sys_xxx directory, rename it and then modify the shell variable assignments to suite your system. Note that within these scripts no spaces are tolerated around the = operator, and that you should enclose the assignment string within double quotes.
Configuration file variables

Some of the supported variables are obligatory, while others are optional. The required variables and their meanings are:
XINCL The argument used to tell the C compiler where the X11/ include directory can be found. If your machine doesn't have X-windows, assign the empty string "". e.g.,
XINCL="" XINCL="-I/usr/local/include" XINCL="-I/usr/openwin/include"
FCOMPL The command used to invoke the FORTRAN compiler. e.g.,
FCOMPL="f77" FCOMPL="fort77" FCOMPL="fortran" FCOMPL="frt" FCOMPL="gf77" FCOMPL="xlf"
FFLAGC Any FORTRAN compiler flags required for compiling and linking the PGPLOT library. Note that this should not include the "-c" or "-o" options, which are automatically added, where needed, by the makemake script. Examples of possible flags to include, are optimization level flags and flags pertinent to creating shared libraries (where possible). This is usually an option to generate position-independent code (e.g., "+z", "-fpic", "-K PIC"). An option to check for undeclared variables (e.g., "-u") may be specified, but is not required. An option to use static rather than automatic storage (e.g., "-static") is not required but may be used: PGPLOT should work correctly with either static or automatic storage. e.g.,
FFLAGC="-u -O" FFLAGC="-u -PIC -O" FFLAGC="-u -pic -O" FFLAGC="-u" FFLAGC='-Wf"-o novector -i64"'
FFLAGD In most cases this should be the same as FFLAGC. It is used instead of FFLAGC when compiling and linking the PGPLOT demo programs. The main potential difference has to do with the fact that many of the demo programs

exploit the '\' character to introduce special plot symbols within PGPLOT text. Unfortunately many compilers treat this as an escape character. To avoid this, FFLAGD should include a flag to tell the compiler to turn off special treatment of this character. Options for shared libraries (position-independent code) are not required. e.g.,
FFLAGD="" FFLAGD="-O0" FFLAGD="-assume backslash" FFLAGD="-u -!bs" FFLAGD="-u -O" FFLAGD="-u -backslash -O0" FFLAGD="-u -qnoescape" FFLAGD="-xl -u -O"
CCOMPL The command used to invoke the chosen C compiler on your system. If you intend to use the C wrapper library cpgplot, then this should be an ANSI-C
compiler. Otherwise a pre-ANSI K&R C compiler will be sufficient. e.g.,
CCOMPL="/usr/ucb/cc" CCOMPL="c89" CCOMPL="cc" CCOMPL="gcc"
CFLAGC Any C compiler flags that are needed to compile PGPLOT. Note that this should not include the "-c" or "-o" options, which are automatically added, where needed, by the makemake script. Examples of possible flags to include, are optimization level flags and flags pertinent to creating shared libraries (where possible; the option usually required is the one that generates "position-independent code"). Also, if your system exports FORTRAN symbols to the linker postfixed with an underscore then you should include the -DPG_PPU flag. e.g.,
CFLAGC="" CFLAGC="+z -O -D_HPUX_SOURCE" CFLAGC="-DPG_PPU -pic -O"
LIBS This should specify the loader flags required to cite any external libraries that are required when linking any of the demo and server programs. In most cases this is just the X-windows library, cited as "-Ldirectory_name -lX11" where directory_name is the name of the directory in which the library resides. e.g.,

LIBS="" LIBS="-L/usr/lib/X11R5 -lX11" LIBS="-L/usr/openwin/lib -lX11"
RANLIB Many older UNIX systems require newly created or modified libraries to be post-processed for better access speed. On such systems, you should set RANLIB="ranlib". On other systems you should set RANLIB="echo ranlib".
The following are optional. If they are not pertinent to your system configuration, you must omit them from the configuration script.
MOTIF_INCLUDE, MOTIF_LIBS On systems where Motif is installed the MOTIF_INCLUDE and MOTIF_LIBS configuration variables should contain flags telling the C compiler and loader where to find the include files and libraries associated with Motif. This should include files related to X11, Xt and Xm. Note that the XINCL and LIBS variables are not consulted when compiling and linking Motif code, e.g.,
MOTIF_INCL="-I/usr/dt/include $XINCL" MOTIF_LIBS="-L/usr/dt/lib -lXm -L/usr/openwin/lib -lXt $LIBS"
SYSDIR On entering the configuration script, this variable contains the directory name of the system directory in which the configuration file resides. If you have multiple compiler combinations which require a different set of system-specific routines, then you should create a subdirectory in the system directory, for each combination, and redirect SYSDIR in each configuration file, to point at the relevant directory. eg. SYSDIR="$SYSDIR/f77_cc/".
PGBIND_FLAGS If you wish to have the PGPLOT C wrapper library compiled for your system, then you will need to assign this variable. Its arguments are the configuration flags to the PGPLOT pgbind command. To see the available options, compile the pgbind program in pgplot/cpg/ with an ANSI-C compiler and invoke it with no arguments.
SHARED_LIB If your system supports shared libraries, you should specify the name to give the shared library here.
SHARED_LD If your system supports shared libraries, then you should specify the command and its leading arguments, which when all the PGPLOT object files are appended as trailing arguments, will create a shared library. You can use the SHARED_LIB variable specified above as an argument to this command,

by referring to it as $SHARED_LIB. MCOMPL
The command used to invoke the chosen Objective C compiler on your system. This is only required if any of the system code that you supply is written in Objective C. Few people have Objective C compilers, so you should stick to using just C and FORTRAN if at all possible.
MFLAGC The compiler flags to use with MCOMPL. Note that this should not include the "-c" or "-o" options, which are automatically added, where needed, by the makemake script.
Creating system-dependent files
While every effort was made to write PGPLOT in standard FORTRAN-77, some routines, particularly those that provide interfaces to terminals and other graphics devices, had to be written using either FORTRAN extensions or C code. Versions of these routines that work on many systems are included in the pgplot/sys/ directory. When the makemake script looks for the system dependent routines, it looks first in the specific pgplot/sys_xxx directory then in the default pgplot/sys/ directory, so you can override one or more of the default versions, by placing your own versions in the new system directory. The new versions can be in C, FORTRAN or, if unavoidable, Objective C (postfixed with .f, .c or .m respectively).
Points to consider when determining whether new versions of the default system routines are required include.
FORTRAN routines All of the *.f files in pgplot/sys/ use FORTRAN extensions, or rely upon unportable assumptions such as unformatted I/O record sizes. If you are not familiar with the specifics of your FORTRAN compiler, then probably the best thing to do here, is to simply try to compile PGPLOT without overriding any of the default FORTRAN code, and see what the compiler or linker chokes upon.
Problems that might only show up at run time include:
❍ PGPLOT crashes when trying to read its FONT file. This probably means that grsy00.f, which relies upon being able to read large unformatted record sizes, will need to be re-written. This is a difficult problem to fix. The simplest way is to replace both pgplot/sys/grsy00.f and pgplot/fonts/pgpack.f with versions that read and write a useable file format. Both files should be placed in your local system directory. makemake will pick them up from there and compile them in place of the default versions.
❍ When PGPLOT prompts for terminal input, the cursor is placed on the
line after the prompt. This is only a cosmetic problem, but if you can find a way to suppress the carriage return at the end of the prompt string, the appearance will be better.
An optional routine that makemake only compiles if it finds a version in your system directory, is a replacement for the common IAND() intrinsic function. This is used by pgplot/src/grclpl.f and if your compiler doesn't have the IAND intrinsic, you should place a function to replace it in your system directory. Its purpose is simply to return the bitwise logical AND of two FORTRAN integers.
C routines Where C routines have been used, you should be aware that there is no guaranteed way to portably call C from FORTRAN. The C routines in pgplot/sys/ support the two most common conventions, both of which are based on the convention used in the original BSD f77 compiler. In the BSD f77 convention, FORTRAN symbols are converted to lower-case and postfixed with an underscore when exported to the linker, all arguments are passed by pointer, and the lengths of any string arguments are silently appended to the end of the argument list. A common modification to the BSD f77 convention, is to omit the trailing underscore. If you need the trailing underscore, (this is the most common convention), then you must include -DPG_PPU in the configuration file CFLAGS assignment.
If neither of the above conventions are supported by your compiler, then you will have to copy the C routines to the new system directory and modify them to support the calling conventions on your system.
Where C routines have been provided, they are usually based on the availability of POSIX.1. If your machine doesn't support POSIX yet, then you will have some changes to make - particularly as regards terminal I/O routines. If your system is of BSD decent, then try the BSD compatible terminal I/O routines in the pgplot/sys_convex/ system directory.
Wrapper routines for C drivers As mentioned above there is no portable way to call C from FORTRAN, yet there are several drivers that are written in C in the pgplot/drivers/ directory. A prominent example is the X-windows drivers pgplot/drivers/xwdriv.c. Such drivers only understand the two calling conventions mentioned above. Unlike the system routines, the drivers are complicated, so for maintenance reasons it would be unwise to modify copies of them just to support a new calling convention. Instead, makemake checks to see if there are any C wrapper functions in the system directory. These are routines that act as intermediaries between FORTRAN and the unmodified drivers, and makemake arranges to have both the original driver code and wrapper code compiled and linked. In order that makemake detect such wrapper functions, for driver code called xxdriv.c, the wrapper function should be called xxwrap.c, where the two letter prefix xx names a particular driver.
The same mechanism can be used for Objective C drivers, in which case the file would be called xxwrap.m. However as mentioned before you should try to stick to C and FORTRAN code if possible.
Note that there is no requirement that you support all of the drivers in the pgplot/drivers/ directory. Many of them are targeted at specific systems, and others are for rare devices. When first porting PGPLOT, you should probably first stick to a small simple subset until PGPLOT appears to be working reliably, then re-run makemake with a larger selection of drivers uncommented to test more of them.
PGPLOT
Tim Pearson, California Institute of Technology, tjp戢stro.caltech.edu
Copyright © 1995 California Institute of Technology

PGPLOT Graphics Subroutine Library
Contents
● Contents
● Introduction
● Examples
● Copyright
● Status
● Obtaining PGPLOT
● Documentation:
❍ User's manual (draft)
❍ Annotated list of subroutines
❍ Subroutine synopses
❍ Known problems in PGPLOT version 5.2.
❍ Wish-list for future improvements.
❍ Some frequently asked questions.
● Calling PGPLOT from other languages
● Interactive drawing programs and other PGPLOT extensions
● Reporting problems
New Web Addresses
The web address for PGPLOT changed in October 2000. The new web address is
http://www.astro.caltech.edu/~tjp/pgplot/
and the ftp address for downloading PGPLOT is
ftp://ftp.astro.caltech.edu/pub/pgplot/pgplot5.2.tar.gz
Introduction
The PGPLOT Graphics Subroutine Library is a Fortran- or C-callable, device-independent graphics package for making simple scientific graphs. It is intended for making graphical images of publication quality with minimum effort on the part of the user. For most applications, the program can be device-independent, and the output can be directed to the appropriate device at run time.

The PGPLOT library consists of two major parts: a device-independent part and a set of device-dependent ``device handler'' subroutines for output on various terminals, image displays, dot-matrix printers, laser printers, and pen plotters. Common file formats supported include PostScript and GIF.
PGPLOT itself is written mostly in standard Fortran-77, with a few non-standard, system-dependent subroutines. PGPLOT subroutines can be called directly from a Fortran-77 or Fortran-90 program. A C binding library (cpgplot) and header file (cpgplot.h) are provided that allow PGPLOT to be called from a C or C++ program; the binding library handles conversion between C and Fortran argument-passing conventions.
PGPLOT has been tested with UNIX (most varieties, including Linux, SunOS, Solaris, HPUX, AIX, Irix, and MacOS X/Darwin) and OpenVMS operating systems. I am unable to provide support for DOS, Microsoft Windows, but I do distribute code provided by users for use with these operating systems.
Examples
Some example graphs showing some of the capabilities of PGPLOT, and source code in Fortran and C for a simple example, can be found in the PGPLOT Portfolio.
Caution: this page contains several large graphics files.
Copyright
PGPLOT is not public-domain software. However, it is freely available for non-commercial use. The source code and documentation are copyrighted by California Institute of Technology, and may not be redistributed or placed on public Web servers without permission. The software is provided ``as is'' with no warranty.
Status
The current version of PGPLOT is 5.2.2.
● Changes in Version 5.0.0 Released 1994-12-30.
● Changes in Version 5.0.1 Released 1995-02-16.
● Changes in Version 5.0.2 Released 1995-06-14.
● Changes in Version 5.0.3 Released 1995-12-29; sys_mac directory updated
1996-01-23; sys_arc directory updated 1996-03-27.

● Changes in Version 5.1.0 Released 1996-05-10.
● Changes in Version 5.1.1 Released 1996-11-04; sys_arc directory updated
1996-11-06.● Changes in Version 5.2.0 Released 1997-06-16.
● Changes in Version 5.2.1 Released 2000-12-07.
● Changes in Version 5.2.2 Released 2001-02-26.
● Known problems in PGPLOT version 5.2.
● Wish-list for future improvements.
● Some frequently asked questions.
Installation
For instructions for obtaining PGPLOT from my ftp site and for details of supported operating systems, read the installation instructions.
If you cannot use ftp, PGPLOT is available on tape for a fee. Consult tjp·astro.
caltech.edu.
Documentation
The manual PGPLOT Graphics Subroutine Library by T. J. Pearson is being updated for version 5.2 of PGPLOT. A draft of the manual is available: see the Table of Contents.
A PostScript file of the manual will be made available when it is completed. A PostScript file of the old manual (version 4.9, 0.27 Mbyte, gzipped) is still available,
but it does not include the many changes made in version 5.0.
Calling PGPLOT From Other Languages
PGPLOT is distributed with subroutine interfaces for C and Fortran-77; these interfaces can also be used with C++ and Fortran-90.
Several users have contributed bindings for PGPLOT that allow the PGPLOT functions to be called from other languages. Several of these bindings allow

PGPLOT to be used interactively.
ADAMartin Stift has an ADA and ADA95 interface to PGPLOT.
C++CCPL is an interesting graphing library interface for use with C++. A graph is generated by sending data to a stream, e.g., pout << line_plot(my_data) << endp;. Author: Matt Howlett (University of Tasmania). URL: http://ccpl.
sourceforge.net.
GLISHA PGPLOT binding for GLISH has been developed as part of the aips++
project by a consortium led by the National Radio Astronomy Observatory; it is currently in beta release.. For details, see the aips++ web page.
OCTAVEPGPLOT may be called from the Octave language for numerical computations
via Matwrap from Gary Holt.
PERLPGPERL by Karl Glazebrook provides an interface between the Perl language
and the PGPLOT FORTRAN library. For further information, see the WWW page http://www.aao.gov.au/local/www/kgb/pgperl/.
PYTHONNick Patavalis (npat at efault.net) has developed an interface between PGPLOT and the Python and NumPy languages. See http://efault.net/npat/
hacks/ppgplot. Scott Ransom ([email protected]) has written another
wrapper layer that simplifies use of this interface. See ftp://cfa-ftp.harvard.
edu/pub/ransom/.
RUBYRuby/PGPLOT is a PGPLOT interface to the Ruby language, written by
Masahiro Tanaka.
SCHEMEKoji Ejiri has made a Gauche binding for PGPLOT. Gauche is a Scheme
interpreter. TCL/TK
Tcl/Tk interfaces for PGPLOT have been developed by three groups: ❍ Nick Elias of the US Naval Observatory has released ptcl, a package
that registers PGPLOT functions as Tcl commands. Information is available at http://www.InfoMagic.com/~nme2/ptcl/ptcl.html. ptcl has
been ported to OpenVMS by Gilles Ratel.❍ The Sloan Digital Sky Survey project has developed a Tcl interface to
PGPLOT as part of its DERVISH package. See the Dervish Home Page
for a description of the interface (under ``Plotting''). For more information contact Eileen Berman.
❍ PGTK by Brian Toby. This includes a driver for a Tk canvas widget.

The driver tkdriv distributed with PGPLOT is more powerful and is
recommended for people using a Unix X-window system.YORICK
A PGPLOT interface to the Yorick language has been written by Alexey
Goldin ([email protected]). See http://flight.uchicago.edu/goldin/
yorick-pgplot/.
Interactive Drawing Programs and Other PGPLOT Extensions
The following list does not include the many application-specific programs that have been written using PGPLOT.
● BUTTON by N. Cardiel and J. Gorgas of the Universidad Complutense de Madrid is a package of subroutines to facilitate the creation of interactive Fortran programs using graphics buttons. For further information, see the WWW page http://www.ucm.es/OTROS/Astrof/button/button.html.
● GENPLOT by Dale Gary.
● PGXTAL. Devinder Sivia has written some 3D plotting routines for use with
PGPLOT. For details, see http://www.isis.rl.ac.uk/dataanalysis/dsplot/. This
package makes use of undocumented internal features of PGPLOT (something I strongly counsel against) and may not work with all versions of PGPLOT.
● PLOTDAT, by Vincent Jacobs ([email protected], is fully
interactive and features legends, three dimensional histograms, an "echo" scripting mechanism, parsing to add Greek or other "fancy" characters to plots, and extensive online help. Please visit the site: http://www.physics.
rutgers.edu/~vjacobs/PLOTDAT/plotdat.html.
● PONGO by Paul Harrison. This is supported by Starlink: see http://star-www.
rl.ac.uk/. Starlink also maintains a version of PGPLOT layered on the GKS
library.
● QDP/PLT by Allyn Tennant. PLT is an interactive plotting and fitting
subroutine layered on PGPLOT, and QDP provides a command interface to this routine. QDP/PLT is used by some tasks within the FTOOLS package
available from the NASA Laboratory for High Energy Astrophysics.● STAP by Mingsheng Han. STAP is an interactive command driven statistic
and plotting program: for information, see http://www.astro.wisc.edu/~han/
stap/stap.html.
● TVB by Georges GONCZI (Observatoire de Nice, France) is a semi-
interactive tool which gives access to the whole graphic possibilities of PGPLOT without having to learn it and without having to know any special
language. See http://www.obs-nice.fr/tvb/tvb.html.
● WIP by James Morgan. WIP is an interactive package with a simple to use
interface designed to produce high quality graphical output. WIP was developed as part of the Berkeley-Illinois-Maryland Association (BIMA) project. For further information, see the WWW page http://bima.astro.umd.edu/
bima/wip/wip.html.
Reporting problems
If you have questions about PGPLOT, please send them to Tim Pearson, preferably by e-mail to tjp·astro.caltech.edu, or by FAX to +1 (626) 568-9352. If you have a
problem with installation, please include information about your operating system version, Fortran and C compilers, and the version of PGPLOT you are trying to install. If you think you have found a bug in PGPLOT, a simple test program in Fortran or C that demonstrates the problem is very helpful. I maintain a mailing list for announcements about PGPLOT, and I will add your name to the list if you send me your e-mail address.
Tim Pearson, California Institute of Technology, tjp·astro.caltech.edu
Copyright © 1995-2002 California Institute of Technology
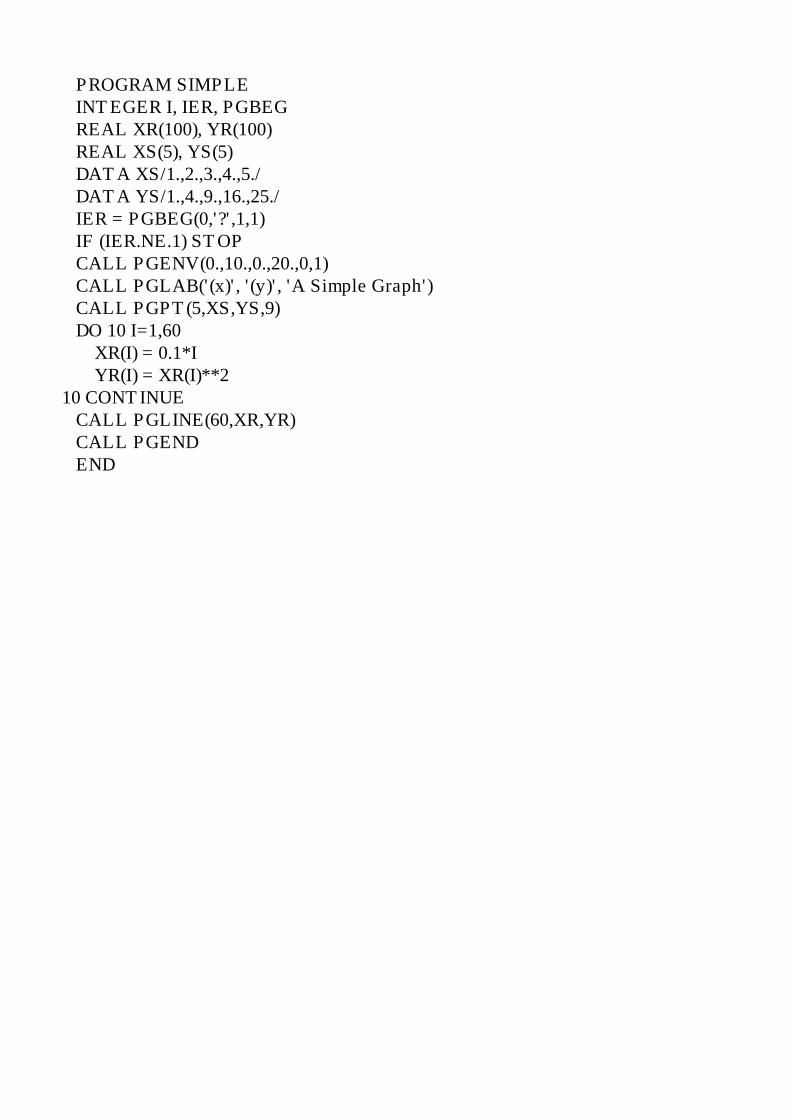
PROGRAM SIMPLE INTEGER I, IER, PGBEG REAL XR(100), YR(100) REAL XS(5), YS(5) DATA XS/1.,2.,3.,4.,5./ DATA YS/1.,4.,9.,16.,25./ IER = PGBEG(0,'?',1,1) IF (IER.NE.1) STOP CALL PGENV(0.,10.,0.,20.,0,1) CALL PGLAB('(x)', '(y)', 'A Simple Graph') CALL PGPT(5,XS,YS,9) DO 10 I=1,60 XR(I) = 0.1*I YR(I) = XR(I)**2 10 CONTINUE CALL PGLINE(60,XR,YR) CALL PGEND END

255 250 250 snow 248 248 255 ghost white 248 248 255 GhostWhite 245 245 245 white smoke 245 245 245 WhiteSmoke 220 220 220 gainsboro 255 250 240 floral white 255 250 240 FloralWhite 253 245 230 old lace 253 245 230 OldLace 250 240 230 linen 250 235 215 antique white 250 235 215 AntiqueWhite 255 239 213 papaya whip 255 239 213 PapayaWhip 255 235 205 blanched almond 255 235 205 BlanchedAlmond 255 228 196 bisque 255 218 185 peach puff 255 218 185 PeachPuff 255 222 173 navajo white 255 222 173 NavajoWhite 255 228 181 moccasin 255 248 220 cornsilk 255 255 240 ivory 255 250 205 lemon chiffon 255 250 205 LemonChiffon 255 245 238 seashell 240 255 240 honeydew 245 255 250 mint cream 245 255 250 MintCream 240 255 255 azure 240 248 255 alice blue 240 248 255 AliceBlue 230 230 250 lavender 255 240 245 lavender blush 255 240 245 LavenderBlush 255 228 225 misty rose 255 228 225 MistyRose 255 255 255 white 0 0 0 black 47 79 79 dark slate gray 47 79 79 DarkSlateGray 47 79 79 dark slate grey 47 79 79 DarkSlateGrey 105 105 105 dim gray 105 105 105 DimGray 105 105 105 dim grey 105 105 105 DimGrey 112 128 144 slate gray 112 128 144 SlateGray 112 128 144 slate grey 112 128 144 SlateGrey 119 136 153 light slate gray 119 136 153 LightSlateGray 119 136 153 light slate grey 119 136 153 LightSlateGrey 190 190 190 gray 190 190 190 grey 211 211 211 light grey 211 211 211 LightGrey 211 211 211 light gray 211 211 211 LightGray 25 25 112 midnight blue 25 25 112 MidnightBlue 0 0 128 navy 0 0 128 navy blue 0 0 128 NavyBlue 100 149 237 cornflower blue 100 149 237 CornflowerBlue 72 61 139 dark slate blue 72 61 139 DarkSlateBlue 106 90 205 slate blue 106 90 205 SlateBlue 123 104 238 medium slate blue 123 104 238 MediumSlateBlue 132 112 255 light slate blue 132 112 255 LightSlateBlue 0 0 205 medium blue 0 0 205 MediumBlue 65 105 225 royal blue 65 105 225 RoyalBlue 0 0 255 blue 30 144 255 dodger blue 30 144 255 DodgerBlue 0 191 255 deep sky blue 0 191 255 DeepSkyBlue 135 206 235 sky blue 135 206 235 SkyBlue 135 206 250 light sky blue 135 206 250 LightSkyBlue 70 130 180 steel blue 70 130 180 SteelBlue 176 196 222 light steel blue 176 196 222 LightSteelBlue 173 216 230 light blue 173 216 230 LightBlue 176 224 230 powder blue 176 224 230

PowderBlue 175 238 238 pale turquoise 175 238 238 PaleTurquoise 0 206 209 dark turquoise 0 206 209 DarkTurquoise 72 209 204 medium turquoise 72 209 204 MediumTurquoise 64 224 208 turquoise 0 255 255 cyan 224 255 255 light cyan 224 255 255 LightCyan 95 158 160 cadet blue 95 158 160 CadetBlue 102 205 170 medium aquamarine 102 205 170 MediumAquamarine 127 255 212 aquamarine 0 100 0 dark green 0 100 0 DarkGreen 85 107 47 dark olive green 85 107 47 DarkOliveGreen 143 188 143 dark sea green 143 188 143 DarkSeaGreen 46 139 87 sea green 46 139 87 SeaGreen 60 179 113 medium sea green 60 179 113 MediumSeaGreen 32 178 170 light sea green 32 178 170 LightSeaGreen 152 251 152 pale green 152 251 152 PaleGreen 0 255 127 spring green 0 255 127 SpringGreen 124 252 0 lawn green 124 252 0 LawnGreen 0 255 0 green 127 255 0 chartreuse 0 250 154 medium spring green 0 250 154 MediumSpringGreen 173 255 47 green yellow 173 255 47 GreenYellow 50 205 50 lime green 50 205 50 LimeGreen 154 205 50 yellow green 154 205 50 YellowGreen 34 139 34 forest green 34 139 34 ForestGreen 107 142 35 olive drab 107 142 35 OliveDrab 189 183 107 dark khaki 189 183 107 DarkKhaki 240 230 140 khaki 238 232 170 pale goldenrod 238 232 170 PaleGoldenrod 250 250 210 light goldenrod yellow 250 250 210 LightGoldenrodYellow 255 255 224 light yellow 255 255 224 LightYellow 255 255 0 yellow 255 215 0 gold 238 221 130 light goldenrod 238 221 130 LightGoldenrod 218 165 32 goldenrod 184 134 11 dark goldenrod 184 134 11 DarkGoldenrod 188 143 143 rosy brown 188 143 143 RosyBrown 205 92 92 indian red 205 92 92 IndianRed 139 69 19 saddle brown 139 69 19 SaddleBrown 160 82 45 sienna 205 133 63 peru 222 184 135 burlywood 245 245 220 beige 245 222 179 wheat 244 164 96 sandy brown 244 164 96 SandyBrown 210 180 140 tan 210 105 30 chocolate 178 34 34 firebrick 165 42 42 brown 233 150 122 dark salmon 233 150 122 DarkSalmon 250 128 114 salmon 255 160 122 light salmon 255 160 122 LightSalmon 255 165 0 orange 255 140 0 dark orange 255 140 0 DarkOrange 255 127 80 coral 240 128 128 light coral 240 128 128 LightCoral 255 99 71 tomato 255 69 0 orange red 255 69 0 OrangeRed 255 0 0 red 255 105 180 hot pink 255 105 180 HotPink 255 20 147 deep pink 255 20 147 DeepPink 255 192 203 pink 255 182 193 light pink 255 182 193 LightPink 219 112 147 pale violet red 219 112 147 PaleVioletRed 176 48 96 maroon 199 21 133 medium violet red 199 21 133 MediumVioletRed 208 32 144 violet red 208 32 144 VioletRed

255 0 255 magenta 238 130 238 violet 221 160 221 plum 218 112 214 orchid 186 85 211 medium orchid 186 85 211 MediumOrchid 153 50 204 dark orchid 153 50 204 DarkOrchid 148 0 211 dark violet 148 0 211 DarkViolet 138 43 226 blue violet 138 43 226 BlueViolet 160 32 240 purple 147 112 219 medium purple 147 112 219 MediumPurple 216 191 216 thistle 255 250 250 snow1 238 233 233 snow2 205 201 201 snow3 139 137 137 snow4 255 245 238 seashell1 238 229 222 seashell2 205 197 191 seashell3 139 134 130 seashell4 255 239 219 AntiqueWhite1 238 223 204 AntiqueWhite2 205 192 176 AntiqueWhite3 139 131 120 AntiqueWhite4 255 228 196 bisque1 238 213 183 bisque2 205 183 158 bisque3 139 125 107 bisque4 255 218 185 PeachPuff1 238 203 173 PeachPuff2 205 175 149 PeachPuff3 139 119 101 PeachPuff4 255 222 173 NavajoWhite1 238 207 161 NavajoWhite2 205 179 139 NavajoWhite3 139 121 94 NavajoWhite4 255 250 205 LemonChiffon1 238 233 191 LemonChiffon2 205 201 165 LemonChiffon3 139 137 112 LemonChiffon4 255 248 220 cornsilk1 238 232 205 cornsilk2 205 200 177 cornsilk3 139 136 120 cornsilk4 255 255 240 ivory1 238 238 224 ivory2 205 205 193 ivory3 139 139 131 ivory4 240 255 240 honeydew1 224 238 224 honeydew2 193 205 193 honeydew3 131 139 131 honeydew4 255 240 245 LavenderBlush1 238 224 229 LavenderBlush2 205 193 197 LavenderBlush3 139 131 134 LavenderBlush4 255 228 225 MistyRose1 238 213 210 MistyRose2 205 183 181 MistyRose3 139 125 123 MistyRose4 240 255 255 azure1 224 238 238 azure2 193 205 205 azure3 131 139 139 azure4 131 111 255 SlateBlue1 122 103 238 SlateBlue2 105 89 205 SlateBlue3 71 60 139 SlateBlue4 72 118 255 RoyalBlue1 67 110 238 RoyalBlue2 58 95 205 RoyalBlue3 39 64 139 RoyalBlue4 0 0 255 blue1 0 0 238 blue2 0 0 205 blue3 0 0 139 blue4 30 144 255 DodgerBlue1 28 134 238 DodgerBlue2 24 116 205 DodgerBlue3 16 78 139 DodgerBlue4 99 184 255 SteelBlue1 92 172 238 SteelBlue2 79 148 205 SteelBlue3 54 100 139 SteelBlue4 0 191 255 DeepSkyBlue1 0 178 238 DeepSkyBlue2 0 154 205 DeepSkyBlue3 0 104 139 DeepSkyBlue4 135 206 255 SkyBlue1 126 192 238 SkyBlue2 108 166 205 SkyBlue3 74 112 139 SkyBlue4 176 226 255 LightSkyBlue1 164 211 238 LightSkyBlue2 141 182 205 LightSkyBlue3

96 123 139 LightSkyBlue4 198 226 255 SlateGray1 185 211 238 SlateGray2 159 182 205 SlateGray3 108 123 139 SlateGray4 202 225 255 LightSteelBlue1 188 210 238 LightSteelBlue2 162 181 205 LightSteelBlue3 110 123 139 LightSteelBlue4 191 239 255 LightBlue1 178 223 238 LightBlue2 154 192 205 LightBlue3 104 131 139 LightBlue4 224 255 255 LightCyan1 209 238 238 LightCyan2 180 205 205 LightCyan3 122 139 139 LightCyan4 187 255 255 PaleTurquoise1 174 238 238 PaleTurquoise2 150 205 205 PaleTurquoise3 102 139 139 PaleTurquoise4 152 245 255 CadetBlue1 142 229 238 CadetBlue2 122 197 205 CadetBlue3 83 134 139 CadetBlue4 0 245 255 turquoise1 0 229 238 turquoise2 0 197 205 turquoise3 0 134 139 turquoise4 0 255 255 cyan1 0 238 238 cyan2 0 205 205 cyan3 0 139 139 cyan4 151 255 255 DarkSlateGray1 141 238 238 DarkSlateGray2 121 205 205 DarkSlateGray3 82 139 139 DarkSlateGray4 127 255 212 aquamarine1 118 238 198 aquamarine2 102 205 170 aquamarine3 69 139 116 aquamarine4 193 255 193 DarkSeaGreen1 180 238 180 DarkSeaGreen2 155 205 155 DarkSeaGreen3 105 139 105 DarkSeaGreen4 84 255 159 SeaGreen1 78 238 148 SeaGreen2 67 205 128 SeaGreen3 46 139 87 SeaGreen4 154 255 154 PaleGreen1 144 238 144 PaleGreen2 124 205 124 PaleGreen3 84 139 84 PaleGreen4 0 255 127 SpringGreen1 0 238 118 SpringGreen2 0 205 102 SpringGreen3 0 139 69 SpringGreen4 0 255 0 green1 0 238 0 green2 0 205 0 green3 0 139 0 green4 127 255 0 chartreuse1 118 238 0 chartreuse2 102 205 0 chartreuse3 69 139 0 chartreuse4 192 255 62 OliveDrab1 179 238 58 OliveDrab2 154 205 50 OliveDrab3 105 139 34 OliveDrab4 202 255 112 DarkOliveGreen1 188 238 104 DarkOliveGreen2 162 205 90 DarkOliveGreen3 110 139 61 DarkOliveGreen4 255 246 143 khaki1 238 230 133 khaki2 205 198 115 khaki3 139 134 78 khaki4 255 236 139 LightGoldenrod1 238 220 130 LightGoldenrod2 205 190 112 LightGoldenrod3 139 129 76 LightGoldenrod4 255 255 224 LightYellow1 238 238 209 LightYellow2 205 205 180 LightYellow3 139 139 122 LightYellow4 255 255 0 yellow1 238 238 0 yellow2 205 205 0 yellow3 139 139 0 yellow4 255 215 0 gold1 238 201 0 gold2 205 173 0 gold3 139 117 0 gold4 255 193 37 goldenrod1 238 180 34 goldenrod2 205

155 29 goldenrod3 139 105 20 goldenrod4 255 185 15 DarkGoldenrod1 238 173 14 DarkGoldenrod2 205 149 12 DarkGoldenrod3 139 101 8 DarkGoldenrod4 255 193 193 RosyBrown1 238 180 180 RosyBrown2 205 155 155 RosyBrown3 139 105 105 RosyBrown4 255 106 106 IndianRed1 238 99 99 IndianRed2 205 85 85 IndianRed3 139 58 58 IndianRed4 255 130 71 sienna1 238 121 66 sienna2 205 104 57 sienna3 139 71 38 sienna4 255 211 155 burlywood1 238 197 145 burlywood2 205 170 125 burlywood3 139 115 85 burlywood4 255 231 186 wheat1 238 216 174 wheat2 205 186 150 wheat3 139 126 102 wheat4 255 165 79 tan1 238 154 73 tan2 205 133 63 tan3 139 90 43 tan4 255 127 36 chocolate1 238 118 33 chocolate2 205 102 29 chocolate3 139 69 19 chocolate4 255 48 48 firebrick1 238 44 44 firebrick2 205 38 38 firebrick3 139 26 26 firebrick4 255 64 64 brown1 238 59 59 brown2 205 51 51 brown3 139 35 35 brown4 255 140 105 salmon1 238 130 98 salmon2 205 112 84 salmon3 139 76 57 salmon4 255 160 122 LightSalmon1 238 149 114 LightSalmon2 205 129 98 LightSalmon3 139 87 66 LightSalmon4 255 165 0 orange1 238 154 0 orange2 205 133 0 orange3 139 90 0 orange4 255 127 0 DarkOrange1 238 118 0 DarkOrange2 205 102 0 DarkOrange3 139 69 0 DarkOrange4 255 114 86 coral1 238 106 80 coral2 205 91 69 coral3 139 62 47 coral4 255 99 71 tomato1 238 92 66 tomato2 205 79 57 tomato3 139 54 38 tomato4 255 69 0 OrangeRed1 238 64 0 OrangeRed2 205 55 0 OrangeRed3 139 37 0 OrangeRed4 255 0 0 red1 238 0 0 red2 205 0 0 red3 139 0 0 red4 255 20 147 DeepPink1 238 18 137 DeepPink2 205 16 118 DeepPink3 139 10 80 DeepPink4 255 110 180 HotPink1 238 106 167 HotPink2 205 96 144 HotPink3 139 58 98 HotPink4 255 181 197 pink1 238 169 184 pink2 205 145 158 pink3 139 99 108 pink4 255 174 185 LightPink1 238 162 173 LightPink2 205 140 149 LightPink3 139 95 101 LightPink4 255 130 171 PaleVioletRed1 238 121 159 PaleVioletRed2 205 104 137 PaleVioletRed3 139 71 93 PaleVioletRed4 255 52 179 maroon1 238 48 167 maroon2 205 41 144 maroon3 139 28 98 maroon4 255 62 150 VioletRed1 238 58 140 VioletRed2 205 50 120 VioletRed3 139 34 82 VioletRed4 255 0 255 magenta1 238 0 238 magenta2 205 0 205 magenta3 139 0 139 magenta4 255 131 250 orchid1 238 122 233 orchid2 205 105 201 orchid3 139 71 137 orchid4 255 187 255 plum1 238 174 238 plum2 205 150 205 plum3 139 102 139 plum4 224 102 255 MediumOrchid1 209 95 238 MediumOrchid2 180 82 205 MediumOrchid3 122 55 139 MediumOrchid4 191 62 255 DarkOrchid1 178 58 238 DarkOrchid2 154 50 205 DarkOrchid3 104 34 139 DarkOrchid4 155 48 255 purple1 145 44 238 purple2 125 38 205 purple3 85 26 139 purple4 171 130 255 MediumPurple1 159 121 238 MediumPurple2 137 104 205 MediumPurple3 93 71 139 MediumPurple4 255 225 255 thistle1 238 210 238 thistle2 205 181 205 thistle3 139 123 139 thistle4 0 0 0 gray0 0 0 0 grey0 3 3 3 gray1 3 3 3 grey1 5 5 5 gray2 5 5 5 grey2 8 8 8 gray3

8 8 8 grey3 10 10 10 gray4 10 10 10 grey4 13 13 13 gray5 13 13 13 grey5 15 15 15 gray6 15 15 15 grey6 18 18 18 gray7 18 18 18 grey7 20 20 20 gray8 20 20 20 grey8 23 23 23 gray9 23 23 23 grey9 26 26 26 gray10 26 26 26 grey10 28 28 28 gray11 28 28 28 grey11 31 31 31 gray12 31 31 31 grey12 33 33 33 gray13 33 33 33 grey13 36 36 36 gray14 36 36 36 grey14 38 38 38 gray15 38 38 38 grey15 41 41 41 gray16 41 41 41 grey16 43 43 43 gray17 43 43 43 grey17 46 46 46 gray18 46 46 46 grey18 48 48 48 gray19 48 48 48 grey19 51 51 51 gray20 51 51 51 grey20 54 54 54 gray21 54 54 54 grey21 56 56 56 gray22 56 56 56 grey22 59 59 59 gray23 59 59 59 grey23 61 61 61 gray24 61 61 61 grey24 64 64 64 gray25 64 64 64 grey25 66 66 66 gray26

66 66 66 grey26 69 69 69 gray27 69 69 69 grey27 71 71 71 gray28 71 71 71 grey28 74 74 74 gray29 74 74 74 grey29 77 77 77 gray30 77 77 77 grey30 79 79 79 gray31 79 79 79 grey31 82 82 82 gray32 82 82 82 grey32 84 84 84 gray33 84 84 84 grey33 87 87 87 gray34 87 87 87 grey34 89 89 89 gray35 89 89 89 grey35 92 92 92 gray36 92 92 92 grey36 94 94 94 gray37 94 94 94 grey37 97 97 97 gray38 97 97 97 grey38 99 99 99 gray39 99 99 99 grey39 102 102 102 gray40 102 102 102 grey40 105 105 105 gray41 105 105 105 grey41 107 107 107 gray42 107 107 107 grey42 110 110 110 gray43 110 110 110 grey43 112 112 112 gray44 112 112 112 grey44 115 115 115 gray45 115 115 115 grey45 117 117 117 gray46 117 117 117 grey46 120 120 120 gray47 120 120 120 grey47 122 122 122 gray48 122 122 122 grey48 125 125 125 gray49 125 125 125 grey49 127 127 127 gray50 127 127 127 grey50 130 130 130 gray51 130 130 130 grey51 133 133 133 gray52 133 133 133 grey52 135 135 135 gray53 135 135 135 grey53 138 138 138 gray54 138 138 138 grey54 140 140 140 gray55 140 140 140 grey55 143 143 143 gray56 143 143 143 grey56 145 145 145 gray57 145 145 145 grey57 148 148 148 gray58 148 148 148 grey58 150 150 150 gray59 150 150 150 grey59 153 153 153 gray60 153 153 153 grey60 156 156 156 gray61 156 156 156 grey61 158 158 158 gray62 158 158 158 grey62 161 161 161 gray63 161 161 161 grey63 163 163 163 gray64 163 163 163 grey64 166 166 166 gray65 166 166 166 grey65 168 168 168 gray66 168 168 168 grey66 171 171 171 gray67 171 171 171 grey67 173 173 173 gray68 173 173 173 grey68 176 176 176 gray69 176 176 176 grey69 179 179 179 gray70 179 179 179 grey70 181 181 181 gray71 181 181 181 grey71 184 184 184 gray72 184 184 184 grey72 186 186 186 gray73 186 186 186 grey73 189 189 189 gray74 189 189 189 grey74 191 191 191 gray75 191 191 191 grey75 194 194 194 gray76 194 194 194 grey76 196 196 196 gray77 196 196 196 grey77 199 199 199 gray78 199 199 199 grey78 201 201 201 gray79 201 201 201 grey79
204 204 204 gray80 204 204 204 grey80 207 207 207 gray81 207 207 207 grey81 209 209 209 gray82 209 209 209 grey82 212 212 212 gray83 212 212 212 grey83 214 214 214 gray84 214 214 214 grey84 217 217 217 gray85 217 217 217 grey85 219 219 219 gray86 219 219 219 grey86 222 222 222 gray87 222 222 222 grey87 224 224 224 gray88 224 224 224 grey88 227 227 227 gray89 227 227 227 grey89 229 229 229 gray90 229 229 229 grey90 232 232 232 gray91 232 232 232 grey91 235 235 235 gray92 235 235 235 grey92 237 237 237 gray93 237 237 237 grey93 240 240 240 gray94 240 240 240 grey94 242 242 242 gray95 242 242 242 grey95 245 245 245 gray96 245 245 245 grey96 247 247 247 gray97 247 247 247 grey97 250 250 250 gray98 250 250 250 grey98 252 252 252 gray99 252 252 252 grey99 255 255 255 gray100 255 255 255 grey100

#ifndef cpgplot_h #define cpgplot_h
#ifdef __cplusplus extern "C" { #endif
typedef int Logical;
void cpgarro(float x1, float y1, float x2, float y2); void cpgask(Logical flag); void cpgaxis(const char *opt, float x1, float y1, float x2, float y2, float v1, float v2, float step, int nsub, float dmajl, float dmajr, float fmin, float disp, float orient); int cpgband(int mode, int posn, float xref, float yref, float *x, float *y, char *ch_scalar); void cpgbbuf(void); int cpgbeg(int unit, const char *file, int nxsub, int nysub); void cpgbin(int nbin, const float *x, const float *data, Logical center); void cpgbox(const char *xopt, float xtick, int nxsub, const char *yopt, float ytick, int nysub); void cpgcirc(float xcent, float ycent, float radius); void cpgclos(void); void cpgconb(const float *a, int idim, int jdim, int i1, int i2, int j1, int j2, const float *c, int nc, const float *tr, float blank); void cpgconf(const float *a, int idim, int jdim, int i1, int i2, int j1, int j2, float c1, float c2, const float *tr); void cpgconl(const float *a, int idim, int jdim, int i1, int i2, int j1, int j2, float c, const float *tr, const char *label, int intval, int minint); void cpgcons(const float *a, int idim, int jdim, int i1, int i2, int j1, int j2, const float *c, int nc, const float *tr); void cpgcont(const float *a, int idim, int jdim, int i1, int i2, int j1, int j2, const float *c, int nc, const float *tr); void cpgctab(const float *l, const float *r, const float *g, const float *b, int nc, float contra, float bright); int cpgcurs(float *x, float *y, char *ch_scalar); void cpgdraw(float x, float y); void cpgebuf(void); void cpgend(void); void cpgenv(float xmin, float xmax, float ymin, float ymax, int just, int axis); void cpgeras(void); void cpgerr1(int dir, float x, float y, float e, float t); void cpgerrb(int dir, int n, const float *x, const float *y, const float *e, float t); void cpgerrx(int n, const float *x1, const float *x2, const float *y, float t); void cpgerry(int n, const float *x, const float *y1, const float *y2, float t); void cpgetxt(void); void cpggray(const float *a, int idim, int jdim, int i1, int i2, int j1, int j2, float fg, float bg, const float *tr); void cpghi2d(const float *data, int nxv, int nyv, int ix1, int ix2, int iy1, int iy2, const float *x, int ioff, float bias, Logical center, float *ylims); void cpghist(int n, const float *data, float datmin, float datmax, int nbin, int pgflag); void cpgiden(void); void cpgimag(const float *a, int idim, int jdim, int i1, int i2, int j1, int j2, float a1, float a2, const float *tr); void cpglab(const char *xlbl, const char *ylbl, const char *toplbl); void cpglcur(int maxpt, int *npt, float *x, float *y); void cpgldev(void); void cpglen(int units, const char *string, float *xl, float *yl); void cpgline(int n, const float *xpts, const float *ypts); void cpgmove(float x, float y); void cpgmtxt(const char *side, float disp, float coord, float fjust, const char *text); void cpgncur(int maxpt, int *npt, float *x, float *y, int symbol); void cpgnumb(int mm, int pp, int form, char *string, int *string_length); void cpgolin(int maxpt, int *npt, float *x, float *y, int symbol); int cpgopen(const char *device); void cpgpage(void); void cpgpanl(int nxc, int nyc); void cpgpap(float width, float aspect); void cpgpixl(const int *ia, int idim, int jdim, int i1, int i2, int j1, int j2, float x1, float x2, float y1, float y2); void cpgpnts(int n, const float *x, const float *y, const int

*symbol, int ns); void cpgpoly(int n, const float *xpts, const float *ypts); void cpgpt(int n, const float *xpts, const float *ypts, int symbol); void cpgpt1(float xpt, float ypt, int symbol); void cpgptxt(float x, float y, float angle, float fjust, const char *text); void cpgqah(int *fs, float *angle, float *barb); void cpgqcf(int *font); void cpgqch(float *size); void cpgqci(int *ci); void cpgqcir(int *icilo, int *icihi); void cpgqclp(int *state); void cpgqcol(int *ci1, int *ci2); void cpgqcr(int ci, float *cr, float *cg, float *cb); void cpgqcs(int units, float *xch, float *ych); void cpgqdt(int n, char *type, int *type_length, char *descr, int *descr_length, int *inter); void cpgqfs(int *fs); void cpgqhs(float *angle, float *sepn, float *phase); void cpgqid(int *id); void cpgqinf(const char *item, char *value, int *value_length); void cpgqitf(int *itf); void cpgqls(int *ls); void cpgqlw(int *lw); void cpgqndt(int *n); void cpgqpos(float *x, float *y); void cpgqtbg(int *tbci); void cpgqtxt(float x, float y, float angle, float fjust, const char *text, float *xbox, float *ybox); void cpgqvp(int units, float *x1, float *x2, float *y1, float *y2); void cpgqvsz(int units, float *x1, float *x2, float *y1, float *y2); void cpgqwin(float *x1, float *x2, float *y1, float *y2); void cpgrect(float x1, float x2, float y1, float y2); float cpgrnd(float x, int *nsub); void cpgrnge(float x1, float x2, float *xlo, float *xhi); void cpgsah(int fs, float angle, float barb); void cpgsave(void); void cpgunsa(void); void cpgscf(int font); void cpgsch(float size); void cpgsci(int ci); void cpgscir(int icilo, int icihi); void cpgsclp(int state); void cpgscr(int ci, float cr, float cg, float cb); void cpgscrl(float dx, float dy); void cpgscrn(int ci, const char *name, int *ier); void cpgsfs(int fs); void cpgshls(int ci, float ch, float cl, float cs); void cpgshs(float angle, float sepn, float phase); void cpgsitf(int itf); void cpgslct(int id); void cpgsls(int ls); void cpgslw(int lw); void cpgstbg(int tbci); void cpgsubp(int nxsub, int nysub); void cpgsvp(float xleft, float xright, float ybot, float ytop); void cpgswin(float x1, float x2, float y1, float y2); void cpgtbox(const char *xopt, float xtick, int nxsub, const char *yopt, float ytick, int nysub); void cpgtext(float x, float y, const char *text); void cpgtick(float x1, float y1, float x2, float y2, float v, float tikl, float tikr, float disp, float orient, const char *str); void cpgupdt(void); void cpgvect(const float *a, const float *b, int idim, int jdim, int i1, int i2, int j1, int j2, float c, int nc, const float *tr, float blank); void cpgvsiz(float xleft, float xright, float ybot, float ytop); void cpgvstd(void); void cpgwedg(const char *side, float disp, float width, float fg, float bg, const char *label); void cpgwnad(float x1, float x2, float y1, float y2);
#ifdef __cplusplus } #endif
#endif

GIF (Graphics Interchange Format)
GIF is a widely supported format for raster graphics, defined by Compuserve, Inc. The program xv (by John Bradley, [email protected]) can be used to display GIF files on UNIX and VMS workstations. PGPLOT uses the GIF87a variant, with up to 8 bits per pixel (256 colors).
The GIF specification incorporates the Lempel-Zev-Welch (LZW) compression algorithm which is the subject of a patent awarded to Unisys. Use of this technology, and in particular creation of GIF format files using this PGPLOT device driver, may require a license from Unisys.
Device type code /GIF (landscape orientation), /VGIF (portrait orientation).
Default file name pgplot.gif A GIF file can contain only a single image, so for multi-page plots PGPLOT creates additional files. If the supplied file name contains the character #, the file name is derived by replacing this character with the current page number. If the supplied file name does not contain a #, PGPLOT appends an underscore and the page number for the second and subsequent pages, e.g.,
PGBEG file name: File names used: pgplot#.gif pgplot1.gif, pgplot2.gif, pgplot3.gif, ... pgplot.gif pgplot.gif, pgplot.gif_2, pgplot.gif_3, ...
If the supplied file name is ``-'', the output is sent to the standard output stream, so that it can, for example, be piped into a viewing program. This will only work for single-page plots.
Default view surface dimensions /GIF: 850 by 680 pixels (nominally 10.0 by 8.0 inches) /VGIF: 680 by 850 pixels (nominally 8.0 by 10.0 inches) These defaults can be overridden by specifying environment variables, or by calling routine PGPAP. The maximum size is limited only by available memory.
Resolution PGPLOT assumes that the device resolution is 85 pixels/inch, but the actual resolution will vary depending on the display device.
Color capability Color indices 0--255 are accepted, with standard defaults for color indices 0--15. If the color representation of a color index is changed, it affects all pixels drawn in that color on the current page.
Input capability

None. Environment variables
PGPLOT_GIF_WIDTH : width of image in pixels (default 850) PGPLOT_GIF_HEIGHT : height of image in pixels (default 680)
File format GIF files are binary files.
Author Remko Scharroo, Tim Pearson, 1994.
Transparent Background Images
The GIF87a images produced by PGPLOT do not have a way of specifying a transparent background. You can mark the background as transparent if you convert the file to GIF89a format using giftrans and specify that color index 0 should be transparent.
● Giftrans source code for Unix is available from the European FTP site
● Giftrans documentation (nroff format) is available from the European FTP
site
● Giftrans.exe executable for DOS is available from European FTP site
To use giftrans, just type
giftrans -t index GIF87a-file > GIF89a-file
This converts the GIF87a-file to a GIF89a-file, with the index entry in the colormap made transparent. Invoke giftrans with the -? option to see a complete usage description.
Hewlett-Packard HPGL Plotters
HPGL (Hewlett-Packard Graphics Language) is a vector-graphics format for control of pen-plotters and laser-printers manufactured by Hewlett-Packard Co., and some other manufacturers. This PGPLOT device handler produces files that should be acceptable to most HPGL and HPGL/2 devices, specifically the HP7475A Plotter.
Device type code /HPGL (landscape orientation), /VHPGL (portrait orientation).
Default file name pgplot.hpgl
Default view surface dimensions /HPGL: 16640 by 11040 pixels (16.38 by 10.87 inches) /VHPGL: 110400 by 16640 pixels (nominally 10.87 by 16.38 inches) These dimensions are chosen for 17 by 11-inch paper.
Resolution The nominal resolution is 1016 pixels/inch, but the actual resolution will vary depending on the display device.
Color capability Color indices 1--6 are accepted, and are interpreted as pen numbers.
Input capability None.
Environment variables If environment variable PGPLOT_GL_TERMINAL has value YES (or any string beginning with Y or y), it is assumed that the output device is a plotter connected before the terminal using the Y-cable (HP part #17455A), in which case the plotter is ``turned on'' and xon/xoff handshaking is enabled using escape sequences. Otherwise, it is the user's responsibility to add control codes, if needed. If there is more than one plot and the plot is on a terminal, a prompt will be generated, allowing the page to be advanced.
File format HPGL files are plain text.
Author B. H. Toby, T. J. Pearson, 1988-1994.

PPM (Portable Pixel Map)
The PPM raster format was defined by Jef Poskanzer, whose Portable Bitmap Utilities (available on the Internet) can be used to translate it into a variety of other formats. The program xv (by John Bradley, [email protected]) can be used to display PPM files on UNIX and VMS workstations. PGPLOT uses the P6 variant, with 24 bits (8 each for R, G, B) for each pixel. The format is not efficient in use of storage, so for most purposes the GIF format is preferred.
Device type code /PPM (landscape orientation), /VPPM (portrait orientation).
Default file name pgplot.ppm A PPM file can contain only a single image, so for multi-page plots PGPLOT creates additional files. If the supplied file name contains the character #, the file name is derived by replacing this character with the current page number. If the supplied file name does not contain a #, PGPLOT appends an underscore and the page number for the second and subsequent pages, e.g.,
PGBEG file name: File names used: pgplot#.ppm pgplot1.ppm, pgplot2.ppm, pgplot3.ppm, ... pgplot.ppm pgplot.ppm, pgplot.ppm_2, pgplot.ppm_3, ...
If the supplied file name is ``-'', the output is sent to the standard output stream, so that it can, for example, be piped into a viewing program. This will only work for single-page plots.
Default view surface dimensions /PPM: 850 by 680 pixels (nominally 10.0 by 8.0 inches) /VPPM: 680 by 850 pixels (nominally 8.0 by 10.0 inches) These defaults can be overridden by specifying environment variables, or by calling routine PGPAP. The maximum size is limited only by available memory.
Resolution PGPLOT assumes that the device resolution is 85 pixels/inch, but the actual resolution will vary depending on the display device.
Color capability Color indices 0--255 are accepted, with standard defaults for color indices 0--15. If the color representation of a color index is changed, it affects only pixels drawn subsequently, so the number of different colors that can be used in an image is not limited to 256.
Input capability None.
Environment variables

PGPLOT_PPM_WIDTH : width of image in pixels (default 850) PGPLOT_PPM_HEIGHT : height of image in pixels (default 680)
File format PPM files are binary files.
Author Remko Scharroo, Tim Pearson, 1994.

PGPLOT driver for PostScript printers
The PostScript page description language is widely used for desktop publishing. PostScript files can be printed on many laser printers and photo-typesetters, and they can also be viewed on most workstations (e.g., use ghostview on UNIX workstations, pageview on Sun workstations, view/format=ps/interface=decw on VMS workstations). A single-page PGPLOT PostScript file is valid ``encapsulated PostScript'' and can be included in another file by way of a page-composition program. PGPLOT generates level-1 PostScript which is accepted by all PostScript printers. PostScript is a trademark of Adobe Systems Incorporated.
Device type code
● /PS (monochrome landscape mode, long edge of paper horizontal). ● /CPS (color landscape mode, long edge of paper horizontal). ● /VPS (monochrome portrait mode, short edge of paper horizontal). ● /VCPS (color portrait mode, short edge of paper horizontal).
``Color'' PostScript files can be printed on monochrome printers: the colors will be rendered as shades of grey. Use the monochrome codes (/PS, /VPS) when you know that the file is to be printed only on monochrome printers.
Default file name
● pgplot.ps
If a file name of - is specified (e.g., -/PS) the PostScript file is sent to the standard output stream (stdout in UNIX).
Default view surface dimensions
10.5 inches horizontal by 7.8 inches vertical (landscape mode); 7.8 inches horizontal by 10.5 inches vertical (portrait mode). These dimensions can be changed with environment variables.
Resolution
The driver uses coordinate increments of 0.001 inch, giving an ``apparent'' resolution of 1000 pixels/inch. The true resolution is device-dependent; e.g., on an Apple LaserWriter it is 300 pixels/inch (in both dimensions).
Color capability

Color indices 0--255 are supported, and the color representation can be changed with routine PGSCR. With device types /PS and /VPS, color index 0 is white (erase or background color), indices 1--13 are black, 14 is light grey, and 15 is dark grey; while with device types /CPS and /VCPS, color index 0 is white (erase or background color), index 1 is black, and indices 2--15 have the standard PGPLOT color assignments.
File format
The file contains variable length records (maximum 132 characters) containing PostScript commands. The commands use only printable ASCII characters, and the file can be examined or modified with a text editor.
Obtaining hardcopy
Use the operating system print or copy command to send the file to a suitable PostScript printer.
Environment variables
PGPLOT_PS_WIDTH (default 7800) PGPLOT_PS_HEIGHT (default 10500) PGPLOT_PS_HOFFSET (default 350) PGPLOT_PS_VOFFSET (default 250)
These variables tell PGPLOT how big an image to produce. The defaults are appropriate for 8.5 x 11-inch paper. The maximum dimensions of a PGPLOT image are WIDTH by HEIGHT, with the lower left corner offset by HOFFSET horizontally and VOFFSET vertically from the lower left corner of the paper. The units are milli-inches. The ``top'' of the paper is the edge that comes out of the printer first.
PGPLOT_IDENT If this variable is defined (with any value), the user name, date and time are written in the bottom right corner of each page.
PGPLOT_PS_BBOX Normally, PGPLOT computes the bounding box for the entire plot (the smallest rectangle that includes all the graphics) as it creates the PostScript file, and writes this information in a %%BoundingBox comment in the file trailer. Some programs that read encapsulated PostScript files expect to find the %%BoundingBox comment in the file header, not the trailer, and may not display the plot correctly. To fix this problem, you may need to move the comment from the trailer to the header with a text editor or special program. Alternatively, you can define PGPLOT_PS_BBOX = MAX. This tells PGPLOT to put a %%BoundingBox comment in the header of the PostScript

file; the bounding box is one which encompasses the whole plottable area, not a minimal one, because PGPLOT does not know the correct bounding box until it has finished writing the file.
PGPLOT_PS_DRAW_BBOX If this variable is set, the bounding box (the smallest rectangle that includes all the graphics) is drawn on each page.
PGPLOT_PS_VERBOSE_TEXT If this variable is set, the text of each plotted character string is included in the PostScript file as a comment before the sequence of vectors that represents the string. This makes the file slightly larger, but it can be useful if you want to edit the PostScript file.
PGPLOT_PS_EOF Normally the output file does not contain special end-of-file characters. But if environment variable PGPLOT_PS_EOF is defined (with any value) PGPLOT writes a control-D job-separator character at the beginning and at the end of the file. This is appropriate for Apple LaserWriters using the serial interface, but it may not be appropriate for other PostScript devices.
PGPLOT_PS_MARKERS Specify NO to suppress use of a PostScript font for the graph markers; markers are then emulated by line-drawing. If this option is not requested, PGPLOT graph markers are scaled geometrically with the character-height attribute and the line-width attribute is ignored. This is different from most of the other drivers, where the line-width used for markers is set by the line-width attribute rather than the character-height attribute. Requesting this option makes the PostScript driver behave like the other drivers, but it also makes the PostScript files larger.
Document Structuring Conventions
The PostScript files conform to Version 3.0 of the Adobe Document Structuring Conventions (see ref.3) and to version 3.0 of the encapsulated PostScript file (EPSF) format. This should allow the files to be read by other programs that accept the EPSF format. Note, though, that multi-page plots are not valid EPSF files. The files do not contain a screen preview section. A device-independent screen preview can be added to PGPLOT files with the program ps2epsi by George Cameron, available with the GhostScript PostScript interpreter from Aladdin Enterprises.
Note that a valid EPSF file should have a %%BoundingBox comment in the header of the file. By default, PGPLOT puts the comment in the trailer of the file, where some but not all programs will find it. You may need to move this comment into the file header using a text editor or special program. See also the discussion of the environment variable PGPLOT_PS_BBOX above.
References

1. Adobe Systems, Inc.: PostScript Language Reference Manual. Addison-Wesley, Reading, Massachusetts, 1985.
2. Adobe Systems, Inc.: PostScript Language Tutorial and Cookbook. Addison-Wesley, Reading, Massachusetts, 1985.
3. Adobe Systems, Inc.: PostScript Language Reference Manual, Second Edition. Addison-Wesley, Reading, Massachusetts, 1990.
Author
T. J. Pearson, 1991--1995.

X Window Dump
X Window dump files can be displayed on X Window workstations using the xwud utility and converted to a printable form using the xpr utility. These utilities are available in most X Window installations.
The X Window system can produce dump files in a variety of formats. PGPLOT uses an image format of ``ZPixmap'' with 8 bits per pixel.
Device type code /WD (landscape orientation), /VWD (portrait orientation).
Default file name pgplot.xwd An X Window dump file can contain only a single image, so for multi-page plots PGPLOT creates additional files. If the supplied file name contains the character #, the file name is derived by replacing this character with the current page number. If the supplied file name does not contain a #, PGPLOT appends an underscore and the page number for the second and subsequent pages, e.g.,
PGBEG file name: File names used: pgplot#.xwd pgplot1.xwd, pgplot2.xwd, pgplot3.xwd, ... pgplot.xwd pgplot.xwd, pgplot.xwd_2, pgplot.xwd_3, ...
Default view surface dimensions /WD: 850 by 680 pixels (nominally 10.0 by 8.0 inches) /VWD: 680 by 850 pixels (nominally 8.0 by 10.0 inches) These defaults can be overridden by specifying environment variables, or by calling routine PGPAP. The maximum size is limited only by available memory.
Resolution PGPLOT assumes that the device resolution is 85 pixels/inch, but the actual resolution will vary depending on the display device.
Color capability Color indices 0--255 are accepted, with standard defaults for color indices 0--15. If the color representation of a color index is changed, it affects all pixels drawn in that color on the current page.
Input capability None.
Environment variables PGPLOT_WD_WIDTH : width of image in pixels (default 850) PGPLOT_WD_HEIGHT : height of image in pixels (default 680)
File format

X Window Dump files are binary files. Author
Scott Allendorf, 1995.

X Window Workstations
Author M. C. Shepherd, 1994.
Supported device All workstations running the X Window System (Version 11 Release 4 and above) under UNIX, VMS and OpenVMS.
Device type codes ❍ /XWINDOW opens a window that disappears when PGEND is called. ❍ /XSERVE opens a window that persists for reuse after PGEND is
called.
Default device name The default X display name defined by one's environment. Under UNIX this is given by the DISPLAY environment variable. Under VMS it is the device last created with CREATE/DISPLAY.
Device name specification window@host:display.screen
The device name specifies the X-window display to use, the screen of that display and the PGPLOT window number to use.
The window number is a small integer used to identify individual windows created by PGPLOT. You can either specify the number of an existing inactive window to reuse, or provide a new number to assign to a new window. If the number is omitted or specified as zero, then either the last window to become inactive will be reused, or a new window will be created and assigned the lowest unused window number. The number of each window is displayed in the title of the window.
The host part of the specification is the address of the host on which the display resides. If a DECNET address is used, the host name should be separated from the display number by two colons instead of one.
The display part of the specification is the number of the display server on the given host. Usually this is 0, but if you have multiple X terminals connected to the same machine, then each terminal is generally assigned a different display number.
The screen number is also usually 0, but if your display has multiple screens,

then each is identified by a small integer.
For example "[email protected]:0.0/xw" opens PGPLOT window 2 as a /xwindow window on host foo.wherever.edu. Note that the @ symbol is optional if the display name is omitted. Thus "2/xw" opens window 2 on the default display.
Default view surface dimensions The default geometry of each window is specified in pixels, using the following hierarchy of specifications. Missing details at each level are supplied by those below.
1. X resource: pgxwin.win#.geometry: WIDTHxHEIGHT+X+Y 2. X resource: pgxwin.Win.geometry: WIDTHxHEIGHT+X+Y 3. Environment variable: PGPLOT_XW_WIDTH [fractional display
width] 4. Width=867, height=669 and aspect=8.5/11.
Once displayed, the window can be resized with the mouse, but the drawing area is only resized to reflect this when the next page is started.
Resolution Depends on monitor.
Color capability Colormaps of types PseudoColor, StaticColor, GrayScale, StaticGray, and TrueColor are supported. By default, the first available colormap from one of the following lists is used.
❍ For color displays: PseudoColor, StaticColor, TrueColor. ❍ For gray-scale displays: GrayScale, StaticGray. ❍ For monochrome displays: The default colormap of the screen.
Thus, where possible a read/write colormap is chosen. This allows color representation changes via PGCTAB, PGSCR and PGSHLS to be applied immediately to previously drawn graphics, which makes it possible to interactively fiddle the colors when used in conjunction with PGBAND.
If the first available colormap type happens to match that of the default colormap of the screen, and enough colors are available therein, then that colormap is used. Otherwise, allocation of a private colormap is attempted. If this fails, the device is treated as monochrome. The default color-map type can be overriden via the pgxwin.Win.visual resource described below. However, if the requested colormap type is not available, the driver reverts to its default colormap search strategy.
By default the driver tries to allocate 100 colors. This number usually makes it possible to have two windows displayed simultaneously without having to allocate a private colormap. This helps to avoid colormap flashing as the

pointer is moved between windows. You can override this default with a number in the range 2 to 255 by using the pgxwin.Win.maxColors X resource.
Input capability The cursor is usually controlled by a mouse. Cursor input is achieved by moving the cursor into the window, and pressing either a mouse button or a keyboard key to select a given position in the window and return a key value. The mouse buttons are mapped to return characters A, D, and X. The cursor can also be moved horizontally and vertically with the keyboard arrow keys: each keystroke moves the cursor by one pixel, or 10 pixels if the SHIFT key is depressed. Rubber-banding is supported: see routine PGBAND. With Click-to-focus window managers you may have to explicitly click on the window to enable keyboard input in the PGPLOT window.
X resources The following optional X window resources can be used to specify configuration options. On POSIX-compliant systems, these should be placed in a file called .Xdefaults in your home directory. Under VMS they should be placed in DECW$USER_DEFAULTS:DECW$XDEFAULTS.DAT. Note that by default DECW$USER_DEFAULTS is defined as SYS$LOGIN. Resource specification is discussed further in the "Potential problems" section further below.
The following resource descriptions show how a resource line should be constructed in one's resource file. Where default values are available they are indicated. Otherwise the value is indicated symbolically and instructions are given for substituting appropriate values.
pgxwin.Win.geometry: WIDTHxHEIGHT+X+Y This specifies the size and position of a window in pixels. Any of the above components can be omitted. The X and Y values specify the position of the top left corner of the window wrt the top left corner of the screen, if positive, or the bottom right corner wrt the bottom right corner, if negative.
pgxwin.Win.iconGeometry: +X+Y This specifies the position of the iconized form of a window, in pixels. The X and Y values specify the position of the top left corner of the window wrt the top left corner of the screen, if positive, or the bottom right corner wrt the bottom right corner, if negative.
pgxwin.Win.acceptQuit: False Most window managers provide a way for the user to destroy a window using the mouse, often via an option in a pull down menu. By default PGPLOT takes steps to ignore this action when a window is actually

being used by a PGPLOT program. To re-enable it, set: pgxwin.Win.acceptQuit: True
pgxwin.Win.iconize: False By default, PGPLOT /XSERVE windows remain mapped when PGEND is called or when the program is terminated. If instead you wish the window to be iconized until opened by a new PGPLOT program, set: pgxwin.Win.iconize: True
pgxwin.Win.maxColors: 100 This specifies the maximum number of colors that PGPLOT tries to allocate for each X window. Reducing the number of colors allocated makes it more likely that each window will share the same colormap and thus stop ``colormap flashing''. Note that the value of the maxColors option must not be less than that of the minColors resource described below.
pgxwin.Win.minColors: 16 To reject colormaps with fewer than a given number of color entries, specify the minimum number of colors required.
pgxwin.Win.visual: default If you have a preference for the type of colormap to use, specify the name of the preferred type. PGPLOT will then try that type first. The following type names are recognized:
■ default - Use the colormap search strategy described in the "Color Capability" section.
■ monochrome - Use black and white. ■ PseudoColor - Read/write color visual. ■ DirectColor - (This is treated as an alias for TrueColor). ■ StaticColor - Read-only color visual. ■ TrueColor - Read-only color visual (3 primary colortables). ■ GrayScale - Read/write gray-scale visual. ■ StaticGray - Read-only gray-scale visual.
pgxwin.Win.crosshair: False
To augment the default active PGPLOT cursor with cross hairs, set: pgxwin.Win.crosshair: True
pgxwin.server.visible: True To hide the PGPLOT server window set pgxwin.server.visible: False
pgxwin.server.iconGeometry: +X+Y This specifies the position of the server window icon on the X display,

in display pixels. The X and Y values specify the position of the top left corner of the window wrt the top left corner of the screen, if positive, or the bottom right corner wrt the bottom right corner, if negative.
Note that resource specifications that start with pgxwin.Win apply to all PGPLOT /xwindow and /xserve windows. To target options at specific windows, replace the Win component of the specification with win#, where # is the number of the PGPLOT window. For example:
pgxwin.Win.crosshair: True pgxwin.win2.crosshair: False
stipulates that all windows except PGPLOT window 2 will use a crosshair for the default cursor. Note that Win is spelt with an upper case initial 'W', whereas win# is spelt with an initial lower-case 'w'. This is important because all resource names are case sensitive.
A better example of the utility of targeting options at specific windows is the following:
pgxwin.Win.geometry: 500x500+600+360 pgxwin.win1.geometry: 500x500+600+33
This example places the first PGPLOT window in one position on the display, and all other windows in a second location - thus avoiding obscuring the first by the second etc..
Similarly if one wanted to dedicate one window to line graphics, one could designate a specific window number to have a reduced number of colors.
pgxwin.win10.maxColors: 16
This window would then be selected using a device specification of "10/xserve".
The /XWINDOW and /XSERVE window server (pgxwin_server). All PGPLOT /xwindow and /xserve windows on a single display are created and maintained by a separate server program called pgxwin_server. If PGPLOT has been installed correctly then this program is automatically started by the /xw and /xs driver when first called upon. pgxwin_server then continues to serve windows to subsequent PGPLOT programs and remains running indefinitely. In order that it be possible to kill the server, an icon

window for it is displayed. Window managers generally provide a way to interactively kill windows, and if this is applied to the server window, then the server will close any inactive /xserve windows, and if no active /xw or /xs windows remain, then the server will shut itself down cleanly. Note that inactive windows are distinguishable from active windows by the appearance of a skull-and-crossbones cursor.
If pgxwin_server fails to start automatically, see the "Potential problems" section below on how to remedy this. However, if for some reason it is necessary to run pgxwin_server manually, you'll need to know the following. In particular, under VMS, before you can run the server you will first need to register it as a foreign command, by typing:
pgxwin_server:=="$directory_name:pgxwin_server.exe"
If your default display is correctly set then simply typing:
pgxwin_server
with no arguments should start the server, and the server icon should appear on the display. If an alternate display is desired then the default display can be overridden with the -display argument. Other options to override selected X resources from the command-line are also available. To see them type:
pgxwin_server -help
Potential problems. The server fails to start.
If the server fails to start automatically then this means that the /xw and /xs driver was unable to find the pgxwin_server executable. It first looks in the directory specified in your PGPLOT_DIR environment variable (or LOGICAL PGPLOT_DIR variable under VMS). Under UNIX, if it fails to find the executable there, it then looks for the executable in each component directory cited in your PATH environment variable. To fix the problem, first determine where the person who compiled PGPLOT installed pgxwin_server and then either place this directory name in your PGPLOT_DIR variable or, under UNIX, add it to your PATH.
If you are still unable to get the server to start automatically, please send me Email at mcs·astro.caltech.edu. In the meantime, you can
work around the problem by starting the server by hand, as described previously.

X resource options are ignored. First check check both the spelling and case of your resource names. Resource names are case sensitive and must appear exactly as indicated above.
The X resource database is compiled by the pgxwin_server program when it is started. Resources set after it has been started are ignored and pgxwin_server will need to be restarted before they are acquired. There are a number of places in which the server can find resources, and your specifications will not be seen if they appear in the wrong place. pgxwin_server attempts to follow the rules laid down by the X Toolkit. First it looks for a RESOURCE_MANAGER property on the root window of your display. This contains a list of resource names and values and comes into being when the standard xrdb program is applied to a resource file. It is common for xrdb to be applied automatically to your Xdefaults file, or to a system supplied xdefaults file when the X server is first started. If this is the case then changes to your Xdefaults file will be ignored until the server is restarted or you explicitly re-run the xrdb command.
If - and only if - the RESOURCE_MANAGER property does not exist, then under UNIX pgxwin_server looks for a file called .Xdefaults in your home directory, and under VMS it looks for a file called DECW$USER_DEFAULTS:DECW$XDEFAULTS.DAT. If it finds this file, it initializes its resource database from it. It then also looks to see if the XENVIRONMENT environment variable contains a valid file name and if so reads resources from that file, overriding any contrasting resources from your Xdefaults file.
To be sure that changes to resources in your Xdefaults are seen by pgxwin_server you should use the xrdb command to install them on the display:
UNIX:
(cd;xrdb .Xdefaults)
VMS:
$ xrdb -nocpp decw$user_defaults:decw$xdefaults.dat
If the xrdb command is not defined on your system, then first execute:

$ @DECW$UTILS:DECW$DEFINE_UTILS.COM
Then terminate pgxwin_server by quiting its icon and ask for /xw or /xs again to restart it.

PGDISP or FIGDISP server for X Window workstations
The figdisp server is part of Figaro: it maintains a ``line graphics'' window which can be addressed by PGPLOT using the /XDISP device type. The pgdisp server is a subset of figdisp that shows only the line graphics window. Both server programs run in the background and keep the PGPLOT window open. (Most users will prefer to use /XSERV instead of /XDISP).
Author Sam Southard, Jr., 1991.
Device type code /XDISP.
Starting PGDISP
To start up the pgdisp server (in the background), use
% pgdisp [options] &
You can change the size of the server window with the mouse. You can also use standard -geometry and -display options with pgdisp. PGPLOT will adapt to the size selected, but it is not possible to change the size of a graph after it has been displayed. To remove the server, select Quit from its menu. If the pgdisp program is not in a directory in your path, you will need to use the full file name (or create an alias), e.g.,
% /usr/local/pgplot/pgdisp [options] &
Redirecting the Display
Before starting pgdisp, both the Figaro and the X11 environment must be set up. The X11 environment consists of setting the DISPLAY environment variable appropriately. For example:
% setenv DISPLAY :0
or
% setenv DISPLAY lo-fan:0.0
The first example would cause the display to appear on the local machine. Other values which can be used to accomplish this are "unix:0.0" and "lhost:0.0", where

lhost is the name of the local host.
Multiple Copies
If you wish to start up a second copy of pgdisp, type the line
% pgdisp -id # [options] &
where # represents any integer. Note that there cannot be a copy of figdisp and a copy of pgdisp running on the same screen with the same id. To send graphics to a particular pgdisp window, specify the id number before /XDISP, e.g., "1/XDISP". The default is 0.
Options
The PGDISP window uses a default of 16 colors (2 if on a monochrome screen or it can't get 16 colors for some reason), but this can be changed with the lineColors resource. You need more than 16 colors for PGPLOT gray-scales; I recommend 64. More than 64 colors is likely to steal too many from other windows.
The window can be resized arbitrarily. The initial size is determined by the figdisp.lg.geometry resource. Since PGPLOT automatically scales to use the entire window, the line graphics window should not be resized while a program is accessing it. If this is done, the display server will not crash, but the output will look odd, and cursor positioning may be incorrect.
The window title is updated to show the position of the cursor when the cursor is in the line graphics window.
Command Line Option X resource Default Notes
-display disp .display none The display on which the display server should run.
-id # .id 0 The id number of this copy of figdisp or pgdisp. An arbitrary number of copies of figdisp/pgdisp may be run at the same time, as long as each one's id number is unique.

-geometry WxH[+x+y] 512x512 This flag corresponds to .bm.geometry in figdisp and .lg.geometry in pgdisp
-lgGeometry WxH[+x+y] .lg.geometry 512x512 The line graphics window geometry.
-lineColors # .lineColors 16 The number of colors to use for line graphics.
-visual .visual Any The visual to use. Accepted values include the X11 visuals PseudoColor and GrayScale, as well as Default (only the default visual is allowed) and Any (any visual is allowed) for either pgdisp or figdisp. Pgdisp also allows the X11 visual classes StaticGray, StaticColor, DirectColor, and TrueColor.
-lgCrosshair .lg.Crosshair Specify to get cross-hair cursor.

VMS Workstations Running VWS software
Supported device This driver should work with all VAX/VMS workstations running VWS software; it requires the UISSHR shareable image provided by DEC.
Device type code /WS.
Default device name PGPLOT. Output is always directed to device SYS$WORKSTATION; the ``device name'' provided by the user is used to label the PGPLOT window.
Default view surface dimensions Depends on monitor. PGPLOT uses a window which is nominally 11 inches wide by 8.5 inches tall, i.e., the same size as you would get in a hardcopy. If you prefer a vertical orientation, execute the following command before running the program:
$ DEFINE PGPLOT_WS_ASPECT PORTRAIT
Substitute LANDSCAPE for PORTRAIT to revert to horizontal orientation. Resolution
Depends on monitor. Color capability
VAX workstations can have 1, 4, or 8 bitplanes. On 1-plane devices, there are only two colors (background = white, color index 1 = black). On 4-plane devices, color indices 0--11 are available (4 indices are reserved for text windows and pointers). On 8-plane systems, color indices 0--249 are available (6 indices are reserved for text windows and pointers).
Input capability The cursor is controlled by the mouse or the keypad available on the controlling (DEC-like) keyboard. The user positions the cursor, and then types any key on the controlling keyboard. The mouse buttons are ignored (at present).
Author S. C. Allendorf, 1990.
NeXT Workstations
Supported device Any computer running NeXTstep.
Device type code /next.
Default device name none
Default view surface dimensions The default screen size is 720 by 535 pixels (about 8 by 6 inches on a 19 inch monitor). The aspect ratio was selected to match the /PS device. The window can be resized larger or smaller.
Resolution The screen resolution is 92 dpi. The driver generates PostScript commands with a resolution 10 times greater than the screen resolution. This allows the window to be resized and/or a hardcopy to be made with no loss of resolution.
Color capability On all devices, color indices 0-15 are supported. The default colors are 0 is white, 1 is black, 14 is light gray, 15 dark gray. On monochrome devices, color indices 2-13 default to black. If the driver detects a color server, then color indices 0-255 are allowed and color indices 2-13 default to the standard PGPLOT colors.
Input capability The PGPLOT cursor is supported. When a cursor read is requested the the viewer becomes the active application and the active plot window becomes the key window. This allows the user to terminate the cursor read by either a mouse click (which generates an 'A' character) or by pressing a key on the keyboard.
File format By using the print command, in the main menu, you can send the contents of the current window to a file. This file can then be printed on any PostScript printer.
Obtaining hardcopy If you click on the print item in the main menu, then the standard NeXT print panel comes up. This allows the contents of the current window to be sent to a printer, disk file or previewer.
References 1. Adobe Systems, Inc.: PostScript Language Reference Manual. Addison-
Wesley, Reading, Massachusetts, 1985. 2. Adobe Systems, Inc.: PostScript Language Tutorial and Cookbook. Addison-
Wesley, Reading, Massachusetts, 1985. 3. Adobe Systems, Inc.: PostScript Language Reference Manual, Second
Edition. Addison-Wesley, Reading, Massachusetts, 1990. 4. Adobe Systems, Inc.: Programming the Display PostScript System with

NeXTstep. Addison-Wesley, Reading, Massachusetts, 1992. Author
A. F. Tennant, 1992.

Acorn Archimedes
This driver will cause the system to leave the Desktop, but leave the screen mode provided it has the normal 16 colours.
This routine must be compiled with Fortran release 2, and linked with the Fortran Friends graphics and utils libraries.
Resolution: Depends on graphics mode. Ensure that the current mode is suitable before running the PGPLOT program.

MS-DOS Machines
Supported device IBM PCs and compatibles running Microsoft Fortran 5.0. This driver will put the display into graphics mode. To avoid `erasing' the screen when the program exits, the display will be left in graphics mode. Therefore, you will need some other program to restore to the display to a (faster) text mode.
Device type code /MSOFT.
Default device name none (the device name, if specified, is ignored).
Default view surface dimensions depends on monitor, typical 7 x 10 inches.
Resolution Depends on graphics card. Tested with a 640 x 300 EGA card. Driver should work with other graphics cards, however, expect to tweak it a bit.
Color capability Color indices 0--15 are accepted. This version maps the PGPLOT color indices into the IBM color indices with the default color most closely corresponds to the PGPLOT default color. Thus, PGPLOT index 2 (red) maps to IBM index 12 (light red).
Input capability ?
Author A. F. Tennant.

MS-DOS machines running Lahey F77 32-bit FORTRAN
This PGPLOT driver is for IBM PC's and clones running MS-DOS and Lahey F77 32-bit Fortran v5.0. The driver will put the display into graphics mode, and calls to `close' the workstation (PGEND) will set it back into the previous mode (generally erasing the display, so don't do it until you are really finished).
This routine must be compiled and linked with the Lahey graphics library GRAPH3 supplied with Lahey Fortran v4.0 or greater.
Supported device IBM PC's and compatibles.
Device type code /LH
Default device name None (the device name, if specified, is ignored).
Default view surface dimensions Depends on monitor, typically 7x10 inches.
Resolution Depends on graphics card. Tested with a 640x480 VGA card. Driver should work with other graphics cards.
Color capability Color indices 0-15 are accepted. The PGPLOT color indices are mapped into the IBM color indices for with the default color most closely corresponds to the PGPLOT default color. Thus, PGPLOT index 2 (red) maps to IBM index 12 (light red).
Input capability Graphics cursor implemented using Microsoft Mouse or compatible, accessed through DOS calls.
File format None.

Tektronix Terminals and Emulators
Supported device 1. Tektronix 4006/4010 storage-tube terminal; can be used with emulators,
but the options below take advantage of features not present in the basic Tektronix terminal.
2. GraphOn Corporation 200-series terminals. These emulate a Tektronix-4010 with enhancements (selective erase, rectangle fill, switch between Tek and VT100 modes).
3. Digital Engineering, Inc., Retrographics modified VT100 terminal (VT640).
4. IRAF GTERM Tektronix terminal emulator, with color extensions. 5. Xterm window on an X-window server. Emulates a Tektronix-4014,
with extensions (switch between Tek and VT100 windows). 6. ZSTEM 240 and ZSTEM 4014 terminal emulators for the IBM PC and
clones. ZSTEM supports Tektronix 4014 emulation and the 4105 color escape sequences. ZSTEM can be obtained from: KEA Systems Ltd., 2150 West Broadway, Suite 412, Vancouver, British Columbia, Canada, V6K 4L9.
7. Visual-603 and 630 terminals. These are VT100/220 compatible terminals with Tektronix 4010/4014 emulation (Visual Technology Incorporated, 1703 Middlesex Street, Lowell, Mass 01851). The Visual 630 has the capability of displaying dual text and graphics. This feature is not used in this driver. Graphics mode is entered automatically when the graph is drawn but only exited when PGPAGE or PGEND is called. Therefore, for multiple plots interspersed with text I/O, use PGPAGE at the end of each plot. This will prompt for a carriage return before switching. If this is not done, intervening text will appear on the graphics screen. Graphics mode can be entered and exited from the setup menu, or by SHIFT-PF1. Graphics extensions include rectangle fill, selective erase and switch between Tek and VT100 modes.
8. IBM PC's and compatibles running MS-Kermit 3 as a terminal emulator. The video board is assumed to have sufficient memory to retain the graphics image in memory when switched to text. This will be true for VGA and EGA, but some early PCs might not be able to do this. If Kermit is using full VGA resolution (ie SET TERMINAL GRAPHICS VGA), there is not usually enough memory to store the full 480 vertical lines, so the bottom few lines may disappear. Tektronix enhancements include selective erase, colours, rectangle fill, and switching between text and graphics mode. The cursor may be operated with the mouse. Tested with Kermit version 3.1.
9. Tektronix 4100 series color terminals (and emulators, e.g., Versaterm-PRO for Macintosh).

Device type codes 1. /TEK4010 Tektronix-4010 terminal 2. /GF GraphOn terminal 3. /RETRO Retrographics VT640 terminal 4. /GTERM GTERM terminal emulator 5. /XTERM XTERM terminal emulator 6. /ZSTEM ZSTEM terminal emulator 7. /V603 Visual V603 terminal 8. /KRM3 Kermit 3 on IBM-PC 9. /TK4100 Tektronix 4100 series terminals
Default device name The logged-in terminal: /dev/tty (UNIX), TT: (VMS).
Default view surface dimensions Depends on monitor; nominally 8in (horizontal) by 6in (vertical).
Resolution A standard Tektronix terminal displays a screen of 1024 pixels (horizontal) by 780 pixels (vertical), with a nominal resolution of 130 pixels per inch. The actual resolution may be less.
Color capability ❍ /TEK4010, /XTERM: none; only color index 1 is available; selective
erase is not possible. Requests to draw in color index 0 are ignored. ❍ /GF, /RETRO, /V603: color indices 0 (erase, black) and 1 (bright:
usually white, green or amber) are supported. It is not possible to change color representation.
❍ /GTERM: color indices 0 to 15 are available and default to the standard PGPLOT colors. The color representation can be changed.
❍ /ZSTEM: color indices 0 to 7 are available and default to the indicated in the ZSTEM setup menu (which default to the standard PGPLOT colors). The color representation cannot be changed.
❍ /KRM3: color indices 0 to 7 are the standard PGPLOT colors. Indices 8 to 14 are also available, but are BRIGHT versions of 1 to 7, and thus non-standard. Color representation can't be changed.
❍ /TK4100: color indices 0-15. Input capability
Depending on the emulation, the graphics cursor may be a pointer, a small cross, or a crosshair across the entire screen. The user positions the cursor using thumbwheels, mouse, trackball, or the arrow keys on the keyboard. The user indicates that the cursor has been positioned by typing any printable ASCII character on the keyboard. Most control characters (eg, ^C) are intercepted by the operating system and cannot be used.
File format Binary byte stream. Under Unix, the output may be directed to a file; under VMS, this is not possible: the output device must be a terminal.
Tektronix-4014 Disk File
Supported device disk file which may be printable on a Tektronix-compatible device. This driver uses the extended (12-bit) addressing of the Tektronix-4014. (This driver is for VMS systems; on Unix systems the regular Tektronix driver (/TEK) can produce a disk file.)
Device type code /TFILE.
Default device name PGPLOT.TFPLOT.
Default view surface dimension Depends on printer; nominally 400 pixels/inch giving 10.24 in (horizontal) x 7.80 in (vertical).
Resolution The coordinate system used for Tektronix emulation is 4096 x 3120 pixels.
Color capability Only color index 1 is supported. Primitives drawn in `erase' mode (color index 0) are ignored (not erased). It is not possible to change color representation.
Input capability None.
File format Binary, variable length records (maximum 1024 bytes); no carriage-control attribute.
Obtaining hardcopy depends on the available printer. Note: the file cannot easily be displayed on a Tektronix-compatible terminal because it contains control characters which may be interpreted by the operating system. The terminal must be set to PASSALL mode before the file can be displayed.
Author T. J. Pearson, 1987; Darvid R. Chang, 1995.

GOC (Sigma) Terminal
Supported device Sigma, T5670 terminal.
Device type code /GOC.
Default file name TT (logical name, usually equivalent to the logged in terminal).
Default view surface dimensions 38 cm display.
Resolution The full view surface is 768 by 512 pixels.
Color capability Color indices 0 (erase) and 1 are supported.
Input capability Cursor is a cross-hair and can be moved using the joystick or the cursor keys to the left of the keyboard. Terminate cursor motion and send the cursor position to the program by typing any printable character on the keyboard.
File format It is not possible to send GOC plots to a disk file.
Obtaining hardcopy A hardcopy of the plot may be obtained using a Tektronix hardcopy unit attached to the terminal.
Author Allyn F. Tennant, 1986.

DEC Regis Terminals
Author T. J. Pearson, 1988.
Supported devices Digital Equipment Corporation VT125, VT240, or VT241 terminal; other REGIS devices may also work.
Device type code /VT125.
Default file name TT:PGPLOT.VTPLOT. This usually means the terminal you are logged in to (logical name TT), but the plot can be sent to another terminal by giving the device name, e.g., TTC0:/VT, or it can be saved in a file by specifying a file name (in this case a disk name must be included as part of the file name).
Default view surface dimensions Depends on monitor.
Resolution The default view surface is 768 (horizontal) by 460 (vertical) pixels. On most Regis devices, the resolution is degraded in the vertical direction giving only 230 distinguishable raster lines. (There are actually 240 raster lines, but 10 are reserved for a line of text.)
Color capability Color indices 0--3 are supported. By default, color index 0 is black (the background color). Color indices 1--3 are white, red, and green on color monitors, or white, dark grey, and light grey on monochrome monitors. The color representation of all the color indices can be changed, although only a finite number of different colors can be obtained (see the manual for the terminal).
Input capability The graphics cursor is a blinking diamond-crosshair. The user positions the cursor using the arrow keys and PF1--PF4 keys on his keyboard [Note: NOT the keyboard of the terminal on which he is plotting, if that is different.] The arrow keys move the cursor in the appropriate direction; the size of the step for each keystroke is controlled by the PF1--PF4 keys: PF1 = 1 pixel, PF2 = 4 pixels, PF3 = 16 pixels, PF4 = 64 pixels. [The VT240 terminal has a built-in capability to position the cursor, but PGPLOT does not use this as it is not available on the VT125.] The user indicates that the cursor has been positioned by typing any character other than an arrow or PF1--PF4 key [control characters, eg, ctrl-C, and other special characters should be avoided, as they may be intercepted by the operating system].
File format A REGIS plot file is formatted in records of 80 characters or less, and has no carriage-control attributes. The records are grouped into ``buffers,'' each of which begins with a command to put the terminal into graphics mode and ends

with a command to put it back into text mode. The terminal is in graphics mode only while a buffer is being transmitted, so a user's program can write to the terminal at any time (in text mode) without worrying if it might be in graphics mode.
Obtaining hardcopy A hardcopy of the plot can be obtained using a printer attached to the VT125/VT240 terminal (see the instruction manual for the terminal). A plot stored in disk file can be displayed by issuing a TYPE command (e.g., TYPE PGPLOT.VTPLOT) on a VT125 or VT240.
Canon Laser Printer
Supported device Canon LBP-8/A2 Laser printer. Conforms to ISO 646, 2022, 2375 and 6429 specifications. VDM (graphics) conforms to proposed American National Standard VDM mode.
Device type code /CAnon or /BCAnon (landscape mode); /VCAnon (portrait mode). Device type /CANON or /VCANON uses vector instructions for printing, while type /BCANON produces a bitmap. The default bitmap size is 1556 blocks and takes 5 min (parallel) or 15 min (serial 9600 baud) to print. Thus for simple line graphs /CANON produces much smaller files (typically <100 blocks) that that plot in <30 sec. However, for complex graphs, for example those obtained with PGGRAY, /BCANON will produce the smaller file and plot faster.
Default file name PGPLOT.CAN.
Default view surface dimensions 24 cm by 19 cm (landscape); 19 cm by 24 cm (portrait).
Resolution 300 pixels per inch in both directions.
Color capability Color indices 0 (erase) and 1 (black) are supported. Note: hardware polygon fill is used and colors 0--11 control the fill pattern.
Input capability None.
File format Variable length records with Carriage control of LIST.
Obtaining hardcopy If printer is connected to a terminal line (RS-232 option) then printing the file on the corresponding queue should suffice. If the printer is connected using the Centronics interface, which appears the to VAX as an LP device, then it is important to ensure that (1) all 8 bit characters are passed to the printer (2) lines longer than 132 bytes are not truncated, and (3) no extra formatting commands (e.g. form-feeds) are sent to the printer. This can be done with the VMS command:
$ SET PRINT/PASSALL/LOWER/CR device
Note, some interface boards have a option to append a carriage return after a formfeed or LF character, it is suggested that this be disabled. The file should be printed with the /PASSALL qualifier i.e.,
$ PRINT/PASSALL filename
Note: SET PRINT/PASSALL and PRINT/PASSALL do not do the same things and hence PASSALL is required in both locations.
Author Allyn F. Tennant, 1988; Martin Shepherd, 1991.

Canon LaserShot printer (LIPS2/2+)
Supported device Canon LaserShot (LIPS2/2+). Conforms to ISO646, 2022, 2375 and 6429 specifications. VDM (graphics) conforms to proposed American National Standard VDM mode.
Device type code /LIPS2 (landscape), /VLIPS2 (portrait).
Default file name PGPLOT.LPS
Default view surface dimensions 23 cm by 18 cm (landcsape), 18 cm by 23 cm (portrait).
Resolution 240 pixels per inch in both directions.
Color capability Color indices 0 (erase) and 1 (black) are supported. Note: hardware polygon fill is used and colors 0-11 control the fill pattern.
Input capability None.
File format Variable length text records.
Obtaining hardcopy Use lpr (unix) or print (dos) command.
Author M. Hamabe, 1994.

DEC LJ250 Color Companion Printer
Supported device DEC LJ250 Color Companion printer.
Device type code /CCP (portrait) or /CCL (landscape). Note: To choose portrait mode, you must execute a DCL command of the following form before executing your program:
$ DEFINE PGPLOT_CC_MODE PORTRAIT
Default device name PGPLOT.CCPLT.
Default view surface dimensions 8.0 inches by 10.5 inches.
Resolution 90 dots/inch.
Color capability Color indices 0--15 are supported. It is not (yet) possible to change color representation.
Input capability None.
File format DEC color sixel format.
Obtaining hardcopy Use the VMS PRINT command.
Author S. C. Allendorf, 1989.

DEC Sixel Printers (LA50)
Supported device DEC LA50 printer; may also work on LA100 or LN03.
Device type code /LA50.
Default device name LA50:PGPLOT.LAPLOT.
Default view surface dimensions 9.5 in (horizontal) by 6 in (vertical).
Resolution 72 (x) by 144 (y) pixels/inch.
Color capability Color indices 0 (erase, white) and 1 (black) are supported. It is not possible to change color representation.
Input capability None.
File format Variable-length records, with list carriage-control, maximum 80 bytes.
Obtaining hardcopy If the LA50 is connected to the user's VT2xx or VT3xx terminal then the printer can be accessed by sending the file directly to the terminal: use PGPLOT device TT:/LA50 or DEFINE PGPLOT_LA50 TT: (be sure to do a SET TERM/FORM if page spacing is important). If the LA50 is attached to a different terminal port, e.g., TXZ99:, which preferably has been set spooled, use PGPLOT device TXZ99:/LA50 or DEFINE PGPLOT_LA50 TXZ99:.
Author B. H. Toby, 1988.
DEC LN03 Laser Printer
Supported device the LN03-PLUS Laser Printer.
Device type code /LN03 (landscape orientation); /LVN03 (portrait).
Author Sid Penstone, 1989.

EPSON FX100 Dot Matrix Printer (EPDRIV)
Author PSB, 1987; AFT, 1988.

Genicom Printer
Supported device Genicom 4410 dot-matrix printer.
Device type code /GENICOM (landscape); /VGENICOM (portrait).
Default device name PGPLOT.PRPLOT.
Default view surface dimensions Landscape: 10.25 in (horizontal) by 7.8 in (vertical). Portrait: 7.8 in (horizontal) by 10.25 in (vertical).
Resolution 144 (x) x 140 (y) pixels/inch (reversed for portrait mode).
Color capability Color indices 0 (erase, white) and 1 (black) are supported. It is not possible to change color representation.
Input capability None.
File format Variable-length records, maximum 197 bytes, with embedded carriage-control characters. A full-page plot occupies 600 512-byte blocks.
Obtaining hardcopy Use the command PRINT/PASSALL.
Author J. H. Trice, 1990.

Hewlett-Packard Deskjet or Laserjet
Supported device Hewlett-Packard LaserJet, LaserJet+, or LaserJet II. DeskJet, DeskJet Plus, DeskJet 500.
Device type code /HJ.
Default device name PGPLOT.HJPLT.
Default view surface dimensions Depends on which driver settings are chosen, via environment variables PGPLOT_HJ_MODE, PGPLOT_HJ_MAR, PGPLOT_HJ_SIZE, and PGPLOT_HJ_PAGE.
Resolution Depends on which driver settings are chosen, via logical names PGPLOT_HJ_MODE or PGPLOT_HJ_RES.
Color capability Color indices 0 (erase, white) and 1 (black) are supported. It is not possible to change color representation.
Input capability None.
File format See the LaserJet andDeskJet Printer Technical Reference Manuals for details of the file format.
Obtaining hardcopy VMS: use the command PRINT/PASSALL.
Environment variables use DEFINE in VMS, setenv in Unix to define the following environment variables or logical names. PGPLOT_HJ_MODE = xxxx where xxxx is one of the entries in the following table. PHOT puts out bitmaps suitable for inclusion in TeX output if you are using the Arbortext DVIHP program. The only options that will work with unexpanded LaserJet are HJ08 and HJ09. The other seven options require a LaserJet Plus or LaserJet II. Do NOT attempt to send grayscale plots to the drivers that use the optimized bitmap dumps. Terrible things will happen.
Option Equiv Size (H x V) Resolution ------ ----- --------------------- ---------- HJ01 LHOR 10.25 by 8.00 inches 300 DPI HJ02 PHOR 8.00 by 10.25 inches 300 DPI HJ03 PHOT 8.00 by 10.25 inches 300 DPI HJ04 LHBR 6.54 by 4.91 inches 300 DPI HJ05 PHBS 5.65 by 5.65 inches 300 DPI HJ06 LMBR 10.25 by 8.00 inches 150 DPI
HJ07 PMBR 8.00 by 10.25 inches 150 DPI HJ08 PMBS 4.48 by 4.48 inches 150 DPI HJ09 PLBS 6.00 by 6.00 inches 100 DPI
The following logical names will override the PGPLOT_HJ_MODE settings, if used. PGPLOT_HJ_RES =
H or HIGH for 300 bpi M or MEDIUM for 150 bpi L or LOW for 100 bpi V or VERYLOW for 75 bpi
PGPLOT_HJ_MAR = ``xx.xx,yy.yy'' where ``xx.xx'' and ``yy.yy'' are the vertical and horizontal margin dimensions in inches. The number of characters, including spaces preceding and following the comma, should not exceed five. PGPLOT_HJ_SIZE = ``xx.xx,yy.yy'' where ``xx.xx'' and ``yy.yy''are the vertical and horizontal plot dimensions in inches. The number of characters, including spaces preceding and following the comma, should not exceed five. PGPLOT_HJ_TEX: if this is defined with any value, TeX mode (see above) will be used. PGPLOT_HJ_NOFF: if this is defined with any value, the form feed needed to eject the final page will be omitted. This is useful for spooled printers -- it prevents wasted (blank) pages. PGPLOT_HJ_PAGE = L (or LANDSCAPE) for Landscape mode, P (or PORTRAIT) for Portrait mode. PGPLOT_HJ_OPT = O (or OPTIMIZE) so that bitmap will be ``optimize,'' pr C (or COMPRESS) so that bitmap will be ``compressed.'' Optimized mode minimizes the memory usage for the LaserJet devices. This sometimes leads to a larger file than if optimization is not used. Optimized mode may not be used with the DeskJet devices. Compressed mode decreases the size of the bitmap file for later model HP devices, particularly the DeskJet devices.
Author S. C. Allendorf, 1989; B. H. Toby, 1991.

Hewlett-Packard LaserJet Printer
Author S. C. Allendorf, 1989.
Supported device Hewlett Packard LaserJet, LaserJet+, or LaserJet II.
Device type code /LJnn where nn is a number 01--09.
Default device name PGPLOT.LJPLT.
Default view surface dimensions Depends on which version of the driver is chosen via the logical name PGPLOT_LJ_MODE.
Driver Equivalence Size (H x V) ------ ----------- --------------------- LJ01 LHOR 10.50 by 8.00 inches LJ02 PHOR 8.00 by 10.50 inches LJ03 PHOT 8.00 by 10.50 inches LJ04 LHBR 6.54 by 4.91 inches LJ05 PHBS 5.65 by 5.65 inches LJ06 LMBR 10.50 by 8.00 inches LJ07 PMBR 8.00 by 10.50 inches LJ08 PMBS 4.48 by 4.48 inches LJ09 PLBS 6.00 by 6.00 inches
Resolution Depends on which version of the driver is chosen via the logical name PGPLOT_LJ_MODE.
Driver Equivalence Resolution ------ ----------- ---------- LJ01 LHOR 300 DPI LJ02 PHOR 300 DPI LJ03 PHOT 300 DPI LJ04 LHBR 300 DPI LJ05 PHBS 300 DPI LJ06 LMBR 150 DPI LJ07 PMBR 150 DPI LJ08 PMBS 150 DPI LJ09 PLBS 100 DPI
Color capability

Color indices 0 (erase, white) and 1 (black) are supported. It is not possible to change color representation.
Input capability None. To choose one of the specific LaserJet drivers, you must execute a DCL command of the following form before executing your program:
$ DEFINE PGPLOT_LJ_MODE LJnn
where nn is a number 01--09 NDEV inclusive. You may also use one of the equivalent names listed above. These equivalent names are an attempt to make the driver names make sense. They are decoded as follows: 1st character: P for protrait orientation or L for landscape orientation. 2nd character: H for high resolution (300 dpi) or M for medium resolution (150 dpi) or L for low resolution (100 dpi). 3rd character: B for a straight bitmap dump or O for an optimized bitmap dump. 4th character: R for a rectangular view surface or S for a square view surface. A few notes are in order. First, not all of the possible combinations above are supported (currently). The driver that goes by the name of PHOT is a driver that puts out bitmaps suitable for inclusion in TeX output if you are using the Arbortext DVIHP program. The only drivers that will work with unexpanded LaserJet are LJ08 and LJ09. The other seven drivers require a LaserJet Plus or LaserJet II. Finally, do NOT attempt to send grayscale plots to the drivers that use the optimized bitmap dumps. Terrible things will happen.

Printronix Printers
Supported device Printronix P300 or P600 dot-matrix printer.
Device type code /PRINTRONIX.
Default device name PGPLOT.PXPLOT.
Default view surface dimensions 13.2 in (horizontal) by 10.25 in (vertical).
Resolution 60 (x) x 72 (y) pixels/inch.
Color capability Color indices 0 (erase, white) and 1 (black) are supported. It is not possible to change color representation.
Input capability None.
File format Variable-length records, maximum 135 bytes, with embedded carriage-control characters. A full-page plot occupies 200 512-byte blocks.
Obtaining hardcopy (VMS) Use the command PRINT/PASSALL.
Author T. J. Pearson, 1987.
QUIC Printers
Supported device Any printer that accepts the QUIC page description language (QMS and Talaris 800/1200/1500/2400). 4-bit mode is used.
Device type code /QMS (landscape orientation); /VQMS (portrait orientation).
Default file name PGPLOT.QMPLOT, PGPLOT.QPPLOT.
Default view surface dimensions 10.25 inches horizontal by 7.75 inches vertical (landscape mode); 7.75 inches vertical by 10.25 inches horizontal (portrait mode); margins of 0.5 inches on top and left of page.
Resolution The driver uses coordinate increments of 1/1000 inch. The true resolution is device-dependent; it is typically 300 dots per inch.
Color capability Color indices 0 (erase), and 1 (black) are supported. Requests for other color indices are converted to 1. It is not possible to change color representation.
Input capability None.
File format ASCII text, variable length records (max 130 bytes).
Obtaining hardcopy (VMS) PRINT/QUEUE=QMS file.type (site-dependent).
Author P. P. Murphy, 1987.

Talaris EXCL Devices
Supported device Any Talaris printer that accepts the EXCL page description language. 7-bit mode is used.
Device type code /EXCL (landscape orientation); /VEXCL (portrait orientation).
Default file name PGPLOT.EXPLOT.
Default view surface dimensions 10.25 inches horizontal by 7.75 inches vertical (landscape mode); 7.75 inches horizontal by 10.25 inches vertical (portrait mode).
Resolution The driver uses coordinate increments of 1/1000 inch. The true resolution is device-dependent; at time of writing, it is typically 300 dots per inch.
Color capability Color indices 0 (erase), and 1 (black) are supported. Requests for other color indices are converted to 1. It is not possible to change color representation.
Input capability None.
File format Ascii, variable length records (max 80 bytes).
Author A. L. Fey, 1989; P. J. Scott, 1989.
Toshiba ``3-in-one'' Printer (TODRIV)
Author T. J. Pearson, 1987.
Supported device Toshiba ``3-in-one'' printer, model P351.
Device type code /TOSHIBA.
Default device name PGPLOT.TOPLOT.
Default view surface dimensions 10.5 in (horizontal) by 8.0 in (vertical).
Resolution 180 pixels/inch.
Color capability Color indices 0 (erase, white) and 1 (black) are supported. It is not possible to change color representation.
Input capability None.
File format Variable-length records, maximum 132 bytes, with embedded carriage-control characters. A full-page plot occupies 901 512-byte blocks.
Obtaining hardcopy (VMS) Use the command PRINT/PASSALL.

Colorwriter 6320 Plotter
Supported device Gould (now Bryans) Colourwriter 6320 or any device obeying Gould Plotter Language.
Device type code /CW6320.
Default device name $PLOTTER1 (a logical name).
Default view surface dimensions 280 mm by 360 mm (A3).
Resolution 0.025 mm.
Color capability Up to 10 pens. Default is pen 1 which is picked up on initialization without a call to PGSCI. Calls to PGSCI are interpreted as the pen number and colors therefore depend on how the pens have been loaded into the stalls. If a call is made for a pen higher than 10 the selected pen defaults to 1.
Input capability Possible but not supported.
File format Ascii character strings. It is possible to send the data to a file which can then be copied to the plotter or on a terminal.
Author Len Pointon (Jodrell Bank), 1988.

Hewlett-Packard HP-GL/2 Plotters
HP-GL (Hewlett-Packard Graphics Language) is a vector-graphics format for control of pen-plotters and laser-printers manufactured by Hewlett-Packard Co., and some other manufacturers. This PGPLOT device handler produces files that should be acceptable to most HP-GL/2 devices, specifically the HP LaserJet 3.
Device type code /HPGL2.
Default file name pgplot.hpplot
Default view surface dimensions 8128 by 10160 pixels (8.00 by 10.0 inches).
Resolution The nominal resolution is 1016 pixels/inch, but the actual resolution will vary depending on the display device.
Color capability Color indices 1--6 are accepted, and are interpreted as pen numbers.
Input capability None.
Author Colin J. Lonsdale, 1990.

Hewlett Packard HP 7221 pen plotter
Device type code /HP7221
Default file name pgplot.hpplot

Houston Instruments HIDMP Pen Plotter (HIDRIV)
Supported device Houston Instruments pen plotters implementing the HIDMP control commands.
Device type code /HIDMP.
Default device name pgplot.hiplot.
Default view surface dimensions 2099 × 1599 ``pixels'' (10.5 × 8 inches).
Resolution The nominal resolution is 200 pixels per inch; the actual resolution depends on the pen used.
Color capability Only color index 1 is supported; erase in color index 0 is not possible. The color is determined by the pen installed on the plotter.
Input capability None.
File format ASCII text.
Author T. J. Pearson, 1987.

ZETA Plotter (ZEDRIV)
Supported device Zeta 8 Digital Plotter.
Device type code /ZEta.
Default file name PGPLOT.ZET.
Default view surface dimensions 11 inches by 11 inches. Current version does not allow larger plots although the manual indicates plots up to 144 feet are possible.
Resolution This version is written for the case where the resolution switch is set to 0.025 mm. Actual resolution depends on thickness of pen tip.
Color capability Color indices 1 to 8 are supported corresponding to pens 1--8. It is not possible to erase lines.
Input capability None.
File format Variable length records.
Obtaining hardcopy On Starlink print the file on the queue associated with the Zeta plotter. If the Plotter is attached to a terminal line, then TYPEing the file at the terminal will produce a plot. On Starlink:
$ PRINT/NOFEED/QUE=ZETA PGPLOT.ZET
To stop a Zeta plot job, once it has been started, use the buttons on the plotter. Press PAUSE, NEXT PLOT and CLEAR. Only after this sequence is it safe to delete the job from the ZETA Queue. Failing to press the NEXT PLOT button will not correctly advance the paper. Failing to press CLEAR but, deleteing the current job can prevent the following plot from being plotted.
Author Allyn F. Tennant, 1986.

Null Device (no graphical output)
The ``null'' device can be used to suppress all graphic output from a program.
Device type code /NULL.
Default device name None (the device name, if specified, is ignored).
Default view surface dimensions Undefined (the device pretends to be a hardcopy device with 1000 pixels/inch and a view surface 8in high by 10.5in wide.)
Resolution Undefined.
Color capability Color indices 0--255 are accepted.
Input capability None.
Environment variables PGPLOT_DEBUG : if this environment variable is defined, with any value, some statistics are reported on standard output.
Author T. J. Pearson, 1988--1994.
PGPLOT metafile driver
Beta-test version released with PGPLOT v5.2.0
Author T. J. Pearson, 1997.
Supported device This PGPLOT driver creates a disk file in the private PGPLOT metafile format. [Do not confuse this format with other formats, such as the Windows Metafile format.]Files in this format can be read into a PGPLOT program with subroutine pgrdmf and displayed on another PGPLOT device.
The device driver is written in standard Fortran-77 and can be used with all operating systems for which PGPLOT is available.
The PGPLOT metafile is a plain ASCII text file; it can be transferred from one machine to another using standard channels (e.g., ftp, e-mail). The first five characters in the file must be %PGMF to identify the file type. PGPLOT metafiles can contain more than one picture (``page''). PGPLOT metafiles may be concatenated: the resulting file is also a valid PGPLOT metafile. Files can be substantially compressed by using standard utilities such as gzip.
It should be fairly easy to write translation programs to convert files from this format to another graphics format.
Device specification filename/PGMF -/PGMF
Supply any file name suitable for use on the host operating system. The default file name is pgplot.pgmf. If the file already exists, it will be overwritten (unless the operating system can create multiple versions of the file).
If the filename is ``-'', the file will be sent to the standard output and can be piped into another program (on operating systems that support this).
Default view surface dimensions The default view surface is 6400×4800 units, with a nominal scale and resolution of 1000 units per inch (about 40 units per mm). The actual scale can be changed when the metafile is displayed. The default can be overridden by calling pgpap in the PGPLOT program, or, if pgpap is not used, by setting

environment variables (logical names in VMS): ❍ PGPLOT_PGMF_WIDTH (default 6400) ❍ PGPLOT_PGMF_HEIGHT (default 4800)
These variables specify width and height in metafile units.
Color capability Color indices 0-255 are available; color indices 0-15 have the standard PGPLOT default color representations, with white background (color index 0) and black foreground (color index 1). The RGB representation of any color index can be changed by calling pgscr. The default representations of color indices 0 and 1 can be changed with PGPLOT environment variables, e.g.
❍ PGPLOT_BACKGROUND (default white) ❍ PGPLOT_FOREGROUND (default black)
Input capability None (non-interactive device).
Limitations 1. Only one PGPLOT device of this type may be opened at once. 2. The driver does not yet support the image functions (routines pgimag, pggray, etc.).

TeX PK Font file
Supported device PK Font files for TeX.
Device type code /TX
Default file names pgplot.RESpk, pgplot.tfm where the RES is a default value of 300 but may be set to something else. If RES=300, then the default file names would be pgplot.300pk and pgplot.tfm. If more than 15 font characters are produced, then the file names become pgplot_2.300pk and pgplot_2.tfm, etc., for each set of 15 characters output (i.e., for each PK font produced).
Default view surface dimensions 2.8 x 2.8 inches. May be overridden by the environment variables PGPLOT_TX_YINCHES, and PGPLOT_TX_XINCHES
$DEFINE PGPLOT_TX_XINCHES "5.0" $DEFINE PGPLOT_TX_YINCHES "4.5"
would provide a view surface of 5.0 inches horizontally by 4.5 inches vertically.
Resolution 300 dots per inch. May be overridden by the logicals PGPLOT_TX_XRESOL and PGPLOT_TX_YRESOL:
$DEFINE PGPLOT_TX_XRESOL "78.0" $DEFINE PGPLOT_TX_YRESOL "78.0"
will produce a font at 78 dots per inch resolution. This would be good for a Vaxstation 2000 workstation. The default 300 dots per inch is good for a laser printer such as a QMS1200 LaserGrafix or an HP2000 LaserJet.
Color capability Color indices 0 (erase, white) and 1 (black) are supported. It is not possible to change color representation.
Output Orientation Portrait. (Can be overridden by setting the environment variable PGPLOT_TX_ORIENT = LANDSCAPE.)
Input capability None.
File formats TeX PK Font file format, and TeX TFM file format. The files are output as FORTRAN, DIRECT ACCESS, UNFORMATTED, 512 BYTE RECORDS so that we can have compatability with the VAX and our UNIX machine. A raw

bitmap copy is also possible if you define the logical PGPLOT_TX_BITFILE:
$ DEFINE PGPLOT_TX_BITFILE "MINIMAL"
will produce a file copy of the portion of the bitmap which is within the minimal bounding box of the character.
$ DEFINE PGPLOT_TX_BITFILE "ALL"
will produce a file copy of the complete bitmap of the graphics character. Obtaining hardcopy
Use the command DUMP to view the output files, or run TeX and include the character of this new font and DVI the output and print the resulting binary file to the correct printer (with PASSALL, NOFEED, or whatever is required for printing binary output to your specific printer). Also, the PKTYPE and TFTOPL TeX debugging programs will allow you to view your output font characteristics.
TeX Example Assume you have produced a graph into a PK Font and that the output file names are pgplot.300pk and pgplot.tfm then the following lines in your TeX code would include the graph corresponding to the letter A of the TeX PK font "PGPLOT" in the middle of your paper:
\font\myfntname=pgplot This is sentence one of the TeX file. Now I will include the character. \centerline{\myfntname A } This is the last sentence. \bye
The above example for LaTeX would be:
This is the first sentence. Now I will include the character as a figure. \begin{figure} \newfont{\myfntname}{pgplot} \centerline{\myfntname A} \caption{Letter A of PGPLOT font} \end{figure} This is the last sentence.

Of course, you must tell TeX and the DVI driver where to find your fonts. On our VAX, we have defined a search list so that if you define the logical TEX_USER_FONTS to be your directory where you keep your fonts, then TeX and the DVI driver will find the pgplot.tfm file and the pgplot.300pk file. So,
$DEFINE TEX_USER_FONTS SYS$USERDISK:[USERNAME.FONTS]
would cause TeX and the DVI driver to search the normal search path and also the directory SYS$USERDISK:[USERNAME.FONTS] for any fonts that you specified in your TeX file. (Here is an exception for UNIX. Our UNIX TeX and DVI programs will look in your current directory automatically for the fonts and then will check the system library if it cannot find the fonts in your directory.)
Notes You must change the resolution for different output devices (our DVI driver, DVIHP, for our HP2000 LaserJet would use a resolution of 300 dots per inch; while our DVI driver for the Vaxstation 2000 workstation would need a resolution of 78 dots per inch. The pgplot.tfm file would of course be the same in both cases, but the DVI drivers would look for pgplot.300pk and pgplot.78pk respectively). If you produce an image which is too large (by defining logicals PGPLOT_TX_XINCHES and PGPLOT_TX_YINCHES) then some DVI drivers will leave the page blank where the graph of the character belongs (can sometimes use \hsize and \vsize to help with this). Finally, if your device driver only works with PXL files (like our PRINTRONIX DVI driver), then you may want to run the PKTOPX program to convert the PK Font into a PXL Font which your device driver needs.
Author Bob Forrest, Electrical Engineering Dept., Texas A&M University; College Station,Texas 77843 ([email protected]).
LaTeX Picture Environment
Supported device This driver creates a text file containing commands for drawing in the LaTeX picture environment, bracketted by \begin{picture} and \end{picture}. The file can be included in a LaTeX document.
If you have the option of including a PostScript file in your LaTeX document, then that will usually give much better results than using this driver, which has very limited capabilities.
Device type code /LATEX
Default file name pgplot.tex
Default view surface dimensions The default picture size is 6 inches by 6 inches (which corresponds to 1728×1728 units where a unit is 0.25pt = 1/288 inch). The picture size can be changed by using PGPAP in the PGPLOT program.
Resolution The driver rounds coordinates to multiples of 0.25pt (1/288 inch).
Color capability None.
Obtaining hardcopy Embed the file in a LaTeX document and use the normal LaTeX tools to process it, e.g.,
\documentstyle{article}\begin{document}\input pgplot.tex\end{document}
Limitations The LaTeX picture environment has a very limited set of primitives. In particular, diagonal lines must be composed out of dots. This can lead to very large files. For some graphs (especially with a lot of shaded areas), the capacity of many LaTeX systems can easily be exceeded.

Author Originally written by Grant McIntosh ([email protected]), February 1995.

X Motif widget driver
Author M. C. Shepherd, 1996.
Supported device Restricted to Motif applications on workstations running the X Window System (Version 11 Release 4 and above).
Availability Released as a beta-test driver in PGPLOT 5.1.0. Updated for general use in PGPLOT 5.2.0. See the changes section for
revision details.
Device type code /XMOTIF
Device name specification The device name used to refer to an already created and realized XmPgplot widget is the name that was given to the widget as the first argument of XtVaCreateManagedWidget() when the widget was created. The full device specification used to open a given widget to PGPLOT with cpgbeg() or
cpgopen() can also be obtained through the xmp_device_name() convenience
function.
Default view surface dimensions By default the size of an XmPgplot widget window is 256×256 pixels. This can be overridden by setting the XmNheight and XmNwidth X resources when creating the widget.
Resolution This depends on the monitor on which the windows are to be displayed.
Color capability Colormaps of types PseudoColor, StaticColor, GrayScale, StaticGray, and TrueColor are supported. By default, colors are allocated from the colormap used by the parent window of the widget, unless it has too few colors, in which case the window uses the black and white pixels of the screen to implement a monochrome window.
Note that with PseudoColor and GrayScale colormaps, colors of already drawn graphics will respond to changes to their color representations,

whereas with other colormap types, color representation changes will only effect the colors of subsequently drawn graphics.
Input capability The cursor is usually controlled by a mouse. Cursor input is achieved by moving the cursor into the window of the widget, and pressing either a mouse button or a keyboard key to select a given position in the window and return a key value. The mouse buttons are mapped to return characters A, D, and X.
An asynchronous alternative to the cpgcurs() and cpgband() procedures is
provided. This provides the same functionality as cpgband() except that once
armed, cursor input is delivered to the application via callback functions.
Facilities are also provided to support applications that want to handle cursor input themselves via XtAddEventHandler(). This includes optional augmentation of the X cursor with rubber-bands, and functions for converting between X-window coordinates and world coordinates.
Multiple open device capability The XmPgplot driver places no restrictions on the number of XmPgplot widgets that can be open to PGPLOT simultaneously. Note, however that PGPLOT does set limits on the total number of open devices. Currently (April 96) this limit is 8.
Required files from the PGPLOT installation C include files:
XmPgplot.h This header file should be included by all application source code files from which XmPgplot widget functions or resources are used.
cpgplot.h Since Motif is usually used from C, the include file for the C PGPLOT wrapper library should also be included in all Motif applications that make calls to the PGPLOT library.
UNIX PGPLOT libraries: libXmPgplot.a
This library contains the Motif PGPLOT widget and its PGPLOT driver. The main PGPLOT library only contains a stub version of the driver so when linking Motif applications, it is essential that libXmPgplot.a appear before the main PGPLOT library. For example, a snapshot of the link line under UNIX would be:

-lXmPgplot -lcpgplot -lpgplot -lXm -lXt -lX11
libcpgplot.a and libpgplot.a The PGPLOT C wrapper library and the FORTRAN PGPLOT library.
VMS PGPLOT libraries: XMPGPLOT.OBJ
This object file contains the compiled Motif PGPLOT widget and its PGPLOT driver. Note that the main PGPLOT library only contains a stub version of the driver and that programs that use the Motif widget must link with XMPGPLOT.OBJ in addition to the the main PGPLOT library.
GRPCKG.OLB and CPGPLOT.OLB The PGPLOT C wrapper library and the static version of the main PGPLOT library. The shareable PGPLOT library can not be used when the Motif driver is required.
XMOTIF.OPT This file can be used to link PGPLOT applications that use the XmPgplot widget driver. It is a linker options file that lists the PGPLOT, Motif, X-toolkit and X11 libraries. It should be used like:
LINK PROGRAM,PGPLOT_DIR:PGMOTIF.OPT/OPT
Configuration The configuration of individual widgets is controlled by X resources. It is usually most convenient to set such resources in the call to XtVaCreateManagedWidget() when each PGPLOT widget is created, but they can also be placed in app-defaults files or, on POSIX-compliant systems, the .Xdefaults file in your home directory. Under VMS this file is called DECW$USER_DEFAULTS:DECW$XDEFAULTS.DAT. Note that by default DECW$USER_DEFAULTS is defined as SYS$LOGIN.
Configuration of the widget colormap and visual. XmPgplot widgets allocate colors from the Visual and Colormap specified via the XmNcolormap and XmNvisual resources. These default to CopyFromParent, as they do in most other widgets. As a result, XmPgplot widgets normally allocate colors from the default colormap and visual of the screen. If the default colormap of the screen is insufficient for your needs and you need to allocate a private colormap then I suggest that you register the result with the top-level widget of the application rather than with a specific XmPgplot widget.
This will then be inherited by all widgets in the application, including XmPgplot widgets. The steps to perform to allocate a private colormap and assign it to the top-level widget of the application are as follows:
■ Call XtVaAppinitialize() as you normally would. For the sake of the example, let's say that you store the returned top-level widget in a variable called w_top.
■ Call XtDisplay(w_top) to acquire the Display Xlib context object.
■ Use the normal Xlib functions to find an appropriate visual and allocate the required private colormap.
■ Register the selected colormap and visual to the top-level widget:
XtVaSetValues(w_top, XmNcolormap, colormap, XmNvisual, visual, NULL);
Alternatively if you really want to assign private colormaps to individual XmPgplot widgets then note that to get the window manager to automatically install the colormap of a widget window, one has to set the WM_COLORMAP_WINDOWS property on the top-level window of the host application. The X toolkit provides the function XtSetWMColormapWindows() to do this.
Other X resources that effect the way that colors are allocated are:
XmpNminColors This has a default value of 2. Its value determines the minimum acceptable number of colors in a colormap. If fewer colors are available than this number, then the color allocation code will give up and fall back on using just the black and white colors of the screen to draw PGPLOT graphics.
XmpNmaxColors This has a default value of 100. It specifies how many colors to attempt to allocate per widget. Thus if you have two PGPLOT widgets sharing a colormap that has only 100 free colors then you would need to make the XmpNmaxColors resource values of the two widgets add up to no more than 100.
Configuring how widget resizes are handled. When geometry management widgets are resized by users, their child widgets generally also get resized. This means that the PGPLOT widget can get resized at unpredictable times. However PGPLOT

assumes that the size of its view surface remains unchanged between the start of one page and the start of the next. To handle this XmPgplot widgets use an off screen pixmap for buffering and backing store. This is kept fixed in size for the duration of each page, and is only resized to fit the window when cpgpage() is called. If the widget window is
resized to a smaller size, then part of the plot will become obscured until the next page is started. The XmPgplot widget driver supports two optional ways to improve this situation.
Scrolled PGPLOT windows. If you arrange for the parent widget of a XmPgplot widget to be a Motif ScrolledWindow widget then the PGPLOT widget will automatically adopt the scroll-bars of its parent and arrange that they scroll the underlying pixmap relative to the window. Then if the window is resized to a smaller size the scroll bars can be used to see the obscured part of the plot.
Using a resize callback. Another way to handle the situation is to register a callback to be called whenever the PGPLOT widget gets resized. For this to be useful you should have the callback call the PGPLOT cpgpage() procedure so as to synchronize the size of the pixmap
with the window, and then re-draw any graphics that you want to re-appear there. Registering such a callback is just a matter of calling XtAddCallback() with the PGPLOT widget as the first argument, XmNresizeCallback as the second argument, your callback function as the third argument and an optional client-context data argument as the final argument. The callback function should be declared like:
void whatever(w, client_data, call_data) Where the arguments are declared and interpreted as:
Widget w The XmPgplot widget that has been resized.
XtPointer client_data This is the client_data pointer that was registered with XtAddCallback(). It should be cast back to its actual type before use.
XtPointer call_data This argument is always NULL.
Cursor input functions The standard PGPLOT cpgcurs() and cpgband() cursor-input functions are
not recommended for use in Motif applications because they block the toolkit event loop. Instead an alternative callback system, designed to mimic cpgband

() but without blocking the event loop, has been provided. Arming and
disarming the cursor is achieved through two functions:
int xmp_arm_cursor(widget, mode, xref, yref, callback, client_data) This function augments the X cursor with the type of rubber-band specified in the mode argument. It also optionally registers a callback function to be passed the world coordinates and character of key-press and button-press events. The cursor can subsequently be disarmed via a call to xmp_disarm_cursor(). The cursor is automatically disarmed when the device is closed to PGPLOT by cpgclos() or cpgend(), and
whenever the cursor is re-armed.
Note that when the cursor is augmented, the rubber band is redrawn every time that the PGPLOT buffer is flushed. This happens after every call to PGPLOT functions unless sensible use is made of cpgbbuf
() and cpgebuf() to buffer sequential calls. Be sure to use these
functions properly if you don't want your PGPLOT code to be slow.
The arguments of xmp_arm_cursor() are:
Widget widget The target PGPLOT widget. The widget must be open to PGPLOT.
int mode The type of cursor to display, from: XMP_NORM_CURSOR
The un-augmented X cursor. XMP_LINE_CURSOR
A line drawn between (xref,yref) and the pointer. XMP_RECT_CURSOR
A rectangular cursor with opposing vertices at (xref,yref) and the pointer.
XMP_YRNG_CURSOR Two horizontal lines, one through xref and the other through the pointer.
XMP_XRNG_CURSOR Two vertical lines, one through yref and the other through the pointer.
XMP_HLINE_CURSOR A horizontal line through the pointer.
XMP_VLINE_CURSOR A vertical line through the pointer.
XMP_CROSS_CURSOR A cross-hair cursor centered on the pointer.
float xref, yref The cursor reference position in the current world-coordinate system. If the world coordinate system is subsequently changed the reference position will not be recomputed.
XtCallbackProc callback - The cursor-input callback function, or 0 if not required.
This is used just like any other Xt callback function, except that its call_data argument is a pointer to a struct of the following declaration, cast to (XtPointer).
typedef struct { float x,y; /* The world-coordinate position of the cursor */ char key; /* The key pressed by the user. Mouse buttons */ /* are encode as 'A','D','X' (left to right) */ } XmpCursorCallbackStruct;
The callback function will be called whenever a key (if the widget has keyboard input focus) or pointer button is pressed while the pointer is in the associated PGPLOT widget.
void *client_data - Client context data. This pointer will be passed verbatim to the callback function whenever a cursor-input event is reported.
The return value of xmp_arm_cursor() is 0 if successful or 1 if the specified widget is not an open PGPLOT widget or the callback argument is NULL.
int xmp_disarm_cursor(widget) This function can be called to undo the effect of a previous call to xmp_arm_cursor() for the specified widget. Note that this function can be called even when the cursor has not been previously armed or when the widget is not open to PGPLOT.
The xmp_disarm_cursor() function returns 0 if successful or 1 if the specified widget is not a PGPLOT widget.
Advanced cursor-input On its own xmp_arm_cursor() provides a convenient but limited cursor-input facility, designed to mimic cpgband(). What it doesn't provide is a
general means of responding to the full variety of X-window events. For example, it doesn't report Motion events via its callback. This section describes the facilities available for establishing one's own cursor-input handlers.

To display a rubber band cursor without using its callback facility, call xmp_arm_cursor() with its callback argument specified as 0. This tells the widget's cursor event handler not to select for button-press and key-press events and disables the special interpretation of mouse-buttons and Tab keys with respect to keyboard-focus management .
To register input event handlers externally to xmp_arm_cursor() use the standard XtAddEventHander(). In order to convert from the reported X-window coordinates to PGPLOT world-coordinates, use the xmp_pixel_to_world() function described later.
For example, having created a Label widget w_label and a PGPLOT widget w_plot, the following code would result in a world-coordinate readout of the cursor being displayed in the label whenever the cursor was moved over the PGPLOT widget.
XtAddEventHandler(w_plot, PointerMotionMask, False, report_cursor, (XtPointer)w_label); ...
static void report_cursor(Widget w, XtPointer context, XEvent *event, Boolean *continue_dispatch) { Widget w_label = (Widget) context; char text[80]; float wx, wy;/* * Convert from X-window coordinates to world coordinates. */ if(xmp_pixel_to_world(w, event->xmotion.x, event->xmotion.y, &wx, &wy) == 0) { sprintf(text, "X=%-10g Y=%-10g", wx, wy); XtVaSetValues(w_label, XtVaTypedArg, XmNlabelString, XmRString, text, strlen(text)+1, NULL); } *continue_dispatch = True; }
Keyboard focus issues A widget that receives keyboard input is said to have the keyboard input focus. Only one widget can have this at one time. If you want to be told of keyboard input when an XmPgplot cursor is armed, then read on about the awkward issue of how an XmPgplot widget receives the input focus. Alternatively, if you only care about receiving cursor input

from button presses, then you should set the XmNtraversalOn widget resource to False, otherwise some button-presses will be lost to focus management.
When a Motif application has the keyboard input focus, the Motif library decides which of the application's widgets will receive keyboard input. This is independent of the method used by the window manager for top-level windows. Motif supports two schemes, either of which can be selected by setting the value of the XmNkeyboardFocusPolicy resource of the top-level widget to one of the following values:
1. XmEXPLICIT (The default focus policy).
This implements a click-to-focus model whereby the user must explicitly set the input focus either by pressing the TAB key repeatedly until the required widget is reached, or by moving the pointer into the widget window and pressing a mouse button.
Unfortunately, this means that when a PGPLOT widget doesn't have the keyboard input focus, the first button press is used to acquire the input focus, rather than being reported as cursor-input. Similarly, once the widget has the keyboard input focus, TAB characters are used to move the input focus to the next widget rather than being delivered as cursor input. This is confusing to users, so it is better to either use the XmPOINTER
focus policy, or to tell the widget that keyboard input is not desired, as described above.
In order to allow users to determine in advance whether an XmPgplot widget has input focus, the border of the widget is changed from the background color of its parent to white. This color was chosen so as to be distinct from the default black background color of XmPgplot widgets. The color and other aspects of highlighting can be changed via the highlighting resources of the Primitive widget.
Note that X conventions discourage applications from moving the keyboard focus unless under user direction. However, in cases where the user presses a button who's primary function is to activate an XmPgplot cursor for user input, you might consider actively setting the keyboard input focus to the respective XmPgplot widget via a statement of the following form,
XmProcessTraversal(widget, XmTRAVERSE_CURRENT);
placed just after the call to xmp_arm_cursor(widget, ..). This statement has no effect if the focus policy is not XmEXPLICIT.
2. XmPOINTER
In this scheme the widget in which the pointer lies is the one that receives keyboard input, and button presses are always unambiguously treated as cursor input. This avoids all keyboard focus complications. However, some users don't like it because they like to be able to move the pointer out of the window in which they are typing.
Note that the above resource values can either be hard-coded via the call to XtVaAppInitialize() or specified in the application's app-defaults file.
If having read this, you still want to be told about keyboard input in addition to mouse-button input, but you don't like the way xmp_arm_cursor() manages the keyboard input focus, then you can write your own using the facilities described above under "Advanced
cursor-input".
Coordinate conversion functions The following functions are designed for use with custom event handlers. They perform conversions between widget X-window coordinates and PGPLOT world coordinates.
int xmp_pixel_to_world(widget, px, py, wx, wy) This function takes the X-window coordinates of a pixel within a PGPLOT widget and returns the corresponding PGPLOT world coordinates. If the widget is not open to PGPLOT the reported world coordinates will be 0.0,0.0. The function arguments are:
Widget widget The target PGPLOT widget.
int px, py The pixel coordinates to be converted. These are interpretted with respect to the origin at the top left corner of the widget window. This is the normal coordinate system used by X windows.
float *wx, *wy On output the variables pointed to by wx and wy will be

assigned the PGPLOT world coordinates that correspond to pixel px, py.
The function returns 0 on success or 1 if the widget is invalid.
int xmp_world_to_pixel(widget, wx, wy, px, py) This function takes the PGPLOT world coordinates of a point on the viewsurface of a PGPLOT widget and returns the X-window coordinates of the nearest pixel. If the widget is not open to PGPLOT the reported coordinates will be 0,0. The function arguments are:
Widget widget The target PGPLOT widget.
float wx, wy The PGPLOT world coordinates to be converted.
int *px, *py On output the variables pointed to by px and py will be assigned the X-window coordinates of the pixel nearest to world coordinate wx, wy.
The function returns 0 on success or 1 if the widget is invalid.
Widget identification functions Two convenience functions are provided for determining the name and PGPLOT id associated with a particular PGPLOT widget. int xmp_device_name(Widget widget)
This function returns a device-name string suitable for use with the cpgopen() or cpgbeg() functions to open the specified XmPgplot widget
to PGPLOT. An example of how this can be used with cpgopen() is
shown later. The returned string is part of the specified widget and
must be treated as read-only by the caller.
The form of the returned string is "widget_name/XMOTIF" where widget_name is the name that was given to the widget when it was created.
If the specified widget is not a PGPLOT widget then an error message will be emitted and the returned device name will be "/null".
int xmp_device_id(Widget widget) When a PGPLOT device is opened with the cpgopen() function,
PGPLOT returns an integral identifier. This may then be used, via the cpgslct() function, to select which of the open PGPLOT devices is to
be the current graphics device. The xmp_device_id() convenience

function returns the PGPLOT identifier associated with the given XmPgplot widget. This can be useful in callbacks, where the Widget argument passed to the callback function can then be used to select the widget as the current PGPLOT device.
If the Widget argument passed to the xmp_device_id() function either hasn't been opened to PGPLOT or hasn't been re-opened after being closed, then xmp_device_id() emits an error message and returns 0.
Inherited widget resources. XmPgplot widgets inherit all of the X resources of the Core and Primitive Motif widget classes.
Note that the XmNbackground and XmNforeground resources change the color representations of pgplot color indexes 0 and 1. The default background is black and the default foreground is white. Thus to create an XmPgplot widget with these colors swapped, one could type:
plot = XtVaCreateManagedWidget("plot", xmPgplotWidgetClass, parent, XmNheight, 400, XmNwidth, 400, XmpNmaxColors, 50, XmNtraversalOn, False, XtVaTypedArg, XmNbackground, XmRString, "white", strlen("white")+1, XtVaTypedArg, XmNforeground, XmRString, "black", strlen("black")+1, NULL);
How to create and use a Motif PGPLOT widget with PGPLOT Motif PGPLOT widgets are created just like other widgets, by calling XtVaCreateManagedWidget. The first argument to XtVaCreateManagedWidget must be the device name by which you wish to refer to the widget in cpgbeg() or cpgopen(), and the second argument must be
xmPgplotWidgetClass. The third argument specifies the parent widget. If you want the widget to have scroll bars then this should be a Motif ScrollBar widget. The remaining arguments are a list of X resource-value pairs terminated by a NULL argument. These should be used to configure the widget, via the resources listed earlier.
A non-variadic "convenience" function for creating a PGPLOT widget is also available, called XmCreatePgplot() and the equivalent function to create both a PGPLOT widget and an associated ScrollBar widget is called XmCreateScrolledPgplot(). Note that in both cases you should apply XtManageChild() to the returned widget.

Before a PGPLOT widget can be used from PGPLOT it has to be opened by calling cpgbeg() or cpgopen(). This can be done any time after the PGPLOT
widget has been realized.
Note that PGPLOT now supports multiple open PGPLOT devices via cpgopen(), cpgslct() and cpgclos(). You can thus create and have multiple
PGPLOT widgets open to PGPLOT simultaneously. If you do this, be sure to call cpgslct() in each callback to ensure that the intended PGPLOT widget is
addressed. The id to pass to cpgslct() to select a given XmPgplot widget can
be obtained via the xmp_device_id() convenience function.
Please see the previous sections on configuration, resize options and how to get cursor input.
An example of creating a PGPLOT widget as the child of a scroll bar widget is as follows:
#include <stdio.h> #include <X11/Intrinsic.h> #include <Xm/Xm.h> #include <Xm/ScrolledW.h>
#include "XmPgplot.h" #include "cpgplot.h"
int main(int argc, char *argv[]) { XtAppContext app; /* Application context */ Widget w_top; /* The top-level widget of the application */ Widget w_scroll; /* Scroll-bar widget */ Widget w_pgplot1; /* PGPLOT widget */ /* * Initialize Motif and request a pointer following * keyboard-focus policy. */ XtSetLanguageProc(NULL, NULL, NULL); w_top = XtVaAppInitialize(&app, "Pgplot", NULL, 0, &argc, argv, NULL, XmNkeyboardFocusPolicy, XmPOINTER, NULL); /* * Create a ScrollBar widget. */ w_scroll = XtVaCreateManagedWidget("pgplot_scrollbar",
xmScrolledWindowWidgetClass, w_top, NULL); /* * Create a PGPLOT widget as a child of the scroll-bar widget. * Give it an initial size of 300x300 pixels and allow it to * allocate up to 60 colors from the colormap used by the parent * widget. */ w_pgplot1 = XtVaCreateManagedWidget("pgplot1", xmPgplotWidgetClass, w_scroll, XmNheight, 300, XmNwidth, 300, XmpNmaxColors, 60); /* * Create and display the application windows. */ XtRealizeWidget(w_top); /* * Open w_pgplot1 as the current PGPLOT device. */ if(cpgopen(xmp_device_name(w_pgplot1)) <= 0) { fprintf(stderr, "Failed to open PGPLOT widget: %s\n", xmp_device_name(w_pgplot1)); exit(1); }; /* * Proceed with the Xt event loop. */ XtAppMainLoop(app); /* NOT REACHED */ return 0; };
This example doesn't actually do anything useful except create a PGPLOT widget with scroll-bars and open it to PGPLOT. To make the example useful you would have to arrange for something to draw into the PGPLOT widget. This could be a work procedure, a callback registered to a communication stream for logging incoming data, or a push-button callback.
The pgmdemo demo program provides a much more complete example. The source code for it can be found in the PGPLOT distribution in pgplot/drivers/xmotif/pgmdemo.c. It is compiled automatically when the xmdriv driver is uncommented in drivers.list during PGPLOT installation.

Changes in the PGPLOT 5.2.0 release. The rubber-band and cursor input facilities have been reworked. The changes include:
❍ Setting the XmNtraversalOn widget resource to False now correctly
disables keyboard-focus management. Previously this resource was ignored.
❍ xmp_arm_cursor now allows one to specify 0 for its callback argument.
This allows people to use the rubber-band cursor augmentation facility without incuring the side-effects of its callback facility. This paves the way for programmers to use XtAddEventHandler to register more advanced cursor-event handlers than would otherwise be possible.
❍ There are two new coordinate conversion functions for use by those
who want to write their own X-window event handlers. ❍ The cursor used to be disarmed whenever the world coordinate system
of a widget changed. It no longer is. ❍ It used to be the case that if graphics were drawn while the rubber-band
cursor was displayed, the new graphics could overwrite parts of the cursor. To counter this the rubber-band cursor is redrawn every time the PGPLOT buffer is flushed. This will slow down graphical output unless you use cpgbbuf() and cpgebuf() prudently to buffer sequential
pgplot calls. ❍ Various bugs have been fixed that had been causing the rubber-band
cursor to be left un-erased in certain obscure situations, or to leave a "bristly" edge in the highlight border where the cursor shouldn't have been drawn in the first place, or to flip to the bottom when the mouse pointer exited the top of a widget.
❍ The XmNbackground and XmNforeground resources were being overriden by the default pgplot background and foreground colors whenever a widget was opened to pgplot. This made these resources useless. They now work correctly. If not specified, the default background and foreground colors will be black and white (as before) rather than taking on the conventional blue and black Motif colors. See the Inherited widget resources section for more details.
Martin Shepherd (mcs·astro.caltech.edu).

X-Window Tk widget driver
Author M. C. Shepherd, 1997.
Supported device Restricted to Tcl/Tk (Tk4.0 and above) applications on workstations running the X Window System.
Device type code /XTK
Compatibility So far, the driver has been tested by the author on a Sparc running Solaris 2.5.1 and the following combinations of Tcl and Tk:
❍ Tcl7.5b3 and Tk4.1b3 ❍ Tcl8.0a2 and Tk8.0a2
No changes were needed to upgrade between the above versions, so it is probably safe to assume that all intervening versions will work as well. Future incompatibilities will be accommodated as needed and distributed with later versions of PGPLOT.
The driver is unlikely to work fully with versions of Tk prior to Tk4.0. At the very least, the changed definitions of the xview and yview commands will prevent the use of
scrollbars with the widget.
Device name specification Tk PGPLOT widgets are created with a Tcl command called pgplot. The first argument of this command is the Tk path-name to give the new widget. This doubles as the PGPLOT device name of the widget.
Default view surface dimensions pgplot widgets adopt a default size of 256×256 pixels. This can be changed via the -
width and -height configuration options during or after creation of the widget.
Resolution Depends on monitor.
Multiple device capability Applications are allowed to create multiple PGPLOT Tk widgets and open them simultaneously to PGPLOT. If you do this, be sure to reduce the default number of colors allocated by each widget by using the -maxcolors configuration option.
Otherwise you will run out of colors very quickly and some of your widgets will be forced to use monochrome colors. Also be sure that all asynchronous callbacks call cpgslct() to select the appropriate widget for PGPLOT output.
Color capability Colors are allocated from the colormap of the top-level window of the application.

Colormaps of types PseudoColor, StaticColor, GrayScale, StaticGray, and TrueColor are supported. The value of the -maxcolors configuration option specifies the number
of colors that each widget should attempt to allocate. This defaults to 100. The actual number allocated will be less than this if there are fewer color cells left in the application's color table. If fewer colors than the value of the -mincolors configuration
option are available, then monochrome is used.
Note that changes to the representation of a given PGPLOT color index will change the colors of previously drawn graphics if a PseudoColor or GrayScale colormap is being used. For other colormaps, only subsequently drawn graphics will take on the new colors.
See the section on private colormaps for further information.
Input capability The standard Tk event binding mechanism can be used to select for any combination of keyboard and button press events received by a PGPLOT Tk widget. To facilitate combining this with PGPLOT, PGPLOT Tk widgets provide Tcl commands for converting between widget X coordinates and PGPLOT world coordinates. They also provide facilities for augmenting the X cursor with rubber-band cursors. These facilities are described later.
Cursor input can also be acquired via cpgband() and cpgcurs(), but these functions are
not recommended because they block the Tk event loop.
Scroll capability There are two types of scrolling available.
Tk window scrolling. The widget window will be smaller than the PGPLOT view surface if:
■ cpgpage() has not been called since the user resized the window to a
smaller size. ■ cpgpap() has been used to request a larger physical size than that of the
widget.
In such cases a Tk scrollbar could be used to scroll the visible area of the view surface. For this purpose the widget provides the conventional xview and yview
commands and the -xscrollcommand and -yscrollcommand configuration options.
PGPLOT Scroll area The PGPLOT scroll-area option is supported. See the PGPLOT documentation on cpgscrl() for details.
Associated files tkpgplot.h
This header file is intended for use by the C part of a Tcl/Tk application. It includes prototypes of the package-initialization function of the PGPLOT Tk widget and a few optional convenience functions for communicating with the
widget directly via C. libtkpgplot.a
This library file contains the Tk PGPLOT widget and its PGPLOT driver. The main PGPLOT library only contains a stub version of the driver, so it is essential to present libtkpgplot.a to the linker before the main PGPLOT library. For example, a snapshot of the link line under Solaris would look something like:
-ltkpgplot -lcpgplot -lpgplot -lTk4.1 -ltcl7.5 -lX11 -ldl
cpgplot.h The include file for the C PGPLOT wrapper library should also be included in all files that make calls to the PGPLOT library from C.
libcpgplot.a and libpgplot.a The PGPLOT C wrapper library and the FORTRAN PGPLOT library.
Configuration As is customary in Tk, PGPLOT widgets can be configured both when they are created, and thereafter by using the path name of the widget as a command. For example, the following Tcl command creates a PGPLOT widget called .plot, and gives it an initial size of 10x10 cm, up to 16 colors and a 3D border width of 2 pixels.
pgplot .plot -width 10c -height 10c -maxcolors 16 -bd 2
Having done this the following command would change the X-window cursor of the widget to a small cyan crosshair cursor.
.plot configure -cursor {crosshair black cyan}
The following is a list of the configurable options of PGPLOT widgets:
-background color -bg color
Set or change the background color of the widget. Note that this also changes the color associated with PGPLOT color index 0. This command takes a standard Tk color specification as its only argument. The default foreground color is black.
-foreground color -fg color
Set or change the color that is associated with PGPLOT color index 1. This command takes a standard Tk color specification as its only argument. The default foreground color is white.
-cursor tk-cursor-specification This changes the cursor image that will be displayed when the cursor is within the PGPLOT widget. It takes a standard Tk cursor specification as its only argument. The default cursor is the cursor of the parent widget. This does not affect any rubber-band cursor that has been established.
-borderwidth width -bd width
This sets the width of the 3D border that is drawn around the widget. The single

argument is a standard Tk width specification. The default width is zero, which results in no border being drawn.
-relief raised|sunken|flat|ridge|groove This specifies how the 3D border is to appear. It takes a single argument naming one of the standard Tk reliefs. The default is raised.
-height height This specifies the height of the PGPLOT window displayed in the widget. It takes a standard Tk width specification as its only argument. The default is 256 pixels.
-width width This specifies the width of the PGPLOT window displayed in the widget. It takes a standard Tk width specification as its only argument. The default is 256 pixels.
-highlightbackground color This sets the color of the widget's highlight border when the widget does not have the keyboard input focus. It takes a standard Tk color specification as its sole argument. The default color is grey, chosen to match the default background color of most standard Tk widgets.
-highlightcolor color This sets the color of the widget's highlight border when the widget has the keyboard input focus. It takes a standard Tk color specification as its sole argument. The default color is white, such that it stands out against the default black background of the PGPLOT window.
-highlightthickness width This sets the width of the widget's highlight border. The single argument is a standard Tk width specification. By default the highlight thickness is zero. If you intend to adopt Tk's default click-to-focus input model and you intend to select for keypress events in the widget then be sure to set this thickness to a finite width, such as 2. Otherwise users will not be able to tell when the widget has the keyboard input focus.
-takefocus This selects whether the widget will be given the keyboard input focus when Tab or Shift-Tab is pressed in a neighboring widget. The default is 0, which means that the widget will not receive the input focus unless it is explicitly set using the Tk focus command. If you intend to select for keyboard input in the widget (as opposed to mouse button input), then be sure to reconfigure this to 1. You should then also establish event bindings such that once the widget has the keyboard input focus, Tab and Shift-Tab will move the input focus in the conventional manner. For example:
pgplot .plot -takefocus 1 bind .plot <Tab> {focus [tk_focusNext %W]} bind .plot <Shift-Tab> {focus [tk_focusPrev %W]}
-xscrollcommand prefix Whenever the visible part of the PGPLOT view surface underlying a PGPLOT widget is changed, either by resizing the widget or by scrolling horizontally with the xview widget command, the specified command prefix is augmented with two extra arguments and evaluated. The two arguments are floating point numbers

which denote the left and right edges of the visible part of the view surface. 0 refers to the leftmost edge of the view surface, and 1 refers to the rightmost edge. This is designed for use with Tk scrollbar widgets. For example, given a horizontal scroll bar called .hscroll and a PGPLOT widget called .plot, the following commands would connect the scrollbar and the PGPLOT widget.
.plot configure -xscrollcommand {.hscroll set} .hscroll configure -command {.plot xview}
-yscrollcommand prefix This is the Y-axis equivalent of the -xscrollcommand configuration option.
-mincolors This specifies the smallest acceptable number of colors before a widget switches to monochrome. The default is 2. If fewer colors than this number are available, a black and white colormap will be adopted and grey-scale images will be dithered. This option is only consulted when a widget is created. Changes made thereafter using the configure command will be ignored.
-maxcolors This specifies the number of colors that the widget will attempt to allocate for itself. The default is 100. On computers with 8-bit frame-buffers, colors are a scarce resource so be sure to set this number as low as possible. For example, if you don't intend to use cpgimag() or cpggray() to draw images, then the default
of 100 colors is likely to be much more than you need. In this case setting -maxcolors to 16 will give access to all 16 of PGPLOT's pre-defined line colors, while reducing the likelihood that either your application or somebody else's will run out of colors. This is especially important if you intend to use more than one PGPLOT widget within your application. This option is only consulted when a widget is created. Changes made thereafter using the configure command
will be ignored.
Other widget commands. After a PGPLOT widget has been created, the following commands can be applied to that widget, using the normal Tk syntax of:
widget_path_name command_name arguments...
configure option arguments... This allows widget configuration options to be changed after a PGPLOT widget has been created. The supported options and their arguments have already been described in the Configuration section.
cget option This allows the current value of the specified configuration option to be queried. The return string is formatted in the same fashion as the arguments of the corresponding "pathName configure option" command.
xview ... This is used to scroll the widget horizontally. It can take any of the following forms, as used by Tk scrollbar widgets.

xview moveto fraction Where fraction is the fractional width of the PGPLOT view surface that lies to the left of the left edge of the widget.
xview scroll increment units Move the view surface increment pixels to the right. Negative values move the view surface to the left.
xview scroll increment pages Move the view surface increment widget-widths to the right. Negative values move the view surface to the left.
yview ... This is used to scroll the widget vertically. It takes the same forms as described for the xview command except that positive increments are defined as moving the widget downwards instead of to the right.
setcursor mode x y ci This is used to augment the normal X-window cursor of a PGPLOT widget with one of a selection of rubber-band cursors. The mode argument selects the type of cursor to use and the x and y arguments are used to set the origin of cursors that have anchor points. The ci argument is a PGPLOT color index, and is used to specify the color used to draw the cursor. The mode argument must be one of the following names:
■ norm No cursor augmentation.
■ line A line drawn between the specified anchor point and the position of the cursor.
■ rect An open rectangle with vertices at the specified anchor point and the position of the cursor.
■ yrng Two horizontal lines extending the width of the view surface, one passes through the Y coordinate of the specified anchor point and the other passes through the cursor. This was designed for selecting the end of a Y-axis range whose start has already been selected.
■ xrng Two vertical lines extending the height of the view surface, one passes through the x coordinate of the specified anchor point and the other passes through the cursor.
■ hline A horizontal line that passes through the cursor and extends the width of the view surface. This was designed for selecting the start of a Y-axis range.
■ vline A vertical line that passes through the cursor and extends the height of the view surface. This was designed for selecting the start of an X-axis range.
■ cross A crosshair cursor that passes through the cursor and extends the width and height of the view surface.
Note that this command will have no effect if the widget has not been opened to PGPLOT.

Also note that when the cursor is augmented, the rubber band is redrawn every time that the PGPLOT buffer is flushed. This happens after every call to PGPLOT functions unless sensible use is made of cpgbuf() and cpgebuf() to
buffer sequential calls. Be sure to use these functions properly if you don't want your PGPLOT code to be slow.
clrcursor This is used to remove any cursor augmentation that was previously established with the setcursor command.
world ... This returns the floating point PGPLOT world coordinates that correspond to specified integer X-window coordinates (such as those reported in the %x and %y fields of Tk event bindings). It can take any of the following forms: world x xoffset
This returns the X-axis PGPLOT world coordinate that corresponds to an offset of xoffset pixels in from the left edge of the PGPLOT window.
world y yoffset This returns the Y-axis PGPLOT world coordinate that corresponds to an offset of yoffset pixels in from the top edge of the PGPLOT window.
world xy xoffset yoffset This returns the PGPLOT X and Y-axis world coordinate pair that corresponds to an offset of xoffset pixels in from the left edge of the PGPLOT window and an offset of yoffset pixels in from the top edge of the PGPLOT window.
Note that if the widget is not open to PGPLOT, 0.0 will be returned for all pixel coordinates.
pixel ... This returns the integer X-window coordinates that correspond to specified floating point PGPLOT world coordinates. It can take any of the following forms: pixel x worldx
This returns the horizontal X-window pixel coordinate that corresponds to the given X-axis world coordinate.
pixel y worldy This returns the vertical X-window pixel coordinate that corresponds to a given Y-axis world coordinate.
pixel xy worldx worldy This returns the X-window pixel-coordinate pair that corresponds to the given world coordinates.
Note that if the widget is not open to PGPLOT, 0 will be returned for all world coordinates.
id This returns the integer id that was returned by cpgopen() when the widget was
last connected to PGPLOT. This can then be used with cpgslct() to select the
widget to be the target for subsequent PGPLOT output. If the widget has not been opened, 0 is returned.
Handling widget resizes. When an application is resized by the user, some or all of its nested widgets are resized

to fit the new area. This means that a PGPLOT widget can get resized at unpredictable times, whereas PGPLOT assumes that the size of its view surface remains unchanged between the start of one page and the start of the next. To cope with this, pgplot widgets draw to an off screen pixmap which is kept fixed in size for the duration of each page, and is only resized to fit the window when cpgpage() is called. Thus when
the widget is smaller than the pixmap, only part of the PGPLOT view surface will be visible. There are two ways to deal with this:
1. One way is to provide the widget with scrollbars, so that the user can interactively change which part of the PGPLOT window is visible. For example:
pgplot .plot -maxcolors 16 scrollbar .xscroll -command {.plot xview} -orient horizontal scrollbar .yscroll -command {.plot yview} -orient vertical .plot configure -xscrollcommand {.xscroll set} .plot configure -yscrollcommand {.yscroll set}
2. The other is to establish a Tk event binding to redraw the plot whenever the user resizes the window. Provided that your redraw command calls cpgpage(),
the new view surface will then match the current size of the widget.
pgplot .plot -maxcolors 16 -bd 2 -relief sunken bind .plot <Configure> {your_redraw_command}
Cursor facilities The standard PGPLOT cursor functions (cpgband() and cpgcurs()) were not designed
with event-driven programs in mind, and they are not appropriate for use in Tk because they block the Tk event loop. This section describes how to display rubber-band cursors using pgplot widget commands and how to asynchronously respond to user input via the Tk bind command.
The Tk bind command arranges for user-specified Tcl code to be executed whenever a given X-window event occurs. Events such as ButtonPress, KeyPress and Motion events have associated X and Y X-Window coordinates at which the event occurred. These can be converted to PGPLOT world coordinates with the world command
provided by pgplot widgets. For example the following code arranges that whenever any mouse button is pressed when the pointer is in the given PGPLOT widget, a procedure called report_button_press is invoked. This procedure then converts the X-window pixel coordinates to world coordinates and reports them to stdout.
Tcl button-press example
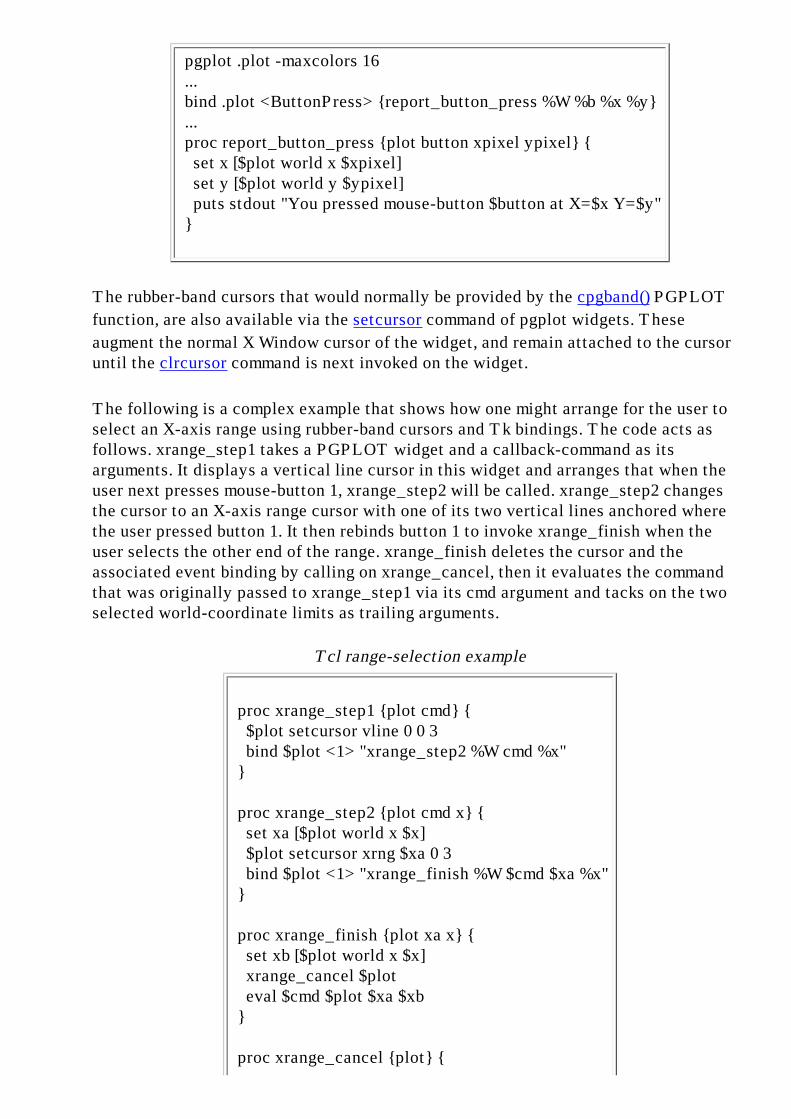
pgplot .plot -maxcolors 16 ... bind .plot <ButtonPress> {report_button_press %W %b %x %y} ... proc report_button_press {plot button xpixel ypixel} { set x [$plot world x $xpixel] set y [$plot world y $ypixel] puts stdout "You pressed mouse-button $button at X=$x Y=$y" }
The rubber-band cursors that would normally be provided by the cpgband() PGPLOT
function, are also available via the setcursor command of pgplot widgets. These
augment the normal X Window cursor of the widget, and remain attached to the cursor until the clrcursor command is next invoked on the widget.
The following is a complex example that shows how one might arrange for the user to select an X-axis range using rubber-band cursors and Tk bindings. The code acts as follows. xrange_step1 takes a PGPLOT widget and a callback-command as its arguments. It displays a vertical line cursor in this widget and arranges that when the user next presses mouse-button 1, xrange_step2 will be called. xrange_step2 changes the cursor to an X-axis range cursor with one of its two vertical lines anchored where the user pressed button 1. It then rebinds button 1 to invoke xrange_finish when the user selects the other end of the range. xrange_finish deletes the cursor and the associated event binding by calling on xrange_cancel, then it evaluates the command that was originally passed to xrange_step1 via its cmd argument and tacks on the two selected world-coordinate limits as trailing arguments.
Tcl range-selection example
proc xrange_step1 {plot cmd} { $plot setcursor vline 0 0 3 bind $plot <1> "xrange_step2 %W cmd %x" }
proc xrange_step2 {plot cmd x} { set xa [$plot world x $x] $plot setcursor xrng $xa 0 3 bind $plot <1> "xrange_finish %W $cmd $xa %x" }
proc xrange_finish {plot xa x} { set xb [$plot world x $x] xrange_cancel $plot eval $cmd $plot $xa $xb }
proc xrange_cancel {plot} {

bind $plot <1> {} $plot clrcursor }
The following is an example of how this could be used. A more complete example is provided later.
pgplot .plot -maxcolors 16 ...
proc report_xrange {plot xa xb} { puts "You selected X-axis range $xa -> $xb" }
xrange_step1 $plot report_xrange
Finally, the following example shows how one can provide a continuous readout of the world coordinates of the cursor whenever the cursor is in the target PGPLOT widget. It creates two label widgets in which to display the X and Y coordinates, places them left to right above a PGPLOT widget and then arranges for the positions reported by Motion events to be translated to world coordinates and placed in the labels.
Tcl cursor-readout example
# Create two labels side-by-side in a frame.
frame .f label .f.x -width 12 -anchor w label .f.y -width 12 -anchor w pack .f.x .f.y -side left -anchor w
# Create the PGPLOT widget and place it below the labels.
pgplot .plot -maxcolors 16 pack .f .plot -side top
# Arrange to update the labels whenever the cursor moves # in the PGPLOT window.
bind .plot <Motion> { .f.x configure -text "X=[.plot world x %x]" .f.y configure -text "Y=[.plot world y %y]" }
Note that this example will display X=0.0 and Y=0.0 until the widget is opened to PGPLOT. Up to that point no world coordinates exist so the world command returns

0.0 for all input coordinates.
Private colormaps The Tk pgplot widget allocates colors from the colormap of the top level widget that encloses it. By default this is also the default colormap of the screen, which is being competed for by most of the other X-window programs that are being displayed. To avoid running out of colors you can do two things:
1. Set the value of the pgplot -maxcolors configuration option to as small a value
as you actually need. 2. Allocate a private colormap for the top level widget of your application.
The latter option is easily available via the -colormap configuration argument of the Tcl/Tk toplevel command. This means that you can either create your own separate top level widget with its own colormap, or you can request a private colormap for the main window when the application starts. For example, using the standard Tcl/Tk window shell:
wish -colormap new
will allocate wish its own private colormap. If you start your application via the standard Tk_Main() function and pass it the command-line arguments of your program then it too will accept the -colormap option from the command-line.
How to use the driver from C The most efficient way to use the Tk PGPLOT driver is to handle user-interaction using a Tcl/Tk script and delegate drawing operations to Tcl-callable C functions. This section gives a complete example to illustrate how this is done. If you want to try this code, extract the following C-code fragments (eg. using cut and paste), assemble them into a .c file and compile the result as described later.
The main() function of the example program delegates starting up Tcl/Tk to the standard Tk main function. This in turn calls the example customization function Demo_AppInit(). The customization function calls Tkpgplot_init() to create the Tcl pgplot command, then creates two other new Tcl commands. The first is simply a wrapper around cpgopen(). The second is a wrapper around an example drawing
function that draws a plot of x² versus x.
C example program

#include <tk.h> #include <stddef.h> #include <stdlib.h> #include "tkpgplot.h" /* Needed solely for tkpgplot_Init() */ #include "cpgplot.h" /* Needed for cpg*() pgplot functions */
/* Prototype local functions. */
static int Demo_AppInit(Tcl_Interp *interp); static int usage_error(Tcl_Interp *interp, char *usage); static int tcl_pgopen(ClientData data, Tcl_Interp *interp, int argc, char *argv[]); static int tcl_draw_plot(ClientData data, Tcl_Interp *interp, int argc, char *argv[]);
int main(int argc, char *argv[]) { Tk_Main(argc, argv, Demo_AppInit); return 0; }
static int Demo_AppInit(Tcl_Interp *interp) { if(Tcl_Init(interp) == TCL_ERROR || Tk_Init(interp) == TCL_ERROR || Tkpgplot_Init(interp) == TCL_ERROR) return TCL_ERROR; Tcl_CreateCommand(interp, "pgopen", tcl_pgopen, NULL, 0); Tcl_CreateCommand(interp, "draw_plot", tcl_draw_plot, NULL, 0); return TCL_OK; }
/* * Implement the example pgopen Tcl command. This takes a single * PGPLOT device specification argument and returns the * corresponding PGPLOT id for use with cpgslct(). */ static int tcl_pgopen(ClientData data, Tcl_Interp *interp, int argc, char *argv[]) { char result[20]; int id; /* * Make sure that the right number of arguments have been provided. */ if(argc != 2) return usage_error(interp, "pgopen device"); /* * Attempt to open the PGPLOT device specified in argv[1]. */

id = cpgopen(argv[1]); if(id <= 0) { Tcl_AppendResult(interp, "Unable to open device: ", argv[1], NULL); return TCL_ERROR; }; /* * Turn off new-page prompting. */ cpgask(0); /* * Return the PGPLOT id of the device via the Tcl result string. */ sprintf(result, "%d", id); Tcl_AppendResult(interp, result, NULL); return TCL_OK; }
/* * Implement the example Tcl draw_plot command. This takes three * arguments. The id of the PGPLOT device to plot to, the leftmost * X-axis value to display and the rightmost X-axis value to * display. */ static int tcl_draw_plot(ClientData data, Tcl_Interp *interp, int argc, char *argv[]) { double xa, xb; /* The X-axis range to plot */ int id; /* The PGPLOT id of the target device */ int i; /* * Make sure that the right number of arguments have been provided * and that the PGPLOT id makes sense. */ if(argc != 4 || (id=atoi(argv[1])) <= 0) return usage_error(interp, "draw_plot id xmin xmax"); /* * Decode the two X-axis world-coordinate limits. */ if(Tcl_GetDouble(interp, argv[2], &xa) == TCL_ERROR || Tcl_GetDouble(interp, argv[3], &xb) == TCL_ERROR) return TCL_ERROR; /* * Select the PGPLOT device and draw the plot. */ cpgslct(id); cpgpage(); cpgswin(xa, xb, 0.0, 1.0); cpgsci(1); cpgbox("BCNST", 0, 0, "BCNST", 0, 0); cpgsci(2);

cpgmove(0.0, 0.0); for(i=1; i<100; i++) { float x = i/100.0; cpgdraw(x, x*x); } return TCL_OK; }
/* * The final function is just a utility function for reporting * command-usage errors and returning the standard Tcl error code. */ static int usage_error(Tcl_Interp *interp, char *usage) { Tcl_AppendResult(interp, "Usage: ", usage, NULL); return TCL_ERROR; }
Having assembled the above C fragments into a single file called demo.c the file can be compiled and linked (on a Sun running Solaris 2.5.1) as follows:
cc -c -O demo.c -I/usr/local/pgplot -I/usr/local/include
f77 -o demo demo.o -ltkpgplot -lcpgplot -lpgplot -ltk4.1 -ltcl7.5 -lX11 -lnsl -lsocket -ldl
The actual compilation and linking steps will differ from machine to machine. However note that the main PGPLOT library is written in FORTRAN. For this reason it is usually easiest to link the program using a fortran compiler as shown above. This is easier than having to figure out what FORTRAN support libraries to cite when linking with a C compiler.
Having compiled and linked the example program, we now need a Tcl script to show how to use the commands that it implements. The following script creates a PGPLOT widget, opens it to PGPLOT and draws the example plot in it. It also arranges that whenever the user resizes the application, the plot will be redrawn to take advantage of the new size.
Tcl example script

# Give the application window a title.
wm title . {Example plot}
# Show a usage label.
label .usage -text {Mouse-button 1 selects range, 2 cancels, 3 unzooms}.usage configure -bd 2 -relief groove -bg yellowpack .usage -side top -anchor c -fill x
# Create a PGPLOT widget.
pgplot .plot -maxcolors 4 -width 500 -height 500pack .plot -side top -expand true -fill both
# Open the widget to PGPLOT.
pgopen .plot/xtk
# Arrange for the plot to be redrawn whenever the user resizes it.
bind .plot <Configure> {draw_plot [%W id] 0.0 1.0}
# Reproduce the previously explained range-selection functions.
proc xrange_step1 {plot cmd} { $plot setcursor vline 0 0 3 bind $plot <1> "xrange_step2 %W $cmd %x"}
proc xrange_step2 {plot cmd x} { set xa [$plot world x $x] $plot setcursor xrng $xa 0 3 bind $plot <1> "xrange_finish %W $cmd $xa %x"}
proc xrange_finish {plot cmd xa x} { set xb [$plot world x $x] xrange_cancel $plot eval $cmd $plot $xa $xb}
proc xrange_cancel {plot} { bind $plot <1> {} $plot clrcursor}
# This function is called to draw a zoomed version of the plot.

proc zoom_plot {plot xa xb} { draw_plot [$plot id] $xa $xb start_zoom $plot}
# This procedure sets up the cursor to allow users to zoom# in on the plot.
proc start_zoom {plot} { xrange_step1 $plot zoom_plot bind $plot <2> "start_zoom $plot" bind $plot <3> {draw_plot [%W id] 0.0 1.0}}
# Start the ball rolling.
start_zoom .plot
To try the above script, cut and paste it into a file called demo.tcl and run it by typing:
demo demo.tcl
If the pgplot widget complains that there aren't sufficient colors left in the default colormap, then rerun the demo with a private colormap as follows:
demo demo.tcl -colormap new
In addition, if you just run the program without specifying a script file:
demo
then you will be given a wish shell prompt at which you can type Tcl/Tk commands, including those defined by the example program.
A more complicated demonstration program comes with the PGPLOT distribution and is automatically compiled if the Tk driver is selected. To run it, change to the pgplot installation directory and type:
pgtkdemo pgtkdemo.tcl
or
pgtkdemo pgtkdemo.tcl -colormap new
if it complains about there being insufficient colors. Note that this demo uses different resize strategies for its two PGPLOT widgets. The topmost pgplot widget displays a

grey-scale image and is slow to redraw, so this has been given scrollbars. If you resize the application to a smaller size, then you will be able to use the scroll bars to see any part of the partially obscured image. If you want to replot the image with the same size as the shrunk widget, simply select an image function from the option menu. The other pgplot widget displays a line graph which is quick to redraw, so when the application is resized by the user, the graph is redrawn to take advantage of the new size.
Frequently asked questions and answers The following is a collection of problems that you might initially encounter and suggestions for how to resolve them.
Why does the first plot that I draw appear to have the wrong size? You probably attempted to plot in the widget before it had been displayed for the first time, so the pgplot widget created a view surface that had the default, or specified size of the widget rather than the size that the widget was subsequently given by the Tk geometry manager. To ensure that the widget has been displayed and given its final size before drawing into it, place the following Tcl command before your first plotting command:
update idletasks
How do I stop a pgplot widget from complaining about there being insufficient colors? See the private-colormaps section.
Martin Shepherd (mcs·astro.caltech.edu).

PGPLOT version 5.2.0
This version includes bug fixes, improvements in existing routines, new routines, and new device drivers. All changes are intended to be compatible: existing programs should run unchanged and produce the same output (except for a few bug fixes).
Tested Systems
Version 5.2.0 has been tested with the following operating systems and compilers. Drivers tested include: GI, GL, NU, PG, PP, PS, TT, TK, VT, WD, X2, XM, XW (but not all combinations of drivers and systems have been tested exhaustively).
● Solaris 2.5.1 (SunOS 5.5.1), Sun Fortran (f77) 3.0.1, Sun C (cc) 3.0.1 (tested on SPARC Ultra-1) [sol2 f77_cc].
● Solaris 2.5.1 (SunOS 5.5.1), GNU Fortran (g77) 0.5.18, GNU C (gcc) 2.7.2.1 (tested on SPARC Ultra-1) [sol2 g77_gcc].
● SunOS 4.1.3, Sun Fortran (f77), GNU C (gcc) (tested on Sun SPARCStation 2) [sun4 f77_gcc].
● OpenVMS AXP V6.1, DEC FORTRAN V6.2, DEC C V4.0, DECwindows Motif 1.1 (tested on DEC 3000/M600).
● OpenVMS VAX V6.1, DEC FORTRAN V6.2, DEC C V4.0, DECwindows Motif 1.2 (tested on VAXstation 4000-90).
New PGPLOT routines
The following routines are documented in the list of subroutines, and will be
explained more fully in the manual.
pgaxis
Draw a linear or logarithmic axis (more options will be added in later versions).
pgconf
Shade area between two contours. pgerr1
Draw a single error bar (useful for systems which cannot pass a scalar to a routine that expects an array).
pgpt1
Draw a single graph marker (useful for systems which cannot pass a scalar to a routine that expects an array).
pgsclp, pgqclp

Set/query clipping status (used by PGBOX and PGAXIS to ensure that axes are not clipped against the viewport).
pgqdt, pgqndt
Inquiry routines used to determine the list of device types available in a PGPLOT installation; useful for building menus, etc.
pgscrl
Scroll a rectangular region of the screen; useful for making animated displays without redrawing the whole screen; currently only supported on X Window and related devices.
pgtick
Used by pgaxis to draw single labelled tick mark; may be called directly, e.g., for special non-linear axes.
Modified PGPLOT routines
Internal changes that do not affect the API are not listed. Several routines have been modified to improve their descriptions or improve speed.
pgctab
The behavior of the arguments "brightness" and "contrast" has been changed slightly. The color indices set by this routine will be slightly changed from earlier versions of PGPLOT, except when these arguments have their "default" values (0.5 and 1.0). The routine is designed for use in an interactive environment in which the user can explore the effect of changing these parameters; in the new version they behave somewhat more as one might expect.
pgqinf
Added ability to determine whether a device supports pgscrl.
New device drivers
pgdriv (device type /PGMF)
Creates a disk file in a private PGPLOT Metafile format. This is a portable file format using only printable ASCII characters. It is intended to replace the old metafile (created by MFDRIV) which uses a binary, machine-dependent format. Subroutines are being prepared to allow a PGPLOT program to read and display files written in this format (an example program is provided in directory pgplot/pgmf). The driver uses only standard Fortran-77 and so should be portable to all operating systems on which PGPLOT is supported.
tkdriv (device type /XTK)
For plotting in PGPLOT Tcl/Tk widgets under the X Window System (UNIX systems only). An example program is included. Feedback on this driver would be appreciated: send e-mail to Martin Shepherd (mcs·astro.caltech.

edu).
Modified device drivers
lxdriv
LaTeX picture environment driver. Fixed bug: picture size can now be adjusted with PGPAP. (Note: The PostScript driver gives much better results than this one, if your LaTeX environmant allows PostScript files to be included in LaTeX documents.)
xmdriv
Motif widget driver. Added support for scrolling; improved cursor handling; bug fixes.
xwdriv
X Window driver. Added support for scrolling; bug fixes. The PGPLOT cursor can now be moved horizontally and vertically with the keyboard arrow keys, which can be more precise than using the mouse. Each keystroke moves the cursor by one pixel, or 10 pixels if the SHIFT key is depressed.
Deprecated drivers
The following drivers are probably no longer useful, and their use is discouraged. They have been moved from pgplot/drivers to pgplot/drivers/old. If you still need any of these drivers, please contact Tim Pearson.
imdriv, vidrivImagen printers.
irdrivSilicon Graphics workstations: use the X-window drivers instead.
svdrivSun workstations running SunView: use the X-window drivers instead.
Changes to installation procedures
The installation instructions have been rewritten. There are two changes you should
be aware of:
1. All the UNIX configuration files (pgplot/sys_*/*.conf) have been modified to add new parameters that may be required for the new widget drivers. If you have made modifications to configuration files and haven't sent them back to Tim Pearson, you will need to change them again.
2. If you need to modify a configuration file for your system, it is now recommended that you make a new configuration file called "local.conf" in the build directory, by editing a configuration file for a related system. makemake

will now read this file if you do not specify a configuration on the makemake command line.
New and modified demonstration programs
pgdemo1Now uses new routine pgpt1 when a single marker is to be drawn.
pgdemo2Modified text-sample page.
pgdemo3Added demo of new routine pgconf. Demo of pgvect has been moved to pgdemo15.
pgdemo4Demo of pgimag: modified to use slightly more realistic transformation matrices, to show the use of pgctab, and to show how the color palette may be modified interactively.
pgdemo6Now uses new routine pgpt1 when a single marker is to be drawn.
pgdemo13Now uses new routine pgpt1 when a single marker is to be drawn.
pgdemo15New demo for routine pgvect (formerly in pgdemo3).
pgdemo16New demo for bar and column charts. This uses a general-purpose subroutine that may get included in a future version of pgplot, although not exactly in this form.
pgdemo17New demo, from Dr Martin Weisser, showing animated rotation of a molecular structure.
Changes to C binding
The program that creates the PGPLOT C binding (pgbind) can now generate a binding for MS-Powerstation (Windows).
Tim Pearson, California Institute of Technology, tjp戢stro.caltech.edu
Copyright © 1997 California Institute of Technology

Installation Instructions: UNIX systems
Note: The following instructions refer to two directories, the distribution (source) directory which will contain the PGPLOT source code directory tree, and the target directory in which the machine-specific libraries, data files, and demonstration programs will be created. It is recommended that you create new, empty directories for these. They should not be the same directory. In the examples below, these directories are named
/usr/local/src/pgplot (distribution directory) /usr/local/pgplot (target directory)
but you can use any convenient names. Unusual (root) privileges are not required to install PGPLOT, assuming you have write access to the directories. A single distribution directory can be used to install versions of PGPLOT for different architectures in different target directories.
Copy the distribution file
Copy the distribution file by anonymous ftp from Caltech. Use anonymous ftp (user: anonymous, password: your id username@machine) to node ftp.astro.caltech.edu.
The distribution file is a UNIX tar file compressed with gzip. Issue the following ftp commands to retrieve the file:
cd pub/pgplot binary get pgplot5.2.tar.gz
The text files in this directory are also included in the tar file.
The distribution file can also be fetched from URL ftp://ftp.astro.caltech.edu/pub/pgplot/pgplot5.2.
tar.gz.
Decompress the files
Use gunzip and tar to decompress the archive and extract its contents. This will create directory pgplot (and subdirectories) in the current directory. Make sure that your current directory is where you want to create the ``PGPLOT distribution'' directory tree.
cd /usr/local/src gunzip -c pgplot5.2.tar.gz | tar xvof -
This example will create /usr/local/src/pgplot and subdirectories.
Create the target directory
Create a writeable directory in which the PGPLOT library and associated files will be created. One such directory is needed for each different operating system and compiler combination (``target system'') that you wish to support, e.g.,

mkdir /usr/local/pgplot
Do not try to create the PGPLOT library in the distribution directory.
Select device drivers
Configure PGPLOT by selecting device drivers from the available list. First copy the file drivers.list from the distribution directory to the target directory, and then use a text editor to select device drivers. This file contains one line for each available device driver: delete the exclamation mark (!) at the beginning of the line to include the driver, or ensure that an exclamation mark is present if you want to exclude the driver. Many of the drivers can be used only on certain operating systems (see notes in drivers.list), so include only the drivers you plan to use. PGPLOT can later be reconfigured by restarting the installation at this step. Most installations should include: the null device (/NULL), PostScript printers (/PS, /VPS, /CPS, and /VCPS), Tektronix terminals (/TEK, /XTERM, and possibly other variants), and, if the X window system is available on the target, the X window drivers (/XWINDOW, /XSERVE). You may also wish to include drivers for GIF files (/GIF, /VGIF) or some of the other printers.
cd /usr/local/pgplot cp /usr/local/src/pgplot/drivers.list . vi drivers.list (or use your preferred editor)
Note: If you select either the Motif widget driver (XMDRIV) or the Tk/Tcl widget driver (TKDRIV), the installation procedure will install additional files and demonstration programs. Do not select these drivers unless you are planning to develop programs that will use them. For further information see the appropriate documentation:
● XMDRIV
● TKDRIV
Create the makefile
The PGPLOT installation procedure for UNIX uses a script, called makemake, to generate a standard UNIX makefile for your operating system, compilers, and list of selected PGPLOT device drivers. Operating-system and compiler information is obtained from a configuration file. Configuration files are available for the following systems. If your configuration is not one of those listed, or if you have trouble using the generated makefile, see below for information about creating your own configuration file.
Note that the configuration files are for particular compilers, on particular operating systems. If, for example, you have set up your system so that the command f77 invokes the GNU g77 compiler, then you cannot use a configuration file designed for, say, a SPARC f77 compiler. You will have to create a special configuration file.
In the following table, Arg#2 is a code for the operating system, and Arg#3 is a code for the Fortran and C compilers. For more information about the supported systems, see the file pgplot/sys_*/aaaread.me, where * stands for one of the options for Arg#2.
Arg#2 Arg#3

------ ------ aix xlf_cc alliant fortran_cc bsd g77_gcc convex fc_cc cray cf77_cc epix2 f77_cc (Control Data EP/IX 2.x) freebsd f77_cc fujitsu uxpm_frt_cc fujitsu uxpv_frt_cc hp fort77_c89 hp fort77_gcc irix f77_cc linux absoft_gcc linux f77_gcc linux g77_elf linux g77_gcc next af77_cc next f2c_cc next g77_cc next gf77_cc osf1 f77_cc osf1 f77_cc_shared sol2 f77_cc (Solaris 2.x, SunOs 5.x) sol2 f77_gcc sol2 f90_cc sol2 g77_gcc sun4 f77_acc (SunOS 4.x) sun4 f77_cc sun4 f77_gcc ultrix f77_cc
If your system is one of those listed, proceed as follows:
Make the target directory your current default directory, e.g.,
cd /usr/local/pgplot
Execute the script makemake from the distribution directory: e.g.,
/usr/local/src/pgplot/makemake /usr/local/src/pgplot sun4
The first argument supplied to makemake is the name of the distribution directory. Note that when you run makemake, your current default directory should be the target directory, i.e., the directory in which you want to put the compiled library.
The second argument is the name of the operating system (Arg#2 from the above table); if you omit it or supply an unrecognized name, makemake will indicate the allowed values.
On some operating systems, where more than one Fortran or C compiler is available, a third argument is required (Arg#3 from the above table); usually this is composed of the two compiler names separated by an underscore. If you omit it, makemake will indicate the allowed values.

Once you have supplied valid arguments, makemake may complain that it can't find the drivers.list file. Go back to step 4!
Example
% ../pgplot/makemake ../pgplot sol2 f77_gccFor additional information, read file ../pgplot/sys_sol2/aaaread.meReading configuration file: ../pgplot/sys_sol2/f77_gcc.confSelecting uncommented drivers from ./drivers.listFound drivers GIDRIV NUDRIV PPDRIV PSDRIV TKDRIV TTDRIV WDDRIV XMDRIV XWDRIVCreating make file: makefileDetermining object file dependencies.%
The script makemake generates a file makefile for subsequent use, a Fortran file grexec.f that calls the selected device drivers, and a text file rgb.txt that contains color definitions for use by routine PGSCRN. (If you already have a file rgb.txt, possibly modified with your own custom definitions, makemake does not modify it.) It also copies two Fortran include files that will be needed during compilation. So at this stage you will have at least the following files:
drivers.list grexec.f grpckg1.inc makefile pgplot.inc rgb.txt
You should check that these files have been created, and you should also check that the list of drivers that makemake says that it found corresponds to those you selected in drivers.list.
If your UNIX system is not one of the supported systems listed above, create your own configuration file in the target directory, with name local.conf. It is best to copy one of the configuration files provided (from pgplot/sys_*/*.conf, and then edit it following the comments in the file. The makemake procedure will use local.conf if it exists in the current directory, and if you do not specify Arg#3. Note that you must still specify Arg#2 (operating system). For more information about configuration files, see Porting PGPLOT, or consult tjp·astro.caltech.edu.
Use `make' to compile the code
Now use the UNIX make command to compile the PGPLOT library following the instructions in makefile:
make
By default, make will generate: an object-module library, libpgplot.a; a shareable library (if possible on the selected operating system), the binary PGPLOT font file grfont.dat, the demonstration programs pgdemo*, and a documentation file pgplot.doc. In addition, if the /XWINDOW and/or /XSERVE driver was selected in step 4, it will generate a program pgxwin_server, and if the /XDISP driver was selected, it will generate a program pgdisp.

If this step proceeds satisfactorily, you may want to type
make clean
to remove unneeded intermediate files. You will then have the following files in the current directory:
drivers.list grexec.f grfont.dat (binary font file)* libpgplot.a (PGPLOT library)* libpgplot.so (shared library, optional)* makefile pgdemo1 ... pgdemo16 (demonstration programs) pgdisp (required by /XDISP driver)* pgplot.doc (ASCII documentation file) pgxwin_server (required by /XWINDOW driver)* rgb.txt (color name database)*
If you requested XMDRIV or TKDRIV, you will also have some of the following files:
pgmdemo (executable demo program) libXmPgplot.a (object library required by PGPLOT/Motif applications)* XmPgplot.h (header file required by PGPLOT/Motif applications)* libtkpgplot.a (object library required by PGPLOT/Tk applications)* pgtkdemo (executable demo program) pgtkdemo.tcl (script used by demo program) tkpgplot.h (header file required by PGPLOT/Tk applications)*
If you want to copy the compiled version of PGPLOT to another directory, you must copy at least the files marked with an asterisk (*). The documentation file contains the PGPLOT subroutine descriptions, which are also available in the manual.
Install the C binding
Optionally, install and test the C binding for PGPLOT. This requires an ANSI C compiler (that understands function prototypes) and is not available on all systems.
make cpg
This creates three files:
cpgplot.h (ANSI C header file) libcpgplot.a (library containing the C binding) cpgdemo (demonstration program)
Note: The installation procedure does not create a shared library for the C binding. If you want one, you can create it by hand using the appropriate commands for your system, e.g. for some versions of Linux,
ld -shared -o libcpgplot.so --whole-archive libcpgplot.a

Run the demonstration programs
Run the demonstration programs on your selected devices and verify that they run satisfactorily.
Before running any PGPLOT program, you must ensure that the environment variable PGPLOT_DIR is correctly defined. This is the name of the directory in which PGPLOT will look for the files grfont.dat and rgb.txt (unless environment variables PGPLOT_FONT and PGPLOT_RGB are defined to override this default behavior), and, if needed, the X-window server program pgxwin_server:
UNIX csh: setenv PGPLOT_DIR /usr/local/pgplot/UNIX sh: PGPLOT_DIR="/usr/local/pgplot/"; export PGPLOT_DIR
It is also convenient, but not essential, to define a default PGPLOT device with environment variable PGPLOT_DEV, e.g.
UNIX csh: setenv PGPLOT_DEV /xwindow
Other PGPLOT environment variables are described in the manual.
When using a UNIX shared library (e.g., on Solaris 2.x), you may also need to put the PGPLOT directory in your loader search path, defined in environment variable LD_LIBRARY_PATH.
To run a program, type its name (with directory if the current directory is not in your path):
./pgdemo1
All the demonstration programs prompt for a device name and type. Type a question mark ? to see a list of the available device types and verify that PGPLOT has been configured properly.
Points to check for: the PGPLOT program correctly reads the font file and displays superscripts, subscripts and special characters (pgdemo2); the PGPLOT program can read the color database (pgdemo10); on interactive devices, the cursor works correctly (pgdemo5, pgdemo6).
To test the PGPLOT Motif widget driver, run pgmdemo in the same way as the other demonstration programs. You must first ensure that an X-window display is available and that environment variable PGPLOT_DIR is correctly defined.
To test the PGPLOT Tk/Tcl widget driver, type
pgtkdemo pgtkdemo.tcl
See the documentation for the driver for more information.
Note: The installation procedure does not install the Tk demo correctly on Digital Unix (4.0B). The demos program pgtkdemo is unable to read command-line arguments. Use the following commands to compile and link the demo:
cc -c -I`pwd` -I/usr/local/include pgtkdemo.c
cc -o pgtkdemo pgtkdemo.o -L`pwd` -ltkpgplot -lcpgplot -lpgplot \

-L/usr/local/shlib/alpha -ltk -ltcl -lX11 -lUfor -lfor -lm
(i.e., omit -Dmain=MAIN__ and use cc instead of f77 for the link step.)
Install documentation files (optional)
The standard installation procedure creates an ASCII text file containing synopses of all the PGPLOT subroutines: pgplot.doc.
A documentation file in HTML format that can be displayed with a Web browser or an HTML reader can be created by typing:
make pgplot.html
This file is created by executing a perl program to extract the documentation from the source code. If you do not have perl installed on your system, you can access the file at URL http://www.
astro.caltech.edu/~tjp/pgplot/subroutines.html. You may need to edit the first line of file pgplot/
makehtml to include the correct commands for invoking perl on your system.
A documentation file in LaTeX format (Appendix A of the manual) can be created by typing
make pgplot-routines.tex
This file is also created by executing a perl program to extract the documentation from the source code. You may need to edit the first line of file pgplot/maketex to include the correct commands for invoking perl on your system. To print this file, you will need to run LaTeX to create a dvi file and a dvi interpreter to print it, e.g. (on Unix systems)
latex pgplot-routines dvips pgplot-routines -o
Install the library of obsolete routines (optional)
The library libpgobs.a includes some obsolete PGPLOT routines. If you have old programs that use these routines, you can install the library by
make libpgobs.a
However, these routines will not be included in future versions of PGPLOT, so you should rewrite your programs to avoid their use.
PGPLOT Tim Pearson, California Institute of Technology, tjp·astro.caltech.edu
Copyright © 1995-1999 California Institute of Technology

PGPLOT Installation Instructions: LINUX systems
Version 5.2.0
For LINUX systems, I recommend installing from the source code, following the standard UNIX instructions. This will ensure that the library is compiled with the
same version of the compilers that you will use with application programs, and allows you to select which PGPLOT device drivers are included in the library.
Precompiled versions are available for some varieties of LINUX, however, containing a limited set of device drivers. I did not create these myself, and if you have problems with them, I suggest that you obtain the source distribution.
If anyone wishes to make other binary packages, I would appreciate it if they would consult me first.
Linux for Astronomy
PGPLOT is included on the Linux for Astronomy CD-ROMs, available from The
Random Factory.
Debian
G. John Lapeyre ([email protected]) has put source code and binary
packages on his Web page at http://physics.arizona.edu/~lapeyre/pgplot/. They are
also available at the official Debian site, http://cgi.debian.org/www-master/debian.
org/Packages/unstable/math/pgplot.html and mirrors.
ELF
Evgeny Stambulchik ([email protected]) has created a
precompiled ELF package:
● http://sunsite.unc.edu/pub/Linux/devel/lang/fortran/pgplot5.2.0.bin.lsm
● http://sunsite.unc.edu/pub/Linux/devel/lang/fortran/pgplot5.2.0.bin.tgz
PGPLOT

Tim Pearson, California Institute of Technology, tjp戢stro.caltech.edu
Copyright © 1997 California Institute of Technology

PGPLOT Installation Instructions: VMS systems
Version 5.2.0
Note: The following instructions refer to two directories, the distribution (source) directory which will contain the PGPLOT source code directory tree, and the binary directory in which the machine-specific libraries, data files, and demonstration programs will be created. It is recommended that you create new, empty directories for these. They should not be the same directory. In the examples below, these directories are named
USR:[LOCAL.PGPLOT] (distribution directory) USR:[LOCAL.PGBIN] (binary directory)
but you can use any convenient names. Unusual (system) privileges are not required to install PGPLOT, assuming you have write access to the directories. In a mixed VAX-Alpha cluster, you can use a single distribution directory, but you will need two binary directories, one for each architecture. The distribution directory may be deleted after the installation has been competed, but it will be needed if you later decide to select different device drivers..
1. Copy the distribution file
Copy the distribution file by anonymous ftp from Caltech. Use anonymous ftp (user: anonymous, password: your id username@machine) to node ftp.astro.caltech.edu.
The distribution file is a UNIX tar file compressed with Gzip. Issue the following ftp commands to retrieve the file:
cd pub/pgplot binary get pgplot5.2.tar.gz pgplot.tar-gz
(Note that you need to provide a VMS-compatible output file name in the get command.)
2. Decompress the files
You will need two programs to decompress and extract the contents of the distribution file: gunzip and vmstar. These programs are not part of VMS, but are widely available on the Internet, e.g., at
http://www.openvms.digital.com/openvms/freeware/cd.html

Use gunzip to decompress the distribution file, e.g.,
$ gunzip pgplot.tar-gz
Then use vmstar to extract the contents of the archive:
$ set default USR:[LOCAL} $ vmstar/extract/verbose pgplot.tar OR $ vmstar xvf pgplot.tar $ delete pgplot.tar;
This will create a subdirectory [.PGPLOT] (and lower-level subdirectories) in the current directory, e.g., USR:[LOCAL.PGPLOT...]. Make sure that your current directory is where you want to create the ``PGPLOT distribution'' directory tree.
3. Create the binary directory
Create a writable directory in which the PGPLOT library and associated files will be created. One such directory is needed for each different binary system; e.g., you may want separate directories for VAX and Alpha.
$ create/directory USR:[LOCAL.PGBIN] $ set default USR:[LOCAL.PGBIN]
Do not try to create the PGPLOT library in the source (``distribution'') directory.
4. Select device drivers
Configure PGPLOT by selecting device drivers from the available list. First copy the file drivers.list from the distribution directory to the binary directory, and then use a text editor to select device drivers. This file contains one line for each available device driver: delete the exclamation mark (!) at the beginning of the line to include the driver, or ensure that an exclamation mark is present if you want to exclude the driver. Many of the drivers can be used only on certain operating systems (see notes in drivers.list), so include only the drivers you plan to use. PGPLOT can later be reconfigured by restarting the installation at this step. Most installations should include: the null device (/NULL), PostScript printers (/PS, /VPS, /CPS, and /VCPS), Tektronix terminals (/TEK, /XTERM, and possibly other variants), and, if the X window system (DECwindows) is available, the X window drivers (/XWIN, /XSERV). You may also wish to include drivers for GIF files (/GIF, /VGIF) or some of the other printers.
$ copy USR:[LOCAL.PGPLOT]drivers.list [] $ edit drivers.list
5. Compile the library and demonstration programs
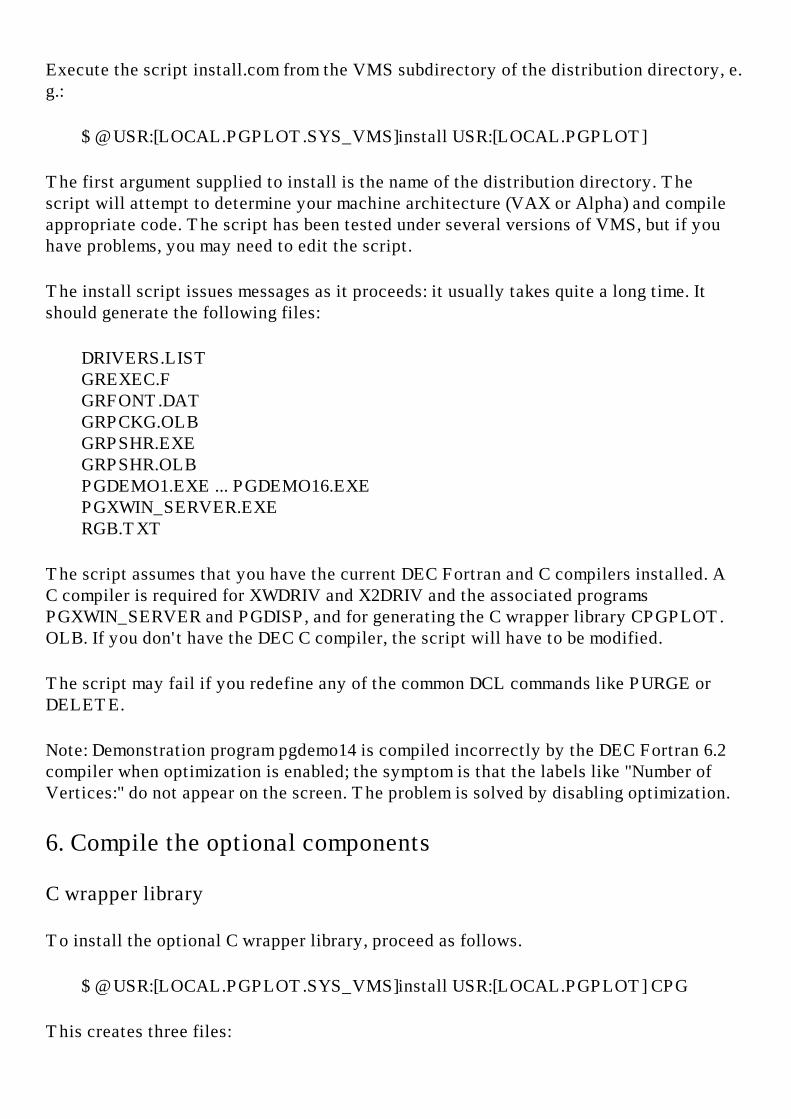
Execute the script install.com from the VMS subdirectory of the distribution directory, e.g.:
$ @USR:[LOCAL.PGPLOT.SYS_VMS]install USR:[LOCAL.PGPLOT]
The first argument supplied to install is the name of the distribution directory. The script will attempt to determine your machine architecture (VAX or Alpha) and compile appropriate code. The script has been tested under several versions of VMS, but if you have problems, you may need to edit the script.
The install script issues messages as it proceeds: it usually takes quite a long time. It should generate the following files:
DRIVERS.LIST GREXEC.F GRFONT.DAT GRPCKG.OLB GRPSHR.EXE GRPSHR.OLB PGDEMO1.EXE ... PGDEMO16.EXE PGXWIN_SERVER.EXE RGB.TXT
The script assumes that you have the current DEC Fortran and C compilers installed. A C compiler is required for XWDRIV and X2DRIV and the associated programs PGXWIN_SERVER and PGDISP, and for generating the C wrapper library CPGPLOT.OLB. If you don't have the DEC C compiler, the script will have to be modified.
The script may fail if you redefine any of the common DCL commands like PURGE or DELETE.
Note: Demonstration program pgdemo14 is compiled incorrectly by the DEC Fortran 6.2 compiler when optimization is enabled; the symptom is that the labels like "Number of Vertices:" do not appear on the screen. The problem is solved by disabling optimization.
6. Compile the optional components
C wrapper library
To install the optional C wrapper library, proceed as follows.
$ @USR:[LOCAL.PGPLOT.SYS_VMS]install USR:[LOCAL.PGPLOT] CPG
This creates three files:

CPGPLOT.H (ANSI C header file) CPGPLOT.OLB (library containing the C binding) CPGDEMO.EXE (demonstration program)
PGDISP program
The PGDISP program is required if you selected the /XDISP device driver. Use of this driver is not recommended: you should use the standard X Window driver (/XWIN or /XSERV) instead.
$ @USR:[LOCAL.PGPLOT.SYS_VMS]install USR:[LOCAL.PGPLOT] PGDISP
This adds one file, PGDISP.EXE. The PGDISP program sometimes gives compilation problems. Most of these are non-fatal warnings that can be ignored.
Motif support and example files
If you plan to develop Motif applications that use the PGPLOT widget, or if you want to inspect a sample Motif application, you will need to do this step. You must first: (a) ensure that the Motif header files and libraries are installed on your system; (b) select XMDRIV in drivers.list before installing the PGPLOT library; and (c) install the C wrapper library. Execute the following command:
$ @USR:[LOCAL.PGPLOT.SYS_VMS]install USR:[LOCAL.PGPLOT] PGMDEMO
This creates five files:
PGMDEMO.EXE (executable demo program) PGMOTIF.OPT (linker options file for linking PGPLOT/Motif applications) PGXWIN.OBJ (object module required by PGPLOT/Motif applications) XMPGPLOT.OBJ (object module required by PGPLOT/Motif applications) XMPGPLOT.H (header file required by PGPLOT/Motif applications)
(This step may not work on all VMS systems: there are many differences between the various available versions of the DEC C compiler and DECwindows Motif. If you get error messages, you may need to modify file [local.pgplot.sys_vms]make_pgmdemo.com.)
7. Define logical names
Before running any PGPLOT program, you must ensure that the following logical names are correctly defined. The logical names may be placed in the process table or the system table. It may be convenient to place the definitions in LOGIN.COM.
GRPSHR This should point to the PGPLOT shared library, GRPSHR.EXE, with complete directory information, e.g.,

$ define GRPSHR PGPLOT_DIR:GRPSHR.EXE
If this logical name is not defined, RUN will look for GRPSHR.EXE in the system library directory (SYS$LIBRARY).
PGPLOT_DIR This is the name of the directory in which PGPLOT will look for the files grfont.dat and rgb.txt (unless logical names PGPLOT_FONT and PGPLOT_RGB are defined to override this default behavior), and, if needed, the X-window server program pgxwin_server:
$ define PGPLOT_DIR USR:[LOCAL.PGBIN]
PGPLOT_DEV It is also convenient, but not essential, to define a default PGPLOT device with logical name PGPLOT_DEV, e.g.
$ define PGPLOT_DEV "/xwin"
LNK$LIBRARY If you develop PGPLOT programs, you can arrange for the linker to automatically scan the PGPLOT library by naming GRPSHR.OLB in one of the LNK$LIBRARY* logical names, e.g.
$ define LNK$LIBRARY PGPLOT_DIR:GRPSHR.OLB
If you do not do this, you will need to include this library (note: GRPSHR.OLB, not GRPSHR.EXE) in your LINK commands.
Other PGPLOT logical names (environment variables) are described in the manual.
8. Run the demonstration programs
Run the demonstration programs on your selected devices and verify that they run satisfactorily.
To run a program, use the RUN command:
$ run pgdemo1 $ run pgdemo2 ... $ run cpgdemo ! optional component $ run pgmdemo ! optional component

All the demonstration programs prompt for a device name and type. Type a question mark ? to see a list of the available device types and verify that PGPLOT has been configured properly.
Points to check for: the PGPLOT program correctly reads the font file and displays superscripts, subscripts and special characters (pgdemo2); the PGPLOT program can read the color database (pgdemo10); on interactive devices, the cursor works correctly (pgdemo5, pgdemo6).
9. Install the documentation files
Unlike the UNIX installation procedure, the VMS installation procedure does not generate documentation. A list of subroutine synopses is available in a variety of formats by anonymous ftp from ftp://ftp.astro.caltech.edu/pub/pgplot/DOC/:
● pgplot.doc (plain ASCII file)
● pgplot.hlp (VMS help format)
● pgplot.html (HTML [WWW] format)
● pgplot.ps (PostScript)
The help file can be installed in a VMS help library with a DCL command like the following:
$ library/insert/help pgplot.hlb pgplot.hlp
PGPLOT
Tim Pearson, California Institute of Technology, tjp戢stro.caltech.edu
Copyright © 1997 California Institute of Technology

PGPLOT Installation Instructions: Windows 95/98/NT with Absoft Pro Fortran
PGPLOT version 5.2.0
Supported system: Microsoft Windows 95/98 or Windows NT with Absoft Pro Fortran 6.0, from Absoft Corporation, 2781 Bond Street, Rochester Hills, MI 48309, USA.
http://www.absoft.com
I am presently installing and testing PGPLOT under this system, and full instructions should be available soon. Contact me for additional information. I am grateful to Absoft Corporation for providing a copy of the compiler.
Most of the PGPLOT code, including the standard drivers (PostScript, GIF), should work without change on this system. There is currently no driver to display PGPLOT graphics in a Windows screen window; this is obviously a major drawback. However, I cannot yet predict when such a driver will be available. Anyone interested in providing such a driver should contact me to avoid duplication of effort.
PGPLOT
Tim Pearson, California Institute of Technology, tjp·astro.caltech.edu
Copyright © 1999 California Institute of Technology

PGPLOT Installation Instructions: Windows 95/NT with Compaq Visual Fortran
PGPLOT version 5.2.2
The following notes are based on information received from Phil Seeger. Please send any suggestions for improvement to Tim Pearson.
Supported system: Microsoft Windows 95 or Windows NT with Compaq Visual Fortran 5.0. Information about the compiler can be found at http://www.digital.com/
fortran/index.html.
Note: The Compaq Visual Fortran driver for Windows uses an extension (quickwin) which prevents the PGPLOT library from being dynamically loadable. So, although PGPLOT itself works, code generated with it cannot be made into a shared-object. Among other things, this means it cannot be used with PGPERL.
Installation Instructions
1. Download PGPLOT by your favorite method from URL: ftp://ftp.astro.caltech.edu/pub/pgplot/pgplot5.2.tar.gz.
2. Uncompress the file (gunzip) and extract the files from the tar archive (tar cv). Versions of gunzip and tar for Windows are available on the Web. One program that will handle both steps is WinZip. It is available from http://www.
winzip.com and many other web sites.
The files in the tar archive are organized in a hierarchical directory structure, with the top level directory called PGPLOT. You will need the files from the following directories:
x:\PGPLOT \CPG \DRIVERS \EXAMPLES \FONTS \PGMF \SRC \SYS_WIN

The other SYS_* directories can be ignored.
3. Then follow the installation instructions in PGPLOT\SYS_WIN\AAAREAD.ME:
PGPLOT 5.2.0 for Windows95/98/NT and Microsoft / Digital / Compaq Fortran P. A. Seeger, August 27, 1998 (document revised July 15, 2000) e-mail: [email protected] (Based on C. T. Dum, May 1995)
The following notes describe the porting of Tim Pearson's PGPLOT 5.2.0to Microsoft Windows95/98 (or WindowsNT), using Microsoft Developer Studio and the corresponding Fortran compiler. The 32-bit Windows systems are easy to use, but most importantly remove the severe memory restrictionsof DOS. The size of applications which can be linked with PGPLOT.LIB is limited only by total physical and virtual memory. The graphics librariesMSFLIB (Microsoft) or DFLIB (Digital/Compaq) also include many additional (system) functions known from C. Even for an old-fashioned command-line Fortran programer (like PAS), it is relatively easy to add features like dialog boxes and custom menus.
Once PGPLOT.LIB is built, applications are most easily compiled using the Microsoft Developer Studio. The application type must be "QuickWin",or it must be compiled with command line option "/MW". Programs execute in a text window, with the graphical output in up to 8 separate child windows. Cursor functions (including rubber-band modes) are implemented by moving the mouse and typing a keyboard key. There are three versionsof the Developer Studio. You MUST have the same version for Fortran and for C++ in order to mix languages. Although the Fortran code is the same,the user interface is slightly different. The versions are Developer Studio 4.0, Microsoft PowerStation Fortran 4.0 Developer Studio 5.0, Digital Visual Fortran 5.0 Developer Studio 6.0, Digital Visual Fortran 6.0 or Compaq Visual Fortran 6.1NOTE: applications developed in these Fortrans will NOT execute under DOS or Windows 3.x (no, not even with WIN32s installed).
The steps in building PGPLOT.LIB are the following:
1. Download PGPLOT 5.2.0 by your favorite method. I decompressed ver. 5.0.3 on VAX-VMS system, and ver. 5.1.beta from a Unix machine ("uncompress" followed by "tar -xcf"). But I have now acquired WinZip (Nico Mak Computing, Inc., www.winzip.com) which performs Gunzip

and tar in the PC (very good program - I even sent them the $29 fee!). Just make the file name "PGPLOT52.TGZ" and open it in WinZip.
2. Create an appropriate subdirectory structure; e.g. x:\PGPLOT \SRC \SYS_WIN \DRIVERS \FONTS \EXAMPLES where x: is either C: or another hard disk in your system. Extract files from the corresponding subdirectories of the downloaded .TGZ file. Note: The copy of GRGFIL.F from the \SRC folder must be omitted in favor of the copy in \SYS_WIN to get an appropriate default directory. (Personal preference note: I also copy \APPLICAT\PLOT10\PLOT10.F into the \SRC subdirectory.)
The files in \SYS_WIN should include AAAREAD.ME (this file) AAAREAD.ME2 (information for C programmers) GIDRIV.F (Fortran90 version of GIF driver, without "C" calls) GRDOS.F GREXEC.F GRGFIL.F (replace the version in \SRC) GRSY00.F (not system dependent) PGBIND.MAK (see AAAREAD.ME2 for discussion) W9DRIV.F (the driver itself, with attached subroutines)
The file W9DRIV.F as included is appropriate for Digital or Compaq. To convert to Microsoft, replace the fourth line USE DFLIB with USE MSFLIB This same change must be made in subroutines GRW900 and GRW901.
3. If you did not use C: in step 2, create a directory C:\PGPLOT and copy RGB.TXT to it from x:\PGPLOT. You also need to compile and execute the program PGPACK from subdirectory x:\PGPLOT\FONTS to convert file GRFONT.TXT to binary file GRFONT.DAT. To run PGPACK in the Windows environment, put this statement before the READs: OPEN (5, FILE='x:\pgplot\fonts\grfont.txt') Likewise the OPEN statement for the output can be modified: OPEN (2, FILE='c:\pgplot\grfont.dat') The output file is different for Microsoft and Digital/Compaq. (The directory with these two files can be elsewhere if identified by environment variable PGPLOT_DIR, or the full [path]filenames can be

given in environment variables PGPLOT_RGB and PGPLOT_FONT.)
4. In the Developer Studio, in the File/New menu, Create a new Project Workspace of Type "Static Library", Name PGPLOT, Location x:\MSDEV\PROJECTS\ (ver. 4) or x:\Program Files\DevStudio\MyProjects\ (ver. 5) or x:\Program Files\Microsoft Visual Studio\MyProjects\ (ver. 6). Use the Insert/"Files into Project..." (ver. 4) or Project/Add to Project/Files... (vers. 5/6) and the search box to associate the following files with the project: x:\PGPLOT\SRC\*.F x:\PGPLOT\SYS_WIN\*.F x:\PGPLOT\DRIVERS\LXDRIV.F,NUDRIV.F,PSDRIV.F (The dependent *.INC files will be included automatically.)
5. Build the project. For Digital/Compaq, the following compiler option is required for GIDRIV.F (because Digital changed the default for length of direct-access records from bytes to 4-byte words): /assume:byterecl This option is set as follows: Project/Settings/Fortran tab Settings For: All Configurations Source files: Gidriv.f Category: Fortran Data ver. 5, check: Use Bytes as Units for Unformatted Files ver. 6, Data Options check: Use Bytes as RECL= unit for Unformatted Files The remaining default compiler options are suitable; in particular, the Debug configuration is not optimized, but the Release configuration uses full optimization. (If the choice of "Release" is not apparent, use Build/Set Active Configuration...) From the Build menu, choose "Build PGPLOT.LIB". Expect 7 Warning messages with ver. 4, or 2 with vers. 5/6. When both Debug and Release have successfully completed, I like to copy the Release version of the library so that subsequent applications can find it more easily: ver. 4, from x:\MSDEV\PROJECTS\PGPLOT\RELEASE to x:\MSDEV\LIB ver. 5, from x:\Program Files\DevStudio\MyProjects\PGPLOT\RELEASE to x:\Program Files\DevStudio\DF\LIB ver. 6, from x:\Program Files\Microsoft Visual Studio\MyProjects\PGPLOT\RELEASE to x:\Program Files\Microsoft Visual Studio\DF98\LIB
6. Run the examples. In the same Project Workspace, use File/New and the Projects tab (or if using ver. 4, Insert/Project...) to create a

"QuickWin Application", Name EXAMPLES. Then use Project/Dependencies (ver. 4, Build/Subprojects...) to specify that PGPLOT is a subproject of EXAMPLES. One at a time, use Project/Add to Project/Files... (ver. 4, Insert/Files into Project...) to select a file from x:\PGPLOT\EXAMPLES. (The previous file may be deleted from the FileView window when success- fully completed.) From the Build menu, choose "Execute EXAMPLES.EXE". The first page of the first test (PGDEMO1.F) should be a parabola. If there is no text on the plot, then you have not successfully created or located the file GRFONT.DAT (see step 3 above). If windows are created but neither graphics nor text appear, the problem may be that the display is set to a mode which doesn't use the SVGA color registers; decrease the color palette to 16M or fewer colors. After successfully testing the library, you may delete all of the PGPLOT folders from x:\MSDEV\PROJECTS (ver. 4) or from x:\Program Files\DevStudio\MyProjects\ (ver. 5) or from x:\Program Files\Microsoft Visual Studio\MyProjects\ (ver. 6).
7. Drivers for Windows95/NT, PostScript, GIF, LaTeX, and the Null driver are included by default. If you add additional drivers (which may require debugging to eliminate perceived syntax errors etc.) to the library, then the CASE structure in subroutine GREXEC.F must also be modified to reflect the changes; also, NDEV must reflect the total number of drivers. The default graphic window size for device type "/W9" is 800*600 with 236 colors (SVGA); 20 colors are reserved for system use. The default can be changed by setting an environment variable (either in AUTOEXEC.BAT, or from a command line before starting the application) as follows: SET PGPLOT_VIDEO=VGA (or V), 640 * 480 SVGA (or S), 800 * 600 XGA (or X), 1024 * 768 ZGA (or Z), 1280 * 1024 Modes may also be selected by using alternate device types "/WV", "/WS", "/WX", or "/WZ". Modes exceeding the capability of your Windows screen driver will be reduced to the maximum available. For an example of the 236-color modes, see PGDEMO4. For an example of different resolutions, try using "Menu/WV" for the first window and "Graphs/WX" for the second window in PGDEMO13. (Note the use of the device specification to name the window.)
8. The cursor is emulated by an interrupt driven mouse routine (see GRW901 in file W9DRIV.F). The cursor moves continuously whenever the window is selected, but the position is not returned to the calling program until a key has been struck, and the character is also returned. Control then returns to the "text" window for any additional input or processing. If you lose track, there is a status message at the bottom of the frame window which tells you which

window is waiting for input (except, see Note in previous section). The color of the cursor may be dim against some backgrounds (especially green in the default palette), but you can usually see it at the tip of the mouse arrow while you move it around. You might try using PGBAND mode 7 for the cursor to improve visibility. See especially programs PGDEMO5 and PGDEMO6.
9. Plots can be clipped and copied to other applications, such as Word. Unfortunately, black is black and white is white, so printing uses a lot of ink and the white lines tend to disappear. One option is to exchange palette colors 0 and 1 in PGPLOT with CALL PGSCR(0, 1., 1., 1.) !black becomes white CALL PGSCR(1, 0., 0., 0.) !white becomes black before making the version to be printed; another is to cut and paste to a utility (I use Paint-Shop-Pro) in which you can adjust the color palette; and a third way is to specify either the "filename.ps/PS" or "filename.gif/GI" device and write a file. (Note: this might be a good use for a custom menu entry in your application.) Yet another option is to create a second device window and change the color palette only in that window. (See PGDEMO13 for an example of multiple simultaneous windows.)
10. Finally, this port has been thoroughly tested (starting with earlier versions of PGPLOT, and using the Microsoft compiler), but no responsibility for any damages is accepted (by either [PAS], [CTD], or even [TJP])! User input concerning "features" of the driver or this document is welcomed.
*** Frequently Asked Questions ***
A. "A window is created, but nothing appears in it." Most new graphics driver cards do not emulate color registers when they run in "True Color (32 bit)" mode. You will have to reset the Display Properties (Settings tab) to a smaller number of colors, such as "High Color (16 bit)."
B. "Graphs appear, but no labels." Review step 3 above. The version of file GRFONT.DAT for your compiler must be in directory C:\PGPLOT\.
C. "All of the demo programs work, except PGDEMO3 gives a Linker error." There is a bug in PGDEMO3 that is only picked up by these compilers. About 27 lines from the end of PGDEMO3.F, the statement CALL PGVSTD(0.05,0.95,0.05,0.95) must be replaced with
CALL PGVSTD
D. "I can't read the hardcopy files created with "/GI". Review step 5 above. Some applications (namely Paint-Shop-Pro) will read files written when the code is compiled without this option, but most will not. If you read the file in Paint-Shop-Pro and then save it, other applications will be able to read it.
PGPLOT
Tim Pearson, California Institute of Technology, tjp戢stro.caltech.edu
Copyright © 1997-2002 California Institute of Technology

PGPLOT Installation Instructions: Windows 95/NT with PowerStation Fortran
Version 5.2.0
The following notes are based on information received from P. A. Seeger, C. T. Dum, and Joe Walston. Please send any suggestions for improvement to Tim Pearson.
Supported system: Microsoft Windows 95 or Windows NT with Microsoft PowerStation Fortran 4.0. Note: applications developed in this Fortran will not execute under DOS or Windows 3.x (no, not even with WIN32s).
Once PGPLOT.LIB is built, applications are most easily compiled using the Microsoft Developer Studio. The application type must be "QuickWin", or it must be compiled with command line option "/MW". Programs execute in a text window, with the graphical output in up to 8 separate child windows. Cursor functions (including rubber-band modes) are implemented with the mouse.
Installation Instructions
1. Download PGPLOT by your favorite method from URL: ftp://ftp.astro.caltech.edu/pub/pgplot/pgplot5.2.tar.gz.
2. Uncompress the file (gunzip) and extract the files from the tar archive (tar cv). Versions of gunzip and tar for Windows are available on the Web. One program that will handle both steps is WinZip. It is available from http://www.
winzip.com and many other web sites.
The files in the tar archive are organized in a hierarchical directory structure, with the top level directory called PGPLOT. You will need the files from the following directories:
x:\PGPLOT \CPG \DRIVERS \EXAMPLES \FONTS \PGMF \SRC \SYS_WIN

The other SYS_* directories can be ignored.
The directory PGPLOT\SYS_WIN contains system-specific files for this operating system and compiler:
GRDOS.F GREXEC.F GRGFIL.F GRSY00.F W9DRIV.F (screen driver) PGBIND.MAK
3. Then follow the instructions in PGPLOT\SYS_WIN\AAAREAD.ME (below). These instructions apply to both Microsoft PowerStation Fortran and Compaq/Digital Visual Fortran. Note that for PowerStation Fortran, you must edit the file W9DRIV.F.
PGPLOT 5.2.0 for Windows95/98/NT and Microsoft / Digital / Compaq Fortran P. A. Seeger, August 27, 1998 (document revised July 15, 2000) e-mail: [email protected] (Based on C. T. Dum, May 1995)
The following notes describe the porting of Tim Pearson's PGPLOT 5.2.0to Microsoft Windows95/98 (or WindowsNT), using Microsoft Developer Studio and the corresponding Fortran compiler. The 32-bit Windows systems are easy to use, but most importantly remove the severe memory restrictionsof DOS. The size of applications which can be linked with PGPLOT.LIB is limited only by total physical and virtual memory. The graphics librariesMSFLIB (Microsoft) or DFLIB (Digital/Compaq) also include many additional (system) functions known from C. Even for an old-fashioned command-line Fortran programer (like PAS), it is relatively easy to add features like dialog boxes and custom menus.
Once PGPLOT.LIB is built, applications are most easily compiled using the Microsoft Developer Studio. The application type must be "QuickWin",or it must be compiled with command line option "/MW". Programs execute in a text window, with the graphical output in up to 8 separate child windows. Cursor functions (including rubber-band modes) are implemented by moving the mouse and typing a keyboard key. There are three versionsof the Developer Studio. You MUST have the same version for Fortran and for C++ in order to mix languages. Although the Fortran code is the same,the user interface is slightly different. The versions are Developer Studio 4.0, Microsoft PowerStation Fortran 4.0
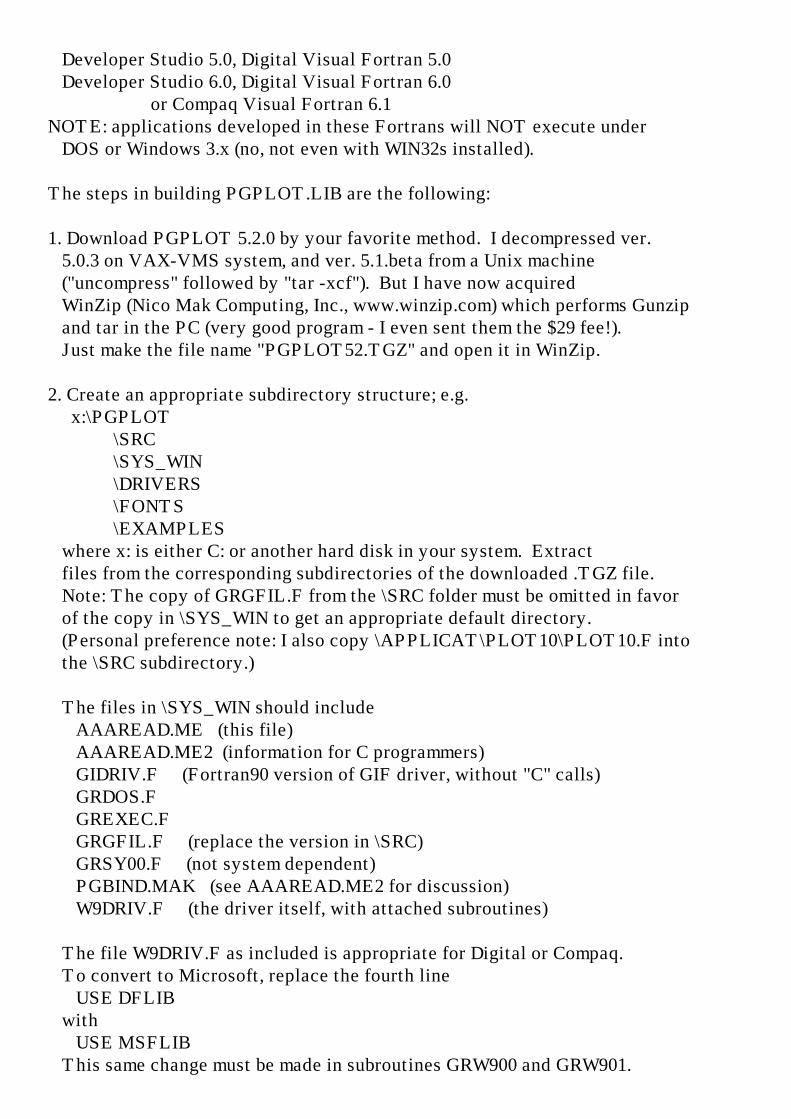
Developer Studio 5.0, Digital Visual Fortran 5.0 Developer Studio 6.0, Digital Visual Fortran 6.0 or Compaq Visual Fortran 6.1NOTE: applications developed in these Fortrans will NOT execute under DOS or Windows 3.x (no, not even with WIN32s installed).
The steps in building PGPLOT.LIB are the following:
1. Download PGPLOT 5.2.0 by your favorite method. I decompressed ver. 5.0.3 on VAX-VMS system, and ver. 5.1.beta from a Unix machine ("uncompress" followed by "tar -xcf"). But I have now acquired WinZip (Nico Mak Computing, Inc., www.winzip.com) which performs Gunzip and tar in the PC (very good program - I even sent them the $29 fee!). Just make the file name "PGPLOT52.TGZ" and open it in WinZip.
2. Create an appropriate subdirectory structure; e.g. x:\PGPLOT \SRC \SYS_WIN \DRIVERS \FONTS \EXAMPLES where x: is either C: or another hard disk in your system. Extract files from the corresponding subdirectories of the downloaded .TGZ file. Note: The copy of GRGFIL.F from the \SRC folder must be omitted in favor of the copy in \SYS_WIN to get an appropriate default directory. (Personal preference note: I also copy \APPLICAT\PLOT10\PLOT10.F into the \SRC subdirectory.)
The files in \SYS_WIN should include AAAREAD.ME (this file) AAAREAD.ME2 (information for C programmers) GIDRIV.F (Fortran90 version of GIF driver, without "C" calls) GRDOS.F GREXEC.F GRGFIL.F (replace the version in \SRC) GRSY00.F (not system dependent) PGBIND.MAK (see AAAREAD.ME2 for discussion) W9DRIV.F (the driver itself, with attached subroutines)
The file W9DRIV.F as included is appropriate for Digital or Compaq. To convert to Microsoft, replace the fourth line USE DFLIB with USE MSFLIB This same change must be made in subroutines GRW900 and GRW901.

3. If you did not use C: in step 2, create a directory C:\PGPLOT and copy RGB.TXT to it from x:\PGPLOT. You also need to compile and execute the program PGPACK from subdirectory x:\PGPLOT\FONTS to convert file GRFONT.TXT to binary file GRFONT.DAT. To run PGPACK in the Windows environment, put this statement before the READs: OPEN (5, FILE='x:\pgplot\fonts\grfont.txt') Likewise the OPEN statement for the output can be modified: OPEN (2, FILE='c:\pgplot\grfont.dat') The output file is different for Microsoft and Digital/Compaq. (The directory with these two files can be elsewhere if identified by environment variable PGPLOT_DIR, or the full [path]filenames can be given in environment variables PGPLOT_RGB and PGPLOT_FONT.)
4. In the Developer Studio, in the File/New menu, Create a new Project Workspace of Type "Static Library", Name PGPLOT, Location x:\MSDEV\PROJECTS\ (ver. 4) or x:\Program Files\DevStudio\MyProjects\ (ver. 5) or x:\Program Files\Microsoft Visual Studio\MyProjects\ (ver. 6). Use the Insert/"Files into Project..." (ver. 4) or Project/Add to Project/Files... (vers. 5/6) and the search box to associate the following files with the project: x:\PGPLOT\SRC\*.F x:\PGPLOT\SYS_WIN\*.F x:\PGPLOT\DRIVERS\LXDRIV.F,NUDRIV.F,PSDRIV.F (The dependent *.INC files will be included automatically.)
5. Build the project. For Digital/Compaq, the following compiler option is required for GIDRIV.F (because Digital changed the default for length of direct-access records from bytes to 4-byte words): /assume:byterecl This option is set as follows: Project/Settings/Fortran tab Settings For: All Configurations Source files: Gidriv.f Category: Fortran Data ver. 5, check: Use Bytes as Units for Unformatted Files ver. 6, Data Options check: Use Bytes as RECL= unit for Unformatted Files The remaining default compiler options are suitable; in particular, the Debug configuration is not optimized, but the Release configuration uses full optimization. (If the choice of "Release" is not apparent, use Build/Set Active Configuration...) From the Build menu, choose "Build PGPLOT.LIB". Expect 7 Warning messages with ver. 4, or 2 with vers. 5/6. When both Debug and Release have successfully completed, I

like to copy the Release version of the library so that subsequent applications can find it more easily: ver. 4, from x:\MSDEV\PROJECTS\PGPLOT\RELEASE to x:\MSDEV\LIB ver. 5, from x:\Program Files\DevStudio\MyProjects\PGPLOT\RELEASE to x:\Program Files\DevStudio\DF\LIB ver. 6, from x:\Program Files\Microsoft Visual Studio\MyProjects\PGPLOT\RELEASE to x:\Program Files\Microsoft Visual Studio\DF98\LIB
6. Run the examples. In the same Project Workspace, use File/New and the Projects tab (or if using ver. 4, Insert/Project...) to create a "QuickWin Application", Name EXAMPLES. Then use Project/Dependencies (ver. 4, Build/Subprojects...) to specify that PGPLOT is a subproject of EXAMPLES. One at a time, use Project/Add to Project/Files... (ver. 4, Insert/Files into Project...) to select a file from x:\PGPLOT\EXAMPLES. (The previous file may be deleted from the FileView window when success- fully completed.) From the Build menu, choose "Execute EXAMPLES.EXE". The first page of the first test (PGDEMO1.F) should be a parabola. If there is no text on the plot, then you have not successfully created or located the file GRFONT.DAT (see step 3 above). If windows are created but neither graphics nor text appear, the problem may be that the display is set to a mode which doesn't use the SVGA color registers; decrease the color palette to 16M or fewer colors. After successfully testing the library, you may delete all of the PGPLOT folders from x:\MSDEV\PROJECTS (ver. 4) or from x:\Program Files\DevStudio\MyProjects\ (ver. 5) or from x:\Program Files\Microsoft Visual Studio\MyProjects\ (ver. 6).
7. Drivers for Windows95/NT, PostScript, GIF, LaTeX, and the Null driver are included by default. If you add additional drivers (which may require debugging to eliminate perceived syntax errors etc.) to the library, then the CASE structure in subroutine GREXEC.F must also be modified to reflect the changes; also, NDEV must reflect the total number of drivers. The default graphic window size for device type "/W9" is 800*600 with 236 colors (SVGA); 20 colors are reserved for system use. The default can be changed by setting an environment variable (either in AUTOEXEC.BAT, or from a command line before starting the application) as follows: SET PGPLOT_VIDEO=VGA (or V), 640 * 480 SVGA (or S), 800 * 600 XGA (or X), 1024 * 768 ZGA (or Z), 1280 * 1024 Modes may also be selected by using alternate device types "/WV", "/WS", "/WX", or "/WZ". Modes exceeding the capability of your Windows screen driver will be reduced to the maximum available. For

an example of the 236-color modes, see PGDEMO4. For an example of different resolutions, try using "Menu/WV" for the first window and "Graphs/WX" for the second window in PGDEMO13. (Note the use of the device specification to name the window.)
8. The cursor is emulated by an interrupt driven mouse routine (see GRW901 in file W9DRIV.F). The cursor moves continuously whenever the window is selected, but the position is not returned to the calling program until a key has been struck, and the character is also returned. Control then returns to the "text" window for any additional input or processing. If you lose track, there is a status message at the bottom of the frame window which tells you which window is waiting for input (except, see Note in previous section). The color of the cursor may be dim against some backgrounds (especially green in the default palette), but you can usually see it at the tip of the mouse arrow while you move it around. You might try using PGBAND mode 7 for the cursor to improve visibility. See especially programs PGDEMO5 and PGDEMO6.
9. Plots can be clipped and copied to other applications, such as Word. Unfortunately, black is black and white is white, so printing uses a lot of ink and the white lines tend to disappear. One option is to exchange palette colors 0 and 1 in PGPLOT with CALL PGSCR(0, 1., 1., 1.) !black becomes white CALL PGSCR(1, 0., 0., 0.) !white becomes black before making the version to be printed; another is to cut and paste to a utility (I use Paint-Shop-Pro) in which you can adjust the color palette; and a third way is to specify either the "filename.ps/PS" or "filename.gif/GI" device and write a file. (Note: this might be a good use for a custom menu entry in your application.) Yet another option is to create a second device window and change the color palette only in that window. (See PGDEMO13 for an example of multiple simultaneous windows.)
10. Finally, this port has been thoroughly tested (starting with earlier versions of PGPLOT, and using the Microsoft compiler), but no responsibility for any damages is accepted (by either [PAS], [CTD], or even [TJP])! User input concerning "features" of the driver or this document is welcomed.
*** Frequently Asked Questions ***
A. "A window is created, but nothing appears in it." Most new graphics driver cards do not emulate color registers when they run in "True Color (32 bit)" mode. You will have to reset the

Display Properties (Settings tab) to a smaller number of colors, such as "High Color (16 bit)."
B. "Graphs appear, but no labels." Review step 3 above. The version of file GRFONT.DAT for your compiler must be in directory C:\PGPLOT\.
C. "All of the demo programs work, except PGDEMO3 gives a Linker error." There is a bug in PGDEMO3 that is only picked up by these compilers. About 27 lines from the end of PGDEMO3.F, the statement CALL PGVSTD(0.05,0.95,0.05,0.95) must be replaced with CALL PGVSTD
D. "I can't read the hardcopy files created with "/GI". Review step 5 above. Some applications (namely Paint-Shop-Pro) will read files written when the code is compiled without this option, but most will not. If you read the file in Paint-Shop-Pro and then save it, other applications will be able to read it.
Using the C binding
The PGPLOT C binding (cpgplot) allows the Fortran PGPLOT library to be called from C programs, using C calling conventions. The following instructions apply to
● C programs compiled with MS Visual C++ V4.0; ● calling PGPLOT compiled with MS Powerstation Fortran V4.0; ● under MS Windows-95 or Windows-NT.
Other compilers may use different calling conventions and will require a different version of the C binding.
To build the cpgplot binding library, you will need the following files:
PGPLOT\CPG\PGBIND.C PGPLOT\SYS_WIN\PGBIND.MAK PGPLOT\CPG\PGBIND_PROTOTYPES
These files can be located anywhere convenient.
To build the library, from a console (DOS) window type
NMAKE /F PGBIND.MAK

This will create cpgplot.lib and cpgplot.h.
The makefile compiles pgbind.c (no unusual compiler flags are needed) to produce the pgbind program. It then produces the C wrapper functions (one file per wrapper) and the cpgplot.h header file using:
pgbind ms -w -h pgbind_prototypes
The cpg*.c files are then compiled and gathered into a library.
To use cpgplot in your programs, you should include cpgplot.h at the top of all C files that use cpgplot functions, and link your programs with both of cpgplot.lib and pgplot.lib.
For further information about using the C binding, see file
PGPLOT\CPG\CPGPLOT.DOC
or the Web page
http://www.astro.caltech.edu/~tjp/pgplot/cbinding.html
PGPLOT
Tim Pearson, California Institute of Technology, tjp戢stro.caltech.edu
Copyright © 1997-2002 California Institute of Technology

PGPLOT Installation Instructions: GNU-Win32
The GNU-Win32 tools are ports of the popular GNU development tools to Windows
NT/95 for the x86 and PowerPC processors.
To install PGPLOT in this environment, using g77 and gcc, follow the UNIX
installation instructions, using the following configuration file. (Better support will
be provided in a future version of PGPLOT.)
# The GNU g77 FORTRAN compiler and Gnu gcc C compiler.#---------------------------------------------------------------------- XINCL="" MOTIF_INCL="" FCOMPL="g77" FFLAGC="-Wall -O" FFLAGD="-fno-backslash" CCOMPL="gcc" CFLAGC="-DPG_PPU -O2" CFLAGD="-O2" PGBIND_FLAGS="bsd" LIBS="" RANLIB="ranlib" PGPLOT_LIB="-L\`pwd\` -lpgplot" CPGPLOT_LIB="-L\`pwd\` -lcpgplot -lpgplot"
This was contributed by David Billinghurst ([email protected]),
who writes:
To date I have only used PSDRIV.
There is a problem making libpgplot.a. I suspect a gnuwin32 bug. To work around it edit the makefile generated by makemake. Change
libpgplot.a : $(PG_ROUTINES) $(PG_NON_STANDARD) $(GR_ROUTINES) \ $(DISPATCH_ROUTINE) $(DRIVERS) $(SYSTEM_ROUTINES) ar ru libpgplot.a \ `ls $(PG_ROUTINES) \ $(PG_NON_STANDARD) $(GR_ROUTINES) $(DISPATCH_ROUTINE) \ $(DRIVERS) $(SYSTEM_ROUTINES) | sort | uniq` $(RANLIB) libpgplot.a
to

libpgplot.a : $(PG_ROUTINES) $(PG_NON_STANDARD) $(GR_ROUTINES) \ $(DISPATCH_ROUTINE) $(DRIVERS) $(SYSTEM_ROUTINES) ar ru libpgplot.a $^ $(RANLIB) libpgplot.a
PGPLOT
Tim Pearson, California Institute of Technology, tjp戢stro.caltech.edu
Copyright © 1997 California Institute of Technology

PGPLOT
Annotated List of Routines
Version 5.2
Many of the routines that set the values of parameters used by PGPLOT have corresponding inquiry routines that can be used to determine the current parameter values. Most of these routines have names starting PGQ... and are indicated in italics.
Opening, Closing, and Selecting Devices
Use PGOPEN to open a graphical device or file and select it for PGPLOT output, PGCLOS to close the device when graphical output is completed, and PGSLCT to switch subsequent output to a different open device. PGBEG is an alternative to PGOPEN, retained for compatibility with existing programs. PGEND can be used to close all open devices.
● PGOPEN : open a graphics device
● PGBEG : open a graphics device
● PGSLCT : select an open graphics device
● PGCLOS : close the selected graphics device
● PGEND : close all open graphics devices
● PGQID : inquire current device identifier
The following routines can be used to determine what types of graphics device are available - the list of types is installation-dependent.
● PGLDEV : list available device types on standard output
● PGQNDT : inquire number of available device types (New in version 5.2)
● PGQDT : inquire name of nth available device type (New in version 5.2)
After a graphics device has been opened, the following routines may be used to determine some of its device-dependent characteristics.
● PGQINF : inquire PGPLOT general information
● PGQCOL : inquire color capability

Controlling the View Surface
Use PGPAGE to start a new page, or PGERAS to clear the screen without starting a new page. On interactive devices, PGPLOT prompts the user before starting a new page unless told not to via PGASK.
● PGPAGE : advance to new page
● PGERAS : erase all graphics from current page
● PGASK : control new page prompting
The size of the view surface is device-dependent and is established when the graphics device is opened. Use PGQVSZ if you need to know the absolute size of the view surface. On some devices, it can be changed by calling PGPAP before starting a new page with PGPAGE. On some devices, the size can be changed (e.g., by a workstation window manager) outside PGPLOT, and PGPLOT detects the change when PGPAGE is used.
● PGPAP : change the size of the view surface
● PGQVSZ : inquire size of view surface
PGPLOT can divide the view surface into two or more panels; to request this, call PGSUBP after opening the device or before starting a new page. When the view surface is divided into panels, PGPAGE advances to the next panel, only clearing the screen or starting a new page after all the panels have been filled. It is also possible to move to a specific panel by calling PGPANL.
● PGSUBP : subdivide view surface into panels
● PGPANL : switch to a different panel on the view surface
To improve efficiency by buffering graphical output, group a sequence of PGPLOT routines between PGBBUF and PGEBUF calls. To force a screen update, call PGUPDT.
● PGBBUF : begin batch of output (buffer)
● PGEBUF : end batch of output (buffer)
● PGUPDT : update display
Windows and Viewports
Specify the viewport to indicate where on the device's view surface you want the graph to appear.

● PGSVP : set viewport (normalized device coordinates)
● PGVSIZ : set viewport (inches)
● PGVSTD : set standard (default) viewport
● PGQVP : inquire viewport size and position
Specify the window to define the range of your world-coordinate space that will be visible in the viewport.
● PGSWIN : set window
● PGWNAD : set window and adjust viewport to same aspect ratio
● PGQWIN : inquire window boundary coordinates
Normally all PGPLOT primitives except text are ``clipped'' at the edge of the viewport; use PGSCLP to disable or re-enable clipping.
● PGSCLP : enable or disable clipping at edge of viewport (New in version 5.2)
● PGQCLP : inquire clipping status (New in version 5.2)
Primitives
Lines
Straight lines and curves made up of straight-line segments can be specified either segment by segment (PGMOVE, PGDRAW) or by a list of points to be joined together (PGLINE).
● PGMOVE : move pen (change current pen position)
● PGDRAW : draw a line from the current pen position to a point
● PGQPOS : inquire current pen position
● PGLINE : draw a polyline (curve defined by line-segments)
Polygons and Filled Areas
Closed polygons, circles, and rectangles canbe outlined, filled with solid color, or shaded using hatching, depending on the current fill-area attributes.
● PGPOLY : draw a polygon, using fill-area attrutes
● PGCIRC : draw a circle, using fill-area attributes
● PGRECT : draw a rectangle, using fill-area attributes
Graph Markers

Use PGPT1 to mark a single point, PGPT to mark several points with the same symbol, or PGPNTS to mark several points with different symbols.
● PGPT1 : draw one graph marker (New in version 5.2)
● PGPT : draw several graph markers
● PGPNTS : draw several graph markers, not all the same
Text
The basic routine for drawing text is PGPTXT. PGTEXT provides a simplified interface for the commonest case.
● PGTEXT : write text (horizontal, left-justified)
● PGPTXT : write text at arbitrary position and angle
In order to correctly position text on a graph, it may be necessary to determine the space occupied by a text string without actually drawing it.
● PGLEN : find length of a string in a variety of units
● PGQTXT : find bounding box of text string
Arrows
An arrow is made up of a line (for the shaft) and a polygon (for the head), but can be regarded as a separate primitive.
● PGARRO : draw an arrow
Attributes
Color
● PGSCI : set color index
● PGQCI : inquire color index
● PGSCR : set color representation
● PGQCR : inquire color representation
● PGSCRN : set color representation by name
● PGSHLS : set color representation using HLS system
Line Attributes

● PGSLS : set line style
● PGQLS : inquire line style
● PGSLW : set line width
● PGQLW : inquire line width
Text and Marker Attributes
● PGSCF : set character font
● PGQCF : inquire character font
● PGSCH : set character height
● PGQCH : inquire character height
● PGQCS : inquire character height in a variety of units
● PGSTBG : set text background color index
● PGQTBG : inquire text background color index
Fill-Area Attributes
● PGSFS : set fill-area style
● PGQFS : inquire fill-area style
● PGSHS : set hatching style
● PGQHS : inquire hatching style
Arrow Attributes
● PGSAH : set arrow-head style
● PGQAH : inquire arrow-head style
Saving and Restoring Attributes
● PGSAVE : save PGPLOT attributes
● PGUNSA : restore PGPLOT attributes
Axes, Boxes, and Labels
To label a graph with axes or a box around the viewport, use PGBOX (or PGTBOX if one or both coordinates are to be treated as a time or angle). More complete control over axes is possible with PGAXIS, including drawing axes that are not parallel to the edges of the viewport. If you need complete control over how an axis is labeled, e.g., for non-linear or curved axes, draw the axis with line-drawing routines and then label it with PGTICK.

● PGBOX : draw labeled frame around viewport
● PGTBOX : draw frame and write (DD) HH MM SS.S labelling
● PGAXIS : draw an axis (New in version 5.2)
● PGTICK : draw a single tick mark on an axis (New in version 5.2)
To place labels around the edges of the viewport, use PGLAB or PGMTXT.
● PGLAB : write labels for x-axis, y-axis, and top of plot
● PGMTXT : write text at position relative to viewport
XY Plots
Error Bars
● PGERRB : horizontal or vertical error bars
● PGERR1 : single horizontal or vertical error bar (New in version 5.2)
● PGERRX : horizontal error bars
● PGERRY : vertical error bars
Curves Defined by Functions
● PGFUNT : function defined by X = F(T), Y = G(T)
● PGFUNX : function defined by Y = F(X)
● PGFUNY : function defined by X = F(Y)
Histograms
● PGBIN : histogram of binned data
● PGHI2D : cross-sections through a 2D data array
● PGHIST : histogram of unbinned data
Contour Maps
● PGCONB : contour map of a 2D data array, with blanking
● PGCONF : fill between two contours (New in version 5.2)
● PGCONL : label contour map of a 2D data array
● PGCONS : contour map of a 2D data array (fast algorithm)
● PGCONT : contour map of a 2D data array (contour-following)
● PGCONX : contour map of a 2D data array (non rectangular)
Images
● PGIMAG : color image from a 2D data array
● PGSCIR : set color index range
● PGQCIR : inquire color index range
● PGCTAB : install the color table to be used by PGIMAG
● PGGRAY : gray-scale map of a 2D data array
● PGPIXL : draw pixels
● PGSITF : set image transfer function
● PGQITF : inquire image transfer function
● PGWEDG : annotate an image plot with a wedge
Vector Plots
● PGVECT : vector map of a 2D data array, with blanking
Interactive Graphics
● PGCURS : read cursor position
● PGBAND : read cursor position, with anchor
● PGLCUR : draw a line using the cursor
● PGNCUR : mark a set of points using the cursor
● PGOLIN : mark a set of points using the cursor
● PGSCRL : scroll window (New in version 5.2)
Miscellaneous Routines
● PGNUMB : convert a number into a plottable character string
● PGRND : find the smallest `round' number greater than x

● PGRNGE : choose axis limits
● PGETXT : erase text from graphics display
● PGIDEN : write username, date, and time at bottom of plot
PGPLOT
Tim Pearson, California Institute of Technology, tjp戢stro.caltech.edu
Copyright © 1997 California Institute of Technology
Known Problems in PGPLOT
Version 5.2.0
General Problems
● Text. There is no way to display a subscript of a superscript or a superscript of a subscript. This is due to a design flaw in PGPLOT. I don't think there is any way that I can fix this problem with the current escape codes \u and \d: there is no way to distinguish a \d meaning end-of-superscript from a \d meaning start-of-subscript-of-superscript. I will try to address this in a future version of PGPLOT, if I can think of a way of doing so while retaining backwards compatibility. I think that I will have to introduce new bracketting delimiters, like HTML <sup>...</sup> and </sub>...</sub> or TeX's ^{...} and _{...}.
● There is no printed manual yet!
● CPGPLOT (C binding): ❍ Routines that require the name of a subroutine as an argument (PGCONX,
PGFUNX, PGFUNY, PGFUNT, etc.) are not handled by the C binding. ❍ CPGPLOT requires an ANSI C compiler.
Problems with Specific Subroutines
● PGBIN: the first and last bins (in CENTER mode) or the last bin (in non-center mode) are plotted incorrectly; a redesign is needed, because the arguments to PGBIN don't provide enough information to do the job.
● PGBOX (and PGENV): if the axis range is small compared with the absolute values of the endpoints, an integer overflow can occur (VMS) or the axis can be labeled incorrectly (UNIX). Example: range 2200.0 to 2200.01.
● PGCONF: has some algorithmic problems noted in the subroutine synopsis.
● PGCONL: with arrays larger than 100×100 pixels, the routine does not place labels precisely as advertised. This is a design flaw. It arises because the contouring routines do a segment of the array at a time (not more than 100×100). This breaks continuous contours and interferes with the labeling sequence. I tried to mitigate this in 5.0.3 by increasing the segment from 50x50 to 100×100, but this only helps a bit. I'll try to do something about this in a later version. Ideally I would like to allocate a temporary work array equal in size to the array to be contoured, but that is not very portable. I also need to make labeling and blanking (PGCONL and PGCONT) work together; at present you can have either one but not both. PGCONL implicitly requires that PGCINT be greater than PGCMIN; this is an unnecessary restriction.
● PGNUMB: this routine does not always honor a request for decimal format (1) but will
use an exponential format instead.
● PGQDT: note that some PGPLOT installations include ``stub'' drivers that should not be called. PGQDT returns a blank TYPE string and TLEN=0 for such drivers. If you use PGQDT in a program, you should test for this condition before using the information returned by PGQDT.
System Problems
● OSF1 (sys_osf1): ❍ All the Fortran drivers that use the %VAL() mechanism for passing an address
fail under DEC UNIX (OSF/1); these drivers will work if you change the declarations of certain pointer variables from INTEGER to INTEGER*8. In several of the drivers, I have included comments to indicate what should be changed.
❍ Cpgdemo does not link on OSF/1: error message cpgdemo.o: main: multiply defined; Unresolved: MAIN__ The best solution to this is to use the flag -nofor_main on the f77 command used to link the program (thanks to David Terrett).
● Silicon Graphics (sys_irix): ❍ In IRIX 6.2, the library names have changed. If the installation fails to find the
X11 library, Edit the .conf file in the pgplot/sys_irix directory and change
LIBS="-lX11_s"
to
LIBS="-lX11"
and then rerun makemake. ❍ A user has reported that PGNUMB does not generate correct code for numbers in
exponential format. This affects axes drawn with PGBOX etc. when labels require a multiplying power of 10. This appears to be a due to a bug in the SGI Fortran compiler. It can apparently be fixed by specifying -backslash when compiling the pgplot library. Edit the .conf file and change
FFLAGC="-u -O2"
to
FFLAGC="-u -O2 -backslash"
❍ The installation procedure for cpgdemo fails. ld reports unresolved __main. The command is
f77 -o cpgdemo cpgdemo.o -L`pwd` -lcpgplot -lpgplot -lX11_s

A work-around is to link using cc instead:
cc -o cpgdemo cpgdemo.o -L`pwd` -lcpgplot -lpgplot -lX11_s -lftn -lm
● VMS (sys_vms): ❍ Installation procedure should compile only required drivers. ❍ Installation procedure assumes that a C compiler (CC) is available. It should be
modified to skip the C compilations when this is not true.
Device drivers
● GIdriv (GIF driver): ❍ GIF uses the LZW compression system which is patented by Unisys; a license
may be required to use this driver. ❍ Uses space-inefficient algorithm. ❍ It might be nicer to insert page-number before the .gif extension instead of after,
but what if there is no extension? ● HPGL drivers:
❍ In some porgrams, the HPGL plot will be filled with many horizontal lines. I think this is caused by using PGERAS, which is trying to fill the page with black, when it should be filling in the background color. As the HPGL has no erase capability, the PGERAS call should really be ignored. Unfortunately I have no easy way to test the HPGL driver; if someone would like to work with me on this problem, or can point me to a viewer for HPGL files for UNIX machines, please contact me.
● HJdriv, LJdriv (Hewlett-Packard PCL) ❍ I have no way to test these drivers, and I am not at all sure that they work on any
systems except VMS. I don't know whether to recommend one or the other. I would appreciate feedback.
● GOdriv, VBdriv, ZEdriv ❍ These drivers require a routine grge00 that is not available on UNIX systems.
They should be rewritten to improve portability. Do not select these drivers on UNIX systems.
● PSdriv (PostScript handler): ❍ The round terminals of thick lines are not clipped at the edge of the window (this
bug affects all handlers that do hardware thick lines). ● TTdriv (/TK4100):
❍ set-color-representation doesn't work correctly; colors are not reset on exit (should they be?).
● VTdriv (VT125 handler): ❍ Cursor input does not work correctly. Unfortunately I do not have any good way
to test this. ● X2DRIV, PGDISP: Note that this driver is no longer supported and the following
problems will not be fixed; use the X-Window driver (/XSERV) instead. ❍ "pgdisp -lineColor 2" crashes immediately. ❍ figdisp_comm.c fails to compile in systems that lack "values.h" (e.g., ConvexOS
10.1). ❍ The driver tries to start up "figdisp" instead of "pgdisp"; you can change this in
the code (figdisp_comm.c) if you wish. ❍ PGDISP cannot be compiled with DECC on VAX/VMS (not AXP).

❍ Compilation of pgdisp on AXP makes warning messages:
%LINK-W-MULDEF, symbol DECC$NTOHS multiply defined in module DECC$SHR file SYS$COMMON:[SYSLIB]DECC$SHR.EXE;1 %LINK-W-MULDEF, symbol DECC$HTONS multiply defined in module DECC$SHR file SYS$COMMON:[SYSLIB]DECC$SHR.EXE;1
● XWdriv (X Window driver): ❍ Does not compile with some non-ANSI compilers (e.g., Convex?) that do not have
"string.h". ❍ Does not support the old XEdriv methods of specifying a label for the PGPLOT
window title bar.
● VTdriv (Dec REGIS driver):
This driver has problems on VMS. There is a special VMS variant of this driver in the [PGPLOT.DRIVERS] directory. Rename file VTDRIV-VMS.F to VTDRIV.F (replacing the file of that name, which is designed for UNIX), and recompile the library. This driver will accept a device specification of the form "/VT" to display on the terminal, or "file/VT" to create a disk file that you can display with TYPE. The driver still has some problems, however: (1) it is limited to 4 colors, even if your REGIS device can display more; (2) I think the cursor doesn't work on most REGIS devices, although I believe it works on a real VT125 terminal (a rare beast indeed); (3) if you direct output to a file, the driver still thinks the output is an interacrtive device and issues a prompt for each new page. I do not plan to fix any of these problems, as REGIS is now an obsolete graphics language.
● Tektronix drivers (TTdriv, TFdriv) and disk files:
If you want your graphics to display in an XTERM window, you should use a device specification "/XTERM" (or possibly "terminal/XTERM" if you have acces to a 'terminal' other than the one you are running the program in. Device type "/TEK", designed for a real Tektronix terminal, does not generate the code required to switch an XTERM into Tektronix mode. You can use /TEK with an XTERM if you first switch the terminal into Tektronix mode by hand, using the control-middle-mouse-button menu.
Device spec "file/TFILE" produces a disk file in Tektronix format. There are two points to note: (1) it does not include the code to switch an XTERM, so you can only display it in an XTERM if the XTERM is already in Tektronix mode. (2) It uses the Tektronix extended (high-resolution) addressing mode, and apparently XTERM doesn't recognize this, so the plot is slightly garbled.
There are many variants of the Tektronix format, and this variety is exacerbated on VMS where you cannot use the same code to write to a terminal as you would use to write a disk file.
I will try to address this problem in a future version of PGPLOT. Basically, I need to modify the I/O routines used by the Tektronix drivers so that they can be used to write a disk file as well as send output to a terminal. This would give you the option of a disk

file with any of the Tektronix variants (/TEK, /XTERM, etc.).
PGPLOT
Tim Pearson, California Institute of Technology, tjp戢stro.caltech.edu
Copyright © 1997 California Institute of Technology

PGPLOT Wishlist
This is a list of requested improvements that I am considering for possible implementation in future versions of PGPLOT. No promises are implied! If you have other suggestions, or want me to give high priority to any of the suggestions, please let me know.
A double precision version of the libraryMaintaining two parallel versions of the library is time-consuming, and I do not wish to do so unless there is a clear need. None of the graphical operations in PGPLOT require double precision calculations to achieve the accuracy warranted by current graphics devices, so it is mainly a matter of convenience for programmers who maintain their data in double precision for other reasons. Some users have reported success using Fortran compiler qualifiers to cause REAL variables and constants to be compiled as double precision; but note that you must also change some of the C support code and drivers.
Rotated coordinate systemsExtend the world-to-device-coordinate transformation to allow rotation as well as scaling and translation. This would allow world-coordinate axes that are not parallel to the edge of the viewport, and would hence cause complications for routines like PGBOX that label the viewport in world-coordinate space.
Positioning workstation windowsUnfortunately there is no way from within a PGPLOT program to control the location of PGPLOT X-windows. I will consider adding a new subroutine to the API to specify this, but there are some potential problems: how should other devices (not X-window) interpret this? and some X-window managers do not honor position requests.
Opaque symbolsAn option to make the graph symbols opaque, so that underlying graphics do not show through (e.g., a circle symbol would consist of a filled disk in the background color, surrounded by a ring in the current color, instead of just the ring). There should be solid and open versions of each symbol.
User-defined symbolsA method of defining new symbols that can be used as graph-markers like the built-in ones.
Bar and column chartsAn example program is included in PGPLOT v5.2.0 (pgdemo16), and I intend to include the subroutine in the main pgplot library in a future version. Comments on the design of this subroutine are solicited.
Surface Plots of 2-D arrays and functionsTo do this properly requires full three-dimensional graphics capability, which

is beyond the scope of PGPLOT. However, a restricted implementation might be possible. Meanwhile, see demo program pgdemo7.f.
Variable line widthAllow line width to be a real/float parameter rather than an integer (this would require new routines: PGSLW and PGQLW would not be changed).
Control of dashed-line appearanceThe ability to set the scaling of the dashed (or dotted or dash-dotted etc.) line-styles and alter the dash pattern.
ColorProvide a way to determine whether the active device is true-color or pseudo-color (with a dynamic lookup table).
String inputPut a prompt on a plot and then read back a number or string with echo, editing, etc. A prototype subroutine to do this is include in pgdemo14 in version 5.1.0; more work is needed before it can be included in the PGPLOT library.
JournallingPGPLOT should be able to save the plotting instructions used to create the current picture so that they can be used to regenerate the picture on another device (e.g., PostScript copy of the current X window display). Eileen Berman has implemented something along these lines by calling the metafile driver in parallel with the active device driver, but this has some problems that need to be sorted out before it can be generally implemented.
Improved cursor inputExtension of PGCURS/PGBAND to return more information about the key-stroke, e.g., whether it came from the keyboard or the mouse, and the state of modifier keys (shift, control, etc.); for devices for which this is possible. New routine to return cursor position immediately, without waiting for a keystroke or other event.
Support for PostScript or other native fontsAllow use of arbitrary PostScript fonts on PostScript devices (and possibly X-window fonts on X-window devices).
One or more mono-spaced fontsUseful for lining things up in columns. (Implementation of tab-stops in text might help here too.)
Eight-Bit Character SetAt present, the PGPLOT routines for displaying text only handle the 7-bit US-ASCII character set (decimal codes 32-126); some other characters can be obtained with escape sequences. I propose to implement all the printable characters of the 8-bit ISO 8859-1 (Latin-1) character set, and possibly provide a way to specify a different character set. I will also add the `gothic' Hershey fonts for those who find them appealing. Some people have requested ways to define their own fonts or add symbols to the font file; I will look into methods of accommodating this.
Additional Characterse.g., Greek cursive pi (varpi).

Alternate syntax for textA request has been made for an alternate syntax for subscripts, superscripts, etc.; possibilities include LaTeX/TeX or HTML. This would only be desirable if it follows an already established standard.
Current: e\ui\gp\d LaTeX: e^{i\pi} HTML: e<sup>iπ</sup>
Ability to change color within a text stringe.g., with an escape code to specify the color index.
Improved support for CShared version of libcpgplot; support for PGERRX etc.; better documentation. Meanwhile, you can make a shared version of libcpgplot using commands like the following (the ld options are highly system dependent)
ar -xv libcpgplot.ald -o libcpgplot.so -z text -G -i cpg*.o -L . -l pgplotrm -f cpg*.o
Improved Contouring Routines❍ Routine to label contours with blanking (i.e., a version of PGCONL for
use with PGCONB instead of PGCONT).❍ Methods for smoothing data (interpolation to finer grid) before
contouring.❍ Contouring a non-rectangular grid [e.g, with x and y coordinates of
each element supplied by user].❍ Better control over labeling in PGCONL, especially orientation of text
(e.g., uphill, downhill, up page, etc.).Improved Imaging Routines
❍ A method to specify an arbitrary transfer function.❍ Imaging with non-rectangular pixels (like PGCONX), e.g., for polar grid;
or arbitrary irregular grid [difficult].❍ Interpolation between pixels.❍ True-color images: Provide a way to specify separate R, G, B
components for each pixel, on devices that permit this, rather than limiting colors to a 256-entry look-up table.
AxesA user has requested the option of putting tick marks at non-integer multiples of the interval, e.g., 0.5 - 2.5 - 4.5 - 6.5.A user has requested logarithmic axes with bases other than 10.Log axes that span 1 decade or less not labeled very well.A more intelligent version of PGLAB that could figure out where to put its labels without overlapping with numeric labels on the axis would be nice.More control over the format of numeric labels is needed; e.g., to specify a

fixed number of decimal places.A means to suppress labels at either end of an axis when they would overlap an adjacent plot; e.g,., options in PGBOX.
Date AxisAn option in PGAXIS to treat a world-coordinate as a time or date (e.g., Modified Julian Date) and label the axis with, e.g.: hours, minutes, seconds year and day year, month and day month and year day of week.
LegendsA convenient way to produce a legend for a plot: i.e. a list of symbols, line-styles, etc. with associated text. A general solution is quite difficult.
VMS Installation ProcedureThis does not contain a way to extract the documentation from the source code.
Circles and ArcsAdd a circle/arc primitive to the driver interface. Add a PGARC routine for drawing partial circles (specified by center, radius, and two angles).
Window titlesAdd a subroutine to modify the window title on X-window and similar devices that put a title bar on PGPLOT windows.
Query routine: number of open devicesA new routine to return the number of open devices and their PGPLOT IDs.
PGPAPThis routine should indicate to the caller when it has failed to allocate a view surface of the requested size.
Cubic splinesPGPLOT draws curves by linear interpolation between a set of points (straight-line segments). I plan to add a routine to draw a smoother curver through the points, e.g., a cubic spline. Smoothing measured data, i.e., drawing a smooth curve that does not pass through all the points, is beyond the scope of PGPLOT. The choice of the best way to smooth the data depends on the characteristics of the data, and you should smooth the data with an appropriate method before passing them to PGPLOT.
Device Drivers
Driver for CGM (Computer Graphics Metafile)This is an official standard interchange format, but not widely adopted. David Billinghurst has contributed a driver, layered on CD from NIST. I am testing this driver, and hope to include it in a future version of PGPLOT.
Driver for FIG formatIt would be nice to have an editable graphics format, but PGPLOT will not be

able to easily take advantage of XFIG's capability, for two reasons: (1) text will appear in the output file as vectors, not characters, and so will be difficult to edit; (2) PGPLOT doesn't structure the file into hierarchical `objects', which would be convenient for editing. Extensions to PGPLOT might make these features possible.
GIF driverAdd option for transparent background.
GIF/PPM/XWD driversRewrite in C for improved portability (these drivers all use dynamic memory allocation, which is not possible in standard Fortran-77).
PostScript driver❍ Put bounding-box info at head of file [difficult in Fortran].❍ Method of automatically printing PostScript output, or piping to
another program.PostScript and other drivers
Mechanism (e.g., environment variable) to set paper size to e.g., A4 instead of US-letter. Ideally this should work with all printer drivers.
X-Window driver (/XW, /XS)❍ Ability to change mapping of mouse-clicks onto A, D, X; different
mapping for modified button-press events (e.g., control+mouse).❍ Copy some colors from the default color map to private color map when
appropriate to ameliorate problems of color map switching.❍ Readout of current cursor position. This is not possible to do except
while the cursor is in the current PGPLOT window. This may be addressed in the Motif driver.
❍ User-selectable run-time cross-hair cursor (currently can be selected by changing Xdefaults or under program control). May also be addressed in Motif driver.
PGPLOT
Tim Pearson, California Institute of Technology, tjp·astro.caltech.edu
Copyright © 1995-1999 California Institute of Technology

PGPLOT Frequently Asked Questions
1. Problems with subscripts, superscripts, and Greek letters
2. Color Map Problems (X-Window)
3. Encapsulated PostScript
4. Changing the Background Color
5. License requirements for GIF
6. Solaris can't find libpgplot.so
7. Why doesn't PGPLOT redraw the plot when the window size is changed?
8. Will PGPLOT ever do three-dimensional graphics?
9. Will PGPLOT be rewritten to use Fortran-90 constructions?
10. Does PGPLOT have a Y2K problem?
11. My compiler complains about use of %VAL in some drivers
12. Can PGPLOT be used in a Web-based CGI application?
13. How do I compile PGPLOT for Linux using the Absoft Fortran compiler?
14. Is there a double precision version of PGPLOT?
15. My publisher has requested that I provide my PostScript color image in
CMYK rather than RGB format. Can I do that with PGPLOT?
Problems with subscripts, superscripts, and Greek letters
I am trying to use escape sequences for subscripts and superscripts and greek letters, however the output is as follows:
call pglab('h/D','\ge\ur\d','TE\u011\d')
The y-axis label turns out to be 'geurd', and similar results occur for the title.
Many UNIX Fortran compilers treat a backslash (\) in a literal Fortran string as a UNIX escape character, converting '\n' to the code for new-line, for example. If you have one of these compilers, and if you want to use '\' as a PGPLOT escape character, you must do either one or other of the following (but not both):
1. Double all backslashes in literal strings in your code (e.g., change '\ge\ur\d' to '\\ge\\ur\\d'); the compiler will translate '\\' to '\'.
2. Enable the compiler option that suppresses this behavior. Most UNIX

compilers have such an option, but it isn't always well documented. Some possibilities for various compilers are:
-assume backslash -backslash -qnoescape -xl (Solaris f77) -!bs (f2c) -fno-backslash (g77)
If you can't find the option, or can't make it work, consult your compiler supplier.
3. An ingenious way to write a program that will work with most compilers is the following: define
CHARACTER BACKSL PARAMETER (BACKSL = '\\')
and then use concatenation, e.g.
call pglab('h/D', BACKSL//'ge'//BACKSL//'ur'//BACKSL//'d', 'TE'//BACKSL//'u011'//BACKSL//'d')
This rapidly leads to unreadable code.
Color Map Problems (X-Window)
I am seeing an unusual situation when running PGPLOT (using the X-Window device) when a previous executable is using up a lot of the available colors. I am running Netscape and PGPLOT on an ncd 19c (color). when Netscape starts first, it grabs alot of the colors so when i do a pgbegin from my application (or run one of the supplied pgdemo programs) the entire terminal screen is blacked out and then the PGPLOT window appears. in fact when i do a pgbegin from my application and before calling any other PGPLOT routine, the entire termianl screen is blacked out and i can only get my windows to appear again by clicking with the mouse over the area where i know a terminal exists. then everything appears as normal and the nnormal PGPLOT window appears. have you seen this problem before?
Colors are a limited resource on X displays: most are 8-bit devices that can display only 256 different colors simultaneously. Different client programs have to divide the available colors between them. If no colors are available for a new window, it
either has to make do by sharing colors that are already in use by other windows (in which case it shouldn't change them), or it has to allocate a ``private color map'' which will display the correct colors, but only while the cursor is in that window: colors of other windows will be incorrect. The problem is much less severe for 24-bit displays which have many more colors available.
Netscape is particularly bad: it appears to grab all the available colors, forcing PGPLOT to use a private color map, which produces the result you see. You can tell Netscape to use less colors (see its documentation, under Help:Frequently Asked Questions:Netscape Navigator for X: item 14). Or you can open the PGPLOT window before the Netscape window: this forces Netscape to use less colors (create an /XSERVE window and keep it around for your PGPLOT programs). You can also tell PGPLOT to allocate less colors for each window (using X resources: see xwdriv), which may reduce conflicts with other applications, but not with greedy
ones like Netscape.
PGPLOT initializes its color map to all black until you start plotting in the window. This exacerbates the problem, and we will try to improve this in a future version.
Encapsulated PostScript
What is the difference between a file produced by PGPLOT using /ps and an encapsulated PostScript file, or is there none?
A PostScript (ps) file produced by PGPLOT is a valid encapsulated PostScript file, except for the following:
1. It must be a single page. Multi-page plots are not valid EPS.2. The ``BoundingBox'' comment is at the end of the file, not the beginning. [The
reason for this is that PGPLOT doesn't know what the bounding-box will be until it has finished creating the file.] If the program that is trying to read the file complains, you can move this comment from the end of the file to the beginning. It is simplest to use the UNIX script ``pscaps'' in the PGPLOT directory:
pscaps yourfile.ps
This modifies the file(s) in place.3. Some EPS files include a ``screen-preview'' section to allow them to be
displayed by programs that cannot interpret PostScript. The format of this is machine-dependent (different for Macintosh and DOS, for example). PGPLOT does not write a screen-preview section.

All PGPLOT PostScript files, both single-page and multi-page, are labelled at the beginning %!PS-Adobe-3.0 EPSF-3.0 Some programs, including GhostView for Windows, apparently have problems if a multi-page file has an EPSF header. If necessary, change the first line of the PostScript file to read %!PS-Adobe-3.0. Some users have reported that the CUPS printing system on Linux prints all pages superimposed on a single page unless this change is made. This sounds like a bug in CUPS, or in the configuration files. Other versions of CUPS, e.g., in MacOS X, do not have this problem.
For more information about PGPLOT PS files, see the manual.
Changing the Background Color
I am using PGPLOT to plot stuff on an X-Window machine. The color scheme by default is white on a black background. I was able to change the color of the image using PGSCI, but how does on control the color of the background?
The background is color index 0. You can change what color it is by using PGSCR
or PGSCRN.
You can also change background and foreground (color indices 0 and 1) with environment variables at run time, e.g., to draw in black on white instead of white on black:
setenv PGPLOT_BACKGROUND white setenv PGPLOT_BACKGROUND black
although a call to PGSCR or PGSCRN in the program will override these.
License requirements for GIF
The drivers.list file indicates that using the GIF driver may require a license from Unisys. Do you have any further information on the licensing requirements?
I cannot give you an authoritative statement on this. The furore seems to have died down a bit, but I believe that Unisys still requires a license, certainly for commercial use. See, for example,
http://www.unisys.com/LeadStory/lzwfaq.html

You can find much more about this by searching for, say, "unisys", "gif", and "compuserve".
At least one new graphics format to replace GIF is under development: PNG (Portable Network Graphics), but I don't intend to add this to PGPLOT until it is clear that it is going to be widely adopted. See, e.g.,
http://www.wco.com/~png/
http://www.group42.com/png.htm
Solaris can't find libpgplot.so
When I run pgdemo*, for example pgdemo1, I get the error-message ld.so.1: pgdemo1: fatal: libpgplot.so: can't open file: errno=2 Killed What could be the reason? libpgplot.a is seen by the program.
This is a ``feature'' of shared libraries under Solaris 2.x.
Under Solaris, as with most UNIX systems, you link a program with PGPLOT with a command like the following:
f77 -o example example.f -L/usr/local/pgplot -lpgplot
The -L option tells the linker where to look for the library. Unfortunately, this information is not recorded in the executable file, and the run-time shared library loader thus doesn't know where to find the PGPLOT library. There are a number of solutions to this problem:
1. Link the program statically:
f77 -o example example.f -L/usr/local/pgplot -Bstatic -lpgplot \ -Bdynamic -lX11
This will result in a big executable (and you also have to specify the -LX11 option to include the X11 library).
2. Add the directory of the PGPLOT library to the list of directories in your LD_LIBRARY_PATH environment variable, e.g.,
setenv LD_LIBRARY_PATH /usr/local/pgplot:/usr/openwin/lib:/usr/dt/libf77 -o example example.f -lpgplot

The LD_LIBRARY_PATH variable is read both by the compile-time linker and the run-time linker so you no longer have to use -L. The only disadvantage of this method is that if somebody else wants to use your program they will also have to modify their LD_LIBRARY_PATH before running it.
3. Place the directory of the PGPLOT library in your LD_RUN_PATH environment variable.
setenv LD_RUN_PATH /usr/local/pgplotf77 -o example example.f -L/usr/local/pgplot -lpgplot
The contents of the LD_RUN_PATH variable are recorded in the executable and thereafter used as the path to search for shared libraries. In this case you still have to use -L or set your LD_LIBRARY_PATH appropriately to tell the linker where to find the library at link time, but thereafter anybody will be able to run the program without modifying their LD_LIBRARY_PATH or LD_RUN_PATH variables.
4. Use the -R switch of f77 in place of setting LD_RUN_PATH. This can be more problematic because f77 quietly appends the path of its run-time libraries to the LD_RUN_PATH variable, and this is ignored when -R is used. As a result you have to remember to specify the directory of the f77 libraries (usually /opt/SUNWspro/lib):
f77 -o example example.f -R/usr/local/pgplot:/opt/SUNWspro/lib \ -L/usr/local/pgplot -lpgplot -lX11
[Thanks to Martin Shepherd.]
Why doesn't PGPLOT redraw the plot when the window size is changed?
PGPLOT cannot automatically redraw the plot at a new scale when the window size is changed. If you use the PGPLOT X-window driver (device /XSERV or /XWIN), PGPLOT, in concert with the X-server, maintains an off-screen pixmap (a pixel-by-pixel copy of the screen picture) which is used to redraw the picture when it is de-iconized, uncovered, resized, etc. However the pixmap cannot be rescaled. PGPLOT does not keep a record of the elements comprising the plot (vectors, polygons, etc.) which could be used to redraw the plot at a new scale; such a record could potentially require a very large amount of memory and slow down the PGPLOT process. If you want your application to redraw the plot, you should call PGPAGE and re-issue the subroutine calls required to draw the plot. If you do not have to recalculate your data this should be quite quick. If the window has been resized,
PGPLOT becomes aware of the new size when PGPAGE is called. There is one problem though: how does your application tell that the window has been resized and that the plot must be redrawn? This is an "asynchronous event" (it could happen at any time during the execution of your program) and it is difficult for a standard Fortran program, with a single thread of execution, to respond to such an event, and it is also difficult to get access to the X-events from the program.
Will PGPLOT ever do three-dimensional graphics?
No. A comprehensive 3D capability (including projection, hidden-line and hidden-surface removal, and lighting) is beyond the scope of PGPLOT. Some of the PGPLOT demonstration programs do rudimentary 3D graphics, but they take care of projection and hidden-line removal themselves, and pass only 2D data to PGPLOT. For 3D graphics a number of packages are available, such as OpenGL and PHIGS.
Will PGPLOT be rewritten to use Fortran-90 constructions?
I do not plan to rewrite PGPLOT in Fortran-90. I do not think that Fortran-90 has yet taken over from Fortran-77 (e.g., there are no free compilers), and I do not have the resources to maintain two versions.
You should be able to call PGPLOT routines from f90 with no problem. I recommend that you compile PGPLOT with an f77 compiler, and link it into your f90 program. I would hope that your f90 compiler can handle the argument passing conventions of f77, but this may depend on which compilers you use. Alternatively, you can compile PGPLOT with the f90 compiler, but you will be unable to use some of the drivers which use non-standard extensions to Fortran-77. I intend to address this by rewriting these drivers in C rather than Fortran-90.
Does PGPLOT have a Y2K problem?
I am checking our software for Year2000 compliancy and was wondering if I should be concerned about any functions in pgplot.
No, you should not be concerned. The only routine in PGPLOT that does anything with dates is PGQINF, which can return the current date, obtained from the operating system, to the caller. It uses a 4-digit year. There should be no Y2K problem unless the underlying operating system has a problem. No Y2K problems with PGPLOT have been reported.

My compiler complains about use of %VAL in some drivers
My Fortran-77 compiler doesn't understand the syntax %VAL() that is used in some of the PGPLOT device drivers. What should I do?
Unfortunately some of the PGPLOT device drivers require dynamically-allocated memory and cannot be written using standard Fortran-77; in these cases the drivers are written either in C or in non-standard Fortran. If your compiler does not understand the %val() extension (used for passing an argument by value instead of address, and used in PGPLOT to pass a dynamically-allocated array to a subroutine), you will be unable to use these drivers unless you rewrite them. There are standard mechanisms in both C and Fortran-90 for handling dynamically-allocated memory, and I may in a future version replace these drivers with C or Fortran-90 versions.
Can PGPLOT be used in a Web-based CGI application?
Yes! Several people have used PGPLOT in a Web CGI application to generate plots in GIF format on-the-fly. In most UNIX systems, the CGI script is required to send the plot to standard output; in PGPLOT, use a device specification "-/GIF" in PGOPEN or PGBEG. Alternatively, the script may create a temporary named GIF file and return HTML code for a Web page that includes the GIF file using an IMG tag. If the Web server is a Windows system, it may be a little more complicated. Bernhard Rupp has put some hints for using a Fortran PGPLOT program in a CGI script on his web page: http://www-structure.llnl.gov/Xray/comp/gif_prog.htm.
How do I compile PGPLOT for Linux using the Absoft Fortran compiler?
The following information is from Absoft support ([email protected]). It
will be included in PGPLOT 5.2.1.
We've had source modifications for using PGPLOT with our Fortran compilers on Linux available on our ftp site for some time now. We provide three different configuration files (fold to upper, fold to lower, and fold to lower/append an underscore) so that the end user can choose the name space that fits his/her project. We also include an absoft_src directory under sys_linux that contains the necessary

source mods to build the library. The installation procedure is
1. tar -xzvf pgplot5.2.tar.gz 2. cd pgplot 3. tar -xzvf pgplot_absoft50_linux.tar.gz 4. makemake [where]/pgplot linux absoftucs_gcc (or absoftg77_gcc or
absoftlcs_gcc).
You can download our modifications from:
ftp://ftp.absoft.com/pub/linux/profortran5.0/pgplot_absoft50_linux.tar.gz
Is there a double precision version of PGPLOT?
PGPLOT is only available in single precision (Fortran REAL). All floating-point arguments passed to PGPLOT routines should be of type REAL, not DOUBLE PRECISION or REAL*8, for example. Higher precision is not needed internally by PGPLOT, given the limited resolution of most graphics devices.
If the data that you wish to plot are DOUBLE PRECISION quantities, you need to convert them to REAL before passing them to PGPLOT. If this is very inconvenient, you can in principle compile PGPLOT in double precision (some Fortran compilers have an option to do this), but you also need to change the C support routines, so I do not recommend this.
The above remarks apply to Fortran: for C, arguments should be float, not double. In some cases the function prototypes will direct the C compiler to automatically convert double to float for you, but this does not happen with array arguments.
I may in future distribute two versions of the library for REAL and DOUBLE PRECISION; if I do, the double precision routines would have different names.
My publisher has requested that I provide my PostScript color image in CMYK rather than RGB format. Can I do that with PGPLOT?
PGPLOT uses the "device RGB" color model in PostScript files. All PostScript interpreters should convert RGB to CMYK when the output device requires it, so

there is no real need for a CMYK option in PGPLOT. Some publishers prefer CMYK because they believe that it gives better color fidelity. However, consistency of color is difficult to achieve using either RGB or CMYK because different devices use different methods to represent color, and different devices produce different ranges of colors. You will see differences, e.g., between a printout and an on-screen display of a PGPLOT PostScript file. If color fidelity is important, I recommend that you import the PGPLOT file into a graphics application such as Adobe Photoshop on a PC or Macintosh with color management software (modern versions of Windows and MacOS are good about this, but Unix is not). After adjusting the colors to your liking, save the file in PDF or PS format from that program, using any options recommended by your publisher.
PGPLOT
Tim Pearson, California Institute of Technology, tjp·astro.caltech.edu
Copyright © 1996-1999 California Institute of Technology

PGPLOT Examples
PGPLOT is designed to make it easy to generate simple graphs, while providing full capability for more complex graphs.
As an example of a simple graph, here is a graph of the function y = xexp(-x), which was drawn with six PGPLOT subroutine calls.
This figure is a GIF file. With no change to the source code, the program can also generate
files in other formats, such as PostScript.
Here is the Fortran code required to draw this graph, with comments to explain the purpose of each subroutine call. The question mark as an argument to PGOPEN allows the user to specify a file name and file format at run time.
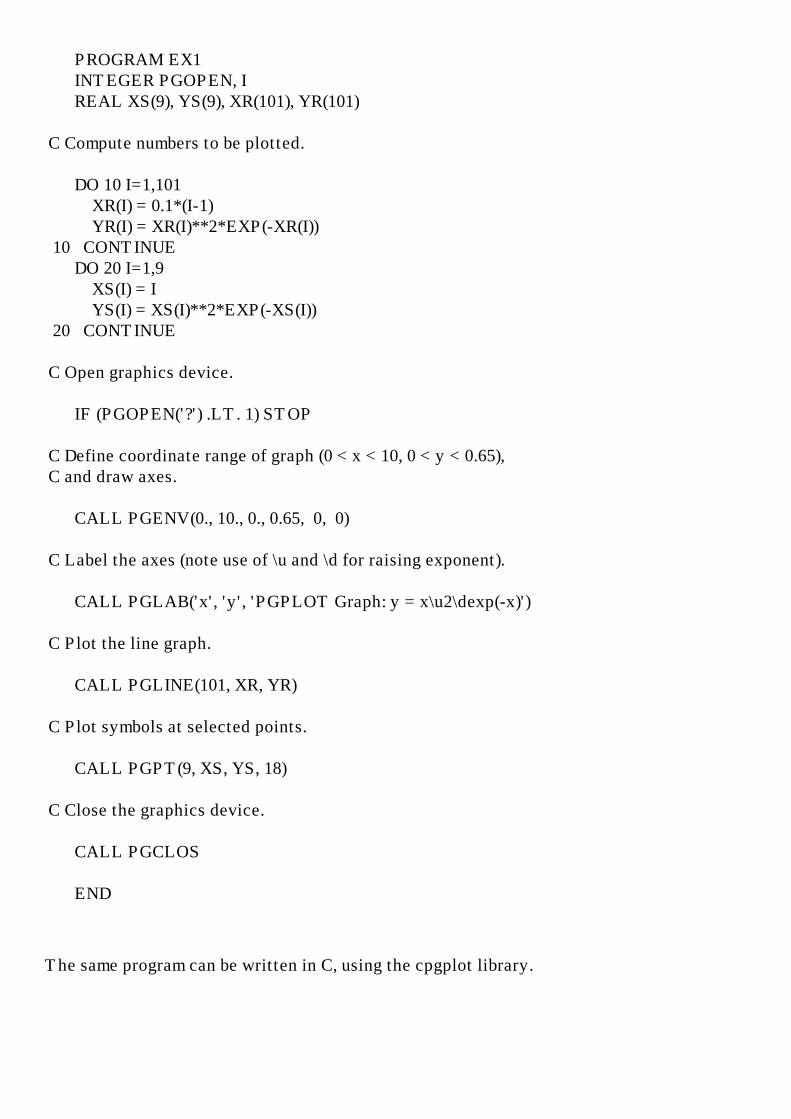
PROGRAM EX1 INTEGER PGOPEN, I REAL XS(9), YS(9), XR(101), YR(101)
C Compute numbers to be plotted.
DO 10 I=1,101 XR(I) = 0.1*(I-1) YR(I) = XR(I)**2*EXP(-XR(I)) 10 CONTINUE DO 20 I=1,9 XS(I) = I YS(I) = XS(I)**2*EXP(-XS(I)) 20 CONTINUE
C Open graphics device.
IF (PGOPEN('?') .LT. 1) STOP
C Define coordinate range of graph (0 < x < 10, 0 < y < 0.65),C and draw axes.
CALL PGENV(0., 10., 0., 0.65, 0, 0)
C Label the axes (note use of \u and \d for raising exponent).
CALL PGLAB('x', 'y', 'PGPLOT Graph: y = x\u2\dexp(-x)')
C Plot the line graph.
CALL PGLINE(101, XR, YR)
C Plot symbols at selected points.
CALL PGPT(9, XS, YS, 18)
C Close the graphics device.
CALL PGCLOS
END
The same program can be written in C, using the cpgplot library.

#include "cpgplot.h"#include "math.h"
int main(){ int i; float xs[9], ys[9]; float xr[101], yr[101];
/* Compute numbers to be plotted. */
for (i=0; i<101; i++) { xr[i] = 0.1*i; yr[i] = xr[i]*xr[i]*exp(-xr[i]); } for (i=0; i<9; i++) { xs[i] = i+1; ys[i] = xs[i]*xs[i]*exp(-xs[i]); }
/* Open graphics device. */
if (cpgopen("?") < 1) return 1;
/* Define coordinate range of graph (0 < x < 10, 0 < y < 0.65), and draw axes. */
cpgenv(0., 10., 0., 0.65, 0, 0);
/* Label the axes (note use of \\u and \\d for raising exponent). */
cpglab("x", "y", "PGPLOT Graph: y = x\\u2\\dexp(-x)");
/* Plot the line graph. */
cpgline(101, xr, yr);
/* Plot symbols at selected points. */
cpgpt(9, xs, ys, 18);
/* Close the graphics device */
cpgclos(); return 0;}

More complex graphs supported by PGPLOT include
● Scatter plots
● Function plots

● Contour maps
● Images
● Histograms

All these graphs are also available in a single PostScript file (3 pages).
Further examples can be found in the directory pgplot/examples distributed with PGPLOT.
PGPLOT
Tim Pearson, California Institute of Technology, tjp戢stro.caltech.edu
Copyright © 1997 California Institute of Technology

PGPLOT Version 5.0
All changes are intended to be backwards-compatible: i.e., existing programs should run correctly when recompiled, and recompilation should not be necessary. Some programs may give slightly different results, owing to the bug fixes described below.
New installation procedure
The installation procedure for UNIX systems has changed substantially, to allow automatic generation of the makefile and the device dispatch routine (grexec.f).
New C binding
This release of PGPLOT includes an experimental C binding for calling PGPLOT
from C programs. It consists of two files, a header file cpgplot.h that should be included in C programs that call PGPLOT, and a system-dependent wrapper library that encapsulates the manipulations necessary to call Fortran subroutines from C programs (e.g, converting C null-terminated char arrays to Fortran character strings). The wrapper library requires an ANSI-compliant C compiler, and is not available on all systems (interlanguage calls are very difficult or impossible on some systems).
Changes to device drivers
● PostScript: the PostScript device driver (device types /PS, /VPS, /CPS, and /
VCPS) has been changed to handle the new PGIMAG routine. Use /CPS or /
VCPS for color images. One side-effect is that the monochrome types (/PS and /VPS) now honor color representation changes requested by PGSCR,
although they substitute a grey level for the requested color. ● X-Window: the X-Window driver has had major changes to speed it up, make
it more portable, and add new features. The window is now resizable, and it is possible to specify that it stay up after the PGPLOT program exits. The driver provides support for the new cursor features in PGBAND. The number
of colors reserved and the default placement of the window can be specified in X resources.
● GIF (Graphics Interchange Format): a new driver to create GIF files (type /
GIF or /VGIF). ● PPM (Portable Pixmap): a new driver to create PPM files (type /PPM or /
VPPM). ● Many of the other drivers have been cleaned up to make them more portable.
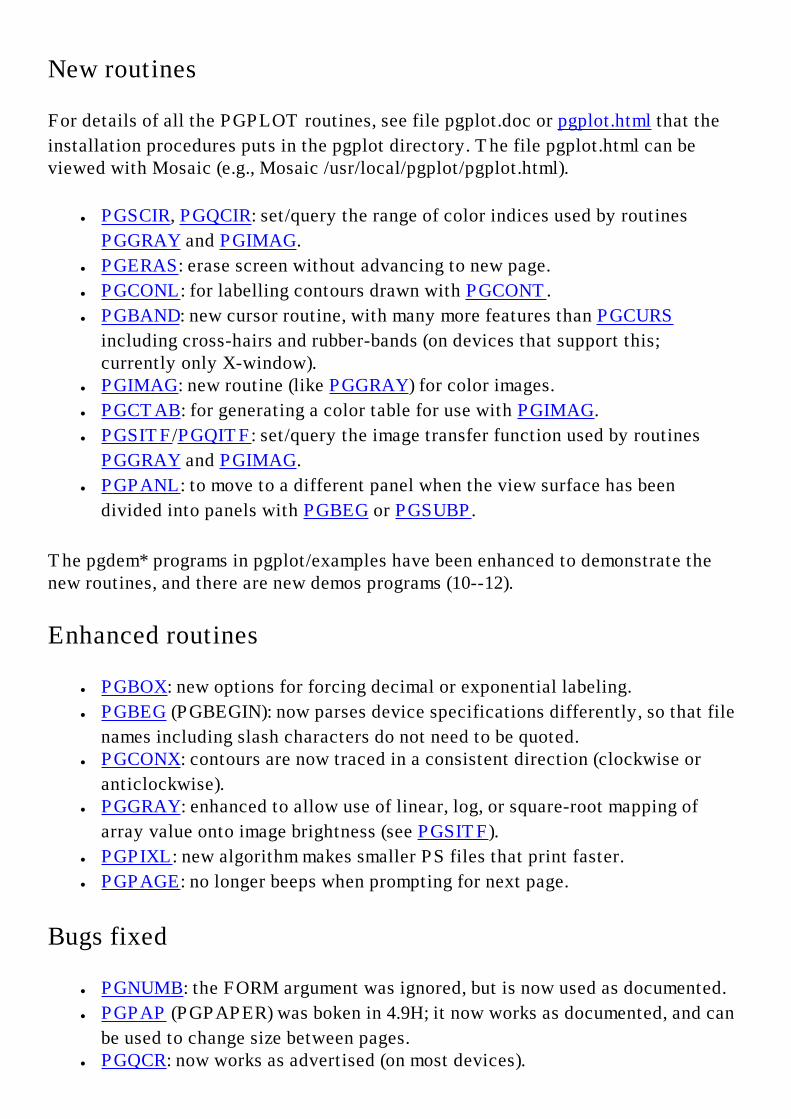
New routines
For details of all the PGPLOT routines, see file pgplot.doc or pgplot.html that the
installation procedures puts in the pgplot directory. The file pgplot.html can be viewed with Mosaic (e.g., Mosaic /usr/local/pgplot/pgplot.html).
● PGSCIR, PGQCIR: set/query the range of color indices used by routines
PGGRAY and PGIMAG.
● PGERAS: erase screen without advancing to new page.
● PGCONL: for labelling contours drawn with PGCONT.
● PGBAND: new cursor routine, with many more features than PGCURS
including cross-hairs and rubber-bands (on devices that support this; currently only X-window).
● PGIMAG: new routine (like PGGRAY) for color images.
● PGCTAB: for generating a color table for use with PGIMAG.
● PGSITF/PGQITF: set/query the image transfer function used by routines
PGGRAY and PGIMAG.
● PGPANL: to move to a different panel when the view surface has been
divided into panels with PGBEG or PGSUBP.
The pgdem* programs in pgplot/examples have been enhanced to demonstrate the new routines, and there are new demos programs (10--12).
Enhanced routines
● PGBOX: new options for forcing decimal or exponential labeling.
● PGBEG (PGBEGIN): now parses device specifications differently, so that file
names including slash characters do not need to be quoted. ● PGCONX: contours are now traced in a consistent direction (clockwise or
anticlockwise). ● PGGRAY: enhanced to allow use of linear, log, or square-root mapping of
array value onto image brightness (see PGSITF).
● PGPIXL: new algorithm makes smaller PS files that print faster.
● PGPAGE: no longer beeps when prompting for next page.
Bugs fixed
● PGNUMB: the FORM argument was ignored, but is now used as documented.
● PGPAP (PGPAPER) was boken in 4.9H; it now works as documented, and can
be used to change size between pages. ● PGQCR: now works as advertised (on most devices).

● Calling PGSCR before starting a new page (or defining
PGPLOT_BACKGROUND or PGPLOT_FOREGROUND) no longer creates a blank page in the graphics file.
● Filled polygons are now correctly clipped against the window on all devices; formerly they were not clipped on PostScript and X-Window devices.
● The unit of line-width in PGSLW is now 0.005 inch on all devices.
● Sometimes markers centered exactly on the edge of the window were not drawn when they should have been.
Tim Pearson, California Institute of Technology, tjp戢stro.caltech.edu
Copyright © 1995 California Institute of Technology
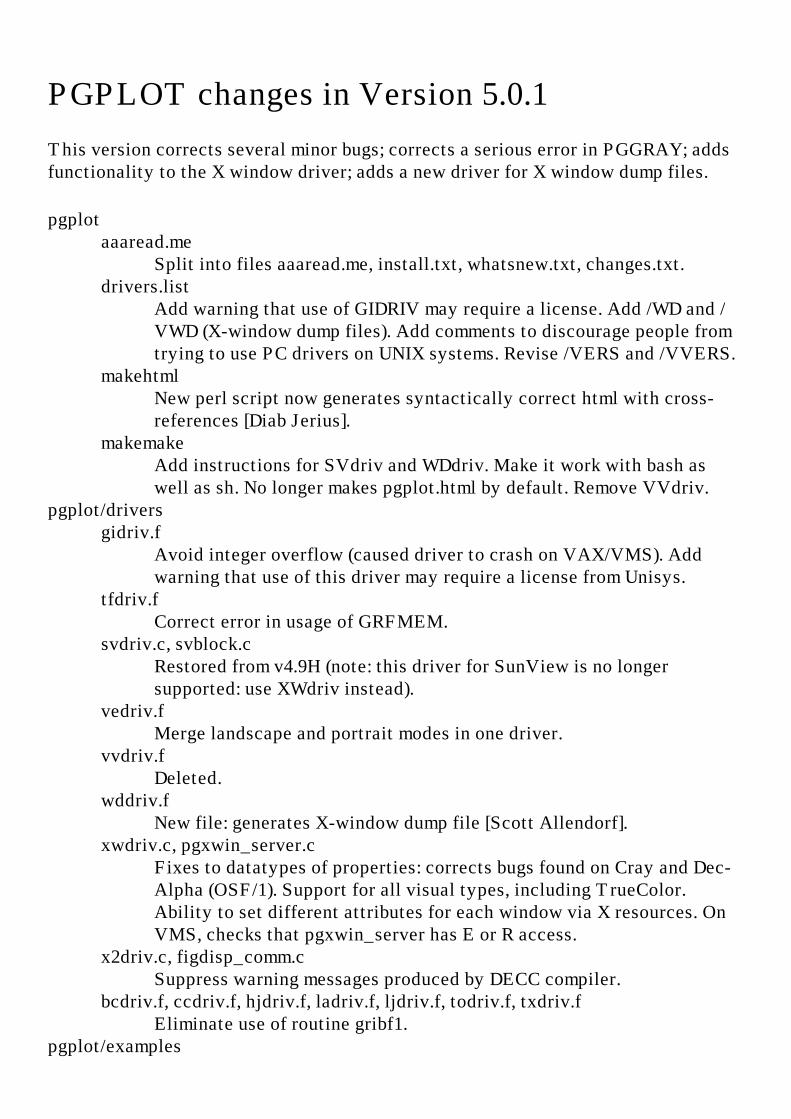
PGPLOT changes in Version 5.0.1
This version corrects several minor bugs; corrects a serious error in PGGRAY; adds functionality to the X window driver; adds a new driver for X window dump files.
pgplot aaaread.me
Split into files aaaread.me, install.txt, whatsnew.txt, changes.txt. drivers.list
Add warning that use of GIDRIV may require a license. Add /WD and /VWD (X-window dump files). Add comments to discourage people from trying to use PC drivers on UNIX systems. Revise /VERS and /VVERS.
makehtml New perl script now generates syntactically correct html with cross-references [Diab Jerius].
makemake Add instructions for SVdriv and WDdriv. Make it work with bash as well as sh. No longer makes pgplot.html by default. Remove VVdriv.
pgplot/drivers gidriv.f
Avoid integer overflow (caused driver to crash on VAX/VMS). Add warning that use of this driver may require a license from Unisys.
tfdriv.f Correct error in usage of GRFMEM.
svdriv.c, svblock.c Restored from v4.9H (note: this driver for SunView is no longer supported: use XWdriv instead).
vedriv.f Merge landscape and portrait modes in one driver.
vvdriv.f Deleted.
wddriv.f New file: generates X-window dump file [Scott Allendorf].
xwdriv.c, pgxwin_server.c Fixes to datatypes of properties: corrects bugs found on Cray and Dec-Alpha (OSF/1). Support for all visual types, including TrueColor. Ability to set different attributes for each window via X resources. On VMS, checks that pgxwin_server has E or R access.
x2driv.c, figdisp_comm.c Suppress warning messages produced by DECC compiler.
bcdriv.f, ccdriv.f, hjdriv.f, ladriv.f, ljdriv.f, todriv.f, txdriv.f Eliminate use of routine gribf1.
pgplot/examples

pgdemo2.f Add a test of an invisible polygon.
pgplot/fonts aaaread.me
Note that pgunpack and pgdchar are unsupported. pgplot/src
grcurs.f Correct bug: start new picture if necessary.
grldev.f Change ``Legal PGPLOT device types are:'' to ``Device types available:''.
grmker.f Fix bug: viewport grew as symbols were plotted!
pgband.f, pgcurs.f Issue message if device is not open.
pggray.f, grgray.f PGGRAY now uses a color ramp between the colors assigned to color index 0 (background) and color index 1 (foreground). This should restore the old behavior: the ramp runs from black to white on devices with black background and white foreground, and from white to black on devices with white background and black foreground.
pgpage.f If this routine detects that the size of the view surface has been changed (e.g., by a workstation window manager), it now rescales the viewport in proportion. Formerly the size of the viewport (in absolute units, e.g., mm) was not changed and so the viewport might extend outside the view surface. This only affects programs that do not reset the viewport for each page.
pgpoly.f, grpocl.f Correct bug: an invisible polygon generated a spurious error message.
pgqcs.f, pglen.f, pgqvsz.f Fix minor formatting errors in header comments.
pgqinf.f Change version to 5.0.1.
pgslw.f, pgqlw.f, grslw.f Correct header comments (line width unit is 0.005 inch).
pgplot/sys gribf1.f
Deleted (also system-dependent variants). grfileio.c
Add O_TRUNC to cause truncation when an existing file is overwritten.
pgplot/sys_convex fc_cc.conf
Added -lX11. pgplot/sys_cray

aaaread.me Removed note about /XWIN: it now works.
grfileio.c add O_TRUNC to cause truncation when an existing file is overwritten.
pgplot/sys_linux aaaread.me
New file: note that many drivers cannot be compiled; note about disabling backslash interpretation.
f77_gcc.conf Corrected to use ranlib, and revised list of libraries.
pgplot/sys_next pgview/PGView.m
[Allyn Tennant] Correct resize bar. af77_src/grfileio.c
add O_TRUNC to cause truncation when an existing file is overwritten.
pgplot/sys_sol2 aaaread.me
Added warning about non-ANSI C compilers. pgplot/sys_sun
aaaread.me Added note about SunView driver.
pgplot/sys_vms build.com
Add PGQITF, PGSITF, PGPANL to transfer vector. grfileio.c
Suppress warning messages produced by DECC compiler. Add O_TRUNC to cause a new version of the file to be created instead of overwriting (usual VMS behavior).
grlgtr.f Convert supplied string to uppercase before attempting to translate it as a logical name.
make_demos.com Correct comment.
make_font.com Change protection of grfont.dat.
Tim Pearson, California Institute of Technology, tjp戢stro.caltech.edu
Copyright © 1995 California Institute of Technology
PGPLOT changes in Version 5.0.2
This version implements fill-area styles 3 and 4 (hatching and cross-hatching). This affects polygons drawn with PGPOLY, PGCIRC, and PGRECT. Hatching is selected by CALL PGSFS(3), and cross-hatching is selected by CALL PGSFS(4);
see also PGQFS. There is a new user-callable routine (PGSHS) to control the angle
and spacing of hatch lines, and a corresponding new inquiry routine (PGQHS).
There is also one new internal routine (PGHTCH). Drivers have been modified so that they all interpret self-intersecting polygons the same way: a point is inside the polygon if an infinite ray with the point as origin crosses an odd number of polygon edges (``EvenOddRule'' in X-window terminology). Example program PGDEMO1 has been revised to show the new fill-area styles.
Routine PGERRB has acquired new options that allow symmetric, two-sided error
bars to be drawn with one call instead of two.
There are two new drivers, LXDRIV, to create a LaTeX picture environment (this is
only useful for very simple plots), and HGDRIV, to create a plot in HPGL2 format.
The PostScript driver has been updated to record a correct bounding box for each page, and optionally include comments describing text strings. Note that the bounding-box is now written at the end of the file, i.e., after PGPLOT has figured out what it should be. Some programs that import PostScript require the bounding-box in the file header. The script pgplot/pscaps.sh can be used to move the bounding-box information into the header.
There are four bug-fixes: (1) in routine PGSUBP which was not setting the viewport correctly; (2) in routine PGCONL (actually PGCL) which was writing contour labels at the wrong angle; (3) in routine GRPARS which was incorrectly attempting to overwrite the supplied device spec when doing logical-name translation [VMS only]; (4) in routine GRFA which would sometimes incorrectly fill a re-entrant polygon.
Support is added for the FreeBSD operating system and for PCs running MS-DOS with Salford Software Fortran (pgplot/sys_salford) or Microsoft PowerStation Fortran (pgplot/sys_msdos).
All the UNIX configuration files have been modified to add a CFLAGD parameter that controls linking of C programs that call PGPLOT.
pgplot aaaread.me

Updated for version 5.0.2. ver500.txt, ver501.txt
Earlier release notes (renamed and reformatted). ver502.txt
Release notes for this release (this file). copyright.notice
Updated. drivers.list
Updated for new drivers. install.txt
Updated. makemake
Add PGHTCH, PGSHS, PGQHS to routine list; remove GRSFS. Modify to avoid use of shell functions that are not supported by some old versions of the Bourne shell.
pscaps.sh (New file.) Script to modify a PostScript file by moving the BoundingBox comment from trailer to header. This will convert a single-page PGPLOT PostScript file into valid Encapsulated PostScript.
pgplot/cpg cpgplot.doc
Added further instructions on linking C and Fortran. libgcc_path.sh
A new script that tries to generate the correct linking commands for use with mixed Fortran and gcc.
pgplot/drivers ccdriv.f, ladriv.f, lndriv.f
Remove backslashes and PDP-11 octal constants from code to improve portability (but these drivers are probably still specific to VMS).
epdriv.f Remove some VMS dependencies; has not been tested under UNIX, however.
hgdriv.f (New file.) Driver for HPGL2 graphics, from Colin Lonsdale.
ljdriv.f (Bug fix.) Add a SAVE statement for non-static compilers.
lxdriv.f (New file.) Driver for LaTeX picture environment, from Grant McIntosh.
pgxwin_server.c Add omitted include: X11/Xos.h.
psdriv.f (New feature.) If the supplied file name is '-', the driver send the PostScript output to standard output. (Note: this will only work when Fortran unit 6 is connected to standard output.) A correct

PageBoundingBox comment is now included for each page. Plotted text can be included in the PostScript file as comments if environment variable PGPLOT_PS_VERBOSE_TEXT is set.
tfdriv.f Improved optimization [David R. Chang]. Note that this driver is for VMS systems where the regular Tektronix driver (ttdriv.f) can send output to a terminal but cannot create a disk file.
xwdriv.c Change polygon fill rule from ``WindingRule'' to ``EvenOddRule'' to match other drivers. Suppress message about starting server (when it starts successfully). Update comments.
pgplot/examples pgdemo1.f
Revise example 6 to show all four fill-area styles, and example 7 to use the new options in PGERRB.
pgdemo2.f Revise to exercise hatching styles.
pgdemo3.f Change internal subroutine name PLOT to avoid possible conflicts with other libraries.
pgdemo12.f Call PGBEG as a function rather than a subroutine.
pgplot/pgdisp initlgwin.c
Change polygon fill rule from ``WindingRule'' to ``EvenOddRule'' to match other drivers.
pgplot/src grfa.f
(Bug fix.) Fixed bug in filling re-entrant polygons (thanks to Andrew Carman).
grlin3.f Prevent a possible `sqrt of negative number' error.
gropen.f (Bug fix.) Avoid a zero-length string problem. Explicitly initialize variable to zero.
grpars.f (Bug fix.) No longer overwrites supplied string with logical name translation; avoid a zero-length string problem.
grpckg1.inc Remove unused variable GRFASL.
grsfs.f (File deleted.)
grtext.f Now sends text as a comment to output when requested.
pgbeg.f

Initialize hatching attributes. Explicitly initialize variable to zero. pgbox.f
(Aesthetic improvement.) Move labels outwards slightly when inverted ticks are requested; adjust position of `MV' y labels.
pgcl.f (support routine for pgconl) (Bug fix.) The contour labels were written at the wrong angle when x and y scales differed (thanks to Gerry Haines for discovering this); also labels could be drawn outside the window.
pgerrb.f (Enhancement.) Add options 5 and 6 for drawing symmetric two-sided error-bars.
pghtch.f (New file.) Routine for hatching (shading) polygon.
pgmtxt.f (Bug fix.) The routine could try to use a zero-length character substring, which is not allowed by the Fortran-77 standard.
pgplot.inc Add hatching attributes.
pgpoly.f Add support for hatching.
pgqfs.f Add file styles 3 and 4 (hatching).
pgqinf.f Change version to 5.0.2. Avoid some zero-length string problems.
pgqhs.f (New file.) Routine to inquire hatching style.
pgrect.f Add support for hatching.
pgsave.f Save hatching style.
pgsfs.f Add file styles 3 and 4 (hatching).
pgshs.f (New file.) Routine to set hatching style.
pgsubp.f (Bug fix.) Rescale viewport when panel size changes.
pgplot/sys_dos *.f
Split grdos.for into separate files for easier maintenance. pgplot/sys_freebsd
aaaread.me, f77_cc.conf, iand.c (New directory.) Support for FreeBSD operating system (Jean-Marc Zucconi).
pgplot/sys_hp aaaread.me
(New file.) Add notes about optimization.

fort77_gcc.conf (New file.) Configuration file for use with gcc compiler (not tested).
pgplot/sys_msdos aaaread.me, etc.
(New directory.) Support files for MS Power Station 32-bit Fortran (from C. T. Dum).
pgplot/sys_osf1 aaaread.me
(Modified.) Add note about shareable library. f77_cc_shared.conf
(New file.) For making a shareable library. pgplot/sys_salford
aaaread.me, *.f (New directory.) New system-specific files for MS-DOS with Salford Software Fortran (from Michael Michelson).
pgplot/sys_sun4 *.conf
Change -pic to -PIC (a large global offset table is needed if many drivers are selected).
pgplot/sys_ultrix f77_cc.conf
Add "-lX11" in LIBS and "-Olimit 600" (for optimizing complex routines) in CFLAGC (Jaiyong Lee).
pgplot/sys_vms build.com
Add PGSHS, PGQHS to transfer vector. Do not attempt to link with UIS on an AXP machine.
Tim Pearson, California Institute of Technology, tjp戢stro.caltech.edu
Copyright © 1995 California Institute of Technology

PGPLOT version 5.0.3
Tested Systems
Version 5.0.3 has been tested with the following operating systems and compilers. Drivers tested include: GI, GL, NU, PP, PS, TT, VT, WD, X2, XW (but not all combinations of drivers and systems have been tested exhaustively).
● HP-UX version A.09.01, HP Fortran/9000 (fort77), HP C (c89). ● OpenVMS AXP V6.1, DEC FORTRAN V6.2, DEC C V4.0 (tested on DEC
3000/M600). ● OpenVMS VAX V6.1, DEC FORTRAN V6.2, DEC C V4.0 (tested on
VAXstation 4000-90). Note: the PGDISP server cannot be compiled on this system.
● Solaris 2.4 (SunOS 5.4), Sun Fortran 2.0.1, Sun C 2.0.1 (tested on SPARCstation 10).
● SunOS 4.1.4, Sun Fortran 1.3.1, cc (tested on SPARCstation IPX). Note: the C-binding cannot be compiled with this non-ANSI C compiler.
● SunOS 4.1.4, Sun Fortran 1.3.1, GNU gcc v2.7.0 (tested on SPARCstation IPX).
● IRIX 6.0.1, Power Indigo2, f77 -mips4, cc -64 (reported by Tomasz Plewa).
Changes in Version 5.0.3
Routine PGQCS has a new option to determine the character height in world coordinates, and a bug that would give wrong values on devices with non-square pixels has been corrected.
Routine PGTBOX has a new option `X' to label the HH field modulo 24. Thus, a label such as 25h 10m would come out as 1h 10m.
Graphical output from the GIF and PPM drivers can now be directed to the standard output by specifying a file name ``-'', e.g., ``-/gif''. This allows output to be piped to a viewing program, e.g., ``pgprog | xv -''. This will only work for single-page plots.
In this version I have started work to change the character coding of PGPLOT text strings from US-ASCII to ISO Latin-1. Unfortunately I do not have digitized versions of most of the required glyphs, so this work is not complete. Programs which use characters with decimal codes in the range 128-255 will now display differently: in most cases, the glyph will be an approximation to the ISO Latin-1 character (e.g., an unaccented letter instead of the correctly accented one).

A new escape sequence, \., has been added for a centered dot (·).
A bug has been fixed that affected PostScript and possibly some other drivers: they would ignore a change to the color-representation of the currently selected color index.
Some changes have been made in the way PGPLOT writes BoundingBox comments in PostScript files.
Two bugs in polygon fill have been fixed: PGPOLY would issue an error message about a polygon with less than 3 vertices on some occasions when a polygon was completely outside the viewport; and polygon fill was ignored completely on some devices if the y-axis ran downwards instead of upwards.
There is one new driver (HGDRIV), for HP-GL/2 devices.
Minor corrections have been made in several other subroutines and text files.
pgplot aaaread.me
Changed version number to 5.0.3. copyright.notice
Changed version number to 5.0.3. drivers.list
Added HGDRIV. install.txt
Updated. makehtml
This is a perl script used for making the html documentation file. Some systems had trouble executing this script. I have now modified it to invoke perl by the #! mechanism. You may have to modify the first line of the script to specify the location of perl on your system.
makemake Now includes the ``non-standard'' routines in the documentation files (pgplot.doc, pgplot.html). Also modified the non-standard routines to get cross-references to their aliases in the HTML file. The list of include file dependencies is now generated by searching the code. Special code for the Motif widget has been added. Added HGDRIV.
ver503.txt (New file.) Release notes.
pgplot/drivers hgdriv.f
(New file.) Driver from Colin J. Lonsdale for HP-GL/2 devices. I have

not tested this. It is an alternative to GLDRIV: you should probably not include both in your PGPLOT configuration.
lxdriv.f Removed a non-standard DATA initialization.
psdriv.f Changed interpretation of environment variables PGPLOT_PS_BBOX and PGPLOT_PS_DRAW_BBOX; see the documentation.
xwdriv.c Fix an error in display of large images.
gidriv.f, ppdriv.f, wddriv.f Added comments to indicate what must be changed on operating systems like OSF/1 that use 64-bit addresses.
pgplot/examples pgdemo1.f
Fixed error in scatter plot, and rewrote random number routines. pgdemo2.f
Exercise a few more escape sequences. pgplot/src
grdtyp.f, grldev.f Changed to totally ignore a PGPLOT driver that reports a zero-length device type. This is to allow for stub drivers (more to come on this).
grfa.f Fix bug: polygon fill was ignored on devices for which fill must be emulated in PGPLOT if the y-axis was reversed.
grfa.f, grrec0.f Changed to avoid use of a real variable as a do-loop index (not allowed by some compilers).
grscr.f Fix bug that affected some drivers: if you change the color representation of the current color, these drivers did not notice.
grsyds.f Changed to allow 304 = 256+48 characters in a font rather than 128+48 (the `48' are the greek characters). Added \. escape sequence.
grsymk.f Changed to allow 304 = 256+48 characters in a font rather than 128+48. This is in preparation for using the ISO-Latin-1 character set rather than US-ASCII. Unaccented glyphs have been assigned for most of the ISO-Latin-1 accented characters.
pgcl.f Under rare circumstances could crash with both arguments to atan2 equal to zero. [This is an internal routine used by PGCONL].
pgpoly.f Fixed a bug in the clipping algorithm that affected some polygons that lie entirely outside the viewport.
pgqcs.f

Added option UNITS=4 to determine the character height in world coordinates, and fixed a bug that would give wrong values on devices with non-square pixels.
pgqhs.f Corrected comments (arguments are output, not input).
pgqinf.f Changed version number to 5.0.3. Changed cursor test to determine whether the driver reports a cursor, rather than assuming that all interactive devices have cursors.
pgtbox.f New option `X' to label the HH field modulo 24 [Neil Killeen].
pgimag.f Minor changes to header comments.
pgswin.f, pgwnad.f These routines now check whether a window of zero width or zero height has been requested, in order to prevent a nasty divide-by-zero error.
pg*.f (many files) Many of the top-level PG routines have been modified to issue a warning message (by calling PGNOTO) if no device is open. This is in preparation for multiple open devices.
pgplot/sys grfileio.c
Recognize file name ``-'' as standard output. pgplot/sys_dos
msdriv.f Revised device driver for PCs running DOS with Microsoft Fortran 5.0, from Harry Lehto. This replaces msdriv.f, msdriv.koyama, and msdriv.lehto.
pgplot/sys_linux aaaread.me
Add notes on use of Gnu g77 compiler [Brian Toby]. g77_gcc.conf
(New file.) Configuration file for Gnu g77 compiler [Brian Toby]. pgplot/sys_mac
(New directory.) Macintosh OS, LS Fortran 2.1. See file aaaread.me. pgplot/sys_msdos
aaaread.me Added information about a serious bug in the Microsoft Powerstation Fortran compiler [from C. T. Dum].
pgplot/sys_osf1 aaaread.me
Added notes about the 64-bit address problem: some PGPLOT device drivers must be modified to be used with this operating system.
grgmem.c This is a variant of pgplot/sys/grgmem.c that returns the pointer as an
INTEGER*8 (64-bit-address). pgplot/sys_sun4
*.conf Changed shared library version number from 1.6 to 1.7.
pgplot/sys_vms grfileio.c
Now recognizes file name ``-'' as standard output.
Tim Pearson, California Institute of Technology, tjp戢stro.caltech.edu
Copyright © 1995 California Institute of Technology

PGPLOT version 5.1.0
Tested Systems
Version 5.1.0 has been tested with the following operating systems and compilers. Drivers tested include: GI, GL, NU, PP, PS, TT, VT, WD, X2, XM, XW (but not all combinations of drivers and systems have been tested exhaustively).
● SunOS 4.1.3_U1, Sun Fortran (f77) 1.3.1, GNU C (gcc) 2.7.0 (tested on SPARC 5).
● Solaris 2.5 (SunOS 5.5), Sun Fortran (f77) 3.0.1, Sun C (cc) 3.0.1 (tested on SPARC IPX).
● Solaris 2.5 (SunOS 5.5), Sun Fortran (f77) 3.0.1, GNU C (gcc) 2.7.2 (tested on SPARC IPX, SPARC Ultra-1).
● OpenVMS AXP V6.1, DEC FORTRAN V6.2, DEC C V4.0, DECwindows Motif 1.1 (tested on DEC 3000/M600).
● OpenVMS VAX V6.1, DEC FORTRAN V6.2, DEC C V4.0, DECwindows Motif 1.2 (tested on VAXstation 4000-90).
Changes in Version 5.1.0
New Features
1. A major change in this version allows a program to have more than one PGPLOT device open at once. The devices can be of the same type, e.g., two windows on an X-window workstation, or of different types, e.g., a Tektronix terminal emulator and a PostScript file. Up to 8 devices may be open at once. To support this new feature, four new routines have been added: PGOPEN,
PGQID, PGSLCT, and PGCLOS, and many routines have been modified
internally.
At present, support for multiple devices of the same type is not complete. Each PGPLOT device driver needs to be modified to support multiple devices of the same type (i.e., served by the same driver), or to explicitly prohibit opening more than one device. Some of the older drivers have not yet been modified, and these drivers may give incorrect results if you attempt to use them to open two devices. There should never be any problem with unlike devices served by different drivers, e.g., /XTERM and /PS.
2. A new driver (xmdriv) and support routines have been provided by Martin
Shepherd to facilitate use of PGPLOT in a Motif application. Note that this is an experimental driver: feedback would be appreciated.

3. The C function prototypes (cpgplot.h) and C binding are now compatible with
C++ as well as C.
Bugs Fixed
A bug has been fixed in GRPOCL (support routine for PGPOLY). This could cause overflow and incorrect plots if the world-coordinate values were greater than about 1E18 (on most machines). A rounding-error has been fixed in GRFA (support routine for PGPOLY); this could cause gaps between polygons that should abut.
A bug has been fixed in GRPIXL (support routine for PGPIXL); this should improve speed.
Two bugs have been fixed in the X-window driver (XWDRIV): it would sometimes cause color maps to be set incorrectly; it allowed only 255 colors, not 256.
Drivers Removed
The following device drivers have been moved into directory pgplot/drivers/old, and cannot be selected in a normal installation. I believe that no-one is still using these drivers: ardriv.f (Args image display), grdriv.f (Grinnell image display), ikdriv (Ikon pixel engine), lidriv (Liacom display), pkdriv.f and pzdriv.f (Peritek image displays), vedriv.f (Versatec V80 printer).
List of Changes
pgplot aaaread.me, copyright notice, makedoc, makehtml
Updated date and version number. drivers.list
Added XMDRIV (Motif driver). Do not select this unless you have the necessary Motif support and plan to write Motif applications that call PGPLOT. Removed obsolete drivers as noted above.
makemake Added new subroutines. Added targets pgplot.hlp (VMS help file); pgplot-routines.tex (LaTeX); pgmdemo (example Motif application). Name changes: pgdisp is now pgdispd (directory); pgview is now pgview.app (NeXT).
makehelp (New file.) Script to generate VMS help file.
maketex

(New file.) Script to generate LaTeX documentation. pgdispd
Changed name of directory from pgdisp to pgdispd to avoid problems if you try to compile PGPLOT in the source directory.
ver510.txt (New file.) List of changes since previous version.
pgplot/cpg cpgdemo.c
Added a third page to exercise more routines. cpgplot.h
Deleted file (note that this file needs to be created as part of the installation).
pgbind.c Added C++ wrapper to the generated cpgplot.h file. Added support for const qualified declarations in the function prototypes.
pgplot/drivers gidriv.f, ppdriv.f, psdriv.f, ttdriv, wddriv.f, x2driv.c
Modified to prevent concurrent access. gidriv.f, ppdriv.f, psdriv.f, wddriv.f
On some systems the decoding of environment variables PGPLOT_xx_WIDTH, HEIGHT failed owing to a bad Fortran format. Rewritten to avoid this problem.
nudriv.f Modified to allow concurrent access (up to 8 devices).
xmdriv.c, pgxwin.c, pgxwin.h New files: PGPLOT driver for Motif applications (from Martin Shepherd).
xwdriv.c Fix bug in handling query-color-representation.
pgxwin_server.c Fix bug: 256 colors allowed, not 255.
pgplot/drivers/old New directory: several obsolete drivers (and associated drivers.list) have been moved from pgplot/drivers into this directory. These drivers should not be used; contact Tim Pearson if you still have a need for any of them.
pgplot/drivers/xmotif New directory: support routines and example program for Motif applications.
pgplot/examples Some of the example programs have been modified to use PGOPEN/PGCLOS instead of PGBEG/PGEND. pgdemo1.f
Changed the pseudo-random number generator to avoid integer overflows.
pgdemo6.f `+' key now cycles between cursor modes (rubber-band, cross-hair, etc.)
pgdemo13.f

(New program) Demonstration of two open devices. pgdemo14.f
(New program) This program demonstrates a method of coding a user interface in PGPLOT. It requires the /XSERV device. For a more professional approach to graphical user interfaces, consider using the PGPLOT Motif driver.
pgplot/src (Many pg routines)
Changed the C function prototypes to use the const qualifier where appropriate. This makes it easier to use the function prototypes with C++. Most arguments declared float * or char * are now const float * or const char * (except for returned values).
grpckg1.inc Modified to allow up to 8 concurrent devices.
grfa.f Rounding-error fix (thanks to Remko Scharroo; twice).
grinit.f New routine: initializes common block (avoids BLOCK DATA).
grpixl.f Minor bug fix (Remko Scharroo).
grpocl.f Rewrite to avoid potential overflow (thanks to Tomasz Plewa).
pgplot.inc Modified to allow up to 8 concurrent devices; many variables changed from scalars to arrays, with new names.
pgask.f, pgband.f, pgbbuf.f, pgbeg.f, pgbox.f, pgcirc.f, pgebuf.f, pgend.f, pgerrb.f, pgerrx.f, pgerry.f, pggray.f, pghi2d.f, pgiden.f, pgimag.f, pglen.f, pgmtxt.f, pgncur.f, pgnoto.f, pgpage.f, pgpanl.f, pgpap.f, pgpoly.f, pgptxt.f, pgqah.f, pgqch.f, pgqcir.f, pgqcs.f, pgqfs.f, pgqhs.f, pgqinf.f, pgqitf.f, pgqtbg.f, pgqtxt.f, pgqvp.f, pgqvsz.f, pgqwin.f, pgrect.f, pgsah.f, pgsch.f, pgscir.f, pgsfs.f, pgshs.f, pgsitf.f, pgstbg.f, pgsubp.f, pgsvp.f, pgswin.f, pgvsiz.f, pgvstd.f, pgvw.f, pgwnad.f
Modified to allow multiple concurrent devices. pgclos.f
(New routine.) Closes the currently selected graphics device. pginit.f
(New internal routine.) Initialize PGPLOT (this is to avoid an illegal initialization of data in COMMON).
pgopen.f (New routine.) Open (and select) a graphics device; unlike PGBEG, this does not close any previously opened device.
pgqid.f (New routine.) Returns the identifier of the currently selected graphics device, for use with PGSLCT.
pgslct.f

(New routine.) Selects one of the open devices for graphics output. pgqinf.f
Changed version number to 5.1.0. pgshs.f
Added checks on validity of arguments. pgplot/sys_*
Changes to configuration files to support compilation of the Motif driver and example programs.
pgplot/sys_arc Contents of directory updated for version 5.1.0 by Dave Crennell. See file AAAREADME.
pgplot/sys_linux The current version of gcc does not require system-specific variants of any files. The variants for f2c have been moved into a subdirectory pgplot/sys_linux/f77_src and the configuration files have been modified accordingly.
pgplot/sys_mac Contents of directory updated for version 5.0.3 by J. S. Salmento. See file aaaread.me.
pgplot/sys_msdos Contents of directory updated for version 5.1.0 by C. T. Dum. See file aaaread.me.
pgplot/sys_next Contents of directory updated for version 5.1.0 and NeXtStep 3.0 by Allyn Tennant. Configuration file for GNU Fortran (g77) added. See file aaaread.me.
pgplot/sys_sol2 Added -R options to the ld commands in the configuration files; these help the demo programs to find the PGPLOT shared library at run time (assuming you haven't moved it after compilation.)
pgplot/sys_sun4 Changed version number from 1.7 to 1.8 in all .conf files.
pgplot/sys_vms build.com, compile.com
Added new routines to shared library transfer vector. Added instructions for linking with Motif library when needed.
grlgtr.f This routine formerly converted all PGPLOT device specifications to uppercase for VMS. It now preserves case (VMS file and device names are not case-sensitive, but some PGPLOT device specifications can be).
install.com Added new target (pgmdemo) to compile/install the Motif demonstration program.
make_cpg.com Corrected to use the version of cpgplot.h in the current directory; set correct protection on generated files.
make_pgdisp.com

Changed name of directory from PGDISP to PGDISPD. make_pgmdemo.com
(New file.) Used in compilation of the Motif example program. pgplot/sys_win
New directory: from Phil Seeger. Port of version 5.1.0 to MS PowerStation Fortran/Windows95 (or WindowsNT) environment. See file aaaread.me.
Tim Pearson, California Institute of Technology, tjp戢stro.caltech.edu
Copyright © 1996 California Institute of Technology
PGPLOT version 5.1.1
Tested Systems
Version 5.1.1 has been tested with the following operating systems and compilers. Drivers tested include: GI, GL, NU, PP, PS, TT, VT, WD, X2, XM, XW (but not all combinations of drivers and systems have been tested exhaustively).
● SunOS 4.1.3_U1, Sun Fortran (f77) 1.3.1, GNU C (gcc) 2.7.0 (tested on SPARC 5).
● Solaris 2.5 (SunOS 5.5), Sun Fortran (f77) 3.0.1, Sun C (cc) 3.0.1 (tested on SPARC IPX).
● Solaris 2.5 (SunOS 5.5), Sun Fortran (f77) 3.0.1, GNU C (gcc) 2.7.2 (tested on SPARC IPX, SPARC Ultra-1).
● OpenVMS AXP V6.1, DEC FORTRAN V6.2, DEC C V4.0, DECwindows Motif 1.1 (tested on DEC 3000/M600).
● OpenVMS VAX V6.1, DEC FORTRAN V6.2, DEC C V4.0, DECwindows Motif 1.2 (tested on VAXstation 4000-90).
Changes in Version 5.1.1
All changes are bug fixes or minor improvements. The most notable bug fixes are:
● PGOPEN, PGBEG: a device specification like '? ' (question mark with one or more trailing spaces) causes PGOPEN to issue a blank prompt for device specification. This was an unintended change in 5.1.0, and has been fixed in version 5.1.1.
● PGBEG: in version 5.1.0, the ordering of panels changed from row order to column order. The way the sign of the NXSUB argument was interpreted was precisely the opposite of the documented interpretation (NXSUB > 0 should give row order, and < 0 should give column order). PGSUBP has always been wrong, but PGBEG acquired the incorrect behavior in version 5.1.0. Both PGBEG and PGSUBP now behave as documented.
● The PostScript driver was ignoring environment variables used to set the paper size. It now recognizes these variables. In addition, it will accept requests via routine PGPAP to change the paper size, even if the size requested is larger than the default size. (You can still set the default size with environment variables PGPLOT_PS_WIDTH and PGPLOT_PS_HEIGHT.) There are two side-effects of this change: (1) When PGPAP is used, a portrait-mode graph is placed in the lower left corner of the

paper (offset by the amount specified by environment variables PGPLOT_PS_HOFFSET and PGPLOT_PS_VOFFSET; a landscape-mode graph is placed in the same corner of the paper, but in this case it appears to be the top left corner! (2) When PGPAP is used, the bounding-box cannot be guessed when the file is opened, so you should not use the PGPLOT_PS_BBOX environment variable; if you do not set this variable, a correct bounding box will be written in the file trailer (see the discussion in the note on the PostScript printer driver).
List of Changes
pgplot aaaread.me
Revised for version 5.1.1. copyright.notice
Version number changed. makemake
It now issues a message encouraging the installer to read the appropriate README file.
ver511.txt [new file] List of changes (this file).
pgplot/drivers psdriv.f
Bug fixes: PGPLOT_PS_HOFFSET and PGPLOT_PS_VOFFSET were not decoded correctly (bug introduced in v5.1.0); bounding box could be incorrect (probably only on systems with non-static allocation of Fortran variables). Driver now honors all requests to change the paper size with PGPAP. Optimization: suppressed attempts to draw zero-length continuation line segments (thanks to Remko Scharroo).
vtdriv-vms.f This is an alternative to vtdriv.f. It uses VMS-specific Fortran, but may work better than vtdriv.f on VMS systems.
xwdriv.c, pgxwin_server.c Bug fix: images were displayed incorrectly on (some?) X-servers with more than 8 bits per pixel.
pgplot/examples pgdemo2.f
Added example of Cyrillic text on page 3. pgplot/src
grdtyp.f, grpars.f Bug fix: improved minmatch routine for device types to allow, e.g., /HPGL even if /HPGL2 is also an option.
grpocl.f Bug fix: (this is a support routine for polygon fill with PGPOLY, etc.) A polygon with one vertex exactly aligned with the edge of the window
was not clipped correctly (thanks to Remko Scharroo for the bug fix). pgopen.f
Bug fix and improvement in header comments. V5.1.0 introduced a bug: a device argument of '? ' with one or more trailing spaces did not issue the correct prompt.
pgqinf.f Change version to 5.1.1.
pgsave.f Correction in header comments.
pgsubp.f This routine was interpreting a negative NXSUB argument incorrectly. According to the documentation, positive NXSUB should step through the panels in row order, while negative NXSUB should step through them in column order; but the routine was interpreting positive NXSUB as column order and negative as row order. The behavior has been corrected to match the documentation. (In version 5.1.0, pgbeg was changed to call pgsubp, thus introducing this bug in pgbeg as well.)
pgtbox.f The positioning of labels relative to the axis has been improved; the displacement of labels from the axis should now be the same as in PGBOX. Problems were most noticeable when a large character size was requested. (Thanks to Neil Killeen for the fix.)
pgvect.f The routine was ignoring the first row and column of the array when finding the scale-factor for the vector length. (Thanks to David Singleton for pointing this out.)
pgplot/sys_arc F77/ACDriver
Revised to allow a concurrent hardcopy device (Dave Crennell). F77/GRexecAC
Correct typo (Dave Crennell). pgplot/sys_fujitsu
This new directory replaces sys_vp2200. The files are from David Singleton. aaaread.me
Revised. uxpm_frt_cc.conf
Configuration file for Fujitsu UXP/M, frt FORTRAN compiler and /usr/ucb/cc compiler.
uxpv_frt_cc.conf Configuration file for Fujitsu UXP/V, frt FORTRAN compiler and /usr/ucb/cc compiler.
pgplot/sys_hp *.conf
Added support for compiling the Motif driver (xmdriv) [mcs]. pgplot/sys_linux
aaaread.me

Added notes on Linux variants and problems. g77_elf.conf [new file]
Configuration file for Linux systems that use ELF binaries. pgplot/sys_sol2
aaaread.me Added notes about use of Sun f90 compiler and GNU g77 compiler. Added note about problem with the ucb version of "ld".
f90_cc.conf [new file] For Solaris f90 1.1 Fortran compiler (from Ricardo Piriz).
g77_gcc.conf [new file] For GNU g77 Fortran compiler (with gcc).
pgplot/sys_vp2200 Directory removed.
pgplot/sys_vms aaaread.me [new file]
Includes some notes on incompatibilities between versions of Motif, C compiler, and VMS.
grlgtr.f This has been rewritten: it now treats logical names as case-insensitive, and uses $TRNLNM instead of obsolete $TRNLOG.
makedoc.com [new file] A DCL command procedure to extract the documentation from the source code.
Tim Pearson, California Institute of Technology, tjp戢stro.caltech.edu
Copyright © 1996 California Institute of Technology
PGPLOT version 5.2.1
This version is a maintenance release. It introduces no new subroutines or functionality.
Tested Systems
Version 5.2.1 has been tested on the following systems.
● Solaris 2.5.1 (SunOS 5.5.1), GNU Fortran (g77) and C (gcc) 2.8.1 [sol2 g77_gcc]; tested on SPARC Ultra-1; device drivers CGDRIV GIDRIV GLDRIV NUDRIV PPDRIV PSDRIV TKDRIV TTDRIV WDDRIV XMDRIV XWDRIV.
Changes to configuration files and system support
New systems
sys_cygwinsys_gnuwin32sys_solx86
Modified systems
See the appropriate pgplot/sys_*/aaaread.me file for details of changes. Many configuration files (not listed here) have been modified to correct errors and add new configuration variables.
sys_aixModified aaaread.me, xlf_cc.conf; added g77_gcc.conf.
sys_hpAdded g77_gcc.conf.
sys_linuxAdded f95_gcc.conf (and directory f95_src), fort77_gcc.conf, g77_elf.conf, g77_gcc_aout.conf, nag_gcc.conf and directory nag_src.
sys_osf1Added g77_gcc.conf.
sys_winAdded gidriv.f and pgpack.f (special versions of these routines for Windows).
Modified support routines
sys/grgetc.c

Removed unused variables.sys/grgmem.c
Modified to work with 64-bit systems (or other systems in which a pointer does not fit in an int).
Changes to device drivers
New device drivers
cgdrivDriver for CGM (Computer Graphics Metafile).
pndrivDriver for PNG (Portable Network Graphics format). Note: to install this, you must have libpng.
xadrivThis is a widget driver, like xmdriv, that uses the X-athena widget set instead of the Motif widget set. See the documentation for xmdriv for further information.
Modified device drivers
Many.
Changes to PGPLOT subroutines
pgqinfReturns new version number (5.2.1).
Tim Pearson, California Institute of Technology, tjp·astro.caltech.edu
Copyright © 1999 California Institute of Technology
PGPLOT version 5.2.2
This version is a maintenance release. It introduces no new subroutines or functionality.
Modified configuration files
Configuration files for aix, linux, and solaris have been updated.
Windows support
The files sys_win/aaaread.me and sys_win/gidriv.f have been modified.
Modified device drivers
Minor bugs in the X-window device drivers have been corrected.
Changes to PGPLOT subroutines
pgqinf: returns new version number (5.2.2).
Tim Pearson, California Institute of Technology, tjp·astro.caltech.edu
Copyright © 2001 California Institute of Technology

From: Koji Ejiri <[email protected]> Date: January 27, 2006 1:59:31 PM PST To: [email protected] Subject: Gauche/PGPLOT
Hi, I'm Koji Ejiri.
I make Gauche binding for PGPLOT. Gauche is one of Scheme interpreter.
* Gauche
http://www.shiro.dreamhost.com/scheme/gauche/index.html
= Download
* tarball
http://www.kono.cis.iwate-u.ac.jp/~kojieji/Gauche-pgplot-0.1.0.tar.gz
* Subversion repository
http://www.cozmixng.org/repos/pgplot
* check out
% svn co http://www.cozmixng.org/repos/pgplot .
= Install
Following programs need to install before to install Gauche/PGPLOT.
* PGPLOT * Gauche * libpng * g77
I think you can install Gauche/PGPLOT if you type following command.
% gauche-package install --install-as=root /path/to/Gauche-pgplot-X.X.X.tar.gz
= product requirements
Following OS I checked to install Gauche/PGPLOT.
* FreeBSD * Debian GNU/Linux

It is first time for me to make a package program. Please tell me when some problems find.
Sincerely -- Koji Ejiri e-mail: [email protected]
