five basic objectives of istm
DESCRIPTION
Five basic objectives of ISTM. Identify & prioritize decisions, questions, and objectives Review existing programs and designs Identify monitoring designs, sampling frames, protocols, and analytical tools Use trade-off analyses to develop recommendations for monitoring - PowerPoint PPT PresentationTRANSCRIPT
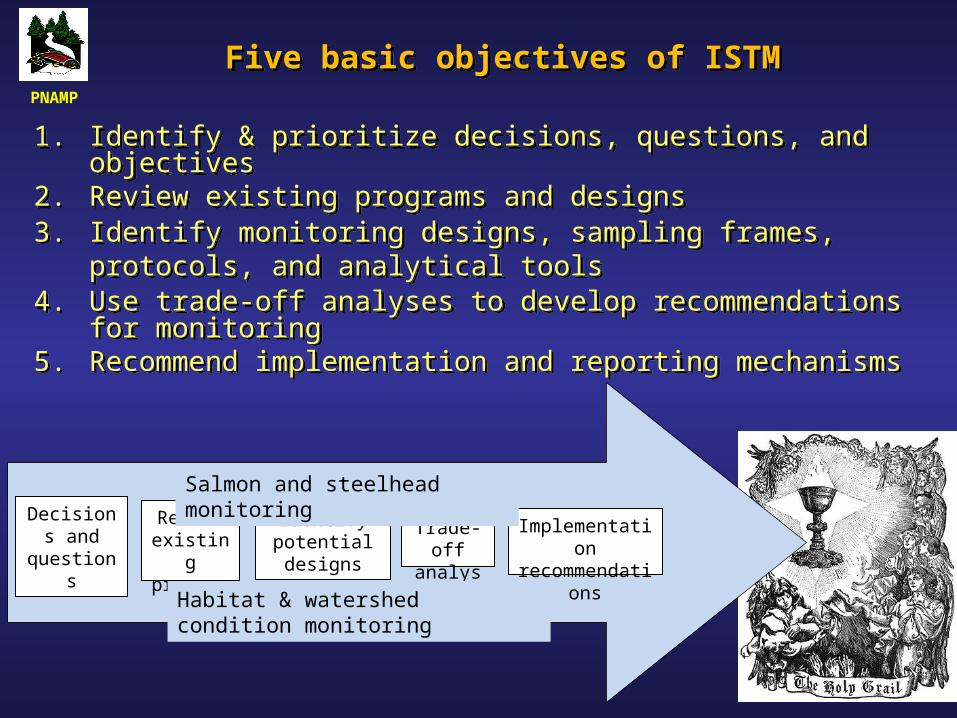
Five basic objectives of ISTMFive basic objectives of ISTM
1. Identify & prioritize decisions, questions, and objectives2. Review existing programs and designs3. Identify monitoring designs, sampling frames, protocols,
and analytical tools 4. Use trade-off analyses to develop recommendations for
monitoring5. Recommend implementation and reporting mechanisms
Decisions and
questions
Review existing
programs
Identify potential designs
Trade-off analyses
Implementation recommendations
Salmon and steelhead monitoring
Habitat & watershed condition monitoring
PNAMP

Fish ISTM – Objective 1 CompletedFish ISTM – Objective 1 Completed
Identified and prioritized VSP monitoring needs and fish related critical uncertainty research needs in Lower Columbia:
• Thematically
• Spatially
• Temporally
• Certainty
Identified and prioritized VSP monitoring needs and fish related critical uncertainty research needs in Lower Columbia:
• Thematically
• Spatially
• Temporally
• Certainty

Fry/Parr Index:
Juvenile Migrants
Adult Recruits
Spawners
Age Structure
Migration/Spawning Timing
Sex
Origin
Fry/Parr Spatial Structure
Spawner Spatial Structure
Prioritized Indicators

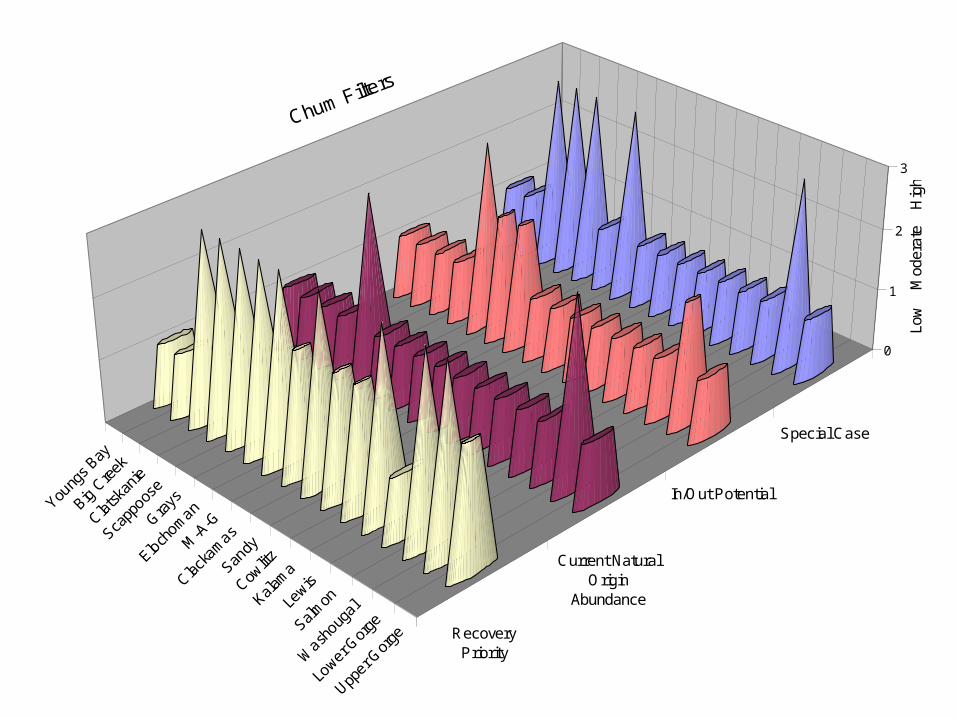
Filters• Recovery Priority• 3 - Primary populations (i.e. low or very low risk) are high priority• 2 - Contributing populations (i.e. moderate risk) are moderate priority• 1 - Stabilizing populations (i.e. high or very high risk) are low priority
• Current Natural Origin Abundance• 3 - average of >500 natural origin spawners over last six years• 2 - average of 100-500 natural origin spawners over last six years• 1 - average of <100 natural origin spawners over last six years
• In/Out Potential• 3 - High priority where existing infrastructure and methods allow for an
unbiased and precise adult and smolt abundance estimates (CV < 15%) for a substantial portion of the population area (>30%)
• 2 - Moderate priority where existing infrastructure and methods allow for an unbiased and precise adult and smolt abundance estimates (CV < 15%) for a small portion of the population area (<30%)
• 1 - Low priority where existing infrastructure and methods do not allow for unbiased and precise adult and smolt abundance estimates (CV > 15%)
• Special Case • 3 -High priority• 2 - Moderate priority• 1 - Low Priority

Young
s Bay
Big C
reek
Clatsk
anie
Scapp
oose
Gra
ys
Eloch
oman
M-A
-G
Clacka
mas
Sandy
Cowlitz
Kalam
a
Lewis
Salm
on
Wash
ougal
Lower G
orge
Upper G
orge Spawner & adult
recruit abundance;adult age, sex,
origin, anddistribution
Juvenile Migrants
Migration/ SpawnTiming
Fry/Parr Index &Distribution
0
1
2
3
Lo
w
M
od
era
te
H
ighChum VSP Indicator Monitoring Relative Prioritie
s
Young
s Bay
Big C
reek
Clatsk
anie
Scapp
oose
Gra
ys
Eloch
oman
M-A
-G
Clacka
mas
Sandy
Cowlitz
Kalam
a
Lewis
Salm
on
Wash
ougal
Lower G
orge
Upper G
orge Recovery
Priority
Current NaturalOrigin
Abundance
In/Out Potential
Special Case
0
1
2
3
Low
M
oder
ate
H
igh
Chum Filters

Calculations
• Relative Indicator Score = (Raw Indicator Score) x (Recovery Priority Score) x (Current Abundance Score) x (Fish In/Fish Out Score) x (Special Cases Score)
• Total Species Population Score = ∑Relative Indicator Scores for a Species & Population
Calculations
• Relative Indicator Score = (Raw Indicator Score) x (Recovery Priority Score) x (Current Abundance Score) x (Fish In/Fish Out Score) x (Special Cases Score)
• Total Species Population Score = ∑Relative Indicator Scores for a Species & Population

Total Score for Chum - Adults
0
10
20
30
40
50
60
70
80
90
Gra
ys
Lower G
orge
Clatsk
anie
Scapp
oose
M-A
-G
Eloch
oman
Sandy
Lewis
Wash
ougal
Clacka
mas
Cowlitz
Kalam
a
Upper G
orge
Young
s Bay
Big C
reek
Salm
on
Total Score for Chum - Adults and Juveniles
0
500
1000
1500
2000
2500
Gra
ys
Lower G
orge
M-A
-G
Clatsk
anie
Scapp
oose
Eloch
oman
Sandy
Lewis
Wash
ougal
Clacka
mas
Cowlitz
Kalam
a
Upper G
orge
Young
s Bay
Big C
reek
Salm
on

Fall Late Fall Spr. Fall Sum. Win. Sum.Youngs Bay 46 23 486 50 605Big Creek 46 23 729 150 948Clatskanie 150 225 729 729 1833Scappoose 75 225 486 486 1272Grays/Chinook 288 2025 243 81 2637Eloch./Skam. 450 150 312 486 1398Mill/Aber./Ger. 1350 450 1458 936 4194Sandy 96 225 450 75 486 486 1818Clackamas 48 675 48 729 729 2229Lower Cowlitz 144 52 486 730Coweeman 1350 729 729 2856SF Toutle 243 162 1176NF Toutle 729 729 2229Upper Cowlitz 675 972 1458 3174Cispus 675 972 1458 3174Tilton 69 150 225 513Kalama 432 144 48 729 1458 52 2863NF Lewis 1350 675 312 75 468 3630EF Lewis 162 486 162 1560Salmon 23 23 25 25 96Washougal 675 75 104 729 104 1687Lower Gorge 48 1350 162 324 1884Upper Gorge 48 50 2187 2414White Salmon 150 48 327Hood 432 225 486 324 324 1791
Population
675
Chinook
8148
75
Coho
675 48
69
Chum Steelhead
48
Total Score

Total Score for All Species - Adults and Juveniles
0
500
1000
1500
2000
2500
3000
3500
4000
4500
Mill/
Aber./
Ger.
NF Lew
is
Upper C
owlitz
Cispus
Kalam
a
Cowee
man
Gra
ys/C
hino
ok
Upper G
orge
NF Tout
le
Clacka
mas
Lower G
orge
Clatsk
anie
Sandy
Hood
Wash
ougal
EF Lew
is
Eloch
./Ska
m.
Scapp
oose
SF Tou
tle
Big C
reek
Lower C
owlitz
Young
s Bay
Tilton
White
Salm
on
Salm
on

Objective 2: Existing Data & Gaps Objective 2: Existing Data & Gaps
• Confirm/finalize inventory of existing monitoring data (296)• Compile any important LCR datasets not already obtained
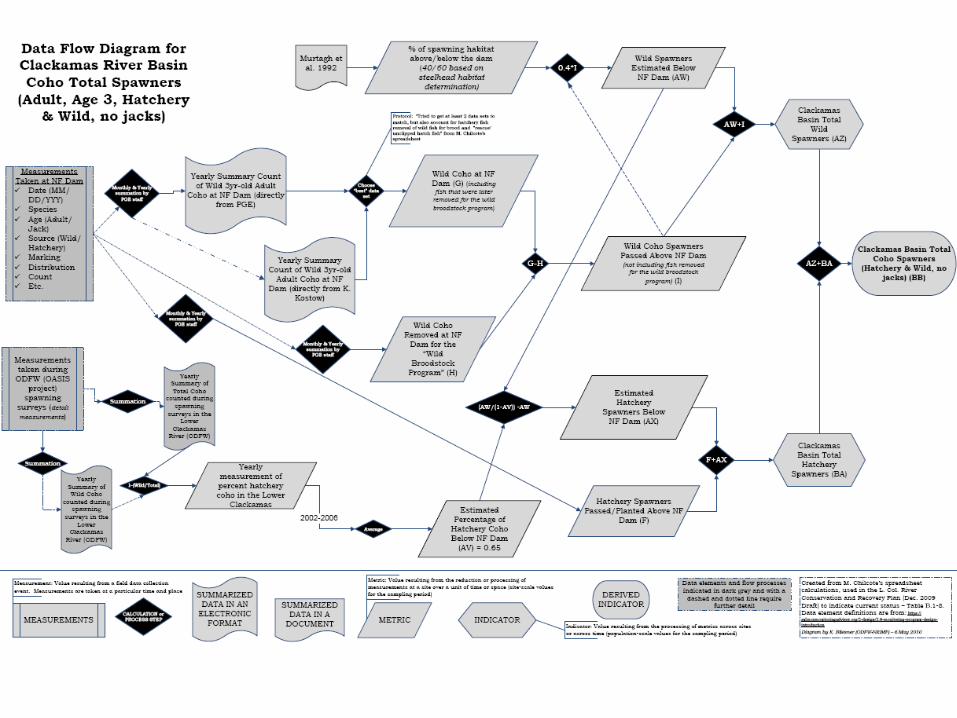
(127)• Create data flow diagrams for each data collection effort
• Develop metadata for each existing monitoring data collection effort
• Develop standards for terminology (a data dictionary)• Document sampling protocols
• Document data availability schedule
• Detail current data storage, analysis, reporting & dissemination infrastructure
• Identify needed data exchange templates for sub-regional & regional data sharing
• Gather input on desired features of a data management system from data contributors
• Confirm/finalize inventory of existing monitoring data (296)• Compile any important LCR datasets not already obtained
(127)• Create data flow diagrams for each data collection effort
• Develop metadata for each existing monitoring data collection effort
• Develop standards for terminology (a data dictionary)• Document sampling protocols
• Document data availability schedule
• Detail current data storage, analysis, reporting & dissemination infrastructure
• Identify needed data exchange templates for sub-regional & regional data sharing
• Gather input on desired features of a data management system from data contributors

Habitat ISTM – Objective 1 in ProgressHabitat ISTM – Objective 1 in Progress
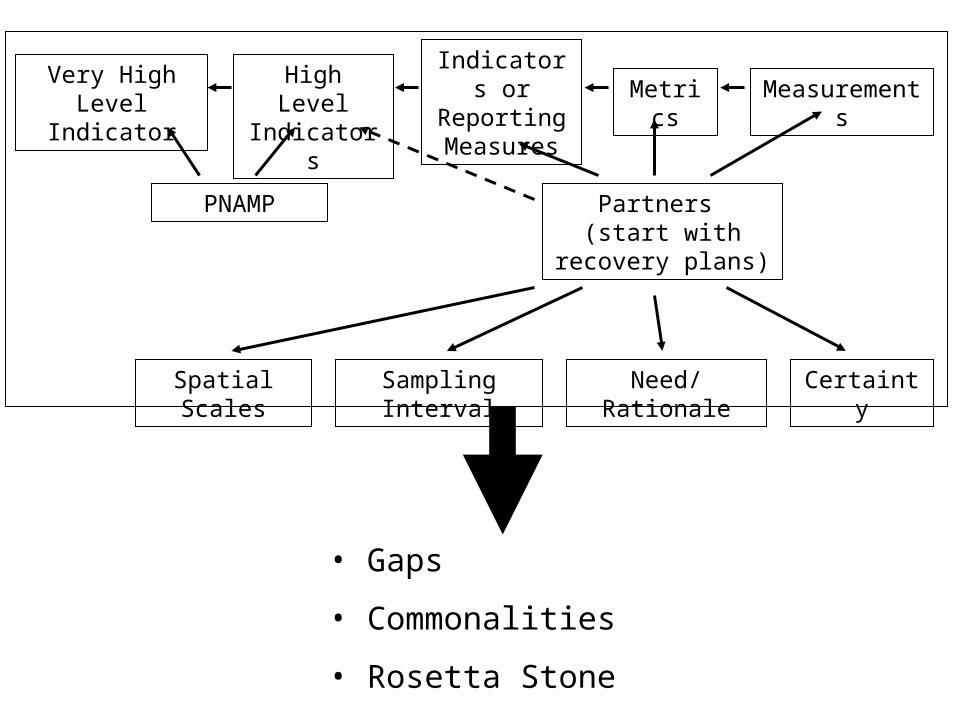
PNAMP Partners (start with recovery
plans)
Spatial Scales Sampling Interval Need/Rationale Certainty
• Gaps
• Commonalities
• Rosetta Stone
Very High Level Indicator
High Level Indicators
Indicators or Reporting Measures
Metrics Measurements