pharmacokinetic and pharmacodynamic assessment of
TRANSCRIPT
1
Pharmacokinetic and Pharmacodynamic Assessment of Hydroxychloroquine in
Breast Cancer
Kristen M. Van Eaton and Daniel L. Gustafson
Affiliations:
School of Biomedical Engineering, Colorado State University, Fort Collins, CO USA
(KMV, DLG); Department of Clinical Sciences, Colorado State University, Fort Collins,
CO USA (DLG); Flint Animal Cancer Center, Colorado State University, Fort Collins, CO
USA (DLG); Developmental Therapeutics Program; University of Colorado Cancer
Center, Aurora CO USA (DLG).
Financial Disclosure: Not author has an actual or perceived conflict of interest with the
contents of this article
Corresponding Author: Daniel L. Gustafson, Ph.D.
Flint Animal Cancer Center
300 W. Drake Rd
Fort Collins, CO 80523
970-297-1278
This article has not been copyedited and formatted. The final version may differ from this version.JPET Fast Forward. Published on September 9, 2021 as DOI: 10.1124/jpet.121.000730
at ASPE
T Journals on January 18, 2022
jpet.aspetjournals.orgD
ownloaded from
2
Running Title:
HCQ PK/PD Assessment in Breast Cancer
Number of text pages: 45
Number of tables: 1
Number of figures: 5
Number of references: 49
Number of words in the Abstract: 190
Number of words in the Introduction: 749
Number of words in the Discussion: 1498
Abbreviations:
5-ethynyl-2′-deoxyuridine (EdU), area under the curve (AUC),
desethylhyrdoxychloroquine (DHCQ), human equivalent dose (HED),
hydroxychloroquine (HCQ), median effective dose (Dm), pharmacokinetics (PK),
pharmacodynamics (PD)
Recommended section assignment:
Chemotherapy, Antibiotics, and Gene Therapy
This article has not been copyedited and formatted. The final version may differ from this version.JPET Fast Forward. Published on September 9, 2021 as DOI: 10.1124/jpet.121.000730
at ASPE
T Journals on January 18, 2022
jpet.aspetjournals.orgD
ownloaded from
3
Abstract
Hydroxychloroquine (HCQ) is being tested in a number of human clinical trials to
determine the role of autophagy in response to standard anticancer therapies. However,
HCQ pharmacodynamic responses are difficult to assess in patients and preclinical
studies in mouse models are equivocal with regard to HCQ exposure and inhibition of
autophagy. Here, pharmacokinetic (PK) assessment of HCQ in non-tumor bearing mice
following intraperitoneal (IP) dosing established 60 mg/kg as the human equivalent dose
of HCQ in mice. Autophagy inhibition, cell proliferation, and cell death were assessed in
2D cell culture and 3D tumor organoids in breast cancer. Mice challenged with breast
cancer xenografts were then treated with 60 mg/kg HCQ via IP dosing and subsequent
PK and pharmacodynamic (PD) responses were assessed. Although autophagic flux was
significantly inhibited in cells irrespective of autophagy dependency status, autophagy
dependent tumors had decreased cell proliferation and increased cell death at earlier time
points compared to autophagy independent tumors. Overall, this study shows that 2D cell
culture, 3D tumor organoids, and in vivo studies produce similar results and in vitro
studies can be used as surrogates to recapitulate in vivo antitumor responses of HCQ.
This article has not been copyedited and formatted. The final version may differ from this version.JPET Fast Forward. Published on September 9, 2021 as DOI: 10.1124/jpet.121.000730
at ASPE
T Journals on January 18, 2022
jpet.aspetjournals.orgD
ownloaded from
4
Significance Statement
Autophagy dependent tumors, but not autophagy independent tumors, have decreased
cell proliferation and increased cell death following single agent hydroxychloroquine
treatment. However, hydroxychloroquine causes decreased autophagic flux regardless
of autophagy status, suggesting its clinical efficacy in the context of autophagy inhibition.
This article has not been copyedited and formatted. The final version may differ from this version.JPET Fast Forward. Published on September 9, 2021 as DOI: 10.1124/jpet.121.000730
at ASPE
T Journals on January 18, 2022
jpet.aspetjournals.orgD
ownloaded from
5
Introduction
Macroautophagy (“autophagy”) is a normal cellular process in which cell components are
taken up by vesicles called autophagosomes that fuse with lysosomes where components
are degraded and recycled. Autophagy is induced by metabolic stress and in cells
undergoing remodeling or differentiation (De Duve and Wattiaux 1966, Yang and Klionsky
2010). It plays important roles in many diseases including cancer by enhancing survival
and therapy resistance (Duffy et al., 2015). Hydroxychloroquine (HCQ) is a lipophilic weak
base that prevents lysosomal acidification by sequestering in lysosomes and raising their
pH, in turn blocking the fusion of autophagosomes to lysosomes (Mauthe et al., 2018).
HCQ is commonly used as an autophagy inhibitor in cancer clinical trials because it is
already FDA approved, has a low toxicity profile, and is inexpensive (Cheong 2015,
Thorburn et al., 2014, Ruiz-Irastorza et al., 2010, Manic et al., 2014).
HCQ pharmacokinetic (PK) parameters have been well characterized in humans.
Following oral administration, HCQ is almost completely and rapidly absorbed in the
gastrointestinal tract and is about 75% bioavailable (Lim et al., 2009, Estes et al., 1987,
Carmichael et al., 2003). Approximately 50% of HCQ is bound to plasma proteins and
extensively sequesters in tissue (Lim et al., 2009, Tett 1993, Ducharme and Farinotti
1996). It partitions into red blood cells and binds strongly to heme proteins, leading to a
high volume of distribution and a prolonged half-life of 40-50 days (Tett 1993, Ducharme
and Farinotti 1996, Furst 1996). HCQ is dealkylated in the liver by cytochrome P450
enzymes into active metabolites including desethylhydroxychloroquine (DHCQ) (Lim et
al., 2009, Ducharme and Farinotti 1996, Cardoso and Bonato 2009). HCQ clearance is
This article has not been copyedited and formatted. The final version may differ from this version.JPET Fast Forward. Published on September 9, 2021 as DOI: 10.1124/jpet.121.000730
at ASPE
T Journals on January 18, 2022
jpet.aspetjournals.orgD
ownloaded from

6
divided nearly equally between hepatic and renal mechanisms (Ducharme and Farinotti
1996).
While HCQ PK is well described in humans, the pharmacodynamics (PD)
associated with HCQ exposure is difficult to assess. There are over 90 cancer clinical
trials (ClinicalTrials.gov) that currently or have previously investigated the effects of HCQ
alone and in combination with chemo-, immuno-, and/or radiation therapies. Trials use
between 200 and 1200 mg of HCQ daily but the number of patients with partial or stable
responses is variable (Wolpin et al., 2014, Boehrer et al., 2008, Goldberg et al., 2012,
Zeh et al., 2020). Further, when assessing patients for LC3-II or p62 accumulation as
markers for autophagy inhibition, autophagy inhibition is achievable with HCQ but
inconsistent across patient populations (Wolpin et al., 2014, Zeh et al., 2020, Kimmelman
2011). Monitoring HCQ-driven correlative PD endpoints has not been successful at doses
less than the maximum tolerated dose (Mahalingam et al., 2014). Given the large number
of clinical trials using HCQ to target cancer, it is important to understand how HCQ
exposure modulates cellular responses.
Mice are a widely used pre-clinical cancer research model system and have been
used in numerous autophagy-modulation studies (Frese and Tuveson 2007, Amaravadi
et al., 2007, Komatsu et al., 2007, Duran et al., 2008, Yang et al., 2011). However, many
human tumors do not grow in immunodeficient mouse models which makes it impossible
to study certain cancers using this model. For instance, triple negative breast cancers
grow in immunodeficient mouse models, but most luminal estrogen receptor positive and
human epidermal growth factor receptor 2 positive breast xenografts cannot grow
(Sflomos et al., 2016, Dobrolecki et al., 2016). However, there are reports of growing
This article has not been copyedited and formatted. The final version may differ from this version.JPET Fast Forward. Published on September 9, 2021 as DOI: 10.1124/jpet.121.000730
at ASPE
T Journals on January 18, 2022
jpet.aspetjournals.orgD
ownloaded from
7
these subtypes in three-dimensional cell culture as organoids (Li et al., 2019, Campaner
et al., 2020) which is important since organoids have been shown to more closely mimic
in vivo responses compared to 2D cell culture (Bleijs et al., 2019, Yang et al., 2020). In
addition, tumor organoids can accurately recapitulate in vivo drug responses, simplify
experiments, and save time and money (Bleijs et al., 2019, Fan et al., 2019, Sasmita and
Wong 2018).
Although HCQ is used clinically as an autophagy inhibitor to prevent cancer cell
survival and therapy resistance, the efficacy of HCQ is not known in humans and has not
been established in mouse models. Here, the human equivalent dose (HED) of HCQ
reflected in human clinical trial data was determined in non-tumor bearing mice and the
response to autophagy inhibition was assessed. Cell proliferation, death, and autophagic
flux following HCQ were then evaluated in breast cancer cell lines that are variably
dependent on autophagy in vitro. Mice with human breast xenografts were treated with
the HED to characterize pharmacodynamic responses in vivo. Understanding HCQ PK
and PD allows for comparison to human PK reported in recent trials and subsequently
the PD associated with autophagy inhibition.
This article has not been copyedited and formatted. The final version may differ from this version.JPET Fast Forward. Published on September 9, 2021 as DOI: 10.1124/jpet.121.000730
at ASPE
T Journals on January 18, 2022
jpet.aspetjournals.orgD
ownloaded from
8
Materials and Methods
Mouse treatments
Protocols for animal studies were approved by the Institutional Animal Care and Use
Committee at Colorado State University. Six- to eight-week-old non-tumor bearing female
BALB/c mice (Charles River NCI, Frederick, MD) were treated with a single intraperitoneal
dose (IP) of 20, 40, or 80 mg/kg HCQ (Sigma-Aldrich, H0915). Tissues and whole blood
were collected at 3, 6, 12, 24, 48 and 72 hours. For tumor-bearing mice, MDA-MB-231
and MDA-MB-468 breast cancer cell lines were implanted in the third mammary fat pads
of 6- to 8-week-old female athymic nude mice (Charles River NCI, Frederick, MD). MCF7
breast cancer cells were implanted in the third mammary fat pads of 6- to 8-week-old
ovariectomized female athymic nude mice (Charles River NCI, Wilmington, MA) and
supplemented with 0.18 mg 17-estradiol 60-day slow-release tablets (Innovative
Research of America, SE-121). Tumors were grown to between 150 and 400 mm3 then
treated with a single IP dose of 60 mg/kg HCQ or once daily with a 60 mg/kg HCQ IP
dose for one week. Tissues, tumors, and whole blood were collected at 3, 6, 12, 24, 48,
and 72 hours following the single dose or 24 hours following the last daily dose.
Drug Measurements
Levels of HCQ and DHCQ in whole blood and tissues were determined via a validated
liquid chromatography-tandem mass spectrometry (LC-MS/MS) assay as previously
described (Barnard et al., 2014). Pharmacokinetic parameters were calculated by non-
compartmental analysis (NCA) using Phoenix WinNonlin (v 8.3.3.33) (Certara, Princeton,
NJ).
This article has not been copyedited and formatted. The final version may differ from this version.JPET Fast Forward. Published on September 9, 2021 as DOI: 10.1124/jpet.121.000730
at ASPE
T Journals on January 18, 2022
jpet.aspetjournals.orgD
ownloaded from
9
Western blot analysis
Tissues and tumors were flash frozen in lysis buffer (1% Triton X-100, 150 mM NaCl, 10
mM Tris pH 7.5, 100 mM Na-orthovanadate [Alexis Biochemicals, 400-032-G025], 34.8
g/mL PMSF [Fluka Biochemica, 78830], and 1x protease inhibitor cocktail [Roche,
11836153001]). Samples were homogenized for 20 s and sonicated with three 3 second
bursts on ice then centrifuged at 14,000 rpm for 10 min at 4C. Supernatant was collected
and protein concentration was determined using the Pierce BCA Protein Assay Kit
(Thermo Scientific, 23225). Twenty g of protein was resolved on a 4-20% SDS-
polyacrylamide gel (Bio Rad, 4568095) and transferred onto PVDF membranes (Bio Rad,
1704272). Membranes were blocked in 2.5% nonfat dry milk in tris-buffered saline/Tween
80 (TBST) (10 mM Tris pH 7.5, 100 mM NaCl, and 0.1% Tween 80 [Fisher Chemicals,
BP338-500]) for 1 hour at room temperature. Blots were probed with polyclonal anti-LC3B
antibody (Novus Biologicals, NB100-2220) at 1:1,000, monoclonal anti--tubulin antibody
(Sigma-Aldrich, T5168) at 1:5,000, monoclonal anti-p62/SQSTM1 antibody (Novus
Biologicals, H00008878-M01) at 1:1,000, or monoclonal anti-GAPDH antibody (Novus
Biologicals, NB300-221) at 1:1,000 in blocking solution overnight at 4C. Blots were
washed three times in TBST then incubated at room temperature for 1 hour with HRP
conjugated secondary antibodies anti-rabbit-HRP (Pierce, 31460) at 1:2000 or anti-
mouse-HRP (Pierce, 31430) at 1:2,000 for p62, 1:5,000 for -tubulin, or 1:10,000 for
GAPDH in blocking solution. Alpha-tubulin or total protein were used as housekeeping
controls. Blots were washed three times with TBST. Immunodetection was carried out
using SuperSignal West Dura (Thermo Scientific, 34075) and imaged in a ChemiDoc
This article has not been copyedited and formatted. The final version may differ from this version.JPET Fast Forward. Published on September 9, 2021 as DOI: 10.1124/jpet.121.000730
at ASPE
T Journals on January 18, 2022
jpet.aspetjournals.orgD
ownloaded from

10
XRS+ (Bio Rad, Hercules, CA) using Image Labs version 3.0 software. Densitometry
quantification of LC3 and p62 levels was performed by NIH ImageJ software (http://
rsb.info.nih.gov/nih-image/) or by Image Labs total protein normalization.
Immunofluorescence analysis
Tumor samples were put into 5% PLP solution for 24 hours at 4C then placed in 30%
sucrose solution for 24 hours at 4C. Samples were fixed in 4% paraformaldehyde then
placed in OCT and cryosectioned at 5 m. Sample slides were rehydrated in PBS plus
0.05% Tween 20 (PBST) then washed with 0.1M glycine/PBS to reduce tissue
autofluorescence. Non-specific binding was blocked with 5% donkey serum in
immunofluorescence (IF) buffer (0.2% Triton X-100, 0.1% BSA, 0.05% Tween 20, PBS)
for 30 min at room temperature. Sections were probed for primary anti-Ki67 (Cell
Signaling Technology, 9027) diluted 1:400, primary anti-cleaved caspase-3 (Cell
Signaling Technology, 9664) diluted 1:200, or rabbit IgG isotype control (Cell Signaling
Technology, 3900) diluted to same the concentration as other primary antibodies in IF
buffer for 1 hour at room temperature. Slides were washed 3 times in PBST then
incubated with Cy3 secondary antibody (Jackson ImmunoResearch, 711-165-152 lot
#142318) diluted 1:200 in IF buffer for 30 min at room temperature. Three washes were
performed then slides were counterstained with filtered DAPI working solution (Thermo
Scientific, 62248) diluted 1:500 in PBS for 15 min at room temperature. Slides were cover-
slipped with ProLong Diamond Antifade Mountant (Invitrogen, P36961) and imaged using
an Olympus IX83 confocal microscope and Hamamatsu digital camera.
This article has not been copyedited and formatted. The final version may differ from this version.JPET Fast Forward. Published on September 9, 2021 as DOI: 10.1124/jpet.121.000730
at ASPE
T Journals on January 18, 2022
jpet.aspetjournals.orgD
ownloaded from

11
Cell culture
Cell lines were validated mycoplasma free and maintained at 37C and 5% CO2 in DMEM
(Corning, 10-017-CV) buffered with 10 mM HEPES (Fisher Scientific, BP-299-100) and
supplemented with 10% FBS (Peak Serum, PS-FB3), 1% penicillin-streptomycin
(Corning, 30-002-CI), and 1% sodium pyruvate (Corning, 25-000-CI). MCF7 media was
also supplemented with 10 g/mL insulin (Fisher Scientific, 12585014). Cells were used
for no more than 20 passages.
Organoid culture
To form organoids, cells were grown on Cultrex 3D Culture Matrix RGF Basement
Membrane Extract (BME) (R&D Systems, 344501001). Briefly, 100 L/cm2 BME was
plated and allowed to solidify at 37C for a minimum of 30 min before plating cells. Cells
were grown for 2 days on BME prior to addition of drug.
Drug sensitivity, cell death, and autophagic flux live cell imaging assays
For 2D HCQ drug sensitivity, cell death, and autophagic flux assays, 3,000 cells were
plated per well in a 96-well plate a few hours before drugging. NucLight red-labeled cells
were used for drug sensitivity and cell death assays and cells transduced with LC3-
mCherry-GFP were used for autophagic flux assays. For HCQ sensitivity assays, cells
were treated with HCQ concentrations ranging from 0 to 40 M HCQ. For the apoptosis
assays, cells were plated in buffered MEM (Corning, 10-010-CV) 5 hours before drugging
with 10 M HCQ (equal dosing) and either 8 M (MDA-MB-231 and MDA-MB-468) or 15
M (MCF7) HCQ (equal toxicity) combined with 5 M caspase 3/7 green fluorescent dye
This article has not been copyedited and formatted. The final version may differ from this version.JPET Fast Forward. Published on September 9, 2021 as DOI: 10.1124/jpet.121.000730
at ASPE
T Journals on January 18, 2022
jpet.aspetjournals.orgD
ownloaded from
12
(Essen BioScience, 4440). For cytotoxicity assays, cells were plated in buffered MEM 5
hours before drugging with 10 M HCQ and either 8 M (MDA-MB-231 and MDA-MB-
468) or 15 M (MCF7) HCQ combined with 100 nM YOYO green fluorescent dye
(Invitrogen, Y3601). For autophagic flux assays, cells were plated in buffered DMEM 5
hours before drugging with 10 M HCQ and either 8 M (MDA-MB-231 and MDA-MB-
468) or 15 M (MCF7) HCQ. Plates were imaged once every 24 hr on an IncuCyte Zoom
(Essen BioScience). All organoid cultures were performed the same way except 5,000
cells/well were plated on 100 L/cm2 BME two days prior to drugging.
Cell cycle analysis
300,000 cells/well were plated in 6-well plates the day before drugging with HCQ. Cells
grew for 48 hr following drugging then were trypsinized, spun down, washed once with
PBS, then fixed with 70% ethanol and stored at -20C for up to two weeks. Cells were
stained with FxCycle PI/RNase (Life Technologies, F10797) at a concentration of 2 million
cells/mL then analyzed on a Gallios flow cytometer (Beckman Coulter). Flow results were
analyzed via FlowJo.
Cell proliferation via 5-ethynyl-2′-deoxyuridine (EdU) staining
For 2D cell culture experiments, 750,000 cells/plate were plated in 60 mm dishes the day
before drugging with HCQ. Once drugged with HCQ, cells grew for 48 hr. One hr (MCF7
and MDA-MB-231) or two hr (MDA-MB-468) before 48 hr time point, cells were treated
with 10 M EdU. Cells were trypsinized, spun down, washed once with cold PBS, then
fixed in ice cold 70% ethanol. Fixed cells were stored at 4C for a minimum of two days.
This article has not been copyedited and formatted. The final version may differ from this version.JPET Fast Forward. Published on September 9, 2021 as DOI: 10.1124/jpet.121.000730
at ASPE
T Journals on January 18, 2022
jpet.aspetjournals.orgD
ownloaded from
13
Cells were re-hydrated in PBS for 1 hr then stained using the Click-iT EdU flow cytometry
Alexa Fluor 647 kit (Invitrogen, C10424) by permeabilizing and staining cells. Cells were
washed an extra time with PBS just before putting at final concentration of 1 million
cells/mL in PBS. 100 g/mL RNase A (Thermo Scientific, FEREN0531) and 1 L of a 1:4
dilution from stock Sytox Blue (Thermo Scientific, S34857) was added per 1 million cells.
Cells incubated overnight before flow on a Gallios flow cytometer.
For tumor organoid experiments, 100 L/cm2 BME was plated then 30 min later,
750,000 cells were plated. Tumor organoids were allowed to establish for two days before
treatment with HCQ. Once drugged with HCQ, cells grew for 48 hr. Four hr before 48 hr
time point, cells were treated with 10 M EdU. Cells were isolated from BME using cell
harvesting buffer (R&D Systems, 3448020CH) protocol. Briefly, cells were washed 3
times with PBS, cell harvesting buffer was added to the plate on ice, pipetted up and
down, moved to a 15 mL conical, topped with cell harvesting buffer, and shaken on a
plate shaker at 650 RPM for 30 min at 4C. Conical tubes were centrifuged, supernatant
was removed, and cells were washed once more with cell harvesting buffer. To break up
organoids, cells were incubated with trypsin at room temp for 10 min then fixed with 4%
PFA for 15 min. Cells were permeabilized and stained following the Click-iT EdU flow
cytometry Alexa Fluor 647. Cells were washed an extra time with PBS then incubated
with 100 g/mL RNase A and 1 L of a 1:4 dilution from stock Sytox Blue per 1 million
cells for a minimum of 30 min before analyzing on a Gallios flow cytometer. All results
were analyzed via FlowJo.
This article has not been copyedited and formatted. The final version may differ from this version.JPET Fast Forward. Published on September 9, 2021 as DOI: 10.1124/jpet.121.000730
at ASPE
T Journals on January 18, 2022
jpet.aspetjournals.orgD
ownloaded from
14
Autophagic flux flow cytometry
Cells transduced with a LC3-mCherry-GFP reporter were used. Cells were plated at
325,000 cells/well in a 6-well plate for 24 hr, 200,000 cells/dish in a 60 mm dish for 96 hr,
or 50,000 (MDA-MB-231) or 100,000 (MCF7, MDA-MB-468) cells/plate for 144 hr in a 60
mm dish, allowed a day to attach and grow, then drugged with HCQ. For use in flow
cytometry analysis, control cells were treated with 10 nM bafilomycin A1 (Fisher Scientific,
AAJ67193XF) 24 hr prior to the endpoint to completely inhibit autophagy. Cells were
trypsinized, washed once with cold PBS, and resuspended in PBS, keeping cold and on
ice. Samples were flowed on an Aurora 4 laser (Cytek Biosciences) flow cytometer then
data analyzed via FlowJo. To determine the percent of cells using autophagy, the
bafilomycin-treated control cells were gated so that 5-10% of cells were positive in an
angled, diagonal area to the upper left of the events on a mCherry versus GFP plot. This
gate was pasted directly onto all other samples for the same cell line from the same
replicate.
Live/Dead staining
700,000 cells/plate for 48 hr, 200,000 cells/plate for 96 hr, or 50,000 cells/plate for 144 hr
were plated in 60 mm dishes the day before drugging with HCQ. Cells were grown for
given time frame then trypsinized, spun down, and washed once with cold PBS. Cells
were re-suspended in PBS at a concentration of 1 million cells/mL then 1 L of a 1:4
dilution from stock Sytox Blue was added. Cells were incubated for 15 min at room
temperature then kept on ice until ready to flow and analyzed on a Gallios flow cytometer
as soon as possible. Results were analyzed via FlowJo.
This article has not been copyedited and formatted. The final version may differ from this version.JPET Fast Forward. Published on September 9, 2021 as DOI: 10.1124/jpet.121.000730
at ASPE
T Journals on January 18, 2022
jpet.aspetjournals.orgD
ownloaded from
15
Statistical analysis
Statistical analysis was performed using Graphpad Prism. Two-way ANOVA using
multiple comparisons with Dunnett correction between controls and drug-treated cells at
each time point or unpaired two-tailed t-tests between controls and HCQ-treated mice
were used to determine statistical significance with *p 0.05, **p 0.01, ***p 0.001, or
****p 0.0001. All error bars are standard deviation.
Results
HCQ exposure is dose dependent in vivo
HCQ and DHCQ levels were measured in whole blood, liver, gut, kidney, and brain
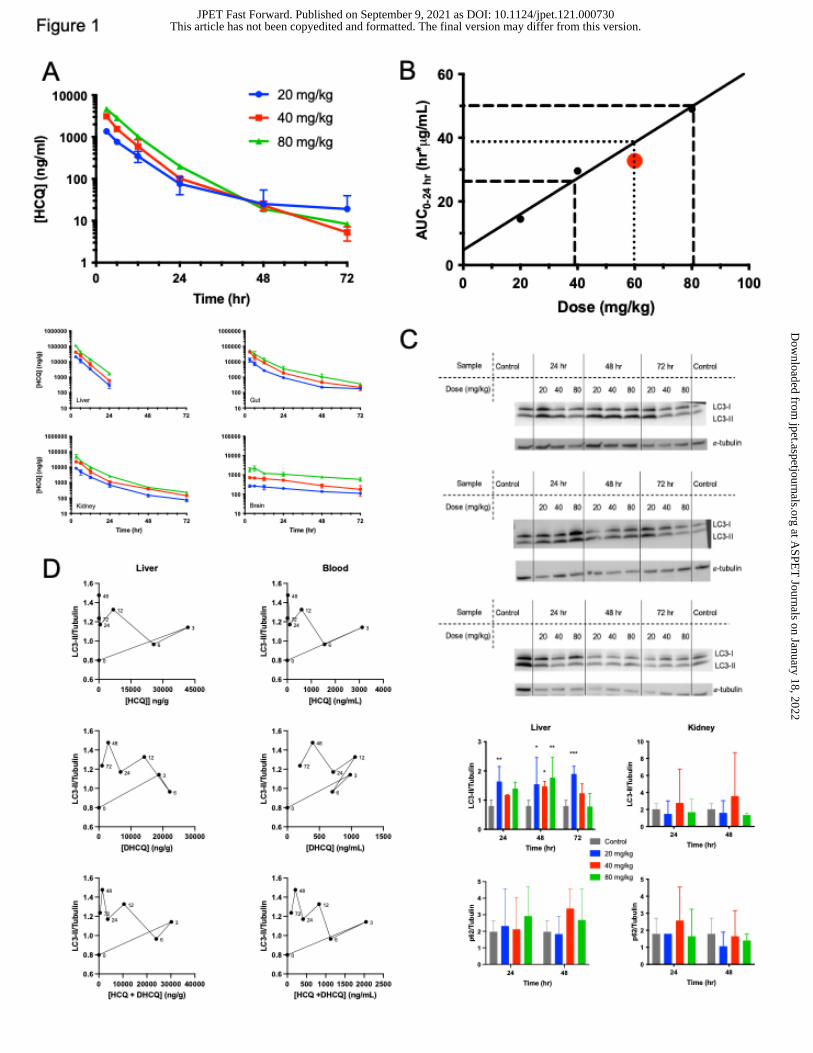
following a single IP dose of 20, 40, or 80 mg/kg HCQ (Figure 1A and Figure S1). Drug
levels were dose dependent and concentrations of HCQ and DHCQ decreased over time.
Highest concentrations were observed in the liver. In whole blood, there were still
detectable levels of HCQ and DHCQ at 72 hours following all doses. HCQ levels were
undetectable in liver after 24 hours, but DHCQ levels were detectable at relevant
concentrations up to 72 hours. Concentrations of HCQ and DHCQ in the gut were similar
over the entire 72 hours, with slightly more DHCQ than HCQ present at all doses 24 hr
and later. Kidney drug levels were similar to gut and showed the same trends with higher
DHCQ levels following 12 hr. HCQ can cross the blood brain barrier (Amaravadi et al.,
2011) and therefore can be detected in the brain. The concentrations of HCQ and DHCQ
in the brain were approximately ten-fold less than whole blood, liver, kidney, and gut,
This article has not been copyedited and formatted. The final version may differ from this version.JPET Fast Forward. Published on September 9, 2021 as DOI: 10.1124/jpet.121.000730
at ASPE
T Journals on January 18, 2022
jpet.aspetjournals.orgD
ownloaded from
16
suggesting that HCQ and DHCQ enter the central nervous system to a lesser degree than
other tissues.
HCQ PK parameters (Table 1 and Table S1) show that maximal concentration
(Cmax) in whole blood, liver, gut, kidney, and brain increased in a dose dependent manner.
Time to maximal concentration (Tmax) occurred at 3 hours in whole blood, liver, gut,
kidney, and brain at all doses except for brain at 80 mg/kg where Tmax occurred at 6 hours.
Half-lives for whole blood, liver, gut, kidney, and brain were approximately 14.5 hours, 3.5
hours, 17.5 hours, 15 hours, and 48 hours, respectively, regardless of dose. The area
under the drug concentration versus time curve (AUC0-inf) increased as dose increased in
all tissues, showing exposure of HCQ is dose dependent. DHCQ PK parameters in whole
blood (Table S2) and tissues (Table S3) had similar trends as HCQ. Cmax and AUC0-inf
increased in a dose-dependent manner. DHCQ Tmax occurred mostly between 5 and 9
hours in all tissue. DHCQ half-lives are all slightly longer than HCQ for all tissues except
brain where DHCQ is more rapidly eliminated from the brain. Both HCQ and DHCQ
clearance is not constant between 20 and 80 mg/kg. Given that AUC0-inf are not dose
proportional from 40 to 80 mg/kg and clearance is concurrently increasing, this signifies
non-linear PK with less drug in the blood at higher HCQ concentrations. A potential
explanation is an increase in cellular lysosomal volume associated with lysosomal
biogenesis triggered by HCQ (Collins et al., 2021) leading to an increase in tissue uptake
and subsequent lower blood levels. This explanation is supported by the relationship
between dose and AUC for blood vs. tissues where whole blood shows a 1.80 and 3.07-
fold increase in AUC when doses are increased 2 and 4-fold whereas tissues (brain, gut,
kidney and liver) all show fold increases greater than 2 and 4 with averages of 2.47± 0.28
This article has not been copyedited and formatted. The final version may differ from this version.JPET Fast Forward. Published on September 9, 2021 as DOI: 10.1124/jpet.121.000730
at ASPE
T Journals on January 18, 2022
jpet.aspetjournals.orgD
ownloaded from

17
and 4.78 ± 0.71. Thus, although dose and exposure (AUC) are related for all tissues
analyzed, tissue accumulation increases greater than the fold dose increase whereas
blood increases at a rate lower than the fold increase.
To determine equivalent dose exposure for HCQ in mice compared to humans,
area under drug concentration versus time curves from both mice and humans were
directly compared since these AUC’s represent exposure in each species. The human
equivalent dose (HED) of steady state HCQ concentration was calculated by using the
average human patient AUC over 24-hour dosing time period estimated at steady state
in humans given an oral 600 mg dose (Rosenfeld et al., 2014) and comparing this to the
AUC0-24 hr corrected with an accumulation factor in mice found in this study. A comparison
of the predicted trough level (24hr) at 60 mg/kg in the Balb/c non-tumor bearing mice at
steady-state versus the measured steady-state levels in tumor bearing mice at 24 hours
showed a predicted value of 227 ng/ml and measured values at 288 75 ng/ml. The
HED in mice is 60 mg/kg in whole blood with a standard deviation of 20 mg/kg (Figure
1B), suggesting most doses used for in vivo mouse studies are within the limits of
exposure achievable in humans. The AUC0-24 that was measured in the tumor-bearing
mice at 60 mg/kg (Table 1) corrected for accumulation at steady-state (1.47-fold) gives a
calculated exposure of 32.8 µg•hr/ml, consistent with the exposure range shown in Figure
1B.
Autophagy inhibition is variable in tissues
Pharmacodynamic response was assessed by western blot analysis of LC3 and p62 in
the liver, kidney, gut, and brain at various time points (Figure 1C and Figure S2).
This article has not been copyedited and formatted. The final version may differ from this version.JPET Fast Forward. Published on September 9, 2021 as DOI: 10.1124/jpet.121.000730
at ASPE
T Journals on January 18, 2022
jpet.aspetjournals.orgD
ownloaded from
18
Autophagy inhibition in the liver was observed at later time points, most noticeably at 48
hr based on the LC3-II/tubulin ratio. Since liver autophagy was inhibited most at later time
points, only 24 hr, 48 hr, and 72 hr time points were assessed in the gut, kidney, and
brain. The gut and the kidney showed no autophagy inhibition by either LC3 or p62 levels.
Brain autophagy inhibition was evident in a few mice at 24 and 48 hr but was not dose
related. There was no difference in p62 expression in controls compared to HCQ-treated
mice in liver or kidney. Effects of HCQ and/or DHCQ on LC3-II expression over time
measured by western blot in the liver demonstrate counterclockwise hysteresis, showing
it takes time for enough HCQ and DHCQ levels to build up before an effect is observed
(Figure 1D and Figure S3). There is not much difference between the curves when
comparing LC3-II levels to either whole blood or liver HCQ concentrations, indicating that
HCQ whole blood concentrations can be used as a surrogate for autophagy effects.
Further, DHCQ has a similar effect as HCQ on LC3-II levels. When HCQ and DHCQ
concentrations are added together to determine total active drug, the hysteresis curves
are still counterclockwise and similar to HCQ or DHCQ alone, indicating that although
DHCQ is active, it does not significantly change how quickly autophagy is affected and
also requires a buildup to achieve an effect.
HCQ exhibits anti-proliferative effects and decreases autophagic flux but does
not induce significant cell death in in vitro 2D culture
In vitro two-dimensional cell culture experiments were performed to validate standard cell
culture methods as a sufficient pharmacodynamic model comparable to in vivo results
and to assess how HCQ is affecting cell growth, death, and long-term autophagy in breast
This article has not been copyedited and formatted. The final version may differ from this version.JPET Fast Forward. Published on September 9, 2021 as DOI: 10.1124/jpet.121.000730
at ASPE
T Journals on January 18, 2022
jpet.aspetjournals.orgD
ownloaded from
19
cancer. To investigate differences in HCQ uptake and response between breast cancers
with different sensitivities to autophagy inhibition determined via shRNA knockdowns and
responses to chloroquine in vitro and when grown as tumor xenografts (Maycotte et al.,
2014), MDA-MB-468 (triple negative basal), MDA-MB-231 (triple negative claudin-low),
and MCF7 (luminal) cells, listed from most autophagy sensitive to least autophagy
sensitive, were treated with increasing doses of HCQ in buffered DMEM for up to 120 hr.
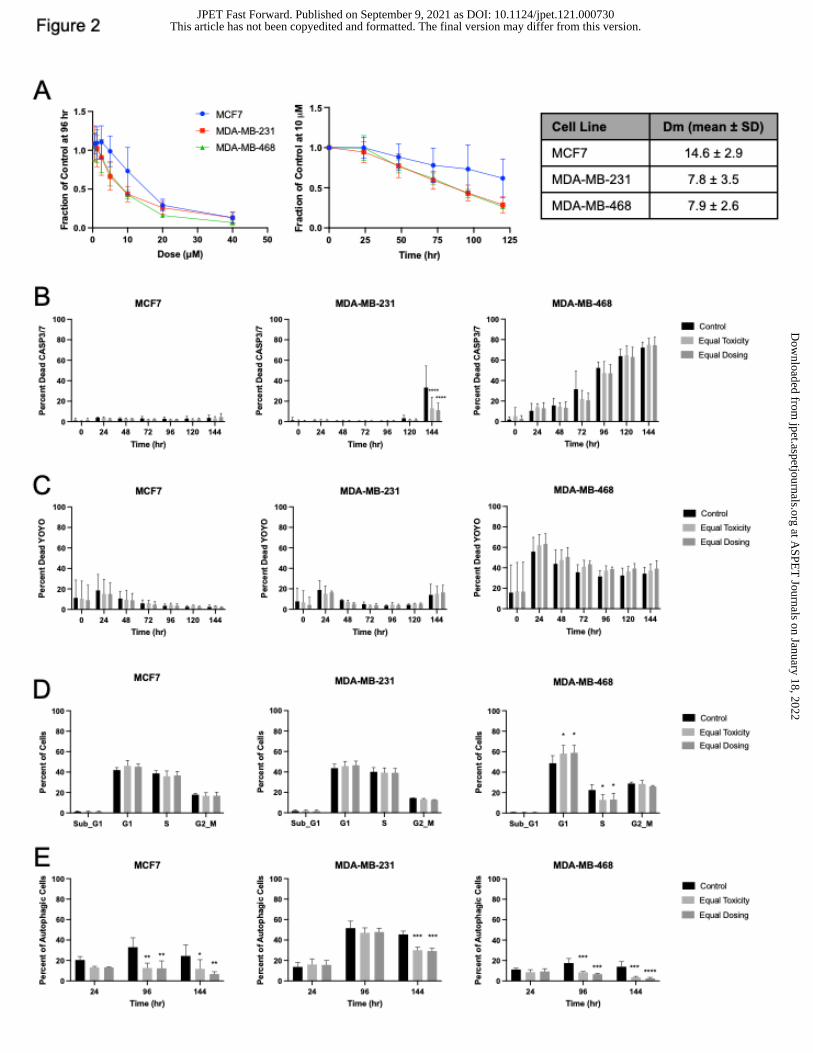
Cells are more affected by lower doses of HCQ at later time points (Figure 2A). The
median dose at which half of cells were affected (Dm) at 96 hr was calculated. As
expected, autophagy independent MCF7 had the highest Dm of 14.6 2.9 M, while
autophagy dependent MDA-MB-231 and MDA-MB-468 Dm’s were lower at 7.8 3.9 M
and 7.9 2.6 M, respectively (Figure 2A).
Since cancer patients are generally treated with 200 mg to 400 mg HCQ, the
maximal concentration of HCQ achievable in patients is equivalent to 10 M and 20 M
in vitro based on dosing an average size patient. Therefore, cells were treated with either
10 M (equal dosing) or their Dm value (equal toxicity, 8 M for MDA-MB-231 and MDA-
MB-468 and 15 M for MCF7) for the following experiments. Equal dosing means cells
were treated with the same concentration of HCQ while equal toxicity means cells were
treated at the HCQ concentration in which half of the cells were affected. To determine if
the cells were dying via apoptosis, cells were treated with HCQ for 144 hr with a Caspase
3/7 fluorescent dye and monitored in a live cell imaging system. There were no differences
in Caspase 3/7 signal between control and HCQ-treated cells in any cell line (Figure 2B
and Supplemental Figure 6A), indicating that either cell growth is inhibited or that cells
are dying by another cell death pathway. To assess whether HCQ causes death in a
This article has not been copyedited and formatted. The final version may differ from this version.JPET Fast Forward. Published on September 9, 2021 as DOI: 10.1124/jpet.121.000730
at ASPE
T Journals on January 18, 2022
jpet.aspetjournals.orgD
ownloaded from
20
caspase 3/7 independent manner, cell death was measured in a live cell imaging system
using the cytotoxicity agent YOYO, a fluorescent dye that is cell membrane impermeable
and binds free DNA in solution as an indicator of cell death (Figure 2C and Supplemental
Figure 6B). No difference between control and HCQ-treated cell death was detected.
However, when cells were stained with a live/dead stain and analyzed via flow cytometry
after 48 hr, 96 hr, or 144 hr of HCQ treatment, modest cell death that was time and dose
dependent was observed in the autophagy dependent cells (Supplemental Figure 4A).
Overall, this indicates that cell death is not the major cellular pharmacodynamic response
to HCQ in 2D culture.
To discern whether cells were growth inhibited, cell cycle assays were performed
following HCQ dosing for 48 hr. Cell cycle analysis showed that when HCQ concentration
is high enough, an increase in G1 and a decrease in G2/M and S is observed
(Supplemental Figure 4B). MCF7 cells treated with 10 M (less than the Dm) have similar
percentages of cells to control in these phases compared to 15 M. In contrast, MDA-
MB-231 and MDA-MB-468 cells experienced a decrease in G2/M and an increase in
G0/G1 at all HCQ doses used (their Dm and higher). These results were further supported
by cell cycle analysis via EdU incorporation. After HCQ treatment for 48 hr, there were
more MDA-MB-231 and MDA-MB-468 cells in G1 and less cells in S and G2/M phases
of the cell cycle when treated with both HCQ concentrations but MCF7 cells treated with
10 M were not different from their control counterparts as the MCF7 cells treated with
15 M were (Figure 2D). Changes in cell cycle were most enhanced in MDA-MB-468,
indicating that HCQ more greatly affects cells that are inherently autophagy dependent.
This article has not been copyedited and formatted. The final version may differ from this version.JPET Fast Forward. Published on September 9, 2021 as DOI: 10.1124/jpet.121.000730
at ASPE
T Journals on January 18, 2022
jpet.aspetjournals.orgD
ownloaded from
21
Autophagic flux following HCQ treatment was assessed by flow cytometry using
cells transduced with a LC3-mCherry-GFP reporter. This reporter works by tagging
autophagosomes. GFP gets quenched in acidic environments. Therefore, when an
autophagosome fuses with a lysosome, GFP signal decreases and indicates autophagic
flux is occurring. Autophagy was inhibited significantly in the MCF7 cells following as little
as 24 hr but autophagy inhibition was not significant in the MDA-MB-231 and MDA-MB-
468 until 144 hr or 96 hr, respectively (Figure 2E and Supplemental Figure 6C). Results
were similar using a live cell imaging system (Supplemental Figure 4C and Supplemental
Figure 6D). This indicates that HCQ has prolonged PD affects that may not be observed
at short time points.
HCQ induces cell death and decreases autophagic flux in tumor organoids
Cells were grown on a basement membrane matrix to obtain three-dimensional tumor
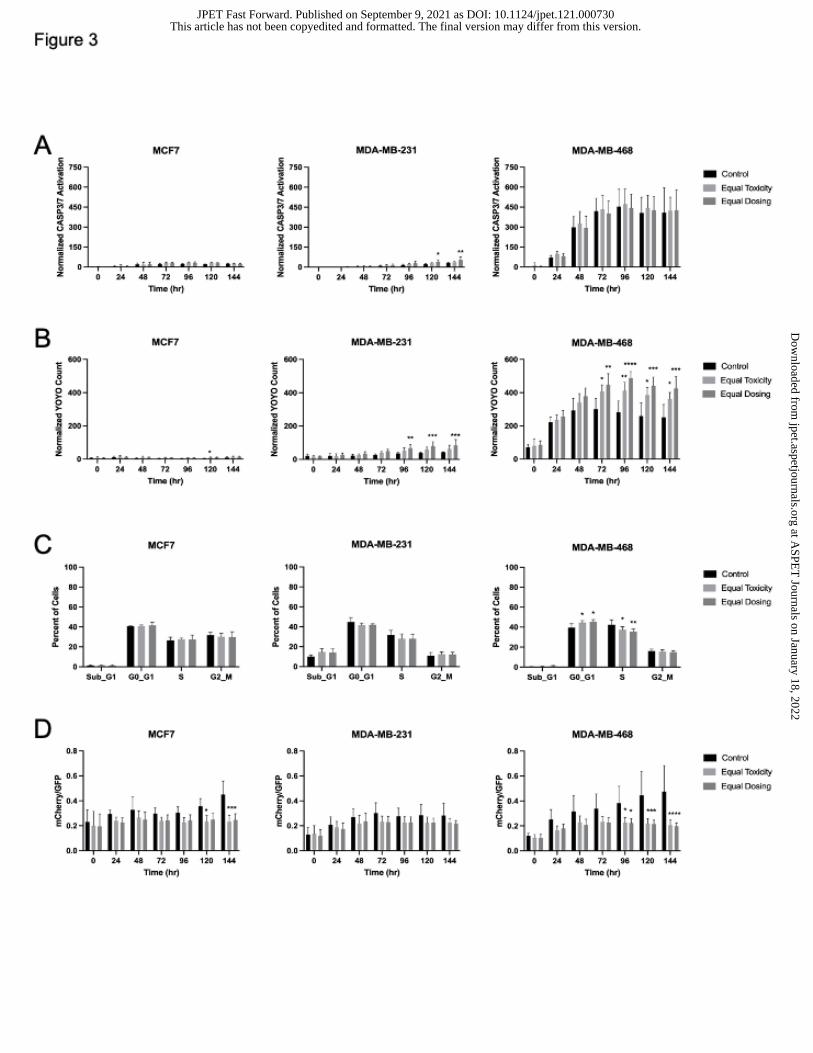
organoids to better recapitulate in vivo tumors. Caspase 3/7-dependent cell death was
assessed by live cell imaging in the IncuCyte. There was significant caspase 3/7 cell
death in MCF7 at 96 hr but by 144 hr, the difference between control and HCQ-treated
organoids was no longer significant. No significant caspase 3/7 cell death was observed
in MDA-MB-468 organoids but there was caspase 3/7 dependent cell death in MDA-MB-
231 organoids treated with HCQ 96 hr and later (Figure 3A and Supplemental Figure 7A).
Cytotoxicity measured by YOYO staining showed significant cell death in MDA-MB-231
and MDA-MB-468 organoids at time points as early as 72 hr following HCQ treatment but
not significantly in the MCF7 organoids at equal dosing until 120 hr (Figure 3B and
This article has not been copyedited and formatted. The final version may differ from this version.JPET Fast Forward. Published on September 9, 2021 as DOI: 10.1124/jpet.121.000730
at ASPE
T Journals on January 18, 2022
jpet.aspetjournals.orgD
ownloaded from
22
Supplemental Figure 7B), indicating that HCQ causes more cell death in autophagy
dependent tumors than autophagy independent tumors.
Cell cycle analysis was assessed in tumor organoids via EdU incorporation (Figure
3C). Results were similar to 2D culture; there was no difference in HCQ-treated MCF7
cells compared to controls but MDA-MB-231 and MDA-MB-468 cells both had
significantly less cells in S phase at both HCQ concentrations used. Consistent with the
2D results, MDA-MB-468 cells also had a significant increase in G1 cells following HCQ
treatment.
To assess autophagic flux, organoids transduced with a LC3-mCherry-GFP
construct were imaged in the IncuCyte over 6 days. Similar to the 2D cell culture results,
autophagy was inhibited significantly between control and HCQ-treated organoids at later
time points (Figure 3D and Supplemental Figure 7C). MCF7 and MDA-MB-468 organoid
autophagic flux inhibition was sustained and enhanced by 144 hr. MDA-MB-231 organoid
autophagic flux inhibition following HCQ was less marked compared to control which was
consistent with the 2D cell culture results.
Autophagy dependent tumors take up more HCQ in vivo
To assess how HCQ affects autophagy dependent and independent tumors in vivo,
MCF7, MDA-MB-231, or MDA-MB-468 cells were implanted into mice and once the
tumors were at least 100 mm3, the mice were treated with either 60 mg/kg HCQ once or
daily for one week to analyze steady state levels.
Whole blood HCQ and DHCQ amounts were similar in both MDA-MB-231 and
MCF7 cohorts while both tumor HCQ and DHCQ amounts were higher in MDA-MB-231
This article has not been copyedited and formatted. The final version may differ from this version.JPET Fast Forward. Published on September 9, 2021 as DOI: 10.1124/jpet.121.000730
at ASPE
T Journals on January 18, 2022
jpet.aspetjournals.orgD
ownloaded from
23
compared to MCF7 following single HCQ doses. MDA-MB-468 HCQ and DHCQ amounts
were also similar to MDA-MB-231 (Figure 4A). Tumor levels of HCQ and DHCQ were
higher in MDA-MB-231 and MDA-MB-468 compared to MCF7 at steady state (Figure 4B),
indicating that more HCQ and DHCQ is distributed into autophagy sensitive tumors. In
the steady state cohort, whole blood levels were similar for HCQ and DHCQ in MDA-MB-
231 and MCF7 but the MDA-MB-231 cohort had higher tumor HCQ and DHCQ levels
compared to the MCF7 cohort (Figure 4C). When the steady state tumor group was
compared to the 24 hr single dose tumors in each tumor type, HCQ and DHCQ levels
were significantly higher in tumors in the steady state group compared to the single dose
groups (Figure 4C), indicating that HCQ and DHCQ move into the tumor after 24 hr and
tumor and blood saturation is not achieved by 24 hr. Whole blood of tumor-bearing mice
treated with a single dose of HCQ for 24 hr was compared to the non-tumor bearing mice
treated with HCQ for 24 hr from Figure 1. HCQ levels from the tumor-bearing mice fell
between the 40 and 80 mg/kg non-tumor bearing levels as expected (Figure 4C) and PK
parameters fell within the expected range (Table 1) . DHCQ levels were not as high in
whole blood in tumor-bearing mice compared to levels that would be predicted based on
the non-tumor bearing mice but this could be due to DHCQ sequestering in tumors in the
tumor-bearing mice. When analyzing DHCQ:HCQ ratios found in steady state treated
tumors, MDA-MB-231 and MDA-MB-468 had higher ratios compared to MCF7 (Figure
4D), indicating that more DHCQ was formed compared to HCQ in the autophagy
dependent tumors.
This article has not been copyedited and formatted. The final version may differ from this version.JPET Fast Forward. Published on September 9, 2021 as DOI: 10.1124/jpet.121.000730
at ASPE
T Journals on January 18, 2022
jpet.aspetjournals.orgD
ownloaded from

24
Autophagic responses were not different but proliferation was less in autophagy
dependent tumors in vivo
Pharmacodynamic response was evaluated via western blot analysis of LC3 and p62 in
the MDA-MB-231, MCF7, and MDA-MB-468 cohorts. There were no major differences
between control and treated mice at 24 hr, 48 hr, or steady state doses although p62
levels trended higher in treated MDA-MB-468 tumors at 24 hr (Figure 4E and Figure S5).
LC3-II densitometry area normalized to total protein were highest at 12 hr, 24 hr, and
following steady state dosing in MDA-MB-231 tumors but these results were variable
depending on the mouse (Figure 4F). Tumor cell proliferation was measured via
immunofluorescence staining of Ki67 in the MDA-MB-231 and MCF7 control and steady
state cohorts. MDA-MB-231 tumors had significantly less Ki67 staining following HCQ
treatment while there was no difference in cell proliferation in the MCF7 tumors after HCQ
treatment (Figure 4G). These results are consistent with the cell cycle results in 2D culture
(Figure 2D) and tumor organoids (Figure 3C) because the cells that are more sensitive to
autophagy inhibition (MDA-MB-231 and MDA-MB-468) have less proliferative cells at
lower HCQ concentrations compared to those that are not (MCF7). Apoptotic cell death
via immunofluorescence staining of cleaved caspase-3 was also performed but no tumors
expressed cleaved caspase-3 (results not shown).
Discussion
Autophagy, a lysosomal degradation process that recycles cellular components, has been
linked to enhanced cancer cell survival and chemotherapy resistance. HCQ is repurposed
as an anticancer agent that inhibits autophagy. Although it is currently being used in over
This article has not been copyedited and formatted. The final version may differ from this version.JPET Fast Forward. Published on September 9, 2021 as DOI: 10.1124/jpet.121.000730
at ASPE
T Journals on January 18, 2022
jpet.aspetjournals.orgD
ownloaded from
25
90 cancer clinical trials alone or in combination treatments, pharmacodynamic responses
associated with drug dosages used clinically is unclear. Further, pre-clinical studies in
mice use varying doses of HCQ but there is no rationale behind those doses or the affect
the associated drug exposures have on autophagy inhibition in vivo.
This study showed that HCQ and its major active metabolite DHCQ levels are dose
dependent in whole blood and multiple tissues in vivo (Figure 1A and Supplemental
Figure S1). Autophagy inhibition was achieved at all doses in liver and gut at multiple time
points (Figure 1C). Although some autophagy inhibition was observed at various doses
in multiple tissues, there was high variability between different mice. Variability and non-
significant differences in autophagy inhibition is also evident in the clinic (Wolpin et al.,
2014, Mahalingam et al., 2014, Barnard et al., 2014) and the results here show that this
is difficult to control from patient to patient based on dose alone, suggesting HCQ doses
may need to be tailored based on their individual PD response. It further implies that
autophagy inhibition may not be reliably achievable using HCQ and that more potent
autophagy inhibitors such as DC661 should be considered. This work clarified that 60
mg/kg ± 20 mg/kg HCQ is the HED to give mice in pre-clinical studies and validates the
clinical relevance for studies that choose HCQ doses within this range (Figure 1B).
Calculating the HED in this way highlights the importance of normalizing pre-clinical and
clinical drug exposure because mouse model efficacy is predictive of clinical response
when drug concentrations in mice are appropriately corrected for therapeutic exposure
(Wong et al., 2012, Kerbel 2003).
Mice with breast tumors treated with the HED of 60 mg/kg HCQ had similar whole
blood HCQ and DHCQ levels but varying tumor levels with more detected in the
This article has not been copyedited and formatted. The final version may differ from this version.JPET Fast Forward. Published on September 9, 2021 as DOI: 10.1124/jpet.121.000730
at ASPE
T Journals on January 18, 2022
jpet.aspetjournals.orgD
ownloaded from
26
autophagy dependent MDA-MB-231 and MDA-MB-468 tumors compared to autophagy
independent MCF7 tumors (Maycotte et al., 2014) (Figure 4A), suggesting that autophagy
dependent tumors sequester more HCQ over time. This could be due to an increase in
lysosomes in autophagy dependent tumors compared to autophagy independent tumors
(Collins et al., 2021). There are important implications of this when considering dual
treatment with HCQ and other drugs, especially chemotherapies that sequester in
lysosomes. It could be advantageous to treat patients with HCQ prior to these drugs since
HCQ also sequesters in lysosome and could make these drugs more potent, as seen in
a phase I clinical trial in dogs with lymphoma (Barnard et al., 2014). Although much
information exists on HCQ effects in cancer, it is also important to consider DHCQ since
it is present at relevant concentrations and correlates to liver autophagy inhibition (Figure
1D and Supplemental Figure S3). Further, data here suggests that DHCQ:HCQ ratios
may be predictive of patient efficacy based on autophagy dependency of the tumor; this
ratio has been implicated in patient response to HCQ treatment in other studies (Munster
et al., 2002, Lee et al., 2016). Similar to HCQ, DHCQ has a long half-life of approximately
160 hr in people (Munster et al., 2002). However, DHCQ is not produced in cell culture
experiments because there are no cytochrome P450 enzymes. Since in vitro studies do
not take into account DHCQ but it has the same action as HCQ, drug concentrations used
in vitro likely do not reflect the full efficacy HCQ and subsequent DHCQ will have on PD
and this should be taken into consideration when choosing HCQ doses in vitro. This is
evidenced by comparing HCQ exposure in vitro to in vivo exposure, where 20 µM HCQ
dosing in cell culture correlates best with the autophagy dependent tumors while there is
no correlation between MCF7 and in vitro exposure (Figure 5). Further, adding in relevant
This article has not been copyedited and formatted. The final version may differ from this version.JPET Fast Forward. Published on September 9, 2021 as DOI: 10.1124/jpet.121.000730
at ASPE
T Journals on January 18, 2022
jpet.aspetjournals.orgD
ownloaded from
27
DHCQ exposure means that a higher concentration of HCQ can be used in cell culture to
achieve the same exposure observed in vivo (Figure 5). This also highlights the
importance of calculating maximum achievable clinically relevant doses for cell culture
experiments.
Autophagy inhibition measured by western blot in vivo was less conclusive in all
tumor types which is consistent with the non-tumor bearing data and autophagy inhibition
measured clinically. However, autophagy inhibition was observed in vitro at clinically
relevant concentrations. Inhibition was most enhanced at later time points indicating that
HCQ does not decrease autophagic flux rapidly (Figure 2E and 3D) even though HCQ
uptake is observed at early time points in the tumors. This is consistent with observing
decreased cell growth compared to control following HCQ treatment at later time points
(Figure 2A). Further, MDA-MB-231 showed high basal autophagy even when treated with
HCQ, implying that HCQ is inhibiting autophagy but not as well as other autophagy
inhibitors since this assay was based on autophagy inhibition via bafilomycin A1. Both
autophagy dependent and independent cell lines had significant decreases in autophagic
flux indicating autophagy is still inhibited by HCQ irrespective of autophagy dependency.
In contrast, one study found the basal breast cancer line SUM190 to be the most sensitive
to HCQ induced autophagy inhibition in vitro but that could be because it only analyzed
short time points (Wang et al., 2019). Overall, autophagy inhibition was variable in vivo
but observed in vitro, suggesting that other autophagy PD measures may be necessary
to better understand how HCQ is causing autophagy inhibition in vivo and clinically.
Although autophagy inhibition was inconsistent across tumor types and between
controlled and treated mice, cell proliferation was consistently affected in autophagy
This article has not been copyedited and formatted. The final version may differ from this version.JPET Fast Forward. Published on September 9, 2021 as DOI: 10.1124/jpet.121.000730
at ASPE
T Journals on January 18, 2022
jpet.aspetjournals.orgD
ownloaded from
28
sensitive MDA-MB-231 and MDA-MB-468 tumors treated with HCQ but not in autophagy
independent MCF7 tumors (Figures 2D, 3C, and 4G) indicating that autophagy dependent
tumors are more affected by single agent HCQ. Further, cell proliferation was more
affected in autophagy dependent tumors at lower doses of HCQ compared to MCF7
(Figures 2D and 3C), suggesting that the MCF7 tumors in vivo did not have high enough
HCQ levels to cause decreased cell proliferation that was observed in MDA-MB-231. The
ability of HCQ alone to inhibit cell proliferation varies in tumor types (Xie et al., 2013,
Arnaout et al., 2019), suggesting that CQ and HCQ alone may not provide effective anti-
proliferative effects in many cancer patients but that HCQ alone is anti-proliferative if
tumors are inherently dependent on autophagy. Even though HCQ did decrease cell
proliferation in autophagy dependent tumors, more potent autophagy inhibitors may
produce more robust results and have less variability in achieving autophagy inhibition as
a single agent compared to HCQ.
Clinically relevant HCQ concentrations were used in this study to determine if HCQ
causes cancer cell death. Based on in vivo and in vitro apoptosis and cell death assays,
breast cancer treated with HCQ alone at the concentrations used here do not appear to
die via caspase 3/7-dependent apoptosis but do undergo some cell death in 2D and
organoids (Supplemental Figure S4A and Figure 3B) and this cell death is enhanced in
autophagy dependent tumors at later time points. Another study also observed no
caspase 3-dependent cell death in head and neck squamous cell carcinoma following 20
M HCQ alone (Gao et al., 2018). Other studies have shown that HCQ alone can induce
caspase 3-dependent cell death in gastric (Wang et al., 2019) and bladder cancer (Lin et
al., 2017) at HCQ concentrations of 14 M and 20 M respectively, indicating that HCQ
This article has not been copyedited and formatted. The final version may differ from this version.JPET Fast Forward. Published on September 9, 2021 as DOI: 10.1124/jpet.121.000730
at ASPE
T Journals on January 18, 2022
jpet.aspetjournals.orgD
ownloaded from
29
alone will only induce this kind of cell death at clinically achievable concentrations in
certain cancer types. However, when clinically relevant HCQ doses are combined with
other treatments, HCQ enhances apoptotic cell death in other cancer types such as head
and neck squamous cell carcinoma (Gao et al., 2018), melanoma (Xie et al., 2013), and
gastric cancer (Wang et al., 2019), demonstrating that although low enough doses of
HCQ alone do not cause caspase 3/7-dependent apoptosis in certain cancer types, in
combination with other therapies it does induce caspase 3/7-dependent apoptosis.
Combination therapies were not tested in this study, but the results here and in other
studies suggest that combining HCQ with other treatments may enhance cell death in
breast cancer.
Overall, this study shows that 2D cell culture, 3D tumor organoids, and in vivo
studies produce similar results and in vitro studies can be used as surrogates to
recapitulate in vivo tumor responses. Tumor autophagy dependency is important in the
evocation of cellular responses including autophagy inhibition, cell proliferation, and cell
death. Further, in certain contexts, HCQ may not be an adequate drug as a single agent
depending on the clinical objective. DHCQ is an active metabolite whose effects needs
to be considered in in vitro experiments since it is not produced but would add to toxicity
if it were present. Lastly, better biomarkers to measure autophagy inhibition clinically are
necessary to understand how the PD relates to the PK of autophagy inhibitors.
Acknowledgements
We would like to thank Drs. Ryan Hansen and Keagan Collins for contributions in the
pharmacokinetic studies as well as other staff in the Pharmacology Shared Resource.
This article has not been copyedited and formatted. The final version may differ from this version.JPET Fast Forward. Published on September 9, 2021 as DOI: 10.1124/jpet.121.000730
at ASPE
T Journals on January 18, 2022
jpet.aspetjournals.orgD
ownloaded from
30
Authorship Contributions
Participated in research design: Van Eaton and Gustafson
Conducted experiments: Van Eaton
Performed data analysis: Van Eaton and Gustafson
Wrote or contributed to the writing of the manuscript: Van Eaton and Gustafson
References
Amaravadi RK, Lippincott-Schwartz J, Yin XM, Weiss WA, Takebe N, Timmer W, DiPaola
RS, Lotze MT and White E (2011) Principles and current strategies for targeting
autophagy for cancer treatment. Clin Cancer Res 17:654-666.
Amaravadi RK, Yu D, Lum JJ, Bui T, Christophorou MA, Evan GI, Thomas-Tikhonenko A
and Thompson CB (2007) Autophagy inhibition enhances therapy-induced apoptosis
in a Myc-induced model of lymphoma. J Clin Invest 117:326-336.
Arnaout A, Robertson SJ, Pond GR, Lee H, Jeong A, Ianni L, Kroeger L, Hilton J,
Coupland S, Gottlieb C, et al. (2019) A randomized, double-blind, window of
opportunity trial evaluating the effects of chloroquine in breast cancer patients. Breast
Cancer Res Treat 178:327-335.
Barnard RA, Wittenburg LA, Amaravadi RK, Gustafson DL, Thorburn A and Thamm DH
(2014) Phase I clinical trial and pharmacodynamic evaluation of combination
hydroxychloroquine and doxorubicin treatment in pet dogs treated for spontaneously
occurring lymphoma. Autophagy 10:1415-1425.
This article has not been copyedited and formatted. The final version may differ from this version.JPET Fast Forward. Published on September 9, 2021 as DOI: 10.1124/jpet.121.000730
at ASPE
T Journals on January 18, 2022
jpet.aspetjournals.orgD
ownloaded from
31
Bleijs M, van de Wetering M, Clevers H and Drost J (2019) Xenograft and organoid model
systems in cancer research. EMBO J 38:e101654.
Boehrer S, Ades L, Braun T, Galluzzi L, Grosjean J, Fabre C, Le Roux G, Gardin C, Martin
A, de Botton S, et al. (2008) Erlotinib exhibits antineoplastic off-target effects in AML
and MDS: A preclinical study. Blood 111:2170-2180.
Campaner E, Zannini A, Santorsola M, Bonazza D, Bottin C, Cancila V, Tripodo C, Bortul
M, Zanconati F, Schoeftner S, et al. (2020) Breast cancer organoids model patient-
specific response to drug treatment. Cancers (Basel) 12:3869.
Cardoso CD and Bonato PS (2009) Enantioselective metabolism of hydroxychloroquine
employing rats and mice hepatic microsomes. Braz J Pharm Sci 45:659-667.
Carmichael SJ, Charles B and Tett SE (2003) Population pharmacokinetics of
hydroxychloroquine in patients with rheumatoid arthritis. Ther Drug Monit 25:671-681.
Cheong H (2015) Integrating autophagy and metabolism in cancer. Arch Pharm Res
38:358-371.
Collins KP, Witta S, Coy JW, Pang Y and Gustafson DL (2021) Lysosomal biogenesis
and implications for hydroxychloroquine disposition. J Pharmacol Exp Ther 376:294-
305.
De Duve C and Wattiaux R (1966) Functions of lysosomes. Annu Rev Physiol 28:435-
492.
Dobrolecki LE, Airhart SD, Alferez DG, Aparicio S, Behbod F, Bentires-Alj M, Brisken C,
Bult CJ, Cai S, Clarke RB, et al. (2016) Patient-derived xenograft (PDX) models in
basic and translational breast cancer research. Cancer Metastasis Rev 35:547-573.
This article has not been copyedited and formatted. The final version may differ from this version.JPET Fast Forward. Published on September 9, 2021 as DOI: 10.1124/jpet.121.000730
at ASPE
T Journals on January 18, 2022
jpet.aspetjournals.orgD
ownloaded from
32
Ducharme J and Farinotti R (1996) Clinical pharmacokinetics and metabolism of
chloroquine. Focus on recent advancements. Clin Pharmacokinet 31:257-274.
Duffy A, Le J, Sausville E and Emadi A (2015) Autophagy modulation: A target for cancer
treatment development. Cancer Chemother Pharmacol 75:439-447.
Duran A, Linares JF, Galvez AS, Wikenheiser K, Flores JM, Diaz-Meco MT and Moscat
J (2008) The signaling adaptor p62 is an important NF-kappaB mediator in
tumorigenesis. Cancer Cell 13:343-354.
Estes ML, Ewing-Wilson D, Chou SM, Mitsumoto H, Hanson M, Shirey E and Ratliff NB
(1987) Chloroquine neuromyotoxicity. Clinical and pathologic perspective. Am J Med
82:447-455.
Fan H, Demirci U and Chen P (2019) Emerging organoid models: Leaping forward in
cancer research. J Hematol Oncol 12:142.
Frese KK and Tuveson DA (2007) Maximizing mouse cancer models. Nat Rev Cancer
7:645-658.
Furst DE (1996) Pharmacokinetics of hydroxychloroquine and chloroquine during
treatment of rheumatic diseases. Lupus 5 Suppl 1:S11-15.
Gao L, Zhao X, Lang L, Shay C, Andrew Yeudall W and Teng Y (2018) Autophagy
blockade sensitizes human head and neck squamous cell carcinoma towards CYT997
through enhancing excessively high reactive oxygen species-induced apoptosis. J Mol
Med 96:929-938.
Goldberg SB, Supko JG, Neal JW, Muzikansky A, Digumarthy S, Fidias P, Temel JS,
Heist RS, Shaw AT, McCarthy PO, et al. (2012) A Phase I study of erlotinib and
This article has not been copyedited and formatted. The final version may differ from this version.JPET Fast Forward. Published on September 9, 2021 as DOI: 10.1124/jpet.121.000730
at ASPE
T Journals on January 18, 2022
jpet.aspetjournals.orgD
ownloaded from
33
hydroxychloroquine in advanced non-small-cell lung cancer. J Thorac Oncol 7:1602-
1608.
Kerbel RS (2003) Human tumor xenografts as predictive preclinical models for anticancer
drug activity in humans: Better than commonly perceived-but they can be improved.
Cancer Biol Ther 4:S134-139.
Kimmelman AC (2011) The dynamic nature of autophagy in cancer. Genes Dev 25:1999-
2010.
Komatsu M, Waguri S, Koike M, Sou YS, Ueno T, Hara T, Mizushima N, Iwata J, Ezaki
J, Murata S, et al. (2007) Homeostatic levels of p62 control cytoplasmic inclusion body
formation in autophagy-deficient mice. Cell 131:1149-1163.
Lee JY, Vinayagamoorthy N, Han K, Kwok SK, Ju JH, Park KS, Jung SH, Park SW,
Chung YJ and Park SH (2016) Association of polymorphisms of cytochrome P450 2D6
with blood hydroxychloroquine levels in patients with systemic lupus erythematosus.
Arthritis Rheumatol 68:184-190.
Li X, Pan B, Ma J, Zhao Z and Li M (2019) Breast cancer organoids model treatment
response of Her2 targeted therapy in her2-mutant breast cancer. Ann Oncol 30:v768-
v769.
Lim HS, Im JS, Cho JY, Bae KS, Klein TA, Yeom JS, Kim TS, Choi JS, Jang IJ and Park
JW (2009) Pharmacokinetics of hydroxychloroquine and its clinical implications in
chemoprophylaxis against malaria caused by plasmodium vivax. Antimicrob Agents
Chemother 53:1468-1475.
This article has not been copyedited and formatted. The final version may differ from this version.JPET Fast Forward. Published on September 9, 2021 as DOI: 10.1124/jpet.121.000730
at ASPE
T Journals on January 18, 2022
jpet.aspetjournals.orgD
ownloaded from
34
Lin YC, Lin JF, Wen SI, Yang SC, Tsai TF, Chen HE, Chou KY and Hwang TI (2017)
Chloroquine and hydroxychloroquine inhibit bladder cancer cell growth by targeting
basal autophagy and enhancing apoptosis. Kaohsiung J Med Sci 33:215-223.
Mahalingam D, Mita M, Sarantopoulos J, Wood L, Amaravadi RK, Davis LE, Mita AC,
Curiel TJ, Espitia CM, Nawrocki ST, et al. (2014) Combined autophagy and HDAC
inhibition: A Phase I safety, tolerability, pharmacokinetic, and pharmacodynamic
analysis of hydroxychloroquine in combination with the HDAC inhibitor vorinostat in
patients with advanced solid tumors. Autophagy 10:1403-1414.
Manic G, Obrist F, Kroemer G, Vitale I and Galluzzi L (2014) Chloroquine and
hydroxychloroquine for cancer therapy. Mol Cell Oncol 1:e29911.
Mauthe M, Orhon I, Rocchi C, Zhou X, Luhr M, Hijlkema KJ, Coppes RP, Engedal N, Mari
M and Reggiori F (2018) Chloroquine inhibits autophagic flux by decreasing
autophagosome-lysosome fusion. Autophagy 14:1435-1455.
Maycotte P, Gearheart CM, Barnard R, Aryal S, Mulcahy Levy JM, Fosmire SP, Hansen
RJ, Morgan MJ, Porter CC, Gustafson DL, et al. (2014) Stat3-mediated autophagy
dependence identifies subtypes of breast cancer where autophagy inhibition can be
efficacious. Cancer Res 74:2579-2590.
Munster T, Gibbs JP, Shen D, Baethge BA, Botstein GR, Caldwell J, Dietz F, Ettlinger R,
Golden HE, Lindsley H, et al. (2002) Hydroxychloroquine concentration-response
relationships in patients with rheumatoid arthritis. Arthritis Rheum 46:1460-1469.
Rosenfeld MR, Ye X, Supko JG, Desideri S, Grossman SA, Brem S, Mikkelson T, Wang
D, Chang YC, Hu J, et al. (2014) A Phase I/II trial of hydroxychloroquine in conjunction
This article has not been copyedited and formatted. The final version may differ from this version.JPET Fast Forward. Published on September 9, 2021 as DOI: 10.1124/jpet.121.000730
at ASPE
T Journals on January 18, 2022
jpet.aspetjournals.orgD
ownloaded from
35
with radiation therapy and concurrent and adjuvant temozolomide in patients with
newly diagnosed glioblastoma multiforme. Autophagy 10:1359-1368.
Ruiz-Irastorza G, Ramos-Casals M, Brito-Zeron P and Khamashta MA (2010) Clinical
efficacy and side effects of antimalarials in systemic lupus erythematosus: A
systematic review. Ann Rheum Dis 69:20-28.
Sasmita AO and Wong YP (2018) Organoids as reliable breast cancer study models: An
update. Int J Oncol Res 1:008.
Sflomos G, Dormoy V, Metsalu T, Jeitziner R, Battista L, Scabia V, Raffoul W, Delaloye
JF, Treboux A, Fiche M, et al. (2016) A preclinical model for ERalpha-positive breast
cancer points to the epithelial microenvironment as determinant of luminal phenotype
and hormone response. Cancer Cell 29:407-422.
Tett SE (1993) Clincal pharamcokinetics of slow-acting antirheumatic drugs. Clin.
Pharmacokinet. 25:392-407.
Thorburn A, Thamm DH and Gustafson DL (2014) Autophagy and cancer therapy. Mol
Pharmacol 85:830-838.
Wang P, Du Y and Wang J (2019) Indentification of breast cancer subtypes sensitive to
HCQ-induced autophagy inhibition. Pathol Res Pract 215:
Wang W, Liu L, Zhou Y, Ye Q, Yang X, Jiang J, Ye Z, Gao F, Tan X, Zhang G, et al.
(2019) Hydroxychloroquine enhances the antitumor effects of BC001 in gastric cancer.
Int J Oncol 55:405-414.
Wolpin BM, Rubinson DA, Wang X, Chan JA, Cleary JM, Enzinger PC, Fuchs CS,
McCleary NJ, Meyerhardt JA, Ng K, et al. (2014) Phase II and pharmacodynamic study
This article has not been copyedited and formatted. The final version may differ from this version.JPET Fast Forward. Published on September 9, 2021 as DOI: 10.1124/jpet.121.000730
at ASPE
T Journals on January 18, 2022
jpet.aspetjournals.orgD
ownloaded from
36
of autophagy inhibition using hydroxychloroquine in patients with metastatic pancreatic
adenocarcinoma. Oncologist 19:637-638.
Wong H, Choo EF, Alicke B, Ding X, La H, McNamara E, Theil FP, Tibbitts J, Friedman
LS, Hop CE, et al. (2012) Antitumor activity of targeted and cytotoxic agents in murine
subcutaneous tumor models correlates with clinical response. Clin Cancer Res
18:3846-3855.
Xie X, White EP and Mehnert JM (2013) Coordinate autophagy and mtor pathway
inhibition enhances cell death in melanoma. PLoS One 8:e55096.
Yang L, Liu B, Chen H, Gao R, Huang K, Guo Q, Li F, Chen W and He J (2020) Progress
in the application of organoids to breast cancer research. J Cell Mol Med 24:5420-
5427.
Yang S, Wang X, Contino G, Liesa M, Sahin E, Ying H, Bause A, Li Y, Stommel JM,
Dell'antonio G, et al. (2011) Pancreatic cancers require autophagy for tumor growth.
Genes Dev 25:717-729.
Yang Z and Klionsky DJ (2010) Eaten alive: A history of macroautophagy. Nat Cell Biol
12:814-822.
Zeh HJ, Bahary N, Boone BA, Singhi AD, Miller-Ocuin JL, Normolle DP, Zureikat AH,
Hogg ME, Bartlett DL, Lee KK, et al. (2020) A randomized Phase II preoperative study
of autophagy inhibition with high-dose hydroxychloroquine and gemcitabine/nab-
paclitaxel in pancreatic cancer patients. Clin Cancer Res 26:3126-3134.
This article has not been copyedited and formatted. The final version may differ from this version.JPET Fast Forward. Published on September 9, 2021 as DOI: 10.1124/jpet.121.000730
at ASPE
T Journals on January 18, 2022
jpet.aspetjournals.orgD
ownloaded from
37
Footnotes
This work was supported by National Cancer Institute Grant R01CA190170 (Therapeutic
Targeting of Autophagy-Dependent Cancer) and by Department of Defense CDMRP
Breast Cancer Research Program Grant BC130103P1 (Identifying and Targeting
Autophagy Dependence to Eliminate Metastatic Breast Cancer). This work was also
supported by the Drug Development & Discovery Shared Resource (D3SR) of the
University of Colorado Cancer Center supported by the Cancer Center Support Grant
(P30CA46934) and the Shipley University Chair in Comparative Oncology awarded to DL
Gustafson.
Legends for Figures
Figure 1. HCQ PK and associated PD in non-tumor bearing mice. (A) Exposure of HCQ
and DHCQ in whole blood, liver, gut, kidney, and brain. (B) Clinical trial human HCQ AUC
data (Rosenfeld et al., 2014) was compared to mouse AUC data to find the human
equivalent dose in mice. Dotted line represents the mean human HCQ AUC and dashed
lines represent human HCQ AUC standard deviation. The red dot represents the AUC0-
24 estimated at steady-state from the tumor-bearing mouse PK study dosed at 60 mg/kg.
(C) LC3 western blots for liver 24 hr, 48 hr, and 72 hr following HCQ in three mice. LC3
and p62 western blot quantification for liver and kidney from western blots shown in Figure
S2. (D) Hysteresis curves showing how LC3-II levels as measured in the liver are affected
by HCQ and/or DHCQ concentrations in the liver or whole blood following 40 mg/kg dose
This article has not been copyedited and formatted. The final version may differ from this version.JPET Fast Forward. Published on September 9, 2021 as DOI: 10.1124/jpet.121.000730
at ASPE
T Journals on January 18, 2022
jpet.aspetjournals.orgD
ownloaded from
38
of HCQ. Numbers on the curves correspond to the time points. N=3 mice per group. *p
0.05, **p 0.01, ***p 0.001, ****p 0.0001
Figure 2. Cell death, cell cycle, and autophagic flux following HCQ treatment in 2D cell
culture. (A) HCQ screen in breast cancer lines in buffered media from 0.625 to 40 M
HCQ. The median effective dose (Dm) at which half of the cells were affected is calculated
at 96 hr. (B) Caspase 3/7 assays on HCQ-treated cells using the live cell imaging
IncuCyte Zoom imaging system. (C) Cell death via YOYO staining using the IncuCyte
Zoom. (D) Cell cycle analysis via EdU incorporation of HCQ-treated cells for 48 hr. (E)
Autophagic flux was assessed using cells transduced with a LC3-mCherry-GFP reporter
and reporting the percent of cells using autophagy. Equal toxicity doses were 8 M for
MDA-MB-231 and MDA-MB-468 and 15 M for MCF7. Equal dosing was 10 M HCQ.
N=3 or more biological replicates of 3 technical replicates each. Significance indicated is
compared to control. *p 0.05, **p 0.01, ***p 0.001, ****p 0.0001
Figure 3. Cell death, cell cycle, and autophagic flux following HCQ treatment in tumor
organoids. (A) Cell death via Caspase 3/7 staining in the IncuCyte. Green object
integrated intensity was normalized to red object integrated intensity. (B) Cell death
analysis by YOYO staining in the IncuCyte. Green object integrated intensity was
normalized to red object integrated intensity. (C) Cell cycle analysis via EdU
incorporation. (D) Autophagy inhibition assessed by monitoring LC3-mCherry-GFP
labeled cells in the IncuCyte over six days. N=3 or more biological replicates of 3 technical
This article has not been copyedited and formatted. The final version may differ from this version.JPET Fast Forward. Published on September 9, 2021 as DOI: 10.1124/jpet.121.000730
at ASPE
T Journals on January 18, 2022
jpet.aspetjournals.orgD
ownloaded from
39
replicates each. Significance indicated is compared to control. *p 0.05, **p 0.01, ***p
0.001, ****p 0.0001
Figure 4. HCQ PK and PD in breast tumor-bearing mice. (A) Exposure of HCQ and
DHCQ in whole blood and tumor. Solid lines represent HCQ and dotted lines represent
DHCQ. (B) Blood and tumor HCQ and DHCQ amounts detected in steady-state dosed
mice compared to 24 hr single dose mice (top) and HCQ and DHCQ amounts detected
in blood in single dose 24 hr tumor-bearing mice compared to non-tumor bearing mice at
24 hr (bottom). Numbers listed above the bars are the mean amount of HCQ/DHCQ of
the respective cohort. (C) Tumor levels of HCQ and DHCQ at steady state. (D)
DHCQ:HCQ ratios in tumors. (E) Western blot quantification of LC3-II/tubulin, LC3-II
densitometry area normalized by total protein, or p62 densitometry area normalized by
total protein in breast tumors following 24 hr, 48 hr, or steady state dosing of HCQ in mice.
Western blots used for protein quantification in Figure S5. (F) Western blot and
quantification of LC3-II density normalized to total protein over 72 hr or at steady state.
(G) Immunofluorescent analysis of Ki67 in MDA-MB-231 and MCF7 control and steady
state tumors. Blue=DAPI and red=Ki67. Quantification based on 6 or more separate fields
of view on each tumor slice. N=3 mice per group. *p 0.05, **p 0.01, ***p 0.001, ****p
0.0001
Figure 5. HCQ PK exposure in vitro compared to in vivo at 24 hr and 48 hr. For the breast
tumors, exposure is based on AUC of concentration versus time curves. The 10 and 20
This article has not been copyedited and formatted. The final version may differ from this version.JPET Fast Forward. Published on September 9, 2021 as DOI: 10.1124/jpet.121.000730
at ASPE
T Journals on January 18, 2022
jpet.aspetjournals.orgD
ownloaded from

40
µM in vitro AUC is based on the theoretical exposure cells will experience based on those
doses for the given time (e.g., 10 µM * 24 hr = 240 hr* µM).
This article has not been copyedited and formatted. The final version may differ from this version.JPET Fast Forward. Published on September 9, 2021 as DOI: 10.1124/jpet.121.000730
at ASPE
T Journals on January 18, 2022
jpet.aspetjournals.orgD
ownloaded from
41
Tables
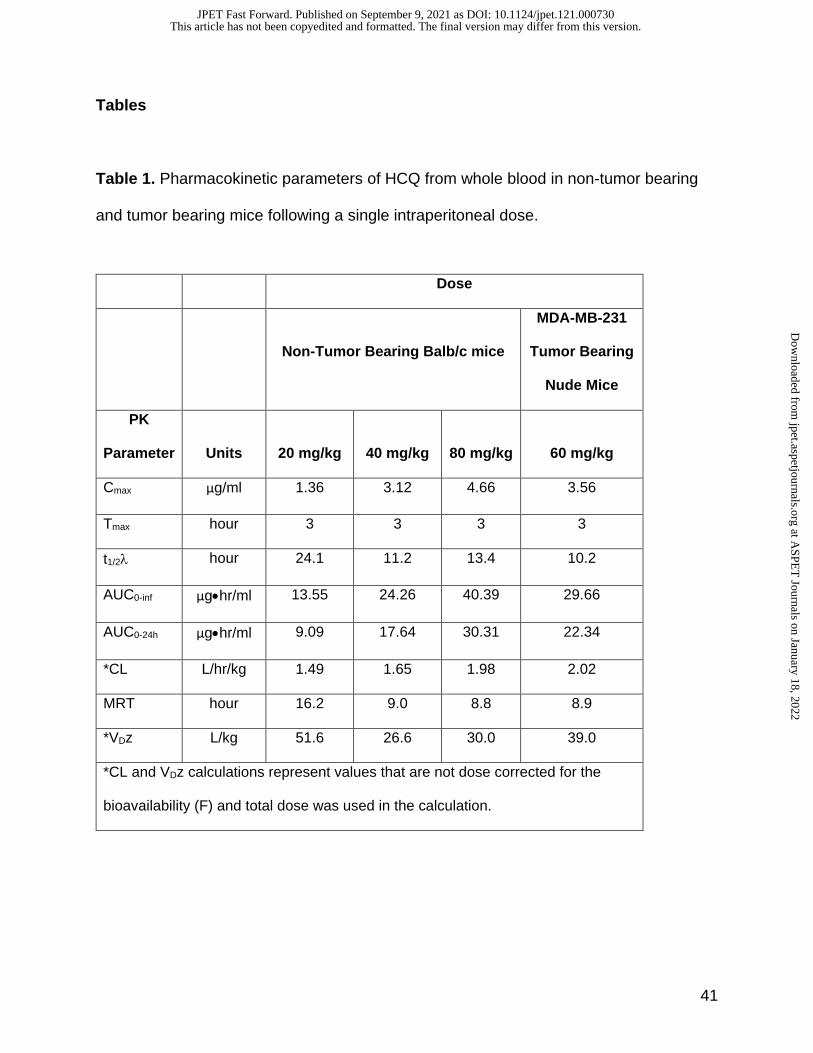
Table 1. Pharmacokinetic parameters of HCQ from whole blood in non-tumor bearing
and tumor bearing mice following a single intraperitoneal dose.
Dose
Non-Tumor Bearing Balb/c mice
MDA-MB-231
Tumor Bearing
Nude Mice
PK
Parameter
Units
20 mg/kg
40 mg/kg
80 mg/kg
60 mg/kg
Cmax µg/ml 1.36 3.12 4.66 3.56
Tmax hour 3 3 3 3
t1/2 hour 24.1 11.2 13.4 10.2
AUC0-inf µg•hr/ml 13.55 24.26 40.39 29.66
AUC0-24h µg•hr/ml 9.09 17.64 30.31 22.34
*CL L/hr/kg 1.49 1.65 1.98 2.02
MRT hour 16.2 9.0 8.8 8.9
*VDz L/kg 51.6 26.6 30.0 39.0
*CL and VDz calculations represent values that are not dose corrected for the
bioavailability (F) and total dose was used in the calculation.
This article has not been copyedited and formatted. The final version may differ from this version.JPET Fast Forward. Published on September 9, 2021 as DOI: 10.1124/jpet.121.000730
at ASPE
T Journals on January 18, 2022
jpet.aspetjournals.orgD
ownloaded from
42
This article has not been copyedited and formatted. The final version may differ from this version.JPET Fast Forward. Published on September 9, 2021 as DOI: 10.1124/jpet.121.000730
at ASPE
T Journals on January 18, 2022
jpet.aspetjournals.orgD
ownloaded from
This article has not been copyedited and formatted. The final version may differ from this version.JPET Fast Forward. Published on September 9, 2021 as DOI: 10.1124/jpet.121.000730
at ASPE
T Journals on January 18, 2022
jpet.aspetjournals.orgD
ownloaded from
This article has not been copyedited and formatted. The final version may differ from this version.JPET Fast Forward. Published on September 9, 2021 as DOI: 10.1124/jpet.121.000730
at ASPE
T Journals on January 18, 2022
jpet.aspetjournals.orgD
ownloaded from
This article has not been copyedited and formatted. The final version may differ from this version.JPET Fast Forward. Published on September 9, 2021 as DOI: 10.1124/jpet.121.000730
at ASPE
T Journals on January 18, 2022
jpet.aspetjournals.orgD
ownloaded from
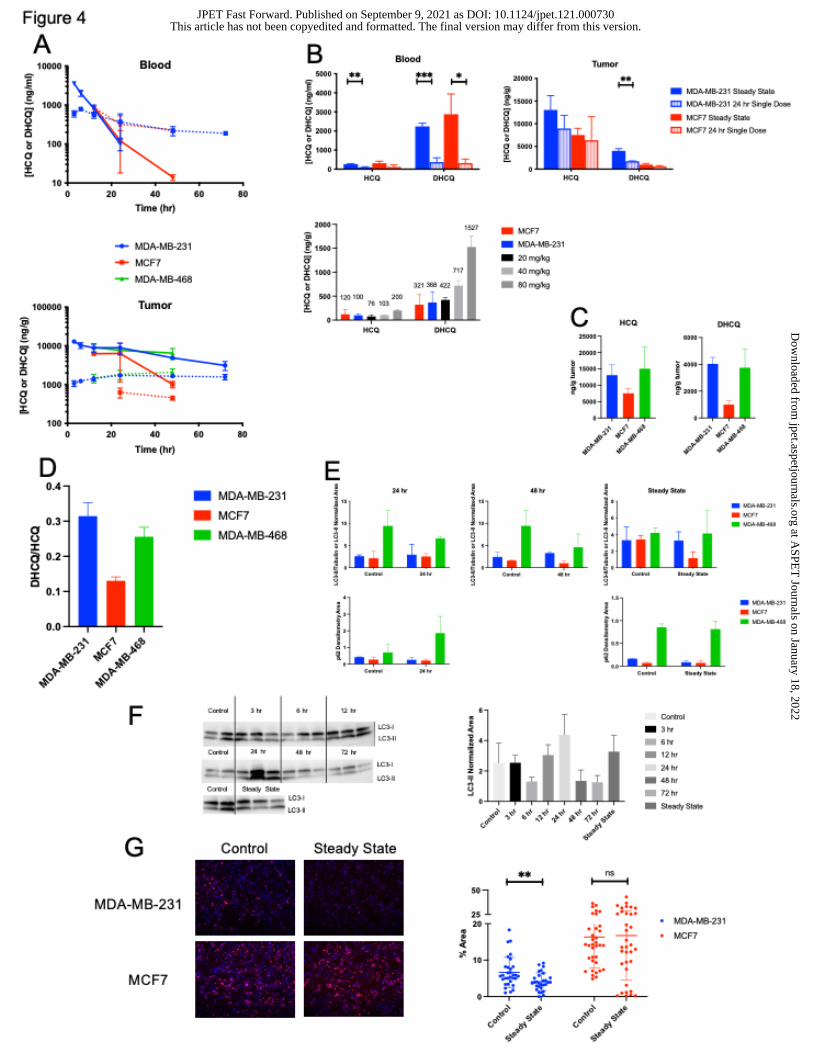
This article has not been copyedited and formatted. The final version may differ from this version.JPET Fast Forward. Published on September 9, 2021 as DOI: 10.1124/jpet.121.000730
at ASPE
T Journals on January 18, 2022
jpet.aspetjournals.orgD
ownloaded from
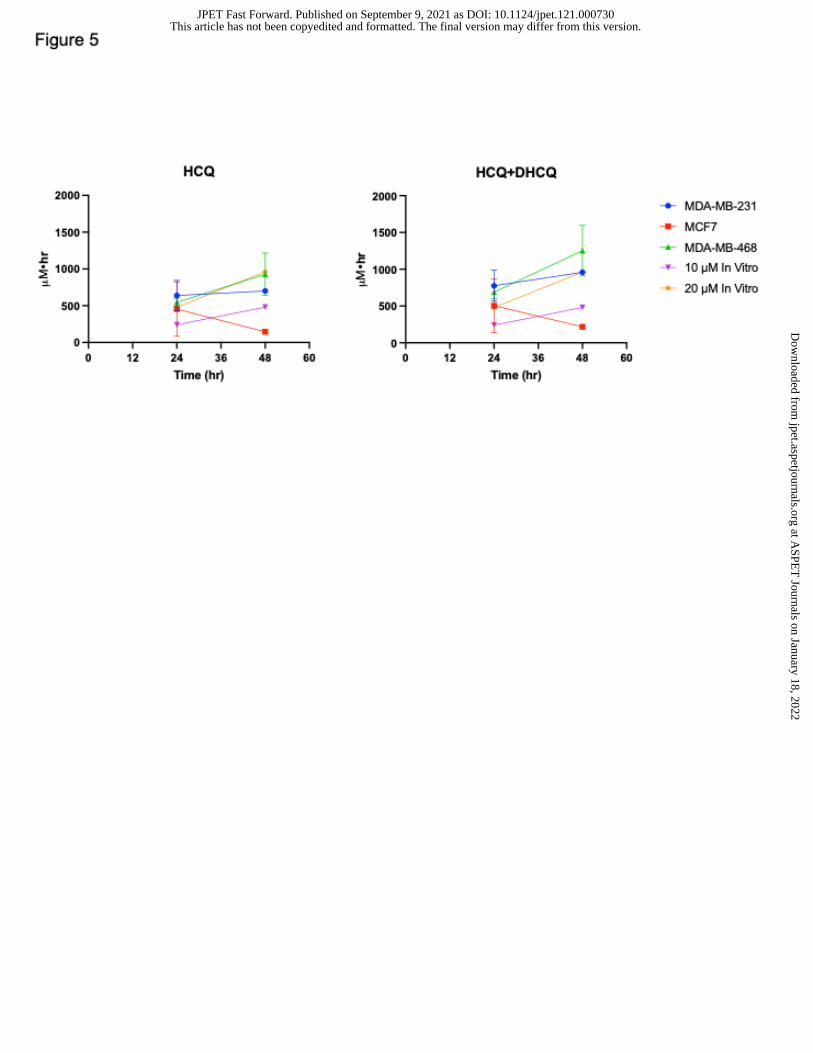
This article has not been copyedited and formatted. The final version may differ from this version.JPET Fast Forward. Published on September 9, 2021 as DOI: 10.1124/jpet.121.000730
at ASPE
T Journals on January 18, 2022
jpet.aspetjournals.orgD
ownloaded from