pharmacokinetic- pharmacodynamic modeling and …917780/fulltext01.pdf ·...
TRANSCRIPT

ACTAUNIVERSITATIS
UPSALIENSISUPPSALA
2016
Digital Comprehensive Summaries of Uppsala Dissertationsfrom the Faculty of Pharmacy 215
Pharmacokinetic-Pharmacodynamic modeling andprediction of antibiotic effects
DAVID D. KHAN
ISSN 1651-6192ISBN 978-91-554-9550-3urn:nbn:se:uu:diva-282604

Dissertation presented at Uppsala University to be publicly examined in A1:111a, BMC,Husargatan 3, Uppsala, Saturday, 28 May 2016 at 13:15 for the degree of Doctor ofPhilosophy (Faculty of Pharmacy). The examination will be conducted in English. Facultyexaminer: Professor Hartmut Derendorf (University of Florida, USA).
AbstractKhan, D. D. 2016. Pharmacokinetic-Pharmacodynamic modeling and prediction of antibioticeffects. Digital Comprehensive Summaries of Uppsala Dissertations from the Faculty ofPharmacy 215. 56 pp. Uppsala: Acta Universitatis Upsaliensis. ISBN 978-91-554-9550-3.
Problems of emerging antibiotic resistance are becoming a serious threat worldwide, and atthe same time, the interest to develop new antimicrobials has declined. There is consequentlya need for efficient methods to develop new treatments that minimize the risk of resistancedevelopment and that are effective on infections caused by resistant strains. Based on in silicomathematical models, describing the time course of exposure (Pharmacokinetics, PK) and effect(Pharmacodynamics, PD) of a drug, information can be collected and the outcome of variousexposures may be predicted. A general model structure, that characterizes the most importantfeatures of the system, has advantages as it can be used for different situations. The aim ofthis thesis was to develop Pharmacokinetic-Pharmacodynamic (PKPD) models describing thebacterial growth and killing after mono- and combination exposures to antibiotics and to explorethe predictive ability of PKPD-models across preclinical experimental systems. Models wereevaluated on data from other experimental settings, including prediction into animals. A PKPDmodel characterizing the growth and killing for a range of E. coli bacteria strains, with differentMICs, as well as emergence of resistance, was developed. The PKPD model was able to predictresults from different experimental conditions including high start inoculum experiments, arange of laboratory and clinical strains as well as experiments where wild-type and mutantbacteria are competing at different drug concentrations. A PKPD model, developed based on invitro data, was also illustrated to have the capability to replicate the data from an in vivo study.This thesis illustrates the potential of PKPD models to characterize in vitro data and their usagefor predictions of different types of experiments. The thesis supports the use of PKPD modelsto facilitate development of new drugs and to improve the use of existing antibiotics.
Keywords: Pharmacometrics, Pharmacokinetics, Pharmacodynamics, PKPD modeling,ciprofloxacin, colistin, E. coli, antibiotics, time-kill experiments
David D. Khan, Department of Pharmaceutical Biosciences, Box 591, Uppsala University,SE-75124 Uppsala, Sweden.
© David D. Khan 2016
ISSN 1651-6192ISBN 978-91-554-9550-3urn:nbn:se:uu:diva-282604 (http://urn.kb.se/resolve?urn=urn:nbn:se:uu:diva-282604)

To my family


List of Papers
This thesis is based on the following papers, which are referred to in the text by their Roman numerals.
I. Khan DD, Lagerbäck P , Sha C, Lustig U, Nielsen EI, Cars O,
Hughes D, Andersson DI, Friberg LE (2015) A mechanism-based pharmacokinetic/pharmacodynamic model allows prediction of antibiotic killing from MIC values for WT and mutants. J Antimicrob Chemother 2015; 70: 3051-60.
II. Nielsen EI, Khan DD, Sha C, Lustig U, Hughes D, Andersson DI, Friberg LE. Are PKPD models predictive across bacterial densities and strains – external evaluation of a PKPD model describing longitudinal in vitro data. (In manu-script)
III. Khan DD, Lagerbäck P, Malmberg C, Kristoffersson AN, Gull-berg E, Sha C, Cars O, Andersson DI, Hughes D, Nielsen EI, Friberg LE. Predicting mutant selection in competition experi-ments. (In manuscript)
IV. Khan DD, Kristoffersson AN, Lagerbäck P, Lustig U, Anner-stedt C, Cars O, Andersson DI, Hughes D, Nielsen EI, Friberg LE. A PKPD model characterizing the combined effects of col-istin and ciprofloxacin on MG1655 wild type and a clinical iso-late of E. coli. (In manuscript)
V. Khan DD, Friberg LE, Nielsen EI. A pharmacokinetic-pharmacodynamic (PKPD) model based on in vitro time-kill da-ta predicts the in vivo PK/PD index of colistin. J Antimicrob Chemother, 2016. (E-pub ahead of print)
Reprints were made with permission from the publishers.

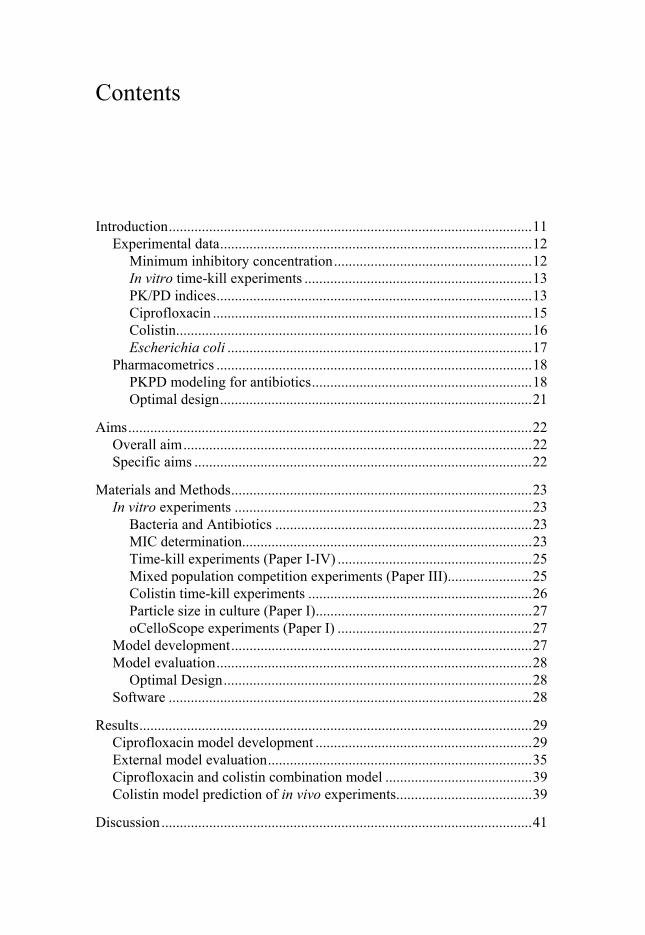
Contents
Introduction ................................................................................................... 11 Experimental data ..................................................................................... 12
Minimum inhibitory concentration ...................................................... 12 In vitro time-kill experiments .............................................................. 13 PK/PD indices ...................................................................................... 13 Ciprofloxacin ....................................................................................... 15 Colistin ................................................................................................. 16 Escherichia coli ................................................................................... 17
Pharmacometrics ...................................................................................... 18 PKPD modeling for antibiotics ............................................................ 18 Optimal design ..................................................................................... 21
Aims .............................................................................................................. 22 Overall aim ............................................................................................... 22 Specific aims ............................................................................................ 22
Materials and Methods .................................................................................. 23 In vitro experiments ................................................................................. 23
Bacteria and Antibiotics ...................................................................... 23 MIC determination............................................................................... 23 Time-kill experiments (Paper I-IV) ..................................................... 25 Mixed population competition experiments (Paper III)....................... 25 Colistin time-kill experiments ............................................................. 26 Particle size in culture (Paper I) ........................................................... 27 oCelloScope experiments (Paper I) ..................................................... 27
Model development .................................................................................. 27 Model evaluation ...................................................................................... 28
Optimal Design .................................................................................... 28 Software ................................................................................................... 28
Results ........................................................................................................... 29 Ciprofloxacin model development ........................................................... 29 External model evaluation ........................................................................ 35 Ciprofloxacin and colistin combination model ........................................ 39 Colistin model prediction of in vivo experiments ..................................... 39
Discussion ..................................................................................................... 41

Conclusions ................................................................................................... 45
Populärvetenskaplig sammanfattning ........................................................... 46
Acknowledgements ....................................................................................... 47
References ..................................................................................................... 50
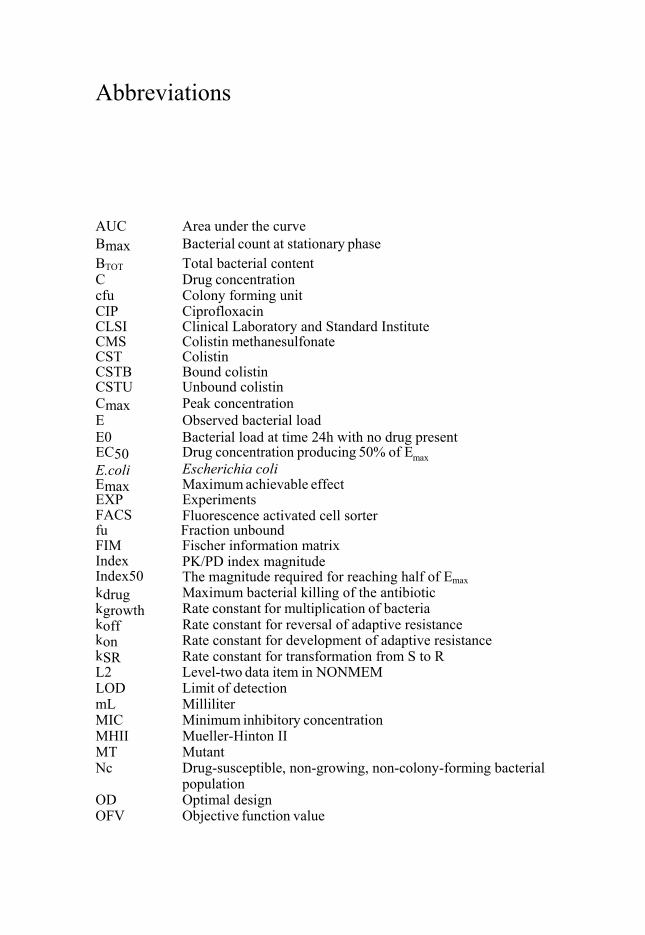
Abbreviations
AUC Area under the curve Bmax Bacterial count at stationary phase BTOT Total bacterial content C Drug concentration cfu Colony forming unit CIP Ciprofloxacin CLSI Clinical Laboratory and Standard Institute CMS Colistin methanesulfonate CST Colistin CSTB Bound colistin CSTU Unbound colistin Cmax Peak concentration E Observed bacterial load E0 Bacterial load at time 24h with no drug present EC50 Drug concentration producing 50% of Emax E.coli Escherichia coli Emax Maximum achievable effect EXP Experiments FACS Fluorescence activated cell sorter fu Fraction unbound FIM Fischer information matrix Index PK/PD index magnitude Index50 The magnitude required for reaching half of Emax kdrug Maximum bacterial killing of the antibiotic kgrowth Rate constant for multiplication of bacteria koff Rate constant for reversal of adaptive resistance kon Rate constant for development of adaptive resistance kSR Rate constant for transformation from S to R L2 Level-two data item in NONMEM LOD Limit of detection mL Milliliter MIC Minimum inhibitory concentration MHII Mueller-Hinton II MT Mutant Nc Drug-susceptible, non-growing, non-colony-forming bacterial
population OD Optimal design OFV Objective function value

PI Prediction interval PC Proportionality constant PD Pharmacodynamics PK Pharmacokinetics PKPD Pharmacokinetic-Pharmacodynamic PsN Pearl-speaks-NONMEM PTA Probability of target attainment R Resting, drug-susceptible bacterial population ROFF Compartment for resistance being off RON Compartment for resistance being on RSE Relative standard error S Growing, drug-susceptible bacterial population S. pyogenes Streptococcus pyogenes P. aeruginosa Pseudomonas aeruginosa tr50 Susceptibility parameter resulting in 50% of the maximum
rate VPC Visual predictive check WT Wild-type

11
Introduction
The discovery of antibiotics, first introduced in the late 1930s, is a key achievement in the history of modern medicine. Problems of emerging anti-biotic resistance are however becoming a serious threat worldwide [1-5]. The situation is intensified by the decline in research and development of new antibiotics. Since the 1970s, only two new classes of antibiotics have been introduced on the market [4] and clinical mortality has increased due to resistance development [6]. There is a need for new treatment regimens that minimize the risk of resistance development as well as a need for treatments that are effective on infections caused by resistant strains. Methods that can be used to forecast untested scenarios, including the impact of mutations and size of start inoculum on the rate and extent of killing, can be an efficient tool to identify effective dosing regimens. Since antibiotics are generally given in short-term therapy and resistance will eventually develop to all an-tibiotics, as well as scientific difficulties to discover new antibiotics that holds clinically, this drug class is of relatively low interest for the pharma-ceutical industry compared to many other drug classes treating chronic dis-eases [7]. A framework for drug developers on how to evaluate new antibiot-ics and to make it an easier and a more appealing disease area for drug de-velopment are definitely needed.
In addition to hospital hygiene and rationale use, i.e. only using antibiot-ics when needed, the choice of drug, dose, dosing interval and treatment length are also vital for minimizing the emergence of resistance as well as for treatment success. Information on the time profile of resistance develop-ment during treatment is of importance for the optimal use of available anti-biotics and preserving their efficaciousness for the future.
It has been shown that PKPD modeling can be a useful tool when select-ing dosing regimens for antibiotics [8]. Pharmacokinetics (PK) can be de-fined as “what the body does to the drug”, and pharmacodynamics (PD) as “what the drug does to the body”. Kinetics means “to do with motion” in ancient Greek and PK refers to how the drug moves and distributes in the body and how the drug leaves the body. PD describes the drug action, the drug effect, which in our case is clearing the system from bacteria. This ef-fect could both be the desired drug effect as well as undesired side effects. In silico Pharmacokinetic-Pharmacodynamic (PKPD) models can incorporate both PK and PD as well as mechanistic features including resistance mecha-nisms. A general PKPD model structure is typically most valuable since it

12
can be used for different situations and be expanded based on a limited amount of information.
In addition to developing new classes of antibiotics, there is a need to op-timize the use and preserve currently available antimicrobials. For example, antibiotic combination therapies have the potential to improve treatment success in the presence of resistant bacteria and to minimize the rate and extent of resistance development and could therefore be valuable in saving currently available antimicrobials to also be efficacious in the future [9]. The usefulness of combination therapy in clinic is mainly in severe life-threatening infections [10]. However choosing dose and dosing regimen for combinations is not trivial [11] and by using PKPD models, predictions for optimal dosing regimens can be made without evaluation of all potential combinations in laboratory experiments which has the potential to improve combination therapies in clinic.
Experimental data The effect of antibiotic treatments on infections in the human body is com-plex with disease burden, drug distribution, antibiotic effect, emergence of drug resistance and the influence of the immune system playing a role on the bacterial load. It is rarely possible to follow the bacterial burden over time clinically. Since antibiotic effects are aiming to act on the bacteria rather than on the human body, information on bacterial growth and antibiotic ef-fects can be studied in vitro. In this thesis, the immune system is not taken into account and thus the scenarios studied represent the worst case scenario, i.e. effect of immune system ignored.
Minimum inhibitory concentration Measuring the minimum inhibitory concentration (MIC) is the most com-monly used quantitative measurement of the in vitro activity of antibiotics. The MIC is defined as the lowest drug concentration that after an incubation period completely inhibits visible growth of bacteria. According to the CLSI guidelines [12] the start inoculum should be set to 5×10⁵ colony forming units per milliliter (cfu/mL), static (constant) drug concentrations are to be used and the incubation period should be 18-24 h. Measuring the MIC is a relatively simple and fast (24-48 h) method [13], compared to other PD ex-periments, and thus it can be used clinically to guide caretakers in the choice of drug and dosage. While MIC is used to guide choice of treatment, it does have drawbacks for understanding the impact of treatment on the bacteria. For example, the MIC only considers the bacterial density at a certain time point and does not take the whole time course of bacterial killing, growth and resistance development into account.

13
In vitro time-kill experiments Traditional time-kill experiments are commonly used when evaluating anti-biotic concentration-effect relationship over time. These experiments are typically performed for 24 h with a range of static drug concentrations. Test-ed concentrations include both above and below MIC concentrations and often a 2-fold scaling between concentrations is used.
The mechanisms resulting in emergence of resistance for antibiotic drug therapies are complex and characterizing the whole time course of the ob-served effect rather than just the MIC provides a better understanding of the antibiotic kill [11]. The in vitro experiments are easy to perform and allow for more flexibility in study design compared to in vivo studies which is an essential basis for PKPD modeling and for evaluating the drug effect [14]. In vitro it is straightforward to study combination therapy with more than one drug or to study mixed population of strains i.e. wild-type (WT) and mutant (MT) bacteria in the same tube. The easiest in vitro time-kill experiments use static drug concentrations with only one bacterial strain. There are also dif-ferent methods that allow for different half-lives of the antibacterial agent in vitro [15-17], which mimic the in vivo situation better.
PK/PD indices PD targets for efficacy are to be applied when guiding on dosing regimens for antibiotic drug treatment and they are typically based on PK/PD indices [18]. The three PK/PD indices most commonly used are the ratio of the max-imum unbound drug concentration to the MIC (fCmax/MIC), ratio of the area under the unbound drug concentration-time curve to the MIC (fAUC/MIC), and the percentage of a 24 h time period where the unbound drug concentration exceeds the MIC (fT>MIC) (Fig. 1). f indicates that the free, unbound concentrations are used, i.e. the concentrations are scaled with the unbound fraction (fu) which may be species dependent. It is the free drug that is available to exert its action.

Figure 1. Left: Time-dependent antibiotics. The time that the concentration of a drug remains above the MIC (T > MIC) is the PK/PD index which is correlating with efficacy. Right: Concentration-dependent antibiotics The peak concentra-tion/MIC (fCmax/MIC) ratio and/or the area under the concentration-time curve at 24 h/MIC (fAUC/MIC). f stands for free unbound drug.
The most predictive PK/PD index is searched for as well as the magnitude to achieve a 2 log-kill. Murine thigh or lung models are often used for single-dose PK studies and are typically performed with neutropenic mice. Differ-ent dose levels are studied. Non-compartmental analysis is conducted or a PK model is developed. To study PD, neutropenic mice are inoculated. Sev-eral single and multiple dose-regimens are studied. At 24 h, mice are killed and bacterial load is measured in thigh or lung. The previously established PK is used to calculate fCmax/MIC, fAUC/MIC and fT>MIC. The PK/PD index with the highest predictive capacity is assessed by fitting a sigmoidal Emax model to each of the different indices (x-axis) and the observed bacteri-al load at 24 h (E) (y-axis) (eq. 1). The R2 value is computed for each of the three PK/PD indices and the PK/PD index with the highest R2 value is con-sidered the main PK/PD index.
E= E0 -Emax * Indexγ / (Index50γ + Indexγ) eq. 1
E0 represents the bacterial load after 24 h with no drug present. Emax is the maximum drug effect (maximum drop in bacterial load from E0). Index is the PK/PD index magnitude and Index50 is the magnitude required for reaching half of Emax. γ is the Hill factor describing the sigmoidal shape. For the main PK/PD index, the magnitude of the index to reach a certain magni-tude of kill compared to the start inoculum, e.g. 2 log kill, is determined. This PK/PD index magnitude is used as target in probability of target at-tainment (PTA) studies. The dosing regimens that are predicted to result in at least 95% PTA (typically), based on expected PK profiles in the patient pop-ulation, are proposed for clinical use.
It has been suggested that PK/PD indices from in vivo mice studies can be extrapolated to clinical efficacy [19]. While the PK/PD indices are relatively
14

15
easy to apply, they do not consider the whole time frame of the bacterial load or the development of resistance and they cannot easily be applied for com-bination therapy. The PK/PD indices are determined based on efficacy eval-uation at a single time point, typically 24 h. By taking a “snapshot” at a cer-tain time point rather than considering the whole timespan of bacterial growth and kill, there is a risk of suboptimal dosing regimens [11]. The PK/PD indices include the MIC, which is considered a stationary value, however, if bacteria are exposed to concentrations of antimicrobial agents which are not high enough to eradicate the bacteria, resistance is likely to occur and the MIC value will increase [20, 21].
It has previously been shown that a mechanism-based PKPD model de-veloped from in vitro data can predict the type and target magnitude for ef-fect of PK/PD indices for several different antibiotics [22, 23], i.e. such models may be predictive of the in vivo response, at least at the 24 h time point where data can be compared.
Ciprofloxacin Ciprofloxacin is a fluoroquinolone effective against a broad spectrum of microorganisms including E. coli. Fluoroquinolones inhibit DNA gyrase and topoisomerase IV which leads to inhibition of cell division and a bactericidal effect [24, 25]. Ciprofloxacin is used to treat different infections including urinary tract infection, gonorrhea and gastrointestinal tract infections. After administration, ciprofloxacin is widely distributed throughout the body. Both fAUC/MIC and fCmax/MIC have been suggested as the main PK/PD index for ciprofloxacin [26, 27]. Around 30% is protein bound in serum and it is both hepatically and renally eliminated [28].
Ciprofloxacin was discovered already in 1981 and was approved by FDA in 1987. It is the most commonly prescribed fluoroquinolone for urinary tract infections because it is available in both oral and intravenous formula-tions. However resistance is emerging worldwide to fluoroquinolones (Fig. 2). It has been suggested that combination treatment with fluoroquinolones and another antibiotic could be beneficial in reducing resistance develop-ment [29, 30].

Figure 2. Resistance map for E. coli to fluoroquinolones [31] (reprinted under creative commons 3.0).
Colistin Polymyxins were discovered already in 1947 but their intravascular use was abandoned in the early 70s after reports of nephrotoxicity as well as availa-bility of other less toxic antibiotics. Polymyxins is a group of polypeptide antibiotics that consists of 5 chemically different compounds (polymyxins A-E)[32]. Colistin (Polymyxin E) mainly constitutes of colistin A and B. For intravenous use colistin is available as a prodrug, colistin methylene sodium (CMS). CMS is in vivo transformed to colistin by hydrolysis [33-35]. Since administration of CMS results in lower Cmax than a colistin infusion of the same duration, CMS is preferred when considering nephrotoxicity of col-istin [36]. To rapidly achieve therapeutic (steady-state) concentrations CMS is now administered with a loading dose to achieve rapid bacterial kill [8, 37, 38]. fAUC/MIC has been proposed as the main PK/PD index for colistin [39, 40]. Fraction of unbound colistin is around 8% in mice [41] and around 34% in man [8].
Colistin disrupts outer cell membrane which leads to leakage of intracel-lular contents and bacterial death. Resistance to colistin can develop through adaptive or mutational mechanisms, with almost complete cross-resistance existing between colistin and other polymyxins [42]. Because of the growing resistance to antimicrobials the use of colistin has increased and new reports indicate that the nephrotoxicity is not as high as originally thought. Colistin
16

17
given as monotherapy has an increased risk for emergence of resistance compared to combination therapy [43] and therefore combination treatment is preferred [44]. Antibiotics with different mechanisms of action may act synergistically. It has been shown that colistin in combination with car-bapenems can make carbapenem-resistant bacteria susceptible again, likely due to opening up the membrane and thus enabling carbapenem to enter the bacteria cell [45].
Escherichia coli Escherichia coli (E. coli) are Gram-negative bacteria and are part of the normal intestinal flora. E. coli can cause infections including urinary tract infection, gastroenteritis and pneumonia. Fluoroquinolones, an antibiotic class, are affective against many invasive E. coli strains, but resistance is increasing worldwide. Resistance to fluoroquinolones has been reported to increase in a majority of the European countries between 2001 and 2011 [46, 47] and a significant increase in resistance has also been reported in the USA and other parts of the world [48]. Common mutations leading to ciprofloxa-cin resistance include mutations in the gyrA1, gyrA2 (DNA gyrase), parC (topoisomerase IV) and marR (efflux regulating) genes. Some of these muta-tions have also been suggested to reduce bacterial fitness depending on sin-gle or combination of the mutations [49]. E. coli strains with mutations in gyrA1, gyrA2, marR and/or parC of E. coli MG1655 have previously been constructed with the relative fitness (i.e. compared to WT) and ciprofloxacin MIC reported [50]. All studied mutations were associated with higher MICs compared to WT.
E. coli exposed to fluoroquinolones can form filaments [24] and the fila-mented bacteria can be alive in the system, however not growing on agar plates, hence being non-plateable and not part of the observed cfu (Fig. 3) [51]. Filamented bacteria may recover and become growing vital cells again that are plateable. If the concentration is high enough the bacteria are killed [24].

Figure 3. Schematic overview of the mode of action of fluoroquinolones [24]. (Reprinted with permission from Infectious Diseases Society of Ameri-ca)
Pharmacometrics Pharmacometrics is the science which handles quantitative description of diseases, drug effects and variability and has been defined as “the science of developing and applying mathematical and statistical methods to character-ize, understand and predict a drugs pharmacokinetics, pharmacodynamics and biomarker outcomes behavior” [52]. The usefulness of pharmacomet-rics has been recognized by regulators [53] and all larger pharmaceutical companies use pharmacometrics.
PKPD modeling for antibiotics In silico PKPD modeling in the infectious disease area is becoming a more utilized tool and a wide range of models have been developed for different bacterial strains exposed to different antibiotics [8, 16, 22, 54-61]. Some models are more empirical in nature while others incorporate mechanistic features to mimic the studied system. The aim and use of the different mod-els vary: The goal for developing a model could be to provide a summary of the generated data, evaluate a mechanism-based theory such as bacterial fitness, improve study designs and/or use the model for predic-
18

tions/simulations of untested scenarios, including alternative dosing regi-mens.
A model structure commonly used to describe bacterial growth and kill is the logistic growth model [60]. Drug effect is often included as a sigmoidal Emax function and can affect either the growth or be independent from growth. This model structure may be sufficient to describe data, however often a more complex model structure is needed.
In addition to describe the time-course of susceptible bacteria, developed models have also, for example, included a second less susceptible subpopu-lation [2, 59] or included non-susceptible non-growing bacteria [62] (Fig. 4).
Figure 4. Mechanism-based PKPD model including susceptible (S) growing and resting (R) non-growing bacteria [62]. (Reprinted with permission from Antimicrobial Agents and Chemotherapy)
The transfer rate from the S state to the R state was in the Nielsen model described by a rate constant (𝑘𝑘𝑆𝑆𝑆𝑆) which is dependent on an estimated pro-portionality constant (PC) and the total amount of bacteria in the system, i.e. the more bacteria in the culture, the higher the rate of transfer from S to R. This model feature allows the model to reach a maximum bacterial load, so called stationary phase. The model structure has previously been shown to describe bacterial growth up to stationary phase well [56, 57, 62]. The drug effect was modelled as a rate constant described by an Emax model dependent on the drug concentration.
In antibiotic PKPD-models, the full time span of bacterial growth and susceptibility to antibiotics can be characterized. An established and validat-ed PKPD model structure that can be used for different type of experiments is desirable. Such a model can be very valuable for simulating out new stud-ies to collect new information based on limited data. By using a structure that incorporates features of the underlying system the model may extrapo-late well to other types of experiments. In addition, such models may be used to support decisions on dosing regimens [8, 56].
19

20
It has been shown that often parts of a model structure can be used for dif-ferent antibiotics and bacteria [45, 57, 62, 63]. Such a general model struc-ture that does not require much detailed data can especially be valuable in early drug development when information on bacterial growth and kill is limited [54]. It also has the potential to improve current dosing regimens. A model for ciprofloxacin which included up to three subpopulations has been described. Two bacterial subpopulations, with one representing suscep-tible growing bacteria and one representing less susceptible growing bacteria were required to describe the dynamics for all the regimens against one of the E. coli strains. However, for the remaining data and in the final model, only one bacterial state was described for susceptible growing bacteria [59].
For ciprofloxacin, a mathematical model incorporating MIC, creatinine clearance and weight has been developed. By targeting a specific AUC mag-nitude, it was shown to improve bacteriological and clinical response in seri-ously ill patients [27].
For colistin, several PKPD models have been developed. One example is a mechanism-based PKPD model for P. aeruginosa exposed to colistin that includes an adaptive resistance mechanism for the colistin effect on the bac-teria (Fig. 5) [57]. Effective combinations of colistin and carbapenems have been reported [44, 64]. However other combinations may also be effective and it is therefore suitable to study different combinations i.e. colistin and ciprofloxacin.
Another mechanism-based PKPD model for colistin and P. aeruginosa has been described. This model includes three different subpopulations of bacteria; susceptible, intermediate and resistant. Bacteria were assumed to release signal molecules that stimulated a phenotypic change which inhibits colistins effect [58].

Figure 5. Schematic illustration of the PKPD model for colistin and P. aeruginosa [57]. The model includes S and R compartments for the bacterial system as de-scribed previously [62]. Resistance development was included as a function with a rate constant for development (kon) of resistance (RON) from a non-resistant state (ROFF), which was dependent on colistin concentration, and a rate constant for return to susceptibility (koff).
Optimal design Experiments supporting development of PKPD models are time consuming and therefore it would be beneficial to make the designs more efficient, thus reducing the number of experiments and experimental sizes. Especially for combination experiments (i.e. more than one drug studied), the experiments are complex to design since it is not trivial what drug concentration combi-nations to study. By applying optimal design (OD) methodology the infor-mation in the performed experiments can be increased with constant or re-duced experimental cost. In vitro time-kill experiments are suitable for OD due to the ease of manipulating the design variables such as sampling times and antibiotic concentrations in order to achieve the requested information [65]. Generally in OD the aim is to maximize the precision in some model parameters by optimizing the experimental design variables 𝛸𝛸, e.g. time points and drug concentrations used in the experiment. This can be achieved by maximizing the Fisher information matrix (FIM) [66]. To perform OD, a developed model is needed. Different parameters can be weighted differently in the optimization.
21

22
Aims
Overall aim The aim of this thesis was to develop Pharmacokinetic-Pharmacodynamic (PKPD) models describing the bacterial growth and killing after mono- and combination exposures to antibiotics and to explore the predictive ability of PKPD-models across preclinical experimental systems. Models were devel-oped based on longitudinal in vitro data using ciprofloxacin and a combina-tion of ciprofloxacin and colistin with well-characterized WT and resistant E. coli bacteria.
Specific aims 1. Develop a mechanism-based model that characterizes PKPD of
ciprofloxacin on E. coli WT and the impact of common mutations on bacterial growth and killing.
2. Evaluate the PKPD model using data outside the traditional experi-mental setting such as high start inoculum, clinical E. coli strains, isogenic strains, static and dynamic time-kill mixed bacteria popula-tion experiments, and serial dilution mixed population experiments.
3. Expand the mechanism-based PKPD model to characterize com-bined exposure of the bacteria to ciprofloxacin and colistin.
4. Evaluate a PKPD-model for its predictive ability of murine thigh re-sponses and PK/PD index data.

23
Materials and Methods
In vitro experiments Bacteria and Antibiotics The laboratory E. coli strains studied (Paper I-IV) were isogenic, only differ-ing in the mutation(s) outlined in Table 1. The clinical strains used in paper III and paper IV had the same resistance mutations as the isogenic laboratory strains (Table 1) [49]. The antibiotics used in the experiments were ciprof-loxacin and colistin (both from Sigma Aldrich Schnelldorf, Germany).
MIC determination The MICs were determined by macrodilution in Mueller-Hinton II (MHII) broth in order to reflect the MIC in the time-kill experiments. The MICs for all strains were evaluated on different occasions, in different labs and for a minimum of 6 times and reported as modal MICs (Table 1). The start inocu-lum was 2 x10⁵ cfu/mL, and a 2-fold half dilution scheme was used and the results were read at 24 h.

24
Table 1. Genotype, ciprofloxacin susceptibility, and fitness for WT, isogenic and clinical bacterial strains in experiments (exp) used for model development (1), eval-uation of efficacy for high start inoculum (2A), evaluation of efficacy across bacteri-al strains (2B), for mixed population competition experiments (3) and for combina-tion experiments with both ciprofloxacin and colistin (4). ∆ = knockout mutation. aWT, bisogenic strain, cclinical strain. NA – not available
Strain Used
for exp gyrA1 gyrA2 parC marR acrR
MIC
(mg/L)
macrodilution
Relative
Fitness [50]
347a 1, 2A, 3,
4 - - - - - 0.023 1.00
202b 1, 2A, 3 - - - ∆ - 0.047 0.83
378 b 1, 2A, 3 S83L - - - - 0.38 1.01
534 b 1, 3 - D87N - - - 0.50 0.99
625 b 1 S83L D87N - - - 0.25 0.97
693 b 1 S83L D87N S80I - - 32 1.01
707 b 1 S83L D87N S80I ∆ - 48 0.89
351 b 2B - - - - ∆ 0.047 0.91
421 b 2B S83L - - ∆ - 1.0 0.86
862 b 2B S83L - S80I - - 1.5 0.98
Nu14c 2B - - - - - 0.023 NA
C128 c 2B S83L - - - - 0.25 NA
C47 c 2B - - - ∆ - 0.047 NA
C77 c 2B S83L - - - - 0.19 NA

25
Time-kill experiments (Paper I-IV) Time-kill experiments (Paper I-IV) were performed in at least duplicates in all studies to show reproducibility. At least one growth control (no drug) was included each time an experiment was performed. Inter-laboratory variation was minimized by strictly following a detailed standard protocol. All incuba-tions were made at 37°C (liquid cultures in a rocking water bath at 150 rpm) and dilutions were made into pre-warmed MHII broth. From single colonies, overnight cultures (15-17 h) were prepared in 2 mL MHII and then diluted 1:100 into 2 mL. A second dilution (1:100 into 2 mL) was made after 1.5 h when the culture had reached log phase (approximately 107-108 cfu/mL) to achieve a start inoculum of 106 cfu/mL. After an initial bacterial sample was extracted, antibiotic was added to obtain the desired concentration. Samples were removed at the decided time points after the addition of the antibiotic. 10-fold dilutions were prepared in sterile 0.9% NaCl and plated for each sampling time point.
The samples were spread by glass beads (5 beads, Hecht 1401/6) on MHII agar plates. Colonies were counted manually after approximately 20 h.
To obtain higher start inoculum than 106 cfu/mL for some experiments (paper II), bacteria from the overnight culture were diluted 1:100 in 20 ml pre-warmed MHII broth in a baffled Erlenmeyer flask and grown for 2 h resulting in approximately 3x10⁸ cfu/mL and then diluted to the desired start inoculum. To produce start inoculum in late stationary phase (approx. 109
cfu/ml), the inocula were prepared according to the standard procedure de-scribed above to reach 106 cfu/mL. The bacteria were thereafter allowed to grow in the culture vessel for 16 h before ciprofloxacin was added and the time-kill curve experiments were started.
Mixed population competition experiments (Paper III) In the three different types of competition experiments E. coli MG1655 WT were competing with one strain of single gene MT bacteria (LM202, LM378, LM534) (Table 1) [43]. For the static time-kill competition experi-ments, the same experimental protocol as described above was used but adapted to mixed population competition experiments. The WT and MT strains were mixed to the predefined ratio, and diluted 1:100 (to ~105 cfu/mL) into the final test tube. In total, three different ratios of MT:WT were tested per strain (1:10, 1:100 and 1:10000). Ciprofloxacin was added to the tubes to achieve the intended concentration. For all plating Difco™ McConkey Base agar plates (Becton, Dickinson and Company, New Jersey, USA), supplemented with 1% agarose, were used. To differentiate between the strains, the WT was labeled and thus has a different color on the McConkey agar plates.

26
The dynamic time-kill competition experiments were performed as de-scribed above, with the difference that instead of a test tube with static anti-biotic concentration, the Löwdin model, allowing for dynamically changing antibiotic concentration, was used [15]. Through a pump medium was added at a rate which diluted the ciprofloxacin concentration to match the desired half-life, and a 0.45 µm filter prevented bacterial cell washout. Sampling and multiple dosing were performed through ports with protective silicon septa.
The serial bacteria dilution experiments with low concentrations of ciprofloxacin have earlier been described in detail [45]. The same E. coli strains as in the time-kill experiments were used but were here tagged with variants of the green fluorescent protein, to be able to be measured by fluo-rescence activated cell sorter (FACS, BD FacsAria). Overnight cultures were grown in MHII medium with initial WT:MT ratio of 1:1. Six ciprofloxacin concentrations below MIC of both WT and MT were studied. 1000-fold serial dilution every 24 h (resulting in approximately 10 generations of growth per serial passage) was used. The ciprofloxacin concentration was maintained and only the bacteria density was diluted. The ratio of MT to WT cells in the population was determined every 24 h using FACS.
Colistin time-kill experiments The time-kill experiments were in general similarly conducted as for ciprof-loxacin. However, colistin has been reported to bind to lab material, and the reduction from intended concentration is important to consider in PKPD-analyses of colistin experiments [67]. To minimize the loss of colistin due to binding to lab material, colistin was diluted from a 10 000 µg/ml stock solu-tion and a fixed protocol for dilutions was followed to minimize the number of dilution steps. Samples for colistin concentration measurements were drawn at 0, 2, 4 and 24 h. A 100 µl sample was added to 100 µl serum and stored at -70°C until assayed. In the work-up procedure the thawed sample was mixed with acetonitrile containing 0.1% TFA, vortexed for about 5 sec-onds and centrifuged for 3 min at 10000 rpm. 100 µl of the supernatant was added to 150 µl 0.03 % TFA in water and loaded in the mass spectrometer [68].
The time-kill experiments with combination of ciprofloxacin and colistin (Paper IV) were performed as described above for the single experiments. Concentration-time profiles of unbound colistin were predicted and used as input to drive the bacterial killing in the PKPD model. The predicted bacteri-al count at 24 h was related to each of the PK/PD indices and the results were compared to reported observations in vivo.

27
Particle size in culture (Paper I) FACS was used to study the bacteria particle size over time. A green fluo-rescent protein gene labeled analog of LM347 that can be measured with FACS was used. This strain has previously been constructed and studied by Gullberg et al. [20]. Overnight cultures were grown in 2 mL MHII broth. The next day, 20 µL of the culture was transferred to 2 mL fresh pre-warmed MHII broth using the same procedure as in the time-kill experiments. Ciprofloxacin was added to each tube to final concentrations of 0, 0.5 and 1 x MIC. Samples were taken at 1, 2, 4, 6, 9 and 24 h after the antibiotic was added. The fluorescence was detected by FITC-filter, Blue 488 nm laser (502 nm Long pass filter, 530/30 nm band pass).
oCelloScope experiments (Paper I) Cell morphology at 0.5 x MIC was monitored over time using oCello-Scope™ (Unisensor A/S, Allerod, Denmark). Bacterial inocula were pre-pared similarly as described above before added into a microtiter plate (96-well microtiter plate with lid, Thermo Scientific Nunc cat. no 10378937), already containing 100 µl MHII with ciprofloxacin at different concentra-tions. Representative images of filamentation were chosen by zooming into the best-focus section.
Model development The general mechanism-based PKPD model previously developed for S. pyogenes by Nielsen et al. [62] was used as starting point for model devel-opment based on the generated in vitro data (Paper I). During development of the ciprofloxacin-E.coli model, different structural models were tested including the characterization of pre-existing subpopulations with different drug susceptibility, non-colony-forming bacteria and adaptive resistance [56, 57]. A parsimonious model with a common structure for all sevens strains was searched for. For Paper II, the developed model in Paper I was further developed to fit stationary phase start inoculum data. Model performance was assessed by evaluating diagnostic plots and the objective function value (OFV). The more complex model was chose when OFV reduction was at least 10.83 (P value <0.001 for 1 degree of freedom). Additive residual error models on log-transformed data were used where one common residual error for all replicates originating from the same time point and time-kill tube was estimated in addition to one replicate specific residual. The M3 method was used for time points where all plated samples were below the limit of detec-tion (LOD) [69, 70]. For the start inoculum, the variability was handled us-ing the B2 method [71]. Further, a model describing colistin binding to lab

28
material was developed and incorporated as well as a model describing the interaction between ciprofloxacin and colistin on the bacterial killing.
Model evaluation For Paper II and III, the developed model in Paper I was further evaluated. In Paper IV, the model from paper I and a previously developed model for colistin [57] were combined. The previously estimated model parameters were used and predictions without re-estimation were performed. The mod-els predictive performance was assessed by evaluating model predictions compared to the produced in vitro data. For Paper V, the previously developed model for colistin [57] was evaluated for prediction of in vivo data. Simulations were conducted using mice PK previously reported [39] to drive the effect in the colistin PKPD model. Dif-ferent dosing regimens were simulated and the three PK/PD indices were calculated and plotted. The main PK/PD index with the highest correlation to efficacy (highest R2 value) was assessed and magnitude of the index to achieve stasis, 1, 2 and 3 log kill was calculated. The results were compared with previously reported in vivo results.
Optimal Design OD was used to decide the experimental design for dynamic competition experiments (Paper III) with the aim of maximizing the precision of a subset of the model parameters from the earlier developed model [63]. The optimi-zation was performed on half-life, sampling times and start concentration of the experiments.
In Paper IV the design optimization was performed with the goal of max-imizing the precision of the estimated interaction of colistin and ciprofloxa-cin without having prior knowledge on the interaction. Two E. coli strains were chosen for the optimization; LM347 and C47, using the model parame-ters for the determined single drug models.
Software The modeling software used in all studies was NONMEM 7 [72]. When selecting between nested models, the difference in OFV was used. The more complex model was selected when the reduction in OFV was at least 10.83 corresponding to a P value lower than 0.001 for 1 degree of freedom. Model predictions and calculations to produce the Visual predictive checks (VPCs) were performed using PsN [73] and visualized using Xpose [74] and R (www.R-project.org). PopED was used for OD [75, 76].

Results
Ciprofloxacin model development The mechanism-based model by Nielsen et al.[62], could satisfactorily char-acterize the initial kill rate at high drug concentrations and the maximum bacterial load in the system. However the model could not describe the ini-tial kill and regrowth observed at concentrations around 0.5 x MIC, nor the slow regrowth at later time points mainly seen for WT bacteria. Therefore, the model structure was further developed to include compartments for drug susceptible growing bacteria (S), resting non-growing bacteria (R) and non-colony-forming drug susceptible bacteria (Nc) that are assumed to be non-growing under the influence of drug and unable to grow on agar plates (Fig. 6).
Figure 6. Schematic illustration of the PKPD model characterizing ciprofloxacin induced killing of E. coli. The total bacterial population is divided into two subpopu-lations, the original main population (1) and pre-existing resistant bacteria (2). C represents the drug concentration; S represent drug-susceptible, growing bacteria, R represent non-susceptible, non-growing bacteria, and Nc represent drug-susceptible, non-growing, non-colony-forming bacteria. The transfer from S to R was assumed to be bacterial density dependent according to a linear function with proportionality constant (PC) multiplied with the total bacterial content in the system (BTOT).
Bacteria were also divided into two subpopulations, subpopulation 1 (S1, R1 and Nc1) and subpopulation 2 (S2, R2 and Nc2) with fraction of bacteria in subpopulation 2 being estimated in the model at the start of the experiment. Subpopulation 2 is representing less susceptible pre-existing resistant bacte-
29

30
ria describing the regrowth seen in some experiments. The inclusion of com-partments of non-colony-forming bacteria satisfactorily described the initial kill and regrowth around 0.5 x MIC. The final model successfully fitted the data from all experiments as shown in the VPC (Fig. 7). The model per-formed better at lower and higher drug concentrations while the observed bacterial count at concentrations around 0.25-1 x MIC varied more within and between experiments and were consequently not as well predicted. The structure and assumptions that created the best model are as follows. At the start of each experiment all bacteria were assigned to be drug-susceptible (S1 or S2). The change in bacterial load for susceptible bacteria (eq. 2) was af-fected by rate constants describing bacterial replication ( , natural kill ( , drug effect ( and transfer from S to as well as transformation into ( and from the non-colony-forming state (Table 2).
eq. 2
The change in bacterial load for the non-susceptible non-growing bacteria (eq. 3) was affected by the transfer from S to as well as the natural kill rate ( .
eq. 3
The rate constant of bacterial transfer from the S state to the R state was dependent on an estimated proportionality constant (PC). Rates of change of the non-colony-forming bacteria were described by eq. 4.
eq. 4
The rate constant for transformation from susceptible to non-colony-
forming bacteria was described by a function that approaches a maximum rate (kSNc,max) at high ciprofloxacin concentrations (C) (eq. 5). The driver for the transformation was a ratio of the antibiotic concentration divided by the estimated EC50 for the drug effect for each bacteria type. tr50 is the suscepti-bility parameter (resulting in 50% of the maximum rate) and γNc
is the esti-mated Hill factor for this function. Since γNc was estimated by the model to a very high value with high uncertainty it was fixed to 20. A high value of γNc

31
predicts that kSNc is rapidly changing from a value of 0 to kSNc,max around tr50 (estimated at approximately 1/4 of EC50).
, /
/ eq.5
The transfer back to S from Nc was also dependent on the scaled ciprof-loxacin concentration (eq. 6) times an estimated scaling rate . C was set to a very low value for control experiments to avoid division by 0.
∗ eq.6
The time during which some of the bacteria in the system were transferred into the non-colony-forming state was estimated to 5.3 h after start of drug exposure. At this estimated time point, the transfer rate constant from the S to the Nc compartment (kSNc) was switched off and set to 0.
The rate constants determining the drug-induced bacterial killing (kDRUG) of S and Nc were described with Emax models (eq.7).
eq. 7
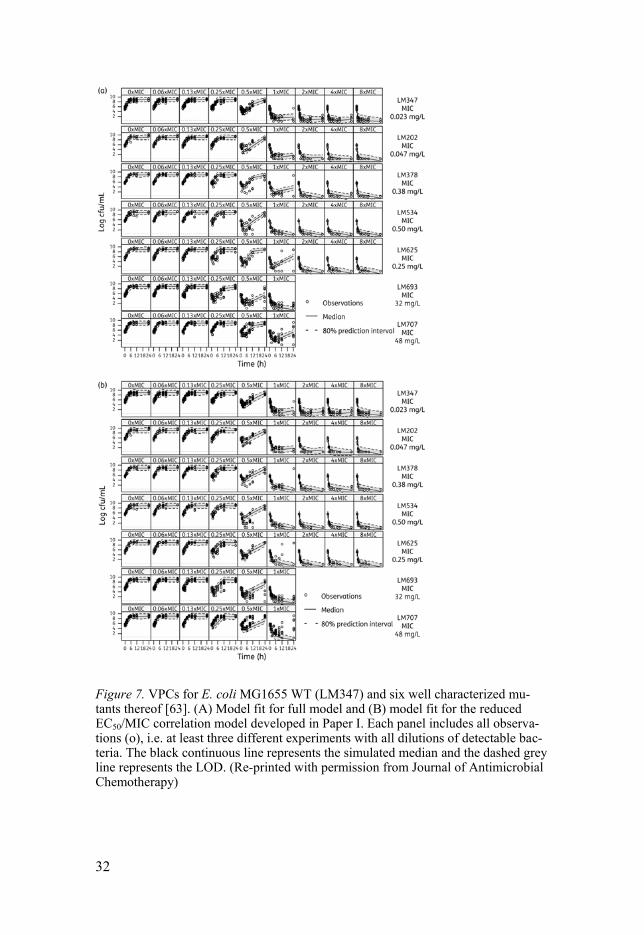
Figure 7. VPCs for E. coli MG1655 WT (LM347) and six well characterized mu-tants thereof [63]. (A) Model fit for full model and (B) model fit for the reduced EC50/MIC correlation model developed in Paper I. Each panel includes all observa-tions (o), i.e. at least three different experiments with all dilutions of detectable bac-teria. The black continuous line represents the simulated median and the dashed grey line represents the LOD. (Re-printed with permission from Journal of Antimicrobial Chemotherapy)
32

Table 2. Final model parameter estimates with relative standard error (RSE) for the full model and the EC50/MIC correlation model. aEC50 for the EC50/MIC correlation model was estimated by two parameters using MIC as covariate (1.22×MIC0.978) (RSE 4.5% and 0.2%, respectively). (Reprinted with permission from Antimicrobial Agents and Chemotherapy)
The estimated EC50 values for the different strains were highly correlated
to the experimentally measured MICs with R2=0.99 for the final model with shared Emax and kgrowth parameters (Fig. 8). A reduced, alternative model where the EC50 values for all strains were forced to be related to their exper-imentally determined MIC was therefore evaluated and resulted in eq. 8.
𝑬𝑬𝑪𝑪𝟓𝟓𝟓𝟓 = 𝟏𝟏.𝟐𝟐𝟐𝟐 × 𝑴𝑴𝑴𝑴𝑪𝑪𝟓𝟓.𝟗𝟗𝟗𝟗𝟗𝟗 eq. 8.
33

34
Figure 8. EC50 as estimated by the full model vs experimentally determined MICs by macrodiltion [63]. (re-printed with permisison from Journal of Antimicrobial Chemotherapy)
A PKPD model for the effect of colistin alone on E. coli was established, using a previously developed model structure for colistin (Fig. 5) [57]. An experimental design considering different interaction scenarios for the com-bined effect of colistin and ciprofloxacin was obtained using OD. The actual concentration in the medium was described by the developed binding model. The PKPD model structure for the combined effects (Fig. 9) was developed based on the colistin binding model-, the colistin PKPD model- and the ciprofloxacin model- structure and the model was fitted to the generated experimental data with both colistin and ciprofloxacin.

Figure 9. PKPD model developed to describe combination of ciprofloxacin (CIP) and colistin (CST) in in vitro time-kill experiments on E. coli. In the model the bac-teria (in green) are assumed to exist in three states: 1. Growing and drug susceptible (S), 2. Non-growing and non-susceptible resting (R), and 3. Transiently non-colony forming (Nc). The bacteria enter the R state as response to high population densities and the Nc state as response to exposure to CIP (yellow). Resistance to CIP is ex-plained by the presence of a second subpopulation with decreased CIP sensitivity. Resistance to CST (red) is explained as an adaptation (grey), inhibiting the CST drug effect. Decrease in CST over the course of the experiment was described by binding to lab material (CSTB) and only the unbound part (CSTU) was available to act on the bacteria.
External model evaluationFor evaluation of the EC50/MIC correlation model E. coli strains not used for model development were predicted, keeping all parameters fixed to those estimated in Paper I. The experimentally observed MIC was used to predict the EC50 according to eq. 8. Parameters were set to the same as previously estimated with no re-estimation. The model was able to well predict the ex-periments including experiments for clinical strains (Fig. 10).
35

36
Figure 10. Model predicted (top) and observed (bottom) bacterial time-kill curves for three laboratory and four clinical E. coli strains. Observations below the dotted line are below the LOD.
The E. coli strains studied in the high inoculum experiments have previously been studied when developing the model. Therefore, when evaluating the predictive performance for higher bacterial densities the full model (separate estimates for the EC50 for each strain) was used in the predictions (Fig. 11). A decrease in the rate and extent of bacterial killing was observed when the start inoculum was increased for all three strains investigated. When using the standard inoculum of 106 an exposure to 2xMIC of ciprofloxacin resulted in a rapid bacterial killing with bacterial counts below LOD from 10 h and onwards in the majority of the experiments, thus representing a reduction in cfu/mL of ≥ 5 log10. In contrast, when the start inoculum was increased 100-fold the same drug exposure resulted in a reduction in bacterial count of ≤ 2 log10.

37
Figure 11. Model predicted (top) and observed (bottom) bacterial time kill curves for three strains of E. coli (A WT, B LM202, C LM378) at 5 different bacterial start inocula. Predictions based on intended start inoculum and observed count plotted as mean of the observations within one sampling time point and experiment. Observa-tions below the dotted line are below the LOD.
For the static competition experiments, the model predicted the observed experimental data for all 3 combinations of strains well using the previously reported parameters [63], i.e. without re-estimation (see Fig. 12 for exam-

38
ple). Below the MICs of both competing strains, the two strains grew expo-nentially until the bacteria reached the stationary phase. At concentrations above WT MIC but below MT MIC, WT bacteria were killed and MT bacte-ria took over the population. At concentration above both WT and MT MIC both strains were killed. This was well predicted by the model. For the high-est studied concentrations, initial kill and regrowth of the MT, between 6 and 24 h, was observed in some experiments for all 3 strain combinations. The predictions did not describe this regrowth; the regrowth observed here was more pronounced than what was observed in the data used for model devel-opment with single strain experiments, where slow regrowth was observed in some experiments, mainly for WT [63].
Figure 12. Predictions and observations for static competition experiments between WT and MT with gyrA2 D87N (LM534). Solid lines are predictions and circles with connecting dashed lines are observed data for WT (green) and MT (red). At least duplicate experiments were conducted for each concentration. Observations below the dotted line are below the LOD.
For the dynamic time-kill experiments, the bacterial killing and growth gen-erally corresponded well to the model predictions (Fig. 13) without a need for re-estimating the previously reported parameters [63]. Initial declines in bacterial load when drug concentration decreased were observed in all ex-periments. When the half-life of ciprofloxacin was 4 h (typical patient PK) the WT was killed off effectively while the MT strain took over for all start ratios of WT:MT. For a shorter half-life of 0.5 h, both WT and MT bacteria had an initial decline for the first 2-3 h and then regrowth was observed for both strains. This was generally well predicted by the model. Dosing once or twice daily resulted in similar time-kill curves. When dosing once daily, the initial kill was higher but longitudinal curves had similar shape as twice dai-ly dosing. For some experiments, regrowth was under predicted by the mod-el compared to the data.
0 0.01 0.1 0.75 mg/ml
13579
13579
13579
10:1100:1
10000:1
0 5 10 15 20 25 0 5 10 15 20 25 0 5 10 15 20 25 0 5 10 15 20 25Time (h)
Ba
cte
ria
l co
un
t (l
og
10
cfu
/ml)
STR:
WT
gyrA2 D87N

39
Figure 13. Experiments with competition between WT (green) and MT with gyrA1 S83L (LM378) (red) at dynamic concentrations of ciprofloxacin. Solid lines are predictions and circles are observed data. Observations below the dotted line are below the LOD.
Ciprofloxacin and colistin combination model The model was able to fit the data for combination experiments satisfactory as shown in the VPC (Fig. 14). For the laboratory strain the interaction be-tween ciprofloxacin and colistin was estimated to additive but for the clinical strain the interaction was estimated to be antagonistic.
Figure 14. VPC for experiments with E. coli exposed to both colistin and ciproflox-acin. The circles represents observed data, the grey area is the models 80% predic-tion intervals and the solid lines represent the medians of the simulated experiments for each concentration. The dashed lines represent LOD.
Colistin model prediction of in vivo experiments The PKPD model for P. aeruginosa exposed to colistin was also applied to perform an in silico replication of an in vivo study where the effect of col-istin on P. aeruginosa was studied in a thigh infection model with neutro-penic mice. The model was found to satisfactorily predict in vivo results from mice; both in terms of which PK/PD index that best correlates to effect (fAUC/MIC) (Fig. 15), as well as the magnitude needed for a 2-log kill. The

fAUC/MIC needed to achieve a 2-log reduction in bacterial counts after 24 h was here predicted to be 9 compared to 31 previously reported in vivo. The maximum killing was predicted to be approximately 1.5 log10 higher by the PKPD model based on in vitro data than what had been observed in vivo. Similarly, we have predicted fAUC/MIC to be the main PK/PD index for ciprofloxacin on E. coli.
Figure 15. In vivo log10 cfu/thigh vs the 3 different PK/PD indices for colistin in the mice thigh model presented by Dudhani et al. [39] (top)* and predictions of log10 cfu/mL vs the 3 different PK/PD indices (bottom) based on the PKPD model for colistin by Mohamed et al., [57] and PK parameters from Dudhani et al. [39]. The dotted horizontal line represents the bacterial start inocula and the solid line repre-sents non-linear least square regression line. In the top panel each dosing regimen is represented with two symbols (one per mice) while in the bottom panel each dosing regimen is represented with only one symbol (no variability is included in the simu-lations) [77]. (Reprinted with permissions from Antimicrobial Agents and Chemo-therapy (top) and Journal of Antimicrobial Chemotherapy (bottom)).
40

41
Discussion
In this thesis, a mechanism-based PKPD model (Paper I) for ciprofloxacin and E. coli was developed. The model successfully characterized the time-kill curves for both WT and six E. coli mutants as illustrated in the VPCs (Fig.7). The model structure includes susceptible growing bacteria, resting non-growing bacteria and non-colony-forming non-growing bacteria, divid-ed into two subpopulations with subpopulation 2 representing pre-existing resistant bacteria (Fig.7). These elements were needed to describe the data, but to describe the mechanism in more detail would be the scope of addi-tional studies aiming to elucidate these relationships.
In the time-kill data an initial decline in bacterial load followed by a re-bound between 2 and 6 h was observed, primarily for concentrations around 0.5 x MIC. This was in the model described by inclusion of the non-colony-forming compartment which significantly improved the description of the data. It has been reported that bacteria being filamented can either die or recover and become growing plateable cells [24]. The mechanistic hypothe-sis is that bacteria get affected by drug and form filaments but do not die. These filamented bacteria are not fully able to proliferate but if the drug concentration is not sufficiently high to kill the filamented bacteria, they may recover and revert back to susceptible growing bacteria. Although the results from the FACS and oCelloScope support this hypothesis, it should be acknowledged that the time-kill experiments were not designed to fully characterize the filamentation. However, the inclusion of the non-colony-forming compartment significantly improved the description of the PKPD-relationship for ciprofloxacin.
In some, but not all, of the experiments with bacteria with low MICs, re-growth was observed. Because of limited information in the data about these pre-existing resistant bacteria (the experiments were not designed to charac-terize these bacteria), all strains were in the final model assumed to share all the parameter estimates specific to this bacterial population, including the fraction of this population in the start inocula, kgrowth2, and EC50,2. In addition, there was no significant difference in Emax for the two subpopulations.
The estimated model parameters for EC50 correlated well with the experi-mentally determined MICs by macrodilution (R2=0.99) (Fig. 8). The reduced EC50/MIC correlation model uses MIC as a covariate for EC50 and therefore it was possible to predict the in vitro time-kill profile for different E. coli strains by measuring only the MIC experimentally and then apply the here

42
developed model structure and model parameters for the reduced EC50/MIC correlation model (Paper II). The PKPD model was able to predict the drug efficacy for additional laboratory and clinical strains not used during model development, with the potency (EC50) derived from the measured MIC. The ability to predict new experimental conditions based on only a limited amount of new information (i.e. MIC values), highlights the potential of combining structured, longitudinal pre-clinical experiments with mecha-nism-based mathematical modeling to learn about the drug-bacteria interac-tion. This knowledge may then be used to bridge between pre-clinical and clinical conditions to make informed decisions for optimal antimicrobial therapy.
It was also shown that the mechanism-based PKPD model structure de-veloped on data from traditional start inoculum experiments (106 cfu/mL) could adequately describe the inoculum effect despite that no model parame-ters were re-estimated (Paper II). Even though the model was developed based on the traditional start inoculum data only, the knowledge that normal growing drug-susceptible cells might transform into resting, non-growing and non-susceptible cells at late exponential growth phase (19, 27) was in-corporated into the model structure during development. One approach to account for the inoculum effect has been to introduce a function where the effective antibiotic concentration decreases with increasing start inoculum (4, 24). A drawback of this approach is that the efficacy is assumed to be static and determined only based on the bacterial density at the start of the experiment. It therefore lacks the ability to accurately describe the effects when the bacterial density varies over time, limiting the possibility to use such models for dose optimization.
The PKPD model for ciprofloxacin could also satisfactorily predict three different static mixed bacteria population experiments where a WT and a MT strain were competing (Paper III). The results for the dynamic concen-tration experiments were also well predicted by the model which indicates that developing a mechanism-based PKPD model on only static time-kill curve data can be sufficient, however the model over predicted regrowth after initial kill for both WT and MT bacteria in some dynamic experiments. Good model-predicted translation from static to dynamic settings has previ-ously been shown by Nielsen et al. for the original PKPD-model and the bacteria (S. pyogenes) and six antibiotics that the model was developed from (21).
In Paper IV, a mechanism-based PKPD model for the combination of ciprofloxacin and colistin on two strains of E. coli, a laboratory WT strain and a clinical isolate with increased MIC, was developed based on the previ-ously developed PKPD model for ciprofloxacin (Paper I) and a previously developed model for colistin. The developed model successfully character-ized the time-kill curves for all time-kill data and could describe the ob-served regrowth for both ciprofloxacin and colistin seen in some of the ex-

43
periments. Colistin is a “sticky” compound and has been reported to bind to lab material [45]. In order to characterize the time dependence of the colistin concentration in the in vitro system, the actual concentration in the medium was determined over time and a colistin binding model was developed and included in the PKPD model. By describing the kinetics of the binding, the change in colistin concentration over time was accounted for.
Assuming an additive effect of the killing effect by the two drugs resulted in reasonable predictions. An improved effect was observed for both strains compared to the same single drug exposure with either colistin or ciproflox-acin. The antibiotic combination was able to reduce the regrowth and may thus be a useful combination to prevent emergence of resistance.
A simulation study (Paper V) was performed comparing model prediction from the previously developed PKPD model for colistin to data from an in vivo PKPD study in a murine thigh model. fAUC/MIC was identified by the model to be the main PK/PD index for colistin, which is in agreement with the earlier in vivo results for similar MIC values (Fig. 2)[39].The ranking of all three PK/PD indices was also in agreement, and the index needed for 2 log10 kill was in similar range. These results support the use of PKPD models based on in vitro time-kill studies in drug development and rather than per-forming massive animal studies, limited amount of confirmatory animal studies could be sufficient, thus reducing the number of animals needed.
The concept of relating PKPD model parameters to the MIC has been dis-cussed before on a theoretical level [78-80]. Yano et al. have previously described an EC50/MIC correlation for meropenem, imipenem, cefpirome, and ceftazidime on E. coli, P. aeruginosa, and S. aureus [60] and Katsube et al. applied that correlation to estimate the EC50 using the MIC as a covariate for P. aeruginosa treated with meropenem and doripenem [81]. In this the-sis, it was shown that the developed PKPD model for ciprofloxacin could well predict new longitudinal experiments for different E. coli MG1655 strain and clinical E. coli strains by only inserting the MIC as a covariate when performing simulations/predictions. This supports the usefulness of PKPD models for predictions of new experiments for different strains in-cluding clinical strains.
The growing problem of antibiotic resistance due to extensive use of anti-biotics and the simultaneous decline in research and development of new antibiotics is a threat to global health. Without effective treatment and prophylaxis of bacterial infections, we risk losing major achievements of modern medicine such as major surgery. With resistance to antimicrobial agents increasing, PKPD models that can predict dosages that limit the selec-tion of less susceptible mutants are much valuable. PKPD modeling for anti-biotics is still an underused tool and the search for dosing regimens can ben-efit from modeling and simulation approach [82]. This thesis supports the use of PKPD models to facilitate drug development by illustrating the pre-dictive capacity such models can have across strains and experimental condi-

44
tions. This type of models may also be used to identify dose regimens that reduce the emergence of resistance. This also includes combination therapy with more than one antibacterial agent, that has the potential to preserve the usefulness of currently available antibiotics that otherwise will be rendered not useful due to resistance development.
In this thesis, it was shown that a range of scenarios can be explored with minimal need for performing actual experiments. This proposes that PKPD models can be an efficient tool in the search for optimal dosing regimens that could reduce resistance development, and to predict what regimens to study clinically. Compounds that are already available to patients were applied to show-case the value of PKPD-models in this work. However the studies also support the use of PKPD models in the development of new antibiotics as a tool that can reduce the number of laboratory and clinical studies that are required to understand the bactericidal effect and at an early stage to select the best drug candidates.

45
Conclusions
In this thesis, PKPD models for antibiotics were developed and their predic-tive ability was evaluated for strains with different susceptibility to ciprof-loxacin. The developed model for ciprofloxacin included drug susceptible growing bacteria, resting non-growing bacteria and non-colony-forming drug susceptible bacteria that are assumed to be non-growing under the in-fluence of drug and unable to grow on agar plates. The PKPD model based on traditional in vitro time-kill curve data satisfactorily predicted new exper-iments with different conditions. Combined killing effects of two antibacte-rial agents was characterized and simulations from a model based on in vitro data were shown to be predictive of in vivo results. The strategies demon-strated in this thesis, for developing and evaluating PKPD models for antibi-otics, could be useful to improve development of new antibiotics and to sug-gest improved dosing regimens of currently available antibiotics. Specifically
1. A mechanism-based PKPD-model for ciprofloxacin and E. coli WT and MT was developed. The impact of common mutations on growth and killing was studied and it was found that a common model struc-ture with all parameters shared, except for EC50, was sufficient to de-scribe the data.
2. The developed PKPD model was found to well predict new data out-side the traditional setting, including high start inoculum, clinical E. coli strains, isogenic strains, static and dynamic time-kill mixed bac-teria population experiments, and serial passage mixed population ex-periments.
3. When combining the developed PKPD model for ciprofloxacin with a PKPD model for colistin, and adding an interaction function, the model structure was found to satisfactorily describe combination ex-periments with ciprofloxacin and colistin.
4. The PKPD model for colistin based on in vitro data was able to pre-dict similar PK/PD index results as in a thigh infection model in neu-tropenic mice, illustrating that PKPD models can be predictive of in vivo data.

46
Populärvetenskaplig sammanfattning
Antibiotikaresistens är ett ökande problem runt om i världen som främst beror på överanvändning av antibiotika. Samtidigt ser vi minskade satsning-ar från läkemedelsföretagen för att ta fram nya antibiotika. Det finns ett stort behov av att utveckla metoder som både underlättar utvecklingen av nya antibiotika och ger stöd för nya doseringsstrategier för befintliga antibiotika, inklusive kombinationsterapi. I avhandlingen beskrivs hur matematiska mo-deller kan utvecklas för att beskriva bakteriers tillväxt och avdödning i prov-rör och hur dessa modeller vidare kan prediktera ciprofloxacins effekt för en rad experiment som inte användes i utvecklandet av modellen: 1) ytterligare bakteriestammar med olika ursprung 2) försök med högre bakteriedensiteter och 3) kompetitionsförsök med bakterier med olika känslighet för ci-profloxacin, dvs tävling mellan bakterier i närvaro av antibiotika. Även ma-tematiska modellers förmåga att förutse antibiotikarespons i en djurmodell illustreras, samt hur interaktionen mellan två antibiotika kan kvantifieras i en modell. Avhandlingen stödjer därmed användandet av PKPD‐modeller vid utvecklingen av nya antibiotika och antibiotikakombinationer då en funge-rande modell minimerar de laborativa och kliniska studier som krävs för att förstå den bakterieavdödande effekten och för att på ett tidigt stadium kunna selektera de bästa läkemedelskandidaterna och de bästa antibiotikakombinat-ionerna.

47
Acknowledgements
This thesis was carried out at the Department of Pharmaceutical Biosciences, Faculty of Pharmacy, Uppsala University. So many people have supported me during my PhD studies. I am very thank-ful to all of you. Especially I would like to thank: Lena Friberg, my main supervisor. I am very lucky that you took me on as one of your PhD students. I learnt so much from you and I really enjoyed working together with you. You have helped me to grow both as a scientist and as a person.
Pernilla Lagerbäck (co-supervisor). Thank you for being a great person and mentor and for always taking time for me when I needed to discuss work with you. I am sure you have been late home so many Thursday evenings because of our unofficial meetings after playing floorball. I really enjoyed working with you.
Otto Cars (co-supervisor), thank you for sharing your knowledge. You al-ways see the big picture and this has been very useful.
Mats Karlsson (co-supervisor), your leadership makes the Pharmacometrics group such a great group to work in.
Elisabet Nielsen. Bettan, you were not my supervisor on paper but you were my cornerstone to discuss the details of the modeling and I really enjoyed working with you! Thanks for being so easy to talk to and for all the great discussions. Anders Kristoffersson, for the contributions to the work and all the fun (and funny) times at conferences. Dan Andersson and Diarmaid Hughes, thank you for contributing to the work and for the excellent collaboration. Dan, I really appreciate you invit-ing me to play floorball with your research group.

48
Cao Sha, Christer, Ulrika, Lotta, Erik G and Britt for great contributions to the work.
Salim, my officemate for the past 2 years. We have been going through simi-lar things in life (i.e. both becoming fathers while writing up the thesis). Your support and friendship has been invaluable. We’ll never walk alone.
Winn, Anders T, Ami and Matti for contributing to a great work environ-ment in the antibiotic sub group.
To Linus Sandegren, Klas Udekwu and Charlotta Edlund (my half time committee), for the valuable feedback and guidance which has been very useful during the rest of my studies.
To Jörgen Bengtsson, your passion for teaching is remarkable. I very much enjoyed teaching, including working with you to develop the new computer task for the students.
Margareta Hammarlund-Udenaes, for contributing to a great working envi-ronment at the department both when it comes to research as well as teach-ing.
To Sven Björkman, for contributing to an excellent working environment and for always taking time to discuss work or other things. You left us too soon and I miss you a lot.
Takayuki Katsube, my previous officemate and a great friend. It was moti-vating and helpful to share office and discuss my project with you. To all the past and present lunch club members, especially Anne-Gaëlle, Emilie and Irena. I always enjoyed our discussions and you are great friends! Waqas, the former leader of the lunch club (sorry AG), you are a great friend and such a nice person. Benjamin G, for technical assistance with R and for being a dear friend.
Karin, Marina and Ulrica B, it is easy to focus on science when other things are taken care of in such a great way. Kajsa and Rikard, for developing PsN and making sure everything run smoothly.

49
Andy, Mia, Siv, Kristin and Ulrika S for contributing to a great working environment. My former master student Giulia Corn for contributing to the work. Åsa and Martin, for teaching me a lot and inspiring me to start a PhD pro-gram. I still remember the flying monkey though, it almost killed me. The Movie Club, Camille, Magnus and Ida for all the fun times!
My previous office mate and previous neighbor Eric S for all interesting conversations. Looking forward to us being neighbors again in Kåbo. All the past and current colleagues at the department, you make it such an excellent working environment.
Apotekarsocieteten and Anna-Maria Lundins Stipendiefond, Smålands Na-tion for travel grants & Swedish foundation for strategic research and DDMoRe for funding. Ett speciellt tack till alla vänner och familj, särskilt till: Mina kompisar i spelföreningen, Joel, Jonas och Virre. Tack för att ni alltid var förstående och anpassningsbara så vi kunde ses och spela spel även när jag hade som mest att göra.
Familjen Bergman, Frida, Svante, Kasper och Juni. Ni är underbara! Inga-Lisa och Gunnar, tack för all er kärlek och all er hjälp. Mina extrasyskon Janne, Maria, Jonas, Hanna och Roxana. Det är underbart med en stor familj.
Mina bröder Jacob och Benjamin. För allt kul vi gör tillsammans, trots att ni inte bor i Sverige just nu så ses vi ofta. Ni är fantastiska. Mamma och Pappa, för all er hjälp och all er kärlek. Jag är den jag är tack vare er.
Min fru Elin, du är den snällaste personen i världen. Tack för att du finns och för all din kärlek och ditt stöd. Jag älskar dig otroligt mycket. Min dotter Emma, du är den finaste som finns för mig. Jag älskar dig.

50
References
1. Levy, S.B. and B. Marshall, Antibacterial resistance worldwide: causes, challenges and responses. Nat Med, 2004. 10(12 Suppl): p. S122-9.
2. Alanis, A.J., Resistance to antibiotics: Are we in the post-antibiotic era? Archives of Medical Research, 2005. 36(6): p. 697-705.
3. Infectious Diseases Society of, A., et al., Combating antimicrobial resistance: policy recommendations to save lives. Clin Infect Dis, 2011. 52 Suppl 5: p. S397-428.
4. Boucher, H.W., et al., Bad bugs, no drugs: no ESKAPE! An update from the Infectious Diseases Society of America. Clin Infect Dis, 2009. 48(1): p. 1-12.
5. Opal, S.M. and T. Calandra, Antibiotic usage and resistance: gaining or losing ground on infections in critically ill patients? JAMA, 2009. 302(21): p. 2367-8.
6. de Kraker, M.E., et al., Mortality and hospital stay associated with resistant Staphylococcus aureus and Escherichia coli bacteremia: estimating the burden of antibiotic resistance in Europe. PLoS Med, 2011. 8(10): p. e1001104.
7. Cohen, M.L., Changing patterns of infectious disease. Nature, 2000. 406(6797): p. 762-7.
8. Mohamed, A.F., et al., Application of a loading dose of colistin methanesulfonate in critically ill patients: population pharmacokinetics, protein binding, and prediction of bacterial kill. Antimicrob Agents Chemother, 2012. 56(8): p. 4241-9.
9. Mouton, J.W., Combination therapy as a tool to prevent emergence of bacterial resistance. Infection, 1999. 27 Suppl 2: p. S24-8.
10. Kumar, A., et al., A survival benefit of combination antibiotic therapy for serious infections associated with sepsis and septic shock is contingent only on the risk of death: a meta-analytic/meta-regression study. Crit Care Med, 2010. 38(8): p. 1651-64.
11. Sy, S.K. and H. Derendorf, Pharmacometrics in Bacterial Infections. 1st ed. Applied pharmacometrics ed. S. Schmidt and H. Derendorf. 2014, New York (NY): Springer.
12. Methods for Dilution Antimicrobial Susceptibility Tests for Bacteria That Grow Aerobically; Approved Standard—Ninth Edition, 2012: Clinical and Laboratory Standards Institute. . p. M07-A9.
13. Jorgensen, J.H. and M.J. Ferraro, Antimicrobial susceptibility testing: a review of general principles and contemporary practices. Clin Infect Dis, 2009. 49(11): p. 1749-55.

51
14. Liu, P., et al., Pharmacokinetic-pharmacodynamic modelling of antibacterial activity of cefpodoxime and cefixime in in vitro kinetic models. Int J Antimicrob Agents, 2005. 25(2): p. 120-9.
15. Lowdin, E., et al., Pharmacodynamic effects of sub-MICs of benzylpenicillin against Streptococcus pyogenes in a newly developed in vitro kinetic model. Antimicrob Agents Chemother, 1996. 40(11): p. 2478-82.
16. Levin, B.R. and K.I. Udekwu, Population dynamics of antibiotic treatment: a mathematical model and hypotheses for time-kill and continuous-culture experiments. Antimicrob Agents Chemother, 2010. 54(8): p. 3414-26.
17. Zinner, S.H., et al., Selection of linezolid-resistant Enterococcus faecium in an in vitro dynamic model: protective effect of doxycycline. The Journal of antimicrobial chemotherapy, 2008. 61(3): p. 629-35.
18. Craig, W.A., Pharmacokinetic/pharmacodynamic parameters: rationale for antibacterial dosing of mice and men. Clin Infect Dis, 1998. 26(1): p. 1-10; quiz 11-2.
19. Ambrose, P.G., et al., Pharmacokinetics-pharmacodynamics of antimicrobial therapy: it's not just for mice anymore. Clin Infect Dis, 2007. 44(1): p. 79-86.
20. Gullberg, E., et al., Selection of resistant bacteria at very low antibiotic concentrations. PLoS pathogens, 2011. 7(7): p. e1002158.
21. Tam, V.H., et al., The relationship between quinolone exposures and resistance amplification is characterized by an inverted U: a new paradigm for optimizing pharmacodynamics to counterselect resistance. Antimicrob Agents Chemother, 2007. 51(2): p. 744-7.
22. Nielsen, E.I., O. Cars, and L.E. Friberg, Pharmacokinetic/pharmacodynamic (PK/PD) indices of antibiotics predicted by a semimechanistic PKPD model: a step toward model-based dose optimization. Antimicrob Agents Chemother, 2011. 55(10): p. 4619-30.
23. Kristoffersson, A.N., et al., Simulation-Based Evaluation of PK/PD Indices for Meropenem Across Patient Groups and Experimental Designs. Pharmaceutical research, 2016.
24. Diver, J.M., Quinolone uptake by bacteria and bacterial killing Reviews of Infectious Diseases, 1989. 11: p. S941-S946.
25. Drlica, K. and X. Zhao, DNA gyrase, topoisomerase IV, and the 4-quinolones. Microbiol. Mol. Biol. Rev., 1997. 61.
26. Szalek, E., et al., The PK/PD index (CMAX/MIC) for ciprofloxacin in patients with cystic fibrosis. Acta Pol Pharm, 2011. 68(5): p. 777-83.
27. Forrest, A., et al., Pharmacodynamics of intravenous ciprofloxacin in seriously ill patients. Antimicrob Agents Chemother, 1993. 37(5): p. 1073-81.
28. Bergogne-Berezin, E., Clinical role of protein binding of quinolones. Clin Pharmacokinet, 2002. 41(10): p. 741-50.

52
29. Wu, B. and H. Derendorf, Pharmacokinetic/pharmacodynamic model-based combination therapy approach to target antibiotic resistant populations emerged from ciprofloxacin exposure. Pharmazie, 2010. 65(6): p. 417-20.
30. Obrink-Hansen, K., et al., Moxifloxacin pharmacokinetic profile and efficacy evaluation in empiric treatment of community-acquired pneumonia. Antimicrob Agents Chemother, 2015. 59(4): p. 2398-404.
31. Antibiotic resistance map. The Center for Disease Dynamics, Economics & Policy; Available from: http://resistancemap.cddep.org/resmap/resistance.
32. Storm, D.R., K.S. Rosenthal, and P.E. Swanson, Polymyxin and related peptide antibiotics. Annu Rev Biochem, 1977. 46: p. 723-63.
33. Li, J., et al., Steady-state pharmacokinetics of intravenous colistin methanesulphonate in patients with cystic fibrosis. The Journal of antimicrobial chemotherapy, 2003. 52(6): p. 987-92.
34. Li, J., et al., Pharmacokinetics of colistin methanesulphonate and colistin in rats following an intravenous dose of colistin methanesulphonate. The Journal of antimicrobial chemotherapy, 2004. 53(5): p. 837-40.
35. Li, J., et al., Pharmacokinetics of colistin methanesulfonate and colistin in a critically ill patient receiving continuous venovenous hemodiafiltration. Antimicrob Agents Chemother, 2005. 49(11): p. 4814-5.
36. Beveridge, E.G. and A.J. Martin, Sodium sulphomethyl derivatives of polymyxins. Br J Pharmacol Chemother, 1967. 29(2): p. 125-35.
37. Plachouras, D., et al., Population pharmacokinetic analysis of colistin methanesulfonate and colistin after intravenous administration in critically ill patients with infections caused by gram-negative bacteria. Antimicrob Agents Chemother, 2009. 53(8): p. 3430-6.
38. Recommendations issued for safe use in patients with serious infections resistant to standard antibiotics. European Medicines Agency 2014; Available from: http://www.ema.europa.eu/docs/en_GB/document_library/Press_release/2014/10/WC500176334.pdf.
39. Dudhani, R.V., et al., Elucidation of the pharmacokinetic/pharmacodynamic determinant of colistin activity against Pseudomonas aeruginosa in murine thigh and lung infection models. Antimicrob Agents Chemother, 2010. 54(3): p. 1117-24.
40. Dudhani, R.V., et al., fAUC/MIC is the most predictive pharmacokinetic/pharmacodynamic index of colistin against Acinetobacter baumannii in murine thigh and lung infection models. The Journal of antimicrobial chemotherapy, 2010. 65(9): p. 1984-90.

53
41. Cheah, S.E., et al., New pharmacokinetic/pharmacodynamic studies of systemically administered colistin against Pseudomonas aeruginosa and Acinetobacter baumannii in mouse thigh and lung infection models: smaller response in lung infection. The Journal of antimicrobial chemotherapy, 2015. 70(12): p. 3291-7.
42. Falagas, M.E. and S.K. Kasiakou, Colistin: The revival of polymyxins for the management of multidrug-resistant gram-negative bacterial infections. Clinical Infectious Diseases, 2005. 40(9): p. 1333-1341.
43. Petrosillo, N., E. Ioannidou, and M.E. Falagas, Colistin monotherapy vs. combination therapy: evidence from microbiological, animal and clinical studies. Clin Microbiol Infect, 2008. 14(9): p. 816-27.
44. Deris, Z.Z., et al., The combination of colistin and doripenem is synergistic against Klebsiella pneumoniae at multiple inocula and suppresses colistin resistance in an in vitro pharmacokinetic/pharmacodynamic model. Antimicrob Agents Chemother, 2012. 56(10): p. 5103-12.
45. Mohamed, A.F., et al., Dynamic interaction of colistin and meropenem on a WT and a resistant strain of Pseudomonas aeruginosa as quantified in a PK/PD model. The Journal of antimicrobial chemotherapy, 2016.
46. ECDC, E.C.f.D.P.a.C., Antimicrobial resistance surveillance in Europe 2012. Annual Report of the European Antimicrobial Resistance Surveillance Network (EARS-Net). Stockholm. 2013.
47. ECDC, Antimicrobial resistance surveillance in Europe. 2012. 48. The center for Disease Dynamics, E.P. Fluoroquinolone-Resistant
Escherichia coli. 2009 10 Oct 2013]; Available from: http://www.cddep.org/ResistanceMap/bug-drug/EC-FQ#.UlWhJBDTRup.
49. Komp Lindgren, P., A. Karlsson, and D. Hughes, Mutation Rate and Evolution of Fluoroquinolone Resistance in Escherichia coli Isolates from Patients with Urinary Tract Infections. Antimicrobial Agents and Chemotherapy, 2003. 47(10): p. 3222-3232.
50. Marcusson, L.L., N. Frimodt-Moller, and D. Hughes, Interplay in the selection of fluoroquinolone resistance and bacterial fitness. PLoS pathogens, 2009. 5(8): p. e1000541.
51. Wickens, H.J., et al., Flow Cytometric Investigation of Filamentation, Membrane Patency, and Membrane Potential in Escherichia coli following Ciprofloxacin Exposure. Antimicrobial Agents and Chemotherapy, 2000. 44(3): p. 682-687.
52. Ette E.I., W.P.J., Pharmacometrics, The Science of Quantitative Pharmacology. 2007, Hoboken, New Jersey: A JOHN WILEY & SONS, INC., PUBLICATION.
53. Powell, J.R. and J.V. Gobburu, Pharmacometrics at FDA: evolution and impact on decisions. Clinical pharmacology and therapeutics, 2007. 82(1): p. 97-102.

54
54. Nielsen, E.I. and L.E. Friberg, Pharmacokinetic-pharmacodynamic modeling of antibacterial drugs. Pharmacol Rev, 2013. 65(3): p. 1053-90.
55. Tam, V.H., et al., Novel approach to characterization of combined pharmacodynamic effects of antimicrobial agents. Antimicrobial Agents and Chemotherapy, 2004. 48(11): p. 4315-21.
56. Mohamed, A.F., et al., Pharmacokinetic-pharmacodynamic model for gentamicin and its adaptive resistance with predictions of dosing schedules in newborn infants. Antimicrobial Agents and Chemotherapy, 2012. 56(1): p. 179-88.
57. Mohamed, A.F., O. Cars, and L.E. Friberg, A pharmacokinetic/pharmacodynamic model developed for the effect of colistin on Pseudomonas aeruginosa in vitro with evaluation of population pharmacokinetic variability on simulated bacterial killing. J Antimicrob Chemother, 2014. 69(5): p. 1350-1361.
58. Bulitta, J.B., et al., Attenuation of colistin bactericidal activity by high inoculum of Pseudomonas aeruginosa characterized by a new mechanism-based population pharmacodynamic model. Antimicrobial Agents and Chemotherapy, 2010. 54(5): p. 2051-62.
59. Meagher, A.K., et al., Novel pharmacokinetic-pharmacodynamic model for prediction of outcomes with an extended-release formulation of ciprofloxacin. Antimicrobial Agents and Chemotherapy, 2004. 48(6): p. 2061-8.
60. Yano, Y., et al., Application of logistic growth model to pharmacodynamic analysis of in vitro bactericidal kinetics. Journal of pharmaceutical sciences, 1998. 87(10): p. 1177-83.
61. Zhuang, L., et al., Gentamicin dosing strategy in patients with end-stage renal disease receiving haemodialysis: evaluation using a semi-mechanistic pharmacokinetic/pharmacodynamic model. The Journal of antimicrobial chemotherapy, 2016. 71(4): p. 1012-21.
62. Nielsen, E.I., et al., Semimechanistic pharmacokinetic/pharmacodynamic model for assessment of activity of antibacterial agents from time-kill curve experiments. Antimicrobial Agents and Chemotherapy, 2007. 51(1): p. 128-36.
63. Khan, D.D., et al., A mechanism-based pharmacokinetic/pharmacodynamic model allows prediction of antibiotic killing from MIC values for WT and mutants. The Journal of antimicrobial chemotherapy, 2015. 70(11): p. 3051-60.
64. Katsube, T., et al., Pharmacokinetic-pharmacodynamic modeling and simulation for bactericidal effect in an in vitro dynamic model. Journal of pharmaceutical sciences, 2008. 97(9): p. 4108-17.
65. Kristoffersson, A.N. and L.E. Friberg, Optimal Design (OD) and In Vitro Validation of Reduced Time-Kill Curve Experiments for Pharmacokinetic-Pharmacodynamic (PKPD) modeling, in ICAAC2014. p. A-049.
66. Atkinson, A.D., A., Optimum Experimental Designs. 1992: Oxford Statistical Science Series.

55
67. Karvanen, M., Optimization of Colistin Dosage in the Treatment of Multiresistant Gram-negative Infections. PhD thesis, 2013, Uppsala University.
68. Jansson, B., et al., Quantitative analysis of colistin A and colistin B in plasma and culture medium using a simple precipitation step followed by LC/MS/MS. J Pharm Biomed Anal, 2009. 49(3): p. 760-7.
69. Bergstrand, M. and M.O. Karlsson, Handling data below the limit of quantification in mixed effect models. The AAPS journal, 2009. 11(2): p. 371-80.
70. Beal, S.L., Ways to fit a PK model with some data below the quantification limit. Journal of pharmacokinetics and pharmacodynamics, 2001. 28(5): p. 481-504.
71. Dansirikul, C., H.E. Silber, and M.O. Karlsson, Approaches to handling pharmacodynamic baseline responses. Journal of pharmacokinetics and pharmacodynamics, 2008. 35(3): p. 269-83.
72. Beal, S., Sheiner, L.B., Boeckmann, A., & Bauer, R.J.2009., NONMEM User's Guides. (1989-2009). 2009, Ellicott City, MD, USA: Icon Development Solutions.
73. Lindbom, L., P. Pihlgren, and E.N. Jonsson, PsN-Toolkit--a collection of computer intensive statistical methods for non-linear mixed effect modeling using NONMEM. Computer methods and programs in biomedicine, 2005. 79(3): p. 241-57.
74. Jonsson, E.N., Karlsson, M.O, Xpose - An S-PLUS based population pharmacokinetic/pharmacodynamic model building aid for NONMEM,. M.O. 1998 Computer Methods and Programs in Biomedicine, 2005. 58: p. 51-64.
75. Foracchia, M., et al., POPED, a software for optimal experiment design in population kinetics. Computer methods and programs in biomedicine, 2004. 74(1): p. 29-46.
76. Nyberg, J., et al., PopED: an extended, parallelized, nonlinear mixed effects models optimal design tool. Computer methods and programs in biomedicine, 2012. 108(2): p. 789-805.
77. Khan, D.D., L.E. Friberg, and E.I. Nielsen, A pharmacokinetic-pharmacodynamic (PKPD) model based on in vitro time-kill data predicts the in vivo PK/PD index of colistin. The Journal of antimicrobial chemotherapy, 2016.
78. Mueller, M., A. de la Pena, and H. Derendorf, Issues in pharmacokinetics and pharmacodynamics of anti-infective agents: kill curves versus MIC. Antimicrob Agents Chemother, 2004. 48(2): p. 369-77.
79. Mouton, J.W., A.A. Vinks, and N.C. Punt, Pharmacokinetic-pharmacodynamic modeling of activity of ceftazidime during continuous and intermittent infusion. Antimicrob Agents Chemother, 1997. 41(4): p. 733-8.
56
80. Czock, D. and F. Keller, Mechanism-based pharmacokinetic-pharmacodynamic modeling of antimicrobial drug effects. Journal of pharmacokinetics and pharmacodynamics, 2007. 34(6): p. 727-51.
81. Katsube, T., Y. Yamano, and Y. Yano, Pharmacokinetic-pharmacodynamic modeling and simulation for in vivo bactericidal effect in murine infection model. J Pharm Sci, 2008. 97(4): p. 1606-14.
82. Sy, S.K., L. Zhuang, and H. Derendorf, Pharmacokinetics and pharmacodynamics in antibiotic dose optimization. Expert Opin Drug Metab Toxicol, 2016. 12(1): p. 93-114.


Acta Universitatis UpsaliensisDigital Comprehensive Summaries of Uppsala Dissertationsfrom the Faculty of Pharmacy 215
Editor: The Dean of the Faculty of Pharmacy
A doctoral dissertation from the Faculty of Pharmacy, UppsalaUniversity, is usually a summary of a number of papers. A fewcopies of the complete dissertation are kept at major Swedishresearch libraries, while the summary alone is distributedinternationally through the series Digital ComprehensiveSummaries of Uppsala Dissertations from the Faculty ofPharmacy. (Prior to January, 2005, the series was publishedunder the title “Comprehensive Summaries of UppsalaDissertations from the Faculty of Pharmacy”.)
Distribution: publications.uu.seurn:nbn:se:uu:diva-282604
ACTAUNIVERSITATIS
UPSALIENSISUPPSALA
2016