phase behavior of hydrocarbon fluids in shale …
TRANSCRIPT
PHASE BEHAVIOR OF HYDROCARBON FLUIDS IN SHALE RESERVOIRS:
EFFECT OF THE PRESENCE OF KEROGEN AND CONFINEMENT
by
Manas Pathak
A dissertation submitted to the faculty of The University of Utah
in partial fulfillment of the requirements for the degree of
Doctor of Philosophy
Department of Chemical Engineering
The University of Utah
May 2017

Copyright © Manas Pathak 2017
All Rights Reserved
T h e U n i v e r s i t y o f U t a h G r a d u a t e S c h o o l
STATEMENT OF DISSERTATION APPROVAL
The dissertation of Manas Pathak
has been approved by the following supervisory committee members:
Milind Deo , Chair 12/09/16
Date Approved
John McLennan , Member 12/12/16
Date Approved
Eric Eddings , Member 12/15/16
Date Approved
Edward Trujillo , Member 12/12/16
Date Approved
Raymond Levey , Member 12/09/16
Date Approved
Jonathan Craig , Member 12/21/16
Date Approved
Ger Van Graas , Member 01/03/17
Date Approved
and by Milind Deo , Chair/Dean of
the Department/College/School of Chemical Engineering
and by David B. Kieda, Dean of The Graduate School.

ABSTRACT
Shale plays have revolutionized oil and gas production in the United States. In the
last decade, many shale gas and liquid plays have been explored and developed in the US
and elsewhere. Prospective shales consist of a complex organic component known as
kerogen which is a precursor to oil and gas. Shales have pores with dimensions in the
range of nanometers in the organic and inorganic constituents. The presence of organic
matter and nanometer pores affect the thermodynamic properties of fluids in these rocks.
A hypothesis has been proposed and proved through modeling and experiments to
account for the influence of kerogen on thermodynamic properties of hydrocarbon fluids.
Kerogen preferentially absorbs hydrocarbons and subsequently swells in volume. This
splits oil in liquid-rich shale plays into two phases – a retained phase and a free phase,
both of which remain in equilibrium. The retained and free phases together form in-situ
oil; equilibrium of in-situ oil with gas was studied to investigate the effect of kerogen on
saturation pressures of oils in shales. Results indicate a bubble point suppression between
~ 4150 kPa and ~ 16350 kPa from an original value of 28025 kPa for produced Eagle
Ford oil. This is attributed to the presence of kerogen. This suppression depends on the
type and level of maturity of the kerogen. The confinement of hydrocarbon fluids in the
nanometer pores present in shales also changes the behavior of these fluids. Pore-wall –
fluid interactions become dominant at the nano-scale and conventional equations of state

iv
(EOS) fail to include the effect of these confined state interactions. Gibbs Ensemble
Monte Carlo simulations were performed in this work to investigate the thermodynamic
properties of pure components and fluid mixtures in confined pores. Suppression of
critical densities and critical temperature of confined decane, decane–methane, and
decane–carbon-dioxide was observed from the bulk properties. This leads to changes in
the saturation pressures of fluids in the confined state.
Experiments on kerogen isolated from a shale and oil were performed with a
differential scanning calorimeter and a thermogravimetric analyzer. These experiments
complimented the modeling results and thus, verified the effect of kerogen and
hydrocarbon fluid confinement observed in the models. Finally, for gas-rich shales, a
carbon dioxide injection as the most effective method was evaluated for enhanced
production of gas sorbed in kerogen. Molecular modeling indicates that the carbon
dioxide can replace methane sorbed in the kerogen and the kerogen matrix decreases in
volume during this process. The carbon dioxide shows higher retention in the kerogen
than methane, indicating the viability of enhanced gas recovery and carbon dioxide
sequestration.

To my family and friends

TABLE OF CONTENTS
ABSTRACT ...................................................................................................................... iii ACKNOWLEDGEMENTS .......................................................................................... viii CHAPTERS
1. INTRODUCTION ........................................................................................................1 1.1 Research Motivation ........................................................................................... 1 1.2 Objectives ........................................................................................................... 2 1.3 Need for Understanding Dynamics at a Pore Scale ........................................... 2
2. EFFECT OF THE PRESENCE OF ORGANIC MATTER ON BUBBLE
POINTS OF OILS IN SHALES ..............................................................................5 2.1 Abstract .............................................................................................................. 5 2.2 Introduction ........................................................................................................ 5 2.3 Kerogen Swelling and Oil Partitioning .............................................................. 8 2.4 Phase Behavior Calculations ............................................................................ 12 2.5 Results and Discussion ..................................................................................... 15
2.5.1 Effect of Maturity on Bubble Points .................................................... 15 2.5.2 Bubble Points of In-situ Oils ................................................................ 17
2.6 Conclusions ...................................................................................................... 20 3. KEROGEN SWELLING AND CONFINEMENT: EFFECT ON
THERMODYNAMIC PROPERTIES OF HYDROCARBON FLUIDS ..........34 3.1 Abstract ............................................................................................................ 34 3.2 Introduction……………...……………………………………………………36 3.3 Method ............................................................................................................. 38
3.3.1 Experimental ........................................................................................ 38 3.3.2 Modeling .............................................................................................. 40
3.4 Results .............................................................................................................. 42 3.5 Conclusions ...................................................................................................... 45 3.6 Supplementary Information .............................................................................. 46
3.6.1 Methodology for Molecular Dynamic Simulations .............................. 46 3.6.2 Simulated Annealing Procedure ........................................................... 48

vii
4. MOLECULAR MODELING STUDY OF BUBBLE POINTS OF HYDROCARBON MIXTURES IN NANOPOROUS MEDIA ..........................60
4.1 Abstract ............................................................................................................ 60 4.2 Introduction ...................................................................................................... 61 4.3 Simulation Methodology .................................................................................. 64 4.4 Bubble Point Measurement .............................................................................. 67 4.5 Result and Discussion ...................................................................................... 68
4.5.1 Simulation for Decane-Methane Mixture ............................................. 68 4.5.2 Simulations for a Decane-CO2 Mixture ............................................... 71
4.6 Conclusions ...................................................................................................... 72
5. MOLECULAR INVESTIGATION OF ENHANCED GAS RECOVERY BY CARBON DIOXIDE SEQUESTRATION IN GAS-RICH SHALES ................81
5.1 Introduction ...................................................................................................... 81 5.2 Background of Carbon Dioxide Enhanced Production .................................... 82 5.3 Kerogen Molecular Modeling .......................................................................... 85 5.4 Simulation of Kerogen, Methane, and Carbon Dioxide System ...................... 88 5.5 Results and Discussion ..................................................................................... 91 5.6 Conclusions ...................................................................................................... 93
6. CONCLUSIONS ........................................................................................................102
6.1 Original Contributions .................................................................................... 103
REFERENCES ...............................................................................................................105
ACKNOWLEDGEMENTS
First of all, I am extremely grateful to my advisor, Professor Milind Deo, for his
guidance and encouragement throughout this research work. I thank him for allowing me
to nurture my intellectual faculties to their utmost levels. I would like to thank the
members of the supervising committee, Dr. John McLennan, Dr. Raymond Levey, Dr.
Eric Eddings, Dr. Edward Trujillo, Dr. Jonathan Craig, and Dr. Ger Van Graas, for their
comments and suggestions. I am thankful to all the faculty and staff of the Chemical
Engineering Department for their support in the graduate program. I would like to thank
Dr. Hai Huang, Dr. Paul Meakin, and Dr. Keith Prisbrey for detailed discussions related
to my research. I am grateful to the Energy & Geoscience Institute (EGI) for providing
me financial support for my graduate study. I am also grateful to Idaho National
Laboratory for providing me access to high performance computing resources. I thank
my colleagues and classmates for making the workplace friendly and productive. Finally,
I express my respect to my parents, brother, friends, and family members for their
support, encouragement, and motivation. I would like to thank Sugandha Sharma for
supporting me throughout this endeavor.

CHAPTER 1
INTRODUCTION
To increase the recoveries of hydrocarbons from shale plays beyond 20%,
understanding the dynamics at a pore scale is required. Larger recoveries would help in
efficient and environmentally friendly exploitation of oil and gas from shale.
1.1 Research Motivation
In the last decade, shale play resources have played a key role in increasing oil
production in the United States. However, the average hydrocarbon recovery factors from
many of these formations are usually less than 20% (less than 10% for oil and 20% for
gas-rich shale plays). There is a considerable interest in understanding the production of
liquids from shale rock plays such as the Eagle Ford Play in Texas. The sizes of pores in
shales holding the oil are believed to be of the order of nanometers. The fluids present in
such small nanopores and in contact with kerogen may have different properties
compared to their properties measured in bulk. Correct prediction of thermodynamic
properties of reservoir fluids in shales is critical for increasing recoveries from shale
plays. “Shale” rocks are in most cases not “true” shales (i.e. having a high proportion of
clay minerals) but fine-grained rocks – often carbonate- and/or silica-rich.

2
1.2 Objectives
In view of important requirements for improved recovery, the following research
objectives have been proposed:
• Develop a thermodynamic model to account for the effect of kerogen on Pressure-
Volume-Temperature (PVT) properties of fluids in shale reservoirs
• Develop a molecular scale model to understand the dynamics of kerogen and
hydrocarbon fluids
• Develop a molecular scale model to understand the effect of confinement (in
nanometer scale porosity) on fluid thermodynamic properties in shales
• Perform experiments to support and complement these models in order to
understand the effect of kerogen and nanopores in shales on PVT properties of
reservoir fluids.
1.3 Need for Understanding Dynamics at a Pore Scale
Fluid saturation pressures at in-situ temperatures – bubble points for oils and dew
points for condensates in shale nanopores, are affected by the influence of the pore walls
in the vicinity of the fluid molecules. Moreover, kerogen, a solid organic constituent of
shale, behaves like a crosslinked polymer and preferentially absorbs a portion of the oil
present in these rocks. Such interactions with kerogen also change the PVT properties of
oil in association with the kerogen. Therefore, thermodynamic properties of those fluids
change in the presence of crosslinked polymers (kerogen) and in confined spaces
(nanopores in shales). Correct prediction of the deviation in these properties is valuable to
many industries including the oil and gas industry. Approach to bubble point or dew
point influences the proportion of liquid or gas produced from a given producing well,

3
and thus impacts the economic viability. Hence, an accurate measure of saturation
pressures is important. Traditional equations of state fail to consider the complexity of
pore wall interactions and kerogen swelling in the determination of thermodynamic
properties of fluids in contact with kerogen and in confinement. It is important to
understand how liquids are produced from ultra-low permeability rocks so that
production rates and recovery can be optimized.
The current Ph.D. research work includes the study of thermodynamics of solvent
(oil) – kerogen (polymer) interaction, Molecular Dynamics (MD) simulations for
assessment of kerogen swelling, as well as Monte Carlo simulations in Gibbs Ensemble
for understanding phase behavior of confined fluids. There are also experiments
conducted on isolated kerogen and hydrocarbon fluids using Differential Scanning
Calorimetry (DSC) and a Thermogravimetric Analyzer (TGA) to understand kerogen
swelling and the associated effect on PVT properties of oil. Finally, MD simulations
investigated the possibility of using CO2 as enhanced production technology for gas-rich
shales.
The results from Molecular Dynamics simulations in Chapter 2 show that kerogen
interacts with hydrocarbons. The subsequent thermodynamic modeling in Chapter 2
demonstrates that kerogen-oil interaction suppresses the bubble point of oil in shales
when compared to the bubble point of oil in the bulk.
Gibbs ensemble Monte Carlo (MC) simulations were used in Chapter 3 to understand
the effect of confinement of fluid molecules on fluid density and phase behavior of the
confined fluid. The traditional equations of state fail to consider the complexity of pore
wall interaction in calculating thermodynamics properties of confined fluids. MC

4
simulations were performed for binary mixtures of decane-methane, decane-CO2 at
different molar ratios confined in a slit-graphite nanopore. The research has shown that
confinement of fluids in nanopores leads to suppression of critical properties of these
fluids mixtures.
Chapter 4 describes experiments performed with pure isolated kerogen to investigate
the effect of kerogen and nanoporosity on the bubble point temperature of pure
component and oil using a Differential Scanning Calorimeter (DSC) and a
Thermogravimetric Analyser (TGA). The results indicate suppression in the bubble point
temperatures of hydrocarbon fluids in the presence of kerogen with nanopores.
The possibility of enhanced oil recovery using CO2 injection is studied in Chapter 5.
The self-diffusivities of CO2 were found to be on the order of 10-9 m2/s in kerogen. The
current research demonstrates that CO2 has more affinity for sorption in kerogen-like
organic macromolecules compared to CH4 and that CO2 swells kerogen less than equal
moles of CH4.

CHAPTER 2
EFFECT OF THE PRESENCE OF ORGANIC MATTER ON BUBBLE
POINTS OF OILS IN SHALES
2.1 Abstract
The relative amounts of oil and gas produced in prolific plays like the Eagle Ford are
affected by the oil’s bubble point. The oil and kerogen (organic matter) coexist and the
oil may remain in contact with the kerogen. Bulk experiments and molecular simulations
clearly show that kerogen preferentially absorbs hydrocarbons. The retained oil phase
remains in multicomponent equilibrium with the expelled oil produced at the surface.
Results from a model proposed to calculate the bubble points (at 400 K) of in-situ oils
(retained + free) in the presence of kerogen indicate suppression of about 4150 kPa –
16350 kPa from the original value of 28025 kPa of a produced Eagle Ford oil. These
calculations depend on the type and level of maturity of kerogen. Reliable prediction of
accurate saturation pressures has key implications on recovery volumes and production
rates from liquid-rich shales.
2.2 Introduction
Recent technological advances have made recovery of liquid hydrocarbons possible
from the ultra-low permeability shales. However, recoveries from these liquid-rich shales
This chapter is reprinted with permission from Effect of the Presence of Organic Matter on Bubble Points of Oils in Shales, Manas Pathak, Palash Panja, Raymond Levey, and Milind Deo, 2017, AIChE Journal. Copyright 2017 John Wiley and Sons

6
still tend to be low. It is believed that more than 90% of generated oil still remains in the
formation1. Better understanding of fluid thermodynamic and transport properties is
necessary to understand the cause of these low recoveries and subsequently improve
production.
One of the reasons for poor recoveries is the large declines in liquid rates in the first
few months of production that are usually associated with a larger fraction of gas
production. Shales producing liquids are undergoing primary production. The physical
production system is shown schematically in Figure 2.1. Figure 2.1 shows a shale
sandwiched between other strata with a horizontal well landed in the shale formation. The
shale is eventually hydraulically fractured to produce oil and gas. During production, the
hydraulic fracture face and some portions of the horizontal well are maintained well
below the bubble point of the reservoir fluid. However, in a low-permeability system,
most of the reservoir remains above the bubble point. Interactions of oil in kerogen with
free oil and their associated gas (Figure 2.1) present in shales are the theme of this
chapter. These interactions occur at a pore scale and affect the saturation pressure of oil
when it is in contact with kerogen. Saturation pressures are important operational
parameters while drilling a well. The reservoir fluids stay in two phases below the
saturation pressures of the oil, which may not be desirable during production.
Organic matter (kerogen) is a key component in liquid-rich shales. Kerogen is a
carbonaceous material, which is believed to be the precursor of hydrocarbons. Kerogen is
typically classified into four types, viz. type I, II, III, and IV. The classification is based
on the source of the organic matter and the general depositional environment, as shown in
Table 2.1. Sometimes, type II kerogen is sulfur rich and is then known as type IIS. Any

7
of the type I, II, and III kerogens can exist in the oil, dry gas, or wet gas windows
depending on their maturity. A van Krevelen2 diagram (Figure 2.2) shows these three
maturity windows based on the Hydrogen to Carbon (H/C) and Oxygen to Carbon (O/C)
ratios of the kerogen. The red dot in Figure 2.2 indicates a type of kerogen, whose model
was used in molecular dynamics simulation, described later in the text. During
catagenesis3,4 of an oil prone type II kerogen, the kerogen transforms and converts into
oil leaving behind residual kerogen matrix. A shale rich in such type II kerogen usually
contains liquid hydrocarbons. The liquid hydrocarbons may or may not be associated
with their gas components in the reservoir. When the reservoir pressure is above the
bubble point pressure of the oil, the gas is dissolved in the oil. A part of the generated oil
expels out of the residual kerogen matrix, and the rest is retained within the kerogen5.
The expelled oil is also referred to as ‘free oil’ in the current work, while the oil retained
within the residual kerogen matrix is referred to as ‘retained’ oil. The absorbed/retained
oil is the sum of generated oil that is retained and expelled oil that is absorbed back into
the matrix; however, it is difficult to differentiate between the two. Hence, the sum would
be referred to as just ‘retained oil’ in this manuscript. Some portion of the retained or
absorbed oil can also be referred to as bitumen which is soluble in organic matter. This is
usually the heaviest portion of the oil. The free oil outside the kerogen matrix in a shale
may remain in a multicomponent equilibrium with the retained oil6,7 as shown in Figure
2.3. Water may be present and the phase behavior of water and hydrocarbons followed by
multiphase expulsion of oil and water is important. The water may have a role in the
generation of oil and gas8,9. However, for the purposes of this paper, it is assumed that
water does not affect the free oil-retained oil equilibrium. Figure 2.3 shows crosslinked

8
kerogen with retained oil. The retained oil phase is in multicomponent equilibrium with
the free oil immediately outside the kerogen matrix. The two oils together form oil
present in the shales at in-situ state. It is the free oil that is produced at the surface.
2.3 Kerogen Swelling and Oil Partitioning
Previously, researchers have theoretically studied and experimentally demonstrated
the swelling of kerogen in the presence of organic solvents6,10–15. These authors suggest
that the organic solvents are absorbed into the kerogen matrix. Considering the
crosslinked nature of kerogen, the equilibrium behavior between the retained oil in the
kerogen matrix and the expelled free oil is studied using an extended Flory-Rehner
Regular Solution (FRRS) theory model6. Similar volumetric swelling observed from
experiments and calculated from extended Flory-Rehner Regular Solution (FRRS) theory
indicates that absorbed solvent stays in dissolved form in the kerogen and remains in
equilibrium with the solvent outside the matrix.
Further, Molecular Dynamics (MD) simulations have been used in the current chapter
to demonstrate the swelling behavior of kerogen in the presence of organic solvents. The
current work used xyz coordinates of atoms in the type II C kerogen model published by
Ungerer et al. (2015)16 and remodeled it by assigning parameters using the General
Amber Force Field (GAFF) from Wang et al. (2004)17. A remodeled kerogen structure
was then used to measure the bulk properties of kerogen by performing MD simulations.
The type II C kerogen model corresponds to a type II kerogen from the Duvernay
Formation (sample C in Kelemen et al., 200718). The H/C and O/C ratios of this model
unit are 0.905 and 0.054, respectively, and the kerogen model plots in the middle to end
of the oil window as shown in the van Krevelen diagram (Figure 2.2).

9
A molecule of type II C kerogen in the protein data bank (PDB) format, rewritten for
GAFF, was used to produce the bulk kerogen model. Ten such molecules were packed
randomly into a simulation box using the Packmol19 tool to form a bulk kerogen. The
PDB of bulk kerogen was taken into the Visual Molecular Dynamics (VMD)20 tool to
write an input file for the Large-scale Atomic/Molecular Massively Parallel Simulator
(LAMMPS) tool21. The Nose-Hoover style non-Hamiltonian equations of motion were
used in a molecular simulator to generate positions and velocities sampled from the
canonical (NVT) and isothermal-isobaric (NPT) ensembles. Simulated annealing was
performed through a series of energy minimization steps. The density of the final kerogen
structure was calculated at the end of simulated annealing. The density of annealed
structure of modeled kerogen was around 1.15 g/cc at 300 K and 300 atm pressure. The
density from simulations matches densities obtained from experiments (1.18-1.29 g/cc) in
Okiongbo et al. (2005)22, and simulations (1.13 g/cc) in Ungerer et al. (2005)16. The
radial distribution function, g(r), gives the probability of finding a particle at a distance
(r) from another particle, averaged over all of the particles in the system. The calculated
radial pair distribution function with peaks at 1.35 Å and 1.55 Å corresponding to C-C
aromatic and C-C aliphatic bond lengths, respectively, is in good agreement with the
radial pair distribution function (calculated at 300 K and 0.98 atmosphere) of Ungerer et
al. (2015)16, who developed the original molecular structure model. The final annealed
structure of bulk kerogen at minimum energy state would be used to further measure
swelling of kerogen in presence of organic solvents.
To calculate swelling of kerogen in presence of organic solvents, the subsequent
simulations in NPT ensemble and periodic boundary conditions 300 K and 30400 kPa

10
pressure were performed with 20% decane molecules by mass (10 molecules of kerogen
simulated with 49 molecules of decane). With decane as a solvent, volumetric swelling
ratio (swelled volume/original volume) of ~1.2 was obtained with the type II kerogen
(Figure 2.4) at the end of simulations. Researchers have previously studied swelling of
kerogen using theory and experiments6,10–15 and obtained similar volumetric swelling
ratio with different organic solvents including decane. Ertas et al. (2006)6 obtained
volumetric swelling ratio (swelled volume/original volume) of 1.22 for decane at 303.15
K temperature. The swelling behavior of kerogen observed by MD simulations again
confirms that kerogen absorbs solvents including hydrocarbons and the hydrocarbons
expelled from the kerogen structure during the catagenesis may remain in a multi-
component equilibrium with the hydrocarbons absorbed/retained in the residual kerogen
matrix6,7. The good match in the volumetric swelling of type II kerogen associated with
absorption of solvents, from experiments, extended FRRS theory, and molecular
simulations further confirms that kerogen behaves as a crosslinked elastomer with non-
specific interactions (no hydrogen bonding) between kerogen and oil6,7 and it fractionates
oil into absorbed/retained and free oil phase.
The above discussion establishes that the oil generated by transformation of kerogen
is partitioned into absorbed/retained and free oil phase by the residual kerogen matrix. All
of the generated oil resides in either of the two forms – oil outside the kerogen matrix or
oil inside the kerogen matrix. The oil inside the matrix could have been generated by a
combination of retention of some of the generated oil during the transformation and
absorption of some of the free oil after transformation, such that the oil inside and outside
of kerogen eventually achieves equilibrium. It is difficult to differentiate between the

11
retained oil and the oil that was absorbed later from the free phase. To facilitate this
differentiation, the oil inside the kerogen is termed retained oil. This retained oil inside
the kerogen stays in the dissolved form within the kerogen matrix. Because of the
absorption of oil, the kerogen swells in volume as shown in Figure 2.5. The oil retained
in the kerogen matrix remains in multicomponent equilibrium with the free oil
surrounding the kerogen matrix (Figure 2.3 and Figure 2.5). It is the free oil that is
produced at the surface. The bubble point of Eagle Ford oil used in the conventional
simulators or for other engineering purposes refers to the bubble point of this free oil. The
retained and free oil together constitute the in-situ oil present in the shales. The phase
transition to gas from an oil takes place in the reservoir – thus, the saturation pressure of
the oil-gas mixture in the presence of kerogen is relevant. This oil-gas equilibrium in the
reservoir is established between the in-situ oil and its gas component. Thus, all three
phases, namely free oil, retained oil, and gas, achieve equilibrium (Figure 2.6). The
following three phases that stay in equilibrium in the liquid-rich shales will be discussed
in the rest of the text:
1. The retained oil (a) phase in kerogen (ker)
2. The free oil (f) phase
3. The gas (g) phase
The chemical potential of oil inside kerogen depends on total contribution from
elastic entropy (∆𝑆#$), entropy of mixing (∆𝑆%), and enthalpy of mixing (∆𝐻%)23,. The
species move in the direction of least chemical potential to attain a lower energy state.
The difference between chemical potential of any component of oil inside and outside the
kerogen matrix (∆µ()is given in Ertas et al. (2006)6.

12
∆+,-./
= 0-./
112,
∆𝐻% − 𝑇 ∆𝑆% + ∆𝑆#$ = ln 𝜐( + 𝜐::;<=;>;<
+ v@ 𝑏(:𝑣::C( −
𝑏(-:D- 𝑣:𝑣- + 𝑣E + v@ 𝑏(E𝑣EF + 𝑣E 𝑣:(𝑏(E −: 𝑏:E) + HIJK(𝑣E
0/M𝑣#NF/M − 𝑣E) (2.1)
where∆µ@ indicates change in chemical potential; kPis Boltzmann constant, b@R =
δ@ − δRF/kPT, δ@ are Hildebrand solubility parameters for solvent species i given in
Flory (1943); v@, vRare molecular volumes of the solvents; 𝑣( ,𝑣: , 𝑣- are volume
fractions of solvents; n@is total number of solvents i; NWis effective number of chain
elements in a crosslinked network of kerogen; vXindicates swollen volume fraction of
kerogen; 𝑣#N is native swelling volume fraction; and µ@Y, µ@Z, µ@[ are chemical potentials of
ith species in three phases – retained (a), free (f), and gas (g), respectively.
2.4 Phase Behavior Calculations
For the three phases to stay in a multicomponent equilibrium in a shale, the chemical
potential of the ith component in all of the three phases must be equal.
𝜇(] = 𝜇(^ = 𝜇(
_ (2.2)
The preference factors determined in Walter (2013) are the numerical values that
provide the extent of partitioning of any ith component between retained and free oil
phase. The preference factors were calculated by solving retained oil-free oil equilibrium
and could be used to calculate the composition of retained oil according to the following
relation:
𝑦( = 𝑃(𝑥(/Σ(𝑃(𝑥() (2.3)
𝑜( = 𝑋𝑥( + 𝑌𝑦( (2.4)

13
where 𝑃( denotes preference factors from Walter et al. (2013) for ith specie, 𝑥( is mole
fraction of ith component in the free oil phase, 𝑦( is mole fraction in retained oil phase, X
is volume fraction of free oil, Y is volume fraction of retained oil, and 𝑜( is overall mole
fraction of in-situ oil in the shale formation.
This ith component of in-situ oil stays in equilibrium with its gas component such that
the chemical potentials of ith component in all three phase, viz. retained, free, and gas
phase, are equal. The Peng Robinson equation of state24 was used to solve the equilibrium
between gas and in-situ oil (free and retained oil phases) (Figure 2.6):
𝑃 = g/;=h,
− ],(/); ;ih, ih,(;=h,)
(2.5)
𝐾(_=E = ∅,
K
∅,l (2.6)
where ∅(Eis fugacity coefficient of ith component in ‘in-situ’ oil (o) phase, ∅(_ is fugacity
coefficient of ith component in gas (g) phase, 𝐾(_=E is equilibrium coefficient between gas
and in-situ oil phase, 𝑎( and 𝑏( are equation of state parameters, v is molar volume, P
denotes pressure (kPa), R denotes ideal gas constant, and T denotes temperature (K). The
subscript i refers to the total number of components in the oil (1, 2,3….n).
From here, the work was divided into two parts – calculation of the effect of kerogen
maturity on the bubble point of free oils and the calculation of the bubble point of in-situ
oil in the presence of kerogen of different maturities.
The first part replicates the geologic process of maturation of kerogen and aims to
study the change in bubble points of produced free oils as the kerogen matures. From
Walters et al. (2013)25, the preference factors for type II/IIS kerogen with HI values of
50%, 75%, and 100% HI (HI = 650 mg HC/g TOC) were considered to calculate the

14
composition of free, retained, and in-situ oil in presence of kerogen of increasing
maturity (Table 2.2). The HI values in Table 2.2 represent HI values of present-day
kerogen after 100%, 75%, and 50% conversion from original HI value of 650 mg HC/g
TOC HI and the maturity of kerogen increases from 50% to 100% conversion. Table 2.2
shows lumped oil fractions and corresponding preference factors for the three different
maturity values of type II/IIS kerogen. It is shown in Table 2.2 that the preference factors
in general increases from low maturity kerogen (50% conversion) to higher maturity
kerogen (100% conversion). This signifies that kerogen retains higher amounts of oil as it
matures in nature. In the Table 2.2, for a particular maturity, the preference factor usually
increases from smaller chain compounds to larger chain compounds and from saturated to
aromatics for compounds with the same number of carbon atoms. This reveals that
kerogen tends to retain heavier and aromatic compounds and expels lighter and saturated
compounds.
The second part of the chapter aims to replicate a more realistic present-day scenario.
In the present day, the free and retained oil together form the in-situ oil in the shales. In
shales, free oil would have different PVT properties than the in-situ oil. Therefore,
calculations of rates and hydrocarbon recovery volumes that are based on PVT properties
of the free oil alone will lead to different results. It is the in-situ oil whose PVT properties
should be considered to estimate true rates and hydrocarbon recovery volumes. The
properties based on free oil do not reflect the in-situ behavior of oil. The in-situ behavior
of oil (calculated based on composition of in-situ oil and not free oil) is required to know
the true PVT behavior of the reservoir fluids in the subsurface. The correct properties
would allow the operators to operate the well at a lower bottom hotel pressures without

15
increasing production GOR significantly. In this work, the composition of in-situ oil was
back-calculated from the compositions of produced free oil in order to estimate the
bubble point of in-situ oil.
2.5 Results and Discussion
2.5.1 Effect of Maturity on Bubble Points
For the purpose of demonstration of the proposed model, an approximate Eagle Ford
oil composition slightly modified from Whitson and Sunjerga (2012)26 is used as the
composition of oil generated by catagenesis of kerogen. This composition is shown in
Table 2.3 (first and second columns). The kerogen fractionates this generated oil into free
and retained oil phase. The composition of free oil was calculated by partitioning the
Eagle Ford oil composition into free and retained oil by using the preference factors. The
volumetric swelling and the expulsion efficiency of kerogen were assumed to be 1.6 and
0.9, respectively, in the calculation of the preference factors25.
In this work, compositional lumping was performed on Whitson and Sunjerga
(2012)26 Eagle Ford compositions to match the compositions cited in Walters et al.
(2013)25 in order to use the latter’s preference factors. Columns 3 and 4 of Table 2.3
show the lumped components and their compositions, respectively. The Lee-Kesler27
mixing rules in the WinpropTM simulator (A commercial multiphase, multicomponent
thermodynamic program from CMG– Computer Modeling Group) are used to calculate
the critical properties of the lumped components. Further, the compositions of C6-C14
and C14+ were split into Aromatics (Aros) and Saturates (Sats) with an assumption that
amount of saturated compounds is 1.8 times the amount of aromatics, as shown in Table
2.3. However, if this fraction was assumed to be 1.5 and 2, the compositions of the free

16
oil phase after partitioning were not significantly different. Columns 5 and 6 of Table 2.3
arithmetically combine the components in order to use the phase behavior calculation
simulator (Winprop) to plot the PT graphs. The composition of free oil in the last two
columns of Table 2.3 is used in Winprop to produce PT plots. Table 2.3 shows the
lumping, splitting, and combining components of the original Eagle Ford oil as an
exercise. In the case when oil is in contact with organic matter (kerogen), to account for
the presence of kerogen, the free oil was fractionated in the columns 3 and 4 by using the
preference factors cited in Walters et al. (2013)25 before combining the components in the
last two columns.
The composition of the free Eagle Ford oil is tabulated in Table 2.4 along with the
compositions of the free oil phase after partitioning in different maturity type II kerogens.
It can be observed from Table 2.4 that the amounts of lighter components decrease and
the amounts of heavier components increase in the fractionated or partitioned free oil as
the kerogen matures from 50% conversion to 100% conversion. This exercise was
implemented in order to see the effect of the maturity of kerogen on saturation pressures
of any oil – Eagle Ford oil as an example – which is fractionated into free and retained
phases by kerogen. The trend in the saturation pressure of the different oil fractionated by
a type II kerogen of different maturity (HI) was observed. Winprop generated the two-
phase envelope in the P-T plot (Figure 2.7). The changes in bubble point pressure of free
oil partitioned from Eagle Ford oil with the maturity of type II kerogen is shown in the
Table 2.5 and Figure 2.7. It is evident from the Table 2.5 and Figure 2.7 that the bubble
point pressure decreases with maturity of the present day kerogen. This contradicts
observation by di Primio et al. (1998)28 where they used sets of data collected from
17
experiments of artificial maturation of a Duvernay kerogen sample and composition of
real oil samples. As mentioned in Walters et al. (2013)25, the presence of polar-rich fluids
in expelled free fraction at higher levels of thermal maturation is the reason for such a
contrast. This, however, is not a flaw in the model; rather, it indicates that the
composition of the primary expelled products is not fixed but keeps changing as the
evolved polar compounds undergo secondary cracking reactions. During the maturation
of kerogen, the crosslink density of kerogen increases10. The change in macromolecular
structure of kerogen with maturity changes its behavior in absorbing oils. The bubble
point of original Eagle Ford oil lies close to the bubble points of oil in presence of
kerogen with maturity of 162.5 mg/g TOC (75% HI) (Table 2.5 and Figure 2.7).
The actual ratios of saturates to aromatics in the Eagle Ford oil26 were not known.
Three ratios of saturates to aromatic compounds (1.5, 1.8, and 2.0) were used to
determine the sensitivity to this number, and the results are presented in Table 2.6. The
composition of free oil does not change significantly when different ratios of saturates to
aromatic compounds were used in the initial lumping of Eagle Ford oil. Therefore, all
the calculations were performed with a saturates to aromatics ratio of 1.8 during the
process of lumping for the remainder of the paper.
2.5.2 Bubble Points of In-situ Oils
A more realistic field-related analysis was performed for the Eagle Ford play in the
second part of this chapter. The Eagle Ford oil composition was treated as free oil
because the oil produced in the Eagle Ford play is actually the free oil phase present in
the Eagle Ford shales. Previously it has been suggested that the kerogen found in the
Eagle Ford shale is of type II29,30; however, some researchers31,32 reported sulfur-rich,

18
Type IIS kerogen in Eagle Ford samples, with maturities ranging from 0-750 mg HC/g
TOC hydrogen index29,33. The spread in the hydrogen index (HI) of Eagle Ford kerogen
is shown in Figure 2.8; the sample data for Eagle Ford were taken from Romero
(2014)29. The compositions of the ‘in-situ’ oil were back calculated from the free oil
Eagle Ford compositions, again using the preference factors shown in Table 2.2 for Type
II and IIS kerogen. For realistic assumptions, the preference factors for kerogen with HI
values of 50%, 75%, and 100% HI (HI = 650 mg HC/g TOC)25 were used in the
calculation as they fall in the range of the HI observed for Eagle Ford kerogen as
discussed earlier. Table 2.7 lists the compositions of the free Eagle Ford oil for a specific
case of 162.5 mg HC/g TOC Type II kerogen that is produced and compositions of in-situ
Eagle Ford oil that are actually proposed to be present in the formation. This in-situ oil
(Figure 2.9a) partitions into free (Figure 2.9b) and retained oil (Figure 2.9c) phases.
Figure 2.9 shows the compositions of the in-situ oil and the two phases (free and retained
oil) that are partitioned from the in-situ oil. It is shown in Table 2.7 that the free oil phase
has a larger amount of lighter and non-polar compounds while the in-situ oil is enriched
in heavier and polar compounds. The composition of the free oil phase (Figure 2.9b) and
the composition of retained oil in the absorbed phase (Figure 2.9c) indicate that the
kerogen expels saturates more than aromatics and polar compounds, and thus tends to
retain aromatics and heavier polar components. This observation is made for the
particular case of Type II kerogen with 162.5 mg HC/g TOC HI; however, it has also
been observed in previous studies5,34,35. The composition of retained oil matches well
with general understanding of the composition of bitumen which is believed to be rich in
aromatic and heavier polar compounds
19
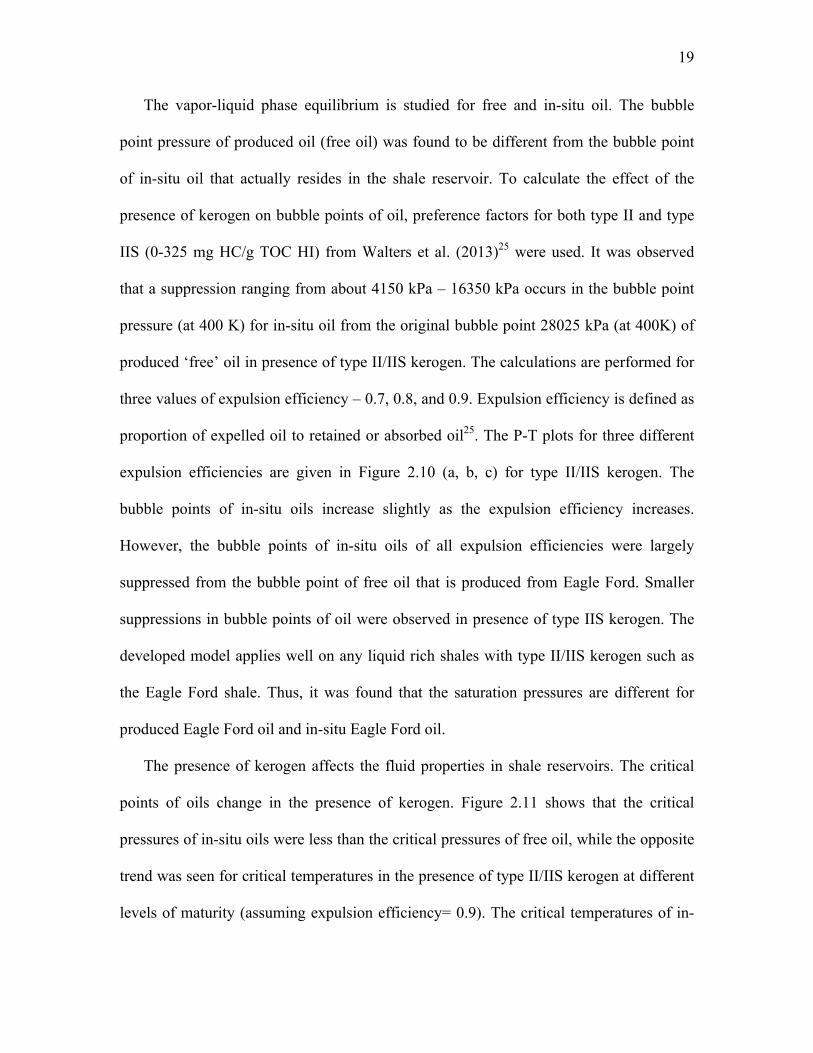
The vapor-liquid phase equilibrium is studied for free and in-situ oil. The bubble
point pressure of produced oil (free oil) was found to be different from the bubble point
of in-situ oil that actually resides in the shale reservoir. To calculate the effect of the
presence of kerogen on bubble points of oil, preference factors for both type II and type
IIS (0-325 mg HC/g TOC HI) from Walters et al. (2013)25 were used. It was observed
that a suppression ranging from about 4150 kPa – 16350 kPa occurs in the bubble point
pressure (at 400 K) for in-situ oil from the original bubble point 28025 kPa (at 400K) of
produced ‘free’ oil in presence of type II/IIS kerogen. The calculations are performed for
three values of expulsion efficiency – 0.7, 0.8, and 0.9. Expulsion efficiency is defined as
proportion of expelled oil to retained or absorbed oil25. The P-T plots for three different
expulsion efficiencies are given in Figure 2.10 (a, b, c) for type II/IIS kerogen. The
bubble points of in-situ oils increase slightly as the expulsion efficiency increases.
However, the bubble points of in-situ oils of all expulsion efficiencies were largely
suppressed from the bubble point of free oil that is produced from Eagle Ford. Smaller
suppressions in bubble points of oil were observed in presence of type IIS kerogen. The
developed model applies well on any liquid rich shales with type II/IIS kerogen such as
the Eagle Ford shale. Thus, it was found that the saturation pressures are different for
produced Eagle Ford oil and in-situ Eagle Ford oil.
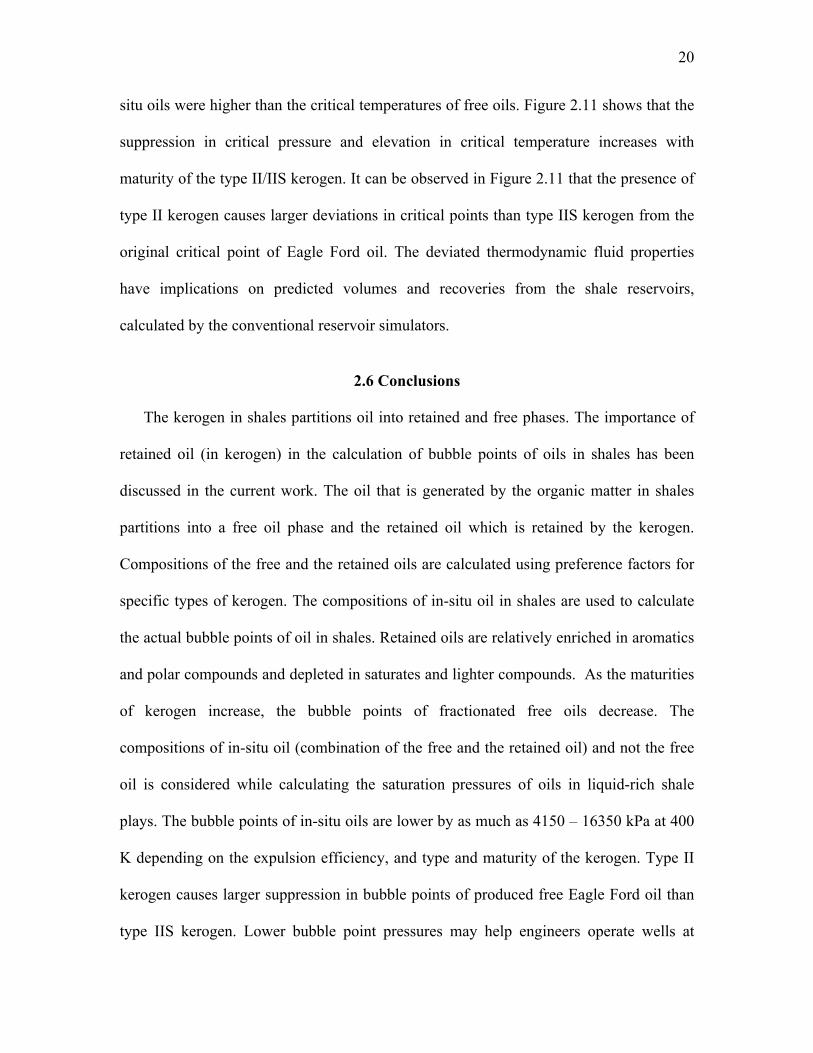
The presence of kerogen affects the fluid properties in shale reservoirs. The critical
points of oils change in the presence of kerogen. Figure 2.11 shows that the critical
pressures of in-situ oils were less than the critical pressures of free oil, while the opposite
trend was seen for critical temperatures in the presence of type II/IIS kerogen at different
levels of maturity (assuming expulsion efficiency= 0.9). The critical temperatures of in-
20
situ oils were higher than the critical temperatures of free oils. Figure 2.11 shows that the
suppression in critical pressure and elevation in critical temperature increases with
maturity of the type II/IIS kerogen. It can be observed in Figure 2.11 that the presence of
type II kerogen causes larger deviations in critical points than type IIS kerogen from the
original critical point of Eagle Ford oil. The deviated thermodynamic fluid properties
have implications on predicted volumes and recoveries from the shale reservoirs,
calculated by the conventional reservoir simulators.
2.6 Conclusions
The kerogen in shales partitions oil into retained and free phases. The importance of
retained oil (in kerogen) in the calculation of bubble points of oils in shales has been
discussed in the current work. The oil that is generated by the organic matter in shales
partitions into a free oil phase and the retained oil which is retained by the kerogen.
Compositions of the free and the retained oils are calculated using preference factors for
specific types of kerogen. The compositions of in-situ oil in shales are used to calculate
the actual bubble points of oil in shales. Retained oils are relatively enriched in aromatics
and polar compounds and depleted in saturates and lighter compounds. As the maturities
of kerogen increase, the bubble points of fractionated free oils decrease. The
compositions of in-situ oil (combination of the free and the retained oil) and not the free
oil is considered while calculating the saturation pressures of oils in liquid-rich shale
plays. The bubble points of in-situ oils are lower by as much as 4150 – 16350 kPa at 400
K depending on the expulsion efficiency, and type and maturity of the kerogen. Type II
kerogen causes larger suppression in bubble points of produced free Eagle Ford oil than
type IIS kerogen. Lower bubble point pressures may help engineers operate wells at

21
lower pressures without risking excess gas production. This would help increase rates and
economics of production.

22
Table 2.1. Different types of kerogen and their source and depositional settings. Modified from McCarthy et al., 2011)36
Kerogen Type Source Material Depositional setting I Algae Lacustrine II Plankton and some algae Marine III Higher Plants Terrestrial IV Reworked, oxidized material Varied
Table 2.2. Preference factors for Type II and IIS kerogen of varying maturity taken from Walters (2013). The original HI is 650 mg/g TOC and preference factors for 50% conversion (325), 75% conversion (162.5.5), and 100% conversion (no potential for further generation) are mentioned in the table. The preference factors increase from low maturity kerogen (50% conversion) to higher maturity kerogen (50% conversion). For a particular maturity, the preference factor usually increases from lighter components to heavier components and from saturated to aromatics for components with similar weights. Sats indicates fraction of saturated compounds, Aros indicates fraction of aromatic compounds and NSOs indicates fraction of polar compounds.
Type I Type IIS
Lumped Components
Preference factor, 𝑃( (50% HI)
Preference factor, 𝑃( (75% HI)
Preference factor, 𝑃(
(100% HI)
Preference factor, 𝑃( (50% HI)
Preference factor, 𝑃( (75% HI)
Preference factor,𝑃(
(100% HI) Methane 0.000567 0.00301 0.024565 0.002189 0.034156 0.06244 Ethane 0.000567 0.002658 0.017853 0.001979 0.02538 0.043657
Propane 0.000523 0.002171 0.012045 0.001662 0.017628 0.028588 Butane 0.000491 0.001801 0.008208 0.00142 0.012351 0.018848 Pentane 0.000566 0.001857 0.007037 0.0015 0.010667 0.01534
C6-C14 Sats 0.000879 0.001909 0.003116 0.001715 0.004847 0.005452 C6-C14 Aros 0.016487 0.06029 0.214116 0.046181 0.235041 0.304303
C14+ Sats 0.001184 0.001554 0.000849 0.001605 0.001415 0.001101 C14+ Aros 0.015535 0.045923 0.276071 0.033195 0.29098 0.305952 C14+ NSOs 1 1 1 1 1 1

23
Components from
Whitson and Sunjrega,
2012
Mole fractions
from Whitson
and Sunjrega,
2012
Lumped Components to match components in Walters et al., 2013
Composition of Lumped
Components (saturated=1.8
aromatics), mole fractions
Re-lumped components to
produce PT plots
Compositions to produce PT plots (xi, mol
fractions)
H2S 0.00 N2 0.13 Methane 0.5091
CO2 0.0195 Ethane 0.0625 C1 0.4885 C1 0.5091 Propane 0.0350 C2 0.0625 C2 0.0625 Butane 0.0218 C3 0.035 C3 0.0351 Pentane 0.0131
I-C4 0.0081 C6-C14 0.2267 N-C4 0.0137 C4 0.0218 C14+ 0.1186 I-C5 0.0063 C14+ NSOs 0.0132 N-C5 0.0068 C5 0.0131 Sum 1
C6 0.0096 C7 0.0389 C8 0.037 C6-C14 0.2267 C9 0.0317 C6-
C14 C6-C14 Sats 0.1457
C10 0.0279 C6-C14 Aros 0.0809 C11 0.0245 C12 0.0215 C13 0.0189 C14 0.0167 C15 0.0147 C14+ 0.1186 C16 0.0129 C14+ C14+ Sats 0.0762 C17 0.0114 C14+ Aros 0.0423 C18 0.0101 C14+ NSOs 0.0132 C19 0.00889 C20 0.00787 C21 0.00697 C22 0.00617 C23 0.00548 C24 0.00487 C25 0.00433
C26+ 0.0381
Table 2.3. Systematic lumping of Whitson and Sunjrega (2012) oil composition to match Walters (2013) compositions for ease in using the latter’s preference factors. The column 1 and 2 described the Eagle Ford oil composition from Whiston and Sunjrega (2012). Further, the C6-C14 and C14+ were splitted into Aromatics (Aros) and Saturated (Sats). The column 3 and 4 describes the systematic lumping using Lee-Kesler (1975) mixing rules. The column 5 and 6 describes the arithmetic re-lumping for use in Winprop to plot PT diagrams.

24
Table 2.4. Compositions of free oil in contact with type II kerogen of 325 mg HC/g TOC HI, 162.5 mg HC/g TOC HI, and 0 mg HC/g TOC HI, respectively. The column 1 shows the original Eagle Ford composition that was partitioned by kerogen as it matures from 50% conversion of kerogen to 100% conversion. The original HI is 650 mg/g TOC.
Components Original xi
(Eagle Ford oil)
New xi partitioned
from original xi with Type
II (of 50% HI) kerogen
New xi partitioned
from original xi with Type II (of
75% HI) kerogen
New xi partitioned
from original xi with Type II (of
100% HI) kerogen
c1 0.5091 0.6251 0.5476 0.4400 c2 0.0625 0.0767 0.0713 0.0644 c3 0.0350 0.0444 0.0436 0.0433 c4 0.0218 0.0284 0.0292 0.0311 c5 0.0131 0.0161 0.0174 0.0196
c6-c14 0.2267 0.1571 0.2046 0.2796 c14+ 0.1186 0.0522 0.0861 0.1206
c14+ NSOs 0.0132 0.0001 0.0003 0.0015
Table 2.5. Changes in bubble point pressure with maturity of kerogen (kerogen matures from 50% conversion to 100% conversion). The original HI is 650 mg/g TOC. The bubble point of original Eagle Ford oil lies in between the bubble point of oils in presence of kerogen of 100% conversion and 75% conversion.
Case Temperature (K) Bubble point Pressure (Psia)
Original Eagle Ford (EF) Oil 400 28025EF Oil with Type II Kerogen (50%
conversion)400 31290
EF Oil with Type II Kerogen (75% conversion)
400 29550
EF Oil with Type II Kerogen (100% conversion)
400 20980

25
Table 2.6. Composition of free oil when different ratios of saturated to aromatic compounds was used in the initial lumping of Eagle Ford oil (Whitson, 2012) to match compositions of Walters (2013).
Scenario 1 Scenario 2 Scenario 3 Components
Free oil composition (x) when saturates
=2*aromatics
Free oil composition (x) when
saturates=1.5*aromatics
Free oil composition (x) when
saturates=1.8*aromatics c1 0.61393 0.62505 0.62506 c2 0.07537 0.07673 0.07673 c3 0.04366 0.04441 0.04441 c4 0.02789 0.02835 0.02835 c5 0.01581 0.01609 0.01610
c6-c14 0.15444 0.14447 0.15708 c14+ 0.06888 0.06486 0.05219 c14+ NSOs
0.00002 0.00002 0.00007

26
Table 2.7. Back calculated in-situ oil compositions from produced ‘free’ Eagle Ford oil when in presence of Type II kerogen of 162.5 mg HC/g TOC HI. The original value of HI is 650 mg/g TOC.
Components
Free oil compositions of
Eagle Ford (mole fractions)
In-situ oil compositions in presence of kerogen of Type
II (75% HI), mole fractions
c1 0.5091 0.2774 c2 0.0625 0.0335 c3 0.0350 0.0184 c4 0.0218 0.0113 c5 0.0131 0.0068
c6-c14 0.2267 0.2295 c14+ 0.1186 0.1050
c14+ NSOs 0.0132 0.3181

27
Figure 2.1. A schematic (X-Z cross section) of a multistage hydraulically fractured horizontal well used in hydrocarbon production from shales. The inset shows the fluid system – kerogen or organic matter in equilibrium with the retained oil and the expelled oil.
Figure 2.2. van Krevelen diagram, modified from McCarthy et al., (2011)36. The model unit used for molecular dynamic simulations is shown by the red dot. Type II kerogen was used in all of the thermodynamic representations.

28
Figure 2.3. Multicomponent equilibrium between free oil and retained oil is shown schematically. The retained oil is staying inside the circular boundary of kerogen shown in the schematic. According to the hypothesis put forward in this work, it is the free oil that is produced at the surface. Kerogen is shown as a crosslinked polymer in golden color.
Original type II kerogen Kerogen swelled with decane (20% by mass)
Figure 2.4. Swelling of kerogen from molecular dynamics simulations. The figure on the left shows a bulk molecular model of kerogen and the figure at the right shows the same bulk kerogen swelled with dissolved decane in the matrix.

29
Figure 2.5. A schematic illustration of swelling of kerogen in the presence of solvent. The kerogen behaves as a crosslinked polymer that swells in presence of a solvent.
Figure 2.6. A schematic showing equilibrium between in-situ oil and gas. It is this vapor-liquid equilibrium that should be studied to calculate the true bubble point in shales. In-situ oil consists of retained and free oil. The retained and free oil phases are in multicomponent equilibrium

30
Figure 2.7. Phase envelopes (pressure-temperature bubble and dew point curves) with different maturities are shown for type II kerogen. The original HI value is 650 mg HC/g total organic content.
Figure 2.8. Modified Ven Krevelen diagram showing the spread of hydrogen index (HI) of kerogen for selected Eagle Ford samples (after Romero, 201430). The kerogen in Eagle Ford varies in maturity ranging from 0-750 mg HC/g TOC hydrogen index.

31
(a)
(b)
(c)
Figure 2.9. Compositions of in-situ, free and retained (absorbed) oil with Eagle Ford oil as example. The figure shows that polar and heavier components are preferentially retained in the kerogen.

32
(a)
(b)
(c)
Figure 2.10. Difference in bubble point pressure of produced Eagle Ford oil and in-situ Eagle Ford oil shown in the pressure temperature plot, calculated for three values of expulsion efficiency in (a), (b), and (c). Each of (a), (b), (c) shows the PT plots for original Eagle Ford oil, in-situ oil in presence of Type II/IIS in maturity of 50, 75, 100 %HI. Arrows indicate the direction of increasing maturity of kerogen.
0
5000
10000
15000
20000
25000
30000
200 300 400 500 600 700 800 900
Pressure(kPa)
Temperature(K)
ExpulsionEfficiency=0.7
EagleFord(freeoil)
In-situoil_TypeII_50%HI
In-situoil_TypeII_75%HI
In-situoil_TypeII_100%HI
0
5000
10000
15000
20000
25000
30000
200 300 400 500 600 700 800 900
Pressure(kPa)
Temperature(K)
ExpulsionEfficiency=0.8
EagleFord(freeoil)
In-situoil_TypeII_50%HI
In-situoil_TypeII_75%HI
In-situoil_TypeII_100%HI
0
5000
10000
15000
20000
25000
30000
200 300 400 500 600 700 800 900
Pressure(kPa)
Temperature(K)
ExpulsionEfficiency=0.8
EagleFord(freeoil)
In-situoil_TypeIIS_50%HI
In-situoil_TypeIIS_75%HI
In-situoil_TypeIIS_100%HI
0
5000
10000
15000
20000
25000
30000
200 300 400 500 600 700 800 900
Pressure(kPa)
Temperature(K)
ExpulsionEfficiency=0.9
EagleFord(freeoil)
In-situoil_TypeIIS_50%HI
In-situoil_TypeIIS_75%HI
In-situoil_TypeIIS_100%HI

33
Figure 2.11. Changing critical points of oils because of interaction with kerogen of type II/IIS with maturity varying 50-100% HI at 0.9 expulsion efficiency is shown in this figure. The critical pressures of in-situ oils are less than critical pressures of free oils; however, opposite trend is observed for critical temperatures. The solid non-circular markers show the critical points of in-situ oils in presence of type IIS kerogen while the open markers show the critical points in presence of type II kerogen. It can be observed that type II kerogen causes larger suppression in critical pressures as well as larger elevation in critical temperatures of oil. However, for both kinds of kerogen, the deviations in critical properties decreases with the maturity of the kerogen. Each data label means - (temperature, pressure).
643.39,16,406.43
840.07,5,269.60
810.88,6,535.76
748.70,9,101.84
819.56,6,197.60
739.77,9,965.96
718.70,12,049.97
4000
6000
8000
10000
12000
14000
16000
18000
600 650 700 750 800 850 900
Pressure(kPa)
Temperature(K) Expulsion Efficiency=0.9
EagleFord(freeoil)
In-situoil_TypeII_50%HI
In-situoil_TypeII_75%HI
In-situoil_TypeII_100%HI
In-situoil_TypeIIS_50%HI
In-situoil_TypeIIS_75%HI
In-situoil_TypeIIS_100%HI

CHAPTER 3
KEROGEN SWELLING AND CONFINEMENT: EFFECT ON
THERMODYNAMIC PROPERTIES OF
HYDROCARBON FLUIDS
3.1 Abstract
Kerogen is organic matter found in shales which are the primary source of oil and gas
deposits throughout the world. The kerogen is made up of heterogeneous complex
polymer-like organic material and has been known to swell in the presence of organic
solvents. The current work performs experiments and molecular simulations to
understand swelling of kerogen and implications of swelling of kerogen on
thermodynamic properties of hydrocarbon fluids. The effect of confinement of fluids in
nanopores of kerogen was identified as well. Kerogen was isolated from whole shale
samples and characterized using data from SEM, thermogravimetric analyzer (TGA),
differential scanning calorimeter (DSC), and nitrogen adsorption experiments. The
swelling behavior of this kerogen with decane was analyzed using simple test-tube
swelling and dynamic light scattering experiments. The TGA and DSC were used to
analyze the behavior of decane that was sorbed in the kerogen. Molecular Dynamic (MD)
simulations were performed to assess swelling of kerogen with various solvents over a
range of temperature and pressure conditions. The MD simulations reveal preferential

35
uptake of hydrocarbon fluids and variation in kerogen swelling in the presence of
different solvents. DSC experiments were performed for oil and oil-laden kerogen to
determine the effect of kerogen swelling on the oil’s bubble point. The results from TGA
and DSC show that kerogen suppresses the boiling point of decane due to the effect of
confinement. However, the suppression is larger when oil (consider the oil as a
multicomponent mixture) was used. This happened because of the effect of kerogen
swelling (splitting of oil in retained and free phase and the effect of confinement
combined). The experiments indicate that the kerogen changes the thermodynamic
properties of fluids due to the effect of confinement and preferential uptake. This has
implications on pressure-volume-temperature (PVT) properties of fluids in shale
reservoirs.
3.2 Introduction
Kerogen is a complex, carbonaceous, heterogeneous compound, which is believed to
be the precursor of oil and gas found in the subsurface. The kerogen plays a key role in
storage and recovery of hydrocarbons from shale. Current techniques of exploitation of
hydrocarbons from shales leave over 80% of generated hydrocarbons in the subsurface37.
Based on the elemental H/C and O/C ratio, the kerogen is classified to be primarily of IV
types with each of the type I-III being in the oil or gas window according to their
maturity. Type IV designates an over-mature kerogen, resembles coal, and has minimum
potential to generate hydrocarbons (Figure 3.1).
To perform experiments, a type I kerogen was isolated from Green River Formation
Shale. This kerogen sample was then analyzed with a scanning electron microscope
(SEM) and Thermogravimetric analyzer (TGA). The TGA data (Figure 3.2) show that the

36
isolated kerogen is over 75% organic matter based on the mass loss below 500 oC. The
pores found in isolated kerogen, as evident in its SEM image (Figure 3.3), have
dimensions in the nanometer range as has also been observed by other authors3. The
nitrogen isotherm (Figure 3.4a) of the isolated kerogen has a hysteresis throughout the
relative pressure range of 0.1 to 1.0. The Brunauer–Emmett–Teller (BET)38 specific
surface area of the isolated kerogen is 13.37 m²/g, and the average pore size calculated by
Barret-Joyner-Halenda (BJH)39 method from desorption data is 17.69 nm (Figure 3.4b).
These nanopores constitute organic porosity in shales. Hydrocarbon gases and liquids in
the kerogen pores and adsorbed on the wall of kerogen may be absorbed in the kerogen
leading to expansion in kerogen volume. Such swelling in kerogen is much like swelling
of coal with the exception that kerogen swelling has nonspecific interactions. These
sorbed hydrocarbons in the kerogen can be a potential hydrocarbon source that is still
untapped. The swelling behavior of kerogen in the presence of hydrocarbons fluids, at
reservoir conditions, was therefore thought to be of importance and studied in this work.
The experiments were designed for a binary mixture of kerogen and decane to
understand the change in the thermodynamic properties of the sorbed decane. To do this,
swollen kerogen samples were prepared by fully saturating kerogen in decane by keeping
the two together for 24 hours. Twenty-four hours was chosen because no further swelling
response was observed after 24 hours, as also pointed out in previous swelling studies6,10–
15,40,41. A swelling ratio (Qv) is defined as the ratio of the volume of swollen kerogen to
the original volume of kerogen. The kerogen absorbed the decane and swelled in volume
over 24 hours. Traditional test-tube swelling experiments were performed on this kerogen
and decane by recording the height of the kerogen bed in a flat bottom test-tube before

37
and after swelling with decane. Dynamic Light Scattering (DLS) experiments were
performed on kerogen particles before and after swelling (Figure 3.5).
MD simulations are useful since experiments are difficult to perform at the high
pressures that are usually seen in the subsurface. Ungerer et al. (2015)16 have developed
realistic kerogen models that are used in this work to perform molecular dynamic
simulations of kerogen with organic solvents. These simulations are performed at
reservoir temperature and pressure on a model of type II kerogen to understand its
swelling in presence of 17 organic solvents chosen in this study
TGA and DSC experiments were performed on sorbed decane and pure decane as
well as on oil and sorbed oil to investigate the effect of kerogen sorption (and therefore
its swelling) and effect of confinement on the thermodynamic properties of the fluids.
The oil was collected from Dakota Formation in Clay Basin Field, Daggett County, Utah.
The sorbed decane sample consisted of swollen decane-laden kerogen. The TGA and
DSC for pure decane and sorbed decane were run in the temperature regime where
kerogen is inert based on the TGA and DSC runs for kerogen performed earlier (refer to
Figure 3.2 for TGA and the results section for DSC). The DSC runs were also performed
for the oil and kerogen-oil binary mixture to understand the effect of preferential swelling
of components by kerogen and its effect of the thermodynamic properties of the oil
absorbed by kerogen. The MD simulations revealed preferential swelling of kerogen
based on the hydrocarbon solvent used (Figure 3.6). Assuming oil as a mixture of
multicomponent hydrocarbons, the preferential swelling of kerogen would change the
composition of the absorbed phase, thereby changing the PVT behavior of the absorbed
oil. The pure-decane and kerogen experiments revealed the effect of confinement.

38
However, the oil and oil-kerogen DSC experiments revealed the combined effect of
preferential swelling of kerogen and effect of confinement.
3.3 Method
3.3.1 Experimental
Kerogen was isolated from the whole rock sample by series of acid treatments based
on previous kerogen isolation work42–47. The kerogen was extracted from Green River
Formation- skyline 16 core. The average organic matter in powdered oil shales were
estimated to be 11.5% weight of the total oil shale48. Based on Elemental analysis48, this
kerogen falls in type I oil shale category on the van Krevelen classification diagram.
First, the carbonate minerals are removed by treating 2.5 grams of shale rock with 30
ml of 5N HCl for 48 hours. The remaining 1.0 g of the residual rock is treated with 10 ml
of 12N HCl and washed with 10 ml of DI water. The residual rock was heated in a
vacuum to 110 oC and was ready for the next step which was removal of pyrite minerals.
To remove the pyrite minerals, if any, from the residual rock, it was treated with 20%
(wt) HNO3 for 48 hours followed by wash with DI water and oven dry. The dry residual
rock was then treated with 5N HCl followed by 25 ml of 48% (wt) HF for 48 hours. The
residual was washed with DI water followed by oven drying. The weight of the rock at
each step was documented. In order to calculate the amount of organic and inorganic
matter left in the residual rock, thermogravimetric analysis (TGA) was performed on the
residual rock sample. The TGA data revealed that over 75% of the residual sample
(powder form) is organic. The experiments with kerogen and kerogen-decane binary
mixture were designed using differential scanning calorimeter (DSC) and
thermogravimetric analyzer (TGA) as shown in Figure 3.7 and Figure 3.8, respectively.

39
First, 60 mg of kerogen sample is dried at 105-110 °C for 1 hour in an oven and cooled
overnight in a vacuum oven until shortly before the swelling experiments. Three samples
of 10 mg kerogen each are treated with excess decane in a mini-centrifuge tube and three
others are packed in airtight tubes. The tubes with kerogen-decane are centrifuged at
6000 rpm for 3 cycles of 5 min duration each. The mixture is kept in a flat bottom test
tube. The initial height of kerogen (h1) in the tube is measured by a Vernier caliper after
the third centrifuge cycle. The sample is left for 24 hours and the sample height is
measured again (h2). Swelling of kerogen was calculated using the test tube method as
Qv = h2/h1. The three swollen samples are then used for further experiments. Differential
scanning calorimetry and thermogravimetric analysis are performed for the original
kerogen and the swollen kerogen to measure the boiling point of sorbed decane. Dynamic
Light Scattering for particle size analysis was performed using on original and swollen
kerogen and the results were compared.
For the differential scanning calorimeter, excess solvent layer in tubes that is
accumulated over the swollen kerogen bed is removed and the sample is transferred to
DSC pans. Weight of each empty DSC pan is measured. Experiments were performed
under atmospheric pressure with an inert gas (nitrogen) flow rate of 40 mL/min. Before
each measurement, the DSC cell was purged with inert gas (nitrogen) for at least 10 min.
Hermetically sealed and pierced samples were cooled to −120 °C at a rate of 5°C/min,
equilibrated at −120 °C for 10 min, and then heated to 200°C. At 200 °C, the temperature
remained constant for 10 min before stopping the run. This procedure was repeated to run
DSC for pure decane (to compare with absorbed decane) as well as for Clay Basin oil
(Figure 3.9). Similarly, the kerogen and kerogen-decane samples were analyzed in the

40
thermogravimetric analyzer. The samples were treated at a ramp-rate of 5°C/min and the
weight of the samples decreased as the temperature was increased due to the loss of
volatiles. A weight loss curve was obtained from the thermogravimetric data.
Each of the DSC runs discussed above were preceded by the ‘Baseline’ run. The
baseline is the response with both crucibles empty in the DSC, yielding a signal bias
inherent in the system49. This ‘Baseline’ allows removal of system bias from the data.
Further, the DSC was calibrated using the standard procedure laid out in ISO 11357-150.
The uncertainties could be estimated to be not more than 0.3 K and 0.5% which are
defined by ISO 11357-1 for temperature and sensitivity calibrations, respectively. The
repeatability error is the smallest possible uncertainty of measurement of calorific
measurements51.
3.3.2 Modeling
The current modeling work involves using xyz coordinates of atoms in one of the
published kerogen models16 (Figure 3.10) and assigning parameters using the General
Amber Force Field (GAFF)17. GAFF has been modified from the Amber Force Field to
include organic molecules. A remodeled kerogen structure was then used to measure the
bulk properties of kerogen, including swelling in presence of different organic solvents,
by performing Molecular Dynamics (MD) simulations. A MD modeling workflow has
been developed (discussed in supplementary information) to study kerogen-hydrocarbon
interactions using the GAFF implemented in the Large-scale Atomic/Molecular
Massively Parallel Simulator (LAMMPS)21 tool. The density of kerogen and probability
distribution function of the C-C bond lengths were calculated. Volumetric swelling of
kerogen in the presence of organic solvents was studied to understand the interaction of
41
kerogen and fluids. The force field GAFF was originally developed to model organic
molecules. The bulk kerogen model was created after a systematic simulated annealing
procedure of 10 individual kerogen molecules. A relaxed bulk kerogen model in its native
state was then used to determine properties like density of bulk kerogen, and swelling of
kerogen with solvents.
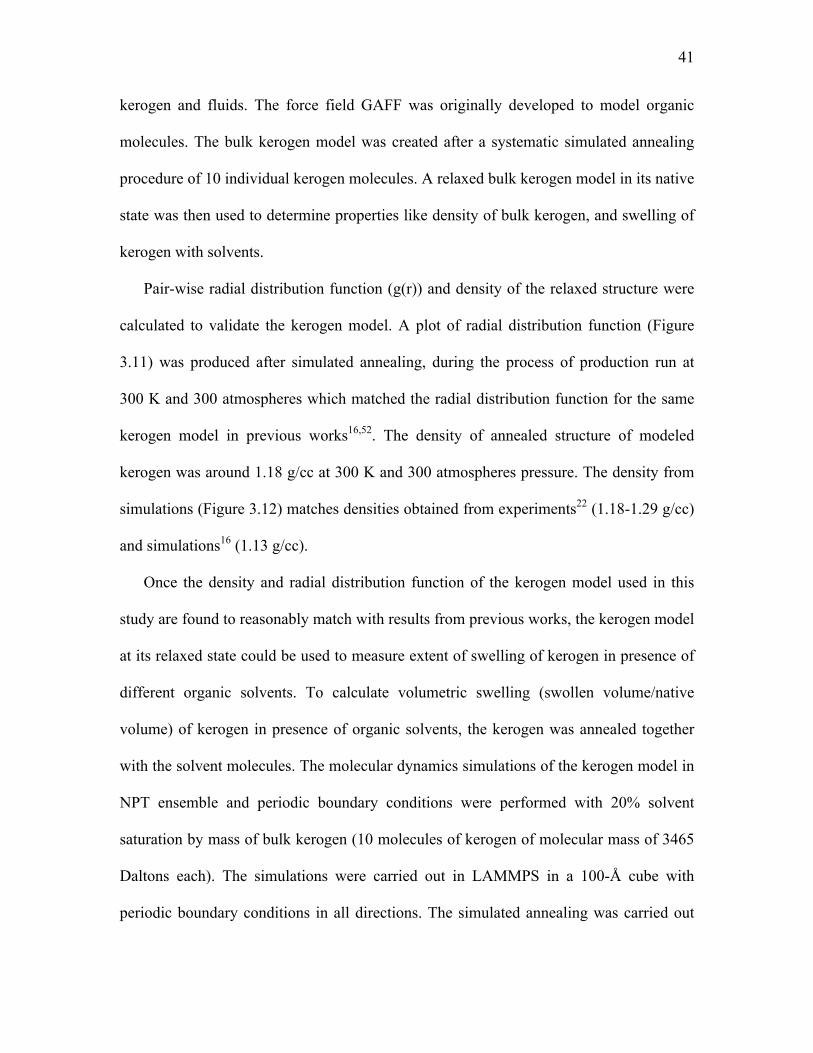
Pair-wise radial distribution function (g(r)) and density of the relaxed structure were
calculated to validate the kerogen model. A plot of radial distribution function (Figure
3.11) was produced after simulated annealing, during the process of production run at
300 K and 300 atmospheres which matched the radial distribution function for the same
kerogen model in previous works16,52. The density of annealed structure of modeled
kerogen was around 1.18 g/cc at 300 K and 300 atmospheres pressure. The density from
simulations (Figure 3.12) matches densities obtained from experiments22 (1.18-1.29 g/cc)
and simulations16 (1.13 g/cc).
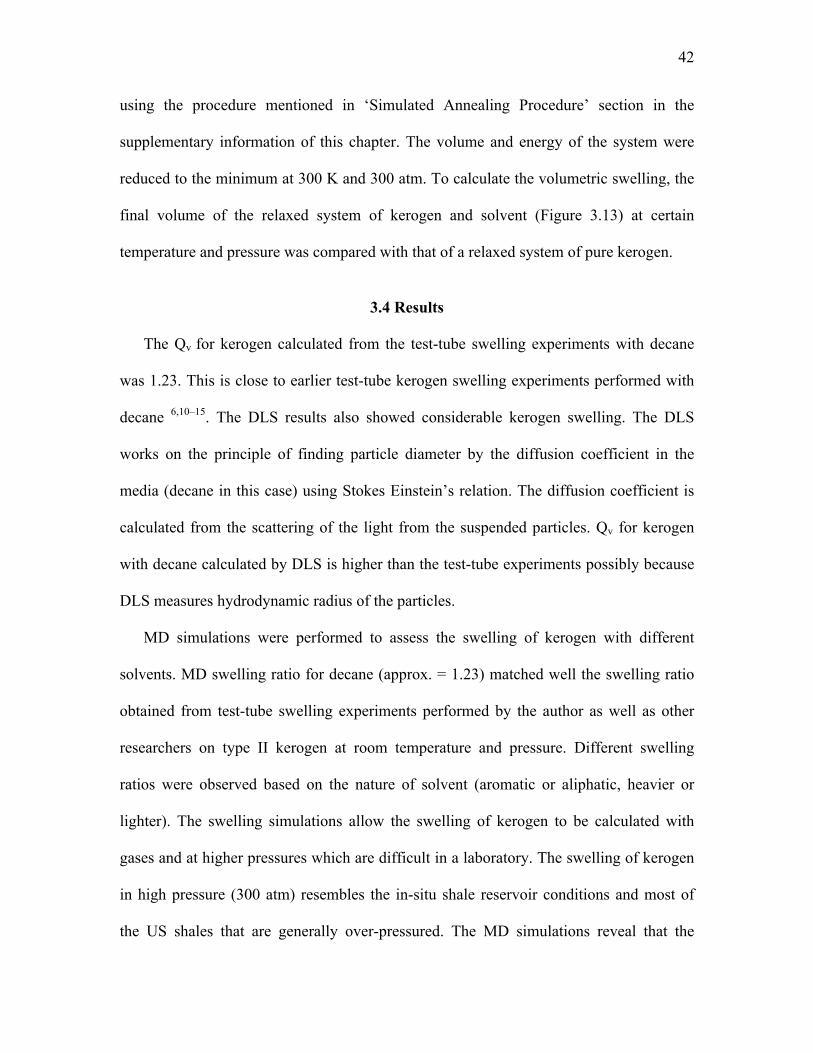
Once the density and radial distribution function of the kerogen model used in this
study are found to reasonably match with results from previous works, the kerogen model
at its relaxed state could be used to measure extent of swelling of kerogen in presence of
different organic solvents. To calculate volumetric swelling (swollen volume/native
volume) of kerogen in presence of organic solvents, the kerogen was annealed together
with the solvent molecules. The molecular dynamics simulations of the kerogen model in
NPT ensemble and periodic boundary conditions were performed with 20% solvent
saturation by mass of bulk kerogen (10 molecules of kerogen of molecular mass of 3465
Daltons each). The simulations were carried out in LAMMPS in a 100-Å cube with
periodic boundary conditions in all directions. The simulated annealing was carried out
42
using the procedure mentioned in ‘Simulated Annealing Procedure’ section in the
supplementary information of this chapter. The volume and energy of the system were
reduced to the minimum at 300 K and 300 atm. To calculate the volumetric swelling, the
final volume of the relaxed system of kerogen and solvent (Figure 3.13) at certain
temperature and pressure was compared with that of a relaxed system of pure kerogen.
3.4 Results
The Qv for kerogen calculated from the test-tube swelling experiments with decane
was 1.23. This is close to earlier test-tube kerogen swelling experiments performed with
decane 6,10–15. The DLS results also showed considerable kerogen swelling. The DLS
works on the principle of finding particle diameter by the diffusion coefficient in the
media (decane in this case) using Stokes Einstein’s relation. The diffusion coefficient is
calculated from the scattering of the light from the suspended particles. Qv for kerogen
with decane calculated by DLS is higher than the test-tube experiments possibly because
DLS measures hydrodynamic radius of the particles.
MD simulations were performed to assess the swelling of kerogen with different
solvents. MD swelling ratio for decane (approx. = 1.23) matched well the swelling ratio
obtained from test-tube swelling experiments performed by the author as well as other
researchers on type II kerogen at room temperature and pressure. Different swelling
ratios were observed based on the nature of solvent (aromatic or aliphatic, heavier or
lighter). The swelling simulations allow the swelling of kerogen to be calculated with
gases and at higher pressures which are difficult in a laboratory. The swelling of kerogen
in high pressure (300 atm) resembles the in-situ shale reservoir conditions and most of
the US shales that are generally over-pressured. The MD simulations reveal that the
43
swelling of kerogen slightly increases as the temperature and pressure of the kerogen-
solvent system were increased. This would have implications on the original oil-in-place
or gas-in-place depending upon different contributions from the absorbed hydrocarbon
phase in the shale rocks.
Differential scanning calorimeter (DSC) results showed a different vaporization
temperature for decane with and without swollen kerogen. The vaporization of decane
(shown by the peaks in the heat flow rate in Figure 3.7) was suppressed by the kerogen
matrix as indicated by suppressed onset temperatures for vaporization. The liquid decane
in kerogen was vaporized at almost 7.8 oC earlier than the temperature of vaporization of
same decane without kerogen (Table 3.1). Similarly, melting and crystallization were
suppressed by the presence of kerogen (Table 3.2). Decane present in nanometer
pores also forms a fraction of the overall decane present in the swollen kerogen sample.
However, there is no clear distinction between decane sorbed by the kerogen matrix and
decane in pores that are large enough (nanometer scale) for some of the decane to behave
like confined bulk decane. The kerogen with 17 nm avg. pore size gave results of
suppression in bubble point temperature (7.8 K suppression) which are in between the
suppressions seen by Luo et al. (2016) in CPG of 38.1 nm (1-4 K suppression) and 4.3
nm (15-25 K suppression) at room pressure conditions. The bubble point was assumed to
be at the temperature of onset of the endothermic peak associated with vaporization and
melting and onset of exothermic peak in crystallization. This onset was determined as the
point of intersection of the tangent line at the point of greatest slope on the leading edge
of the peak with the extrapolated baseline. Different weight loss curves were obtained for
decane with and without kerogen in TGA. The TGA data showed that the decane sorbed

44
in kerogen was vaporized earlier than the pure decane as seen in the Figure 3.8. The
swelling of kerogen has key implications on expulsion studies from kerogen as well as on
the original-hydrocarbon-in-place. Kerogen is shown to swell by absorbing oil (which
can be considered as a mixture of organic solvents). The absorbed oil fraction has
important influence on pressure-volume-temperature (PVT) properties of oil in the
kerogen-rich shales. From the preferential swelling of kerogen seen with different
hydrocarbon components in Figure 3.6, it was hypothesized that the DSC conducted on
oil (assume as multicomponent mixtures) and kerogen would largely change the bubble
points of the absorbed oil as different components of oil will be absorbed in different
amounts. This will lead to change in the composition of sorbed oil from the original
composition of oil. To confirm this hypothesis, the test-tube swelling experiments and
experiments with DSC were performed on oil and kerogen-oil binary mixture. Test-tube
swelling experiments revealed that after over 24 hours, the kerogen swelled 1.6 times due
to absorption of oil.
It was observed from the DSC experiments (Table 3.3) that a suppression of over
50oC was seen in the bubble point temperature of the oil absorbed in kerogen compared
to that of the pure oil. This suppression includes the effect of confinement and the effect
of swelling of kerogen (splitting of phase by absorbing oil components selectively).
Therefore, both confinement and kerogen swelling affect the bubble point of oils but to a
different extent. Swelling of kerogen suppresses the bubble point to a greater extent than
confinement. This is because swelling changes the composition of absorbed oil, while the
pore wall proximity affect is because of dominant surface forces that are important but
not as large as the effects due to changes in composition.
45
Accurate bubble points are essential in predicting the true rates and recoveries from
shale plays. Shifts in the bubble points may delay gas production and would allow
improvements in recovery of liquids.
3.5 Conclusions
The concept of preferential absorption of different solvents has been noted earlier25
by Flory Rehner Theory, experiments11–14,34,40,53,54, and by MD simulations in this work.
This means that both type I and II kerogen preferentially uptakes some components of oil
more than others and shows a bulk swelling that can be calculated in terms of Qv. A Qv of
1.6 was observed in kerogen of type I swelled with Clay Basin oil. This fractionation of
oil by kerogen splits oil into absorbed and free phase. The absorbed phase stays in the
kerogen matrix while the free phase may stay in the nanopores of kerogen. Because of
different compositions of free and observed phase, the absorbed oil behaves differently.
The pore-wall – fluid interactions have another effect (effect of confinement55–64) on the
fluid thermodynamic properties of the confined free fluid. Clay Basin oil absorbed in
kerogen has a bubble point which is suppressed by around 50oC from the original bubble
point of pure oil (Figure 3.9). This suppression is due to combined effect of partitioning
by kerogen and confinement of unabsorbed oil (confined free oil). A wider peak of
kerogen-oil sample in DSC as opposed to sharper peak of pure oil also indicates that
there are two effects that suppressed the bubble point of oil in Figure 3.9. The use of pure
component such as decane in DSC, however, negated the effect of partitioning as there is
just one component that cannot be partitioned based on the composition. Absorbed phase
and free phase in this case are both pure decane. Hence, only the effect of confinement
was present that caused the suppression of only around 7.8oC in the boiling point of

46
decane when it was with kerogen compared to the boiling point of pure decane.
Therefore, both kerogen partitioning and confinement changes the boiling point
temperatures of hydrocarbon fluids; however, the effect of kerogen partitioning is more
dominant. Swelling of kerogen suppresses the bubble point to a greater extent than
confinement. This has implications on pressure-volume-temperature (PVT) properties of
in-situ oil (sum of absorbed and free phase oil) in the kerogen-rich shales. The correct
bubble points are essential in predicting the true rates and volumes of recoveries from
shale plays and must be calculated by accounting for the two effects discussed here.
Shifts in the bubble points may delay gas production and would allow improvements in
liquid recovery.
3.6 Supplementary Information
3.6.1 Methodology for Molecular Dynamic Simulations
A method has been developed in current work to form molecular structure of bulk
kerogen from a single molecule. A simulated annealing procedure was performed on a
group of several kerogen molecules using the force field GAFF which was originally
developed for molecular dynamics simulations of organic molecules17. In the current
work, the application of GAFF has been extended from simpler organic molecules to
complex organic mega-molecules like kerogen. The type II C kerogen model was chosen
from Ungerer et al. (2015)16. The chemical formula of Model II C is C242H219O13N5S2
with 481 total number of atoms in one molecule. The H/C and O/C ratios of this model
unit are 0.905 and 0.054, respectively, and plots in the middle –end of the oil window as
shown in Figure 3.1. The force field parameters for GAFF were chosen from Wang et al.
200417 and ‘gaff.lt’ file available in the Moletemplate65 software distribution. The

47
Gasteiger-Marsili66 charges were assigned to all the atoms using the Avogadro molecular
modeling tool67.
In order to perform MD simulations, a workflow was developed comprising a series
of steps as shown in Figure 3.14. The steps are discussed below:
1. First, a molecule of type II C kerogen was converted from xyz format to protein
data bank (PDB) format. A single kerogen model II C is shown in Figure 3.13.
2. An atomtype program of Ambertools68 was used to convert the file into GAFF
friendly PDB
3. Packmol (Martinez L, 2009) tool was used to randomly stuff 35 of these GAFF
versions of PDB into a simulation box (Figure 3.10)
4. Visual Molecular Dynamics, VMD20 tool to produce an input file for LAMMPS21
5. Manually enter the bond, angles, and dihedrals parameters for all the atoms from
gaff.lt file from Moletemplate65
6. An instruction file for LAMMPS was written which included a series of simulated
annealing steps
7. The simulations for simulated annealing, followed by production runs, were run in
the LAMMPS in parallel with multiple processors of a super computer
8. Properties were calculated after simulated annealing of kerogen. Production
simulations were run in relaxed kerogen structure to calculate swelling, radial distribution
function, and density of kerogen
9. VMD was used to visualize the final relaxed structure of pure kerogen and kerogen
with octane (Figure 3.13).

48
3.6.2 Simulated Annealing Procedure
In order to relax the system to minimum energy state, the bulk kerogen structure
made up of 10 molecules systematically went through a series of energy minimization
steps. The initial packing density of kerogen in a 100Å cube was 0.206 g/cc. First, the
structure was simulated in canonical ensemble (NVT) with gradually increasing
temperature until 2000K, for 0.2 ns. Following NVT ensemble, the system was simulated
in isothermal-isobaric (NPT) ensemble steps for a total time of 1.4 ns, which consisted of
5 smaller steps of range 0.25-0.28 ns each. In these five steps, the system went through
the highest temperature and pressure of 2000 K and 1000 atm, respectively, to minimum
of 300 K and 300 atm towards the end of run in a step-wise reduction of temperatures and
pressures. The final temperature was chosen close to reservoir conditions in order to
replicate the realistic in-situ conditions for kerogen. A schematic of all the annealing
steps is given in Figure 3.14. For any NPT or NVT cycle of over 0.2 ns, the time steps
varied from 0.0001 to 0.01 ns. The Nose-Hoover style non-Hamiltonian equations of
motion were used in the LAMMPS molecular simulator to generate positions and
velocities sampled from the canonical (NVT) and isothermal-isobaric (NPT) ensembles
with periodic boundary conditions in all directions. The density of the final kerogen
structure was calculated at the end of simulated annealing. The final annealed structure of
bulk kerogen at minimum energy state would be used to further measure swelling of
kerogen in presence of organic solvents.
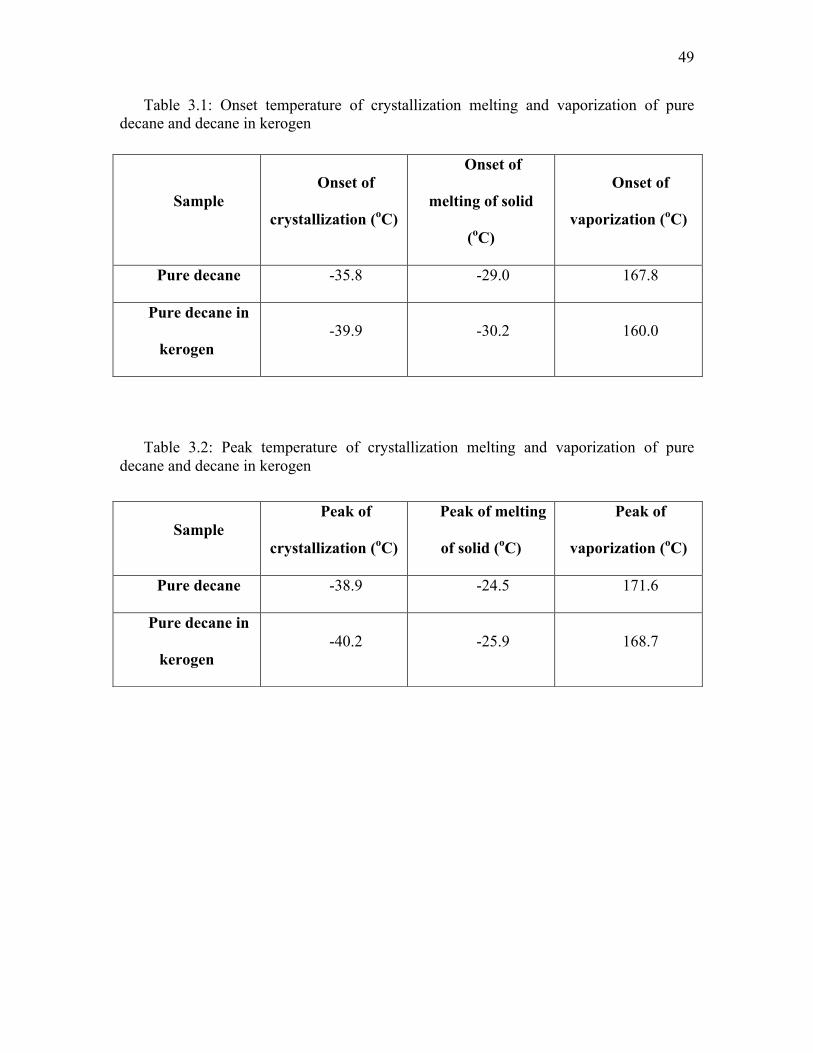
49
Table 3.1: Onset temperature of crystallization melting and vaporization of pure decane and decane in kerogen
Table 3.2: Peak temperature of crystallization melting and vaporization of pure decane and decane in kerogen
Sample Onset of
crystallization (oC)
Onset of
melting of solid
(oC)
Onset of
vaporization (oC)
Pure decane -35.8 -29.0 167.8
Pure decane in
kerogen -39.9 -30.2 160.0
Sample Peak of
crystallization (oC)
Peak of melting
of solid (oC)
Peak of
vaporization (oC)
Pure decane -38.9 -24.5 171.6
Pure decane in
kerogen -40.2 -25.9 168.7
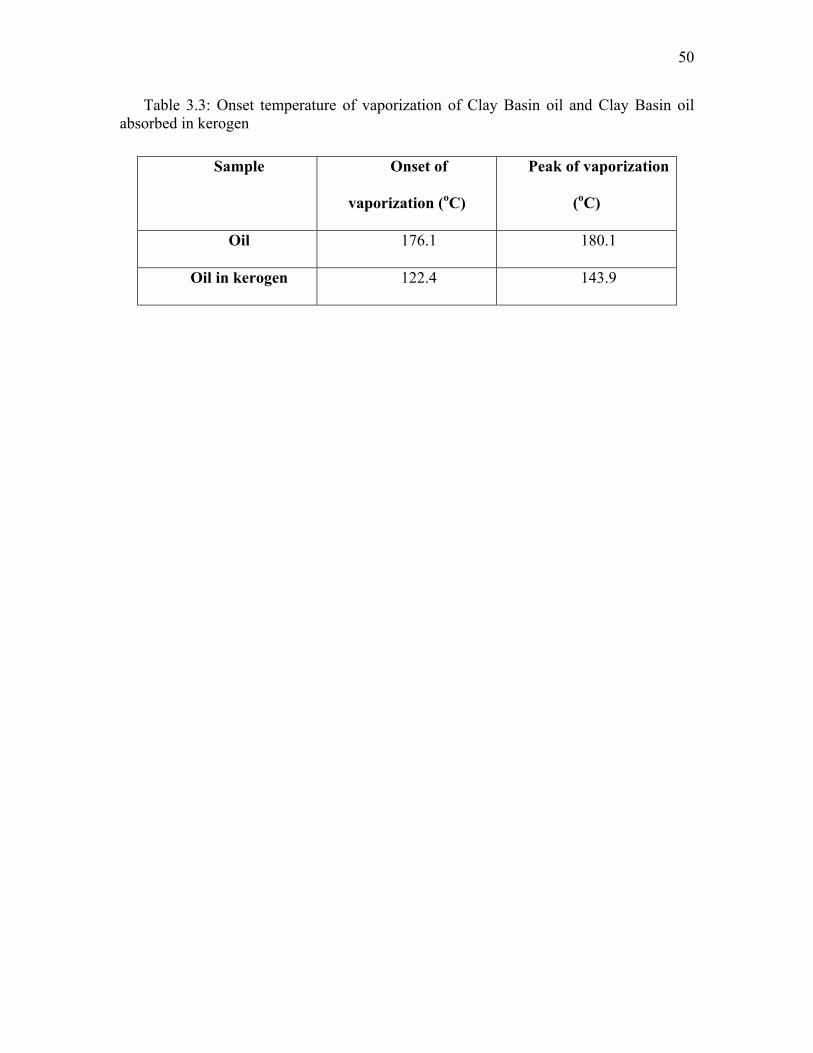
50
Table 3.3: Onset temperature of vaporization of Clay Basin oil and Clay Basin oil absorbed in kerogen
Sample Onset of
vaporization (oC)
Peak of vaporization
(oC)
Oil 176.1 180.1
Oil in kerogen 122.4 143.9

51
Figure 3.1. van Krevelen Diagram showing the IV types of kerogen. The kerogen can be classified into IV types based on their origin. Each class could generate hydrocarbons based on the maturity of the kerogen. The red dot shows the type of kerogen used for Molecular Dynamic simulations later in the text. The plot is redrawn after work of McCarthy et al. (2011)36

52
Figure 3.2: TGA data showing the weight loss curve of kerogen and that the isolated kerogen consists of over 75% organic matter
Figure 3.3: Scanning Electron Microscopy (SEM) image showing presence of sub-micron pores in isolated kerogen of original mesh size of 100 µm
0% 10% 20% 30% 40% 50% 60% 70% 80% 90%
0 100 200 300 400 500 600Weightloss
Temperature (degreeC)
TGA- isolatedkerogen

53
Figure 3.4: Nitrogen adsorption-desorption isotherm on the left shows a hysteresis loop throughout the relative pressure range. The graph on the right shows the average pore diameter of 17.691 nm (range 6-25nm) in the BJH desorption.
Figure 3.5: Swelling was seen in dynamic light scattering (DLS) in the kerogen particle kept with decane for 24 hours. The median raddi increased from 215.7 nm to 439.9 nm.
05
101520253035
0 0.2 0.4 0.6 0.8 1 1.2QuantityAd
sorbed(c
m3/gSTP)
RelativePrerssure(P/Po)
Adsorption-DesoprtionLinearIsotherm
Adsorption Desorption
0
0.01
0.02
0.03
0.04
0.05
0.06
0.07
0 5 10 15 20 25 30
dV/dlog(D)PoreVolume(cm³/g
)
PoreDiameter(nm)
BJHDesorption

54
Figure 3.6: The annealed kerogen matrix swelled while performing NVT simulations with series of solvents as shown here. The swelling ratios of type II kerogen (medium to high maturity) in presence of 17 solvents at different temperatures and pressures is shown in the bar graph with number of solvents. The kerogen swells more at higher temperatures and pressures.
0.951
1.051.11.151.21.251.3
n-he
ptane
octane
n-de
cane
methylcyclohe
xane
n-he
xade
cane
cycloh
exane
decalin
toluen
eo-xylene
be
nzen
etetralin
1-methylnaphthalene
2,5dimethylpyrrole
pyrid
ine
benzofuran
biph
enyl
benzothiop
hene
Qv(swellingratio)
SwellingofKerogen
300K,1atm
300K,300atm
375K,1atm
375K,300atm

55
(a)
(b)
Figure 3.7: DSC results for kerogen and pure decane experiments. (a) DSC data show that the decane absorbed in kerogen boils, melts, and crystalizes at lower temperatures than decane in the bulk state. (b) Boiling point peak is enlarged to see the fine difference in the DSC peak of pure decane and decane absorbed in kerogen.
-6.50
-4.50
-2.50
-0.50
1.50
3.50
5.50
140 150 160 170 180 190 200
DSC/(m
W/m
g)
Temp./°CPureDecane Kerogen-Decane PureKerogen

56
Figure 3.8: TGA data showing that kerogen interacts with decane and changes the boiling point of the decane in the presence of kerogen.
Figure 3.9: DSC data showing that kerogen absorbed oil and changed the bubble point of the absorbed oil
0.00%
20.00%
40.00%
60.00%
80.00%
100.00%
120.00%
20 40 60 80 100 120 140 160 180
%W
eigh
tloss
Temperature(degreeCelcius)
TGAdata
Puredecane Kerogen+decane

57
Figure 3.10: Single molecule of type II kerogen taken from Ungerer P. et al. (2015)
Figure 3.11: Plot of pair-wise radial distribution function

58
Figure 3.12: Density of kerogen calculated from Molecular Dynamics Simulations
Figure 3.13: Relaxed structure of kerogen (blue color) and octane (red color) mixture after simulated annealing
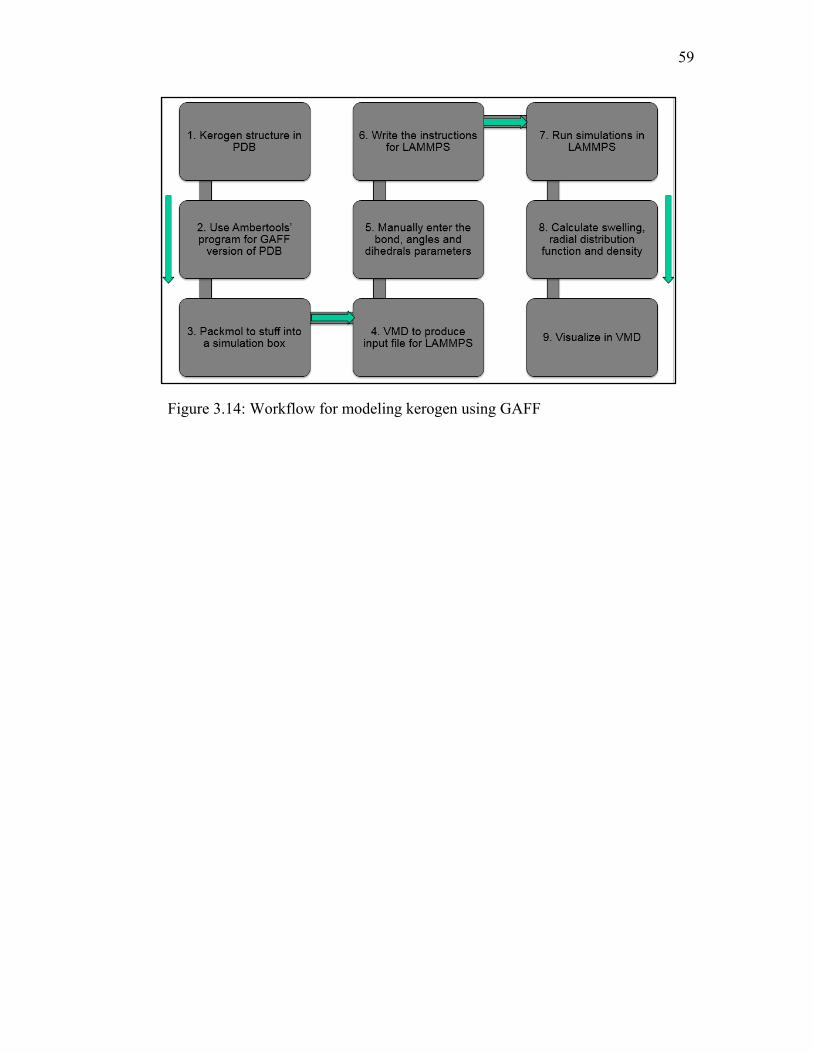
59
Figure 3.14: Workflow for modeling kerogen using GAFF

CHAPTER 4
MOLECULAR MODELING STUDY OF BUBBLE POINTS OF
HYDROCARBON MIXTURES IN NANOPOROUS MEDIA
4.1 Abstract
Shale resources have played a key role in increasing oil production in the last decade
in the United States. The sizes of pores in shales storing oil are believed to be of the order
of nanometers. It is believed that the fluids present in such small nanometer scale pores
have different properties compared to properties measured in the bulk. Fluid saturation
pressures at given temperatures – bubble points for oils and dew points for condensates in
the nanopores, are affected by pore walls in the vicinity of the fluid molecules. Approach
to the bubble point or dew point influences the proportion of liquid or gas produced from
a given well, and thus impacts the economic viability. Hence, an accurate measure of
saturation pressures is important. In this paper, we describe experiments in well
characterized synthesized mesoporous materials and present Gibbs Ensemble Monte
Carlo (GEMC) simulations for understanding the possible reasons for observations made
in the experiments.
The experimentally measured saturation pressures of a mixture of decane-methane in
confined spaces of the mesoporous material are observed to be less than the oil saturation
This chapter is reprinted with permission from Experimental and Molecular Modeling Study of Bubble Points of Hydrocarbon Mixtures in Nanoporous Media, Manas Pathak, Hyeyoung Cho, and Milind Deo, 2017, Energy & Fuels. Copyright 2017 ACS

61
pressure of mixture in the bulk state. The GEMC simulations were performed to
investigate fluid phase equilibrium in confined pores and find possible reason(s) behind
the suppression of bubble points in the confined spaces. The simulations show that
reduction in critical properties of the nano-confined fluids leads to the suppression of
bubble point pressures of the fluids mixtures in confined pores.
4.2 Introduction
The oil and gas production from shale plays have significantly increased the overall oil
and gas production in the United States69. Of the total U.S. crude oil production in the
year 2015, roughly 52% or about 4.5 million barrels per day of crude oil were produced
directly from shale and other tight rock resources according to U.S. Energy Information
Administration (EIA). Figures 4.1 and 4.2 show the recent total production from shale
gas and tight oil (majorly shale oil) plays, respectively, in the U.S.
Even with successful shale exploitation in the U.S. in the last decade, there is still a
constant challenge of increasing the recovery from the shale reservoirs. Much of the
decades of understanding from conventional oil and gas exploration fails to increase
primary recovery over 10% in shale oil1,70 and 20% in shale gas plays. The shale rocks
are also the source of oil and gas and contain organic matter, known as kerogen71,72, in
them. Kerogen is a complex organic matter which is a precursor to oil and gas found in
shales. The nanometer scale pores (1-20 nm) in organic (kerogen) and non-organic parts
of shales have been discussed earlier73 and are referred to as ‘nanopores’ in the rest of
this chapter. Such small pore dimensions add additional complexity to the behavior of
fluids present in shales. Currently, there is still a huge gap in the understanding of storage
and transport of hydrocarbons in shales. When the dimensions of pores are comparable to
62
the mean free path of the fluid molecules, collisions with the wall of the pores cannot be
neglected. At the nanoscale, in the confined pores of shales, phase behavior of fluids not
only depends on fluid-fluid interactions, as in the bulk state, but also depends on fluid -
pore wall interactions60,58. The pore surface area per unit volume increases as pore
dimensions decrease; therefore, the surface forces are not negligible at the nanoscale74.
This interaction between fluid molecules and pore walls needs to be included in any
calculation of thermodynamic fluid or transport properties in shales. Traditional
equations of state fail to incorporate the complexity of pore wall interactions in
calculating thermodynamics properties of confined fluids. The current work aims to study
the effect of pore wall – fluid interaction on pressure-volume-temperature (PVT)
properties of the fluids residing in nanopores of shales.
In recent years, there has been major interest among researchers in looking at fluid
thermodynamic properties in confined pores57–63,75–80. The current work employs
molecular modeling techniques to look at the equilibrium between co-existing vapor-
liquid phases in the nanopores and comparing that to experiments conducted on
artificially created meso- (~3.5 nm pore diameter) porous material. Sheng59 has
demonstrated through experimental work that there are two phases of fluids inside the
nanometer scale pores: the free confined phase and the adsorbed phase. Such small pores
are abundant in shales. However, to the author’s knowledge, a fundamental
understanding of the differences in thermodynamic properties between free confined fluid
and bulk fluid has not been well characterized. In order to understand the phase behavior
of confined fluids, this work studies the vapor-liquid equilibrium of confined fluid while
ignoring other possible effects such as adsorption. The free but confined phase has

63
properties that are different from the bulk fluid because of interactions with pore walls.
The free-confined fluid phase is different from the adsorbed phase; however, the two
phases may remain in a thermodynamic equilibrium. The adsorbed fluids stay in the form
of single to multiple layers of fluid molecules adsorbed on the walls inside of the pore.
The vapor portion of the adsorbed fluid may condense depending on a threshold
temperature and pressure. This condensed liquid phase is a manifestation of the confined
capillary condensation phenomenon63. Such condensation usually happens at a
temperature and pressure below the phase boundary of the bulk fluid. However, for the
current research, the effect of adsorption and possible capillary condensation are ignored
in order to focus on the effect of confinement on the behavior of free fluid phase in the
nanopores59. Further, the effect of high capillary pressure in the smaller pores is also
ignored in the current work. Each shale nanopore has its own vapor-liquid equilibrium
established within the pore. Therefore, a series of Gibbs Ensemble Monte Carlo
(GEMC)81,82 simulations are performed to understand fluid phase equilibrium within a
nanometer scale pore. The key PVT properties affected by the confinement of fluids
include phase boundaries, phase compositions, and saturation pressures (bubble points
and dew points), interfacial tensions, fluid viscosities, and fluid densities. For this work,
the effect on densities, phase boundaries, and the bubble points are studied using a
combination of experiments and molecular modeling. The experiments were conducted to
measure the bubble points of the liquid hydrocarbon mixture (decane-methane in a 90-
10% molar ratio) confined in nanometer sized pores. For the experimental part,
synthesized mesoporous materials with perfectly calibrated nanometer sized pores were
used to represent the porous system in shale reservoirs. Nitrogen adsorption/desorption

64
isotherms and transmission electron microscopy (TEM) were used to characterize the
samples. Measurements show that the synthesized materials have a highly ordered
hexagonal mesostructure and a narrow pore size distribution. Bubble point pressure
measurements for decane-methane mixtures were performed in these mesoporous
materials. The experimental results are complemented with the results from molecular
simulations (GEMC) to understand the dynamics at a pore scale and to investigate
reasons behind the suppression in bubble point pressure that was observed in the
experiments.
4.3 Simulation Methodology
Gibbs Ensemble Monte Carlo (GEMC)81,82 simulations are molecular-scale
simulations that have been widely used by researchers to study vapor-liquid equilibrium
in various scenarios, including in confined spaces19–23. There has not been wide
application of GEMC simulations to study the effect of confinement in ultra-tight oil and
gas formations such as shales. The GEMC simulations technique is used in the current
work to understand the effect of confinement of fluid molecules in graphite slit pores,
evaluating changes in the fluid density and phase behavior of the fluid mixture. GEMC
simulations were performed for pure decane and a 90-10 % molar ratio binary mixture of
decane-methane confined in 3.5 nm wide graphite slit pores. The 3.5 nm was specifically
selected because the average pore size in the synthetic SBA-15 porous media on which
experiments were performed was 3.5 nm.
The GEMC simulations establish phase co-existence between two regions in
accordance with the following four thermodynamic criteria 81,82:
1. The two regions should be in internal equilibrium,

65
2. The temperature in the two regions should be the same,
3. The pressure in the two regions should be the same, and,
4. Chemical potential of all components in the two regions should be the same.
Once the simulations are configured to be performed at a constant temperature, the
following three Monte Carlo moves are performed in the Gibbs Ensemble in order to
achieve thermodynamic equilibrium between the two co-existing phases:
1. Displacements of particles within each region to ensure equality of internal energy,
2. Fluctuations in the volume of the two regions to ensure equality of pressure, and,
3. Transfer of particles between the two regions to ensure equality of chemical
potential
Figure 4.3 shows a schematic of the Gibbs Ensemble method and explains the three
kinds of Monte Carlo moves indicated above.
In the current work, GEMC simulations were performed on pure decane (Figure 4.4)
and a 90-10% molar ratio decane-methane binary mixture. The set-up of the GEMC
simulations performed between the regions of the liquid and vapor phases of decane is
shown in Figure 4.4. To include the effect of confinement, the GEMC simulations were
performed on the fluid(s) confined in a slit pore geometry with graphite walls (Figure 4.4
and 4.5).
The molecular simulation methodology involved performing canonical (NVT) GEMC
simulations at constant temperature. In canonical (NVT) ensemble, the number of
molecules (n), volume of the system (v), and temperature of the system (t) are kept
constant throughout the simulations. As the simulations are performed at different
temperatures, phase equilibrium established between the liquid and vapor phases shifts.

66
This temperature-dependent equilibrium shift between the two phases is evidenced by the
different mole fractions of each component in the two phases and by the different density
of each phase as the temperature is changed. Using a series of simulations, vapor-liquid
equilibrium was simulated at different temperatures. At every isothermal phase
equilibrium simulation, densities and mole fraction of each component in the two phases
are monitored.
The 12-6 Lennard-Jones85 (L-J) potential was used to account for non-bonded
interactions between the fluid molecules. The TraPPE-UA force field parameters were
used in the L-J potential which is described as:
∅ 𝑟 = 4𝜖(:q,rs,r
0F− q,r
s,r
t (4.1)
where 𝜖 is the depth of the potential well, σ is the finite distance at which the inter-
particle potential is zero, and r is the distance between the particles. The subscripts ij
indicate the molecule i and molecule j. The Lorentz-Berthelot86,87 combining rules are
used for calculating the parameters for unlike molecules:
𝜎(: = 𝜎(( + 𝜎::F (4.2)
𝜖(: = 𝜖((𝜖:: (4.3)
The pore wall-fluid interaction potential (𝜙^w)was calculated from the Steele
Potential88,89 (10-4 Lennard-Jones wall):
𝜙^w 𝑧 = 2𝜋𝜌w𝜖^w𝜎 wFΔ F
}q~��
0�− q~�
�
�− q~��
M�(�i�.t0�)� (4.4)

67
where 𝜖, 𝜎, Δ are the well depth of the potential, molecular diameter, and distance
between layers of fluids (f) and graphite (w), respectively. For a given pore width (H), as
shown in Figure 4.3, the total potential energy inside the pore is given as83:
𝜙�Es# 𝑧 = 𝜙^w 𝑧 +𝜙^w 𝐻 − 𝑧 (4.5)
where z is the coordinate axis perpendicular to the pore wall. The slit distance (H) is
fixed at 3.5 nm (to complement the experiments performed with the manufactured
material, SBA-15, that has a pore dimension of 3.5 nm). The values of 𝜖ww, 𝜎ww, andΔ
for graphite were taken to be 28.0 K(kb), 0.340 nm, and 0.335 nm, respectively, as
inferred from earlier work on the Steele Potential83,88,89. The fluid parameters for methane
and decane (𝜖^^, 𝜎^^)were chosen based on the TraPPE-UA force field developed by
Martin and Siepmann90. The values of 𝜖^w𝑎𝑛𝑑𝜎 w were calculated using the combining
rules discussed below.
𝜖^w= 𝜖^^𝜖ww (4.6)
𝜎 w= 𝜎 ^ + 𝜎wwF (4.7)
4.4 Bubble Point Measurement
In preliminary work conducted by Hyeyoung Cho (based on personal communication
with Hyeyoung Cho), two different mesoporous materials, with similar pore sizes, were
used to observe the effect of pore morphology on hydrocarbon mixture phase behavior.
SBA-15 and SBA-16 have highly ordered hexagonal and cubic mesoporous silica
structures. SBA-15 was synthesized in the presence of triblock poly (ethylene oxide)–

68
poly(propylene oxide)–poly(ethylene oxide) (PEO–PPO–PEO) copolymers and SBA-16
was synthesized using a poly(alkylene oxide) triblock copolymer. The bubble point
pressure of the 90:10 mole ratio methane and decane mixture in bulk (no porous medium
confinement) was 374 psia at 100oF (310K). In SBA-15 the equivalent bubble point was
242 psia at 100oF (310K). Thus, the experimentally measured saturation pressure with
SBA-15 was lower than the saturation pressure measured for the bulk fluid.
4.5 Result and Discussion
4.5.1 Simulations for Decane-Methane Mixture
To investigate the preliminary phase behavior data acquired by the experiments
described earlier (suppression of 132 psia in bubble point pressure of 90-10 decane-
methane mixture at 100oF under the effect of confinement in 3.5 nm pores), GEMC
simulations were performed for pure decane and a 90-10 % molar ratio binary mixture of
decane-methane confined in 3.5 nm wide graphite slit pores. The 3.5 nm width was
specially selected because the average pore diameter in the synthetic SBA-15 porous
medium used in the experiments was 3.5 nm.
The GEMC simulations were performed for pure decane for a range of temperatures.
A series of isothermal simulations were performed at different temperatures. In all of
these simulations of decane (vap) – decane (liq) equilibrium, the density of each phase
was monitored. The density for each phase was plotted against temperature to develop a
temperature-density plot, as shown in Figure 4.9. The simulations were performed for
two cases – one considering pore wall-fluid interaction, the other without the effect of
pore wall-fluid interaction. The pore wall-fluid interaction was captured using Steele
potential, as discussed in Section 4.3. The density plots were extrapolated from the near-

69
critical region to estimate the critical temperature of pure decane in bulk and confined
states58,90. The critical temperature of decane was estimated at 705K (compared to the
true critical point of 618K). A suppression of 125K in critical temperature was observed
for the confined decane. This is close to the observations made by other researchers80,91.
The difference between the two values (bulk and confined) is more relevant than the
actual values.
The Antoine92 equation was used to calculate the corresponding change in critical
pressure of the confined fluid. This equation has applicability for wide range of
temperatures93 including near the critical region for decane. The Antoine equation (refer
to Eq. 8) was used to calculate the suppression in the critical pressure of confined decane:
ln 𝑃 = 𝐴 − �/i�
(4.8)
where P and T are in kPa and OC; A, B, and C are constants and their values are based
primarily on data presented by Poling94.
The pressure-temperature (PT) plot for pure decane is shown in Figure 4.10. The bulk
values for the critical properties estimated from the GEMC model were used in this plot.
A suppression in vapor pressure is observed for the confined decane. Such a suppression
happened due to change in the critical properties of the pure decane confined in
nanometer scale pores. This is a clear indication of changes in the thermodynamic
properties of fluids confined in the nanopores. This changes the phase behaviour of free
confined fluid compared to the same fluid in a bulk state. A potential reason for change in
the fluid’s thermodynamic properties and thus, phase behavior of confined fluid is the
pore wall-fluid interactions that are dominant at a nanometer scale. These surface forces
cannot be neglected at the nanometer scale because the surface area per unit volume is
70
very high at such a small scale.
GEMC simulations based on the workflow discussed earlier were again performed for
the binary mixture of decane – methane (90-10% molar ratio) to complement the findings
from the experiments. The motivation for these simulations was to understand the
dynamics at a pore scale and to contribute to the fundamental understanding of phase
behavior of fluids in confined spaces of shale rocks. The simulations helped in
identifying a potential reason for suppression in the bubble point of the binary mixture of
decane and methane that was observed from the experiments. This understanding can be
utilized in the study of phase equilibria of other hydrocarbon mixtures confined in
nanometer scale pores. The GEMC simulations were performed at different temperatures
to simulate the phase equilibrium between vapor and a liquid decane-methane mixture.
The densities at each isothermal step were monitored and plotted to develop a
temperature-density plot for the binary mixture (Figure 4.11). The densities from the
near-critical region were extrapolated with good R2 values to estimate the critical
temperature of the mixture. A suppression of about 85K in the critical temperature of the
binary mixture is observed for the confined mixture compared to the bulk mixture. The
critical density is also supressed by 0.55 g/mL in the confined mixture. This change in the
fluid thermodynamic properties leads to the corresponding change in phase behaviour of
the confined fluids. By performing the molecular modeling using GEMC simulations, it
was observed that the fluids behave like a bulk fluid if the Steele pore wall potential was
not used in simulating the phase behavior. This indicates that pore wall-fluid interaction
is a primary reason for suppression of the critical properties and vapor pressure of the
confined fluids.

71
4.5.2 Simulations for a Decane-CO2 Mixture
The phase behavior of a confined decane-carbon dioxide mixture is important in the
study of minimum miscibility pressures of carbon dioxide (CO2) in confined spaces.
GEMC simulations were performed on 90-10% molar ratio binary mixture of decane and
carbon dioxide. To include the effect of confinement, the GEMC simulations were
performed on the fluid(s) confined in the slit pore geometry made up of graphite walls.
The molecular simulation methodology involved performing canonical (NVT) GEMC
simulations at constant temperature. In canonical (NVT) ensemble, the number of
molecules (n), volume of the system (v), and temperature of the system (t) are kept
constant throughout the simulations. The simulations were performed at different
temperatures. Phase equilibrium established between the liquid and vapor phases shifts.
This temperature-dependent equilibrium shift between two phases is evidenced by the
different mole fractions of each component in the two phases and the different density of
each phase as the temperature is changed. Using a series of simulations, vapor-liquid
equilibria were simulated at different temperatures in this work. Densities and mole
fraction of each component in the two phases were monitored for every isothermal phase
equilibrium simulation.
The GEMC simulations were performed for decane-CO2 for a range of temperatures.
As before, again in this part, each isothermal simulation of decane-CO2 (vap.) – decane-
CO2 (liq.) equilibrium, the density of each phase was monitored. The density for each
phase is plotted against temperature in Figure 4.12. The simulations were performed for
two cases – one considering pore wall-fluid interaction to represent a confined state, the
other without the effect of pore wall-fluid interaction to represent the bulk state. The pore

72
wall-fluid interaction was captured using the Steele potential discussed above. The
density plots were extrapolated from the near-critical region to estimate the critical
temperature and critical density of decane-CO2 in bulk (no pore-wall – fluid interaction)
and a confined state (with pore-wall-fluid interaction)58,90. The critical temperature of the
bulk decane-CO2 binary mixture determined from GEMC was found to be 660K
(compared to the true critical point of 615K predicted by a commercial PVT simulator).
The critical temperature in a confined mixture in the presence of pore-wall-fluid
interaction was found to be 675 K, as shown in Figure 4.12. GEMC indicated that the
critical density of the confined mixture was suppressed by 0.15 g/mL from the bulk
critical density of 0.38 g/mL. The difference between the two values (bulk and confined)
may be more relevant than the actual values.
4.6 Conclusions
The bubble point pressures in the bulk were found to be higher than the bubble points
of the same fluids confined in nanometer scale pores in synthetic mesoporous material.
GEMC simulations were performed to diagnose this bubble point suppression for
confined fluids. The GEMC simulations indicated that the pore wall-fluid interactions are
dominant at the nanometer scale and suppress the critical properties of fluids confined in
nanometer scale pores. A suppression in the critical point of a confined decane-CO2
mixture is also observed. This has implications in the calculation of minimum miscibility
pressure of CO2. The estimation of correct fluid thermodynamic properties, including
pressure-volume-temperature (PVT) properties, is essential to for better prediction of
reserves and the rates of recovery of these reserves from shale plays. Conventional PVT
simulators do not account for pore wall-fluid interaction and fail to capture the

73
suppression of the critical properties of these confined fluids. Conventional PVT
simulators should be updated with models like the one proposed here in order to capture
the dynamics at a pore scale.

74
Figure 4.1: U.S. Energy Information Administration (EIA) official shale gas production data through July 2016. The figure shows current gas production of over 40 BCF of gas per day from US Shale gas plays. The gas production has increased in the past decade due to increased exploration and drilling activities in shale gas plays; however, the recovery from individual shale gas wells is still no more than 20% on average. Source: US Energy Information Administration (EIA) web-article 95.
Figure 4.2: U.S. Energy Information Administration (EIA) official tight oil production data through July 2016. The figure shows current oil production of over 4.0 million barrels of oil per day from US tight oil plays. Tight oil in US is produced majorly from low-permeability shale formations but also includes sandstones and carbonates. Source: US Energy Information Administration (EIA) web-article 95.

75
Figure 4.3: Gibbs Ensemble Monte Carlo simulations establish the equilibrium between two fluid phases by employing three kinds of move in the two regions - Region I, II. The two regions are taken from the two simulation boxes, each containing two different fluid phases. The three moves performed in the two regions are particle displacement, volume change, and particle transfer. The figure is redrawn from the work by Panagiotopoulos82.

76
Figure 4.4: The Gibbs Ensemble Monte Carlo (GEMC) simulations were performed
on pure decane and a binary mixture of decane and methane (90-10% molar ratio) confined by graphite walls. This figure shows a schematic of the GEMC simulation set-up performed for pure decane. The three kinds of moves in the GEMC simulations were performed in the two regions (Region I and Region II) bounded by graphite walls.

77
Figure 4.5: The molecular model showing a fluid mixture confined in a graphite slit pore. H is the normal distance between the graphite layers forming the pore, also known as pore width. H will correspond to the pore dimensions OF SBA-15 used in the experiments discussed in this chapter. H is also represented in the wall-fluid potential discussed later in the text.
Figure 4.6: The PT plot for pure decane. Vapor pressure suppression is observed for decane confined in the slit pore made up of graphite.

78
Figure 4.7: Temperature-density plot for pure decane. The densities from the near-critical region were extrapolated with good R2 values to estimate the critical temperature of the decane in confined and bulk states. Suppression of approximately 125K or 225oF is observed for the critical temperature of decane confined in nanometer scale pores. This is similar to the observations made by other researchers80,91. vap_wall and liq_wall in the legend refer to the use of Steele pore wall potential to account for pore wall-fluid interaction. vap_no_wall and liq_no_wall represent the bulk state when pore wall-fluid interactions were not included.

79
Figure 4.8: Temperature-density plot for a mixture of decane-methane (90-10% molar ratio). A critical temperature suppression of about 85K is observed for 90-10% molar ratio binary mixture of decane and methane. liq_wall and vap_wall in the legend refer to the use of Steele’s pore wall potential to account for pore wall-fluid interaction. liq_no_wall and vap_no_wall represent the bulk state when pore wall-fluid interactions were not included. Suppression in the critical properties of the confined fluids is attributed to the pore wall-fluid interaction that becomes dominant at the nanometer scale.

80
Figure 4.9: Temperature-density plot for a decane-CO2 mixture of (90-10% molar ratio). The critical density is supressed by 0.15 g/mL in the confined binary mixture relative to the bulk critical density of 0.38 g/mL. liq_wall and vap_wall in the legend refer to the use of Steele’s pore wall potential to account for pore wall–fluid interaction. liq_no_wall and vap_no_wall represent the bulk state when pore wall-fluid interactions were not included. Suppression of the critical density for the confined decane-CO2 binary mixture is attributed to the pore wall–fluid interactions that become dominant at the nanometer scale.

CHAPTER 5
MOLECULAR INVESTIGATION OF ENHANCED GAS RECOVERY BY
CARBON DIOXIDE SEQUESTRATION IN GAS-RICH SHALES
5.1 Introduction
The overall recovery factor from shale gas plays is only about 20%37. Gas bearing
shales are sites for continuous gas accumulation rather than trapped gas in the
conventional reservoirs, and different approaches (other than hydraulic fracturing) may
be appropriate for increasing recovery. As demonstrated in previous chapters, residual
kerogen present in these rocks changes the dynamics of gas storage and production.
According to simple scaling laws, the surface area per unit volume is inversely
proportional to the scale of the porosity in geometrically similar porous materials. Due to
the nanoscale porosity of gas-rich kerogen, the surface area per unit volume is very high.
Consequently, adsorption on kerogen surfaces may play an important role in gas
retention. The net attractive interactions between gas molecules and kerogen surfaces
may lead to adsorption of significant volumes of gas in kerogen. The nanometer scale
pores in kerogen73 add another level of complexity to gas storage and production and
increases the challenges of estimating the retention of natural gas in organic-rich shales.
The connected nanopores may form nanochannels, which could provide important fluid

82
flow pathways in the kerogen and contribute to fluid transport on longer scales within
organic-rich shales. However, permeability scales as the square of the hydrodynamic pore
diameter, and the permeability of a connected network of nanoscale pores would be very
small. For much the same reason, the matrix permeability of shales formed from very
small sediment particles is also very small. However, the fracture permeability in those
clastic sediments may be much higher. The low permeability and the sorptive retention of
gas are key reasons for low recovery from shale gas plays. Assuming that the gas
molecules can diffuse out of the kerogen matrix through the walls of kerogen96, there
could be a significant amount of sorbed gas in the kerogen matrix that may be produced
by replacing it with gas of higher sorption affinity for kerogen such as carbon dioxide.
Sorption of carbon dioxide may drive desorption of methane that was originally adsorbed
by the kerogen component of gas-rich shales at in-situ conditions97. Here we report a
fundamental, molecular, pore scale investigation of carbon dioxide enhanced production
technologies for shale gas plays.
5.2 Background of Carbon Dioxide Enhanced Production
In recent years, there have been many investigations of using carbon dioxide to
enhance production from shale gas plays. One approach is to use carbon dioxide as an
injection fluid, perhaps in a cyclic process (huff-n-puff technique). For huff-n-puff
scenarios, some reservoir scale simulations indicate that increased recovery can be
achieved98,99,100,101,102. Another approach is to use carbon dioxide as a hydraulic
fracturing/refracturing fluid 103. The carbon dioxide is pumped as a viscosified, foamed,
or energized fluid to fracture the formation. Neat CO2 is rarely used for primary
stimulation because of its poor proppant carrying ability. Several field investigation104,105

83
have demonstrated increased production after fracturing/refracturing using carbon
dioxide. Simulations also indicate that gas recovery can be increased in this manner 106.
In both of these approaches for using carbon dioxide for increasing gas recovery, at
least some of the carbon dioxide will penetrate into the targeted formation and interact
with its various organic and inorganic components. The purpose of the molecular
dynamics (MD) simulations presented in this article was to obtain a better understanding
of the effects of carbon dioxide on kerogen and natural gas (represented by methane)
within shales under in-situ conditions. When carbon dioxide reaches the targeted
formation at depth, it is already in the supercritical form (at pressure of 300 atmospheres
and temperature of 400K). Supercritical carbon dioxide will be referred to as just carbon
dioxide in the rest of this manuscript. In the subsurface, carbon dioxide will interact with
various components of the rock. A shale can be broadly divided into the solid inorganic
matrix, solid organic matter, and fluids. The inorganic matrix consists mostly of various
minerals including clays, quartz, carbonates, clays (aluminosilicates), etc. Some of these
minerals may interact chemically with carbon dioxide and adsorb it, particularly some of
the clays. Adsorptive capacity can be reduced in the presence of water. However, the
current work focuses on the interaction of carbon dioxide with the solid organic
components that are mostly residual kerogen. Kerogen consists of organic matter that is
usually embedded in the inorganic matrix of shales. The kerogen is classified into four
main types as shown in the Figure 5.1 based on its atomic composition and origin. As
kerogen-bearing sedimentary rock is progressively buried over geologic time, the
kerogen undergoes chemical and physical alteration because of the increasing
temperature and stress (a process known as catagenesis or maturation). As the maturity

84
of the kerogen increases, first oil, then wet gas, and finally dry gas (mainly methane with
only small amounts of higher molecular mass hydrocarbons) are produced from the
remaining kerogen. The kerogen can be classified in terms of both type and maturity (in
the oil window or wet gas window or dry gas window).
The work reported here focused on a particular type of kerogen (type II) at a
particular maturity (near the end of the oil window and the beginning of the wet-dry gas
window). The kerogen model for this type II kerogen was taken from the work of
Ungerer et al. (2015) and is shown by the red dot on the Van Krevelen diagram in Figure
5.1. The chemical formula of this kerogen model is C242H219O13N5S2. The H/C and O/C
ratios of this model unit are 0.905 and 0.054, respectively. Type II kerogen (kerogen with
initially high H/C and H/O ratios, formed primarily from marine microorganisms) is
known to be oil and/or gas prone in nature. This kerogen type is found in many
productive gas-rich shale plays in the US and it is, therefore, a suitable medium for
assessing the interaction of typical shale gas kerogen with carbon dioxide and methane.
The sorption of carbon dioxide and methane by organic-rich shale, individually as
well as competitively, has been extensively studied experimentally and reported in the
scientific literature107,108. However, the fundamental molecular level processes that
control the kinetics and thermodynamics of methane and carbon dioxide sorption and
desorption have not been investigated using realistic kerogen molecular models. All of
the experimental studies reported so far have focused only on the sorption of gas by
carbon (which accurately represents kerogen only at the end of the dry gas window) or on
whole rock shale samples. A few studies have discussed the associated swelling of the
carbon or the whole rock samples due to adsorption of gases108–110.

85
The swelling of kerogen in our MD simulations is attributed to the combined effects
of adsorption and absorption (referred to collectively as sorption), whereas previous work
has focused on adsorption108. The change in volume of kerogen during desorption of
methane and sorption of carbon dioxide may close or open fluid pathways and thus, plays
a key role in determining the effective drainage of fluids in shales.
5.3 Kerogen Molecular Modeling
The molecular model for type II kerogen developed by Ungerer et al. (2015) was used
with the General Amber Force Field (GAFF) developed by Wang et al. (2004) and
implemented in LAMMPS (Large-scale Atomic/Molecular Massively Parallel Simulator
21) to perform molecular dynamics (MD) simulations of kerogen, methane, and carbon
dioxide system. Before performing simulations with complex multicomponent systems,
the kerogen model was tested because the GAFF force field was different from that used
by Ungerer et al. (2015). The General Amber Force Field (GAFF) force field was used to
calculate the parameters for bonded as well as non-bonded interactions. The 12-6,
Lennard-Jones (L-J) potential85
∅ 𝑟 �=� = 4𝜖(:q,rs,r
0F− q,r
s,r
t (5.1)
was used to calculate the non-bonded molecular forces. Here, 𝜖 is the depth of the
potential well, σ is the finite distance at which the inter-particle potential is zero, and r is
the distance between the particles. The Lorentz-Berthelot classical mixing rule86,87 was
used to calculate the parameters for unlike atoms in the L-J potential.
𝜎(: = 𝜎(( + 𝜎::F (5.2)

86
𝜖(: = 𝜖((𝜖:: (5.3)
Gasteiger-Marsili 66 charges were assigned to all of the atoms in the kerogen and gas
molecules (methane and carbon dioxide) to calculate the Coulombic interactions
∅ 𝑟 �E�$E�h(� =�N�N�∈s
(5.4)
Here, q1 and q2 are the charges on interacting atoms, ∈ is the dielectric constant of the
medium, and C is a constant. The final configurations were visualized using VMD
(Visual Molecular Dynamics)20.
Simulated annealing of the kerogen was performed to construct a molecular model
that represents the native state (lowest conformational free energy state) of the kerogen.
The Ungerer model for medium–high maturity kerogen, shown in Figure 5.2, has the
atomic composition C242H219O13N5S2 and a molecular mass of ~3465 daltons.
To conduct simulated annealing, 15 of these molecules were placed in a cubic box
with periodic boundary conditions. MD simulations were performed in a canonical
(NVT) ensemble for a 0.2 ns (in 2 million time steps) at a temperature of 2000K and
density of 0.22 g/cc. In a canonical ensemble, the number of molecules, temperature, and
volume of the system are kept constant. The system was then “annealed” using isobaric-
isothermal (NPT) ensembles starting at 1000 atmospheres (» 100 MPa) and 1000K, and
both the temperature and pressure were reduced in stages (as shown in Figure 5.3) until a
final pressure of 300 atmospheres (» 30 MPa) and a final temperature of 300K (room
temperature) were reached. To monitor the simulated annealing process, the kerogen
density was calculated at each step, as shown in Figure 5.3. The density of the type II

87
kerogen after annealing was 1.18 g/cc at 300K and 300 atmospheres. This matches well
with experimentally measured kerogen densities in the range of 1.18-1.23 g/cc reported
by Stankiewicz et al. (1994)111 and 1.2-1.25 g/cc cited by Okiongbo et al. (2005)22. The
size of the time steps and the lengths of each annealing stage were carefully chosen to
guarantee that the system evolved towards equilibrium during each stage.
Figure 5.4 shows the molecular system before and after simulated annealing to a
temperature of 300K and a pressure of 300 atmospheres. The kerogen condenses and
reaches a quasi-minimum free energy at a temperature of 300K and a pressure of 300
atmospheres. Figure 5.5 shows the radial pair distribution function (g(r)) at a temperature
of 300K and a pressure of 300 atmospheres. The radial distribution function, g(r), gives
the probability of finding a particle at a distance (r) from another particle, averaged over
all of the particles in the system. The first two peaks in the radial pair distribution
function correspond to the C-C aromatic and C-C aliphatic bond lengths (1.35 Å and 1.55
Å, respectively) in the simulations. The radial pair distribution function calculated in this
work is in good agreement with the radial pair distribution function (calculated at 300K
and 0.98 atmosphere) of Ungerer et al. (2015), who developed the original molecular
structure model. To investigate the sorption of methane, carbon dioxide, and competitive
sorption of methane and carbon dioxide under subsurface conditions, after the annealing,
production runs (for measuring the volumetric swelling of kerogen and retention of
methane and carbon dioxide) were performed. These production runs were performed at
the reservoir temperature and pressure of 400 K and 300 atmospheres (the temperature
and hydrostatic pressure at a depth of »3 km).
The annealed kerogen structure was cut into thin, planar sections to visualize the pore

88
structure (Figure 5.6). This revealed sub-nanometer scale pores in the kerogen matrix.
These pores are difficult to visualize using electron microscopy since preparing such thin
sections may change the molecular scale morphology of the kerogen. Storage of methane
and/or carbon dioxide in these nanoscale pores may play an important role in
retention/production of natural gas and carbon dioxide sequestration. Methane molecules
trapped112 in these sub-nanometer pores are considered to be part of the sorbed methane.
There is a distribution of pore sizes with no clear distinction between methane sorbed by
the kerogen matrix (methane in pores of about the same size as a methane molecule),
methane sorbed on pore walls, and methane in pores that are large enough for some of the
methane to behave like bulk methane under subsurface temperature and pressure
conditions. A substantial fraction of the methane is sorbed strongly enough by the
kerogen to prevent recovery under normal conditions. However, the kerogen has a higher
affinity for carbon dioxide than for methane107,108, and carbon dioxide may displace
sorbed methane97 .
5.4 Simulation of Kerogen, Methane, and Carbon Dioxide System
The Molecular Dynamic (MD) simulations were performed for the ternary kerogen,
methane, and carbon dioxide system. The objective of the simulations was to calculate
volumetric swelling of the kerogen in presence of gasses and diffusion coefficients of
gases in the kerogen matrix: The following four scenarios were considered in the
simulations to meet that objective.
a. Pure kerogen,
b. Kerogen with methane (35% of the total kerogen mass),
c. Kerogen with carbon dioxide (the same number of molecules of carbon dioxide as

89
molecules of methane in scenario b),
d. Kerogen with carbon dioxide and methane in a 3:1 molecular ratio (the same total
number of molecules of carbon dioxide and methane as the number of molecules
of methane in scenario b). At 400K and 300 atmospheres, this scenario nominally
replicates in-situ conditions at a depth of approximately 3 km. The 3:1 ratio
between carbon dioxide and methane was based on selective sorption capacities
observed experimentally107,108.
The MD simulations for all four scenarios were performed under a reasonable
reservoir temperature (400K) and pressure conditions (300 atmospheres) at a depth of
approximately 3km. The amount of methane gas relative to kerogen (35% wt.) used in the
simulations was based on the adsorption isotherms for pure carbon and for shales, as
documented by other researchers107,108. The initial configurations of the multicomponent
systems in scenarios b, c, and d are similar. The initial configuration for scenario d is
shown in Figure 5.7 as an example. Initially, the gas (carbon oxide and/or methane) was
placed outside of the kerogen, and the gas molecules diffused into the kerogen and were
sorbed by it during the subsequent MD simulations. The shale samples studied by Heller
and Zoback (2014)108 included shales from the Eagle Ford and Marcellus formations. The
kerogen in both the Eagle Ford and Marcellus Shales is medium to high maturity type
II29,113, similar to the kerogen that is used in this study. The sorption of gases by kerogen
during the MD simulations indicates that the interaction between kerogen and gases is not
just a surface phenomenon (adsorption on kerogen surface or on pore walls made up of
kerogen) but also involves internal matrix-gas interaction (absorption). The final
configuration of the system after sorption of one or both of the gases is shown in Figure

90
5.8. The properties of interest – volumetric swelling and diffusion coefficients were
calculated during the final production run using an NPT ensemble at in-situ conditions
(400 K and 300 atmospheres).
In scenario a, the pure kerogen was simulated under in-situ subsurface conditions.
This is followed by scenario b in which the kerogen is exposed to a fixed amount (750
molecules) of methane gas. Part of this gas was sorbed by the kerogen, and the kerogen
swells as a result of the sorption. Previously, swelling of kerogen was attributed only to
adsorption of gases108 instead of a combination of adsorption and absorption, i.e.
sorption. The volumetric swelling in each of the scenarios b, c, and d was determined by
monitoring the change in volume of kerogen during the production runs (after the
simulated annealing runs) with methane and/or carbon dioxide. The diffusion coefficients
of the sorbed gases (carbon dioxide and methane) in the kerogen were calculated to
investigate their preferential retention in the kerogen. The mean square displacement of
the gas molecules inside the matrix of kerogen was recorded and diffusion coefficients
were calculated from the slope of mean square displacement versus time plots (an
example for the case of methane in scenario (b) is shown in Figure 5.9). The mean square
displacement was calculated for the final 100,000 steps of the production run. A short
time interval was used to ensure that the methane molecules that were tracked remained
in the kerogen. The relationship between the mean square displacement and time is
represented reasonably well by:
<r2> =6Dt (5.5)
where <r2> is the mean square displacement, t is time, and D is the diffusion coefficient.

91
5.5 Results and Discussion
Table 5.1 shows the volume of the kerogen with and without sorbed gases (carbon
dioxide and methane) at a pressure of 300 atmospheres and temperature of 400 K. The
swelling ratio (Qv) is defined as the ratio of the final volume of the swollen kerogen to
the initial volume of the annealed kerogen. The swelling ratio of kerogen that has sorbed
the same number of molecules (and therefore moles) of carbon dioxide and methane is
larger for methane, even though both gases have approximately the same molecular sizes.
The swelling ratio (Qv) of kerogen with decane was also calculated to compare it with
kerogen swelling ratios obtained from experiments conducted by other authors. The Qv
for type II kerogen in the presence of decane at room temperature and pressure from MD
simulations was calculated to be around 1.20. This decane swelling ratio matches closely
with the swelling ratio for Draupne type II kerogen (from North Sea Draupne Formation)
determined experimentally by Ertas D. et al. (2006). Draupne type II kerogen has a
maturity similar to the that of the kerogen model used in this study114.
The primary reason for the larger kerogen swelling ratio for methane as opposed to
carbon dioxide can be attributed to the polar nature and linear shape of the carbon dioxide
molecule. These features allow it to associate more strongly with kerogen and better fit
into pre-existing pores and free volume. The increase in volume for a given amount of
sorbed gas is higher if the mixing molecules (kerogen and methane in scenario b) have a
low affinity for each other (increase in volume in scenario b is higher than that in
scenario c). Therefore, kerogen swells more in the presence of methane than carbon
dioxide per mole of sorbed gas. Scenario (d) could represent a field situation when a
limited amount of carbon dioxide (roughly equal to or less than the gas-in-place) is

92
injected into a shale formation. In scenario (d), three quarters of the methane in scenario
(b) has been replaced by equal moles of carbon dioxide. The final equilibrium state in
scenario (d) represents in-situ kerogen with carbon dioxide and methane in 3:1 molar
ratio. There was net volumetric shrinkage of the kerogen from scenario (b) to scenario
(d). Therefore, if a volume of carbon dioxide – equal to or less than the gas-in-place
(GIP) – is injected during a carbon dioxide enhanced gas recovery operation, there would
possibly be a net shrinkage experienced by the kerogen. This is because kerogen
primarily would shrink when part of the methane is replaced by an equal number of
moles of carbon dioxide (going from scenario (b) to scenario (d)). However, if excess
carbon dioxide is injected, the kerogen may swell leading to consequences such as
permeability reduction, as seen in coalbed methane reservoirs. Also, the low permeability
of shales should be considered during controlled CO2 injection. Due to low permeability
to gases, shales may witness excess CO2 at the site of injection which may swell the
kerogen. Kerogen shrinkage during enhanced gas recovery through controlled carbon
dioxide injection would be smaller than the shrinkage in kerogen during the regular
methane production by desorbing the gas. However, in the latter case, there would not be
enhanced gas recovery by the process of exchange of sorbed methane with carbon
dioxide. The volumetric strain was calculated for each of the scenarios and is tabulated in
Table 5.2. Kerogen shrinkage or swelling may change the fluid pathways at the kerogen-
mineral-grain boundaries. This will increase the permeability of the formation. This will
also change the effective drainage volume available in the shale rocks. Higher
permeability and effective drainage area is required for better recovery from shales.
The diffusion coefficients of each gas in the kerogen were calculated to investigate
93
preferential retention in kerogen. These are tabulated for each scenario in Table 5.2.
Table 5.2 shows that the diffusion coefficient of methane in kerogen (scenario b) is an
order of magnitude higher than for carbon dioxide (scenario c). In scenario (d), similar
results were obtained, indicating that the interdiffusion coefficients of carbon dioxide and
methane in kerogen are largely unaffected by each other. Slower diffusion of carbon
dioxide in kerogen than methane indicates that carbon dioxide is strongly retained in the
kerogen matrix. The methane diffusion coefficients match well with the methane
diffusion coefficient determined by Ho et al. (2016)115 who used the same Ungerer et al.
(2015) kerogen model and a force field that is different from the force fields used by
Ungerer and in this study.
5.6 Conclusions
Molecular dynamics simulations of carbon dioxide/methane/kerogen systems were
performed with the objective of gaining a better understanding of the consequences of
carbon dioxide injection into gas-bearing organic-rich shales. The higher adsorption
capacity of kerogen for carbon dioxide than methane is well known. The MD simulations
demonstrated that methane and carbon dioxide sorb in the matrix of kerogen and this
increases (swells) its volume. However, the sorption of carbon dioxide will swell the
kerogen to a lesser extent than swelling induced by sorption of an equal number of moles
of methane. The MD simulations revealed that the sorbed carbon dioxide is more strongly
retained by the medium maturity type II kerogen than is methane – at least under the
reservoir temperature and pressure conditions. This preferential retention of carbon
dioxide promotes its sequestration in shale gas reservoirs. Swelling in methane-poor
reservoirs may impede permeability. Therefore, in the process of enhanced gas recovery
94
through carbon dioxide sequestration, the kerogen matrix may shrink if the injected
carbon dioxide volume is roughly equal to or less than the gas-in-place (GIP). In such a
case, operators may not worry about implications of swelling when pumping carbon
dioxide into the shale reservoirs. The change in kerogen volume affects fluid flow
pathways at the interface of kerogen and minerals. Net kerogen shrinkage in the case of
controlled injection of carbon dioxide may open new fluid pathways at the kerogen-
mineral-grain boundary and increase permeability that may lead to an improved recovery
from shales. Interaction of carbon dioxide with the mineral matrix (parts of shales other
than kerogen) and associated volumetric changes in the mineral matrix in presence of
carbon dioxide should be studied to complete the full picture of carbon dioxide
interaction with shales.
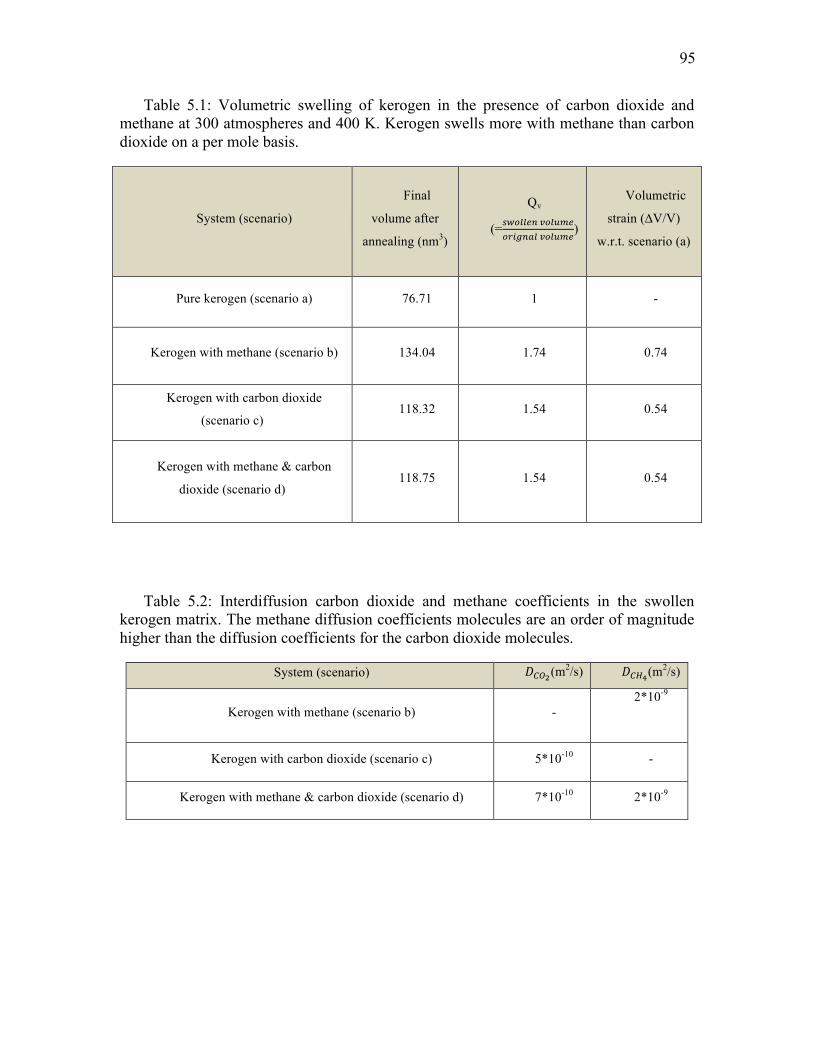
95
Table 5.1: Volumetric swelling of kerogen in the presence of carbon dioxide and methane at 300 atmospheres and 400 K. Kerogen swells more with methane than carbon dioxide on a per mole basis.
System (scenario)
Final
volume after
annealing (nm3)
Qv
(=�wE$$#2�E$��#Es(_2]$�E$��#
)
Volumetric
strain (∆V/V)
w.r.t. scenario (a)
Pure kerogen (scenario a) 76.71 1 -
Kerogen with methane (scenario b) 134.04 1.74 0.74
Kerogen with carbon dioxide
(scenario c) 118.32 1.54 0.54
Kerogen with methane & carbon
dioxide (scenario d) 118.75 1.54 0.54
Table 5.2: Interdiffusion carbon dioxide and methane coefficients in the swollen kerogen matrix. The methane diffusion coefficients molecules are an order of magnitude higher than the diffusion coefficients for the carbon dioxide molecules.
System (scenario) 𝐷���(m2/s) 𝐷���(m2/s)
Kerogen with methane (scenario b) - 2*10-9
Kerogen with carbon dioxide (scenario c) 5*10-10 -
Kerogen with methane & carbon dioxide (scenario d) 7*10-10 2*10-9

96
Figure 5.1. A Van Krevelen diagram, modified from McCarthy et al. (2011). Types I, II and III kerogen can generate oil and gas, and as they do, the maturity, which is often indicated by the atomic ratios of hydrogen to carbon (H/C) and oxygen to carbon (O/C), increase. Type IV kerogen, which is formed from charred organic matter and soot, has a high polyaromatic content. It produces no oil, but it may produce natural gas with a low yield. The model unit used for molecular dynamic simulations is shown by the red dot.

97
Figure 5.2. Molecular model of a single molecule of type II kerogen with medium to high maturity. The chemical formula of kerogen in this model is C242H219O13N5S2. The model was developed by Ungerer et al. (2015). In this model, the carbon, hydrogen, oxygen, nitrogen, and sulfur atoms are represented in green, white, red, blue, and yellow colors.
Figure 5.3. The variation in the density of the kerogen during simulated annealing. The density of the final annealed kerogen was 1.18g/cc.

98
Figure 5.4: The configurations of kerogen molecules before and after simulated annealing to a temperature of 300K and a pressure of 300 atmospheres. The initial density (0.22 g/cc) of the system (with molecules in green) was increased to a final density of 1.18 g/cc (system with molecules in pink) as the system condenses (shown by the yellow arrows) at the end of simulated annealing. The simulated annealing brings the kerogen to a quasi-minimum free energy state without chemical alteration. Simulations of the sorption of methane and carbon dioxide were conducted at 400 K and 300 atmospheres using this molecular configuration of kerogen as the initial state.

99
Figure 5.5: The radial pair distribution function of the simulated kerogen at a temperature of 300 K and a pressure of 300 atmospheres.
Figure 5.6: Planar thin sections of the kerogen model reveal sub-nanometer scale pores. Such pores are difficult to visualize through electron microscopy. These pores can become potential sites for entrapment of CO2 for the purpose of sequestration.

100
Figure 5.7: Initial configuration of kerogen and gas molecules. Initially the gas molecules were placed outside of the kerogen matrix. The gases may adsorb or absorb based on the interaction of each molecule with kerogen. The gas reservoir on the right contains both CO2 and CH4 molecules in red and green, respectively. The CO2 and CH4 molecules are in a 3:1 ratio with a total of 750 molecules.
Figure 5.8: Final configuration of kerogen and gas molecules (CO2 and CH4). The gas molecules that were originally outside but in contact with the kerogen matrix have been sorbed in the kerogen matrix. The atoms H, O, N, C, S are shown in white, red, blue, cyan, and yellow in the molecular model.

101
Figure 5.9: Plot of mean square displacement (MSD) in (𝐴𝑛𝑔𝑠𝑡𝑟𝑜𝑚𝑠F) versus time for methane starting at t = 9,000,000 time steps and ending at 9,100,000. The time is in units of molecular dynamics simulation time steps. The slope of the mean square displacement versus time relationship is the diffusion coefficient.
y = 0.0002x - 2035.5R² = 0.98155
0
5
10
15
20
25
30
8950000 9000000 9050000 9100000 9150000
MSD
of C
H4
Steps in the production run

CHAPTER 6
CONCLUSIONS
Over the last decade or so, shales have played a key role in increasing oil and gas
production in the United States. Shales contain organic matter known as kerogen. The
dimensions of pores in shales holding hydrocarbons are believed to be on the order of
nano meters. The fluids present in such small nanopores have different properties from
those measured in bulk. Kerogen behaves as crosslinked polymer and preferentially
absorbs different components of oil and swells in volume. Fluid saturation pressures at
given temperatures – bubble points for oils and dew points for condensates in the
nanopores, are affected by the pore walls in the vicinity of the fluid molecules and by the
swelling behavior of the kerogen. In this dissertation, the effects of kerogen swelling and
confinement of hydrocarbon fluids on bubble points of hydrocarbon liquids were studied
using modeling and experimental techniques. The numerical representations included
Molecular Dynamics simulations, and Gibbs Ensemble Monte Carlo simulations,
Thermogravimetric analysis, and Differential Scanning Calorimetry were used in the
experimental work. The experiments complimented the modeling results and confirmed
the effect of kerogen swelling and confinement on the thermodynamic properties of
analog formation hydrocarbon fluids. An approach of using carbon dioxide enhanced
recovery was proposed for gas-rich shales as carbon dioxide helps to get sorbed methane
103
gas out from the kerogen matrix in shale. This will increase the recovery of gas from the
gas-rich shales.
6.1 Original Contributions
The following original contributions in this dissertation account for the presence of
nanopores and kerogen in shales and their influence on the thermodynamic properties.
These original contributions are also the conclusions of this dissertation.
1. Effect of retained oil-free oil equilibrium on the bubble point of oil from shales
It was found that the bubble point pressure of Eagle Ford oil is suppressed in the
subsurface because of presence of kerogen in shales. The kerogen absorbs oil and
increases (swells) in volume. The absorbed/retained oil composition is different from
the free oil that did not penetrate into the kerogen matrix. The composition of an in-
situ oil (the sum of the retained and free oil phases) should be considered when
calculating the PVT properties of oils in shales. Due to the absorption by kerogen, the
bubble points of in-situ oils in an example Eagle Ford shale are lowered by as much
as 4150 to 16350 kPa at 400 K. This reduction depends on the expulsion efficiency,
and the type and maturity of the kerogen.
2. Effect of confinement of hydrocarbons on thermodynamic properties of oils
Shale is a nanoporous medium. The confinement of hydrocarbon fluids in these
nanopores changes the thermodynamic properties of these fluids. The Gibbs
Ensemble Monte Carlo simulations indicated that the critical density and critical
temperature of a 90:10 decane-methane mixture were suppressed when confined in a
3.5 nm slit representing a nanopore.
3. Experimental validation of the effect of kerogen and nanopores

104
Experiments were designed using thermogravimetric analysis (TGA) and
differential scanning calorimetry (DSC) to validate the effect of kerogen and
nanopores (confinement) in shales. The bubble point temperature for decane and Clay
Basin oil was reduced in the presence of kerogen and confinement. It was found that
the presence of kerogen has a larger influence on the bubble point temperature than
does confinement. The DSC experiments demonstrated a bubble point suppression of
over 40oC when the oil was absorbed in kerogen. This suppression includes the effect
of confinement and the effect of kerogen swelling (splitting of phase by absorbing oil
components selectively).
4. Carbon dioxide as possible solution for increasing gas recovery through its
sequestration
Carbon dioxide may have value as an injection fluid by replacing absorbed
methane in the kerogen matrix. The diffusion coefficients of carbon dioxide gas are
an order of magnitude smaller than for methane gas in a particular kerogen matrix.
Thus, carbon dioxide has a higher tendency for retention in the kerogen matrix than
methane gas. This can favor limited carbon dioxide sequestration in shales. If the
volume of the injected carbon dioxide is less than the gas-in-place (GIP) during an
enhanced gas recovery operation, there could be a net shrinkage in kerogen. A net
shrinkage of kerogen (matrix volume) in the case of controlled injection of carbon
dioxide may open new fluid pathways at the kerogen – mineral-grain boundary that
may lead to an improved recovery from shales.

REFERENCES
1. Swindell, G. S. Eagle Ford Shale -An Early Look at Ultimate Recovery. in SPE Annual Technical Conference and Exhibition (2012).
2. van Krevelen, D. W. COAL : typology, chemistry, physics, constitution. (Elsevier, 1961).
3. Tissot, B. P. & Welte, D. H. Petroleum Formation and Occurrence. (Springer-Verlag, 1984)
4. Vandenbroucke, M. & Largeau, C. Kerogen origin, evolution and structure. Org. Geochem. 38, 719–833 (2007).
5. Sandvik, E. I., Young, W. A. & Curry, D. J. Expulsion from hydrocarbon sources: the role of organic absorption. Org. Geochem. 19, 77–87 (1992).
6. Ertas, D., Kelemen, S. R. & Halsey, T. C. Petroleum Expulsion Part 1. Theory of Kerogen Swelling in Multicomponent Solvents. (2006). doi:10.1021/EF058024K
7. Pathak, M., Deo, M. D., Panja, P. & Levey, R. A. The Effect of Kerogen-Hydrocarbons Interaction on the PVT Properties in Liquid Rich Shale Plays. in SPE/CSUR Unconventional Resources Conference (Society of Petroleum Engineers, 2015). doi:10.2118/175905-MS
8. Miknis, F. P., Turner, T. F., Berdan, G. L. & Conn, P. J. Formation of soluble products from thermal decomposition of Colorado and Kentucky oil shales. Energy & Fuels 1, 477–483 (1987).
9. Curiale, J. A. & Curtis, J. B. Organic geochemical applications to the exploration for source-rock reservoirs - A review. J. Unconv. Oil Gas Resour. 13, 1–31 (2016).
10. Larsen, J. W. & Li, S. Changes in the Macromolecular Structure of a Type I Kerogen during Maturation. Energy & Fuels 11, 897–901 (1997).
11. Larsen, J. W. & Li, S. Solvent Swelling Studies of Green River Kerogen. Energy

106
& Fuels 8, 932–936 (1994).
12. Larsen, J. W. & Li, S. An initial comparison of the interactions of Type I and III kerogens with organic liquids. Org. Geochem. 26, 305–309 (1997).
13. Hruljova, J., Savest, N., Oja, V. & Suuberg, E. M. Kukersite oil shale kerogen solvent swelling in binary mixtures. Fuel 105, 77–82 (2013).
14. Ballice, L. Solvent swelling studies of Göynük (Kerogen Type-I) and Beypazarı oil shales (Kerogen Type-II). Fuel 82, 1317–1321 (2003).
15. Savest, N., Oja, V., Kaevand, T. & Lille, Ü. Interaction of Estonian kukersite with organic solvents: A volumetric swelling and molecular simulation study. Fuel 86, 17–21 (2007).
16. Ungerer, P., Collell, J. & Yiannourakou, M. Molecular Modeling of the Volumetric and Thermodynamic Properties of Kerogen: Influence of Organic Type and Maturity. Energy & Fuels 29, 91–105 (2015).
17. Wang, J., Wolf, R. M., Caldwell, J. W., Kollman, P. A. & Case, D. A. Development and testing of a general amber force field. J. Comput. Chem. 25, 1157–74 (2004).
18. Kelemen, S. R. et al. Direct Characterization of Kerogen by X-ray and Solid-State 13C Nuclear Magnetic Resonance Methods. Energy & Fuels 21, 1548–1561 (2007).
19. Martínez, L., Andrade, R., Birgin, E. G. & Martínez, J. M. Packmol: A Package for Building Initial Configurations for Molecular Dynamics Simulations. (2009). doi:10.1002/jcc.21224
20. Humphrey, W., Dalke, A. & Schulten, K. VMD: visual molecular dynamics. J. Mol. Graph. 14, 33–8, 27–8 (1996).
21. Plimpton, S. Fast Parallel Algorithms for Short-Range Molecular Dynamics. J. Comput. Phys. 117, 1–19 (1995).
22. Okiongbo, K. S., Aplin, A. C. & Larter, S. R. Changes in Type II Kerogen Density as a Function of Maturity: Evidence from the Kimmeridge Clay Formation. Energy & Fuels 19, 2495–2499 (2005).
23. Flory, P. J. Principles of polymer chemistry. (Cornell University Press, 1953).
24. Robinson, D. B. & Peng, D.-Y. The characterization of the heptanes and heavier fractions for the GPA Peng-Robinson programs. (Gas Processors Association, 1978).

107
25. Walters, C. C., Freund, H., Kelemen, S. R., Ertas, M. D. & Symington, W. Method for Predicting Petroleum Expulsion. (2013).
26. Whitson, C. H. & Sunjerga, S. PVT in Liquid-Rich Shale Reservoirs. in SPE Annual Technical Conference and Exhibition (Society of Petroleum Engineers, 2012). doi:10.2118/155499-MS
27. Lee, B. I. & Kesler, M. G. Generalized thermodynamic correlation based on three-parameter corresponding states. AIChE J. 21, 510–527 (1975).
28. Di Primio, R., Dieckmann, V. & Mills, N. PVT and phase behaviour analysis in petroleum exploration. Org. Geochem. 29, 207–222 (1998).
29. Romero, M. A. Subsurface and Outcrop Organic Geochemistry of the Eagle Ford Shale (Cenomanian-Coniacian) in West, Southwest, Central, and East Texas. (University of Oklahoma, 2014).
30. Pathak, M., Deo, M., Craig, J. & Levey, R. Geologic Controls on Production of Shale Play Resources: Case of Eagle Ford, Bakken and Niobrara. in Proceedings of the 2nd Unconventional Resources Technology Conference (American Association of Petroleum Geologists, 2014). doi:10.15530/urtec-2014-1922781
31. Hackley, P. C. & Cardott, B. J. Application of organic petrography in North American shale petroleum systems: A review. Int. J. Coal Geol. 163, 8–51 (2016).
32. Edman, J. D. & Pitman, J. K. Geochemistry of Eagle Ford group source rocks and oils from the first shot field area, Texas. in Gulf Coast Association of Geological Societies 60th Annual Convention 217–234 (Gulf Coast Association of Geological Socities, 2010).
33. Cardneaux, A. P. Mapping of the Oil Window in the Eagle Ford Shale Play of Southwest Texas using Thermal Modeling and Log Overlay Analysis. (University of Mississippi, 2012). at <http://etd.lsu.edu/docs/available/etd-07112012-122340/unrestricted/Cardneaux_Thesis.pdf>
34. Ritter, U. Solubility of petroleum compounds in kerogen. Org. Geochem. 34, 319–326 (2003).
35. Ritter, U. Fractionation of petroleum during expulsion from kerogen. J. Geochemical Explor. 78–79, 417–420 (2003).
36. McCarthy, K. et al. Basic Petroleum Geochemistry for Source Rock Evaluation. Oilf. Rev. 23, 32–43 (2011).
37. U.S. Energy Information. Technically Recoverable Shale Oil and Shale Gas Resources : An Assessment of 137 Shale Formations in 41 Countries Outside the

108
United States. U.S. Energy Information Administration (2013).
38. Brunauer, S., Emmett, P. H. & Teller, E. Adsorption of Gases in Multimolecular Layers. 407, 309–319 (1936).
39. Barrett, P. E., Joyner, L. G. & Halenda, P. P. The Determination of Pore Volume and Area Distributions in Porous Substances. I. Computations from Nitrogen Isotherms. J. Am. Chem. Soc., 73, 373–380 (1951).
40. Oja, V., Yanchilin, A., Kan, T. & Strezov, V. Thermo-swelling behavior of Kukersite oil shale. J. Therm. Anal. Calorim. 119, 1163–1169 (2014).
41. Hruljova, J., Savest, N., Yanchilin, A., Oja, V. & Suuberg, E. M. Solvent Swelling Of Kukersite Oil Shale Macromolecular Organic Matter In Binary Mixtures: Impact Of Specifically Interacting Solvents. Oil Shale 31, 365–376 (2014).
42. Green, T. K., Kovac, J. & Larsen, J. W. A rapid and convenient method for measuring the swelling of coals by solvents. Fuel 63, 935–938 (1984).
43. Larsen, J. W. & Flores, C. I. Kerogen chemistry 5. Anhydride formation in, solvent swelling of, and loss of organics on demineralization of Kimmeridge shales. Fuel Process. Technol. 89, 314–321 (2008).
44. Pinto, F., Gulyurtlu, I., Lobo, L. S. & Cabrita, I. Effect of coal pre-treatment with swelling solvents on coal liquefaction. Fuel 78, 629–634 (1999).
45. Sert, M. et al. Effect of solvent swelling on pyrolysis of kerogen (type-I) isolated from Göynük oil shale (Turkey). J. Anal. Appl. Pyrolysis 84, 31–38 (2009).
46. SONG, L., XUE, H., LU, S. & TIAN, S. The Research Progress on the Occurrence Mechanism of Detained Hydrocarbon. Acta Geol. Sin. - English Ed. 89, 164–165 (2015).
47. Raji, M., Gröcke, D. R., Greenwell, C. & Cornford, C. Pyrolysis, porosity and productivity in unconventional mudstone reservoirs: Free and Adsorbed Oil. in 3rd Unconventional Resources Technology Conference, San Antonio (2015).
48. Pankaj, T. Oil Shale Pyrolysis: Benchscale Experimental Studies and Modeling. (University of Utah, 2012).
49. Daw, J. E. Measurement of Specific Heat Capacity Using Differential Scanning Calorimeter. Idaho National Laboratory (2008).
50. ISO 11357-1:2016(en), Plastics — Differential scanning calorimetry (DSC) — Part 1: General principles. (2016). at <https://www.iso.org/obp/ui/#iso:std:iso:11357:-1:ed-3:v1:en>

109
51. Höhne, G., Hemminger, W. F. & Flammersheim, H. J. Differential Scanning Calorimetry. (Springer Berlin Heidelberg, 2013). at <https://books.google.co.in/books?id=0mzmCAAAQBAJ>
52. Collell, J. et al. Molecular Simulation of Bulk Organic Matter in Type II Shales in the Middle of the Oil Formation Window. Energy & Fuels 28, 7457–7466 (2014).
53. Jin, Z. & Firoozabadi, A. Flow of methane in shale nanopores at low and high pressure by molecular dynamics simulations. J. Chem. Phys. 143, 104315 (2015).
54. Kilk, K. et al. SOLVENT SWELLING OF DICTYONEMA OIL SHALE. OIl Shale 27, 26–36 (2010).
55. Zarragoicoechea, G. J. & Kuz, V. A. Critical shift of a confined fluid in a nanopore. Fluid Phase Equilib. 220, 7–9 (2004).
56. Wu, Q. Investigation of fluids flow behavior in nano-scale channels by using optic imaging system. (2014).
57. Wang, L. et al. SPE 169581 Experimental Study and Modeling of the Effect of Nanoconfinement on Hydrocarbon Phase Behavior in Unconventional Reservoirs. in SPE Western North American and Rocky Mountain Joint Regional Meeting (2014). doi:10.2118/169581-MS
58. Singh, S. K., Sinha, A., Deo, G. & Singh, J. K. Vapor− liquid phase coexistence, critical properties, and surface tension of confined alkanes. J. Phys. Chem. C 113, 7170–7180 (2009).
59. Sheng, L., Hadi, N. & Lutkenhaus, J. L. Effect of Confinement on the Bubble Points of Hydrocarbons in Nanoporous Media. AIChE J. 0, (2016).
60. Pitakbunkate, T., Balbuena, P. B., Texas, a, Moridis, G. J. & National, L. B. Effect of Confinement on PVT Properties of Hydrocarbons in Shale. 1–16 (2014). doi:10.2118/170685-PA
61. Gelb, L. D., Gubbins, K. E., Radhakrishnan, R. & Sliwinska-Bartkowiak, M. Phase separation in confined systems. Reports Prog. Phys. 62, 1573–1659 (1999).
62. Dong, X., Liu, H., Hou, J., Wu, K. & Chen, Z. Phase Equilibria of Confined Fluids in Nanopores of Tight and Shale Rocks Considering the Effect of Capillary Pressure and Adsorption Film. Ind. Eng. Chem. Res. 55, 798–811 (2016).
63. Barsotti, E., Tan, S. P., Saraji, S., Piri, M. & Chen, J.-H. A review on capillary condensation in nanoporous media: Implications for hydrocarbon recovery from tight reservoirs. Fuel 184, 344–361 (2016).

110
64. Carlson, T. Modeling van der Waals forces in graphite Structure of Graphene.
65. Jewett, A. I., Zhuang, Z. & Shea, J.-E. Moltemplate a Coarse-Grained Model Assembly Tool. Biophys. J. 104, 169a (2013).
66. Gasteiger, J. & Marsili, M. Iterative partial equalization of orbital electronegativity—a rapid access to atomic charges. Tetrahedron 36, 3219–3228 (1980).
67. Hanwell, M. D. et al. Avogadro: an advanced semantic chemical editor, visualization, and analysis platform. J. Cheminform. 4, 17 (2012).
68. Case, D. A. et al. The Amber biomolecular simulation programs. J. Comput. Chem. 26, 1668–1688 (2005).
69. Pathak, M., Deo, M., Craig, J. & Levey, R. Geologic Controls on Production of Shale Play Resources: Case of Eagle Ford, Bakken and Niobrara. in Proceedings of the 2nd Unconventional Resources Technology Conference (American Association of Petroleum Geologists, 2014). doi:10.15530/urtec-2014-1922781
70. Sheng, J. J. Enhanced oil recovery in shale reservoirs by gas injection. J. Nat. Gas Sci. Eng. 22, 252–259 (2015).
71. Pathak, M., Deo, M. D., Panja, P. & Levey, R. A. The Effect of Kerogen-Hydrocarbons Interaction on the PVT Properties in Liquid Rich Shale Plays. in SPE/CSUR Unconventional Resources Conference (Society of Petroleum Engineers, 2015). doi:10.2118/175905-MS
72. Pathak, M., Pawar, G., Huang, H. & Deo, M. D. Carbon Dioxide Sequestration and Hydrocarbons Recovery in the Gas Rich Shales: An Insight from the Molecular Dynamics Simulations. in Carbon Management Technology Conference (Carbon Management Technology Conference, 2015). doi:10.7122/439481-MS
73. Nagarajan, N. R., Honarpour, M. M. & Arasteh, F. Critical Role of Rock and Fluid - Impact on Reservoir Performance on Unconventional Shale Reservoirs. in Unconventional Resources Technology Conference, Denver, Colorado, 12-14 August 2013 1905–1910 (Society of Exploration Geophysicists, American Association of Petroleum Geologists, Society of Petroleum Engineers, 2013). doi:10.1190/urtec2013-194
74. Devegowda, D., Sapmanee, K., Civan, F. & Sigal, R. Phase behavior of gas condensates in shales due to pore proximity effects: Implications for transport reserves and well productivity. SPE Annu. Tech. Conf. Exhib. 1–22 (2012). doi:10.2118/160099-MS
75. Haider, B. A. Impact of Capillary Pressure and Critical Properties Shift Due To
111
Confinement on Hydrocarbon Production. (Stanford University, 2015).
76. Ma, Y., Chen, J.-H. & Jamili, A. Adsorption and Capillary Condensation in Heterogeneous Nanoporous Shales. in Unconventional Resources Technology Conference (URTeC) (2016). doi:10.15530-urtec-2016-2432657
77. Firincioglu, T. Bubble point suppression in unconventional liquids rich reservoirs and its impact on oil production. (Colorado School of Mines).
78. Nagy, S. & Siemek, J. Confined Phase Envelope of Gas-Condensate Systems in Shale Rocks. Arch. Min. Sci. 59, 1005–1022 (2014).
79. Jin, Z. & Firoozabadi, A. Thermodynamic Modeling of Phase Behavior in Shale Media. Soc. Pet. Eng. J. 190 (2016). doi:10.2118/176015-PA
80. Xiong, X., Devegowda, D., Civan, F. & Sigal, R. F. Compositional Modeling of Liquid-Rich Shales Considering Adsorption, Non-Darcy Flow Effects and Pore Proximity Effects on Phase Behavior. in Unconventional Resources Technology Conference (URTeC) (Society of Petroleum Engineers (SPE) , 2013).
81. Panagiotopoulos, A. Z. Adsorption and capillary condensation of fluids in cylindrical pores by Monte Carlo simulation in the Gibbs ensemble. Mol. Phys. 62, 701–719 (1987).
82. Panagiotopoulos, A. Z. Direct Determination of Fluid-Phase Equilibria by Simulation in the Gibbs Ensemble - a Review. Mol. Simul. 9, 1–23 (1992).
83. Sliwinska-Bartkowiak, M. et al. Phase Transitions in Pores: Experimental and Simulation Studies of Melting and Freezing. Langmuir 15, 6060–6069 (1999).
84. Lastoskie, C., Gubbins, K. E. & Quirke, N. Pore size heterogeneity and the carbon slit pore: a density functional theory model. Langmuir 9, 2693–2702 (1993).
85. Jones, J. E. On the Determination of Molecular Fields. II. From the Equation of State of a Gas. Proc. R. Soc. A Math. Phys. Eng. Sci. 106, 463–477 (1924).
86. Berthelot D. C. R. No Title. Hebd. Seanc. Acad. Sci., Paris 126, 1703. (1898).
87. Lorentz, H. A. Ueber die Anwendung des Satzes vom Virial in der kinetischen Theorie der Gase. Ann. Phys. 248, 127–136 (1881).
88. Steele, W. A. The physical interaction of gases with crystalline solids. Surf. Sci. 36, 317–352 (1973).
89. Steele, W. A. The interaction of gases with solid surfaces. (Pergamon Press, 1974). at

112
<https://books.google.com/books/about/The_interaction_of_gases_with_solid_surf.html?id=9BROAQAAIAAJ>
90. Martin, M. G. & Siepmann, J. I. Transferable Potentials for Phase Equilibria. 1. United-Atom Description of n-Alkanes. J. Phys. Chem. B 1998, 102, 2569–2577 (1998).
91. Singh, S. K., Saha, A. K. & Singh, J. K. Molecular Simulation Study of Vapor−Liquid Critical Properties of a Simple Fluid in Attractive Slit Pores: Crossover from 3D to 2D. J. Phys. Chem. B 114, 4283–4292 (2010).
92. Antoine, C. Tensions des vapeurs: nouvelle relation entre les tensions et les temperatures. Tensions de diverses vapeurs. Compt. Rend. 107, 681–684 (1888).
93. Thomson, G. W. The Antoine Equation for Vapor-pressure Data. Chem. Rev. 38, 1–39 (1946).
94. Poling, B. E., Prausnitz, J. M. & O’Connell, J. P. The Properties of Gases and Liquids. (McGraw-Hill Education). at <https://www.amazon.com/Properties-Gases-Liquids-Bruce-Poling/dp/0070116822>
95. Shale in the Unites States. (2016). at <https://www.eia.gov/energy_in_brief/article/shale_in_the_united_states.cfm>
96. Etminan, S. R., Javadpour, F., Maini, B. B. & Chen, Z. Measurement of gas storage processes in shale and of the molecular diffusion coefficient in kerogen. Int. J. Coal Geol. 123, 10–19 (2014).
97. Chandler, D. L. Realistic molecular model of kerogen’s nanostructure. (2016). at <http://phys.org/news/2016-02-nanopores-oil-gas-kerogen.html>
98. Al-Hasami, A., Ren, S. & Tohidi, B. CO2 Injection for Enhanced Gas Recovery and Geo-Storage: Reservoir Simulation and Economics. in SPE Europec/EAGE Annual Conference (Society of Petroleum Engineers, 2005). doi:10.2118/94129-MS
99. Jikich, S. A., Smith, D. H., Sams, W. N. & Bromhal, G. S. Enhanced Gas Recovery (EGR) with Carbon Dioxide Sequestration: A Simulation Study of Effects of Injection Strategy and Operational Parameters. in SPE Eastern Regional Meeting (Society of Petroleum Engineers, 2003). doi:10.2118/84813-MS
100. Khan, C., Amin, R. & Madden, G. Effects of CO2 and acid gas injection on enhanced gas recovery and storage. J. Pet. Explor. Prod. Technol. 3, 55–60 (2013).
101. Khan, C., Amin, R. & Madden, G. Carbon dioxide injection for enhanced gas recovery and storage (reservoir simulation). Egypt. J. Pet. 22, 225–240 (2013).

113
102. Oldenburg, C. M. & Benson, S. M. CO2 Injection for Enhanced Gas Production and Carbon Sequestration. in SPE International Petroleum Conference and Exhibition (Society of Petroleum Engineers, 2002).
103. Pathak, M., Panja, P., Huang, H. & Deo, M. Enhanced Recovery in Shales: Molecular Investigation of CO2 Energized Fluid for Re-Fracturing Shale Formations. in Unconventional Resources Technology Conferenc (Unconventional Resources Technology Conference, 2016).
104. Burke, L. H., Nevison, G. W. & Peters, W. E. Improved Unconventional Gas Recovery With Energized Fracturing Fluids: Montney Example. in SPE Eastern Regional Meeting (Society of Petroleum Engineers, 2011). doi:10.2118/149344-MS
105. Reynolds, M., Bachman, R., Buendia, J. & Peters, W. The Full Montney - A Critical Review of Well Performance by Production Analysis of Over 2,000 Montney Multi-Stage Fractured Horizontal Gas Wells. in SPE/CSUR Unconventional Resources Conference (Society of Petroleum Engineers, 2015). doi:10.2118/175948-MS
106. Eshkalak, M. O., Al-shalabi, E. W., Sanaei, A. & Aybar, U. Journal of Natural Gas Science and Engineering Simulation study on the CO 2 -driven enhanced gas recovery with sequestration versus the re-fracturing treatment of horizontal wells in the U . S . unconventional shale reservoirs. J. Nat. Gas Sci. Eng. 21, 1015–1024 (2014).
107. Charoensuppanimit, P., Mohammad, S. A. & Gasem, K. A. M. Measurements and Modeling of Gas Adsorption on Shales. Energy & Fuels 30, 2309–2319 (2016).
108. Heller, R. & Zoback, M. Adsorption of methane and carbon dioxide on gas shale and pure mineral samples. J. Unconv. OIL GAS Resour. 8, 14–24 (2014).
109. Kowalczyk, P., Furmaniak, S., Gauden, P. A. & Terzyk, A. P. Carbon Dioxide Adsorption-Induced Deformation of Microporous Carbons. J. Phys. Chem. C 114, 5126–5133 (2010).
110. Yang, S., Wu, W., Xu, J., Ji, D. & Chen, Z. Volume Effects on Methane-Shale Adsorption under Reservoir Conditions. in SPE EUROPEC/EAGE, 78th EAGE Conference and Exhibition (Society of Petroleum Engineers, 2016).
111. Stankiewicz, B. A., Kruge, M. A., Crelling, J. C. & Salmon, G. L. Density Gradient Centrifugation: Application to the Separation of Macerals of Type I, II, and III Sedimentary Organic Matter. Energy & Fuels 8, 1513–1521 (1994).
112. Bousige, C. et al. Realistic molecular model of kerogen’s nanostructure. Nat. Mater. 15, 576–582 (2016).

114
113. Nyahay, R., Leone, J., Smith, L. B., Martin, J. P. & Jarvie, D. J. Update on Regional Assessment of Gas Potential in the Devonian Marcellus and Ordovician Utica Shales of New York. in AAPG Eastern Section Meeting (AAPG Search and Discovery Article #10136, 2007). at <http://www.searchanddiscovery.com/documents/2007/07101nyahay/index.htm?q=%25252Btex>
114. Nykky, A. Pores, porosity and pore size distribution of some Draupne Formation and Colorado Group shales and kerogens. (Newcastle University, 2014). at <https://theses.ncl.ac.uk/dspace/handle/10443/2418>
115. Ho, T. A., Criscenti, L. J. & Wang, Y. Nanostructural control of methane release in kerogen and its implications to wellbore production decline. Sci. Rep. 6, 28053 (2016).