ph.d. thesis ahmed m. abdalla; mcmaster …...ph.d. thesis – ahmed m. abdalla; mcmaster university...
TRANSCRIPT

Ph.D. Thesis – Ahmed M. Abdalla; McMaster University –Engineering Physics
i
SYNTHESIS AND CHARACTERIZATION OF MAGNETIC CARBON NANOTUBES

Ph.D. Thesis – Ahmed M. Abdalla; McMaster University –Engineering Physics
ii
SYNTHESIS AND CHARACTERIZATION OF MAGNETIC CARBON NANOTUBES
By AHMED MOHAMED S. A. ABDALLA, B.Sc., M.Sc.
A Thesis Submitted to the School of Graduate Studies in Partial Fulfilment of the
Requirements for the Degree Doctor of Philosophy
McMaster University © Copyright by Ahmed Mohamed S. A. Abdalla, June 2017

Ph.D. Thesis – Ahmed M. Abdalla; McMaster University –Engineering Physics
ii
McMaster University DOCTOR OF PHILOSOPHY (2017) Hamilton Ontario
(Engineering Physics)
TITLE: Synthesis and Characterization of Magnetic Carbon Nanotubes AUTHOR: Ahmed
Mohamed S. A. Abdalla, B.Sc. (Military Technical Collage, Egypt), M.Sc. (Military
Technical Collage, Egypt) SUPERVISOR: Professor I. K. Puri NUMBER OF PAGES:
xxiv, 181.

Ph.D. Thesis – Ahmed M. Abdalla; McMaster University –Engineering Physics
iii
LAY ABSTRACT
The superior properties of carbon nanotubes (CNTs) are best manifested in bulk materials
when the CNTs are organized axially and in tandem, and embedded in a continuous matrix.
Decorating the CNTs with magnetic nanoparticles (MNPs) facilitates their organization
through “action from a distance” with a magnetic field. The attachment of MNPs to the
surfaces of CNTs can be realized through covalent or non-covalent (i.e. physical) bonding.
This work develops both methodologies to investigate how the physical properties of
magnetized CNT (mCNT) can be tuned and produce new CNT-based nanostructures for
particular applications. First, mCNTs are utilized to synthesize a hitherto unreported class
of colloidal suspensions based on which a magnetic bio ink is fabricated to print a fast-
response biological sensor. Next, nickel-coated CNTs prepared using electroless deposition
are used in the form of a filler at low volume fractions in an epoxy matrix, where they are
aligned along multiple-direction using magnetic field, producing either anisotropic or
isotropic bulk properties on demand. Finally, subsequent annealing of nickel-coated CNTs
in air oxidizes nickel to nickel oxide while carbon is released in the form of gaseous carbon
dioxide. This leads to another novel approach for the fabrication of nickel oxide nanotubes,
which are demonstrated to be an alternate viable material to fabricate electrodes for use in
supercapacitors.

Ph.D. Thesis – Ahmed M. Abdalla; McMaster University –Engineering Physics
iv
ABSTRACT
The superior properties of carbon nanotubes (CNTs) are best manifest in bulk materials
when the CNTs are organized in tandem and embedded in a continuous matrix. Decorating
the CNTs with magnetic nanoparticles (MNPs) facilitates their expedient organization with
a magnetic field. One of the most convenient methods for their decoration is to first treat
the CNTs with oxidative acids, and then coprecipitated MNPs in situ. This method results
magnetized CNTs that are covalently functionalized with the MNPs. The associated
destruction in the CNTs required running a comparative study of this protocol to identify
the influence of the acid treatment on the decoration of multiwalled CNTs (MWNTs).
Further, we explore means to tune the physical properties of these magnetized CNTs
(mMWNTs) by varying the (1) MNP material composition, and (2) MNP:MWNT (w/w)
magnetization weight ratio (γ). The resulted composite materials (mMWNTs) are utilized
to synthesize a novel and hitherto unreported class of colloidal suspensions (MCCs) for
which the dispersed phase, which consists of MWNTs decorated with MNPs, is both
magnetoresponsive and electrically conductive. Synthesis of the dispersed phase merges
processes for producing ferrofluids and mMWNTs. Later, these MCCs are adapted and
engineered to produce a biological ink containing MWNTs that are twice functionalized,
first with MNPs and thereafter with the anti-c-Myc monoclonal antibodies (Abs). The ink
is pipetted and dynamically self-organized by an external magnetic field into a dense
electrically conducting sensor strip that measures the decrease in current when a sample
containing c-Myc antigens (Ags) is deposited on it. On the other side, a nondestructive
methods to magnetize MWNTs and provide a means to remotely manipulate them is

Ph.D. Thesis – Ahmed M. Abdalla; McMaster University –Engineering Physics
v
through the electroless deposition of magnetic nickel nanoparticles on their surfaces. The
noncovalent bonds between Ni nanoparticles and MWNTs produce a Ni-MWNT hybrid
material (NiCH) that is electrically conductive and has an enhanced magnetic susceptibility
and elastic modulus. Raising γ (Ni:MWNT weight ratios) increases the coating layer
thickness, which influences the NiCH magnetic properties and tunes its elastic modulus.
The NiCH was used to fabricate Ni-MWNT macrostructures and tune their morphologies
by changing the direction of an applied magnetic field. Leveraging the hydrophilic Ni-
MWNT outer surface, a water-based conductive ink was created and used to print a
conductive path that had an electrical resistivity of 5.9 Ωm, illustrating the potential of this
material for printing electronic circuits. Further, the NiCHs are introduced into an epoxy
matrix at low 0.25-1% volume fractions and aligned along the direction of an applied
magnetic field, which produces anisotropic bulk properties. However, nanoparticles
aligned in perpendicular directions in sequential layers result in an effectively isotropic
composite material. Furthermore, the subsequent annealing of the NiCH in the presence of
air oxidizes nickel to nickel oxide whereas carbon is released as gaseous carbon dioxide,
which leads to a novel approach for the fabrication of nickel oxide nanotubes (NiONTs)
based on MWNTs as a sacrificial template. New chelating polyelectrolytes are used as
dispersing agents to achieve high colloidal stability both for NiCH and NiONTs. A
gravimetric specific capacitance of 245.3 F g-1 and areal capacitance of 3.28 F cm-2 at a
scan rate of 2 mV s-1 is achieved with an electrode fabricated using nickel oxide nanotubes
as the active element with a mass loading of 24.1 mg/cm2.

Ph.D. Thesis – Ahmed M. Abdalla; McMaster University –Engineering Physics
vi
TABLE OF CONTENT
1. Introduction ...................................................................................................................... 1
1.1 The Era of Nanotechnology .................................................................................. 1
1.2 The World of Carbon ............................................................................................ 3
1.3 Amazing Material: Carbon Nanotubes .................................................................. 4
1.4 Why to Functionalize CNT? ................................................................................. 5
1.5 Magnetizing CNT: A Way to Remotely Control & Manipulate ........................... 6
1.6 Outline ................................................................................................................... 7
1.6.1 Background .................................................................................................... 7
1.6.2 Magnetizing MWNT via Covalent Functionalization ................................... 8
1.6.3 Conductive Nano-inks Based on Covalently Magnetized MWNTs .............. 8
1.6.4 Magnetizing of MWNT via Non-covalent Functionalization (Ni-MWNT
Hybrid Nanomaterials) ................................................................................................. 9
1.6.5 Tailoring the Properties of a Ni-MWNTs Based Polymer Nanocomposite
Using a Magnetic Field ............................................................................................... 10
1.6.6 Supercapacitor Based on Nickel Oxide Nanotubes Synthesized from Ni-
MWNT Hybrid Nanomaterials ................................................................................... 10
1.5.7 Summary and Future Work .......................................................................... 11
2. Background .................................................................................................................... 12
2.1 Carbon Nanotubes ................................................................................................ 12
2.1.1 Historical......................................................................................................... 12
2.1.2 Structures and Main Types .............................................................................. 12
2.1.3 Unique Properties and Wide Applications ...................................................... 14
2.1.4 Synthesis Methods .......................................................................................... 15
2.1.5 Key problems of CNTs ................................................................................... 15
2.2 Carbon Nanotubes Functionalization ................................................................... 16
2.2.1 Non-Covalent Functionalization ..................................................................... 16
2.2.2 Covalent Functionalization ............................................................................. 17
2.3 Magnetism and Magnetic Nanomaterials ................................................................. 18
2.3.1 The magnetic moment .................................................................................... 18
2.3.2 Magnetic dipole .............................................................................................. 20
2.3.3 Magnetic Parameters ...................................................................................... 21

Ph.D. Thesis – Ahmed M. Abdalla; McMaster University –Engineering Physics
vii
2.3.4 Magnetic Domains .......................................................................................... 22
2.3.5 Magnetization Hysteresis Loop ...................................................................... 23
2.3.6 Classification of Magnetic Materials .............................................................. 23
2.3.7 Magnetic Nanomaterials ................................................................................. 25
2.4 Magnetization of Carbon Nanotubes ..................................................................... 26
2.4.1 Magnetization by Encapsulation .................................................................... 27
2.4.2 Magnetization by Surface Decoration ............................................................ 27
2.5 Potential Applications for Magnetic CNTs ........................................................... 29
2.5.1 Carbon Nanotubes in Nanofluids.................................................................... 29
2.5.2 Carbon Nanotubes in Polymer Composites .................................................... 31
3. Magnetizing MWNT via Covalent Functionalization ................................................... 33
3.1 Introduction .......................................................................................................... 33
3.2 Background Information ...................................................................................... 34
3.3 Methodology ........................................................................................................ 36
3.3.1 Materials and Reagents ................................................................................... 36
3.3.2 Acid-enabled Functionalization ..................................................................... 37
3.3.3 Decoration...................................................................................................... 38
3.3.4 Influence of MNPs Concentration and Chemical Composition .................... 39
3.3.5 Characterization Methods .............................................................................. 40
3.4 Results and Discussion ......................................................................................... 41
3.4.1 Synthesis of Magnetic MWNTs via Variable Acid-enabled Functionalization
.................................................................................................................................... 41
3.4.2 Influence of MNP Concentration on the Decoration of mMWNT ................ 52
3.4.3 Effects of Changing MNPs Chemical Composition on the mMWNTs ......... 55
3.5 Conclusion ............................................................................................................. 59
4. Conductive Nano-inks Based on Covalently Magnetized MWNTs .............................. 61
4.1 Introduction .......................................................................................................... 61
4.2 Background Information ...................................................................................... 62
4.3 Methodology ........................................................................................................ 66
4.3.1 Materials and Reagents .................................................................................. 66
4.3.2 Synthesis of Magnetoresponsive Conductive Colloids (MCCs) ................... 66
4.3.3 Synthesis of Magnetic Biological Ink............................................................ 68
4.3.5 Electrical Circuit, Sensor Assembly and Sensing.......................................... 71

Ph.D. Thesis – Ahmed M. Abdalla; McMaster University –Engineering Physics
viii
4.3.6 Characterization Methods .............................................................................. 72
4.4 Results and Discussion ......................................................................................... 73
4.4.1 Magnetoresponsive Conductive Colloids (MCCs) ........................................ 73
4.4.2 Adaptation of mMWNT for the Magnetic Biological Ink ................................. 75
4.4.3 Visualization of Ab Immobilization onto MWNT Surface ........................... 78
4.4.3 Fabrication of the Bio-sensor ........................................................................ 81
4.4.4 Sensing Measurements .................................................................................. 83
4.5 Conclusion ............................................................................................................. 88
5. Magnetizing of MWNT via Non-covalent Functionalization (Ni-MWNT Hybrid
Nanomaterials) ................................................................................................................... 90
5.1 Introduction .......................................................................................................... 90
5.2 Background Information ...................................................................................... 91
5.3 Methodology ........................................................................................................ 94
5.3.1 Materials and Reagents .................................................................................. 94
5.3.2 Catalyzing Carbon Nanotubes ....................................................................... 95
5.3.3 Synthesis of NiCH Nanostructures ................................................................ 95
5.3.4 Fabrication of NiCH Macrostructures ........................................................... 96
5.3.5 Ni-MWNT Water Based Conductive Inks .................................................... 97
5.3.6 Characterization Methods .............................................................................. 97
5.4 Results and Discussion ......................................................................................... 98
5.4.1 Material Phases .............................................................................................. 98
5.4.2 Elastic Modulus ........................................................................................... 103
5.4.3 Magnetic Properties ..................................................................................... 104
5.4.4 Tuning the NiCH Macrostructure Morphology ........................................... 107
4.4.5 Conductive Inks for Circuit Printing ........................................................... 108
5.5 Conclusion ........................................................................................................... 110
6. Tailoring the Properties of a Ni-MWNTs Based Polymer Nanocomposite Using a
Magnetic Field ................................................................................................................. 112
6.1 Introduction ........................................................................................................ 112
6.2 Background Information .................................................................................... 113
6.3 Methodology ...................................................................................................... 115
6.3.1 Materials and Reagents ................................................................................ 115
6.3.2 Electroless Plating of MWNTs with Nickel ................................................ 116
Ph.D. Thesis – Ahmed M. Abdalla; McMaster University –Engineering Physics
ix
6.3.3 Preparation of Epoxy Nanocomposites ....................................................... 116
6.3.4 Characterization Methods ............................................................................ 119
6.4 Results and Discussion ....................................................................................... 120
6.4.1 Nickel-Coated MWNTs ............................................................................... 120
6.4.2 Alignment of Ni-MWNT in the Epoxy Matrix............................................ 122
6.4.3 Tensile Strength of the Nanocomposites ..................................................... 124
6.4.4 Elastic Modulus E ........................................................................................ 126
6.4.5 AC Electrical Resistivity ρ .......................................................................... 128
6.5 Conclusion .......................................................................................................... 132
7. Supercapacitor Based on Nickel Oxide Nanotubes Synthesised From Ni-MWNT
Hybrid Nanomaterials ...................................................................................................... 134
7.1 Introduction ........................................................................................................ 134
7.2 Background Information .................................................................................... 135
7.3 Methodology ...................................................................................................... 137
7.3.1 Materials and Reagents ................................................................................ 137
7.3.2 Synthesis of Nickel Oxide Nanotube (NiONT) ........................................... 138
7.3.3 Preparation of Colloidal Suspension of Ni-MWNT and NiONT ................ 140
7.3.4 Characterization Methods ............................................................................ 140
7.3.5 Electrochemical Performance Testing ......................................................... 141
7.4 Results and Discussion ....................................................................................... 142
7.4.1 Synthesis of NiONT: Characterization and Elemental Analyses ................ 142
7.4.2 Stability of the Colloidal Suspension .......................................................... 146
7.4.3 Electrochemical Performance ...................................................................... 150
7.5 Conclusion ........................................................................................................... 152
8. Summary and Future Work .......................................................................................... 153
8.1 Thesis Summary .................................................................................................. 153
8.2 Future Work ........................................................................................................ 160
9. References .................................................................................................................... 163

Ph.D. Thesis – Ahmed M. Abdalla; McMaster University –Engineering Physics
x
LIST OF FIGURES
Figure 2.1: Different structures of CNTs……………………………………………...…13
Figure 2.2: A current passing through a loop produces a magnetic moment m and angular
momentum l………………………………………………………………….19
Figure 2.3: A magnetic field H apply a torque Γ on a magnetic dipole………………….21
Figure 2.4: Domain walls. (a) single domain. (b) 180 domain. (c) 90 domain…………22
Figure 2.5: Magnetization Hysteresis Loop..………………………………………….…23
Figure 2.6: Different types of magnetism. (a) Ferromagnetism. (b) Paramagnetism. (c)
Antiferromagnetism. (d) Ferrimagnetism…………………………………….24
Figure 2.7: The relation between the coercivity and the particle size……………………25
Figure 2.8: Polarization of CNTs placed in an ionic medium between two electrodes
charged by an electric field Ea…………………………………………...…...30
Figure 3.1: Magnetizing CNTs by coprecipitation. When CNTs are treated with strong
oxidizing acids, COOH, C=O, and C–OH groups are formed at defect sites. In
the presence of Fe+2, Fe+3 and a precipitating base, they serve as nucleation sites
for magnetite (Fe3O4) nanocrystals……………………………………....…...35
Figure 3.2. Schematic of the synthesis routes showing the variations used to produce the
six samples, S1-S6. Since intermediate filtration leads to the loss of MWNTs
that are shortened due to the damage caused by the acid, for routes S4-S6 the
acid functionalization process is ceased after the sample has been decanted and
diluted, i.e., co-precipitation is induced without any filtration or drying of the
acid-treated MWNTs………………………………………..……………..…38
Figure 3.3: Comparison of acid-treatment routes. XPS analysis shows that treatment with
HNO3 or H2SO4 leads to a moderate increase in oxygen content (4-5%) relative
to pure MWNTs (~2%). In contrast, treatment with a 1:1 mixture of the two
acids produces a much higher (15.23%) oxygen content……….…………....42
Figure 3.4: Comparison of Material Content of MWNTs. (a) The XRD (Co Kα, λ=1.79 Å)
patterns for S1-S3 (b) The average crystallite size, determined using the XRD
data by the Scherrer equation (3.3)) reveal a narrow particle size distribution of
8.5 -11.3 nm……………………………………………………………....…..43
Figure 3.5: IR spectra of samples S1-S3 reveal individual broad absorption bands at 528.5,
526.6 and 530.4 cm-1. The range between 490 and 560 cm-1 is associated with
the vibration of the Fe–O functional group for samples S1, S2 and S3. This
confirms magnetite formation since the absorption splits into multiple
absorption bands for maghemite. The shoulder peak at 623 cm-1 could imply
partial oxidation of magnetite into maghemite…………….…………………46
Figure 3.6: TEM images of samples S1-S6 show that the mMWNTs prepared with the
intermediate filtration steps (S1-S3) have denser and uniform decoration, while
those prepared without the step (S4-S6) have a sporadic non-uniform
decoration. Decorations for S1-S4 and S6 are clearly crystalline, while that for
S5 is largely amorphous, as demonstrated visually from the TEM image, and
also by comparing the electron diffraction pattern of each with that of pure
MWNTs (S0). Further, functionalization by either HNO3 or H2SO4 does not

Ph.D. Thesis – Ahmed M. Abdalla; McMaster University –Engineering Physics
xi
inflict structural damage on the MWNT surface, which is evident by the smooth
surfaces for S1, S2, S4 and S5. In contrast, S6, which was functionalized by a
mixture of the two acids, contains small (~ 100 nm) MWNT fragments,
emphasized by the circles and arrows. S3, which was also treated with the acid
mixture, does not contain these small fragments since these are lost during
filtration. However the structural damage is manifested in the form of increased
asperities on the MWNT surface……………………………………………...49
Figure 3.7: Magnetic Characterization. (a) The magnetized MWNTs (mMWNTs, left) are
attracted by a magnet, while the bare MWNTs (right) show no such response.
(b) Magnetic hysteresis curves. (c) The linear variation of Ms with the fraction
of MNPs (w/w) produced by the respective synthesis routes explains the
difference in Ms values produced by the various synthesis routes. (d) The Ms
values of the NPs were estimated by dividing the Ms of the mMWNT samples
S1-S3 by the mass fraction of the nanoparticles…………………………...…51
Figure 3.8: Influence of Fe3O4 - MWNT weight ratio (γ) on Morphology. Magnetic
nanoparticles are precipitated on activation sites. However, when γ is increased
above a certain value for which all available sites are occupied by MNPs, further
precipitation of the nanoparticles produces MNP agglomeration in a direction
perpendicular to the MWNT axis. An idealization of this process is presented
on the left……………………………………………………………………..53
Figure 3.9: Phases Analysis of Magnetized MWNTs. (a) The XRD (Co Kα) patterns show
that, besides C6, a nanocrystalline spinel phase was formed. The Spinel phase
in S1 was identified as magnetite (Fe3O4), in S1c it was Cu-Zn ferrite
(Cu0.4Zn0.6Fe2O4). The corresponding phase in S1m could not be identified
using the powder diffraction file (PDF) database. (b) EDX analysis revealed the
presence of Mn, Cu, Zn, Fe, and O, which supports our inference that S1m
contains Mn0.2Cu0.2Zn0.6Fe2O4……………………………...………………..56
Figure 3.10: TEM images of samples S1, S1m and S1c (from top to bottom) confirm that
all samples were successfully decorated with highly crystalline (but different)
MNPs that were synthesized within the narrow size distribution of 10-15
nm…………………………………………………………………………….57
Figure 3.11: Magnetic Characterization. (a) Magnetic hysteresis curves of the dry powders
shows no evidence of remanence, i.e., the mMWNTs are superparamagnetic.
(b) For all samples, Ms decreases with increasing temperature. Magnetite (S1)
has the strongest magnetization and weakest sensitivity to temperature, Mn-Cu-
Zn ferrite (S1m) has the weakest magnetization while Cu-Zn Ferrite (S1c) has
the strongest temperature sensitivity………………………………………….58
Figure 4.1: Synthesis of Magnetoresponsive Conductive Colloids (MCCs). (a) MWNTs are
first dispersed in water and then covalently functionalized with MNPs that are
coprecipitated in situ. The resulting mMWNTs are peptized using
tetramethylammonium hydroxide (TMAH) as a surfactant, yielding
magnetoresponsive conductive colloids (MCCs). (b) Upon visual inspection, an
aqueous dispersion of MCCs rests in the absence of a magnet (left) whereas it
is attracted towards a magnet when it is present (right)…………………...….67

Ph.D. Thesis – Ahmed M. Abdalla; McMaster University –Engineering Physics
xii
Figure 4.2: Synthesis of the magnetic biological ink and its use to print a c-Myc sensor.
MWNTs are treated with concentrated nitric acid, which produces unsaturated
carboxylic (–COOH) groups on the surface. Some of these groups act as
nucleation sites for the in situ co-precipitation of magnetite (Fe3O4) nanocrystals
and the remainder are available for anti-c-Myc amine (–NH2) groups to form
covalent bonds with the MWNT surfaces. The magnetic biological ink is then
deposited onto a glass substrate using a pipette where it dynamically organizes
under the influence of an external magnetic field and prints an electrically
conducting pattern………..……………………………………......................69
Figure 4.3: MCC Electrical Conductivity. (a) MWNTs placed in an ionic medium between
two electrodes charged by an electric field Ea polarize and become oriented
along the direction of the field. This MWNT orientation shortens the ion
transport path, decreasing the effective electrical resistance of the colloidal
suspension. (b) Dissolving 10% (w/w) of tetramethyl ammonium hydroxide
(TMAH) in DI water increases the electrical conductivity σ to 90.5 mS cm-1.
Dispersing 4% (w/w) of the different mMWNTs in the TMAH solution
enhances σ by 65-90%......................................................................................74
Figure 4.4: Apparent Zeta Potential Distribution. All three samples show a similar mean
zeta potential (N = 3), of 33 mV , which indicates moderate colloidal
stability.............................................................................................................75
Figure 4.5: X-Ray Diffraction Analysis of mMWNTs. The XRD (Co Kα, λ=1.79 Å) patterns
for magnetite:MWNTs weight ratios 𝛾 = 0.1, 0.2, and 0.4 which confirm the
presence of a magnetite (Fe3O4) phase and a hexagonal carbon phase from the
carbon nanotubes………………………………...…………………….……..77
Figure 4.6: TEM images of mMWNT samples at various magnetization weight ratios γ =
0.1 to 0.4 (from top to bottom) confirm that all samples have been successfully
decorated with crystalline MNPs synthesized within a narrow size distribution
around ~10 nm………………………………………………………………..77
Figure 4.7: Magnetic Characterization. Magnetic hysteresis curves show that all mMWNT
samples exhibit superparamagnetic behavior, but have different saturation
values Ms depending on their magnetite content (γ). The greater this content, the
stronger is the material response to a magnetic field…………………………78
Figure 4.8: Visualization of Ab immobilization on the surface of mMWNTs. First, FITC-
labeled fluorescent Abs are employed to confirm Ab immobilization on the
surface of mMWNTs for an Ab: MWNT weight ratio 𝛽 = 2.5×10⁻⁴ in an ink
where Abs are covalently bonded with mMWNTs that have Fe3O4: MWNT
weight ratios (a) 𝛾 = 0.1, (b) 𝛾 = 0.2 and (c) 𝛾 = 0.4, and (d) for an ink that
contains adsorbed Abs on mMWNTs with 𝛾 = 0.4. For (e) 𝛽 = 0, 𝛾 = 0.4, no
fluorescence is observed from MWNTs and Fe3O4, confirming that the
fluorescence observed in (a)-(d) originates from FITC-labeled Abs only. No
visual differences in fluorescence are detected for samples containing different
weight ratios of magnetite, and those containing adsorbed and covalently
bonded immobilized Abs. (f) STEM and EELS micrographs reveal the presence
of elemental carbon (C), oxygen (O) and nitrogen (N). The nitrogen, which is

Ph.D. Thesis – Ahmed M. Abdalla; McMaster University –Engineering Physics
xiii
present only in Anti-c-Myc Abs, confirms Ab immobilization on the conductive
MWNT network………………………………………..………………….....80
Figure 4.9: Printing technique and sensor assembly. (a) 10 μL of the magnetic bioink is
deposited on top of a glass coverslip that is placed on a permanent magnet. The
applied magnetic field concentrates and self organizes the functionalized
magnetic CNTs on the substrate. After the supernatant in the ink is evaporated,
a patterned strip of densely packed Ab-functionalized CNTs remains deposited
on the substrate, which forms the sensor. The STEM micrograph identifies
MNPs and anti-c-Myc that constitute the print based on the magnetic bioink.
Electrodes are readily connected to either end of the strip, providing current to
the sensor. (b) A voltage divider with a reference resistor Rref = 100 kΩ monitors
current changes that measure the biosensor responses to the various samples
that are deposited on it……………………………………..………………....82 Figure 4.10: Biosensor transient response. (a) Immediately after 2 μL samples are deposited
on the sensor strip, the DI water and BSA samples induce a rapid decrease in
electrical current, which subsequently levels out. In contrast, since the sensor is
inherently sensitive to c-Myc Ag interactions due to the anti-c-Myc Abs that are
covalently bonded to the surfaces of MWNTs, the current for all c-Myc samples
decreases to levels below those measured for DI water and BSA deposition,
which offers proof of targeted detection and sensor specificity to c-Myc Ags.
The higher the c-Myc concentration in a sample, the larger the current decrease
it induces. All of the deposited c-Myc samples produce a steady current decrease
during the period 30 s < t < 60 s. Normalizing the average current over that
duration leads to the quasi-linear response shown in (b). There is a linear
correlation in (c) between the normalized current gradients in (b) and the
corresponding c-Myc concentrations. Biosensor response to successive 1 μL
sample additions. (d) Acting as a control, magnetized MWNTs that are not
functionalized with Abs (i) cannot distinguish between 40 pM BSA and c-Myc
samples, black dashed and solid curves respectively. When anti-c-Myc is
immobilized on the MWNT surfaces through adsorption, again (ii) there is
insufficient discrimination between these two samples. In contrast, a sensor
fabricated using an ink in which anti-cMyc is attached to the MWNT surfaces
through acid functionalization, (iii) clearly distinguishes between the two
negative control samples, DI water and BSA, and the Ag of interest, c-
Myc…………….…………………………………………………………......86
Figure 5.1: CNTs magnetized with Ni by Electroless Deposition. (a) MWNTs were
catalyzed through two chemical treatment steps using acid solutions of SnCl2
for sensitization and PdCl2 for activation. Electroless deposition of Ni on the
resulting activated MWNTs (aMWNTs) used a plating solution containing a
nickel salt and a reducing agent, where nickel ions accept electrons from the
reducing agent to form metallic nickel through metal reduction……….......…91
Figure 5.2: Phases analysis of the Ni-CNT (NiCH) hybrid nanomaterials. (a) The XRD (Co
Kα) patterns for samples SN1, SN2 and SN3 show that a nanocrystalline nickel
phase formed on the MWNT surfaces. Oxidation of Sn2+ to Sn4+ was inferred

Ph.D. Thesis – Ahmed M. Abdalla; McMaster University –Engineering Physics
xiv
since no foreign phases were detected. There is also no evidence for the
formation of a crystalline Ni3P phase. Symbol sizes are varied to improve
illustration. (b) The EDX analysis for SN1-SN3 shows a small phosphorous
content as the reaction byproduct. (c) EDX/Dark Field STEM Line Scanning.
Nickel forms a wavy coating around MWNTs with slight variations in the layer
thickness and density. The measurements confirm the existence of MWNTs
inside the coating layer and Ni as the major component of the outer
coating………………………………………………………………………..99
Figure 5.3: Dark field STEM/TEM images of samples SN1, SN2, and SN3 at different
magnifications visualize the NiCH hybrid nanomaterial prepared through
electroless plating for different weight ratios γ =1, 2, and 3. The average
thickness of the Ni coating layer increases from 10 to 150 nm when γ increases
from 1 to 14 in the three samples. All samples show continuous coating of Ni
on the CNTs. Sample SN1 has a smaller Ni layer thickness and higher coating
layer porosity while the coatings for samples SN2 and SN3 have larger
thickness and better layer continuity. The Ni connections between MWNTs are
more obvious for SN3, which is a microcomposite with Ni forming a conductive
metallic matrix around reinforcing MWNTs……………..………………….101
Figure 5.4: SEM images of samples SN1 and SN3 at two magnifications confirm the
deposition of nickel in the form of merged Ni nanolayers that cover the outer
surfaces of the MWNTs. Nickel links the MWNTs through conductive
connections to produce micron-size networks…………...…………………102
Figure 5.5: AFM topographical and mechanical sketch up of samples S0, SN1 and SN2.
Pure MWNTs (S0) had an average elastic modulus E ~ 12.5 GPa while Ni-
MWNT samples for γ = 1, and 7 had values of E ~ 18.3 (46% increase) and 58.7
GPa (370% increase), respectively. Increasing Ni:MWNT weight ratio γ
enhances the measured modulus…………………………………....…….....103
Figure 5.6: Magnetic Characterization. Magnetic hysteresis curves show that samples SN1-
SN3 deviate from superparamagnetic behavior at room temperature (Mr < 1
emu/g and Hc < 30 Oe). For samples SN1 and SN2, γ increases from 1 to 7, but
Hc remains constant at 30 Oe while Ms and Mr increase from 4.1 and 0.51 emu/g
to 9.5 and 1.01 emu/g. For SN3, corresponding to γ = 14, single magnetic
domains are transformed into multimagnetic domains since the nickel coating
thickness increases to 100-150 nm………………………………………......105
Figure 5.7: Fabrication of Nickel-MWNT Macrostructures. Nickel deposition on the
vertically aligned Ni-MWNT hybrid nanomaterial (SN1, γ = 1) results in a
porous 3D macrostructure (DM1). With horizontal alignment, the resulting
macrostructure (DM2) is denser and flatter………………………....………106
Figure 5.8: Water based conductive inks. (a) The procedure for ink preparation. Ni-
MWNTs or MWNTs are dispersed in DI water using a probe sonicator and the
ink poured into a plastic template. (b) Post drying, optical images show the
morphology of the printed lines created by either MWNT or Ni-MWNT based
inks (2 vol%). Macroscale cracks are clearly observed in the case of MWNTs,
while smaller microscale cracks are observed for the other case. (c) The

Ph.D. Thesis – Ahmed M. Abdalla; McMaster University –Engineering Physics
xv
measured electric resistivity of the lines printed by Ni-MWNT based inks for
different volume loadings with and without magnetic assistance……..……108
Figure 6.1: Alignment of homogeneously dispersed Ni-MWNTs in epoxy matrix using
magnet sets placed on either side of a 6cm × 6cm × 1cm template containing
the nanocomposite. The arrow denotes the direction of the magnetic field
B…………………………………………………………………………….115
Figure 6.2: Preparation of different epoxy nanocomposites. The samples contain (a)
randomly dispersed MWNTs or MWNTrandom, (b) randomly dispersed Ni-
MWNTs, or Ni-MWNTrandom (c) Ni-MWNTs aligned along a single direction in
separate layers or Ni-MWNTaligned,1D, and (d) Ni-MWNTs aligned along
perpendicular directions in separate layers or Ni-MWNTaligned,2D……..….…116
Figure 6.3: Schematic of AC electrical resistivity measurements using an ultra-precision
capacitance bridge at 1 kHz…………………………………………………119
Figure 6.4: Phase and morphology of the synthesized Ni-MWNT samples. (a) TEM image
of the as prepared MWNTs, (b) dark field STEM image of an Ni-MWNT, (c)
magnetic response of the prepared Ni-MWNTs towards a magnet, and (d) the
magnetic hysteresis curve that shows that Ni-MWNTs exhibit quasi-
superparamagnetic behavior at room temperature (Ms ~ 9.5 emu g-1)………120
Figure 6.5: Simulated characteristics of the magnetic field within the sample. (a) A 2-D
simulation showing the topology of the magnetic lines of force and the field
magnitude within the sample along its (b) x and (c) y axes. The simulation is
conducted with the dimensions of the experimental setup and the magnet type
and size employed……………...……...........................................................121
Figure 6.6: Optical microscope images obtained at different times confirm Ni-MWNT
nanoparticle agglomeration into clusters that finally the align after 4 min along
the direction of the applied magnetic field oriented at (a) 0° and (b) 45° with
respect to an arbitrary axis…………………………………………………..122
Figure 6.7: Tensile strengths for different epoxy nanocomposites. The nanoparticle volume
fraction for all nanocomposites is 0.25%. The organization of the nanoparticles
within the epoxy matrix is also illustrated……….…………………………..124
Figure 6.8: AFM characterization of the cured polymer and its three nanocomposites,
MWNTrandom, Ni-MWNTrandom, and Ni-MWNTaligned,1D. (a) Surface topography,
(b) elastic modulus and (c) line scans of the elastic modulus. The
nanocomposites are prepared with a 0.25 vol% nanoparticle loading. While
epoxy has an average elastic modulus E ~ 17 GPa, which is similar to that for
the MWNTrandom sample, both Ni-MWNT composites reveal higher E up to ~
150 GPa………………………………………………………………..……126
Figure 6.9: AC electrical resistivity ρ measured at a frequency of 1 kHz. (a) Effect of nickel
coating and alignment on the resistivity of nanocomposites prepared with the
same 0.25% volumetric nanoparticle loading along with pictorial
representations of how the nanoparticles are organized within the epoxy matrix.
(b) Change in resistivity with volumetric loading for the Ni-MWNTaligned,2D
composite. A nanocomposite prepared with randomly distributed MWNTs at a
1% volume loading is used as reference sample for comparison………….…129

Ph.D. Thesis – Ahmed M. Abdalla; McMaster University –Engineering Physics
xvi
Figure 7.1: Synthesis of nickel-oxide nanotubes. (a) Schematic of the synthesis process for
nickel oxide nanotubes (NiONTs). It involves the electroless deposition of Ni
on MWNT, oxidation of Ni to NiO, and carbon of the MWNT to gaseous CO2.
The carbon dioxide is released, producing a tubular vacancy in the NiO bulk
where the MWNT originally existed. (b) TEM image of a MWNT, (c) dark field
STEM image of a Ni-MWNT, and (d) dark field STEM image of a
NiONT……………………………………………………………………....138
Figure 7.2: XRD patterns for Ni-MWNTs and NiONTs for two different Ni:MWNT weight
ratios, i.e., γ = 1 and 7. The absence of diffraction peaks corresponding to
MWNTs and the appearance of a diffraction peak corresponding to nickel oxide
after annealing confirms the removal of carbon and oxidation of Ni to
NiO………………………………………………………………………….141
Figure 7.3: TEM and STEM images of NiONT for two different Ni:MWNT weight ratio γ
= 1 and 7 at different magnifications. Panels a.1 and a.2 include TEM images
and panels a.3 & a.4 show dark field STEM images of NiONTs produced at γ =
1. Panels b.1 & b.2 likewise show TEM images and panels b.3 & b.4 dark field
STEM images for NiONT synthesized at γ = 7……...………………………143
Figure 7.4: EDX elemental analyses of NiONT for elemental Ni, C and O. (Panels a.1 and
b.1) along with line scans of the NiONTs synthesized at γ = 1 and 7,
respectively. The line scans are taken across the cross-sections of the respective
NiONTs shown in the accompanying STEM images. Panels a.2 and b.2 contain
elemental maps of NiONT for γ = 1 and 7, respectively…………………….144
Figure 7.5: Chemical structures of (a) PAZO and (b) PSSA and corresponding adsorption
mechanisms involving complexation of (c) salicylate groups of PAZO and (d)
carboxylic groups of PSSA with Ni atoms on the surfaces of (c) Ni-MWNT and
(d) NiONT…………………………………………….…………...………..146
Figure 7.6: Electrophoretic mobility of Ni-MWNTs (for γ = 1) and NiONTs (for γ = 1 and
7) with two dispersing agents, PAZO and PSSA…………………………...148
Figure 7.7: (a) CVs at different scan rates, (b) Nyquist plot of complex impedance, (c) real
and (d) imaginary components of AC capacitance calculated from the
impedance data versus frequency for NiONT (80%) - Ni-MWNT (20%)
composite electrodes with active mass of 24.1 mg/cm2………………….....150

Ph.D. Thesis – Ahmed M. Abdalla; McMaster University –Engineering Physics
xvii
LIST OF TABLES
Table 3.1: The XRD semi-quantitative analysis, obtained using TOPAS software, shows
that the MWNT:Fe3O4 weight ratio differs from the intended value of 1:1 (w/w)
that is stoichiometrically designed. (*A few peaks in the XRD spectrum for S5
result from material phases that could not be identified by TOPAS.)………...44
Table 3.2: The weight percentages of MWNT and Fe3O4 for samples S1-S3, measured
using a digital balance, deviates less than 5% from the corresponding
measurements approximated through XRD analysis…………...………….…44
Table 3.3: Yields of the various material phases, as a fraction of their stoichiometrically
designed values. The magnetization ratio γ is the ratio of Fe3O4: MWNT (w/w).
The intended value of this ratio is unity for all samples…………………...…45
Table 3.4: The calculated lattice parameters at all XRD diffraction planes for samples S1,
S2, and S3, obtained with Bragg’s Law. The average lattice parameters for these
samples concur with those for magnetite (Fe3O4)………………..………..….46
Table 4.1: MCC compositions and densities. In all MCCs, ≈4 weight percent of mMWNT
was dispersed in 10 weight percent TMAH aqueous solution. The densities of
the three MCCs are almost similar and lie between 1.22-1.26 g/cm. The small
variations occur due to the different MNP weight percentages and chemical
compositions…………….................................................................................73
Ph.D. Thesis – Ahmed M. Abdalla; McMaster University –Engineering Physics
xviii
ACKNOWLEDGEMENTS:
This dissertation could not have been completed without the great support that I have
received from so many people over the years. I would like to thank all the people who
contributed in some way to the work described in this thesis. I wish to offer my most
heartfelt thanks to them. First and foremost, I thank my Doctoral advisor, Professor. Ishwar
K. Puri, for accepting me into his group. During my tenure, he contributed to a rewarding
graduate school experience by giving me intellectual freedom in my work, engaging me in
new ideas, and demanding a high quality of work in all my endeavors. Thank you for the
advice, support, and willingness that allowed me to pursue research on topics for which I
am truly passionate. Additionally, I would like to thank my committee members Professor
John Preston, and Professor Gianluigi A. Botton for their interest in my work and their
continuing guidance, you have my ultimate gratitude.
Every result described in this thesis was accomplished with the help and support of
fellow lab-mates and collaborators. I would also like to thank Dr. Suvojit Ghosh for his
assistance and guidance in getting my research work started on the right foot and providing
me with the foundation for becoming a Ph.D. scholar. Additionally, I am very grateful for
the friendship of all of the Multiphysics Research Group, especially Dr. Rakesh Sahu, Dr.
Souvik Pal, Dr. Fei Geng, Abdel Rahman Abdel Fattah, Jenifer Tsai, Tahereh Majdi, Sarah
Mishriki, Ri Chen, and Huifang Pang, whom I worked closely and puzzled over many
problems. They helped me in numerous ways during various stages of my PhD. Many
thanks to Abdel Rahman Abdel Fattah, Tahereh Majdi, and Jenifer Tsai, my road-mates
Ph.D. Thesis – Ahmed M. Abdalla; McMaster University –Engineering Physics
xix
from the beginning of my study. Ours friendship led to many brain storming sessions which
results a lot of collaborative work and great projects that enriched my entire work. Thanks
to Sarah, Elvira Meleca, and Dr. Fei Geng whom opened my eyes to the beauty of biology,
and provided me with many biological knowledge. I wouldn’t be think to work in the
supercapacitors and microwave absorbers without the collaboration that I have received
from Ri Chen and Huifang Pang, thank you both for broaden my horizon. A very special
thank you to Dr. Rakesh Sahu for his invaluable advice and feedback on my research and
for always being so supportive of my work. He provides an ultimate guidance and
assistance which led to many collaborations and successful projects. I would like to thank
Professor. Igor Zhitomirsky for his advice and guidance through my first-time work in
energy storage materials (e.g. supercapacitors).
This work is supported by a Natural Sciences and Engineering Research Council of
Canada (Grant no.RGPIN-2014-04066) Discovery Grant (NSERC-DG), Canada
Foundation for Innovation (Grant no.33016) John R. Evans Leaders Fund (CFI-JELF) and
Ontario Research Fund Research Infrastructure (ORF-RI) grants. I would like to thank the
following for assistance with measurements: Dr. Gregory Wohl of Department of Mechanical
Engineering at McMaster University for assisting in tensile strength measurements, Dr.
Carmen Andrei of Canadian Centre for Electron Microscopy for TEM/STEM, Ms. Victoria
Jarvis of McMaster Analytical X-Ray Diffraction Facility for XRD, Dr. Paul Dube of
Brockhouse Institute for Materials Research, Professor. Marek Niewczas of Materials
Science and Engineering, McMaster University for PPMS, and Abhishaik Rampal of the
Department of Engineering Physics at McMaster university for assisting in the AC electrical

Ph.D. Thesis – Ahmed M. Abdalla; McMaster University –Engineering Physics
xx
resistivity measurements. AMA thanks the Egyptian Armaments Authority for a Ph.D.
scholarship.
Finally, and most importantly, I would like to acknowledge friends and family who
supported me during my time here. I would like to thank my wife Doaa Saleh. Her support,
encouragement, quiet patience and unwavering love were undeniably the bedrock upon
which the past eleven years of my life have been built. Thank you for your love, friendship,
and unyielding support. I thank my parents, for their faith in me and allowing me to be as
ambitious as I wanted. It was under their watchful eye that I gained so much drive and an
ability to tackle challenges head on. Also, I thank my siblings whom provided me with
unending encouragement and support.
Ph.D. Thesis – Ahmed M. Abdalla; McMaster University –Engineering Physics
xxi
LIST OF ABREVIATIONS
Ab Antibody
AC Alternative current
AFM Atomic force microscopy
Ag Antigen
aMWNT Activated multiwalled carbon nanotubes
Bioink Biological ink
BSA Bovine serum albumin
CNT Carbon nanotube
CVD Chemical vapor deposition
Dc Critical diameter
Dc Direct current
DI Water Deionized water
DLS Dynamic light scattering
DM Double magnetized
Ds Super paramagnetic diameter
DWNT Double walled carbon nanotubes
EDX Energy dispersive X-ray analysis
EELS Electron energy loss spectroscopy
EGFP Enhanced green fluorescent protein
ELISA Enzyme linked immunosorbent assay
FET Field effect transistor
FEMM Finite element method magnetics
FF Ferrofluid
FITC Fluorescein isothiocyanate
FTIR Fourier transformer infrared spectrometry
HRTEM High resolution transmission electron microscope
IGFs Insulin-like growth factor
Ph.D. Thesis – Ahmed M. Abdalla; McMaster University –Engineering Physics
xxii
mBioink Magnetic biological ink
MCC Magnetoresponsive and conductive colloidal suspension
MCH Metal-CNT hybrid nanomaterial
mCNT Magnetic carbon nanotube
MNP Magnetic nanoparticle
MWNT Multiwalled carbon nanotube
mMWNT Magnetic multiwalled carbon nanotube
NiCH Ni-CNT hybrid material
NiONT Ni oxide nanotube
NP Nanoparticle
PCR Polymeric chain reaction
PDF Powder diffraction file
PDMS Polydimethylsiloxane
PLC Programmable logic controller
PSA Prostate specific antigen
SEM Scanning electron microscopy
SQUID Superconducting quantum interference device
STEM Scanning transmission electron microscopy
SWNT Single walled carbon nanotubes
TEM Transmission electron microscopy
TMAH Tetra methyl ammonium hydroxide
VSM Vibrating sample magnetometer
XPS X-ray photoelectron spectroscopy
XRD X-ray diffraction
Ph.D. Thesis – Ahmed M. Abdalla; McMaster University –Engineering Physics
xxiii
LIST OF SYMBOLS
c Chiral vector
θ Angle
r Radius
ro The equilibrium bond length
χ Magnetic susceptibility
µ Permeability
H Magnetic field
E Electric field
B Magnetic induction
M Magnetization
Mr Remanence magnetization
Ms Saturation magnetization
Hc Coercive field
I Electric current
J Electric current density
q Electric charge
p Magnetic charges
ω Angular frequency
f Frequency
A Area
m Magnetic moment
mo Orbital magnetic moment
ms Spin magnetic moment
l Orbital angular momentum
s Spin angular momentum
v Velocity
me Electron mass

Ph.D. Thesis – Ahmed M. Abdalla; McMaster University –Engineering Physics
xxiv
ħ The reduced Planck constant (1.055 × 10⁻³⁴ J s)
μB Bohr magneton
F Force
Γ Torque
E Elastic modulus
N Number of moles
V Volume
U Potential energy
γ Magnetization weight ratio (MNP:MWNT)
𝛽 Bio-functionalization weight ratio (an anti-c-Myc:MWNT)
λ Wavelength
a, b, and c Lattice space parameters
D Crystal size
B The full width at half maximum
ζ Zeta potential
σ Electrical conductivity
R Electrical resistance
ρ AC Electrical Resistivity
Z* Complex impedance
CS* Complex differential capacitance

Ph.D. Thesis – Ahmed M. Abdalla; McMaster University –Engineering Physics
1
1. Introduction
1.1 The Era of Nanotechnology
Nanometer, a word referring to a length scale (one billionth of a metre) [1], is used to
express objects such as viruses (cold virus, 25 nm) and DNA molecule (width of 2 nm).
The understanding, measuring, manipulating, controlling, and using such nano-scaled
materials (dimensions of <100 nm) is defined as nanotechnology [1-3]. The 21st Century
can be considered as the era of the nanotechnology as this technology has spread across the
world and becomes one of the technologies with enormous potential for current and future
applications. Nanotechnology provides a unique and novel use and application in contrast
to that existing in conventional materials and technologies. Nowadays, nanotechnology
along with nanomaterials not only play an important role in science, research and
development, but also is ubiquitous in everyday’s life products [3]. Nanomaterials have a
huge surface area per unit volume in comparison to conventional materials, e.g. by splitting
an object with dimensions ~ cm into nano-fragments, the total surface area will therefore
increase by millions times [2, 4]. Top-down (e.g. nanofibers produced by electrospinning)
and bottom-up (e.g. carbon nanotubes (CNTs) produced by vapour deposition)
technologies are the most common approaches used currently to make nanomaterials [3,
4]. The former technology starts with a micro/macro-sized materials which is then
subsequently cut down to the nanometer scale using lithographical and etching techniques.

Ph.D. Thesis – Ahmed M. Abdalla; McMaster University –Engineering Physics
2
In contrast, the latter technology uses the self-organization of atoms or molecules to build
up the nanostructures [3, 4].
At the intermediate stage between the atomic level and bulk material, nanoparticles
gained a lot of interest. The nanomaterials feature exceptional physical properties that differ
from bulky materials, this includes chemical reactivity (catalysis), sensing activity,
absorption, dispersion ability, waterproofing, anti-microbial, high strength, and varying
thermal, electric, magnetic, optical properties [2, 4]. Nanomaterials are unique as most of
its material is situated at the surface, e.g. in single walled carbon nanotubes (SWNTs), all
the carbon atoms are located at the surface. Also, when the particle size becomes smaller
than the de Broglie wavelength, the optical properties of nanoparticles is significantly
affected. Further, at a size smaller than the critical domain size (~few nm), ferromagnetic
nanoparticles consists of a single domain that exhibits a superparamagnetic behavior where
any retained magnetization can be removed by thermal energy. Furthermore, if the
material’s structure can constrain the length of cracks caused by stress within few
nanometers, the stresses needed for the material failure would significantly increase [3].
Nanomaterials exists in different forms such as nanoparticles or even thin layer of
few atoms [2, 4]. Nanoparticles could be of metals, metals oxides or carbon. Spheres are
the most energetically favorable shape for the nanoparticles, however, other materials like
hollow nanoballs, nanorods, nanowires, or nanotubes of diameter in nano-scale and length
in nano/micro-scale can be formed. In all of them, carbon based nanomaterials provide a
wide variety of physical properties associated with low density and currently, used in many
potential applications [1].

Ph.D. Thesis – Ahmed M. Abdalla; McMaster University –Engineering Physics
3
1.2 The World of Carbon
Carbon (C, atomic number of 6) is the vital element of living creature and all known life.
It is the 4th most abundant element in the Universe by mass. The unique ability of carbon
to bond to itself and other elements forming millions of organic compounds and polymer
chains allows it to act as an important role in our life [5, 6]. Carbon atom has four electrons
participating in covalent bonding, resulting compounds with strong σ bonds due to the s
and p orbitals hybridization, whereas the 2pz orbitals can form weak π bonds in some other
cases [6, 7]. The most common form of carbon is soot which has an amorphous structure.
The formation of highly ordered carbon nanostructures with controlled morphology (tubes,
spheres, helices and Y-junctions) requires depositing carbon atoms under controlled
conditions [6]. Carbon atom is capable of forming multiple bonds (e.g. C-C, C=C and C≡C
bonding) allowing it to form many types of allotropes such as diamond (3D structure; cubic
lattice; sp3 hybridization) is the metastable form of carbon, graphite or graphene (2D
structure; layers with weak interlayer bonding; sp2 hybridization) are the most
thermodynamically stable form of carbon at room temperature, CNTs (1D structure; rolled
sheets of graphene; sp2 hybridization), fullerenes (0D structures; spheres formed by curling
up sheet of graphene; sp2 hybridization), and mesoporous carbon structures [6-10].
The carbon-carbon interaction significantly influences both the chemical and
physical properties of the formed compound [6, 10]. The featured physical and chemical
properties depends on their unique atomic structures [9, 10]. All carbon nanomaterials
benefit from the low atomic weight of the carbon atom (one-sixth of iron). SWNTs are the

Ph.D. Thesis – Ahmed M. Abdalla; McMaster University –Engineering Physics
4
strongest material synthesised to date, while diamond is the hardest known one. Carbon
nanomaterials have a wide electronic properties depending on the bonding and the
structure, e.g. carbon nanomaterials couth either be conductors, semi-conductors or even
insulators. In most of the carbon nanomaterials, surface functionalization can be performed
to modify their physical or chemical properties [6].
The carbon bonded structures with sp2 hybridization are the strongest material ever
measured on earth. The famous examples are CNTs and graphene which show the most
outstanding properties; i.e. exceptional mechanical properties, low density, huge surface
area, high stability, unique electrical and electronic properties, and wide electrochemical
stability window. They are widely used in a range of applications; e.g., reinforced
composite materials, catalysis, sensing, microelectronics, energy storage, energy
conversion devices, and medicine [8, 10, 11].
1.3 Amazing Material: Carbon Nanotubes
Graphite, an amazing member in the club of the carbon nanostructures with sp2
hybridization has the unique honeycomb atomic arrangement of the carbon atoms, where
each atom form three σ bonds with their neighbours atoms. In 1991 Iijima observed tubular
nanoshapes that are based on the unique structure of graphite. They consist of several
graphitic layers rolled up into tubular shape (multiwalled carbon nanotubes (MWNTs))
[12]. These CNTs are long and thin cylinders with a diameter of 1-100 nm, that provide a
best example of the true nanotechnology that is very useful for numerous applications.
CNTs are electrically conductive like copper with thermal conductivity five times more

Ph.D. Thesis – Ahmed M. Abdalla; McMaster University –Engineering Physics
5
than copper. Their measured mechanical strength is 20 times stronger than steel with
density 5 times lighter [5]. The discovery of the CNTs with these extraordinary properties
opened an incredible window for applications in the fields of materials science, electronics,
chemical processing, energy, and biomedical applications [5-7]. CNTs can be made of only
one layer of graphene (single-wall, SWNT), or many layers (multiwall, MWNT).
Practically, their production introduces defects into their basic hexagonal carbon structure
(e.g. pentagons, heptagons, and other imperfections) which degrade their featured physical
properties [6, 7, 13].
Usually, CNTs are synthetized by heating a carbon precursor in the presence of a
catalyst through one of three common fabrication techniques, e.g. arc-discharge, laser
ablation and chemical vapour deposition [6, 7, 9, 12]. However, most of the bulky
production results into unorganized CNT fragments that have limited properties which
disturb the efficient and reliable use in widespread technologies. This raises the demand of
obtaining, sorting and assembly techniques for large scale production of an organized and
aligned CNTs in the form of forests, yarns, and sheets [9, 13].
1.4 Why to Functionalize CNT?
By definition, functionalization means the introduction of foreign atoms or molecules into
the skeleton of the CNT, either by chemical bonding or physical adsorption [6, 14]. The
objective of functionalizing CNTs is to modify a certain physical and chemical properties
of the CNTs [6]. The extraordinary properties of the CNT make them suitable for several
field of applications. However, functionalization could act as a mean to tailor and engineer

Ph.D. Thesis – Ahmed M. Abdalla; McMaster University –Engineering Physics
6
new nanostructures according to the desired application [14]. Bridging or immobilizing
biological or chemical molecules onto the nanotubes allows them to perform as
bio/chemical sensors [14, 15]. Adsorption of oxygen molecules or functionalization with
ferromagnetic atoms convert the diamagnetic behaviour of the CNT to ferromagnetic.
SWNTs with zigzag chirality is a semiconductor with diamagnetic properties, however, the
coating with titanium makes it conductive and magnetic [14].
Another benefit of functionalizing CNTs is to overcome its surface related
problems. CNTs are poorly dispersible in polar solvents and polymer matrices. Surface
functionalization of CNT’s outer wall with polar molecular groups assists in enhancing the
dispersion ability and improves its interfacial bonding with polymer chains, which allows
effective utilization of CNT in solvent and composite applications [6]. Therefore,
functionalization of CNTs can improve the physical properties by overcoming the CNT’s
surface problems, e.g. functionalizing CNTs with magnetic nanoparticles to enhance their
dispersion ability and modifies their magnetic properties (a way to remotely control and
manipulate) which finally can result in organizing the dispersion inside a polar matrix [16-
19].
1.5 Magnetizing CNT: A Way to Remotely Control & Manipulate
Among different means of manipulation, magnetic field is the most economic, non-
intrusive and efficient tool that can be used to manipulate magnetic objects and particles
with action from a distance. It has been explored to manipulate and organize ferromagnetic,
as well as diamagnetic nanoparticles in tandem to produce a pattern with certain functions

Ph.D. Thesis – Ahmed M. Abdalla; McMaster University –Engineering Physics
7
[18, 20]. e.g. Pisanello et al. were able to change the dielectric properties of a matrix
utilizing the dynamic-assembly of magnetite nanoparticles under a magnetic field [21].
Also, Shin et al. successfully guided neurospheres that have been labeled with bacterial
magnetic nanoparticles using a magnetic field [22]. However, many other similar examples
of manipulating objects by magnetic field are also available [23-25].
When placed in an external magnetic field, magnetic nanoparticles feature large
dipole moments, which consequently allow them to align and agglomerate, forming chains
or rod-like microstructures [24]. This makes them very suitable to chaperone CNTs, and
later when embedded into the polymer matrix, gets aligned and organized under the
influence of external magnetic field. CNTs being quasi-one dimensional, their properties
will be best manifested in the bulk if they are aligned along a particular direction in the
matrix [18]. Herein, we are not only trying to magnetize CNTs in order to align them, but
also to overcome the CNT’s surface related problems, to allow their use in different
applications. Further, we are trying to align and organize the mCNTs inside a polymeric
matrix into a single layer i.e. aligning in 1D or in two consecutive layers aligned in
perpendicular directions i.e. aligning in 2D and furthermore, investigate the effect of these
aligning on the physical properties of the produced composites.
1.6 Outline
1.6.1 Background
The background chapter is intended to provide the reader with an overview of
magnetization techniques in preparation for subsequent chapters. The reader will learn

Ph.D. Thesis – Ahmed M. Abdalla; McMaster University –Engineering Physics
8
primarily about CNTs: history, structures, types, applications, and key problems, and
magnetism and its fundamentals, followed by the methodologies for functionalizing and
magnetizing CNTs. A brief discussion on the potential applications of the mCNT is also
provided.
1.6.2 Magnetizing MWNT via Covalent Functionalization
In this chapter, background information and experimental investigations are presented to
highlight the magnetization of MWNT via covalent functionalization. The results discussed
in this chapter have been previously published in the articles titled Decorating carbon
nanotubes with co-precipitated magnetite nanocrystals, Ahmed M Abdalla, Suvojit Ghosh,
and Ishwar K Puri, available online on April 08, 2016 (DOI:
10.1016/j.diamond.2016.04.003) in the Diamond and Related Materials and
Magnetoresponsive conductive colloidal suspensions with magnetized carbon nanotubes,
Ahmed M Abdalla, Abdel Rahman Abdel Fattah, Suvojit Ghosh, and Ishwar K Puri,
available online on August 08, 2016 (DOI: 10.1016/j.jmmm.2016.08.031) in the Journal
of Magnetism and Magnetic Materials. The author of this thesis is the first author and main
contributor of the above mentioned publications and has conducted all the experiments.
1.6.3 Conductive Nano-inks Based on Covalently Magnetized MWNTs
In this chapter, background information and experimental investigations are presented to
highlight the application of magnetic MWNT synthesised via covalent functionalization in
the fabrication of conductive nano-ink and then the adaptation of this ink to print a
biosensor. Some of the results discussed in this chapter have been previously published in
an article titled Magnetoresponsive conductive colloidal suspensions with magnetized
Ph.D. Thesis – Ahmed M. Abdalla; McMaster University –Engineering Physics
9
carbon nanotubes, Ahmed M Abdalla, Abdel Rahman Abdel Fattah, Suvojit Ghosh, and
Ishwar K Puri, available online on August 08, 2016 (DOI: 10.1016/j.jmmm.2016.08.031)
in the Journal of Magnetism and Magnetic Materials. The author of this thesis is the first
author and main contributor of the above mentioned publication and has conducted all the
experiments. Rest of the work and results have been previously published in an article titled
Magnetic Printing of a Biosensor: Inexpensive Rapid Sensing to Detect Picomolar Amounts
of Antigen with Antibody-Functionalized Carbon Nanotubes, by Abdel Rahman Abdel
Fattah, Ahmed M Abdalla, Sarah Mishriki, Elvira Meleca, Fei Geng, Suvojit Ghosh, and
Ishwar K. Puri, available online on March 20, 2017 (DOI: 10.1021/acsami.6b15989) in
ACS Applied Materials and Interfaces. The author of this thesis is the co-first author with
Dr. A. R. Abdel Fattah, Ms. S. Mishriki of the above mentioned publication and has
performed the magnetization of carbon nanotubes toward the biological ink’s preparation
and done the materials characterization.
1.6.4 Magnetizing of MWNT via Non-covalent Functionalization (Ni-MWNT Hybrid
Nanomaterials)
In this chapter, background information and experimental investigations are presented to
highlight the magnetization of MWNT via non-covalent functionalization. The results
discussed in this chapter have been previously published in an article titled Fabrication of
Nanoscale to Macroscale Nickel-Multiwall Carbon Nanotube Hybrid Materials with
Tunable Material Properties, Ahmed M Abdalla, Tahereh Majdi, Suvojit Ghosh, and
Ishwar K Puri, available online on December 07, 2016 (DOI: 10.1088/2053-
1591/3/12/125014) in the Material Research Express. The author of this thesis is the first

Ph.D. Thesis – Ahmed M. Abdalla; McMaster University –Engineering Physics
10
author and main contributor of the above mentioned publication and has conducted all the
experiments.
1.6.5 Tailoring the Properties of a Ni-MWNTs Based Polymer Nanocomposite Using a
Magnetic Field
The background information presented in this chapter is meant to briefly inform the reader
about the advances and limitations of using CNTs in polymeric composite materials. An
experimental investigation followed by results and discussion section highlights the effect
of multi-directional alignment of nickel coated CNTs inside a polymer matrix on the
physical properties of the resulted composite. The results discussed in this chapter have
been submitted to the journal of Composites part B: Engineering. The author of this thesis
is the first author and main contributor of the above mentioned publication and has
conducted all the experiments.
1.6.6 Supercapacitor Based on Nickel Oxide Nanotubes Synthesized from Ni-MWNT
Hybrid Nanomaterials
The background information presented in the chapter discusses the application of metal
oxides in supercapacitors followed by experimental investigations highlighting a novel
approach for the fabrication of nickel oxide nanotubes based on MWNTs as a sacrificial
template. The results discussed in this chapter have been previously published in an article
titled Nickel Oxide Nanotubes Synthesis using Multiwalled Carbon Nanotubes as
Sacrificial Templates for Supercapacitor Application, Ahmed M Abdalla, Rakesh P. Sahu,
Cameron J. Wallar, Ri Chen, Igor Zhitomirsky, and Ishwar K Puri, available online on
January 16, 2017 (DOI: 10.1088/1361-6528/aa53f3) in Nanotechnology. The author of this

Ph.D. Thesis – Ahmed M. Abdalla; McMaster University –Engineering Physics
11
thesis is the first author and main contributor of the above mentioned publication and has
conducted all the experiments except the electrochemical characterization section.
1.5.7 Summary and Future Work
This final chapter provides a summary of the entire thesis with an emphasis on the
contributions of each chapter. These concluding remarks reconnect the various chapters
and works conducted in the thesis emphasizing the usefulness of mCNTs in potential
engineering applications. Further, the chapter includes some thoughts about the future work
that has to be done to fill the gaps and improve the current work.

Ph.D. Thesis – Ahmed M. Abdalla; McMaster University –Engineering Physics
12
2. Background
2.1 Carbon Nanotubes
2.1.1 Historical
With little scientific interest then, during 1970s, vapour grown, carbon nano-filaments were
produced as a by-product during oxygen-limited combustion along with carbon fibers.
Later, in 1991, these nano-filaments were investigated by Iijima using high resolution
transmission electron microscopy (HRTEM), which led to the discovery of multiwalled
carbon nanotubes (MWNTs) [26]. In 1993, single wall carbon nanotubes (SWNTs) were
also reported by Iijima [27], and by Bethune [28]. SWNTs have a simpler structure that
opened a door to produce novel electronics based on the characteristics of these carbon
nanotubes (CNTs) that were experimentally proven in 1998 [29].
2.1.2 Structures and Main Types
A SWNT is a one-dimensional graphene sheet rolled into a cylindrical shape within a
diameter of about 1-2 nm [27]. Double wall carbon nanotubes (DWNTs) have a
morphology and properties similar to those of SWNTs but with significantly enhanced
chemical resistance [30]. MWNTs consist of concentric cylinders of 10-80 nm in diameter
formed by multiple wrapped graphene sheets with a ≈3.3 Å interlayer distance [31]. The
rolled graphene sheet of these nanotubes is characterized by a repeated hexagonal pattern
that consists of covalently bonded carbon atoms [32]. Each C atom forms three strong sp2
hybridized covalent bonds (σ-bonds) with three neighbouring atoms that have intersection
angles of 120º. This sp2 hybridization combines a 2s orbital with two 2p orbitals in the

Ph.D. Thesis – Ahmed M. Abdalla; McMaster University –Engineering Physics
13
carbon atom. However, the third 2p orbital forms a relatively weak π-bond, which is
commonly used for covalent functionalization of a MWNT with external molecules. The
three strong σ-bonds are mainly responsible for the unique properties of SWNTs and
MWNTs [30].
Although CNTs are cylindrical, they have many different structures that depend on
how the graphene sheet has been rolled. Figure 2.1 shows the honeycomb lattice of
graphene folded into different types of CNT, directed by the orientation of the two unit
vectors a1 and a2. The lattice or chiral vector c = na1 + ma2 is expressed using two integers
n and m. The CNT structure is identified through the chiral angle (θ) between the c and a1
vectors (0ο-30ο). The electronic properties of CNTs changes significantly with the chiral
vector from conducting to semiconducting [33].
Figure 2.1: Different structures of CNTs.
Armchair and zigzag nanotubes are two cases of achiral nanotubes while chiral
nanotubes have a unique structure (Figure 2.1). The naming originates from the shape of
the cross-sectional ring as the armchair structure has the chiral directions (n, n); chiral angle

Ph.D. Thesis – Ahmed M. Abdalla; McMaster University –Engineering Physics
14
(θ) = 30° with metal like conductivity whereas the zigzag structure has chiral directions (n,
0); chiral angle (θ) = 0° with semi conducting properties, and the chiral structure has chiral
directions (n, m); chiral angle (θ) = 0° < θ < 30° [34]. The CNT radius (rCNT) and chiral angle
(θ) are determined from the following expressions (where ro denotes the equilibrium bond
length ≈ 0.1421 nm) [30],
2 203
2CNT
rr n mn m
, (2.1)
1
2 2
2cos
2
n m
n mn m
. (2.2)
2.1.3 Unique Properties and Wide Applications
The electrical properties of CNTs are influenced by their chirality (n, m) and tube
diameters. CNTs can either be metallic, or semiconducting with small and large band gap
[30]. Typically MWNTs are metal-like with a measured electrical resistivity of 10-4 to 10-3
Ω cm [34] with a current carrying capacity up to 109 A cm–2, which is 1000 times greater
than that of copper [13, 35]. Because of their unique shape and structures, CNTs have an
exceedingly higher longitudinal thermal conductivity than graphite [30]. CNTs have high
thermal conductivities in the range of 1750–5800 W m−1 K−1 at room temperature, which
is next to pure diamond [34]. These nanotubes have high thermal stability up to ~2800 °C
in vacuum and ~750 °C in air [31, 35]. CNTs also have a high surface area (200-900 m2 g-
1), low density (1-2 g cm-3), and superior mechanical properties. The reported high tensile
strength and Young’s modulus for SWNTs has been as high as 150 GPa and 1.8 TPa,
respectively, and for MWNTs up to 100 GPa and 1.0 TPa, respectively [13, 31, 34]. CNTs

Ph.D. Thesis – Ahmed M. Abdalla; McMaster University –Engineering Physics
15
have many applications, including in sensors [36, 37], fuel storage [38, 39], high-strength
materials, conductive suspensions [40], scanning microscopy tips [34], nanoelectronics
[41, 42], and biomedicine [43-46].
2.1.4 Synthesis Methods
Originally, CNTs were produced through arc discharge, which is considered to be the oldest
production method for these nanotubes [47]. Recently, chemical vapour deposition (CVD)
techniques have replaced other methods due to several advantages, including the ability for
large scale production, large growth areas, production of higher purity, aligned and longer
CNTs, and lower cost. During the CVD process, hydrocarbon gases (e.g. ethylene) are
decomposed on a hot catalytic metal substrate (~1000˚C) inside a reactor at atmospheric
pressures to sustain CNT growth on the metallic catalyst. The catalyst can be introduced as
a solid, deposited on a substrate (e.g. Si, SiO2, or glass), or injected as a gas (that is fed with
the reactants) [48-50]. A high magnetic field (10 T) can be used to provide control over the
CNT morphology [51]. Currently, plasma enhanced CVD has replaced thermal-based
CVD, since it is able to reduce the decomposition temperature of the hydrocarbon gas (~550
°C) [49, 50, 52].
2.1.5 Key problems of CNTs
A CNT is an anisotropic material with a one dimensional structure. Typically,
commercially available CNTs are entangled and randomly orientated because of the van
der Waals attractions between individual CNTs and/or Brownian motion in the dispersing
medium. The randomness for highly anisotropic material reduces their application
efficiency [53-56]. CNTs are diamagnetic materials, like graphite, which has a diamagnetic

Ph.D. Thesis – Ahmed M. Abdalla; McMaster University –Engineering Physics
16
susceptibility χ of 10-5 emu g-1 [57, 58]. Furthermore, CNTs are hydrophobic because of
their non-polar honeycomb structure, which prevents the formation of hydrogen bonds with
water molecules. This hydrophobicity reduces the compatibility of CNTs with many
dispersing mediums, including polar solvents and polymers [59, 60]. Finally, CNTs are
commercially produced in the powder form and their manipulation and control at the micro
and macro scale is a practical challenge that limits their applications.
2.2 Carbon Nanotubes Functionalization
Functionalization is defined as the introduction of external molecular groups onto CNT in
order to modify a certain physical and chemical properties [14]. The bonding between a
CNT and an external molecule could be of either chemical (e.g. covalent) or physical (e.g.
van der Waals force) nature. Functionalization offers a method to chaperone CNTs, e.g.
functionalization with a magnetic nanoparticle can provide a way to control and manipulate
the now magnetic CNT from a distance. Also, active functional groups such as carboxylic
acid can enhance CNT compatibility with dispersing mediums [61].
2.2.1 Non-Covalent Functionalization
This method is based on utilizing weak bonds like the Van der Waals force between a CNT
surface and an external molecule. Mild reaction conditions do not affect the CNTs surface
significantly, which is a significant advantage [62]. The non-covalent functionalization can
be done through several techniques including biological, metal and polymer
functionalization.
Ph.D. Thesis – Ahmed M. Abdalla; McMaster University –Engineering Physics
17
Bio-functionalization creates bioactive CNTs by the conjugation of bio materials
such as DNA or proteins to the CNT wall, e.g., for biosensing, drug carriers [15, 62-64]
and in artificial muscles [65]. The polymer functionalization induces Van der Waals force
to wrap polymer chains around CNT walls [66]. Endohedral functionalization is another
non-covalent method where external molecules are encapsulated inside the CNT driven by
the capillary effect [66]. Metallic functionalization is performed by depositing a metal
nanoparticle, such as Au, Ag or Ni, onto the outer surface of a CNT [62]. Attentions has
been focused on electroless plating since it produces a more uniform and less porous layer
over irregular and tiny surfaces than conventional electroplating [67].
2.2.2 Covalent Functionalization
While CNTs are inherently inert due to the stable sp2 hybridized C-C σ bonds, they usually
contain defect sites, which occur during production and mechanical loading. Local bonds
destabilize at these defect sites, making the CNTs susceptible to attack by reactive
molecular groups [14]. For instance, surface oxidation with HNO3 [16, 61, 68-72], (HNO3
/ H2SO4) [73-80], and (HNO3 or H2SO4 / H2O2) [69, 71] leads to the formation of COOH,
C=O, and C–OH groups [61, 81] that are covalently linked to the CNT scaffold. These
functional groups can be attached to nanoparticles (NPs) through an additional step, where
the covalent bond could be formed directly by changing the C atom hybridization from sp2
to sp3 or indirectly by chemical transformations of previously generated functional groups.
However, this method produces a strong bond and widespread surface destruction leading
to large defective surface areas [62, 65, 66, 82].

Ph.D. Thesis – Ahmed M. Abdalla; McMaster University –Engineering Physics
18
2.3 Magnetism and Magnetic Nanomaterials
CNTs can be functionalized with magnetic nanoparticles using both methods of
functionalization discussed previously. This offers a practical way to remotely control and
manipulate CNTs inside different dispersing mediums utilizing external magnetic field.
The following section presents a background on magnetism and magnetic nanomaterials.
2.3.1 The magnetic moment
An electric current passing through a wire generates a magnetic field (Ampère’s law). In a
steady electric field, the curl of the magnetic field H equals the electric current density J
(∇ × H = J) [83, 84]. However, when a current I = q (ω/2π), with charge q and an angular
frequency ω passes through a finite loop of area A = π r2, it produces a magnetic moment
of m, where,
2
2
q rdm I dA
ωm . (2.3)
Similarly, the circulation of an electron (Figure 2.2) with charge q = −e, mass of
me, and velocity v = ω × r, produces an orbital angular momentum (l, (2.4)) and orbital
magnetic moment (mo, (2.5)) [85, 86]:
l = me(r × v) = me r2ω, (2.4)
( ) x .
2 2 e
e e
m o
r v lm . (2.5)

Ph.D. Thesis – Ahmed M. Abdalla; McMaster University –Engineering Physics
19
Figure 2.2: A current passing through a loop produces a magnetic moment m and angular
momentum l.
The value of the orbital magnetic moment ‹mzo› can be expressed by quantizing the
angular momentum l along a quantization direction of z as follows (2.7) [85, 87]:
‹l z› = ħ lz, and (2.6)
.
2
z Bz
e
el
m
o zm l
ħ
ħ, (2.7)
where l denotes the integer quantum number of the angular momentum, ħ is the reduced
Planck constant (1.055 × 10⁻³⁴ J s), and Bohr magneton μB is the unit that expresses the
electron magnetic moment.
24 9.27 x 10²
B
e
e
m
ħJ/T. (2.8)
While undergoing orbital spin, the electron also spins around its axis, which is
enough to produce a full Bohr magneton with only half ħ. The electron spin produces a spin
magnetic moment of ms and spin angular momentum of s [85, 87].
2z Bs
zm s
ħ, where
2z s
ħ . (2. 9)

Ph.D. Thesis – Ahmed M. Abdalla; McMaster University –Engineering Physics
20
Finally, the total magnetic moment of the electron is the summation of its orbital
and spin quantized magnetic moments [85, 87, 88], i.e.,
‹mzTotal› = ‹mz
o› + ‹mzs› 2‹ › ‹ ›B z zs l
ħ. (2.10)
2.3.2 Magnetic dipole
A magnetic pole is fictitiously defined as a magnetic point that has a charge (p) located at
the magnet edge and concentrates the magnetic force. A magnetic dipole represents the
interaction between two equally opposite magnetic charges (+p, -p) separated by a distance
r [85, 89]. Similar to coulombic interaction, two poles of strengths p1 and p2 respectively
act on each other with a magnetic force F(r),
1 2
2
04
p pr
rF , (2.11)
where μ0 is the free space permeability and it equal 4π x10-7 Wb A-1 m-1 [87, 89].
For a finite distance between the two poles, the force is a measure for the magnetic
field at any external point with a position vector r. However, for any pole of strength p, the
relation between the acting force and the magnetic field H(r) is [85, 87]:
F(r) = p H(r), and (2.12)
0
34
pr
rH r . (2.13)
Finally, magnetic dipoles always consist of two opposite magnetic charges where
all flux lines that are produced from one pole always return to the opposite pole (Maxwell’s
equations (2.14)) [85, 88].

Ph.D. Thesis – Ahmed M. Abdalla; McMaster University –Engineering Physics
21
0 B . (2.14)
2.3.3 Magnetic Parameters
The magnetic field strength H depends on the separation distance between the field lines.
An external field H with a uniform strength is able to act on a magnetic dipole (p) with
force coupling that results in a torque Γ = prHsinθ, as shown in Figure 2.3 [87, 89].
Figure 2.3: A magnetic field H apply a torque Γ on a magnetic dipole.
The coupling between the dipoles and the applied field produces the magnetization
(M, J T-1) and magnetic induction (B, T). The magnetization (M) is a measure of the
generated magnetic field from the magnetic material and equals the net dipole magnetic
moment per volume density (2.15). It has a direction that polarizes under the effect of the
applied field [87, 89]. The induction (B) is the density of magnetic flux lines (dΦ = BdA).
It is considered as a measure for the magnetic material response. However, B has a linear
relationship with H in vacuum (2.16), and with (H+M) inside any magnetic matter (2.17)
[85-88],
N
VM m , (2.15)
B = μ0H, (2.16)

Ph.D. Thesis – Ahmed M. Abdalla; McMaster University –Engineering Physics
22
B = μ0(H +M). (2.17)
The magnetic susceptibility χ (2.18) and permeability µ (2.19) are considered to be
parameters that quantify the magnetic response of any material [84, 86-88]:
M = χH, (2.18)
B = μH. (2.19)
2.3.4 Magnetic Domains
Because of magnetic anisotropy, magnetic materials tend to obtain a homogenous
magnetization directed into their crystal easy axis for very small domains (size of a few
nm), but not for bigger domains. The self-created magnetostatic energy increases with the
domain size which is not favourable. The material tends to reduce its high energy by
reducing the external path length of the magnetic field loop by dividing the large domain
into smaller multidomains. The total magnetization is the sum of the moments of all created
mini-domains. The domain division also creates a domain wall where adjacent molecules
have net magnetic moments with different directions [85, 87, 88]. Domain Walls are
classified according to the angle between the magnetization of adjacent domains into 180
wall and 90 wall (Figure 2.4) [88].
Figure 2.4: Domain walls. (a) single domain. (b) 180 domain. (c) 90 domain.

Ph.D. Thesis – Ahmed M. Abdalla; McMaster University –Engineering Physics
23
2.3.5 Magnetization Hysteresis Loop
Magnetic hysteresis is an irreversible phenomenon that represents the magnetization and
demagnetization of any magnetic material (Figure 2.5). An applied magnetic field
facilitates the motion of domain walls against the crystal imperfections until all magnetic
moments are completely directed into their crystal’s easy axis, which is aligned close to the
field direction. Consequently, the magnetic material becomes a single domain. A field with
high enough strength can rotate this single domain from its easy direction into a direction
parallel to it. At magnetic saturation (Ms), removal of the applied field retains magnetization
inside the material, which is called the remnant magnetization (Mr). The field required to
reverse this process and reduce the remnant magnetization to zero is called the coercive
field (Hc) [87, 89].
Figure 2.5: Magnetization Hysteresis Loop.
2.3.6 Classification of Magnetic Materials
Pure elements in the periodic table are classified at room temperature according to their
bulk permeability into diamagnetic, paramagnetic, ferromagnetic, and antiferromagnetic

Ph.D. Thesis – Ahmed M. Abdalla; McMaster University –Engineering Physics
24
materials as shown in Figure 2.6. Diamagnetism is the weakest form of magnetism where
the magnetization is proportional to the applied magnetic field. Diamagnetic materials such
as carbon and noble gases have a negative and very weak relative permeability.
Paramagnetic materials such oxygen have a low and positive relative permeability.
Antiferromagnetism exists only in chromium, where equal magnetic moments are
antiparallel in a way that produces almost zero net magnetization [86-89].
Figure 2.6: Different types of magnetism. (a) Ferromagnetism. (b) Paramagnetism. (c)
Antiferromagnetism. (d) Ferrimagnetism.
Nickel, iron, and cobalt are the only three pure elements that are ferromagnetic.
They have high positive relative permeability (102-105) so that all magnetic moments are
equal and parallel. Ferrimagnetism is another type of magnetism that does not occurs in
pure elements. Ferrimagnetic materials are known as ferrites, which are typically complex
magnetic oxides that contain ferric oxide (Fe2O3) as their basic magnetic component.
Ferrimagnetism is a special type of antiferromagnetism where antiparallel magnetic
moments are not equal [86-89].

Ph.D. Thesis – Ahmed M. Abdalla; McMaster University –Engineering Physics
25
For ferromagnetic and ferrimagnetic materials, reducing particles sizes below a
critical dimension (Dc, 15-150 nm) changes the material containing multimagnetic domains
into a single domain (Figure 2.7) [1, 90]. Superparamagnetism is a special case of such a
material when the particle size is lower than the superparamagnetic diameter (Ds, few nm).
In this case, the particle consists of a small single domain that can be conceived as a single
massive paramagnetic atom. Here, the coercivity is zero and upon removal of the applied
field there is no residual magnetization inside the material [85, 91, 92].
Figure 2.7: The relation between the coercivity and the particle size.
2.3.7 Magnetic Nanomaterials
Any material with a dimension less than 100 nm that responds to a magnetic field is
considered to be a magnetic nanomaterial. These nanomaterials, such as metals and spinel
ferrites, which feature a higher surface-to-volume ratio than micromaterials, are
synthesized through several physical and chemical methods [93, 94]. Metals (e.g. Fe, Ni,
and Co) have high magnetization, high density (~8 g.cm-3) and low oxidation stability [1].
Spinel ferrites (i.e. Fe3O4) are easy to synthesis and have less prominent, but tunable,
magnetic properties, lower density (~5 g cm-3), higher stability. Spinel ferrites have a
Ph.D. Thesis – Ahmed M. Abdalla; McMaster University –Engineering Physics
26
general chemical formula of MO.Fe2O3 and a crystal structure similar to naturally occurring
spinel (MgAl2O4), where M denotes a divalent metal (e.g. Fe2+, Mn2+, and Zn2+) [89].
Because of their small sizes (few nm), magnetic nanoparticles (MNPs) are expected to be
individually superparamagnetic [92].
2.4 Magnetization of Carbon Nanotubes
Magnetization of CNTs occurs when magnetic nanoparticles (MNPs) are attached to the
surfaces of the CNTs via either covalent or non-covalent functionalization. Introduction of
MNPs with a high relative permeability to a diamagnetic material that has almost zero
permeability produces a hybrid material with intermediate magnetic properties.
Magnetization is a suitable way to align and manipulate CNTs under an applied magnetic
field e.g., by immersing them in a liquid prepolymer containing dispersed magnetized
CNTs (mCNTs) as it experiences an applied magnetic field [95, 96]. The magnetic
nanoparticles that attach to a CNT surface provide new surfaces that are more compatible
with dispersing mediums. They can be used to overcome the high contact electric resistance
that arises due to the anisotropic behaviour of CNTs, and enhance their mechanical
properties by assisting with mechanical load transfer [97].
In bulk materials, the superior properties of CNTs can be leveraged by dispersing
them in a continuous matrix to form a nano-composite [53, 98]. Since CNTs are a quasi-
one dimensional, their properties are best exploited by aligning them along their
longitudinal axes [54, 99, 100]. mCNTs are utilized in many applications including

Ph.D. Thesis – Ahmed M. Abdalla; McMaster University –Engineering Physics
27
wastewater treatment [101, 102], phase separation [103], biomedical applications [104],
drug carriers [63, 105], and microwave absorbers [106-108].
2.4.1 Magnetization by Encapsulation
The stable crystalline structure of the CNT walls can be used to protect encapsulated
materials so that they can be used as carrier systems for many nanomaterials, including
magnetic nanoparticles [109]. During CVD, a CNT can be filled with a metal [110-116] or
an oxide [117]. Utilizing capillary action to fill colloidal suspensions of nanomaterials is
less expensive [109, 118], e.g., using magnetic assistance to accelerate encapsulation [118-
121].
2.4.2 Magnetization by Surface Decoration
2.4.2.1 Co-Precipitation Method
Coprecipitation is the common synthesis methodology for nanocrystalline spinel ferrites.
Mixed cations of hydroxide are coprecipitated from their aqueous ionic solution using a
precipitant (e.g. ammonia) and then decomposed thermally into their corresponding oxides.
Coprecipitation performed at room temperature and under atmospheric conditions produces
homogenous, pure and fine nanoparticles [89, 122].
Magnetic CNTs have been produced by the covalent attachment of MNPs to the
external walls of CNTs. Covalent functionalization commonly proceeds by first treating
CNTs with acids, such as concentrated nitric acid HNO3 [16, 61, 68-72], or a mixture of
concentrated nitric and sulfuric acids [73-80]. Composite Fe3O4-CNTs have been produced
by co-precipitating Fe3O4 nanoparticles on the CNT surfaces from an aqueous solution,

Ph.D. Thesis – Ahmed M. Abdalla; McMaster University –Engineering Physics
28
such as one containing Iron (II, III) chloride [104, 123-126] or Iron sulphates [101-103,
124, 127, 128]. During the process, a precipitant is slowly introduced with the assistance
of sonication to adjust the pH at 9-12. The common precipitant for Fe3O4 nano-particles is
(30%) ammonia solution [102, 122, 127-130] and NaOH solution [104, 131-133]. Other
MNPs such as maghemite (γ-Fe2O3) [123, 134, 135], and M2+Fe2O4 (M2+ = Mn, Co, Ni,
Cu, or Zn) [136-138] have been coprecipitated on CNTs.
2.4.2.2 Electroless Deposition
Surface treatment of CNTs with a metallic coating is a method of magnetization that
improves their oxidation resistance [99], minimizes the ohmic contact resistance [139],
increases CNT wettability, adhesion to polymers and assists in the transfer of mechanical
loading [97]. Nanotubes can be coated with metals using electroless plating [97], a method
which is applicable to many substrates [140]. The resulting metal-CNT hybrid (MCH)
nanomaterial has a relatively high surface area, low electric contact resistance [141],
superior hardness, wear resistance and magnetic properties [142]. MCHs are used in
reinforced composites, sensors [143], catalytic and electrochemical applications [141].
Nickel is commonly used as a ferromagnetic plating material [144]. Electroless Ni
deposition forms weak noncovalent bonds that utilize van der Waals forces, between the
outer surface of the CNT and its surrounding metallic nanolayer [62]. The metal
materializes from an ionic solution subjected to an in situ reduction reaction [145]. Nickel
chloride is used as the source of metal ions [146]. A reducing agent, sodium hypophosphite,
provides the electrons required to reduce nickel ions (Ni2+) into metallic nickel (Ni) [147]
using a catalyst [148]. To constrain the reaction on the CNT surface, the CNTs must be

Ph.D. Thesis – Ahmed M. Abdalla; McMaster University –Engineering Physics
29
pre-treated with a catalyst prior to depositing Ni on their surfaces. The deposit forms a
continuous Ni layer that encapsulates the CNTs [149].
The catalysis consists of sensitizing and activating steps. Tin ions (Sn2+) are used
for CNT sensitization and palladium ions (Pd2+) for activation [99, 140]. Sn2+ adsorbs on
the CNT surface during sensitization and reduces Pd2+ to Pd during subsequent activation.
Pd initiates the reduction reaction that deposits Ni on CNTs [148]. The electroless
deposition is a redox process that consists of an oxidation reaction (2.20) for the reducing
agent and a reduction reaction (2.21) for nickel ions [149, 150]. Sodium citrate is generally
used to prevent Ni from complexing [147].
1. Oxidation - + -
2 2 2 2
-
3H PO + H O H PO + 2H +2e (2.20)
2. Reduction 2+ -
Ni + 2e Ni
Catalyst
CNT surface (2.21)
2.5 Potential Applications for Magnetic CNTs
2.5.1 Carbon Nanotubes in Nanofluids
Nanofluids are colloidal suspensions of nanoparticles dispersed in a liquid [151]. Due to
their superior electrical and thermal conductivities, CNTs have been introduced as the
dispersed phase into nanofluids [29, 31, 152], some of which have been used as coolants
[153] and as electrically conductive nanofluids [154]. When dispersed in an aqueous
medium, as little as 0.5% (w/w) of CNTs can increase the electric conductivity by an order
of magnitude [154].
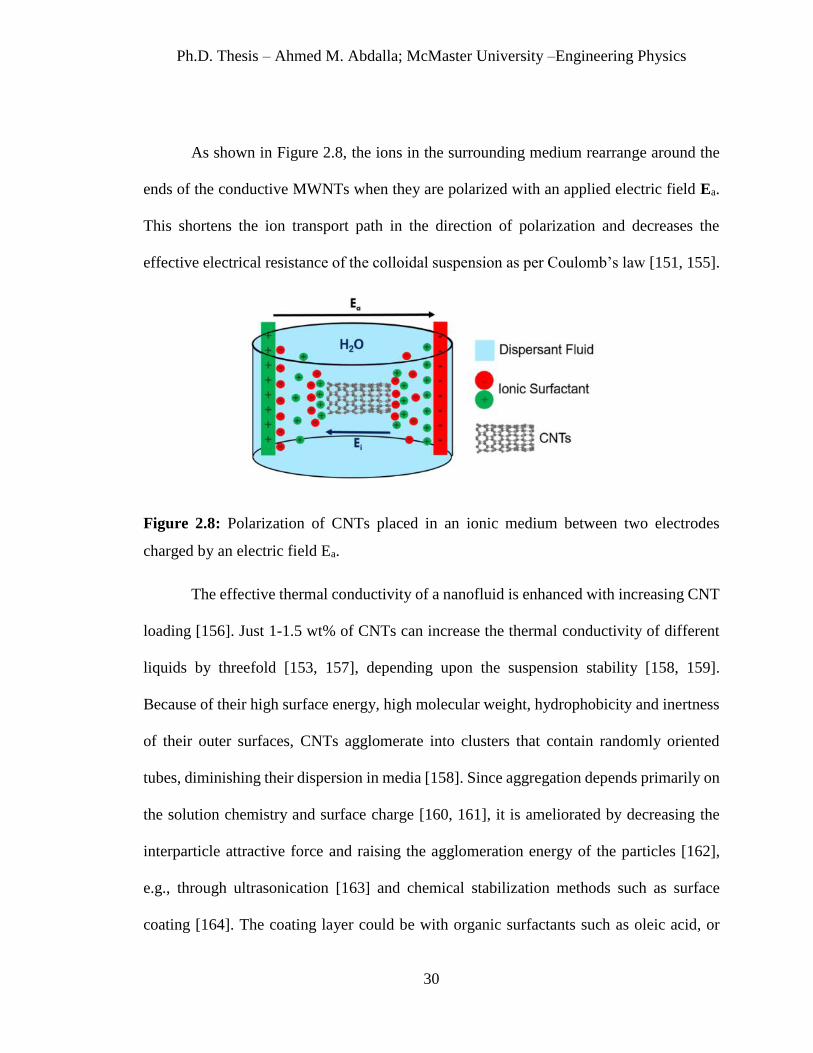
Ph.D. Thesis – Ahmed M. Abdalla; McMaster University –Engineering Physics
30
As shown in Figure 2.8, the ions in the surrounding medium rearrange around the
ends of the conductive MWNTs when they are polarized with an applied electric field Ea.
This shortens the ion transport path in the direction of polarization and decreases the
effective electrical resistance of the colloidal suspension as per Coulomb’s law [151, 155].
Figure 2.8: Polarization of CNTs placed in an ionic medium between two electrodes
charged by an electric field Ea.
The effective thermal conductivity of a nanofluid is enhanced with increasing CNT
loading [156]. Just 1-1.5 wt% of CNTs can increase the thermal conductivity of different
liquids by threefold [153, 157], depending upon the suspension stability [158, 159].
Because of their high surface energy, high molecular weight, hydrophobicity and inertness
of their outer surfaces, CNTs agglomerate into clusters that contain randomly oriented
tubes, diminishing their dispersion in media [158]. Since aggregation depends primarily on
the solution chemistry and surface charge [160, 161], it is ameliorated by decreasing the
interparticle attractive force and raising the agglomeration energy of the particles [162],
e.g., through ultrasonication [163] and chemical stabilization methods such as surface
coating [164]. The coating layer could be with organic surfactants such as oleic acid, or

Ph.D. Thesis – Ahmed M. Abdalla; McMaster University –Engineering Physics
31
ionic as tetramethylammonium hydroxide aqueous solution [162, 165, 166]. Whereas,
precise manipulation of the nanotubes into fully aligned structures can be challenging
[167], magnetization can provide a convenient solution for manipulating CNTs inside
dispersing media as a response to an applied magnetic field [95, 96].
2.5.2 Carbon Nanotubes in Polymer Composites
Polymer nanocomposites are used as matrices because of their low density and tunable
mechanical properties. Nanomaterials with a high surface area and tunable properties can
be useful reinforcing fillers in composites [53]. As a filler, a small amount of CNTs can
increase the electrical and thermal conductivity of a polymeric matrix with only a small
increase in its density [54, 168]. For instance, a 1 wt% loading of MWNTs provides a 80%
increase in the elastic modulus of polyvinyl alcohol [169], and a 1 wt% loading of single
wall CNTs produces a 125% increase in the thermal conductivity of an epoxy polymer
[170] while a 3% loading increases the thermal conductivity three fold [171]. Generally,
composites based on aligned CNTs exhibit a higher electric conductivity [134], and thermal
conductivity [171] than unaligned CNTs.
Because of Brownian motion, CNTs are randomly orientated in a polymeric matrix,
which reduces their efficacy in enhancing bulk material properties [53-55]. Electric and
magnetic fields can overcome the Brownian motion and assist in CNT alignment and
manipulation [98, 168, 172, 173]. The poor magnetic susceptibility of CNTs requires a very
strong magnetic field to produce a torque that exceeds their thermal energy (2.22) and the
viscous resistance of the medium,

Ph.D. Thesis – Ahmed M. Abdalla; McMaster University –Engineering Physics
32
2 kU m H T , (2.22)
where U denotes the CNT potential energy, H the field strength, and m the mass of a CNT
segment [55, 134]. As previously described, CNT functionalization with MNPs provides a
means to enhance the magnetic susceptibility and therefore reduce the field strength
required for their alignment (up to 0.2 T) [168, 172, 174].

Ph.D. Thesis – Ahmed M. Abdalla; McMaster University –Engineering Physics
33
3. Magnetizing MWNT via Covalent Functionalization
3.1 Introduction
In this chapter, an experimental investigations will be presented to highlight the
magnetizing of the MWNT via covalent functionalization. Decorating the CNTs with
magnetic nanoparticles (MNPs) facilitates their expedient organization with a magnetic
field. One of the most convenient methods for their decoration is to first treat the CNTs
with nitric or sulfuric acid, or a mixture of the two, and then co-precipitate MNPs in situ.
Here, six variations of this protocol are compared to identify acid treatment influence on
the decoration of multi-walled CNTs (MWNTs). Further, we explore means to tune the
properties of these magnetic MWNT by varying the (1) MNP material composition, and
(2) MNP:MWNT (w/w) magnetization weight ratio (γ). This chapter is reprinted and
adapted with permission from Diamond and Related Materials, Decorating carbon
nanotubes with co-precipitated magnetite nanocrystals, 66, Ahmed M Abdalla, Suvojit
Ghosh, and Ishwar K Puri, Copyright 2016 and, from Journal of Magnetism and Magnetic
Materials, Magnetoresponsive conductive colloidal suspensions with magnetized carbon
nanotubes, 421, Ahmed M Abdalla, Abdel Rahman Abdel Fattah, Suvojit Ghosh, and
Ishwar K Puri, Copyright 2017 and, with permissions from Elsevier. The author of this
thesis is the first author and main contributor of the above mentioned publications and has
conducted all the experiments. The chapter will provide a literature review which is
discussed in the background information section, followed by excerpts from the above
mentioned papers to emphasize some of the concepts disused below.
Ph.D. Thesis – Ahmed M. Abdalla; McMaster University –Engineering Physics
34
3.2 Background Information
The superior mechanical strength, and electrical and thermal conductivities of carbon
nanotubes (CNTs) can be leveraged in bulk materials by embedding the nanotubes in a
continuous matrix to form a nano-composite [53, 98, 175]. Since CNTs are quasi-one
dimensional, their properties are best manifested in the bulk if they are aligned along a
particular direction in the matrix [54]. Such alignment is easily implemented when the
CNTs are magnetized (mCNTs). For instance, a polymer can be dissolved in a solvent that
contains dispersed mCNTs, then solution-cast in the presence of an applied magnetic field
[95, 96]. Herein, the field aligns the mCNTs, and the orientation is preserved by the
solution-cast polymeric matrix.
Nanotubes can be magnetized in several ways, e.g., by encapsulating magnetic
nanoparticles (MNPs) within them [109, 110, 115, 117-119, 176], plating them with a
ferromagnetic metal [99, 139, 140, 177, 178], or decorating them with MNPs [135-138,
179-181]. Decoration is the most convenient route. Unlike encapsulation, which requires
sophisticated in situ chemical vapor deposition (CVD) [109, 110, 117] with precise
templates [115, 118, 119], and plating that requires expensive reagents [99, 139, 140, 177,
178], decoration uses inexpensive reagents and commonly available laboratory apparatus.
CNTs are inherently inert due to their stable sp2 hybridized C-C σ bonds. However,
they typically feature defect sites that are created during production and/or due to
mechanical loading. At such defect sites, the local C-C bonds become destabilized and are
susceptible to attack by reactive molecular groups [75, 182]. These structural defects are
exploited to decorate CNTs. For instance, treatment with HNO3 [71, 72], HNO3 and H2SO4

Ph.D. Thesis – Ahmed M. Abdalla; McMaster University –Engineering Physics
35
[72, 80], or H2SO4 and H2O2 [69, 71], leads to surface oxidation at the defect sites, forming
COOH, C=O, and C–OH functional groups that are covalently linked to the CNT scaffold
[61, 183]. These functional groups form the sites where MNPs are attached to the CNT.
Various chemical routes for decoration have been developed, e.g., hydrothermal
decomposition of iron compounds [105, 126, 184], surface imprinting of magnetite (Fe3O4)
nanograins [125], and in situ co-precipitation of ferrite nanocrystals [101-104, 124, 127,
128, 185, 186]. Co-precipitation can be performed at room temperature and under
atmospheric conditions. In contrast, hydrothermal processes employ high temperatures
(~250 °C) and an inert atmosphere [184], while surface imprinting requires a sealed
autoclave, also at high temperatures (~200 °C) over a long duration (~10 h) [125]. Thus,
co-precipitation is by far the most convenient method for decorating CNTs with MNPs.
Figure 3.1: Magnetizing CNTs by coprecipitation. When CNTs are treated with strong
oxidizing acids, COOH, C=O, and C–OH groups are formed at defect sites. In the presence
of Fe+2, Fe+3 and a precipitating base, they serve as nucleation sites for magnetite (Fe3O4)
nanocrystals.
Magnetic decoration through co-precipitation is performed in two steps (Figure
3.1). First, the CNTs are treated with strong oxidizing acids, such as HNO3 and H2SO4.

Ph.D. Thesis – Ahmed M. Abdalla; McMaster University –Engineering Physics
36
Herein, the NO3¯ and HSO4+ radicals attack the weak C-C bonds at the CNT defect sites
to produce functional groups, e.g., COOH, C=O, and C–OH. Next, these groups act as the
nucleation sites for magnetite (Fe3O4) nanocrystals that are coprecipitated (3.1) from a
solution of Fe2+ and Fe3+ ions [128, 181]. Many variations in the co-precipitation routes to
decorate CNTs with MNPs have been reported, but these routes have yet to be compared
to identify best practices. We fill this gap by examining (1) how use of two acids, HNO3
and H2SO4, and their mixture influences the decoration produced on multi-walled CNTs
(MWNTs), and (2) if filtration, washing and drying of MWNTs after acid treatment can be
eliminated to prevent material loss to the filtrate and thus increase the yield of magnetized
MWNTs (mMWNTs). Further, we explore means to tune the properties of these mMWNT
by varying the (1) MNP material composition, and (2) MNP:MWNT (w/w) magnetization
weight ratio (γ).
2 3 4 4 4 23FeCl + 2FeCl + 8NH OH Fe O + 8NH Cl+4H O . (3.1)
3.3 Methodology
3.3.1 Materials and Reagents
Multiwall carbon nanotubes (MWNTs) produced by CVD with purity > 95%, outside
diameters of 20-30 nm, inside diameters of 5-10 nm and lengths between 0.5-2.0 µm, were
purchased from US Research Nanomaterials. Other reagents used were ferric chloride
hexahydrate (FeCl3·6H2O, 97-102%, Alfa Aesar), ferrous chloride tetrahydrate
(FeCl2·4H2O, 98%, Alfa Aesar), copper II chloride (CuCl2, 98%, Alfa Aesar), tetramethyl
ammonium hydroxide (C4H13NO·5H2O, 98%, Alfa Aesar), manganese II chloride
tetrahydrate (MnCl2·4H2O, 99%, Sigma Aldrich), zinc chloride (ZnCl2, 99%, Sigma

Ph.D. Thesis – Ahmed M. Abdalla; McMaster University –Engineering Physics
37
Aldrich), sodium hydroxide (NaOH, 97%, CALEDON Laboratory Chemicals), nitric acid
(HNO3, 68-70%, CALEDON), sulfuric acid (H2SO4, 95-98%, CALEDON) and ammonium
hydroxide (NH4OH, 28-30%, CALEDON). All reagents were used as received without
further purification.
3.3.2 Acid-enabled Functionalization
For each sample, 1 g of MWNTs was first dispersed in 200 ml of concentrated acid and
sonicated for 4 h in a sonication bath (VWR International, Model: 97043-936). The
MWNTs were subsequently washed three times by diluting the dispersion in 500 ml of
deionized (DI) water, allowing the MWNTs to settle (~20 h) and then decanting the
supernatant. After three washes, the solution pH ≈ 2, after which it was filtered, washed
several times and finally dried. Six variations of this route were probed, as illustrated in
Figure 3.2, yielding the six samples S1-S6.
Briefly, concentrated HNO3 was used for S1 and S4, H2SO4 for S2 and S5 and a 1:1
(v/v) mixture of HNO3 and H2SO4 for S3 and S6. For samples S4-S6, the filtration, washing
and drying steps subsequent to acid functionalization were eliminated to prevent the loss
of MWNTs to the filtrate. In these cases, excess NaOH was employed to neutralize the
excess acid and to also induce co-precipitation of MNPs. Thus, the magnetite (Fe3O4) co-
precipitation reaction occurred in a dilute acid medium. Routes S2 and S4-S6 are new and
hitherto unexplored.

Ph.D. Thesis – Ahmed M. Abdalla; McMaster University –Engineering Physics
38
Figure 3.2: Schematic of the synthesis routes showing the variations used to produce the
six samples, S1-S6. Since intermediate filtration leads to the loss of MWNTs that are
shortened due to the damage caused by the acid, for routes S4-S6 the acid functionalization
process is ceased after the sample has been decanted and diluted, i.e., co-precipitation is
induced without any filtration or drying of the acid-treated MWNTs.
3.3.3 Decoration
Based on stoichiometric calculations to obtain a 1:1 (w/w) mixture of Fe3O4:MWNTs, 2.3
g of FeCl3·6H2O and 0.9 g of FeCl2·4H2O were first dissolved in 400 ml DI water for each
sample. Prior to dissolving the salts, the water used was carefully degassed by boiling and
sonication in order to prevent the formation of maghemite (γ-Fe2O3) and hematite (α-Fe2O3)
by dissolved oxygen [187, 188]. The acid-treated MWNTs were dispersed in the solution
using ultrasonic treatment for 10 mins with a probe sonicator (Qsonica, Model: Q500 with
1/4ʺ micro-tip at 35% power) and subsequently for 50 minutes in a sonication bath at 50°C
(VWR International, Model: 97043-936). The precipitant was slowly introduced during the
second sonication step until the pH reached 10. For samples S1-S3, 30% ammonia solution
Ph.D. Thesis – Ahmed M. Abdalla; McMaster University –Engineering Physics
39
was used as the precipitant. The higher acidity (pH ≈ 2) of samples S4-S6 required the use
of a stronger base, 0.2 M NaOH, as a precipitant [131-133, 189]. After co-precipitation,
the samples were settled through magnetic sedimentation and washed with DI water
multiple times until the supernatant reached a pH ~ 7. Thereafter, the samples were washed
using ethanol, filtered and then dried in a vacuum oven at 70 °C for 1 hr. The dried samples
were strongly magnetic.
3.3.4 Influence of MNPs Concentration and Chemical Composition
Employing the process for the production of sample S1 described in section 3.3.3,
stoichiometric calculations for different samples (S1, S1.2, S1.3, S1.4, and S1.5) were
conducted to obtain different Fe3O4:MWNT (w/w) magnetization weight ratio γ = 1, 1.25,
1.5, 1.75 and 2. The effect of changing magnetization ratio γ on the uniformity and density
of decoration was observed through transmission electron microscopy (TEM) images.
For the magnetization weight ratio γ of unity, the magnetite nanoparticles in S1
with a relatively high Curie temperature [190] were replaced with Mn0.2Cu0.20.6Fe2O4 to
produce sample S1m and with Cu0.4Zn0.6Fe2O4 to make S1c, since both of the latter MNPs
have lower Curie temperatures [191, 192]. For S1m and S1c, we used Mn+2, Cu+2, and Zn+2
chloride salts for co-precipitation and NaOH as the precipitant [193, 194], and the MWNTs
and salt solution were dropped into the precipitant instead of vice versa [193]. SQUID
magnetometry provided changes in the magnetic properties of the mMWNTs, X-Ray
diffraction (XRD) revealed the material phases and MNP crystal sizes. TEM and energy-

Ph.D. Thesis – Ahmed M. Abdalla; McMaster University –Engineering Physics
40
dispersive X-ray spectroscopy (EDX) were used to visualize the mMWNTs, the uniformity
and density of their decoration with MNPs, and to identify their elemental composition.
3.3.5 Characterization Methods
The elemental composition of acid-treated MWNTs was determined using a PHI Quantera
II Imaging and Scanning X-Ray Photoelectron Spectrometer (XPS). X-Ray Diffraction
(XRD) analysis of MWNT and mMWNT powder samples was performed using a Bruker
D8 Discover instrument comprising a DavinciTM diffractometer operating at 35 kV and
45 mA using Co-Kα radiation (λavg = 1.79026 Å). Bruker’s DIFFRAC.Eva V3.1 and
TOPAS softwares were used for the analysis and semi-quantitative estimation of the sample
composition. For samples S1-S3, the semi-quantitative analysis was verified using a digital
weighing balance. The sample weights were recorded three times during the synthesis
process: (1) before and (2) after acid functionalization to determine the MWNT weight, and
(3) after the mMWNTs were produced to obtain the weight of Fe3O4 that was attached to
the MWNTs. Similar verification of samples S4-S6 was not possible because the filtration,
washing and drying step was eliminated. Transmission electron microscopy (TEM) and
energy dispersive X-ray (EDX) spectroscopy was conducted with a JEOL 2010F field
emission microscope, where the samples were suspended in ethanol, dripped on to a TEM
grid and then wicked off with a tissue-wipe. A Fourier transformer infrared spectrometer
(FTIR, Bruker Vertex 70, ATR Diamond accessory, 64 scans at a resolution of 4cm-1) was
used to determine the absorption for the Fe-O bond in the MNPs. Magnetization
measurements were performed using SQUID magnetometry at room temperature.

Ph.D. Thesis – Ahmed M. Abdalla; McMaster University –Engineering Physics
41
3.4 Results and Discussion
3.4.1 Synthesis of Magnetic MWNTs via Variable Acid-enabled Functionalization
We synthesize mMWNTs, i.e., MWNTS decorated with MNPs, using six variations in the
method for acid treatment, as described in section 3.3.2 and illustrated in Figure 3.2. The
variations are implemented to compare the influence of acid-treatment by HNO3, H2SO4,
or a 1:1 (v/v) mixture of the two by using (1) XPS to measure the oxygen content in the
acid-treated MWNTs as a metric for functionalization, (2) XRD to determine the material
composition and size of MNPs decorating the mMWNTs, (3) transmission electron
microscopy (TEM) to visualize the mMWNTs, and (4) vibrating sample magnetometry
(VSM) to measure magnetic properties. Further, we determine the feasibility of eliminating
the filtration, washing and drying of MWNTs after acid treatment to prevent material loss
to the filtrate and thus increase the yield of magnetized MWNTs (mMWNTs).
3.4.1.1 Material Phases
XPS analysis (Figure 3.3), shows that acid treatment always leads to an increase in oxygen
content. While pure MWNTs contain ~2 atomic percentage (at.%) oxygen, treatment with
either nitric or sulfuric acid increase oxygen content to 4-5 at.%. This increase is moderate
when contrasted with the effect of a 1:1 (v/v) mixture of the two acids, which yields ~15
at.% oxygen.

Ph.D. Thesis – Ahmed M. Abdalla; McMaster University –Engineering Physics
42
Figure 3.3: Comparison of acid-treatment routes. XPS analysis shows that treatment with
HNO3 or H2SO4 leads to a moderate increase in oxygen content (4-5%) relative to pure
MWNTs (~2%). In contrast, treatment with a 1:1 mixture of the two acids produces a much
higher (15.23%) oxygen content.
XRD analysis reveals the influence of a particular synthesis route on the material
content of the mMWNTs. The spectra (Figure 3.4a) are used to quantify the resulting
composition, presented in Table 3.1. For routes S1-S3, the XRD estimate is verified against
the weights obtained using a weighing balance. That comparison, in Table 3.2, shows that
the deviations from the XRD analyses are smaller than 5%. Table 3.3 lists the combined
weight of the MWNT and its attached Fe3O4 MNPs as a fraction of the intended, or
stoichiometric, weight.
Strong oxidizing acids cause structural damage to MWNTs and shorten their
lengths. When these short MWNTs are washed and the dispersion filtered, they can be lost
to the filtrate. A potential remedy to retain these shortened MWNTs is to eliminate the
filtration step. To examine this, we contrast the compostion of samples S1-S3 and S4-S6
that are produced with and without the intermediate filtration respectively.

Ph.D. Thesis – Ahmed M. Abdalla; McMaster University –Engineering Physics
43
Figure 3.4: Comparison of Material Content of MWNTs. (a) The XRD (Co Kα, λ=1.79 Å)
patterns for S1-S3 (b) The average crystallite size, determined using the XRD data by the
Scherrer equation (3.3)) reveal a narrow particle size distribution of 8.5 -11.3 nm.
Samples S1-S3 contain only the intended material phases, i.e. magnetite (Fe3O4,
PDF No. 01-071-6336) and hexagonal carbon C6 (PDF No. 00-058-1638), as shown in
Figure 3.4a. In contrast, undesired materials are found for samples S4-S6 that are an
anciticpated consequence of co-precipitation in the presence of a strong acidic medium. S4
contains Akaganeite (Fe3+O(OH, Cl), PDF No. 00-013-0157). S5 contains the mildly

Ph.D. Thesis – Ahmed M. Abdalla; McMaster University –Engineering Physics
44
magnetic iron oxide hematite (α-Fe2O3, PDF No. 00-032-0469), ferrous sulfate (FeSO4,
PDF No. 00-042-0229) and other phases that could not be identified by the EVA software
using the PDF database. S6 contains FeSO4. Thus, the filtration and drying of MWNTs
subsequent to acidic functionalization is a necessary step.
Material Phase S1 S2 S3 S4 S5* S6
MWNT 41.7% 41.8 % 31.9 % 48.9% 38.8 % 47.3 %
Magnetite (Fe3O4) 58.3% 58.2 % 68.1 % 37.3 % 15.5 % 33.9 %
Hematite (α-Fe2O3) 0% 0% 0% 0% 28.4 % 0%
Akaganeite 0% 0% 0% 13.8 % 0% 0%
Ferrous Sulfate
(FeSO4) 0% 0% 0% 0% 17.3 % 18.8 %
Table 3.1: The XRD semi-quantitative analysis, obtained using TOPAS software, shows
that the MWNT:Fe3O4 weight ratio differs from the intended value of 1:1 (w/w) that is
stoichiometrically designed. (*A few peaks in the XRD spectrum for S5 result from
material phases that could not be identified by TOPAS.)
Sample # MWNT (wt %) Fe3O4 wt%
Error XRD Balance XRD Balance
S1 41.7 % 43.97 % 58.3 % 56.03 % 2.27 %
S2 41.8 % 46.46 % 58.2 % 53.54 % 4.66 %
S3 31.9 % 35.06 % 68.1 % 64.94 % 3.16 %
Table 3.2: The weight percentages of MWNT and Fe3O4 for samples S1-S3, measured
using a digital balance, deviates less than 5% from the corresponding measurements
approximated through XRD analysis.
We note here that magnetite (Fe3O4) and maghemite (γ-Fe2O3) have almost identical
crystal structures, and are thus nearly indistinguishable solely by XRD [131]. However,
past reports have established that coprecipitation of Fe2+ and Fe3+ ions yields magnetite
(Fe3O4) contaminated with maghemite (γ-Fe2O3) if the water used in the reaction contains

Ph.D. Thesis – Ahmed M. Abdalla; McMaster University –Engineering Physics
45
dissolved oxygen, which oxidizes the Fe2+ to the Fe3+ state [187, 188]. If this is avoided,
nearly pure magnetite (Fe3O4) nanoparticles are formed, which are stable in air and require
high temperature (T = 300 °C) aeration for their oxidation into γ-Fe2O3 [195]. Thus,
considering the water used in our reactions was meticulously degassed by boiling in
vacuum for ~30 minutes and subsequent probe sonication for ~30 minutes, we assume that
the nanoparticles produced herein by coprecipitation of Iron (II) and Iron (III) chlorides are
largely of Fe3O4.
Table 3.3: Yields of the various material phases, as a fraction of their stoichiometrically
designed values. The magnetization ratio γ is the ratio of Fe3O4: MWNT (w/w). The
intended value of this ratio is unity for all samples.
Assuming a cubic lattice space (a=b=c), we calculated lattice parameters for
samples S1-S3 at all XRD diffraction peaks (see Table 3.4) using Bragg’s Law, i.e.,
2 2 2
2sinha k l
. (3.2)
These average lattice parameters were 8.410, 8.406 and 8.390 Å for S1, S2 and S3,
respectively that are slightly higher than the anticipated values for magnetite (8.378 Å, PDF
No. 01-071-6336; 8.394 Å, JCPDS No. 79-0417; and 8.400 Å, COD card No. 1011084)
and further from those for γ-Fe2O3 maghemite (8.346 Å, PDF No. 01-089-5892; and 8.330
Material Phase S1 S2 S3 S4 S5 S6
MWNT 90.2 % 91.6 % 54 % 100 % 78 % 82 %
Fe3O4 100 % 94 % 85.2 % 76.8 % 31 % 60 %
mMWNT
(Total Yield) 95.3 % 92.8 % 69.6 % 88.4 % 54.5 % 71 %
Fe3O4: MWNT (w/w)
(Magnetization Ratio, γ) 1.11 1.03 1.58 0.77 0.39 0.73

Ph.D. Thesis – Ahmed M. Abdalla; McMaster University –Engineering Physics
46
Å, COD card No. 9006316), which supports our assumption that magnetite is formed. The
slight increase in the measured lattice parameters could be explained by the lattice defects
and strains during the synthesis process.
Table 3.4: The calculated lattice parameters at all XRD diffraction planes for samples S1,
S2, and S3, obtained with Bragg’s Law. The average lattice parameters for these samples
concur with those for magnetite (Fe3O4).
Figure 3.5: IR spectra of samples S1-S3 reveal individual broad absorption bands at 528.5,
526.6 and 530.4 cm-1. The range between 490 and 560 cm-1 is associated with the vibration
of the Fe–O functional group for samples S1, S2 and S3. This confirms magnetite formation
since the absorption splits into multiple absorption bands for maghemite. The shoulder peak
at 623 cm-1 could imply partial oxidation of magnetite into maghemite.
Sample Lattice parameter (Å)
(111) (220) (311) (400) (422) (511) aaverage
S1 8.420 8.415 8.411 8.409 8.407 8.400 8.410
S2 8.413 8.410 8.407 8.400 8.405 8.398 8.406
S3 8.397 8.396 8.391 8.391 8.381 8.381 8.390
Ph.D. Thesis – Ahmed M. Abdalla; McMaster University –Engineering Physics
47
FTIR analysis at room temperature provided further information about the structure
of samples S1-3. Figure 3.5 shows that, in the lower wavenumber range each sample has a
single broad absorption band at 528.5, 526.6 and 530.4 cm-1, respectively. The range
between 490 and 560 cm-1 is associated with the vibration of the Fe–O functional group for
samples S1, S2 and S3. This individual broad band confirms the formation of magnetite,
since maghemite absorption occurs through multiple absorption bands [196]. However, the
shoulder peak which occurs at 623 cm-1 could imply partial oxidation of the magnetite into
maghemite [197].
Samples produced with the intermediate filtration step do not show substantial loss
of MWNTs due to filtration when either HNO3 or H2SO4 are used for functionalization. For
S1 and S2, which use HNO3 and H2SO4, the MWNT yields are 90.2% and 91.6%
respectively. However, when a mixture of the two acids is used, a substantial fraction of
the MWNTs is lost. S3 has a MWNT yield of a meagre 54%. This is because the acid
mixture oxidizes and damages the MWNTs [81] much more than each acid individually.
This influence is also evidenced by the substantially higher oxygen content of MWNTs
treated with the acid mixture, as demonstrated by the XPS analysis above. Overall, the
samples functionalized using either HNO3 or H2SO4 (S1, S2) have considerably higher
mMWNT yields (95.3% and 92.8% respectively) than those functionalized using the
HNO3/H2SO4 mixture (S3, 69.6%).
The magnetization ratio (γ), defined as the weight ratio of MNP to MWNT, is
closest to the desired value of unity in samples S1 (γ = 1.11) and S2 (γ = 1.03). S3 yields
the highest magnetization ratio (γ = 1.58), but this is because a substantial portion (46%)

Ph.D. Thesis – Ahmed M. Abdalla; McMaster University –Engineering Physics
48
of the MWNTs are lost due shortening by the acids while the produced MNPs are not. S4-
S6 deliver the lowest magnetization ratios because iron is consumed in side reactions with
the acid to produce non-magnetic byproducts. Considering a higher mMWNT yield, γ ≈ 1
and minimal byproduct formation to be representative of a better quality process, magnetic
decoration is best accomplished when the MWNTs are functionalized by either HNO3 or
H2SO4 and the intermediate filtration step is performed.
We use the Scherrer equation
0.94 / (2 )cosBD , (3.3)
to determine the average Fe3O4 nano-crystal size D (Figure 3.4b). Here, B denotes the full
width at half maximum (FWHM) of the profile of the highest peak at (311) expressed in
radians, λ the X-ray wavelength and θ the Bragg angle. For all six samples, the MNP size
lies in the narrow range from 8.5 – 11.3 nm. Thus, it appears that the co-precipitation
process is not substantially influenced by variations in the synthesis route.
3.4.1.2 Decoration Quality and MWNT damage
TEM images at various magnifications (Figure 3.6) are used to visually evaluate the (1)
quality of decoration and (2) the influence of the process on the structural integrity of the
MWNTs.
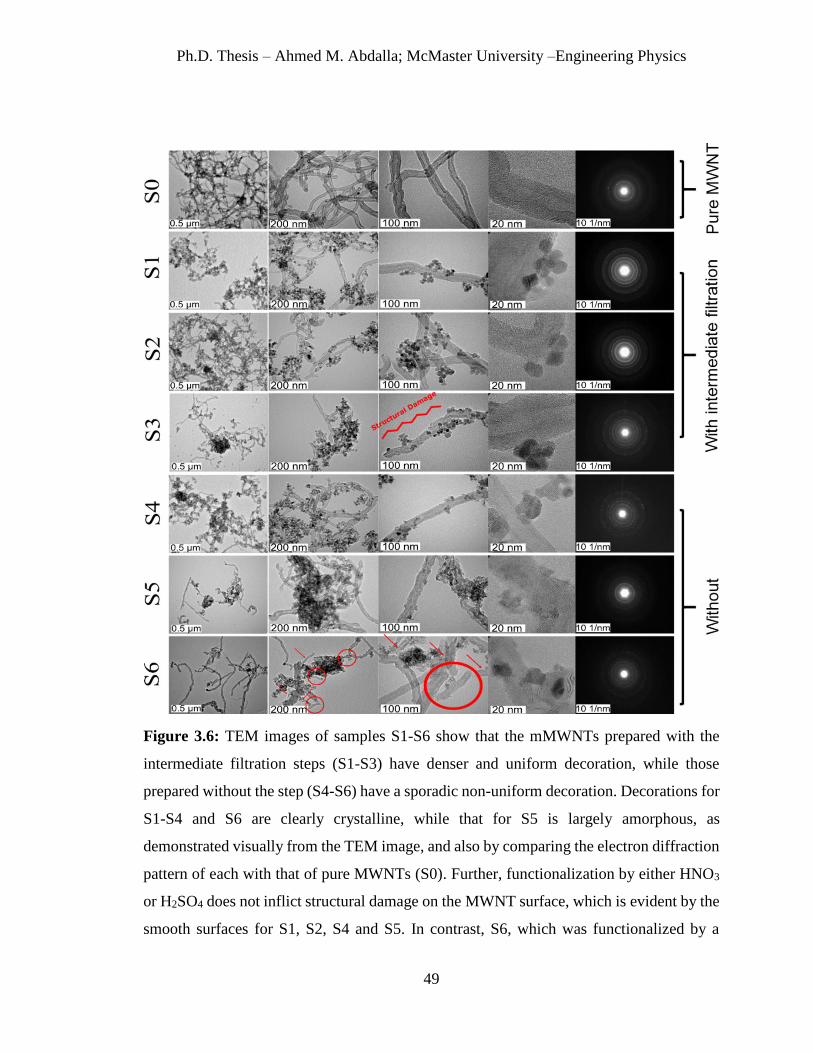
Ph.D. Thesis – Ahmed M. Abdalla; McMaster University –Engineering Physics
49
Figure 3.6: TEM images of samples S1-S6 show that the mMWNTs prepared with the
intermediate filtration steps (S1-S3) have denser and uniform decoration, while those
prepared without the step (S4-S6) have a sporadic non-uniform decoration. Decorations for
S1-S4 and S6 are clearly crystalline, while that for S5 is largely amorphous, as
demonstrated visually from the TEM image, and also by comparing the electron diffraction
pattern of each with that of pure MWNTs (S0). Further, functionalization by either HNO3
or H2SO4 does not inflict structural damage on the MWNT surface, which is evident by the
smooth surfaces for S1, S2, S4 and S5. In contrast, S6, which was functionalized by a

Ph.D. Thesis – Ahmed M. Abdalla; McMaster University –Engineering Physics
50
mixture of the two acids, contains small (~ 100 nm) MWNT fragments, emphasized by the
circles and arrows. S3, which was also treated with the acid mixture, does not contain these
small fragments since these are lost during filtration. However the structural damage is
manifested in the form of increased asperities on the MWNT surface.
The mMWNTs prepared using the intermediate filtration step (S1-S3) show a
visibly higher decoration density and fairly uniform decoration. S3 shows the highest
decoration density, which is consistent with the highest value of γ = 1.58 obtained using
XRD analysis. In contrast, mMWNTs prepared without the intermediate filtration step (S4-
S6) show sporadic decoration. S5 has the lowest decoration density, which agrees with the
obtained value of γ = 0.39. Further, while S1-S4 and S6 have visibly crystalline decorations,
the decorations on S5 are largely amorphous. This is evidenced by comparing the electron
diffraction patterns of all samples (S1-S6) with pure MWNTs (S0). The diffraction pattern
of S5 is largely identical to S0, i.e., no crystalline phases other than MWNTs are present in
S5. In contrast, the diffraction patterns of all other samples (S1-S4, S6) differ from that of
pure MWNTs, i.e., they contain crystalline phases other than MWNTs.
When MWNTs are functionalized using either HNO3 or H2SO4 (S1, S2, S4, S5)
they experience slight damage. In contrast, functionalization with a mixture of the two acids
(S3, S6) leads to greater structural damage. Short (≈100 nm) MWNT fragments are seen in
S6. Similar fragments were also likely produced in S3, but were lost to the filtrate. Here,
the MWNT surface shows asperities that are indicative of structural damage.
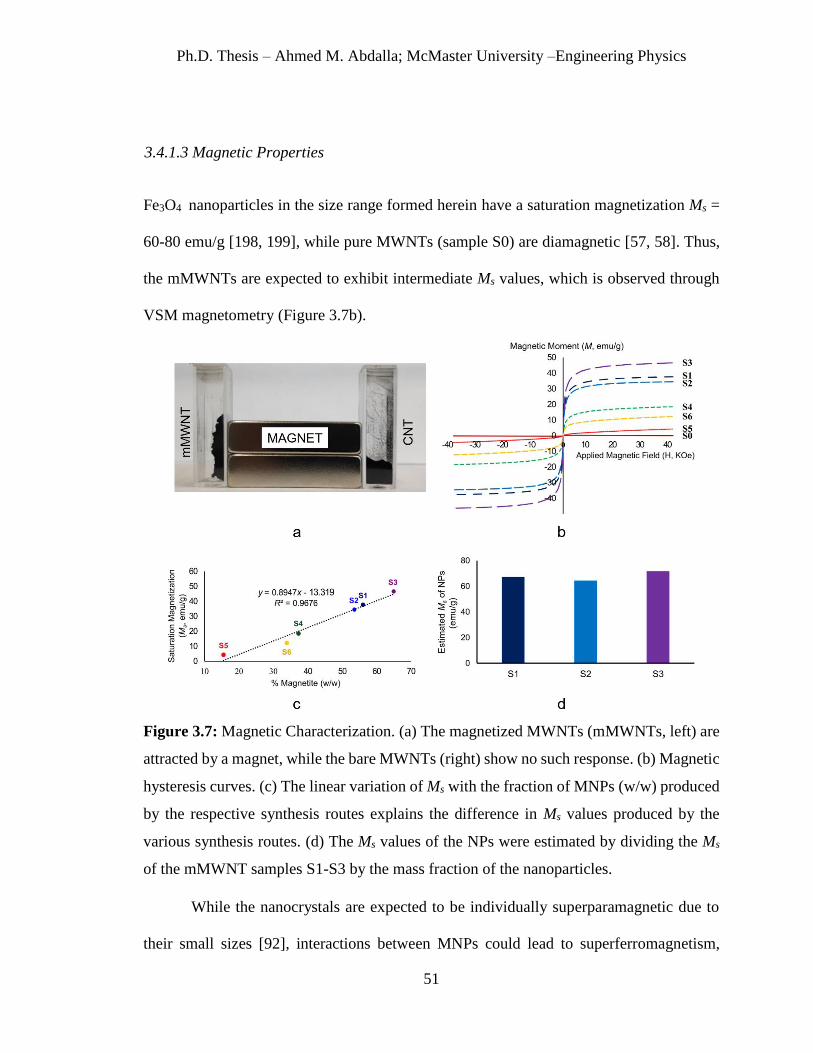
Ph.D. Thesis – Ahmed M. Abdalla; McMaster University –Engineering Physics
51
3.4.1.3 Magnetic Properties
Fe3O4 nanoparticles in the size range formed herein have a saturation magnetization Ms =
60-80 emu/g [198, 199], while pure MWNTs (sample S0) are diamagnetic [57, 58]. Thus,
the mMWNTs are expected to exhibit intermediate Ms values, which is observed through
VSM magnetometry (Figure 3.7b).
Figure 3.7: Magnetic Characterization. (a) The magnetized MWNTs (mMWNTs, left) are
attracted by a magnet, while the bare MWNTs (right) show no such response. (b) Magnetic
hysteresis curves. (c) The linear variation of Ms with the fraction of MNPs (w/w) produced
by the respective synthesis routes explains the difference in Ms values produced by the
various synthesis routes. (d) The Ms values of the NPs were estimated by dividing the Ms
of the mMWNT samples S1-S3 by the mass fraction of the nanoparticles.
While the nanocrystals are expected to be individually superparamagnetic due to
their small sizes [92], interactions between MNPs could lead to superferromagnetism,
Ph.D. Thesis – Ahmed M. Abdalla; McMaster University –Engineering Physics
52
particularly in anisotropic ensembles [199-201]. However, the measurements provide no
evidence of this phenomenon. The hysteresis data of Figure 3.7b shows that all samples are
superparamagnetic at room temperature, i.e., there is no observable remanence and the
coercive field is zero.
The variation in Ms depends upon the relative content of Fe3O4 in a sample, as
shown in Figure 3.7c. Thus, the mMWNTs produced by a process that includes
intermediate filtration to remove acids (S1-S3) are associated with higher Ms than those
prepared without this step. Sample S5 has the weakest Ms = 4.3 emu/g, which is to be
expected from the poor decoration observed in the corresponding TEM images, as well as
from the lower ~15% (w/w) Fe3O4 content revealed through the XRD analysis.
The Ms of the MNPs can be estimated by dividing the Ms of the mMWNTs from
samples S1-S3 by the mass fraction of MNPs in the corresponding samples. As shown in
Figure 3.7d, we estimate that the Ms of the nanoparticles formed lie in the range of 66-71
emu/g, which is consistent with Fe3O4 nanoparticles in the size range formed herein [198,
199], and substantially higher than what would have resulted if the Fe3O4 were oxidized to
γ-Fe2O3, i.e., Ms ~ 40 emu/g [195, 198, 199, 202, 203]. This adds credence to our claim that
the nanoparticles formed are indeed magnetite.
3.4.2 Influence of MNP Concentration on the Decoration of mMWNT
Figure 3.8 presents TEM images at various magnifications that help visualize the
mMWNTs and their decoration as the magnetite weight percentage with respect to MWNT
weights is varied. For all samples, the high-resolution images show that magnetite MNPs

Ph.D. Thesis – Ahmed M. Abdalla; McMaster University –Engineering Physics
53
are attached to the outer surfaces of MWNTs. The MNPs are crystalline with crystallite
sizes between 10-15 nm.
Figure 3.8: Influence of Fe3O4 - MWNT weight ratio (γ) on Morphology. Magnetic
nanoparticles are precipitated on activation sites. However, when γ is increased above a
certain value for which all available sites are occupied by MNPs, further precipitation of
the nanoparticles produces MNP agglomeration in a direction perpendicular to the MWNT
axis. An idealization of this process is presented on the left.

Ph.D. Thesis – Ahmed M. Abdalla; McMaster University –Engineering Physics
54
Increasing γ from 1 to 2 has a noticeable effect on the decoration density as the
numbers of magnetite MNPs that have accumulated at various sites increases. The activated
MWNT weight is constant in all samples. Thus, increasing the Fe+2/Fe+3 weight content
attaches a larger amount of MNPs to the same number of activation sites. Samples S1 and
S1.2 reveal better decoration uniformity and distribution, implying that the numbers of
activated sites on the outer surfaces of MWNTs and the corresponding MNPs are roughly
equal. For S1.3–S1.5, the sizes of the MNP agglomerates increase as the magnetite weight
percentage is raised. Since the weight percentage of magnetite is greater for S1.5 than for
S1.4, and likewise for S1.4 it is greater than for S1.3, this supports our interpretation that a
larger amount of MNPs become attached to a near constant number of activation sites. After
all activated sites are occupied, due to their relatively high surface energy, excess Fe+2/Fe+3
ions nucleate new MNPs on the surfaces of those that were previously precipitated.
Figure 3.8 presents representative TEM images for all samples, which reveal how
the decoration is influenced by increasing the MNP weight percentage. During covalent
functionalization, decoration is restricted to activated sites until all these sites are
completely occupied. Thereafter, the surface energy of freshly produced MNPs facilitates
their accumulation on the free surfaces of MNPs that are already attached to the MWNTs
[204]. Consequently, this subsequent accumulation proceeds primarily in a direction
perpendicular to the MWNT surface. Therefore, sample S1 with γ = 1 contains an optimal
mMWNT sample for which all activated MWNT sites are mostly decorated with single
MNPs and there are relatively few large agglomerates.
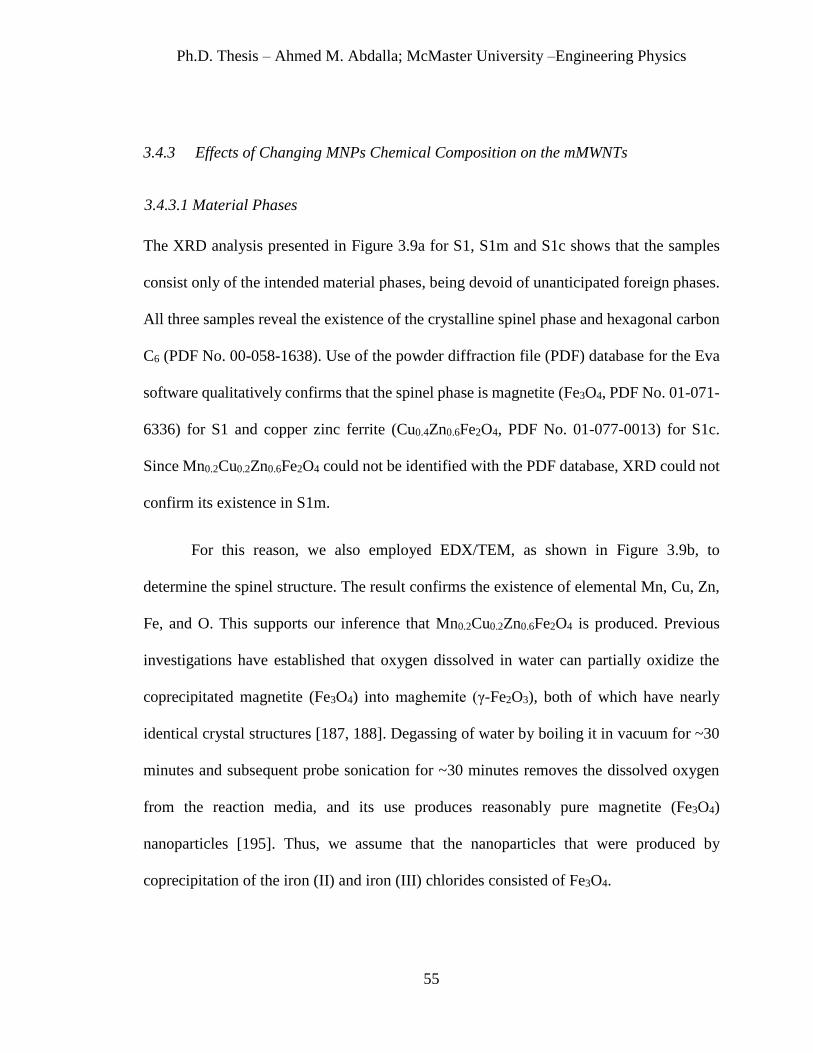
Ph.D. Thesis – Ahmed M. Abdalla; McMaster University –Engineering Physics
55
3.4.3 Effects of Changing MNPs Chemical Composition on the mMWNTs
3.4.3.1 Material Phases
The XRD analysis presented in Figure 3.9a for S1, S1m and S1c shows that the samples
consist only of the intended material phases, being devoid of unanticipated foreign phases.
All three samples reveal the existence of the crystalline spinel phase and hexagonal carbon
C6 (PDF No. 00-058-1638). Use of the powder diffraction file (PDF) database for the Eva
software qualitatively confirms that the spinel phase is magnetite (Fe3O4, PDF No. 01-071-
6336) for S1 and copper zinc ferrite (Cu0.4Zn0.6Fe2O4, PDF No. 01-077-0013) for S1c.
Since Mn0.2Cu0.2Zn0.6Fe2O4 could not be identified with the PDF database, XRD could not
confirm its existence in S1m.
For this reason, we also employed EDX/TEM, as shown in Figure 3.9b, to
determine the spinel structure. The result confirms the existence of elemental Mn, Cu, Zn,
Fe, and O. This supports our inference that Mn0.2Cu0.2Zn0.6Fe2O4 is produced. Previous
investigations have established that oxygen dissolved in water can partially oxidize the
coprecipitated magnetite (Fe3O4) into maghemite (γ-Fe2O3), both of which have nearly
identical crystal structures [187, 188]. Degassing of water by boiling it in vacuum for ~30
minutes and subsequent probe sonication for ~30 minutes removes the dissolved oxygen
from the reaction media, and its use produces reasonably pure magnetite (Fe3O4)
nanoparticles [195]. Thus, we assume that the nanoparticles that were produced by
coprecipitation of the iron (II) and iron (III) chlorides consisted of Fe3O4.

Ph.D. Thesis – Ahmed M. Abdalla; McMaster University –Engineering Physics
56
We used the Scherrer equation (3.3) to determine the average magnetic nanocrystal
size D. For all three samples, the MNP sizes lie in the narrow range of 8.1, 8.9 and 9 nm
for S1, S1m and S1c, respectively.
\
Figure 3.9: Phases Analysis of Magnetized MWNTs. (a) The XRD (Co Kα) patterns show
that, besides C6, a nanocrystalline spinel phase was formed. The Spinel phase in S1 was
identified as magnetite (Fe3O4), in S1c it was Cu-Zn ferrite (Cu0.4Zn0.6Fe2O4). The
corresponding phase in S1m could not be identified using the powder diffraction file (PDF)
database. (b) EDX analysis revealed the presence of Mn, Cu, Zn, Fe, and O, which supports
our inference that S1m contains Mn0.2Cu0.2Zn0.6Fe2O4.
3.4.3.2 Decoration with Different MNPs
TEM images show successful direct attachment of the MNPs to the MWNT surfaces for
samples S1, S1m and S1c at various magnifications (Figure 3.10). All MNPs have high
crystallinity with a narrow crystallite sizes distribution between 10-15 nm. The
Cu0.4Zn0.6Fe2O4/CNT sample S1c reveals more MNP agglomeration than is evident for S1
and S1m.
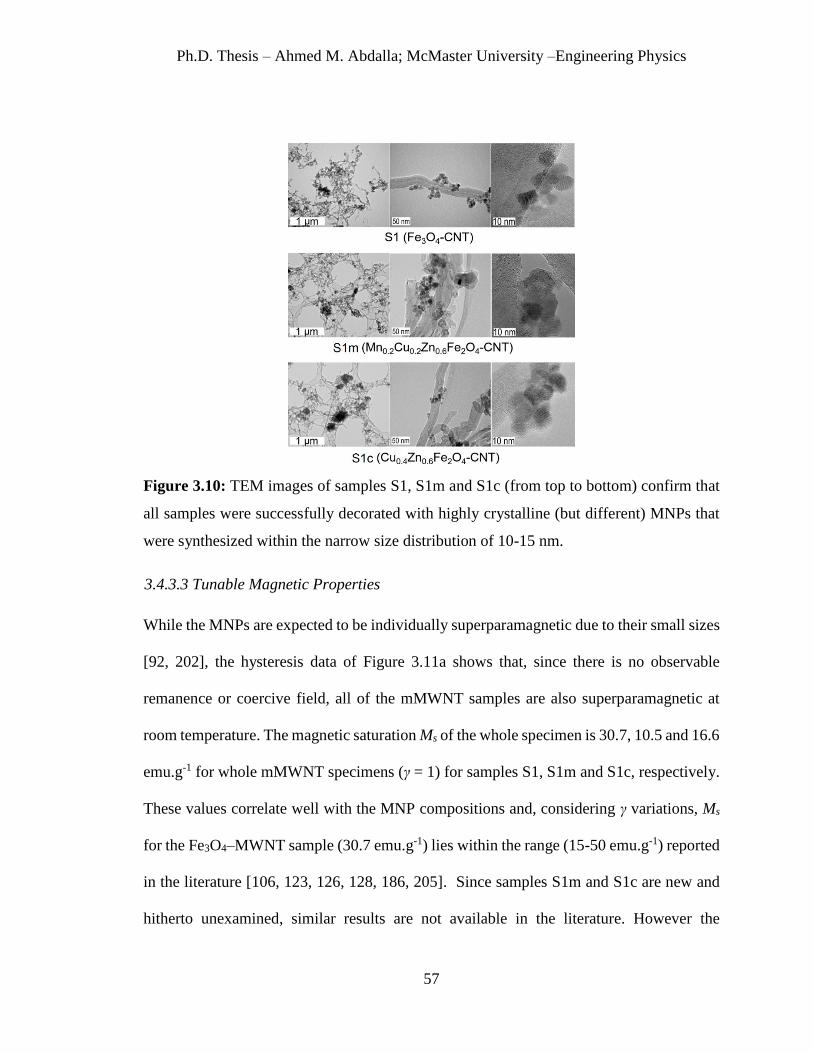
Ph.D. Thesis – Ahmed M. Abdalla; McMaster University –Engineering Physics
57
Figure 3.10: TEM images of samples S1, S1m and S1c (from top to bottom) confirm that
all samples were successfully decorated with highly crystalline (but different) MNPs that
were synthesized within the narrow size distribution of 10-15 nm.
3.4.3.3 Tunable Magnetic Properties
While the MNPs are expected to be individually superparamagnetic due to their small sizes
[92, 202], the hysteresis data of Figure 3.11a shows that, since there is no observable
remanence or coercive field, all of the mMWNT samples are also superparamagnetic at
room temperature. The magnetic saturation Ms of the whole specimen is 30.7, 10.5 and 16.6
emu.g-1 for whole mMWNT specimens (γ = 1) for samples S1, S1m and S1c, respectively.
These values correlate well with the MNP compositions and, considering γ variations, Ms
for the Fe3O4–MWNT sample (30.7 emu.g-1) lies within the range (15-50 emu.g-1) reported
in the literature [106, 123, 126, 128, 186, 205]. Since samples S1m and S1c are new and
hitherto unexamined, similar results are not available in the literature. However the
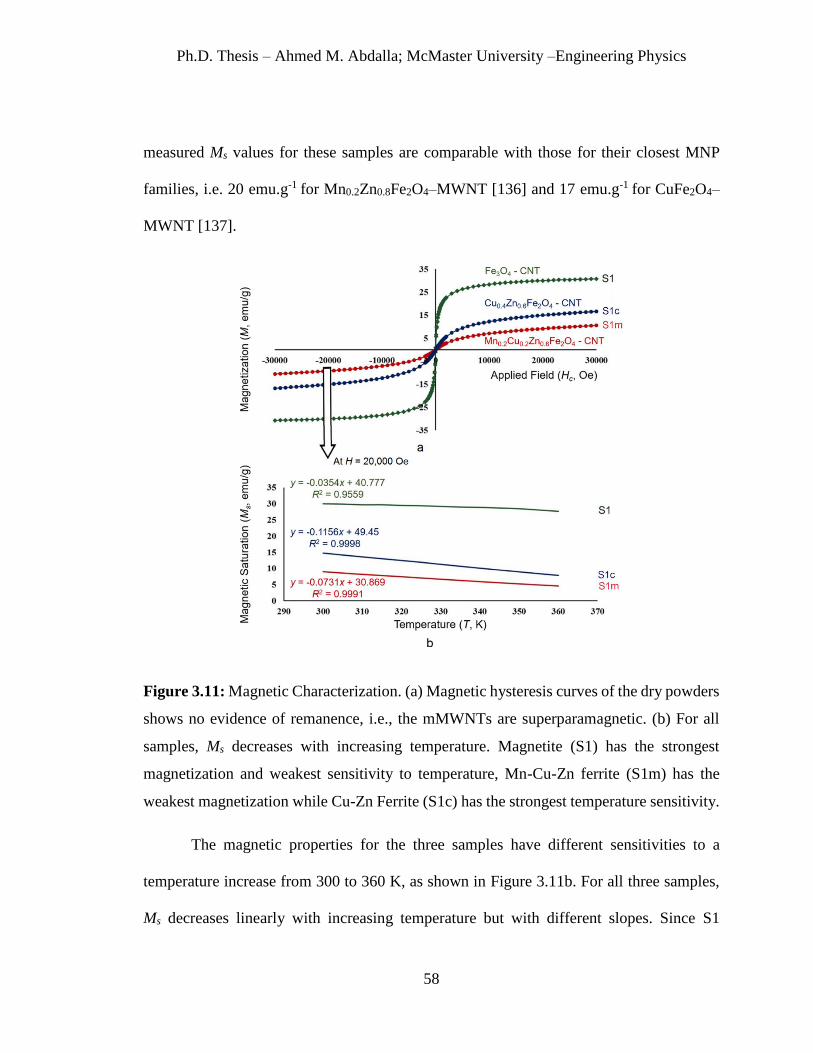
Ph.D. Thesis – Ahmed M. Abdalla; McMaster University –Engineering Physics
58
measured Ms values for these samples are comparable with those for their closest MNP
families, i.e. 20 emu.g-1 for Mn0.2Zn0.8Fe2O4–MWNT [136] and 17 emu.g-1 for CuFe2O4–
MWNT [137].
Figure 3.11: Magnetic Characterization. (a) Magnetic hysteresis curves of the dry powders
shows no evidence of remanence, i.e., the mMWNTs are superparamagnetic. (b) For all
samples, Ms decreases with increasing temperature. Magnetite (S1) has the strongest
magnetization and weakest sensitivity to temperature, Mn-Cu-Zn ferrite (S1m) has the
weakest magnetization while Cu-Zn Ferrite (S1c) has the strongest temperature sensitivity.
The magnetic properties for the three samples have different sensitivities to a
temperature increase from 300 to 360 K, as shown in Figure 3.11b. For all three samples,
Ms decreases linearly with increasing temperature but with different slopes. Since S1

Ph.D. Thesis – Ahmed M. Abdalla; McMaster University –Engineering Physics
59
contains high Curie temperature Fe3O4 MNPs, it is weakly sensitive to the temperature rise
and hence exhibits the lowest slope of 0.04 emu.g-1.K-1 due to a small loss of 7.7% from its
300 K Ms value. Results for the MNPs that have lower Curie temperatures, i.e.,
Mn0.2Cu0.2Zn0.6Fe2O4 in S1m and Cu0.4Zn0.6Fe2O4 in S1c, show that they are more sensitive
to the temperature increase. The two respective slopes of 0.07 and 0.12 emu.g-1.K-1 are
steeper, with samples S1m and S1c losing 48.9% and 46.6% of their Ms values at 300 K.
These results provide evidence that the magnetic properties of mMWNTs can be tuned to
by varying the MNP composition.
3.5 Conclusion
Six functionalization routes to decorate MWNTs by in situ co-precipitated magnetic
nanoparticles are examined to determine best practices. Of these six routes, four (S2 and
S4-S6) are newly reported herein. Functionalization using H2SO4 is found to minimize
MWNT loss during decoration and provides a decoration density very close to unity.
Although mixtures of HNO3 and H2SO4 have been commonly employed, they are found to
inflict significant structural damage to the MWNTs. If the MWNT suspension is filtered
after acid functionalization, this damage produces short MWNT fragments that are lost to
the filtrate. The loss of MWNTs can be as much as ≈ 46% (w/w) and accompanied with
significant nanotube oxidation with oxygen content up to 15.23%. Functionalization with
either HNO3 or H2SO4 is much less destructive with less oxidation in this context. However,
even after considering MWNT damage, the filtration step is important since it removes
leftover acid from the dispersion prior to co-precipitation. In the absence of filtration, the
acids react with iron ions to produce nonmagnetic byproducts which compromise the
Ph.D. Thesis – Ahmed M. Abdalla; McMaster University –Engineering Physics
60
magnetization of the mMWNTs. Overall, (a) functionalizing with HNO3 or H2SO4,
followed by (b) filtration, (c) washing, (d) drying and (e) subsequent in situ coprecipitation
of MNPs yields the best quality MNPs, relatively high mMWNT yield of ≈ 95%,
magnetization ratio close to the intended value of unity, reasonably uniform MNP
distribution on the mMWNT surfaces, and negligible MWNT shortening and damage.
MWNTs were decorated by in situ co-precipitation with different magnetic
nanoparticles (MNPs) for varying magnetization weight ratios γ in the range of 1-2. The
decoration of the MWNTs with MNPs depends upon the availability of activation sites on
the outer surfaces of the nanotubes. All MWNT activation sites are utilized when γ reaches
a specific value. Typically, γ =1 provides uniform decoration and minimum agglomeration.
Although the quantity of MNPs exceeds the number of the activation sites when γ is
increased above this value, decoration still continues with nanoparticle agglomeration
occurring perpendicular to the MWNT surface. The MNP chemical composition influences
the magnetic properties of mMWNTs. Fe3O4 MNPs that have a high Curie temperature
produce mMWNTs with the highest magnetic saturation Ms = 30.7 emu.g-1. These
mMWNTs exhibit the weakest sensitivity to a temperature increase of 60 K above 300 K
with a corresponding reduction in Ms of 7.7%. Mn0.2Cu0.2Zn0.6Fe2O4, and Cu0.4Zn0.6Fe2O4
MNPs have lower Curie temperatures. Thus mMWNTs produced with these MNPs have
lower Ms values (10.5 and 16.6 emu.g-1, respectively) and are more sensitive to a
temperature increase (with up to 48.9% and 46.6% reductions in Ms).

Ph.D. Thesis – Ahmed M. Abdalla; McMaster University –Engineering Physics
61
4. Conductive Nano-inks Based on Covalently Magnetized
MWNTs
4.1 Introduction
In this chapter, an experimental investigations will be presented to highlight the application
of magnetic MWNT synthesised via covalent functionalization in the fabrication of
conductive nano-inks. We synthesize a novel and hitherto unreported class of colloidal
suspensions for which the dispersed phase, which consists of multiwall carbon nanotubes
(MWNTs) decorated with magnetic nanoparticles (MNPs), is both magnetoresponsive and
electrically conductive. Synthesis of the dispersed phase merges processes for producing
ferrofluids and magnetic MWNTs (mMWNTs). Further, we explore how to adapt this
magnetoresponsive and conductive ink to be also bio-sensitive enabling the printing of
biosensing strips by the magnetic dynamic-assembly. That led to the fabricating of
biological sensors. This chapter is adapted from the Journal of Magnetism and Magnetic
Materials, Magnetoresponsive conductive colloidal suspensions with magnetized carbon
nanotubes, 421, Ahmed M Abdalla, Abdel Rahman Abdel Fattah, Suvojit Ghosh, and
Ishwar K Puri, Copyright 2017, with permissions from Elsevier. The author of this thesis
is the first author and main contributor of the above mentioned publication and has
conducted all the experiments. Rest of the work and results have been previously published
in journal of ACS Applied Materials and Interfaces, Magnetic Printing of a Biosensor:
Inexpensive Rapid Sensing to Detect Picomolar Amounts of Antigen with Antibody-
Functionalized Carbon Nanotubes, 9 (13), Abdel Rahman Abdel Fattah, Ahmed M

Ph.D. Thesis – Ahmed M. Abdalla; McMaster University –Engineering Physics
62
Abdalla, Sarah Mishriki, Elvira Meleca, Fei Geng, Suvojit Ghosh, and Ishwar K. Puri,
Copyright 2017, with permissions from ACS Publications. The author of this thesis is the
co-first author with Dr. A. R. Abdel Fattah, Ms. S. Mishriki of the above mentioned
publication and has performed the magnetization of carbon nanotubes toward the biological
ink’s preparation and done the materials characterization.
4.2 Background Information
Nanofluids are colloidal suspensions that contain nanoparticles dispersed in a liquid [151].
Due to their superior electric conductivity, carbon nanotubes (CNTs) have been introduced
as the dispersed phase in a nanofluid. When dispersed in an aqueous medium, as little as
0.5% (w/w) of CNTs can increase its electric conductivity by an order of magnitude [154].
However, CNTs tend to flocculate rapidly in an aqueous medium, yielding clusters of
randomly oriented nanotubes that settle under gravity [158]. Since flocculation is typically
caused by inter-CNT attractions due to surface charges [160, 161], temporary dispersions
can be achieved by enhancing inter-CNT distances, e.g., through ultrasonication [206, 207].
However, to achieve long term stability, chemical peptization methods are required, such
as providing CNTs with a surface coating to counterbalance the surface interactions [164].
Peptization is hard to achieve for CNTs due to their high molecular weight, hydrophobicity
and inertness of their outer surfaces [208].
Ferrofluids are nanofluids that respond to a magnetic field [209-212] since the
dispersed phase consists of magnetic nanoparticles (MNPs) [213-215]. Several methods
have been developed to peptize MNPs in aqueous media to enable their colloidal stability

Ph.D. Thesis – Ahmed M. Abdalla; McMaster University –Engineering Physics
63
for extended periods [216-218]. Typically, MNPs are coated with a surfactant that produces
interparticle repulsion [161, 219]. These MNPs can chaperone other nonmagnetic
materials, such as MWNTs, to orient and organize them [20, 220], and print spatial
heterogeneities in materials [95, 96]. However, the MNPs in most ferrofluids are ferrites
that possess poor intrinsic electrical conductivity. A ferrofluid containing an electrically
conductive dispersed phase has promising applications. Since its MNPs can be manipulated
by a magnetic field, the local electrical conductivity of a conductive ferrofluid can be tuned.
Magnetic manipulation also allows the printing of an electronic circuit with a conductive
ink.
Conductive nanofluid inks are typically dispersions of gold, silver, and copper
nanoparticles, but these are expensive, require nanoparticle sintering and have only fair
dispersion and oxidation resistance [221]. While use of graphene and CNTs has been
reported, their agglomeration and dispersion are problematic [151, 155, 222]. Our solution
is to decorate multiwall carbon nanotubes (MWNTs, the electrically conductive dispersed
phase) with magnetically responsive MNPs.
We probe ways to influence the electrical and magnetic properties of the MWNTs
by altering the material content of the MNPs. The synthesized mMWNTs are dispersed in
an aqueous medium to prepare novel magnetoresponsive conductive colloidal suspensions
(MCCs). An ionic dispersant (tetramethylammonium hydroxide, or TMAH), commonly
used to peptize ferrite MNPs, is used to ensure colloidal stability. These MCCs are a
hitherto unreported type of colloidal suspension that responds to an external magnetic field,
is electrically conductive and can be stably dispersed.

Ph.D. Thesis – Ahmed M. Abdalla; McMaster University –Engineering Physics
64
The need for early pathogen detection and diagnosis of disease has led to strategies
for DNA and antigen (Ag) detection such as polymerase chain reaction (PCR) and enzyme-
linked immunosorbent assay (ELISA). Being time consuming and labor intensive, these
methods are not suitable for inexpensive rapid detection [223]. Recent advances in
nanomaterial synthesis and nanofabrication have enabled the rapid identification of
pathogen and disease biomarkers. Nanoscale lithography allows for femtosensitive DNA
detection [224, 225] and the electrical response of carbon nanotubes (CNTs) to specific
biological species has led to resistance and field effect transistor (FET) biosensors [226-
230].
Biosensors can be tailored towards specific biomarkers by selectively modifying a
CNT surface, e.g., by decorating it with particular antibodies (Abs), which enables the
detection of specific Ags, leading to an inexpensive and rapid alternative to current
methods. Usually, fabrication utilizes laborious lithography for electrode deposition and
general sensor assembly, while simpler benchtop fabrication methods, e.g., CNTs in paper-
based biosensors, provide longer sensing response times [231].
Magnetic nanoparticles (MNPs) can be patterned into a polymer matrix to produce
a functional material [62, 215, 232-241]. As described previously in MCC, MNPs can also
be used to chaperon MWNTs by remotely manipulating MNP-MWNT complexes with a
magnetic field, for instance, to print conductive networks and sensors [232, 242]. Magnetic
MWNTs (mMWNTs or MWNT-Fe3O4 hybrid nanoparticles) have been explored for
biological applications, e.g., human IgG immunosensors [233], and for electrical current
measurements [230, 243]. Most such measurements involve cyclic voltammogram

Ph.D. Thesis – Ahmed M. Abdalla; McMaster University –Engineering Physics
65
analysis, which requires sophisticated acquisition devices and a magnet to be continually
present during sensing to affix the sensing material to an electrode [244].
Based on the same concept of the previously described MCC, our contribution is
through development of a new mMWNT biosensor ink that utilizes immobilized Abs to
detect specific Ags, which expands the utility of mMWNTs as protein-sensing
nanomaterials. Without requiring complex chemistry or lithographic techniques, synthesis
of the magnetic ink is inexpensive and a sensor strip is readily fabricated. The ink is printed
using an external magnet by dynamically organizing its nanoparticle constituent into an
electrically conducting strip in 4-5 minutes, excluding drying time. The resulting biosensor
detects Ag samples with picomolar sensitivity in less than a minute.
Biomarkers distinguish between healthy and diseased cells. Examples include
prostate-specific antigen (PSA) [245], insulin-like growth factors (IGFs) [246], and human
epidermal growth factor receptor (HER)-2 [247], which are used to diagnose human
cancers. Recognized by the anti-c-Myc primary Ab, the c-Myc Ag is over-expressed in
many human cancers, such as breast, prostate, gastrointestinal, lymphoma, melanoma and
myeloid leukemia [248, 249]. High expression of c-Myc Ag can accelerate tumour
progression [250], making it a potentially important cancer biomarker for predicting
clinical outcomes. Therefore, we focus on c-Myc Ag detection to illustrate proof of concept
of an Ab magnetic ink for an Ag sensing application.

Ph.D. Thesis – Ahmed M. Abdalla; McMaster University –Engineering Physics
66
4.3 Methodology
4.3.1 Materials and Reagents
Multiwall carbon nanotubes (MWNTs) produced by CVD with purity > 95%, outside
diameter of 20-30 nm, inside diameter of 5-10 nm and length between 0.5-2.0 µm, were
purchased from US Research Nanomaterials. Other reagents used were ferric chloride
hexahydrate (FeCl3·6H2O, 97%, Alfa Aesar), ferrous chloride hexahydrate (FeCl2·4H2O,
98%, Alfa Aesar), copper II chloride (CuCl2, 98%, Alfa Aesar), tetramethyl ammonium
hydroxide (C4H13NO·5H2O, 98%, Alfa Aesar), manganese II chloride tetrahydrate
(MnCl2·4H2O, 99%, Sigma Aldrich), zinc chloride (ZnCl2, 99%, Sigma Aldrich), sodium
hydroxide (NaOH, 97%, Caledon Laboratory Chemicals), nitric acid (HNO3, 68-70%,
Caledon), and ammonium hydroxide (NH4OH, 28-30%, Caledon). C-Myc Ag (Abcam,
Cambridge, Massachusetts, USA) had a molecular weight of 49 kDa (49,000 g mol-1).
Bovine serum albumin (BSA) (Sigma Aldrich, Oakville, Ontario, Canada) was used as a
negative control. All reagents were used as received without further purification. The
NdFeB, Grade N52 magnets were purchased from K&J Magnetics Inc (25.4×6×6 mm).
The electrode support was fabricated using polydimethylsiloxane (PDMS) and a curing
agent (Sylgard 184 kit, Dow Corning). The coverslips (Fisher Scientific, 12-540-B) had
dimensions of 22×22×2 mm.
4.3.2 Synthesis of Magnetoresponsive Conductive Colloids (MCCs)
Three different MCCs (MCC1, MCC2 and MCC3) were synthesized using the mMWNT
samples S1, S1c, and S1m (section 3.3.4). These preparations followed principles used to

Ph.D. Thesis – Ahmed M. Abdalla; McMaster University –Engineering Physics
67
synthesize ordinary ionic ferrofluids [162]. As illustrated in Figure 4.1, since the MNPs are
attached to the outer surface of the MWNTs through covalent bonds, they magnetize the
MWNTs and, with assistance of an ionic surfactant and vigorous sonication, carry, suspend,
and stabilize the MWNTs in DI water. The mMWNTs therefore have the ability to move
along with the whole fluid in response to an applied magnetic field. The ionic surfactant
facilitates whole fluid electric conductivity since the electrical discontinuity due to separate
suspended mMWNTs is now overcome.
Figure 4.1: Synthesis of Magnetoresponsive Conductive Colloids (MCCs). (a) MWNTs
are first dispersed in water and then covalently functionalized with MNPs that are
coprecipitated in situ. The resulting mMWNTs are peptized using tetramethylammonium
hydroxide (TMAH) as a surfactant, yielding magnetoresponsive conductive colloids
(MCCs). (b) Upon visual inspection, an aqueous dispersion of MCCs rests in the absence
of a magnet (left) whereas it is attracted towards a magnet when it is present (right).
Although the mMWNT suspensions were not filtered or dried, the co-
precipitation by-products were removed from the three samples by decanting and washing
them. The pH was concurrently stabilized between 9-10 using precipitant drops during
washing. The resulting dilute suspensions settled over 24 h under gravity after which excess
water was removed, leaving behind denser suspensions. Next, a 25% TMAH solution of

Ph.D. Thesis – Ahmed M. Abdalla; McMaster University –Engineering Physics
68
the ionic surfactant was added where 60 ml of the solution was used for each 100 ml of an
mMWNT suspension. Sonication was performed thereafter for 10 min using a probe
sonicator. The MCCs were isolated for 24 h after which excess water was again removed.
Samples of known volume were extracted from the preparation before and after surfactant
addition, and also weighed before and after drying.
4.3.3 Synthesis of Magnetic Biological Ink
Like MCC, the first step in producing the magnetic biological ink requires treatment of
CNTs with concentrated HNO3. This creates surface sites where reactive molecules, such
as COOH, C=O, and C–OH, form covalent bonds with the CNT scaffold and subsequently
nucleate magnetite nanocrystals (Fe3O4) [18]. When the MNP yield is low enough, anti-c-
Myc covalently bonds to the surface through a condensation reaction between the amine
groups of the Ab and the remaining carboxylic groups [226] without additional reagents
[244]. The synthesis process of bioink is described in Figure 4.2.
The MWNTs are functionalized in the manner we reported of sample S1 described
previously in section 3.3.3 [18]. Briefly, 1 g of MWNTs was first activated by dispersing
it in 200 mL of concentrated nitric acid and sonicated for 4 h in a sonication bath (VWR
International, Model: 97043-936). The activated MWNTs (aMWNTs) were subsequently
washed several times with deionized (DI) water, filtered, washed again and finally dried in
a vacuum oven. Magnetite nanoparticles were co-precipitated onto the aMWNTs by
stoichiometric calculations to obtain a Fe3O4:aMWNTs magnetization weight ratios γ = 0.1,
0.2, and 0.4 (w/w). For γ = 0.4, a mixture of 0.92 g of FeCl3·6H2O and 0.36 g of FeCl2·4H2O
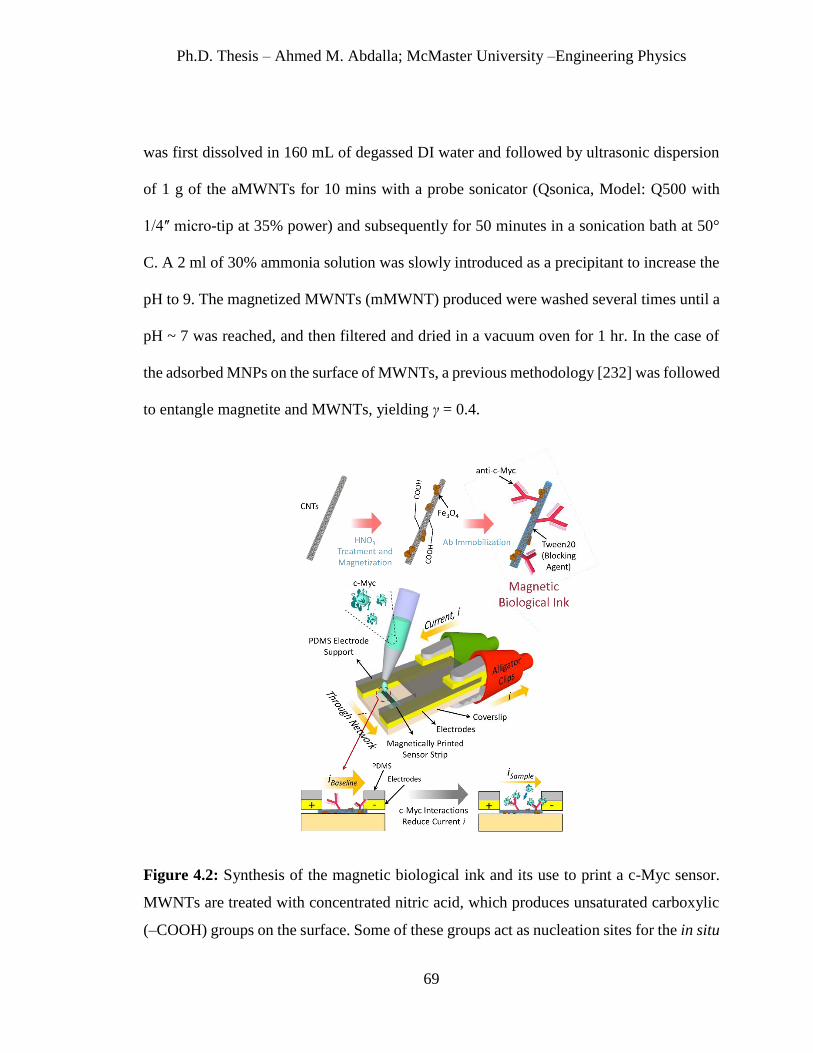
Ph.D. Thesis – Ahmed M. Abdalla; McMaster University –Engineering Physics
69
was first dissolved in 160 mL of degassed DI water and followed by ultrasonic dispersion
of 1 g of the aMWNTs for 10 mins with a probe sonicator (Qsonica, Model: Q500 with
1/4ʺ micro-tip at 35% power) and subsequently for 50 minutes in a sonication bath at 50°
C. A 2 ml of 30% ammonia solution was slowly introduced as a precipitant to increase the
pH to 9. The magnetized MWNTs (mMWNT) produced were washed several times until a
pH ~ 7 was reached, and then filtered and dried in a vacuum oven for 1 hr. In the case of
the adsorbed MNPs on the surface of MWNTs, a previous methodology [232] was followed
to entangle magnetite and MWNTs, yielding γ = 0.4.
Figure 4.2: Synthesis of the magnetic biological ink and its use to print a c-Myc sensor.
MWNTs are treated with concentrated nitric acid, which produces unsaturated carboxylic
(–COOH) groups on the surface. Some of these groups act as nucleation sites for the in situ

Ph.D. Thesis – Ahmed M. Abdalla; McMaster University –Engineering Physics
70
co-precipitation of magnetite (Fe3O4) nanocrystals and the remainder are available for anti-
c-Myc amine (–NH2) groups to form covalent bonds with the MWNT surfaces. The
magnetic biological ink is then deposited onto a glass substrate using a pipette where it
dynamically organizes under the influence of an external magnetic field and prints an
electrically conducting pattern.
Following activation and magnetization of the MWNTs, Ab immobilization was
performed. For each mg of MWNTs contained in the mMWNTs, 2 mL of deionized water
was used as media to disperse the precursor magnetic ink in solution with a probe sonicator
(15 seconds, 30% amplitude). Corresponding to the amount of MWNTs, an anti-c-
Myc:MWNT weight ratio 𝛽 = 2.5×10⁻⁴ value was selected and an appropriate amount of
Ab (0.5 µL, 0.5 mg mL-1) was added to the mMWNTs (1.4 mg) in solution. The mixture
was incubated for 1 hour at room temperature, inverted gently every five minutes to
maintain the suspension, or when sedimentation of the magnetic biological ink was
observed. Following incubation, the supernatant was removed.
A blocking procedure was then performed to prevent non-specific binding of Ag
molecules to the magnetic biological ink. Blocking of the MWNT surface ensures that the
detected signal is directly related to the specific Ag-Ab interaction, reducing noise that may
originate due to adsorption of non-specific molecules [226, 251]. For every 1 mg of
aMWNTs, 2 mL of blocking solution (0.1% Tween 20 in deionized water) was added to
the magnetic biological ink [229]. The ink was blocked for a half hour at room temperature,
inverted gently every five minutes to ensure saturation of the ink surface. Following
incubation with the blocking solution, the blocked ink was washed three times in deionized
water. A final concentration of 10 mg/mL was obtained by adjusting the amount of DI

Ph.D. Thesis – Ahmed M. Abdalla; McMaster University –Engineering Physics
71
water. The same approach was followed for the case when MNPs and Ab were adsorbed
on the MWNT surfaces. These biological inks are used to print patterns between electrically
conductive electrodes. Once the pattern evaporates, the resulting feature is used as a
biosensor that measures its electrical response to deposited samples. The measurements are
capable of distinguishing between varying picomolar concentrations of c-Myc within 60
seconds (Figure 4.2).
4.3.5 Electrical Circuit, Sensor Assembly and Sensing.
To investigate the sensing capability of the dried ink, a voltage divider circuit was used
with a reference resistance of Rref = 100 kΩ. A square PDMS (2.5×2.5×0.3 cm) section
was used to support two aluminum foil electrodes. The electrodes were separated by 5 mm
and fixed to the PDMS support using double-sided tape. A cutout (1×0.5 cm) through the
PDMS support was centered between the electrodes to allow sample deposition on the ink
strip. The electrodes were wrapped around this support to provide electrical access with
alligator clips. The PDMS electrode assembly was positioned on the top of the sensor, while
the alligator clips held the sensor assembly together mechanically. This ensured good
connection between the ink network and the aluminum electrodes. Each electrode covered
a ~1 mm section of the sensor, leaving another 5 mm ink strip exposed for sample
deposition and therefore Ag detection. The printed sensor of resistance Rs was connected
in series with Rref. A PLC (Arduino Uno) supplied the circuit with a 5 V DC power supply,
while an analog feedback voltage allowed the PLC and computer unit to interpret and
sample the current i passing through the circuit at a frequency of 10 Hz. After each test, the

Ph.D. Thesis – Ahmed M. Abdalla; McMaster University –Engineering Physics
72
electrodes were wiped with ethanol (100%) and left to dry to ensure that no cross
contamination occurred.
4.3.6 Characterization Methods
XRD analysis of MWNT and mMWNT powder samples was performed using a Bruker D8
Discover instrument comprising a DavinciTM diffractometer operating at 35 kV and 45 mA
using Co-Kα radiation (λavg = 1.79026 Å). Bruker’s DIFFRAC.Eva V3.1 software was used
for qualitative analysis of the constituent phases. Transmission electron microscopy (TEM)
and electron energy loss spectroscopy (EELS) spectroscopy were with a JEOL 2010F field
emission microscope. For TEM, the samples were suspended in ethanol, dripped on to a
TEM grid and then wicked off with a tissue wipe. Optical and fluorescence (Enhanced
Green Fluorescent Protein, EGFP) microscopy were conducted using a Zeiss Axio
Observer.Z1. Magnetization measurements were performed using SQUID magnetometry
at room temperature. Electrical conductivity measurements were performed using a VWR
SympHony conductivity probe (Model B40PCID). The suspension stability was measured
using a dynamic light scattering and zeta potential measurer (Malvern Instruments, Model:
ZEN3600 - Zetasizer Nano ZS). The zeta potential ζ is the potential difference between the
dispersion medium and the thin stationary layer of fluid on the surface the particle. The
potential indicates the degree of repulsion between charged particles in dispersion, where
large ζ is indicative of stability [252].

Ph.D. Thesis – Ahmed M. Abdalla; McMaster University –Engineering Physics
73
4.4 Results and Discussion
4.4.1 Magnetoresponsive Conductive Colloids (MCCs)
The MCC densities and compositions (γ =1) are presented in Table 4.1. The compositions
of the colloidal suspensions were measured by drying samples of known weight and volume
before adding the surfactant solution that had a specified concentration. The 1.22 g/cm3
density of MCC2 is slightly lower than the 1.26 g/cm3 densities of MCC1 and MCC2. This
small variation can be explained by the difference in the chemical composition of the
MNPs. The three fluids exhibit different visual responses toward magnets. MCC1 has the
strongest response, as shown in Figure 4.1b, which is reasonable since it is based on sample
S1 that has the highest Ms = 30.6 emu/g.
Material Phase MCC1 MCC2 MCC3
MNPs Fe3O4 Mn0.2Cu0.2Zn0.6Fe2O4 Cu0.4Zn0.6Fe2O4
mMWNT wt% 4.1% 3.9 % 4.1 %
TMAH wt% 10% 10 % 10 %
H2O wt% 85.9% 86.1% 85.9%
Density (g/cm3) 1.26 1.22 1.26
Table 4.1: MCC compositions and densities. In all MCCs, ≈4 weight percent of mMWNT
was dispersed in 10 weight percent TMAH aqueous solution. The densities of the three
MCCs are almost similar and lie between 1.22-1.26 g/cm. The small variations occur due
to the different MNP weight percentages and chemical compositions.
As shown in Figure 4.3a, the ions in the surrounding medium rearrange around the
ends of the conductive MWNTs when they are polarized with an applied electric field Ea.
This shortens the ion transport path in the direction of polarization and decreases the

Ph.D. Thesis – Ahmed M. Abdalla; McMaster University –Engineering Physics
74
effective electrical resistance of the colloidal suspension as per Coulomb’s law [151, 155].
DI water has a relatively poor electric conductivity of 0.005 mS.cm-1, as shown in Figure
4.3b. Its conductivity is enhanced to 90.5 mS.cm-1 by simply dissolving ten percent TMAH
by weight. Adding another 4 weight percent of mMWNTs further increases the
conductivity by 65% for MCC1 (to 149.5 mS.cm-1), 78% for MCC2 (to 161 mS.cm-1) and
90% for MCC3 (to 169.5 mS.cm-1). MCC3 consisting of MNPs with the highest copper
content facilitate the highest electric conductivity, which shows how increasing the Cu
content in an MNP improves the electric conductivity of its MCC.
Figure 4.3: MCC Electrical Conductivity. (a) MWNTs placed in an ionic medium between
two electrodes charged by an electric field Ea polarize and become oriented along the
direction of the field. This MWNT orientation shortens the ion transport path, decreasing
the effective electrical resistance of the colloidal suspension. (b) Dissolving 10% (w/w) of
tetramethyl ammonium hydroxide (TMAH) in DI water increases the electrical
conductivity σ to 90.5 mS cm-1. Dispersing 4% (w/w) of the different mMWNTs in the
TMAH solution enhances σ by 65-90%.
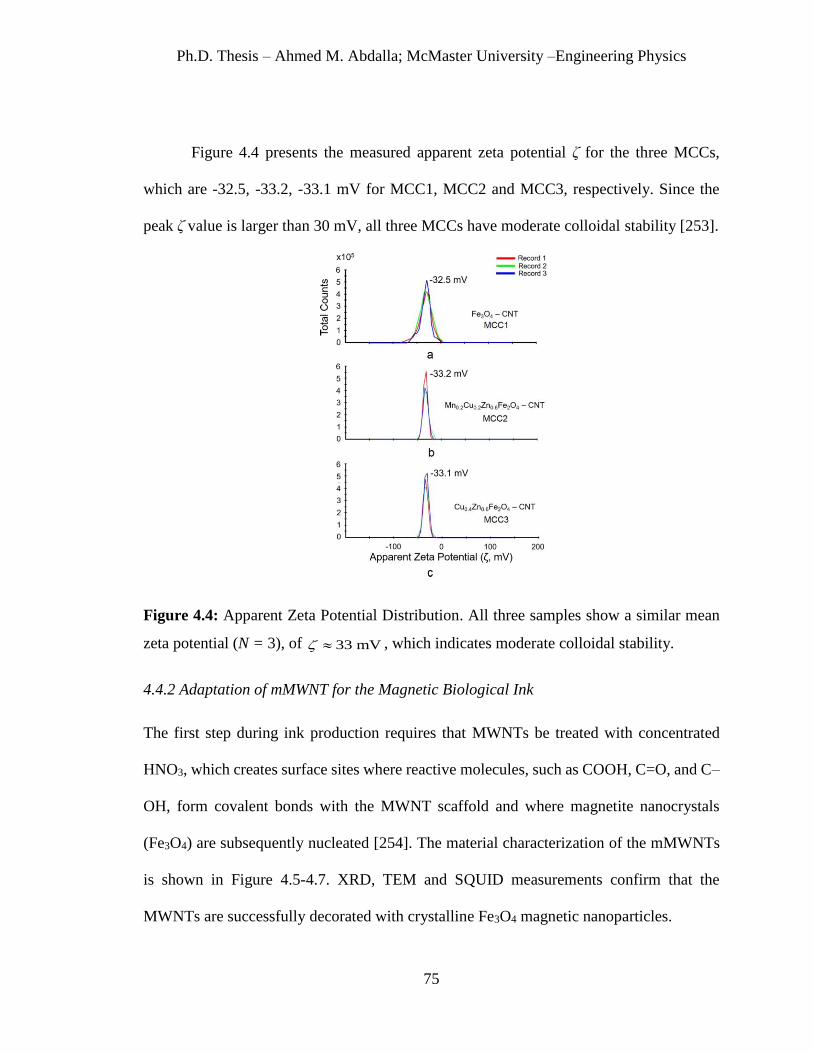
Ph.D. Thesis – Ahmed M. Abdalla; McMaster University –Engineering Physics
75
Figure 4.4 presents the measured apparent zeta potential ζ for the three MCCs,
which are -32.5, -33.2, -33.1 mV for MCC1, MCC2 and MCC3, respectively. Since the
peak ζ value is larger than 30 mV, all three MCCs have moderate colloidal stability [253].
Figure 4.4: Apparent Zeta Potential Distribution. All three samples show a similar mean
zeta potential (N = 3), of 33 mV , which indicates moderate colloidal stability.
4.4.2 Adaptation of mMWNT for the Magnetic Biological Ink
The first step during ink production requires that MWNTs be treated with concentrated
HNO3, which creates surface sites where reactive molecules, such as COOH, C=O, and C–
OH, form covalent bonds with the MWNT scaffold and where magnetite nanocrystals
(Fe3O4) are subsequently nucleated [254]. The material characterization of the mMWNTs
is shown in Figure 4.5-4.7. XRD, TEM and SQUID measurements confirm that the
MWNTs are successfully decorated with crystalline Fe3O4 magnetic nanoparticles.
Ph.D. Thesis – Ahmed M. Abdalla; McMaster University –Engineering Physics
76
XRD analysis of dried mMWNTs was conducted for the three Fe3O4: MWNT
weight ratios γ = 0.1, 0.2, and 0.4. Figure 4.5 shows that all samples consisted only of the
intended magnetite and carbon phases. The powder diffraction file (PDF) database,
available through the Eva software, qualitatively confirmed that all three samples contain
hexagonal carbon (CNTs, PDF No. 00-058-1638) and the spinel magnetite phase (Fe3O4,
PDF No. 01-071-6336). The average size of the Fe3O4 nano-crystals was calculated through
the Scherrer equation (3.3) applied at the highest diffraction peak (311). For all three
samples, the MNP sizes lie in a narrow 8.6–10.3 nm range. Using Bragg’s Law [18],
calculations of the average lattice parameters of Fe3O4 are 8.403, 8.396 and 8.404 Å for γ
= 0.1, 0.2, and 0.4. These values agree with those for magnetite (8.394 Å, JCPDS No. 79-
0417; and 8.400 Å, COD card No. 1011084). For all three cases, TEM images at various
magnifications in Figure 4.6 show that the MWNT surfaces are decorated with MNPs that
have high crystallinity and a narrow crystallite size distribution around ~10 nm. Increasing
γ improves the decoration density.
Because of their small sizes, the magnetite nanoparticles are superparamagnetic
[92] with a high saturation magnetization. Conjugating the MNPs with the diamagnetic
MWNTs retains this superparamagnetic behavior, which is evident in Figure 4.7 since the
measured hysteresis loops for all of the cases indicate that there is no remanence or coercive
field. The magnetic saturations Ms = 3.03, 7.79, 15.09 emu/g for γ = 0.1, 0.2 and 0.4. A
higher Ms value translates into a stronger magnetic response for the conjugate material,
which assists magnetic printing, producing a denser and more electrically continuous
biosensor strip. Being superparamagnetic, dipole-dipole interactions in the conjugate

Ph.D. Thesis – Ahmed M. Abdalla; McMaster University –Engineering Physics
77
material are limited in the absence of a magnetic field, for instance during storage, which
reduces nanoparticle aggregation, allowing repeatable sensor printing.
Figure 4.5: X-Ray Diffraction Analysis of mMWNTs. The XRD (Co Kα, λ=1.79 Å)
patterns for magnetite:MWNTs weight ratios 𝛾 = 0.1, 0.2, and 0.4 which confirm the
presence of a magnetite (Fe3O4) phase and a hexagonal carbon phase from the carbon
nanotubes.
Figure 4.6: TEM images of mMWNT samples at various magnetization weight ratios γ =
0.1 to 0.4 (from top to bottom) confirm that all samples have been successfully decorated
with crystalline MNPs synthesized within a narrow size distribution around ~10 nm.

Ph.D. Thesis – Ahmed M. Abdalla; McMaster University –Engineering Physics
78
Figure 4.6: Magnetic Characterization. Magnetic hysteresis curves show that all mMWNT
samples exhibit superparamagnetic behavior, but have different saturation values Ms
depending on their magnetite content (γ). The greater this content, the stronger is the
material response to a magnetic field.
4.4.3 Visualization of Ab Immobilization onto MWNT Surface
The MWNT surfaces are functionalized with anti-c-Myc Abs through two pathways. The
relatively low MNP yield allows some active carboxylic groups to remain post
magnetization. Hence, subsequent addition of anti-c-Myc allows the Ab to become
covalently bonded even without intermediate reagents [244] through a condensation
reaction between the Ab amine groups and the remaining carboxylic groups on the
mMWNT surfaces [226, 227, 229, 255-257]. Alternately, Abs can also be physically
adsorbed on this surface but, as we explain later, Ab-Ag binding kinetics cannot be
determined using the biosensor in this case. The final ink preparation step involves
dispersing the mMWNT-Ab hybrid nanoparticles in an aqueous solution of Tween 20

Ph.D. Thesis – Ahmed M. Abdalla; McMaster University –Engineering Physics
79
(polysorbate 20), which acts as a blocking agent, coats the MWNT surface, and prevents
non-specific Ag-Ab binding.
The binding of Ab molecules to MWNTs is visualized through fluorescent
microscopy. Secondary Ab, fluorescein isothiocyanate (FITC)-conjugated Donkey anti-
Mouse IgG H&L, is used to create a fluorescent ink, for which the Ab:MWNT weight ratio
𝛽 = 2.5×10⁻⁴. The fluorescence intensity is invariant to the Fe3O4:MWNT weight ratio 𝛾 in
the range 0.1-0.4, as shown Figure 4.8a–c, i.e., the magnetization of MWNTs has a
negligible impact on Ab immobilization on the nanotube surfaces. Hence, MWNTs
magnetized with 𝛾 = 0.4, which exhibit robust magnetic response, are used to fabricate the
biosensor strip.
The fluorescence images for MWNT samples with covalently bonded Abs in Figure
4.8a–c are virtually indistinguishable from the image in Figure 4.8d, which reveals Abs that
are adsorbed onto as-manufactured nanotube surfaces that do not contain functional groups.
Thus, for the particular Ab:MWNT weight ratio used, there appears to be no difference in
Ab immobilization on nanotube surfaces corresponding to (1) mMWNTs, or (2) as
manufactured MWNTs that have no surface functional groups at acid-induced defect sites.
There is no fluorescence in the absence of Ab conjugation, i.e., when 𝛽 = 0, see Figure
4.8e, confirming that the fluorescence sources in Figure 4.8a–d are due to FITC-labeled
Abs only.

Ph.D. Thesis – Ahmed M. Abdalla; McMaster University –Engineering Physics
80
Figure 4.8: Visualization of Ab immobilization on the surface of mMWNTs. First, FITC-
labeled fluorescent Abs are employed to confirm Ab immobilization on the surface of
mMWNTs for an Ab: MWNT weight ratio 𝛽 = 2.5×10⁻⁴ in an ink where Abs are covalently
bonded with mMWNTs that have Fe3O4: MWNT weight ratios (a) 𝛾 = 0.1, (b) 𝛾 = 0.2 and
(c) 𝛾 = 0.4, and (d) for an ink that contains adsorbed Abs on mMWNTs with 𝛾 = 0.4. For
(e) 𝛽 = 0, 𝛾 = 0.4, no fluorescence is observed from MWNTs and Fe3O4, confirming that
the fluorescence observed in (a)-(d) originates from FITC-labeled Abs only. No visual

Ph.D. Thesis – Ahmed M. Abdalla; McMaster University –Engineering Physics
81
differences in fluorescence are detected for samples containing different weight ratios of
magnetite, and those containing adsorbed and covalently bonded immobilized Abs. (f)
STEM and EELS micrographs reveal the presence of elemental carbon (C), oxygen (O)
and nitrogen (N). The nitrogen, which is present only in Anti-c-Myc Abs, confirms Ab
immobilization on the conductive MWNT network.
Since anti-c-Myc Ab is non-fluorescent, an electron energy loss spectrum (EELS)
is performed to identify Abs on the mMWNT surfaces. Figure 4.8f depicts a scanning
transmission electron microscopy (STEM) micrograph and the corresponding EELS
spectrum for the ink. The spectrum highlights locations where elemental C, O and N are
present. Since N originates solely from the Abs and no other ink component, its map reveals
anti-c-Myc locations. The micrograph uncovers a general structure that consists of a
MWNT-Fe3O4-Ab network, where the MWNT mesh produces the electrical path and the
Abs are Ag receptor sites.
4.4.3 Fabrication of the Bio-sensor
The device is fabricated as shown in Figure 4.9a. A 10 μL volume of the magnetic
biological ink is deposited with a micropipette over a 7 mm length on a glass coverslip
directly above one of the magnet edges, which concentrates the magnetic field locally,
which dynamically self organizes the magnetized and Ab-functionalized MWNTs into a
dense electrically conducting strip. After it is printed, each sensor is dried for 20 minutes
at room temperature in the presence of the magnetic field, which maintains the integrity of
the mMWNT-Ab conjugate. When the dispersing medium (DI Water) has evaporated, dried
printed sensor strips of ~7 mm length and ~1.5 mm width remain on the coverslip, held in

Ph.D. Thesis – Ahmed M. Abdalla; McMaster University –Engineering Physics
82
place by Van der Waals and electrostatic forces. Despite visual observations of cracks,
strips at different times exhibit identical sensing responses to various samples.
Figure 4.9: Printing technique and sensor assembly. (a) 10 μL of the magnetic bioink is
deposited on top of a glass coverslip that is placed on a permanent magnet. The applied
magnetic field concentrates and self organizes the functionalized mMWNTs on the
substrate. After the supernatant in the ink is evaporated, a patterned strip of densely packed
Ab-functionalized MWNTs remains deposited on the substrate, which forms the sensor.
Ph.D. Thesis – Ahmed M. Abdalla; McMaster University –Engineering Physics
83
The STEM micrograph identifies MNPs and anti-c-Myc that constitute the print based on
the magnetic bioink. Electrodes are readily connected to either end of the strip, providing
current to the sensor. (b) A voltage divider with a reference resistor Rref = 100 kΩ monitors
current changes that measure the biosensor responses to the various samples that are
deposited on it.
Typically, each sensor consists of ~100 μg of MWNTs, ~40 μg of Fe3O4 and ~25
ng of anti-c-Myc Ab, i.e., the material usage per sensor is small. Hence, the material cost
of a printed sensor is lower than 20 cents (Canadian). The sensor is integrated with
electrodes using a polydimethylsiloxane (PDMS) support and alligator clips that connect
the strip to an electrical circuit. With a reference resistance Rref, an external circuit is used
to measure real-time current changes when samples are deposited on the biosensor, see
Figure 4.9b.
4.4.4 Sensing Measurements
Two types of tests are performed. (1) A sample is deposited once on the surface of the
printed biosensor strip, and (2) equal amounts of the sample are deposited repeatedly after
specific intervals on the sensor surface. Three tests are performed with every sample, each
with a newly printed biosensor. Figure 4.10a presents temporal responses when 2 μL of (1)
purified c-Myc with 40, 20, and 10 pM concentrations, (2) DI water, and (3) 40 pM
concentration of bovine serum albumin (BSA) are placed on the biosensor. The BSA is a
nonspecific Ag towards anti-c-Myc Ab and is therefore a negative control.
Figure 4.10a shows that after sample deposition at time t = 2s on an initially dry
biosensor, the current is decreases rapidly from its initial value ib ≈ 47 μA before reaching

Ph.D. Thesis – Ahmed M. Abdalla; McMaster University –Engineering Physics
84
steady state. Both DI water and BSA samples induce similar decreases in the biosensor
current. In contrast, is does not level off as quickly when c-Myc is deposited on the strip,
but continues to decrease below the steady values reached for DI water and BSA. The
biosensor responds differently to c-Myc sample deposition due to the Ag-Ab binding
kinetics since the interaction of anti-c-Myc Ab with the specific c-Myc Ag increases the
electrical resistance of the sensor, which in turn decreases is [258, 259]. Nonspecific
interactions of anti-c-Myc with DI water and BSA do not decrease is as significantly below
its initial value. The relatively slow Ag-Ab binding kinetics induce the gradual current
reduction.
The biosensor responses shown in Figure 4.10a underscore the specificity with
which the ink detects c-Myc. Increasing the Ag concentration enhances Ab binding and
thus, the electrical resistance of the sensor strip, which leads to a larger current reduction
and steeper temporal current gradients dis/dt, as shown in Figure 4.10a. The values of is at
t = 60 s for the 40, 20, and 10 pM c-Myc concentrations are 34.6±0.5, 38.8±0.4, and
40.9±0.1 μA, respectively, confirming that current reduction scales with increasing Ab
concentration.
During 30 < t < 60 s, the gradient dis/dt is constant, which also correlates with the
c-Myc concentration. Figure 4.10b presents the ratio is,a/is,a,30s, where is,a is the temporal
current at time t averaged over three repetitive tests for a sample and is,a,30s = is,a at t = 30 s.
Figure 4.10c reveals linear correlations between the current gradients obtained from Figure
4.10b and the c-Myc concentrations. These correlations are in agreement with reported
responses for CNT-based biosensors [226, 243, 244]. By simply monitoring the sensor’s

Ph.D. Thesis – Ahmed M. Abdalla; McMaster University –Engineering Physics
85
transient electrical response, it is possible to rapidly identify c-Myc positive samples with
different concentrations. This makes Ag monitoring feasible without using additional
reagents and sophisticated electrical equipment that is typical of other biosensors [244].
Acid treatment of MWNTs provides functional groups at defect sites on the
nanotube surfaces, which promote the covalent immobilization of Abs. During sample
deposition, Ag-Ab interactions at defect sites, where Abs are now immobilized, restrict
current transport over time significantly, amplifying Ag detection [258, 259]. Hence, when
anti-c-Myc Abs are not covalently bonded to a MWNT but are instead physically adsorbed,
we have determined that the Ab-Ag binding kinetics cannot be measured with the
biosensor.
The response of the biosensor to successive 1 μL sample depositions is presented
in Figure 4.10d for three types of biosensor strips that are printed with three different inks.
These inks contain (i) covalently mMWNTs that have not yet been functionalized with Abs
(ink 1), or (ii) MWNTs that have both Fe3O4 nanoparticles and anti-c-Myc Abs adsorbed
on their surfaces (ink 2), and (iii) MWNTs that are covalently magnetized with Fe3O4
nanoparticles and contain both covalently bonded and adsorbed anti-c-Myc Abs on their
surfaces (ink 3). The functionalized MWNTs for all three inks are dispersed in DI water
containing 0.1% Tween 20.

Ph.D. Thesis – Ahmed M. Abdalla; McMaster University –Engineering Physics
86
Figure 4.10: Biosensor transient response. (a) Immediately after 2 μL samples are
deposited on the sensor strip, the DI water and BSA samples induce a rapid decrease in
electrical current, which subsequently levels out. In contrast, since the sensor is inherently

Ph.D. Thesis – Ahmed M. Abdalla; McMaster University –Engineering Physics
87
sensitive to c-Myc Ag interactions due to the anti-c-Myc Abs that are covalently bonded to
the surfaces of MWNTs, the current for all c-Myc samples decreases to levels below those
measured for DI water and BSA deposition, which offers proof of targeted detection and
sensor specificity to c-Myc Ags. The higher the c-Myc concentration in a sample, the larger
the current decrease it induces. All of the deposited c-Myc samples produce a steady current
decrease during the period 30 s < t < 60 s. Normalizing the average current over that
duration leads to the quasi-linear response shown in (b). There is a linear correlation in (c)
between the normalized current gradients in (b) and the corresponding c-Myc
concentrations. Biosensor response to successive 1 μL sample additions. (d) Acting as a
control, magnetized MWNTs that are not functionalized with Abs (i) cannot distinguish
between 40 pM BSA and c-Myc samples, black dashed and solid curves respectively. When
anti-c-Myc is immobilized on the MWNT surfaces through adsorption, again (ii) there is
insufficient discrimination between these two samples. In contrast, a sensor fabricated
using an ink in which anti-cMyc is attached to the MWNT surfaces through acid
functionalization, (iii) clearly distinguishes between the two negative control samples, DI
water and BSA, and the Ag of interest, c-Myc.
Biosensors printed with inks 1 and 2 do not discriminate between 40 pM c-Myc Ag
and 40 pM BSA, i.e., they produce similar responses for these two samples and it is not
possible to positively detect c-Myc by printing biosensor strips with these two inks.
Differences between specific (c-Myc) and non-specific (BSA) samples are apparent only
with biosensors that are printed with ink 3. With ink 3, the 40 pM c-Myc sample produces
the largest current reduction, followed by the 20 pM and 10 pM c-Myc samples. When a 5
μL sample containing c-Myc Ags is deposited on the biosensor in 1 μL increments, the
successive sample additions continue to increase the electrical resistance and decrease the
sensor current.
Ph.D. Thesis – Ahmed M. Abdalla; McMaster University –Engineering Physics
88
4.5 Conclusion
MWNTs were decorated by in situ co-precipitation with different magnetic nanoparticles
(MNPs). These magnetized MWNTs (mMWNTs) were successfully suspended to create
novel and hitherto unreported magnetoresponsive conductive colloids (MCCs) that have
moderate colloidal stability. The MCC synthesis merges processes used to produce
ferrofluids and mMWNTs, which is another novelty. Three magnetoresponsive conductive
colloids were successfully prepared using these three types of the MNPs (γ =1). All colloids
have moderate suspension stability since their mean zeta potential ζ ≈ -33 mV. Their
electric conductivities of 150-170 mS.cm-1 are much higher than the conductivity of the
deionized water dispersing medium that is a poor conductor. The chemical composition of
the MNPs that decorate an mMWNT influences the electric conductivity of their MCC. For
instance, increasing the copper content in an MNP improves the MCC electric conductivity.
In summary, we have provided a novel methodology to produce stable magnetoresponsive
conductive colloidal suspensions with tunable magnetic and electrical properties. These
colloidal suspensions are a promising new class of material that could be used for
applications where a magnetic response, or action from a distance, must be coupled with a
viable material electrical conductivity.
By the adaptation of MCC’s synthesis, a biological magnetic ink is synthesized that
contains Abs immobilized on the surfaces of mMWNTs that are dispersed in DI water
containing Tween 20 as bio-compatible surfactant. Ink synthesis is straightforward and
does not involve complex chemistry or use of intermediate reagents. An applied magnetic
field dynamically self organizes the magnetized and functionalized CNTs, printing them

Ph.D. Thesis – Ahmed M. Abdalla; McMaster University –Engineering Physics
89
into an electrically responsive strip that serves as a biosensor to detect specific Ags. Unlike
previous methods, a magnet is not required during sensing, facilitating simple integration
of the sensor into an electric circuit. The sensor detects picomolar c-Myc concentrations
within a minute and distinguishes between c-Myc and BSA samples of different
concentrations through decreases in the sensor current. These decreases, which occur due
to real-time specific Ab-Ag binding kinetics, are larger at higher Ag concentrations. The
detection technique is simpler, inexpensive and rapid as compared to typical cyclic
voltammorgam analysis. Once the ink is synthesized, the time required to create a prototype
sensor is less than 5 minutes, excluding ink drying time. Semi-quantitative Ag detection
with picomolar sensitivity occurs within a minute after a sample is deposited on the
biosensor. This proof of concept ink and sensor can be tailored to detect different Ags.

Ph.D. Thesis – Ahmed M. Abdalla; McMaster University –Engineering Physics
90
5. Magnetizing of MWNT via Non-covalent Functionalization (Ni-
MWNT Hybrid Nanomaterials)
5.1 Introduction
In this chapter, an experimental investigations will be presented to highlight the
magnetizing of the MWNT via non-covalent functionalization. We describe a
nondestructive method to magnetize MWNTs and provide a means to remotely manipulate
them through the electroless deposition of magnetic nickel nanoparticles on their surfaces.
This nickel-MWNT hybrid nanomaterial was used to fabricate Ni-MWNT macrostructures
and tune their morphologies by changing the direction of an applied magnetic field. These
structures could find use in nano- and microscale filtration, as well as for printing electric
circuits. Further, leveraging the hydrophilic Ni-MWNT outer surface, a water-based
conductive ink was created and used to print a conductive paths with low electrical
resistivity, illustrating the potential of this material for printing electronic circuits.
This chapter is reprinted from Material Research Express, Fabrication of Nanoscale
to Macroscale Nickel-Multiwall Carbon Nanotube Hybrid Materials with Tunable
Material Properties, 3, Ahmed M Abdalla, Tahereh Majdi, Suvojit Ghosh, and Ishwar K
Puri, Copyright 2017, with permissions from IOP. The author of this thesis is the first
author and main contributor of the above mentioned publication and has conducted all the
experiments. The chapter will provide a literature review which is discussed in the
background information section, followed by excerpts from the above mentioned paper.

Ph.D. Thesis – Ahmed M. Abdalla; McMaster University –Engineering Physics
91
5.2 Background Information
As uniaxial materials [99], carbon nanotubes (CNTs) must be axially aligned to fully
exploit their superior electrical and mechanical properties [18, 100]. Magnetized CNTs can
be manipulated and aligned using a remotely applied magnetic field [95, 96]. Coating CNTs
with a magnetic metal also improves their oxidation resistance [99], electrical conductivity
[139], adhesion to polymers [97], and ability to assume mechanical loads [260].
Like many other substrates, carbon nanotubes can also be coated with metals
through electroless plating, a nondestructive, straightforward, and rapid method which can
be performed under ambient conditions [97]. Electroless plating is applicable to any
conductive or nonconductive substrate regardless of its size and shape [140]. Plating
produces a coating layer of uniform thickness regardless of variations in the substrate
thickness [261]. The resulting metal-CNT hybrid nanomaterial has relatively high surface
area, electrical conductivity, tensile strength [141], and superior hardness, wear resistance
and magnetic properties [97]. Such nanomaterials are used in sensors, electronic devices,
catalytic and electrochemical technologies [141], and reinforced composites [260]. Nickel
is a common ferromagnetic plating material. Electroless Ni deposition occurs through the
in situ reduction of the metal from an ionic solution and leverages Van der Waals forces to
form weak noncovalent bonds between the outer surface of the CNT and its surrounding
metallic nanolayer [62].
An electroless process for plating multiwall carbon nanotubes (MWNTs) with
nickel nanocrystals is schematically described in Figure 5.1 where nickel chloride is used

Ph.D. Thesis – Ahmed M. Abdalla; McMaster University –Engineering Physics
92
as the metal ion source [146]. A reducing agent, sodium hypophosphite, provides electrons
that reduce nickel ions (Ni2+) into metallic nickel (Ni) using a catalyst [147]. To constrain
the reaction on their surfaces, the MWNTs must be pre-treated with a catalyst prior to
depositing Ni on their surfaces. The deposit forms a continuous Ni layer that encapsulates
the MWNTs and is attached to their walls [149].
Figure 5.1: CNTs magnetized with Ni by Electroless Deposition. (a) MWNTs were
catalyzed through two chemical treatment steps using acid solutions of SnCl2 for
sensitization and PdCl2 for activation. Electroless deposition of Ni on the resulting activated
MWNTs (aMWNTs) used a plating solution containing a nickel salt and a reducing agent,
where nickel ions accept electrons from the reducing agent to form metallic nickel through
metal reduction.
The catalysis consists of sensitizing and activating steps. Tin ions (Sn2+) are used to
sensitize MWNTs and palladium ions (Pd2+) for activation [99, 178]. The Sn2+ and Pd2+
ions are dissolved in a dilute HCl solution, and catalysis is accelerated through sonication
[147, 262]. The Sn2+ adsorbs on the MWNT surface during its sensitization and reduces
Pd2+ to Pd during the subsequent activation step [178], i.e.,
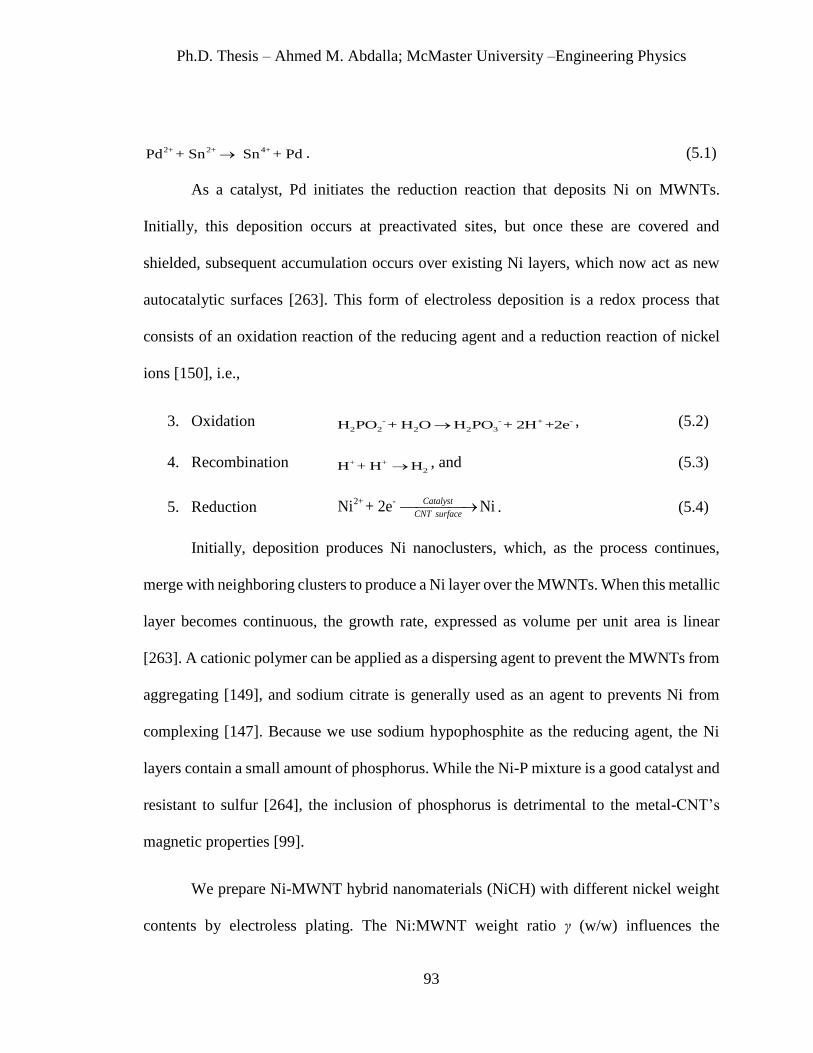
Ph.D. Thesis – Ahmed M. Abdalla; McMaster University –Engineering Physics
93
2+ 2+ 4+Pd + Sn Sn + Pd . (5.1)
As a catalyst, Pd initiates the reduction reaction that deposits Ni on MWNTs.
Initially, this deposition occurs at preactivated sites, but once these are covered and
shielded, subsequent accumulation occurs over existing Ni layers, which now act as new
autocatalytic surfaces [263]. This form of electroless deposition is a redox process that
consists of an oxidation reaction of the reducing agent and a reduction reaction of nickel
ions [150], i.e.,
3. Oxidation - + -
2 2 2 2
-
3H PO + H O H PO + 2H +2e , (5.2)
4. Recombination + +
2H + H H , and (5.3)
5. Reduction 2+ -
Ni + 2e Ni
Catalyst
CNT surface . (5.4)
Initially, deposition produces Ni nanoclusters, which, as the process continues,
merge with neighboring clusters to produce a Ni layer over the MWNTs. When this metallic
layer becomes continuous, the growth rate, expressed as volume per unit area is linear
[263]. A cationic polymer can be applied as a dispersing agent to prevent the MWNTs from
aggregating [149], and sodium citrate is generally used as an agent to prevents Ni from
complexing [147]. Because we use sodium hypophosphite as the reducing agent, the Ni
layers contain a small amount of phosphorus. While the Ni-P mixture is a good catalyst and
resistant to sulfur [264], the inclusion of phosphorus is detrimental to the metal-CNT’s
magnetic properties [99].
We prepare Ni-MWNT hybrid nanomaterials (NiCH) with different nickel weight
contents by electroless plating. The Ni:MWNT weight ratio γ (w/w) influences the

Ph.D. Thesis – Ahmed M. Abdalla; McMaster University –Engineering Physics
94
morphology, thickness, and continuity of the Ni layers deposited on the MWNT, as well as
the mechanical and magnetic properties of the NiCH that is produced. Plating a MWNT
with the electrically conducting metallic layer decreases its contact resistance since the
continuous Ni layer behaves as a conducting bridge connecting adjacent CNTs for γ ≥ 7. A
micro-composite structure is formed for γ = 14 and 30. The deposited Ni acts as a matrix,
and the MWNTs are the reinforcing filler material. The as-prepared NiCH could have
applications as a mesoporous material [141] although our future interest is to incorporate it
into polymeric materials to produce composites with enhanced electrical and thermal
conductivities, and electromagnetic interference shielding [146]. The magnetically
susceptible nanostructures were fabricated into macroscale Ni-MWNT composites, where
their structures were tuned by changing the direction of the magnetic field. The hydrophilic
Ni surface improves the dispersion of the MWNTs in de-ionized water, which allowed us
to create a conductive ink that rapidly prints an electrical circuit. Other applications of the
material include nano- and microscale filtration, energy storage, and composite
nanomaterials [265-268].
5.3 Methodology
5.3.1 Materials and Reagents
We used MWNTs produced by chemical vapour deposition (US Research Nanomaterials
Inc.) with purity > 95%, outer diameter of 20-30 nm, inner diameter of 5-10 nm, and length
between 0.5-2.0 µm as specified by the manufacturer. The other reagents used were nickel
(II) chloride (NiCl2, 98%, Alfa Aesar), nickel (II) sulfate hexahydrate (NiSO4·6H2O, 99%,
Sigma-Aldrich), sodium hydroxide (NaOH, 97%, Caledon Laboratory Chemicals),

Ph.D. Thesis – Ahmed M. Abdalla; McMaster University –Engineering Physics
95
hydrochloric acid (HCl, 36.5-38%, Caledon), stannous chloride dihydrate (SnCl2·2H2O,
98%, Caledon), ammonium chloride (NH4Cl, ACS grade, BDH/VWR International),
sodium citrate dihydrate (Na3C6H5O7·2H2O, 99%, EMD chemicals Inc.), sodium
hypophosphite monohydrate (NaH2PO2·H2O, lab grade, Anachemia Canada Co.), and
palladium (II) chloride (PdCl2, 100%, Artcraft chemicals Inc.). All reagents were used as
received without further purification.
5.3.2 Catalyzing Carbon Nanotubes
The MWNTs were catalyzed through two steps [97, 141, 147, 263]. First, sensitized
MWNTs were produced with 100 ml of stannous chloride solution consisting of 2g SnCl2,
10ml HCl and 90ml deionized (DI) H2O per each g of MWNTs. The sensitisation proceeded
under sonication with a probe sonicator (Qsonica, LLC, Model: Q500 with 1/4ʺ micro-tip
at 35% power) for 30 min. The sample was then filtered, washed with DI water, and finally
dried in a vacuum oven at 70 °C for one hr. Next, each gram of sensitized MWNTs was
activated with 100 ml of palladium chloride solution consisting of 0.03g PdCl2, 2ml HCl
and 98ml DI water. Again, activation proceeded with identical sonication. The sample was
finally filtered, washed with DI water, and dried as before.
5.3.3 Synthesis of NiCH Nanostructures
Electroless plating of activated MWNTs proceeded by depositing nickel nanocrystals under
stoichiometric conditions for the chemical reduction process designed to obtain γ = 1 (w/w)
for Ni-plated CNTs (Ni: MWNTs) [147, 149, 262]. A gram of activated MWNTs was

Ph.D. Thesis – Ahmed M. Abdalla; McMaster University –Engineering Physics
96
dispersed in 100 ml of DI water and sonicated with the probe sonicator (using the 1/4ʺ
micro-tip at 35% power) for 20 min. Next, the plating solution (1.7g NiCl2, 1.1g
NiSO4·6H2O, 5.5g NH4Cl, 4g Na3C6H5O7·2H2O, 5g NaH2PO2·H2O and 100 ml DI water)
was added, and the sonication continued for 60 mins. Sodium hydroxide solution (2N) was
introduced during the sonication process to maintain a pH ≈ 9 during the plating process.
After plating for 60 min, the sample was quickly filtered, washed with DI water, and dried
in an oven at 200 °C for two hr. Employing the electroless plating process described above,
stoichiometric calculations for samples SN1, SN2, and SN3 were implemented to
respectively obtain γ = 1, 7, and 14 to explore the influence of γ.
5.3.4 Fabrication of NiCH Macrostructures
NiCH nanostructures with γ = 1 were dispersed in DI water using a probe sonicator. A
strong magnetic field was applied to force their settling and alignment into two compact
configurations, vertically (DM1) and horizontally (DM2), as shown in Figure 5.5. These
configurations led to differently oriented Ni-MWNT macrostructures. Next, the plating
solution was prepared as described in section 5.3.3 for a stoichiometric calculation for γ =
30. Finally, the plating solution was slowly poured onto either aligned configuration under
an applied magnetic field with no sonication applied while the pH was adjusted to 9
Electroless deposition was stopped after 60 min.
Ph.D. Thesis – Ahmed M. Abdalla; McMaster University –Engineering Physics
97
5.3.5 Ni-MWNT Water Based Conductive Inks
MWNTs are hydrophobic while nickel is hydrophilic. Hence, the Ni coating provides new
functionality for the MWNTs by facilitating their compatibility with polar media [20]. This
allowed us to prepare water-based conductive Ni-MWNT inks for rapid printing of
electrical circuits (Figure 5.8a).
The preparation process is simple and rapid. A synthetized Ni-MWNT (γ=7) sample
was dispersed in DI water using a probe sonicator. Different inks with varying volume
contents of Ni-MWNT (γ=7) (i.e. 1, 2, 4, and 8 vol%) were prepared by dispersing the
equivalent weight into the intended volume of water (where the material density was
approximated as 8.05 g cm-3). During printing, the inks were poured into a plastic mould
(acrylonitrile butadiene styrene) with dimensions of 1 mm×1 mm×10 mm with and without
the assistance of a magnet. The printed lines were dried over a hot plate at 60 °C. An
MWNT-based ink was prepared with a volume content of 2% to compare with the Ni-
MWNT-based inks.
5.3.6 Characterization Methods
X-Ray Diffraction (XRD) analysis of NiCH powder samples was performed using a Bruker
D8 Discover instrument comprising a DavinciTM diffractometer operating at 35 kV and 45
mA using Co-Kα radiation (λavg = 1.79026 Å). Bruker’s DIFFRAC.Eva V3.1 software was
employed for qualitative analysis of the constituent phases. Scanning transmission and
transmission electron microscopy (dark field STEM/TEM) and energy dispersive X-ray

Ph.D. Thesis – Ahmed M. Abdalla; McMaster University –Engineering Physics
98
(EDX) spectroscopy were conducted with a JEOL 2010F field emission microscope. For
STEM/TEM, the samples were suspended in ethanol, dropped onto a TEM copper grid,
then wicked off with a Kimwipe. Scanning electron microscopy (SEM) was conducted with
a JEOL 7000F microscope equipped with a Schottky Field Emission Gun (FEG) filament.
For SEM, the samples were suspended in ethanol and dripped onto a carbon tape on an
aluminum stub. Magnetization measurements were performed using superconducting
quantum interference device (SQUID) magnetometry (Quantum Design Inc.) at room
temperature. Atomic Force Microscopy (AFM Bruker, Multimode 8 with ScanAsyst,
NanoScope 9.1 software) was used to determine the elastic modulus. The AFM tip (TAP
525 A) with measured tip radius and deflection sensitivity of 10 nm and 121.3 nm/V (using
the built-in Ramp mode), was calibrated with a reference material (Sapphire−12M, Bruker
test sample kit) that had a known elastic modulus of 350 GPa. The natural frequency fo and
the spring constant k of the tip were calculated from the thermal tuning data to be 520 Hz,
and 192.3 N/m, values which are in good agreement with standard values of 525 Hz and
200 N/m provided by the manufacturer. All measurements were performed using
NanoScope Analysis 1.5 software. The samples were suspended in ethanol using a probe
sonicator, dropped onto a stainless steel disc, and dried in vacuum oven.
5.4 Results and Discussion
5.4.1 Material Phases
The XRD analysis presented in Figure 5.2a shows that all NiCH samples contain the
anticipated material phases and are devoid of other phases. All three samples contain

Ph.D. Thesis – Ahmed M. Abdalla; McMaster University –Engineering Physics
99
crystalline nickel (Ni, PDF No. 00-004-0850) and hexagonal carbon (C6, PDF No. 00-058-
1638). Due to its relatively low content, the diffraction peaks of phosphorous (P, PDF No.
01-075-0577) could not be distinguished from noise. We found no evidence of the Ni/P
alloy Ni3P, which is reasonable since the samples were treated at a relatively low
temperature of 200°C. The analysis confirmed the existence of Cassiterite (SnO2, PDF No.
00-041-1445) in the samples, which likely formed due to the oxidation of Sn2+ to Sn4+
during the reduction of Pd2+ to Pd. Since a small quantity of PdCl2 was used during the
activation process, the Pd contained in the samples is lower than the instrument detection
threshold.
The EDX/TEM results presented in Figure 5.2b confirm the existence of elemental
C, Ni, P, Cu, Sn, and O. The copper arises from the TEM grid and Sn is detected in all three
samples with a relatively small contribution. These results identify phosphorus as a
byproduct in the Ni layer. Figure 5.2c presents EDX/ dark field STEM line-scanning
results for the NiCH samples, which provide evidence of a uniform Ni coating around the
MWNTs and the wavy features. The elemental composition is again confirmed to include
carbon and nickel. As expected, the C:Ni ratio of these two elements decreases as γ
increases.

Ph.D. Thesis – Ahmed M. Abdalla; McMaster University –Engineering Physics
100
Figure 5.2: Phases analysis of the Ni-CNT (NiCH) hybrid nanomaterials. (a) The XRD
(Co Kα) patterns for samples SN1, SN2 and SN3 show that a nanocrystalline nickel phase
formed on the MWNT surfaces. Oxidation of Sn2+ to Sn4+ was inferred since no foreign
phases were detected. There is also no evidence for the formation of a crystalline Ni3P
phase. Symbol sizes are varied to improve illustration. (b) The EDX analysis for SN1-SN3

Ph.D. Thesis – Ahmed M. Abdalla; McMaster University –Engineering Physics
101
shows a small phosphorous content as the reaction byproduct. (c) EDX/Dark Field STEM
Line Scanning. Nickel forms a wavy coating around MWNTs with slight variations in the
layer thickness and density. The measurements confirm the existence of MWNTs inside
the coating layer and Ni as the major component of the outer coating.
The weight ratios,
wt of Ni MWNT hybrid wt of aMWNT ,
wt of aMWNT
(5.5)
were calculated to be 1.1, 6.6, and 14.2 for SN1, SN2, and SN3, respectively, which vary
slightly from the intended ratios of 1, 7, and 14. This indicates that even after activated
MWNTs (aMWNTs) are fully coated with Ni, plating continues until all Ni in the source
material is consumed, implying that while the Pd catalyst initiates the reaction, the plating
becomes autocatalytic afterward.
Dark field STEM and TEM images at various magnifications (Figure 5.3) help
visualize the NiCH produced for different γ. All images provide evidence of complete Ni
coating on MWNTs and a certain coating thickness for a specific γ. Increasing γ increases
the average thickness of the Ni layer, which is 10-15, 40-60, and 100-150 nm for γ = 1, 7,
and 14, respectively. Increasing γ increases the Ni connections between plated MWNTs so
that the sparse MWNT network for γ = 1 is much denser at γ = 14 when microscale NiCH
structures are produced. In these latter microstructures, Ni is a conductive metallic matrix
that contains MWNTs as the reinforcing filler.
High-resolution TEM images confirm that the plated Ni layer is crystalline, and the
coating is in direct contact with the MWNT surfaces. SEM images of samples SN1 and
SN3 (Figure 5.4) indicate that micron-size MWNT networks become interconnected as the

Ph.D. Thesis – Ahmed M. Abdalla; McMaster University –Engineering Physics
102
nickel deposited on adjacent MWNTs merges. Thus, the conductive NiCH composite
contains nanostructures for γ = 1 which become bulk structures when γ = 14.
Figure 5.3: Dark field STEM/TEM images of samples SN1, SN2, and SN3 at different
magnifications visualize the NiCH hybrid nanomaterial prepared through electroless
plating for different weight ratios γ =1, 2, and 3. The average thickness of the Ni coating
layer increases from 10 to 150 nm when γ increases from 1 to 14 in the three samples. All
samples show continuous coating of Ni on the CNTs. Sample SN1 has a smaller Ni layer
thickness and higher coating layer porosity while the coatings for samples SN2 and SN3

Ph.D. Thesis – Ahmed M. Abdalla; McMaster University –Engineering Physics
103
have larger thickness and better layer continuity. The Ni connections between MWNTs are
more obvious for SN3, which is a microcomposite with Ni forming a conductive metallic
matrix around reinforcing MWNTs.
Figure 5.4: SEM images of samples SN1 and SN3 at two magnifications confirm the
deposition of nickel in the form of merged Ni nanolayers that cover the outer surfaces of
the MWNTs. Nickel links the MWNTs through conductive connections to produce micron-
size networks.
5.4.2 Elastic Modulus
Using an AFM, the average elastic modulus E was measured in the radial direction for the
pure MWNTs (S0) and for NiCH samples for γ =1 and 7 (SN1, and SN2 respectively).
These three measurements were performed under similar AFM calibration conditions so
that the resulting values are relative to the elastic modulus (E = 350 GPa) of the standard
sapphire sample. Figure 5.5 shows AFM measurements over 1 μm square lateral cross-
sections of S0 and SN1 and a 3 μm square lateral cross-section of SN2. Pure MWNTs have
average E (N=20) ~ 12.5 ± 2.0 GPa, while samples SN1, and SN2 have larger E (N=20) ~
18.3 ± 6.3, and 58.7 ± 22.1 GPa, respectively. This increase in the elastic modulus is
attributed to the increase in the nickel content (γ from 0 to 7) and thickness (from 0 to 60

Ph.D. Thesis – Ahmed M. Abdalla; McMaster University –Engineering Physics
104
nm). Increasing the Ni:MWNT weight ratio γ from 0 (S0), to 1 (SN1), and finally to 7
(SN2) significantly increases E, showing that γ provides control and tunability over the
NiCH elastic modulus.
Figure 5.5: AFM topographical and mechanical sketch up of samples S0, SN1 and SN2.
Pure MWNTs (S0) had an average elastic modulus E ~ 12.5 GPa while Ni-MWNT samples
for γ = 1, and 7 had values of E ~ 18.3 (46% increase) and 58.7 GPa (370% increase),
respectively. Increasing Ni:MWNT weight ratio γ enhances the measured modulus.
5.4.3 Magnetic Properties
Since pure MWNTs are diamagnetic [57, 58], those magnetized with ferromagnetic Ni are
expected to exhibit a saturation magnetization Ms intermediate between the two materials
[269], which is determined using SQUID magnetometry, as reported in Figure 5.6.
Ph.D. Thesis – Ahmed M. Abdalla; McMaster University –Engineering Physics
105
Magnetic nanoparticles typically exhibit superparamagnetic behavior when their sizes are
smaller than a critical dimension [92]. The hysteresis data of Figure 5.6 indicates that all
samples show small departures from superparamagnetic behavior, since they show a
remanence Mr < 1 emu/g and a coercive field Hc < 30 Oe. This is attributed to the Ni layer
thickness of 10-150 nm and length of 0.5-2 µm that are larger than the critical
superparamagnetic dimension which is a few nanometers for Ni [270].
Increasing γ increases the Ni coating layer thickness with the consequence that the
Ni grain size increases. Raising γ from 1 to 7 for samples SN1 and SN2, respectively,
increases Ms from 4.1 to 9.5 emu/g and Mr from 0.51 to 1.01 emu/g, while Hc remains
unchanged at 30 Oe. This improvement in magnetic properties, when is raised, is explained
through the associated increase in the average Ni layer thickness γ from 10 to 60 nm.
Although both dimensions are higher than the critical superparamagnetic dimension, they
lead to single magnetic domains. Further increase in γ to 14 for sample SN3 is accompanied
by an increase in the Ni layer average thickness to 100-150 nm. This larger Ni domain size
increases the magnetostatic energy, which decreases when the larger domain is divided into
several smaller domains. The division of the larger domain creates domain walls where
adjacent molecules have net magnetic moments with different directions. These multi-
magnetic domains have lower coercivity and remanence than does a single domain [87].
Therefore, the results show that the magnetic properties for SN3 are inferior to those for
SN2 since Ms decreases to 6.6 emu/g while Mr and Hc are almost zero. Another observation
supporting the formation of domain walls in SN3 is the presaturation region in the
magnetization curve, which is a region of reversible domain wall motion. The

Ph.D. Thesis – Ahmed M. Abdalla; McMaster University –Engineering Physics
106
magnetization curve of SN3 shows a higher curvature than for the other two samples. This
indicates that molecules are present at domain walls, which requires higher field strength
to align their magnetic moments and allow whole material saturation [87].
Figure 5.6: Magnetic Characterization. Magnetic hysteresis curves show that samples
SN1-SN3 deviate from superparamagnetic behavior at room temperature (Mr < 1 emu/g
and Hc < 30 Oe). For samples SN1 and SN2, γ increases from 1 to 7, but Hc remains constant
at 30 Oe while Ms and Mr increase from 4.1 and 0.51 emu/g to 9.5 and 1.01 emu/g. For
SN3, corresponding to γ = 14, single magnetic domains are transformed into multimagnetic
domains since the nickel coating thickness increases to 100-150 nm.
Therefore, changes in magnetic behavior are attributed to the magnetic domains
within the Ni coating. As the thickness of the coating increases from SN1 to SN2, the
domain size increases while the number of magnetic domains does not change so that
magnetization rises. However, the Ni thickness for SN3 is even larger. Consequently, more
magnetic domains are created, which deviate its behavior from superparamagnetism,
leading to a significant decline in their magnetization.

Ph.D. Thesis – Ahmed M. Abdalla; McMaster University –Engineering Physics
107
5.4.4 Tuning the NiCH Macrostructure Morphology
In the presence of an external magnetic field, NiCH (γ=1) nanostructures configure and
align along the magnetic field lines. Since further Ni growth can be initiated on the catalytic
surfaces of the MWNTs, the alignment of the nanoscale NiCH structures influences the
morphologies of the micro- and macroscale NiCH structures. Figure 5.7 shows Ni-MWNT
macrostructures fabricated with the magnetic field in the vertical (DM1) and horizontal
(DM2) directions. The DM1 macrostructure was porous while DM2 was denser and flatter.
Both Ni-MWNT macrostructures could be utilized in applications such as nano- and
microscale filtration (for DM1) and to print electric circuits (DM2) [265-267].
Figure 5.7: Fabrication of Nickel-MWNT Macrostructures. Nickel deposition on the
vertically aligned Ni-MWNT hybrid nanomaterial (SN1, γ = 1) results in a porous 3D
macrostructure (DM1). With horizontal alignment, the resulting macrostructure (DM2) is
denser and flatter.

Ph.D. Thesis – Ahmed M. Abdalla; McMaster University –Engineering Physics
108
4.4.5 Conductive Inks for Circuit Printing
Figure 5.8a illustrates the preparation of water-based conductive inks, which use
hydrophilic Ni-MWNTs (γ=7) as their conductive filler that is readily dispersed in water.
The morphologies of lines printed with MWNT-only and Ni-MWNT based inks (2 vol%)
are presented in Figure 5.8b1 and b2, respectively. Lines that were printed with the
hydrophobic MWNT-based ink (Figure 5.8b1) contained macroscale cracks due to MWNT
agglomeration after drying that destroyed their electrical continuity, producing an open
circuit for DC electrical measurements. In contrast, agglomeration of hydrophilic Ni-
MWNTs was far less severe and they produced a printed line (Figure 5.8b2) containing
only small microscale cracks.
Figure 5.8c presents the measured electric resistivity of lines that were printed with
and without magnetic assistance using inks containing different volume concentrations of
Ni-MWNTs. As expected, the electric resistivity decreases with increasing Ni-MWNT
concentration. When a magnet is not used to facilitate printing, the electric resistivity of the
printed lines decreases from 2420 to 5.9 Ωm by increasing the volume loading of the Ni-
MWNTs from 1 to 8%. The corresponding lines printed with the assistance of a magnetic
showed a similar decrease from 2197 to 4.6 Ωm. Hence, magnetic assistance during
printing led to a greater reduction in electrical resistivity for a lower Ni-MWNT
concentration (i.e. <4 vol%) ink, where the resistivity was reduced for the 1 and 2 vol%
inks by 223.8 and 313.1Ωm, respectively. Use of a magnet concentrated the relatively low
Ni-MWNT content in these inks. However, magnetic assistance was less effective for inks
with a higher Ni-MWNT content that also have a higher viscosity.

Ph.D. Thesis – Ahmed M. Abdalla; McMaster University –Engineering Physics
109
Figure 5.8: Water based conductive inks. (a) The procedure for ink preparation. Ni-
MWNTs or MWNTs are dispersed in DI water using a probe sonicator and the ink poured
into a plastic template. (b) Post drying, optical images show the morphology of the printed
lines created by either MWNT or Ni-MWNT based inks (2 vol%). Macroscale cracks are
clearly observed in the case of MWNTs, while smaller microscale cracks are observed for
the other case. (c) The measured electric resistivity of the lines printed by Ni-MWNT based
inks for different volume loadings with and without magnetic assistance.

Ph.D. Thesis – Ahmed M. Abdalla; McMaster University –Engineering Physics
110
These experiments provide evidence of the importance of surface modification of
MWNTs during the printing of electrical circuits. Coating of MWNTs with nickel enhances
their compatibility with polar solvents and polymers, and improves their mechanical and
magnetic properties. Besides circuit printing, we envisage potential applications for
polymeric composite materials and energy storage.
5.5 Conclusion
Nickel nanocrystals were deposited on MWNTs with electroless plating that used a
chemical metal reduction method for different weight ratios γ = 1, 7, 14, and 30. Once Ni
was deposited on palladium catalyst particles, it formed nanoclusters on the MWNT
surfaces. When the Ni content was increased, neighboring nanoclusters merged to produce
a continuous Ni coating layer that encapsulated the MWNT. For larger γ, despite Ni
coverage over the palladium catalyst, deposition continued through autocatalysis by the
deposited nickel. All NiCH hybrid material samples contained encased MWNTs that were
connected by Ni networks. Increasing γ improved metallic connections between plated
MWNTs so that the sparse MWNT network for γ = 1 became denser when γ = 14 as
microscale NiCH structures were produced. In these structures, Ni formed a conductive
metallic matrix that contained MWNTs as the reinforcing filler material. The Ni-MWNT
hybrid material with γ = 1, and 7 had higher E ~ 18.3 and 58.7 GPa than pure MWNTs (E
~ 12.5 GPa), i.e., increasing γ improved the elastic modulus. The magnetic properties of
the NiCH are superior to those of the original diamagnetic MWNTs (e.g., Ms increases),

Ph.D. Thesis – Ahmed M. Abdalla; McMaster University –Engineering Physics
111
and improve with increasing γ. This electroless plating method is promising for improving
the mechanical and magnetic properties of MWNTs and reducing their electrical resistance.
We also fabricated Ni-MWNT macrostructures with controlled morphologies using
the NiCH. Nickel deposition on the Ni-MWNT sample that was hybrid vertically-aligned
with a magnetic field (SN1, γ = 1) resulted in a porous 3D macrostructure while deposition
on the horizontally-aligned hybrid produced denser and flatter macrostructures. These
macrostructures could be utilized for nano- and microscale filtration, as well as for printing
electric circuits.
Since the hydrophilic nickel outer layer enhances Ni-MWNT dispersion,
electrically conductive inks were synthetized by simply dispersing different concentrations
of Ni-MWNT (γ = 7) samples in water. An ink with a low 8% volume concentration has a
relatively low electrical resistivity of 5.9 Ωm. Using a magnet to print inks containing such
low Ni-MWNT concentrations reduced the electric resistivity of the printed lines by 200-
300Ωm.

Ph.D. Thesis – Ahmed M. Abdalla; McMaster University –Engineering Physics
112
6. Tailoring the Properties of a Ni-MWNTs Based Polymer
Nanocomposite Using a Magnetic Field
6.1 Introduction
In this chapter, an experimental investigations will be presented to highlight how to tailor
the properties of nanocomposites by organizing nanoparticles (Ni-MWNTs) within the
polymer matrix, e.g., for potential engineering applications. These magnetized
nanoparticles are introduced into an epoxy matrix at low 0.25-1% volume fractions and
aligned along the direction of an applied magnetic field, which produces anisotropic bulk
properties. However, nanoparticles aligned in perpendicular directions in sequential layers
result in an effectively isotropic composite material. By changing this alignment, it
becomes possible to tailor the properties of the resulting composite material. This chapter
is reprinted from a manuscript entitled, Tailoring the Properties of a Polymer
Nanocomposite using a Magnetic Field by Ahmed M Abdalla, Rakesh P. Sahu, and Ishwar
K. Puri, submitted to Composites part B: Engineering for possible publication. The author
of this thesis is the first author and main contributor of the above mentioned publication
and has conducted all the experiments. The chapter will provide a literature review which
is discussed in the background information section, followed by excerpts from the above
mentioned paper.
Ph.D. Thesis – Ahmed M. Abdalla; McMaster University –Engineering Physics
113
6.2 Background Information
The properties of natural nanocomposites, such as abalone shell [271], bone, insect wings
[272] and fish tails [273] are influenced by the orientation and layering of their constituent
nanomaterials. Likewise, polymer nanocomposites contain nanoscale fillers, such as
nanoparticles, nanosheets and nanofibers, which can be aligned and layered within their
surrounding polymer matrix. When these nanomaterials are introduced into the matrix, their
high surface area to volume ratio helps enhance the mechanical, thermal, electrical, optical
or magnetic properties of the resulting composite material [53, 274]. For instance, the
anisotropic one-dimensional structure of a carbon nanotube (CNT) and its superior
mechanical, thermal and electrical properties makes it suitable for inclusion in high-
performance nanocomposites.
However, it is difficult to disperse CNTs homogeneously within the matrix due to
their hydrophobicity and low wettability, which restricts their use in nanocomposite
applications [35]. This limitation on dispersion must be overcome to fabricate ordered
nanocomposites in which the CNT-matrix interface is effectively bonded [53]. Methods to
improve CNT dispersion include ultrasonication, where high intensity ultrasound waves
isolate the nanotubes from agglomerated bundles by continuously collapsing them with
nucleated microbubbles. The nanotubes can instead be chemically functionalized to
introduce active chemical groups containing unsaturated bonds on their surfaces. These
groups increase the repulsion between adjacent CNTs [98]. However, ultrasonication alone
is unable to produce a homogeneous and stable dispersion while chemical functionalization

Ph.D. Thesis – Ahmed M. Abdalla; McMaster University –Engineering Physics
114
using acids produces significant CNT surface destruction, thus diminishing the nanotube
properties.
The alignment of CNTs along particular directions in a polymer matrix [53-55] can
be accomplished by applying external electric and magnetic fields [95, 199, 220, 268], or
by leveraging the fluid drag force on the nanoparticles as they are being dispersed in the
uncured matrix [98, 168, 172, 173]. Since CNTs have a poor magnetic susceptibility, this
necessitates the application of a relatively strong external magnetic field during alignment
to produce a force that exceeds the thermal energy and viscous resistance of the uncured
polymer [55, 134]. Therefore, the nanotubes must be first magnetized if realistic magnetic
fields are to be employed [168, 172, 174], e.g., by wrapping polymers functionalized with
iron oxide nanoparticles [172]. These nanoparticles can also be decorated with nickel,
maghemite and magnetite nanoparticles and aligned under a relatively weak field [18, 174,
275]. The decorations occur through chemical methods that destroy the CNT surfaces, do
not improve their hydrophobicity, or increase their electrical contact resistance [18].
Typically, the introduction of a small amount of CNTs into a polymer matrix
increases its electrical and thermal conductivities at the expense of a minor density increase
[54, 168]. For instance, a small 0.021 wt% introduction of CNTs improves the electrical
and thermal conductivities of an insulating polymer [53]. Including 1 wt% of multiwall
carbon nanotubes (MWNTs) in polyvinyl alcohol increases the elastic modulus and
hardness of the resulting composite by 80% and 60%, respectively [169]. Composites with
aligned CNTs exhibit higher electric [134] and thermal [171] conductivities than those that
contain randomly dispersed CNTs and, as expected, this enhancement is a function of the
Ph.D. Thesis – Ahmed M. Abdalla; McMaster University –Engineering Physics
115
nanomaterial weight content [134]. The percolation threshold for CNTs in a typical
polymer lies within a wide 0.5-10 wt% range. The threshold is influenced by several
factors, such as degree of alignment, dispersion homogeneity, polymer type and processing
method [98].
Here, we demonstrate a method to readily disperse and align commercially
available MWNTs in a polymer nanocomposite. The entire surface of the MWNTs is coated
with a nickel layer through nondestructive electroless plating [19, 276]. The resulting Ni-
MWNTs are magnetic, have far better dispersion and stability in the polymer matrix than
MWNTs alone, and enhance the properties of the composite over what MWNTs can alone
provide. This hybrid nanomaterial is aligned in multiple directions within the polymer
matrix with a magnetic field to investigate the influence of nanoparticle anisotropy on the
bulk composite properties. The fabrication method is simple, cost effective and scalable in
contrast to typical laboratory methods that are limited to millimeter dimensions.
6.3 Methodology
6.3.1 Materials and Reagents
Commercially available MWNTs purchased from US Research Nanomaterials Inc. with
purity > 95%, outer diameter of 20-30 nm, inner diameter of 5-10 nm, and length between
0.5-2.0 µm and true density ~2.1 g cm-3, as specified by the manufacturer, are used. Other
reagents include nickel (II) chloride (NiCl2, 98%, Alfa Aesar), nickel (II) sulfate
hexahydrate (NiSO4·6H2O, 99%, Sigma-Aldrich), sodium hydroxide (NaOH, 97%,
Caledon Laboratory Chemicals), hydrochloric acid (HCl, 36.5-38%, Caledon), stannous
chloride dihydrate (SnCl2·2H2O, 98%, Caledon), ammonium chloride (NH4Cl, ACS grade,

Ph.D. Thesis – Ahmed M. Abdalla; McMaster University –Engineering Physics
116
BDH/VWR International), sodium citrate dihydrate (Na3C6H5O7·2H2O, 99%, EMD
chemicals Inc.), sodium hypophosphite monohydrate (NaH2PO2·H2O, lab grade,
Anachemia Canada Co.), and palladium (II) chloride (PdCl2, 100%, Artcraft chemicals
Inc.). Epoxy Resin and hardener (West System 105, Plastic World Co.) are used to form
the matrix of the polymer composite. All reagents are used as received without further
purification.
6.3.2 Electroless Plating of MWNTs with Nickel
The MWNTs are plated with nickel to produce Ni-MWNTs through electroless deposition,
as described in section 5.3.3 [19]. Briefly, palladium is adsorped onto the surface of
MWNTs during two treatment steps, first with stannous chloride solution and then with
palladium chloride solution [19, 97, 141, 147, 263]. Then, nickel ions (Ni+2) are reduced to
nickel metal on the catalyzed surface through the electrons provided by the reducing agent
(sodium hypophosphite, NaH2PO2) [19, 147, 149, 262, 263]. The MWNTs are plated with
Ni for a Ni:MWNT weight ratio γ = 7. A gram of MWNTs requires a plating solution that
consists of NiCl2 (11.9g), NiSO4·6H2O (7.7g), NH4Cl (38.5g), Na3C6H5O7·2H2O (28g),
NaH2PO2·H2O (35g) and deionized water (700 ml) [19].
6.3.3 Preparation of Epoxy Nanocomposites
Epoxy nanocomposites are prepared by dispersing either MWNTs or Ni-MWNTs in epoxy
resin and subsequently sonicated with a probe sonicator (Qsonica, LLC, Model: Q500 with
1/8ʺ micro-tip at 35% power) for 15 min. The dispersion is kept inside a desiccator under
partial vacuum of -0.1 MPa for 10 min to remove bubbles introduced during the sonication

Ph.D. Thesis – Ahmed M. Abdalla; McMaster University –Engineering Physics
117
stage. A curing agent with a hardener-resin volume ratio of 1:10 is subsequently added to
the dispersion and stirred for a minute. The mixture is poured into a template that has inner
dimensions of 6cm × 6cm × 1cm, where it is left to be cured over 24 h (see Figure 6.1).
Figure 6.1: Alignment of homogeneously dispersed Ni-MWNTs in epoxy matrix using
magnet sets placed on either side of a 6cm × 6cm × 1cm template containing the
nanocomposite. The arrow denotes the direction of the magnetic field B.
Figure 6.2: Preparation of different epoxy nanocomposites. The samples contain (a)
randomly dispersed MWNTs or MWNTrandom, (b) randomly dispersed Ni-MWNTs, or Ni-

Ph.D. Thesis – Ahmed M. Abdalla; McMaster University –Engineering Physics
118
MWNTrandom (c) Ni-MWNTs aligned along a single direction in separate layers or Ni-
MWNTaligned,1D, and (d) Ni-MWNTs aligned along perpendicular directions in separate
layers or Ni-MWNTaligned,2D.
In addition to the pure epoxy polymer sample, four other nanocomposite samples
are prepared, each with a 0.25 % nanoparticle volume fraction (Figure 6.2). The equivalent
weight content corresponding to this volume fraction for MWNTs is ~0.5 wt% and for Ni-
MWNTs ~2 wt%. The thickness of all of these epoxy-based samples is 4 mm. The
nanocomposite sample prepared with randomly dispersed MWNTs is denoted as
MWNTrandom in Figure 6.2a. The other three samples prepared with Ni-MWNTs are (i)
randomly dispersed Ni-MWNTs, denoted Ni-MWNTrandom (Figure 6.2b), (ii) Ni-MWNTs
aligned along a single direction, denoted Ni-MWNTaligned,1D (Figure 6.2c), and (iii) Ni-
MWNTs aligned along two perpendicular directions, denoted Ni-MWNTaligned,2D, as shown
in Figure 6.2d.
For the latter two samples that contain aligned nanoparticles, the template is placed
between two sets of NdFeB-N42 magnets (purchased from K&J Magnetics) that establish
an external magnetic field to align the Ni-MWNTs through action from a distance, as shown
in Figure 6.1. The liquid polymer precursor is poured two times to create sequential 2 mm
thick layers, where the second 2 mm layer is poured 5 h after the first. This allows sufficient
time for the first layer to become appropriately viscous and partially cured so as to hold the
aligned Ni-MWNTs in place before the second layer is poured on top of it. The mid-plane
of the magnet set is aligned with the nanocomposite layer. The magnets are raised by 2 mm
after the first layer has partially cured. Pouring the nanocomposite into two layers allows

Ph.D. Thesis – Ahmed M. Abdalla; McMaster University –Engineering Physics
119
multi-directional alignment if the magnetic field is rotated by 90º during the second
pouring. Finally, 1 vol% samples are also prepared for the Ni-MWNTaligned,2D and
MWNTrandom cases to investigate the influence of raising nanoparticle content on the sample
electrical resistivity.
6.3.4 Characterization Methods
Scanning transmission electron microscopy and transmission electron microscopy (dark
field STEM/TEM) are conducted with a JEOL 2010F field emission microscope. The
samples are suspended in ethanol, dropped on a TEM copper grid and then wicked off with
a Kimwipe. Magnetization measurements are performed at room temperature using
superconducting quantum interference device (SQUID) magnetometry (Quantum Design
Inc.). The actual magnetic field is simulated with finite element method magnetics (FEMM)
software (version 8 under terms of the Aladdin free public license). Optical imaging is
conducted with a VWR stereo zoom trinocular microscope. The tensile strength of the
prepared polymer composite is measured with an Instron dual column testing system
(Model No. 5967, 30 kN capacity, wedge action grips). Atomic force microscopy (AFM
Bruker, Multimode 8 with ScanAsyst, NanoScope 9.1 software) is used to determine the
elastic modulus. The AFM tip (TAP 525 A) with measured tip radius and deflection
sensitivity of 5 nm and 82.6 nm.V-1 (using the built-in Ramp mode) is calibrated with a
reference material (Sapphire−12M, Bruker test sample kit) that has a known elastic
modulus of 350 GPa. The natural frequency and the spring constant of the tip are calculated
from thermal tuning data to be 520 Hz and 204.2 N.m-1. These values are in good agreement
with standard values of 525 Hz and 200 N/m provided by the manufacturer. All

Ph.D. Thesis – Ahmed M. Abdalla; McMaster University –Engineering Physics
120
measurements are performed using NanoScope Analysis 1.5 software. The AC electrical
resistivity is measured using an ultra-precision capacitance bridge (Andeen Hagerling) at a
frequency of 1 kHz. To avoid interference with surroundings, the sample is mounted inside
a Pomona box, as shown in Figure 6.3.
Figure 6.3: Schematic of AC electrical resistivity measurements using an ultra-precision
capacitance bridge at 1 kHz.
6.4 Results and Discussion
6.4.1 Nickel-Coated MWNTs
We have presented detailed phase and morphology analyses of Ni-MWNTs in section 5.4.1
[19]. Figure 6.4a presents a TEM image of as prepared MWNTs. The dark-field STEM
image presented in Figure 6.4b confirms complete coating of nickel over MWNTs. The
thickness of the Ni coating is measured to be ≈40-60 nm. Pure MWNTs are diamagnetic
[57, 58] but coating them with a ferromagnetic Ni layer results in a hybrid nanomaterial
that exhibits superparamagnetic behavior. Therefore, the synthesized Ni-MWNTs exhibit

Ph.D. Thesis – Ahmed M. Abdalla; McMaster University –Engineering Physics
121
improved response toward the magnets (Figure 6.4c). The magnetic hysteresis loop
confirms the magnetic saturation of the Ni-MWNTs whereas pure MWNTs are
nonmagnetic. The magnetic saturation of the Ni-MWNT is determined to be 9.5 emu g-1
using SQUID magnetometry, as shown in Figure 6.4d. The improved magnetization of Ni-
MWNTs allows the material to align readily along the direction of an external magnetic
field.
Figure 6.4: Phase and morphology of the synthesized Ni-MWNT samples. (a) TEM image
of the as prepared MWNTs, (b) dark field STEM image of an Ni-MWNT, (c) magnetic
response of the prepared Ni-MWNTs towards a magnet, and (d) the magnetic hysteresis
curve that shows that Ni-MWNTs exhibit quasi-superparamagnetic behavior at room
temperature (Ms ~ 9.5 emu g-1).

Ph.D. Thesis – Ahmed M. Abdalla; McMaster University –Engineering Physics
122
6.4.2 Alignment of Ni-MWNT in the Epoxy Matrix
A magnetic field with a relatively low ~0.1 T strength is used to align the Ni-MWNTs
within the epoxy. In Figure 6.5a, two-dimensional simulations of the experiments using
FEMM software show the magnetic lines of force and field magnitudes generated during
the experiment. There is a slight variation in field strength along x and y axes of the sample
domain, from 0.098-0.103 T and 0.103-0.107 T, respectively (Figure 6.5b & 6.5c). This
quasi-uniform B field effectively aligns Ni-MWNTs along a single direction.
Figure 6.5: Simulated characteristics of the magnetic field within the sample. (a) A 2-D
simulation showing the topology of the magnetic lines of force and the field magnitude
within the sample along its (b) x and (c) y axes. The simulation is conducted with the
dimensions of the experimental setup and the magnet type and size employed.

Ph.D. Thesis – Ahmed M. Abdalla; McMaster University –Engineering Physics
123
Figure 6.6: Optical microscope images obtained at different times confirm Ni-MWNT
nanoparticle agglomeration into clusters that finally the align after 4 min along the direction
of the applied magnetic field oriented at (a) 0° and (b) 45° with respect to an arbitrary axis.
The alignment of Ni-MWNTs under the influence of the external magnetic field is
visualized under an optical microscope for a very low nanoparticle volume fraction (0.01%)
in the epoxy matrix. We observe that Ni-MWNT clusters align along the direction of the
imposed magnetic field. Visualizations are for ~ 0.1 T magnetic field orientations of 0° and

Ph.D. Thesis – Ahmed M. Abdalla; McMaster University –Engineering Physics
124
45° with respect to an arbitrary axis, as shown in Figure 6.6a and 6.6b, respectively. Figure
6.6 shows the different stages of alignment at three different times, namely, 0, 2 and 4 min
after the application of the magnetic field. During alignment, Ni-MWNTs first agglomerate
into microscale clusters that orient along the magnetic field direction but, after ~4 minutes,
these clusters become fully aligned along this direction.
6.4.3 Tensile Strength of the Nanocomposites
Tensile tests are conducted at room temperature and humidity with a cross-head speed of
0.1 mm.min-1. For each tensile strength experiment, four identical samples are prepared.
The samples are polished with an emery cloth to ensure that the Instron sample holder can
properly grip them. Sample stretching continues until complete failure occurs. The
maximum stress on a sample is used to calculate its ultimate tensile strength (referred to as
tensile strength hereafter).
The tensile strengths for five cases with the same 0.25 % nanoparticle volumetric
fraction are presented in Figure 6.7. This strength decreases by ~26.5% from 43.4 MPa for
pure epoxy to 31.9 MPa when 0.25 vol% of pure MWNTs are added to the matrix. The
MWNTs have a non-polar surface that is incompatible with the epoxy matrix, which leads
to their weak adhesion with polymer chains [53]. The multiwall nanotubes also disperse
poorly, agglomerating into microsize bundles [98], which initiate microscale cracks inside
the cured epoxy that diminish its tensile strength. The tests for the MWNTrandom samples
therefore have a relatively large standard deviation of ~6.6 MPa, which is attributed to their
poor nonuniform dispersion in epoxy. Depositing a nickel layer over the non-polar carbon

Ph.D. Thesis – Ahmed M. Abdalla; McMaster University –Engineering Physics
125
surface significantly improves MWNT dispersion in the matrix. Consequently, Ni-
MWNTrandom samples have a higher mean tensile strength of ~41.6 MPa. While this strength
is slightly lower than that of pure epoxy by ~4.1%, it also shows a large standard deviation
of ~6.7 MPa, which we again attribute to nonuniform nanoparticle agglomeration.
Figure 6.7: Tensile strengths for different epoxy nanocomposites. The nanoparticle volume
fraction for all nanocomposites is 0.25%. The organization of the nanoparticles within the
epoxy matrix is also illustrated.
Aligning Ni-MWNTs along specific field directions during curing produces
anisotropic organization and improves directional dispersion. Both Ni-MWNTaligned,1D and
Ni-MWNTaligned,2D tensile strength tests therefore have much lower standard deviations of
~1.8 MPa, and 2.3 MPa, respectively, than do the random samples. These aligned samples
Ph.D. Thesis – Ahmed M. Abdalla; McMaster University –Engineering Physics
126
reveal a slight increase in the average tensile strength to ~47.6, and 47.2 MPa, respectively,
both values being close to the upper standard deviation limit for the Ni-MWNTrandom sample.
The effect of Ni-MWNT alignment coupled with better directional dispersion improves the
load bearing capability of the nanocomposite. These results clarify that nanoparticle
organization can be used to tailor the mechanical properties of a nanocomposite [96, 241].
6.4.4 Elastic Modulus E
The mean elastic modulus E of the samples is measured using AFM with the same tip and
under similar AFM calibration conditions so that the resulting values are relative to the
elastic modulus (E = 350 GPa) of a standard sapphire sample. In the case of samples
containing aligned Ni-MWNTs, probing with the AFM tip is conducted perpendicular to
the direction of alignment.
An epoxy sample and three nanocomposite samples, namely, MWNTrandom, Ni-
MWNTrandom, and Ni-MWNTaligned,1D, are probed. Since probing with the AFM tip provides
a surface property, it is not possible to investigate the effect of alignment in perpendicular
directions on the elastic modulus of the Ni-MWNTaligned,2D sample. The AFM is also less
suitable for investigating the effect of alignment because the scanning area is limited to a
few µm2. Probing a larger area with a lower scan rate would be more accurate but this
requires several hours of probing which deteriorates the AFM tip with the result that the
same tip cannot be used to probe all samples. The nanocomposite samples are polished with
emery cloth prior to the AFM measurements. The surface roughness of all samples is within
1.5-2 μm, as shown in Figure 6.8a.

Ph.D. Thesis – Ahmed M. Abdalla; McMaster University –Engineering Physics
127
Figure 6.8: AFM characterization of the cured polymer and its three nanocomposites,
MWNTrandom, Ni-MWNTrandom, and Ni-MWNTaligned,1D. (a) Surface topography, (b) elastic
modulus and (c) line scans of the elastic modulus. The nanocomposites are prepared with
a 0.25 vol% nanoparticle loading. While epoxy has an average elastic modulus E ~ 17 GPa,
which is similar to that for the MWNTrandom sample, both Ni-MWNT composites reveal
higher E up to ~ 150 GPa.
We have previously reported that, for γ=7, Ni-MWNTs have a ~5 times higher
average elastic modulus than pure MWNTs (~ 12.5 GPa) [19]. As shown in Figure 6.8,
similar behaviour is observed for these two types of nanoparticles when they are dispersed
Ph.D. Thesis – Ahmed M. Abdalla; McMaster University –Engineering Physics
128
in epoxy. AFM measurements over a 20 μm2 cross-section of the nanocomposite samples
are presented in Figure 6.8b. The average elastic modulus E of pure epoxy composite is
measured to be 17 GPa (Figure 6.8c), which is slightly higher than for the as-prepared
commercially purchased MWNTs. This explains why E for the MWNTrandom sample is
similar to that for the pure epoxy sample. The Ni-MWNTrandom sample containing the same
volume fraction of Ni-MWNT nanoparticles has a significantly higher E (Figure 6.8c). At
certain locations, E reaches a maximum value of 150 GPa for both the Ni-MWNTrandom and
Ni-MWNTaligned,1D samples, but a typical E value across a line scan fluctuates between 60-
100 GPa. The density of hot spots characterized by local E peaks increases when Ni-
MWNTs are aligned, as shown in Figure 6.8c. This result is in agreement with the optical
images in Figure 6.6 where Ni-MWNT agglomeration is observed to organize into local
clusters aligned with the applied magnetic field.
6.4.5 AC Electrical Resistivity ρ
The electrical resistivity ρ of the pure epoxy and the nanocomposite samples, all with the
same nanoparticle loading, are presented in Figure 6.9a. The 1×1×0.4 cm samples are
placed between two copper electrodes and measurements made under an AC current of
frequency of 1 kHz. A thin layer of silver paste is applied to both edges of the sample,
which is then placed between spring loaded electrode contacts. The Ni-MWNTaligned,1D
sample contains two 2 mm thick layers in which Ni-MWNTs are aligned along one
direction. Hence, two separate measurements are conducted, one along the direction of
alignment and another perpendicular to it. The Ni-MWNTaligned,2D sample contains
sequential 2 mm layers in which the nanoparticles are aligned along perpendicular

Ph.D. Thesis – Ahmed M. Abdalla; McMaster University –Engineering Physics
129
directions in the two layers. The measurements are similar across different sides of this
sample because, during each experiment, although the second layer contains Ni-MWNTs
aligned along the perpendicular direction, one of the layers contains Ni-MWNTs aligned
along the measurement direction. Six measurements are made for each case. The mean ρ
and its standard deviation are presented in Figure 6.9.
Pure epoxy with a mean ρ = 329.3 MΩ m (Figure 6.9a) behaves as an insulator.
When 0.25 vol% of Ni-MWNTs are randomly dispersed within epoxy, ρ decreases by
28.3% to 236 MΩ m. The alignment of Ni-MWNTs in a single direction induces anisotropic
bulk behaviour in the Ni-MWNTaligned,1D nanocomposite. The resistivity reduces
significantly along the anisotropic alignment direction to 188.1 MΩ m, while ρ = 237.4
MΩ m in the perpendicular direction, i.e., across the nanotubes. This latter resistivity is
similar to that for the sample containing randomly distributed Ni-MWNTs. While ρ
decreases by 28.3% when Ni-MWNTs are randomly dispersed in pure epoxy, nanoparticle
alignment decreases the resistivity by 42.9% from that of pure epoxy.

Ph.D. Thesis – Ahmed M. Abdalla; McMaster University –Engineering Physics
130
Figure 6.9: AC electrical resistivity ρ measured at a frequency of 1 kHz. (a) Effect
of nickel coating and alignment on the resistivity of nanocomposites prepared with the same
0.25% volumetric nanoparticle loading along with pictorial representations of how the
nanoparticles are organized within the epoxy matrix. (b) Change in resistivity with
volumetric loading for the Ni-MWNTaligned,2D composite. A nanocomposite prepared with
randomly distributed MWNTs at a 1% volume loading is used as reference sample for
comparison.

Ph.D. Thesis – Ahmed M. Abdalla; McMaster University –Engineering Physics
131
The alignment of Ni-MWNT along perpendicular directions in the two adjacent
layers in the Ni-MWNTaligned,2D sample produces a higher value for ρ than of the Ni-
MWNTaligned,1D sample measured along the alignment direction. This is to be expected since
the Ni-MWNT volume fraction that is aligned along the direction of measurement is now
halved in comparison to the fraction contained in the entire Ni-MWNTaligned,1D sample. With
nanoparticles in only one of the two layers aligned along the measurement direction, the
decrease in ρ (~36.6%) is higher than that induced by the randomly organized Ni-
MWNTrandom sample and along the radial direction of the Ni-MWNTaligned,1D sample . Thus,
perpendicular alignment of Ni-MWNTs in the two adjacent layers of the Ni-MWNTaligned,2D
sample appears to produce an overall isotropic material. These results show how Ni-
MWNT alignment can be varied to tailor the degree of anisotropy in a bulk composite
material.
We examine the influence of volume fraction on ρ in light of the equivalent isotropic
behaviour of the Ni-MWNTaligned,2D composite in Figure 6.9 where the Ni-MWNT fraction
is varied between 0 (pure epoxy) to 1 vol%. As expected, ρ decreases with increasing Ni-
MWNT fraction. A minimum 63.7 MΩ m value measured at the 1 vol% loading,
representing an 80.7% reduction in ρ over pure epoxy. When the matrix is loaded with the
same 1 vol% of as prepared randomly distributed MWNTs, ρ = 116.5 MΩ m, which is a
~64.6% reduction over the pure epoxy value. For the two-layer case with differently aligned
Ni-MWNTs, a single layer conducts electricity far more effectively since nanoparticles in
the other layer lie orthogonal to the measurement direction. At the same 1 vol%, loading,
the electrical resistivity of the quasi-isotropic Ni-MWNTaligned,2D sample is roughly half that

Ph.D. Thesis – Ahmed M. Abdalla; McMaster University –Engineering Physics
132
of its MWNTrandom counterpart, revealing how ρ is reduced by coating MWNTs with nickel
to reduce the matrix-nanoparticle interfacial contact resistance.
6.5 Conclusion
Electroless metal plating of commercially available MWNTs is a simple, direct,
inexpensive and scalable method to improve the mechanical and electrical properties of a
nanocomposite. Since the resulting Ni-MWNTs are magnetic nanoparticles, an external
magnetic field can be applied in the form of action from a distance to align these
nanoparticles within a nanocomposite. This alignment enhances the properties of the
composite, such as its tensile strength, elastic modulus and AC electrical resistivity.
Deposition of nickel over MWNT also improves the interfacial bonding between the
resulting Ni-MWNT hybrid nanoparticles and the surrounding polymer matrix. The tensile
strength of a nanocomposite containing 0.25% volume fraction of aligned Ni-MWNTs is
~9% higher than of pure epoxy and ~47% higher than a composite containing a similar
volume fraction of randomly dispersed nanoparticles. Nanoparticle alignment reduces the
variability in tensile strength measurements since the dispersion homogeneity in different
samples is improved along the direction of the magnetic field. With a 0.25 vol% of aligned
Ni-MWNTs, the AC electric resistivity along the alignment direction is ~40% lower than
of pure epoxy and ~20% lower than of the composite containing a similar fraction of
randomly dispersed nanoparticles. We demonstrate for the first time how anisotropic
nanoparticles can be aligned in multiple directions in a polymer matrix to produce an
effectively isotropic nanocomposite. The AC electrical resistivity of an epoxy
nanocomposite fabricated with 0.25 vol% Ni-MWNTs aligned in perpendicular directions

Ph.D. Thesis – Ahmed M. Abdalla; McMaster University –Engineering Physics
133
in two sequential layers is effectively isotropic and ~11.6% lower than for the composite
containing a similar fraction of randomly dispersed Ni-MWNTs. Therefore, aligning Ni-
MWNTs along multiple directions enables the tailoring of the physical properties of their
epoxy composites, as well as their direction-dependent bulk behaviour, which is potentially
useful for many engineering solutions, e.g., potential aerospace, automobile and
infrastructure applications.
Ph.D. Thesis – Ahmed M. Abdalla; McMaster University –Engineering Physics
134
7. Supercapacitor Based on Nickel Oxide Nanotubes
Synthesised From Ni-MWNT Hybrid Nanomaterials
7.1 Introduction
In this chapter, an experimental investigations will be presented to highlight a novel
approach for the fabrication of nickel oxide nanotubes based on multiwalled carbon
nanotubes as a sacrificial template. Electroless deposition is employed to deposit nickel on
carbon nanotubes. Subsequent annealing of the product in the presence of air oxidizes
nickel to nickel oxide whereas carbon is released as gaseous carbon dioxide, leaving behind
nickel oxide nanotubes. New chelating polyelectrolytes are used as dispersing agents to
achieve high colloidal stability both for nickel coated carbon nanotubes and nickel oxide
nanotubes. An electrode for supercapacitor was fabricated using nickel oxide nanotubes as
the active element and nickel coated carbon nanotubes as a conductive filler. This chapter
is reprinted from Nanotechnology, Nickel Oxide Nanotubes Synthesis using Multiwalled
Carbon Nanotubes as Sacrificial Templates for Supercapacitor Application, 28 (7),
Ahmed M Abdalla, Rakesh P. Sahu, Cameron J. Wallar, Ri Chen, Igor Zhitomirsky, and
Ishwar K. Puri, with permissions from IOP. The chapter will provide a literature review
which is discussed in the background information section, followed by excerpts from the
above mentioned paper. The author of this thesis is the first author and main contributor of
the above mentioned publication and has conducted all the experiments except the
electrochemical characterization section.

Ph.D. Thesis – Ahmed M. Abdalla; McMaster University –Engineering Physics
135
7.2 Background Information
Carbon neutral solutions require not only renewable energy generation but also efficient
energy storage devices. Novel synthesis processes that produce novel active materials for
these devices will improve their affordability and performance. Quasi one-dimensional
(1D) nanostructures, such as nanoparticles, nanotubes and nanowires, have intrinsically
large surface area to volume (hence mass) ratios, short diffusion lengths for charge and
mass transport, and substantial volume change capacities, which makes them suitable for
next generation energy storage devices [277]. Many nanostructures also exhibit superior
electrochemical performance [278, 279].
Pseudocapacitors are a class of supercapacitors that store Faradaic current through
charge transfer between an electrode and an electrolyte [280, 281]. Conducting polymers
and transition metal oxides, such as ruthenium oxide (RuO2), iridium oxide (IrO2),
manganese dioxide (MnO2), bismuth oxide (Bi2O3), cobalt oxide (Co3O4), iron oxide
(Fe3O4), and nickel oxide (NiO), are candidate electrode materials for
pseudocapacitors,[282] although fabrication cost is an issue. Among transition metal oxides
with p-type semiconducting properties, NiO exhibits higher theoretical capacitance, charge
density, and chemical stability [283-287]. The gravimetric specific capacitance of metal
oxide based electrodes decreases with increasing electrode mass [282, 288-291]. The
charge in pseudocapacitors is stored mostly on the surface of the active material, reducing
the active mass, which is favorable for electrochemical performance [292, 293] and thus
decreasing the specific capacitance [278, 283, 294, 295]. Supercapacitor electrodes
containing active materials and conductive additives also benefit from tubular and fibrous
Ph.D. Thesis – Ahmed M. Abdalla; McMaster University –Engineering Physics
136
microstructures [295-297] that enhance charge transfer and electrolyte access to the active
material, and reduce the amount of binder that is introduced.
Due to their small crystal size, high aspect ratio and hollow microstructure, nickel
oxide nanotubes (NiONT) show promise for sensing [285, 298], catalysis [299], energy
storage applications such as batteries [284, 300-302] and supercapacitors [303, 304]. The
performance of NiO-based supercapacitors [282, 288, 305-307] is enhanced by fabricating
electrodes that have high NiO mass loadings. Practical applications require high specific
capacitance for a mass loading of 10-20 mg cm-2 [308]. Hence, NiO and other charge
storage materials are typically combined with conductive additives, such as Ni, multiwalled
carbon nanotubes (MWNT) and graphene to fabricate composite electrodes that show
improved electronic conductivity [288, 289, 295].
Since NiONT applications are limited by the lack of simple and low cost fabrication
methods, we propose a new scalable method to overcome this limitation. We encapsulate
MWNTs with Ni by depositing the metal through electroless deposition to synthesize the
Ni-MWNT hybrid material (the process was detailed in chapter 5) [19, 140, 141, 144, 147,
262]. These encapsulated nanotubes are annealed in air at temperatures much lower than
the melting temperature of Ni so that the metal and carbon in MWNTs oxidizes to NiO and
CO2. Release of the gaseous carbon dioxide results in a tubular vacancy where the MWNT
existed previously. Thus, the residual NiO retains the shape of the (now oxidized)
underlying MWNT template, producing a NiONT. The wall thickness of this nanotube may
be controlled by varying the mass of Ni deposited, which could allow control over the

Ph.D. Thesis – Ahmed M. Abdalla; McMaster University –Engineering Physics
137
dimensions of the synthesized NiONTs. We investigate NiONT charge storage by using
these nanotubes in the electrode of an electrochemical supercapacitor.
7.3 Methodology
7.3.1 Materials and Reagents
Commercially available MWNTs purchased from US Research Nanomaterials Inc. with
purity > 95%, outer diameter of 20-30 nm, inner diameter of 5-10 nm, and length between
0.5-2.0 µm as specified by the manufacturer are used. Other reagents included nickel (II)
chloride (NiCl2, 98%, Alfa Aesar), nickel (II) sulfate hexahydrate (NiSO4·6H2O, 99%,
Sigma-Aldrich), sodium hydroxide (NaOH, 97%, Caledon Laboratory Chemicals),
hydrochloric acid (HCl, 36.5-38%, Caledon), stannous chloride dihydrate (SnCl2·2H2O,
98%, Caledon), ammonium chloride (NH4Cl, ACS grade, BDH/VWR International),
sodium citrate dihydrate (Na3C6H5O7·2H2O, 99%, EMD chemicals Inc.), sodium
hypophosphite monohydrate (NaH2PO2·H2O, lab grade, Anachemia Canada Co.), and
palladium (II) chloride (PdCl2, 100%, Artcraft chemicals Inc.). Poly(4-styrenesulfonic
acid-co-maleic acid) sodium salt (PSSA, Mw=20 kDa), Poly[1-[4-(3-carboxy-4-
hydroxyphenylazo)benzenesulfonamido]-1,2-ethanediyl, sodium salt] (PAZO, Mw=65-100
kDa) and Poly(vinyl butyral-co-vinyl alcohol-co-vinyl acetate) (PVB, Mw=50–80 kDa)
were obtained from Sigma Aldrich. Ni foams with a porosity of 95% were supplied by Vale
Company. All reagents were used as received without further purification.

Ph.D. Thesis – Ahmed M. Abdalla; McMaster University –Engineering Physics
138
7.3.2 Synthesis of Nickel Oxide Nanotube (NiONT)
The synthesis of the nickel oxide nanotubes is schematically illustrated in Figure 7.1a.
Initially, MWNTs were sensitized with stannous chloride solution and then catalyzed with
palladium through treatment with palladium chloride solution [19, 97, 141, 147, 263], in
both cases under ultra-sonication with a probe sonicator (Qsonica, LLC, Model: Q500 with
1/4ʺ micro-tip at 35% power) for 30 min. The catalyzed MWNTs were washed with water
and dried in vacuum oven after each treatment step. The catalyzed MWNTs were
electrolessly plated with nickel nanocrystals through the chemical reduction of Ni+2
contained in the plating solution by electrons provided by sodium hypophosphite
(NaH2PO2), which acted as a reducing agent. Since the reaction was constrained to the
catalytic surfaces of the MWNTs, a continuous nickel layer was deposited that encapsulated
the entire MWNT [19, 147, 149, 262]. The autocatalytic Ni surface continued to facilitate
nickel deposition even after the original MWNT surface was completely encapsulated
[263]. The details of the catalyzing process of MWNT are presented in section 5.3.2.
The Ni layer thickness was changed by varying the Ni:MWNT weight ratio (γ = 1
and 7), see section 5.3.3. As a summery, for each gram of MWNTs desired, a plating
solution was prepared [19]. For two particular experiments, the solution consisted of NiCl2
(1.7g), NiSO4·6H2O (1.1g), NH4Cl (5.5g), Na3C6H5O7·2H2O (4g), NaH2PO2·H2O (5g) and
DI water (100 ml) for γ = 1, and NiCl2 (11.9g), NiSO4·6H2O (7.7g), NH4Cl (38.5g),
Na3C6H5O7·2H2O (28g), NaH2PO2·H2O (35g) and DI water (700 ml) for γ = 7. The
electroless deposition of Ni over MWCNT was conducted at pH ~ 9-10. Sodium hydroxide
solution (2N) was added dropwise to maintain the reaction pH, which was monitored with

Ph.D. Thesis – Ahmed M. Abdalla; McMaster University –Engineering Physics
139
a pH meter at 5 min intervals and a probe sonicator simultaneously used to continuously
sonicate the medium for 60 min. The reaction products were immediately washed and dried
to obtain Ni-MWNTs.
Figure 7.1: Synthesis of nickel-oxide nanotubes. (a) Schematic of the synthesis process for
nickel oxide nanotubes (NiONTs). It involves the electroless deposition of Ni on MWNT,
oxidation of Ni to NiO, and carbon of the MWNT to gaseous CO2. The carbon dioxide is
released, producing a tubular vacancy in the NiO bulk where the MWNT originally existed.
(b) TEM image of a MWNT, (c) dark field STEM image of a Ni-MWNT, and (d) dark field
STEM image of a NiONT.
The two Ni-MWNT samples for γ = 1, 7 were annealed at ≈500 °C for 2 hours in
the presence of air to oxidize Ni to NiO and the MWNT carbon content to CO2. Release of

Ph.D. Thesis – Ahmed M. Abdalla; McMaster University –Engineering Physics
140
the carbon dioxide left a tubular vacancy inside the NiO bulk, leading to the formation of
NiONTs. The resulting nanotube samples are labeled NiONT-1 for γ = 1 and NiONT-2 for
γ = 7.
7.3.3 Preparation of Colloidal Suspension of Ni-MWNT and NiONT
Electrode fabrication for testing electrochemical performance requires a very stable
colloidal suspension of the active material. The prepared NiONT serves as the active
material and the Ni-MWNT as a conductive additive to achieve high specific capacitance
at high active mass loadings by dispersing and mixing these components.
Dynamic Light Scattering (DLS, DelsaMax Pro: Beckman Coulter) was used to
measure the effect of two different dispersing agents, i.e., PAZO and PSSA, on the colloidal
stability of Ni-MWNTs and NiONTs. Dispersions in PAZO were prepared by dissolving 1
g L-1 of the substance in a 75% ethanol solution, followed by dispersing 4 g L-1 of the solid
material using the probe sonicator for 30 min. Dispersions in PSSA were prepared by
dissolving 1 g L-1 of the compound in a 60% ethanol solution, again followed by dispersing
of 4 g L-1 of the solid material and using the probe sonicator for 30 min. Both solutions
were diluted further to make stability measurements using DLS.
7.3.4 Characterization Methods
X-Ray Diffraction (XRD) analysis of samples was performed using a Bruker D8 Discover
instrument comprising a DavinciTM diffractometer operating at 35 kV and 45 mA using Co-
Kα radiation (λavg = 1.79026 Å). Bruker’s DIFFRAC.Eva V3.1 software was used for

Ph.D. Thesis – Ahmed M. Abdalla; McMaster University –Engineering Physics
141
qualitative analysis of the constituent phases. Scanning transmission and transmission
electron microscopy (dark field STEM/TEM) and energy dispersive X-ray (EDX)
spectroscopy were conducted with a JEOL 2010F field emission microscope. For
STEM/TEM, the samples were suspended in ethanol, dropped onto a TEM copper grid,
and then wicked off with a Kimwipe.
7.3.5 Electrochemical Performance Testing
Electrochemical characterization of the fabricated electrode was carried out using a
standard three-electrode system using a potentiostat (PARSTAT 2273, Princeton Applied
Research). The surface area of the working electrode was 1 cm2. The counter electrode was
a platinum gauze, and the reference electrode was a standard calomel electrode (SCE). The
characterization was conducted in 1 M KOH aqueous solutions using (i) cyclic
voltammetry (CV) and (ii) electrochemical impedance spectroscopy (EIS).
The CV measurements were performed within a 0–0.5 V potential range versus the
SCE as a reference electrode, and data recorded by PowerSuite electrochemical software.
The CVs were obtained at scan rates of 2-100 mV s−1. The charge Q was calculated based
on half of the integrated area of the CV curve. The integrated capacitance CS=Q/ΔVS was
determined by dividing Q by the width of the potential window ΔV and the electrode area
S. Alternating current measurements of complex impedance Z*=Z'–iZ'' were performed in
the frequency range 10 mHz to 100 kHz for a signal amplitude of 5 mV. The complex
differential capacitance CS*=CS'–iCS'' was determined from the impedance data through the
relation CS'=Z''/ω|Z|2S and CS''=Z'/ω|Z|2S, where ω=2πf and f denotes frequency.

Ph.D. Thesis – Ahmed M. Abdalla; McMaster University –Engineering Physics
142
7.4 Results and Discussion
7.4.1 Synthesis of NiONT: Characterization and Elemental Analyses
Figure 7.1b and 7.1c respectively present TEM images of the MWNT before and after
electroless deposition of a layer of nickel that encapsulates the MWNT. Comparison of the
images in Figures. 7.1b, 7.1c and 7.1d with their scale bars indicates that Ni deposition on
the MWNT at γ = 7 is ≈40-50 nm. Annealing of Ni-MWNT results in oxidation of both
nickel and carbon, which leaves a ≈50 nm tubular vacancy, as shown through the dark field
STEM image of a NiONT in Figure 7.1d.
Figure 7.2: XRD patterns for Ni-MWNTs and NiONTs for two different Ni:MWNT
weight ratios, i.e., γ = 1 and 7. The absence of diffraction peaks corresponding to MWNTs
and the appearance of a diffraction peak corresponding to nickel oxide after annealing
confirms the removal of carbon and oxidation of Ni to NiO.
The XRD analysis presented in Figure 7.2 confirms the existence of crystalline
nickel (Ni, PDF No. 00-004-0850) and hexagonal carbon (multiwalled carbon nanotubes,
Ph.D. Thesis – Ahmed M. Abdalla; McMaster University –Engineering Physics
143
PDF No. 00-058-1638) on Ni-MWNT samples for the two different Ni:MWNT weight
ratios γ = 1 and 7. Comparing the ratios of the intensities of the diffraction peaks for the Ni
(111) and (200) planes and likewise for the MWNT (002) and (004) planes for the two
samples shows how the amount of deposited nickel increases by increasing the Ni:MWNT
weight ratio. The XRD patterns for the annealed NiONT samples NiONT-1 and NiONT-2
confirm the absence of MWNTs and Ni, since these two materials are oxidized to CO2,
which is released, and NiO. Here, the diffraction peaks corresponding to nickel oxide (NiO,
PDF No. 01-089-3080) confirm the presence of NiONTs, supporting our hypothesis of the
formation of a crystalline nickel oxide phase.
Figure 7.3 presents dark field STEM images of the as-prepared NiONT for γ = 1
and 7. The STEM images for NiONT-1 (Figure 7.3, Panels a.1-a.5) show that both nickel
oxide nanotubes and nickel oxide agglomerates are present, creating porous structures. The
average outer diameter of the NiONTs is ≈60-80 nm, average inner diameter ≈30-40 nm
and average wall thickness ≈10-25 nm. The STEM images for NiONT-2 (Figure 7.3, Panels
b.1-b.5) show that NiO agglomeration is reduced. Here, the average NiONT outer diameter
≈160-180 nm, average inner diameter ≈60-80 nm, and average wall thickness ≈40-60 nm.
The thin and porous Ni coating (~10-25 nm) [19] on the MWNT for γ = 1 has relatively
low thermal stability so that it undergoes sintering during annealing [309, 310] into porous
microstructures, as shown in Figure 7.3, Panels a.1-a.2. This is also evident from the
morphology and the internal cavity in the NiONT-1 that are not smooth or continuous as
shown in Figure 7.3, Panels a.4-a.5. In contrast, for γ = 7, the thickness of the Ni layer
deposited on a MWNT is ≈40-60 nm [19], which is thermally more stable so that the tubular

Ph.D. Thesis – Ahmed M. Abdalla; McMaster University –Engineering Physics
144
shape of individual MWNTs is retained during annealing, as is evident from Figure 7.3,
Panel b. Additionally, the morphology and the internal cavity for NiONT-2 are smooth and
continuous as shown in Figure 7.3, Panels b.3-b.5. These images indicate that larger
NiONT agglomerates are produced when γ = 1 and more distinct tubular vacancies remain
when γ = 7.
Figure 7.3: TEM and STEM images of NiONT for two different Ni:MWNT weight ratio
γ = 1 and 7 at different magnifications. Panels a.1 and a.2 include TEM images and panels
a.3 & a.4 show dark field STEM images of NiONTs produced at γ = 1. Panels b.1 & b.2
likewise show TEM images and panels b.3 & b.4 dark field STEM images for NiONT
synthesized at γ = 7.
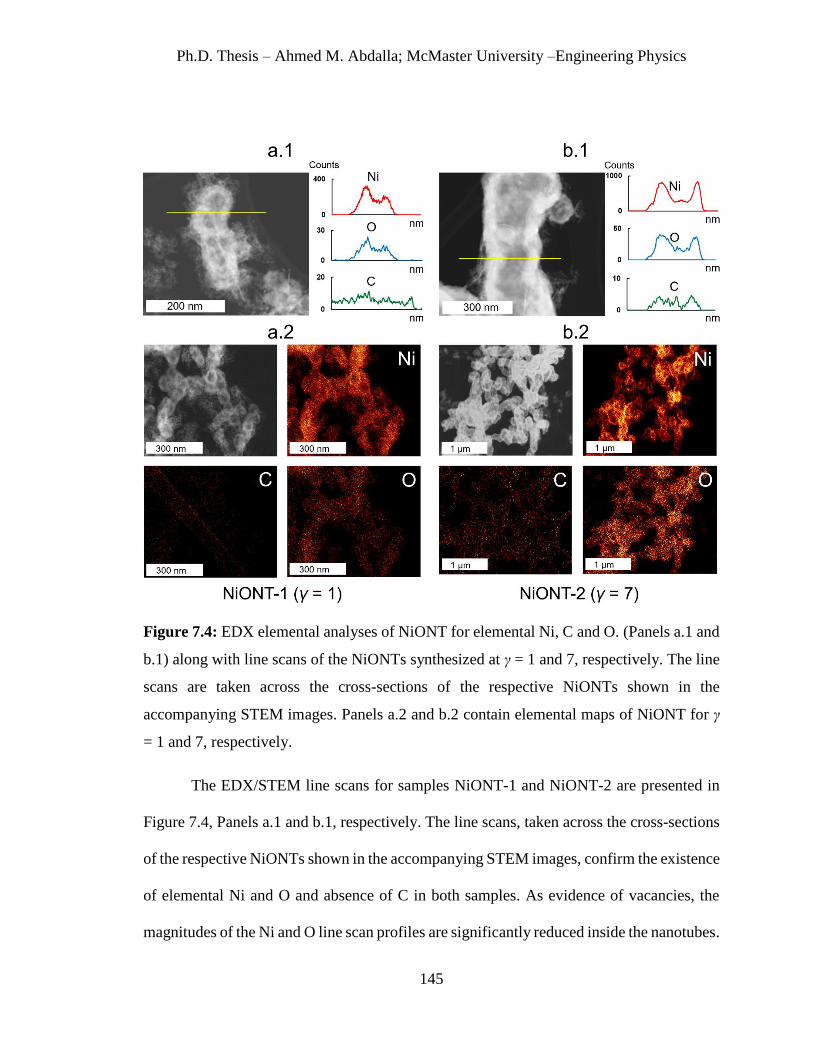
Ph.D. Thesis – Ahmed M. Abdalla; McMaster University –Engineering Physics
145
Figure 7.4: EDX elemental analyses of NiONT for elemental Ni, C and O. (Panels a.1 and
b.1) along with line scans of the NiONTs synthesized at γ = 1 and 7, respectively. The line
scans are taken across the cross-sections of the respective NiONTs shown in the
accompanying STEM images. Panels a.2 and b.2 contain elemental maps of NiONT for γ
= 1 and 7, respectively.
The EDX/STEM line scans for samples NiONT-1 and NiONT-2 are presented in
Figure 7.4, Panels a.1 and b.1, respectively. The line scans, taken across the cross-sections
of the respective NiONTs shown in the accompanying STEM images, confirm the existence
of elemental Ni and O and absence of C in both samples. As evidence of vacancies, the
magnitudes of the Ni and O line scan profiles are significantly reduced inside the nanotubes.
Ph.D. Thesis – Ahmed M. Abdalla; McMaster University –Engineering Physics
146
The EDX/STEM elemental mapping for NiONT-1 and NiONT-2 is presented in Figure 7.4,
Panels a.2 and b.2, respectively. These maps provide additional confirmation that while Ni
and O exist together outside the vacancies, there is a negligible amount of C in both
samples. The small indication of elemental C is attributed to the background lacey grid
used to hold the TEM samples.
7.4.2 Stability of the Colloidal Suspension
Chemical bonding of the dispersants to the particle surfaces is a prerequisite for efficient
dispersion. Previous investigations [311] have shown that charged molecules with
chelating ligands provide efficient dispersion of oxide nanoparticles. Since, molecules with
single chelating ligands lead to relatively weak interactions with a particle surface, efficient
dispersion of relatively large nanotubes requires stronger adsorption of a dispersant on a
particle surface, such as one containing multiple chelating ligands [312, 313].
The chelating polyelectrolyte, PAZO (Figure 7.5a) is a dispersing agent that was
recently employed for efficient dispersion and colloidal processing of nanoparticles [312,
313]. It is an anionic polyelectrolyte containing chelating monomers (Figure 7.5a). The
salicylate groups of such monomers provide multiple adsorption sites, facilitating strong
bonding to a particle surface. Figure 7.5b illustrates the bonding of a PAZO monomer,
which involves complexation of a metal atom on the particle surface. The creation of
multiple bonds leads to strong PAZO adsorption on nanoparticles of different types,
including oxides, hydroxides and metals. Therefore, PAZO is a promising material for the
dispersion of larger nanoparticles, such as NiONTs and Ni-MWNTs. Successful colloidal

Ph.D. Thesis – Ahmed M. Abdalla; McMaster University –Engineering Physics
147
processing of nanoparticles using PAZO has generated interest in the search for new
chelating polyelectrolytes and investigation of new bonding mechanisms, and PSSA
attracted our attention as a chelating polyelectrolyte. Its chelating properties are related to
carboxylic groups of PSSA monomers (Figure 7.5c). It is known that PSSA forms
complexes with metal ions in solutions [314-316]. The chelating mechanism involves two
carboxylic groups of each monomer [316]. We suggest that a similar mechanism leads to
the complexation of Ni atoms on the NiONT and Ni-MWNT surfaces (Figure 7.5d). We
also hypothesize that the multiple chelating bonds result in efficient adsorption of PSSA on
both materials, which is important for their co-dispersion, prevention of agglomeration and
improved mixing.
Figure 7.5: Chemical structures of (a) PAZO and (b) PSSA and corresponding adsorption
mechanisms involving complexation of (c) salicylate groups of PAZO and (d) carboxylic
groups of PSSA with Ni atoms on the surfaces of (c) Ni-MWNT and (d) NiONT.

Ph.D. Thesis – Ahmed M. Abdalla; McMaster University –Engineering Physics
148
Our aim is to fabricate a composite electrode with NiONTs (γ = 1 and 7) as the
active material and Ni-MWNTs (γ = 1) as the conductive additive and characterize its
electrochemical performance. The electrochemical performance of the electrode has a
strong dependence on the microstructure of the active material. Good dispersion and mixing
of the individual components in the composite active material are of critical importance for
the development of advanced electrodes. Therefore, we paid attention to the dispersion and
mixing of the individual components in the slurries, used for electrode fabrication.
We used Ni-MWNTs (γ = 1) only as the conductive additive, since their thin nickel
layer reduced the charge transfer length as well as the specific mass of the electrode. The
thin Ni layer allowed adsorption of PAZO and PSSA by mechanisms involving chelation
of surface Ni atoms (Figure 7.5c-d). A similar mechanism, involving the chelation of Ni
atoms on the NiONT surface allowed PAZO and PSSA to be adsorbed on the active
material. Six different suspensions were prepared for three materials, i.e., NiONT-1,
NiONT-2 and Ni-MWNT (γ = 1), with two dispersing agents, i.e. PAZO and PSSA, which
were subjected to sedimentation tests and DLS.
Sedimentation tests showed that the addition of PAZO or PSSA to Ni-MWNT and
NiONT suspensions resulted in improved suspension stability. Measurements of
electrophoretic mobility showed that Ni-MWNT and NiONT were negatively charged.
Figure 7.6 shows that the electrophoretic mobilities of Ni-MWNT ( = 1) in the suspensions
containing PAZO and PSSA were -0.40 and -0.82 mcms-1V-1, respectively. In addition,
NiONT-2 had higher electrophoretic mobility in both (PAZO and PSSA) suspensions (-

Ph.D. Thesis – Ahmed M. Abdalla; McMaster University –Engineering Physics
149
0.84 and -1.14 mcms-1V-1, respectively) than NiONT-1 (-0.67 and -0.91 mcms-1V-1,
respectively). The lower suspension stability of NiONT-1 is attributed to the formation of
a larger number of microscopic agglomerates, as discussed in section 7.4.1. Since fewer
tubular vacancies remain in the structure, there is a significant reduction in the surface area
to mass ratio, which reduces the suspension stability of these particles. Thus, NiONT-2 was
preferred over NiONT-1 for electrode fabrication.
Figure 7.6: Electrophoretic mobility of Ni-MWNTs (for γ = 1) and NiONTs (for γ = 1 and
7) with two dispersing agents, PAZO and PSSA.
The use of PSSA as a dispersant allowed for improved suspension stability and
higher electrophoretic mobility as compared to PAZO for all samples. The higher
dispersion and electrophoretic mobility for both Ni-MWNTs and NiONTs achieved with
PSSA is due to stronger PSSA adsorption on both types of nanoparticles. From the
perspective of polyelectrolyte adsorption, the chelating groups exert a strong influence on

Ph.D. Thesis – Ahmed M. Abdalla; McMaster University –Engineering Physics
150
polymer adsorption. The adsorbed polymer provides electrosteric dispersion of Ni-MWNT
and NiONT, which facilitates their improved mixing.
7.4.3 Electrochemical Performance
Based on the suspension tests results, the electrode was fabricated with NiONT-2 as the
active material, Ni-MWNT (γ = 1) as a conductive additive, and PSSA as dispersing agent.
A probe sonicator was used for 30 min to prepare a dispersion containing a 5 ml PSSA
solution (0.4 g L-1 in 60% ethanol solution), 2 ml PVB binder solution (0.75 g L-1 in 100%
ethanol solution), 40 mg NiONT (γ = 7), and 10 mg of Ni-MWNT (γ = 1). The prepared
colloidal dispersion was heated overnight at 60 °C until a dense slurry was obtained. This
slurry was used to impregnate the Ni foam current collector, which was dried thereafter in
air and subsequently pressed to 30% of its original thickness using a rolling press. The mass
of the impregnated material was 24.1 mg cm-2.
The prepared electrode was tested for the electrochemical performance using a
potentiostat. Figure 7.7a shows typical CV results at different scan rates. The shape of the
CVs in the selected voltage window of 0-0.5 V is similar to the corresponding literature
data for NiO composites prepared by other methods [282, 286, 289, 292, 305, 317]. The
gravimetric specific capacitance of 245.3 F g-1 is comparable with literature data for
electrodes containing a smaller active mass [282, 295, 306, 307, 317, 318]. It is important
to note that in our investigation the high gravimetric capacitance was achieved for
electrodes with a relatively high mass of 24.1 mg cm-2. As a result, we were able to realize
relatively high areal capacitance of 3.28 F cm-2 at a scan rate of 2 mV s-1.

Ph.D. Thesis – Ahmed M. Abdalla; McMaster University –Engineering Physics
151
Figure 7.7: (a) CVs at different scan rates, (b) Nyquist plot of complex impedance, (c) real
and (d) imaginary components of AC capacitance calculated from the impedance data
versus frequency for NiONT (80%) - Ni-MWNT (20%) composite electrodes with active
mass of 24.1 mg/cm2.
The complex impedance data for the electrodes is presented in Nyquist plot in
Figure 7.7b. The electrodes exhibited a relatively low resistance R=Z' (Figure 7.7b). The
relatively low Z'' resulted from a high capacitance. The components of complex AC
capacitance, calculated from the CV data and plotted versus frequency, showed a relaxation
type dispersion, as indicated by reduction in Cs' with increasing frequency and

Ph.D. Thesis – Ahmed M. Abdalla; McMaster University –Engineering Physics
152
corresponding relaxation maximum of Cs'' (Figure 7.7c and 7.7d). The low frequency
capacitance Cs', calculated from the impedance measurements is comparable with
capacitance Cs, obtained from CV data at a scan rate of 2 mV s-1.
7.5 Conclusion
We present a rapid method to synthesize NiONTs with different wall thicknesses, using
MWNTs as the sacrificial template. This method, which can be scaled for bulk synthesis,
is simpler and more cost effective than existing traditional methods that are intricate, time
consuming and mostly useful for producing small batches of material. The NiONTs
replicated the external dimensions of the MWNT template and their thickness varies with
Ni:MWNT ratio during electroless plating. However, fractals of nickel oxide agglomerates
are formed at a lower Ni:MWNT weight ratio of γ=1. The new chelating polyelectrolytes
exhibit good colloidal stability and efficient mixing of NiONTs and Ni-MWNTs. The
PSSA polyelectrolyte was more effective for stabilising both the Ni-MWNT and NiONT
dispersions. The use of advanced slurry formulations allowed electrodes with a relatively
high gravimetric capacitance of 245.3 F g-1 to be fabricated with high active mass loadings.
As a result, a high areal capacitance of 3.28 F cm-2 was achieved. Thus, we conclude that
our novel synthesis of NiONTs using sacrificial templates and the fabrication of electrodes
based on these materials are promising for the development of advanced energy storage
devices.

Ph.D. Thesis – Ahmed M. Abdalla; McMaster University –Engineering Physics
153
8. Summary and Future Work
8.1 Thesis Summary
Since the discovery of the CNTs in the last century, they have been recognized as important
engineering nanomaterials because of their superior physical properties. However, their
commercial use in large-scale applications is limited due to their high production cost.
Recently, several techniques have emerged to reduce both the production cost and synthesis
complexities. MWNTs, the cheapest available form of CNTs for commercial use suffer
from several key challenges that compromise their performance.
Commercially available MWNTs are produced in the form of powder containing
randomly oriented and entangled fragments, which are also restricted by their imperfect
anisotropic and non-polar behaviour. Here, an experimental investigation focussed on the
magnetization of MWNTs via different functionalization routes is conducted. Decorating
CNTs with magnetic nanoparticles (MNPs) not only expedites their organization with a
magnetic field, but also provides new hydrophilic and polar surfaces on the CNTs’ original
surfaces. This thesis demonstrates the efficacy of magnetized MWNTs over the
commercially available MWNTs.
Magnetization of MWNTs via covalent functionalization is examining for six
different routes of decorating MWNTs by in situ co-precipitation of magnetic
nanoparticles. Four of these six routes are newly reported here. Functionalization using
H2SO4 minimizes MWNT loss during synthesis and also yields a decoration density close

Ph.D. Thesis – Ahmed M. Abdalla; McMaster University –Engineering Physics
154
to unity. Although mixtures of HNO3 and H2SO4 are commonly employed, we found these
to inflict significant structural damage to MWNTs. The damage results in short MWNT
fragments, which are lost to the filtrate upon filtration. This loss of MWNTs can be as high
as ≈ 46% (w/w) and is accompanied with significant nanotube oxidation that has an oxygen
content up to 15.23%. Functionalization with either HNO3 or H2SO4 is much less
destructive than their mixtures with equal proportion. Despite considerable loss of
MWNTs, the filtration step is necessary as it removes remaining traces of acid from the
dispersion prior to co-precipitation. Elimination of the filtration step allows the acids to
react with iron ions to produce nonmagnetic byproducts that compromise the magnetization
of the MWNTs. Overall, (a) functionalizing with HNO3 or H2SO4, followed by (b)
filtration, (c) washing, (d) drying and (e) subsequent in situ coprecipitation of MNPs yields
the best quality MNPs, relatively high magnetized MWNTs (mMWNT) yield of ≈ 95%,
magnetization ratio close to an intended value of unity, reasonably uniform MNP
distribution on the mMWNT surfaces, and negligible MWNT shortening and damage.
MWNTs are decorated by in situ co-precipitation with different magnetic
nanoparticles (MNPs) for varying magnetization weight ratios γ (MNP:MWNT) in the
range of 1-2. The decoration of MWNTs with MNPs depends upon the availability of
activation sites on the outer surfaces of CNTs. The activation sites are completely utilized
when γ reaches a specific value. Typically γ =1 provides uniform decoration of MNPs and
minimum agglomeration. At a higher value of γ, although the number of MNPs exceeds the
activation sites, decoration still continues with nanoparticle agglomerating perpendicular
to the MWNT surface. The chemical composition of MNPs influences the magnetic
Ph.D. Thesis – Ahmed M. Abdalla; McMaster University –Engineering Physics
155
properties of mMWNTs. Fe3O4 with a high Curie temperature produces mMWNTs with
the highest magnetic saturation of Ms = 30.7 emu.g-1. These mMWNTs exhibit the weakest
sensitivity to a temperature increase of 60 K above 300 K with a corresponding reduction
of 7.7% in Ms. Mn0.2Cu0.2Zn0.6Fe2O4, and Cu0.4Zn0.6Fe2O4 MNPs have lower Curie
temperatures. Thus mMWNTs produced with these MNPs have lower Ms values (10.5 and
16.6 emu.g-1, respectively) and are more sensitive to a temperature increase (with up to
48.9% and 46.6% reductions in Ms).
The mMWNTs are successfully suspended to create novel and hitherto unreported
magnetoresponsive conductive colloids (MCCs) with moderate colloidal stability.
Synthesis of an MCC involves both the preparation of ferrofluids and of mMWNTs. Three
separate magnetoresponsive conductive colloids are prepared using the three different types
of MNPs (γ =1). All colloids have moderate suspension stability since their mean zeta
potential ζ ≈ -33 mV. Their electric conductivities of 150-170 mS.cm-1 are much higher
than the conductivity of the deionized water which is used as the dispersing medium and is
a poor conductor. The chemical composition of the MNPs decorating the MWNT
influences the electric conductivity of the respective MCC. For instance, increasing the
copper content in an MNP improves the electric conductivity. In summary, a novel
methodology to produce stable magnetoresponsive conductive colloidal suspensions with
tunable magnetic and electrical properties is provided. These colloidal suspensions are a
promising new class of material that could be used for applications where a magnetic
response, or action from a distance, must be coupled with a viable material electrical
conductivity.

Ph.D. Thesis – Ahmed M. Abdalla; McMaster University –Engineering Physics
156
By adapting MCC synthesis, a biological magnetic ink is produced that contains
Antibodies (Abs) that are immobilized on the surfaces of mMWNTs, which are dispersed
in DI water containing Tween 20 as bio-compatible surfactant. Bio-ink synthesis is
straightforward and does not involve the use of intermediate reagents. An applied magnetic
field dynamically organizes the magnetized and functionalized CNTs, printing them into
an electrically responsive strip that serves as a biosensor to detect specific Antigens (Ags).
Unlike previous methods, a magnet is not required during sensing, facilitating simple
integration of the sensor into an electric circuit. The sensor detects picomolar c-Myc
concentrations within a minute and distinguishes between c-Myc and BSA samples of
different concentrations through the change in the sensor current. The change, which occur
due to the specific Ab-Ag binding kinetics, in real time is larger at higher Ag
concentrations. The detection technique is simple, inexpensive and rapid as compared to
typical cyclic voltammogram analysis. Once the ink is synthesized, the time required to
fabricate the sensing strip is less than 5 minutes, excluding the ink drying time. Semi-
quantitative Ag detection with picomolar sensitivity occurs within a minute after a sample
is dispensed on the biosensor. This Bio-ink and sensor can be further tailored to detect
different Ags.
Magnetization of MWNTs via non-covalent functionalization is developed by
depositing nickel nanocrystals on MWNTs through electroless plating using a chemical
metal reduction method for different Ni:MWNT weight ratios γ = 1, 7, 14, and 30. Once Ni
deposits on palladium catalyst particles, it forms nanoclusters on the MWNT surfaces. With
increasing Ni content, neighboring nanoclusters merges to produce a continuous Ni coating

Ph.D. Thesis – Ahmed M. Abdalla; McMaster University –Engineering Physics
157
that completely encapsulates the MWNT. For larger γ, despite Ni coverage over the
palladium catalyst, deposition of Ni continues through autocatalysis by the deposited
nickel. The Ni-MWNT hybrid material (NiCH) contains encased MWNTs that are
connected by Ni networks. Increasing γ improves the metallic connections between plated
MWNTs so that the sparse MWNT network for γ = 1 becomes denser for γ = 14 with the
formation of microscale NiCH structures. In such structures, Ni forms a conductive metallic
matrix with MWNTs as the reinforcing filler material. The Ni-MWNT hybrid material with
γ = 1, and 7 have higher elastic modulus E ~ 18.3 and 58.7 GPa respectively than pure
MWNTs (E ~ 12.5 GPa), i.e., increasing γ enhances the elastic modulus. The magnetic
properties of the NiCH are superior to those of the original diamagnetic MWNTs (e.g., Ms
increases), and increases with γ. This electroless plating method is promising for improving
the mechanical and magnetic properties of MWNTs and thus reducing their electrical
resistance.
Ni-MWNT macrostructures with controlled morphologies using the NiCH are also
fabricated. Continuous nickel deposition on the Ni-MWNT (γ = 1) hybrid sample can either
result in vertically-aligned porous 3D macrostructures or horizontally-aligned hybrid
denser and flatter macrostructures. These macrostructures could be utilized for nano and
microscale filtration, as well as for printing electric circuits. The hydrophilic layer of nickel
enhances the Ni-MWNT dispersion, which was used to synthetize electrically conductive
inks by simply dispersing different concentrations of Ni-MWNT (γ = 7) samples in water.
An ink with 8% volume concentration has a relatively low electrical resistivity of 5.9 Ωm.

Ph.D. Thesis – Ahmed M. Abdalla; McMaster University –Engineering Physics
158
Using a magnet to print inks containing low Ni-MWNT concentrations reduced the electric
resistivity of the printed lines by 200-300Ωm than similar printed ones without the magnet.
The properties of nanocomposites are tailored by organizing nanoparticles within a
polymer matrix, e.g., for aerospace, automobile and infrastructure applications. Electroless
metal plating of commercially available MWNTs is a simple, direct, inexpensive and
scalable method to improve and tune the mechanical and electrical properties of a
nanocomposite. Since the resulting Ni-MWNTs are magnetic nanoparticles, an external
magnetic field is applied from a distance to align these nanoparticles within the
nanocomposite. These magnetized nanoparticles are introduced into an epoxy matrix at a
relatively low 0.25-1% volume fraction, where, they are aligned with the external magnetic
field along particular directions. Deposition of nickel over an MWNT improves the
interfacial bonding between the resulting Ni-MWNT hybrid nanoparticles and the
surrounding polymer matrix. This alignment enhances the properties of the composite, such
as its tensile strength, elastic modulus and AC electrical resistivity. By changing this
alignment, it becomes possible to tailor the properties of the resulting composite material.
The alignment imparts anisotropic properties to the bulk material, but when the
nanoparticles are aligned in perpendicular directions in two sequential layers, this coupled
orientation produces an effectively isotropic composite material.
The tensile strength of a nanocomposite containing 0.25% volume fraction of
aligned Ni-MWNTs is found to be ~9% higher than of pure epoxy and ~47% higher than
the composite containing a similar volume fraction of randomly dispersed nanoparticles.
Nanoparticle alignment reduces the variability in tensile strength measurements since the
Ph.D. Thesis – Ahmed M. Abdalla; McMaster University –Engineering Physics
159
dispersion homogeneity in different samples is improved along the direction of the
magnetic field. Nanocomposite with 0.25 vol% of aligned Ni-MWNTs, shows a ~40%
lower AC electric resistivity along the alignment direction than that of pure epoxy and
~20% lower than of the composite containing same volume fraction of randomly dispersed
nanoparticles. Alignment of anisotropic nanoparticles in multiple directions within a
polymer matrix to produce an effectively isotropic nanocomposite is demonstrated for the
first time. The AC electrical resistivity of an epoxy nanocomposite fabricated with 0.25
vol% Ni-MWNTs aligned in perpendicular directions in two sequential layers is effectively
isotropic and ~11.6% lower than that of the composite containing a similar fraction of
randomly dispersed Ni-MWNTs. Therefore, aligning Ni-MWNTs along multiple directions
enables tailoring of the physical properties of their epoxy composites, as well as their
direction-dependent bulk behaviour, which is potentially useful for many engineering
solutions.
Metal plated MWNTs are then used as a template to synthesize metal oxide
nanotubes (e.g. NiO) with different wall thicknesses, using MWNTs as the sacrificial
template. Since nickel oxide nanotubes (NiONT) applications are limited by the lack of
simple and low cost fabrication methods, a scalable method to overcome this limitation is
proposed. The MWNTs are encapsulated with Ni by depositing the metal through
electroless deposition to synthesize the Ni-MWNT hybrid material. These encapsulated
nanotubes are annealed in air at temperatures much lower than the melting temperature of
Ni (i.e. 500°c) so that both metal and carbon in MWNTs oxidizes to NiO and CO2
respectively. Release of the gaseous carbon dioxide results in a tubular vacancy where the
Ph.D. Thesis – Ahmed M. Abdalla; McMaster University –Engineering Physics
160
MWNTs previously existed. Thus, the residual NiO retains the shape of the (now oxidized)
underlying MWNT template, producing a NiONT. However, fractals of nickel oxide
agglomerates are formed at a lower Ni:MWNT weight ratio of γ=1. The wall thickness of
this nanotube may be controlled by varying the mass of Ni deposited, which could allow
control over the dimensions of the synthesized NiONTs.
The charge storage capacity of the NiONT-based electrode of an electrochemical
supercapacitor have been investigated. The electrode is fabricated with NiONTs as the
active material, nickel coated carbon nanotubes (Ni-MWNTs) as a conductive additive, and
a dispersing agent. A new chelating polyelectrolyte is used as the dispersing agent to
achieve high colloidal stability both for Ni-MWNTs and NiONTs. A relatively high
gravimetric specific capacitance of 245.3 F g-1 and areal capacitance of 3.28 F cm-2 is
achieved with a mass loading of 24.1 mg cm-2 which meets the requirement of practical
applications. Thus, the novel synthesis of NiONTs using sacrificial templates and the
fabrication of electrodes based on these materials are promising for the development of
advanced energy storage devices.
8.2 Future Work
Means to control and enhance the magnetization of MWNT via both covalent and non-
covalent functionalization have been investigated for some important engineering
applications (e.g. nanofluids, biosensors, nanocomposites, and supercapacitors). However,
significant future work is required for improving the synthesis methods.

Ph.D. Thesis – Ahmed M. Abdalla; McMaster University –Engineering Physics
161
These additional efforts should consider how covalent functionalization of CNTs
can be accomplished with other non-acid oxidizing agents to eliminate the hazards
associated with using large quantity of acids and their disposal. The suspension stability
and thermal conductivity of MCCs based on covalently magnetized CNTs must also be
investigated. For the biosensor, the MCCs must be adapted for different specific antibody-
antigen combinations. The binding kinetics of the antibodies over CNTs require detailed
investigation to enable semi-quantitative prediction of sensor sensitivity. The bio-ink needs
more attention for printing a continuous and stable sensing strip.
Non-covalent functionalization of CNTs requires further study to improve the
magnetic properties of the produced Ni:CNT hybrid nanomaterials. Heat treatment in a
controlled atmosphere to enhance the nickel crystallinity, changing the reducing agent to
prevent contamination with phosphorus, or replacing nickel with other ferromagnetic
metals could be different ways for future investigation. Further, utilizing a magnetic field
to control the growth of Ni:CNT hybrid nanomaterials into macrostructures requires more
attention, including the effect of using different complex configurations of the magnetic
field. These macro structure must be investigated for other novel applications.
The successful tailoring of both anisotropic and isotropic properties of bulk
polymeric composites utilizing multi-directional alignment of Ni-coated MWNT in
sequential layers should be further investigated. Other means to enhance the alignment to
better the composite material’s anisotropic behaviour should be pursued. Further, the effect
of alignment along several, say three or four directions, on the behaviour of the different
physical properties should be investigated. Modeling and experimental investigations

Ph.D. Thesis – Ahmed M. Abdalla; McMaster University –Engineering Physics
162
should be conducted in tandem to highlight the effect of the multi-directional alignment of
the Ni-MWNT fragments in multiple layers on the thermal conductivity of the bulk
material.
The successful synthesis of nickel oxide nanotubes based on MWNT as a sacrificial
templated utilizing the metal plating with nickel requires further verification of the same
concept with different metals (e.g. Cu, Fe, Au, and Ag). The technique should be developed
to synthesize either metal or metal oxide nanotubes on demand.

Ph.D. Thesis – Ahmed M. Abdalla; McMaster University –Engineering Physics
163
9. References
1. Gubin, S.P., Magnetic nanoparticles. 2009: John Wiley & Sons.
2. Cao, G., Nanostructures and nanomaterials: synthesis, properties and applications.
2004: World Scientific.
3. Reithmaier, J., et al., Nanostructured materials for advanced technological
applications. 2009: Springer Science & Business Media.
4. Simonis, M. and S. Schilthuizen, Nanotechnology: innovation opportunities for
tomorrows defence. 2009.
5. Scoville, C., et al., Carbon Nanotubes. Notes Lecture.
6. Coville, N.J., et al., A review of shaped carbon nanomaterials. South African
Journal of Science, 2011. 107(3-4): p. 01-15.
7. Kaushik, B.K. and M.K. Majumder, Carbon Nanotube Based VLSI Interconnects:
Analysis and Design. 2015: Springer.
8. Li, H., et al., Carbon nanomaterials for next-generation interconnects and passives:
physics, status, and prospects. IEEE Transactions on Electron Devices, 2009. 56(9):
p. 1799-1821.
9. Jariwala, D., et al., Carbon nanomaterials for electronics, optoelectronics,
photovoltaics, and sensing. Chemical Society Reviews, 2013. 42(7): p. 2824-2860.
10. Kamat, P., Carbon nanomaterials: Building blocks in energy conversion devices.
Interface, 2006. 15(1): p. 45-47.
11. Schwenke, A.M., S. Hoeppener, and U.S. Schubert, Synthesis and modification of
carbon nanomaterials utilizing microwave heating. Advanced Materials, 2015.
27(28): p. 4113-4141.
12. Popov, V.N., Carbon nanotubes: properties and application. Materials Science and
Engineering: R: Reports, 2004. 43(3): p. 61-102.
13. De Volder, M.F., et al., Carbon nanotubes: present and future commercial
applications. Science, 2013. 339(6119): p. 535-539.
14. Ciraci, S., et al., Functionalized carbon nanotubes and device applications. Journal
of Physics: Condensed Matter, 2004. 16(29): p. R901.
15. Chen, R.J., et al., Noncovalent functionalization of carbon nanotubes for highly
specific electronic biosensors. Proceedings of the National Academy of Sciences,
2003. 100(9): p. 4984-4989.
16. Atieh, M.A., Effect of functionalized carbon nanotubes with carboxylic functional
group on the mechanical and thermal properties of styrene butadiene rubber.
Fullerenes, Nanotubes and Carbon Nanostructures, 2011. 19(7): p. 617-627.
17. Abdalla, A.M., et al., Magnetoresponsive conductive colloidal suspensions with
magnetized carbon nanotubes. Journal of Magnetism and Magnetic Materials,
2017. 421: p. 292-299.
18. Abdalla, A.M., S. Ghosh, and I.K. Puri, Decorating carbon nanotubes with co-
precipitated magnetite nanocrystals. Diamond and Related Materials, 2016. 66: p.
90-97.

Ph.D. Thesis – Ahmed M. Abdalla; McMaster University –Engineering Physics
164
19. Abdalla, A.M., et al., Fabrication of nanoscale to macroscale nickel-nultiwall
carbon nanotube hybrid materials with tunable material properties. Materials
Research Express, 2016. 3(12): p. 125014.
20. Abdel Fattah, A.R., et al., Nickel Nanoparticles Entangled in Carbon Nanotubes:
Novel Ink for Nanotube Printing. ACS Applied Materials & Interfaces, 2016. 8(3):
p. 1589-1593.
21. Pisanello, F., et al., GHz properties of magnetophoretically aligned iron-oxide
nanoparticle doped polymers. ACS Appl Mater Interfaces, 2013. 5(8): p. 2908-14.
22. Shin, J., et al., Magnetic manipulation of bacterial magnetic nanoparticle-loaded
neurospheres. Integrative Biology, 2014. 6(5): p. 532-539.
23. Bonnemay, L., C. Hoffmann, and Z. Gueroui, Remote control of signaling pathways
using magnetic nanoparticles. Wiley Interdisciplinary Reviews: Nanomedicine and
Nanobiotechnology, 2015. 7(3): p. 342-354.
24. Gabayno, J.L.F., et al., Controlled manipulation of Fe 3 O 4 nanoparticles in an
oscillating magnetic field for fast ablation of microchannel occlusion. Nanoscale,
2015. 7(9): p. 3947-3953.
25. Yi, L., G. Yu, and X. Chenjie, Using magnetic nanoparticles to manipulate
biological objects. Chinese Physics B, 2013. 22(9): p. 097503.
26. Iijima, S., Helical microtubules of graphitic carbon. Nature, 1991. 354(6348): p.
56-58.
27. Iijima, S. and T. Ichihashi, Single-shell carbon nanotubes of 1-nm diameter. Nature,
1993. 363: p. 603-605.
28. Bethune, D., et al., Cobalt-catalysed growth of carbon nanotubes with single-
atomic-layer walls. Nature, 1993. 363: p. 505-507.
29. Dresselhaus, M.S., G. Dresselhaus, and P. Avouris, Carbon nanotubes: Synthesis,
structure, properties and applications S-Verlag Berlin, Heidelberg and New York,
2001: p. 12-25.
30. Wernik, J.M. and S.A. Meguid, Recent developments in multifunctional
nanocomposites using carbon nanotubes. Applied Mechanics Reviews, 2010.
63(5): p. 050801.
31. Varshney, K., Carbon nanotubes: a review on synthesis, properties and
applications. International Journal of Engineering Research, 2014. 2(4): p. 660-677.
32. Ren, Z., Y. Lan, and Y. Wang, Aligned carbon nanotubes: physics, concepts,
fabrication and devices. 2012: Springer Science & Business Media.
33. Jorio, A., G. Dresselhaus, and M.S. Dresselhaus, Carbon nanotubes: Advanced
topics in the synthesis, structure, properties and applications. Topics in applied
physics. 2008: Springer.
34. Saito, R., G. Dresselhaus, and M.S. Dresselhaus, Physical properties of carbon
nanotubes. Vol. 35. 1998: World Scientific.
35. Gou, J. and K. Lau, Modeling and simulation of carbon nanotube/polymer
composites. A chapter in the handbook of theoretical and computational
nanotechnology. American Scientific Publishers in, 2005: p. 20051-58883.
36. Sinha, N., J. Ma, and J.T. Yeow, Carbon nanotube-based sensors. Journal of
Nanoscience and Nanotechnology, 2006. 6(3): p. 573-590.

Ph.D. Thesis – Ahmed M. Abdalla; McMaster University –Engineering Physics
165
37. Mahar, B., et al., Development of carbon nanotube-based sensors—a review.
Sensors Journal, IEEE, 2007. 7(2): p. 266-284.
38. Antiohos, D., et al., Carbon nanotubes for energy applications. Syntheses and
Applications of Carbon Nanotubes and Their Composites, 2013: p. 496-534.
39. Dhavle, J., Carbon nanotubes' use in energy storage. Storage4, 2013.
40. Popov, V.N. and P. Lambin, Carbon nanotubes: from basic research to
nanotechnology. Vol. 222. 2006: Springer Science & Business Media.
41. Peng, L.-M., Z. Zhang, and S. Wang, Carbon nanotube electronics: recent
advances. Materials Today, 2014. 17(9): p. 433-442.
42. Szabó, A., et al., Synthesis methods of carbon nanotubes and related materials.
Materials, 2010. 3(5): p. 3092-3140.
43. Park, S., et al., Carbon nanosyringe array as a platform for intracellular delivery.
Nano Letters, 2009. 9(4): p. 1325-1329.
44. Sinha, N. and J.T. Yeow, Carbon nanotubes for biomedical applications.
NanoBioscience, IEEE Transactions on, 2005. 4(2): p. 180-195.
45. Zhu, Y., C. Xu, and L. Wang, Carbon nanotubes in biomedicine and biosensing.
2011: INTECH Open Access Publisher.
46. Shao, W., et al., Carbon nanotubes for use in medicine: Potentials and limitations.
Syntheses and Applications of Carbon Nanotubes and Their Composites. Croatia:
InTech, 2013: p. 285-311.
47. Ando, Y. and X. Zhao, Synthesis of carbon nanotubes by arc-discharge method.
New Diamond and Frontier Carbon Technology, 2006. 16(3): p. 123-138.
48. Rafique, M.M.A. and J. Iqbal, Production of carbon nanotubes by different routes-
a review. Journal of Encapsulation and Adsorption Sciences, 2011. 1(02): p. 29.
49. Prasek, J., et al., Chemical Vapor Depositions for Carbon Nanotubes Synthesis.
2013, Nova Science Publishers. p. 87-106.
50. Terranova, M.L., V. Sessa, and M. Rossi, The world of carbon nanotubes: an
overview of CVD growth methodologies. Chemical Vapor Deposition, 2006. 12(6):
p. 315-325.
51. Yokomichi, H., et al., Morphology of carbon nanotubes synthesized by thermal
CVD under high magnetic field up to 10T. Vacuum, 2008. 83(3): p. 625-628.
52. O’connell, M.J., Carbon nanotubes: properties and applications. 2006: CRC press.
53. Choudhary, V. and A. Gupta, Polymer/carbon nanotube nanocomposites. Carbon
Nanotubes-Polymer Nanocomposites, 2011: p. 65-90.
54. Goh, P., A. Ismail, and B. Ng, Directional alignment of carbon nanotubes in
polymer matrices: contemporary approaches and future advances. Composites Part
A: Applied Science and Manufacturing, 2014. 56: p. 103-126.
55. Kimura, T., et al., Polymer composites of carbon nanotubes aligned by a magnetic
field. Advanced Materials, 2002. 14(19): p. 1380-1383.
56. Du, J., J. Bai, and H. Cheng, The present status and key problems of carbon
nanotube based polymer composites. Express Polymer Letters, 2007. 1(5): p. 253-
273.
57. Ovchinnikov, A.A., Giant diamagnetism of carbon nanotubes. Physics Letters A,
1994. 195(1): p. 95-96.

Ph.D. Thesis – Ahmed M. Abdalla; McMaster University –Engineering Physics
166
58. Kim, Y., et al., High-purity diamagnetic single-wall carbon nanotube buckypaper.
Chemistry of Materials, 2007. 19(12): p. 2982-2986.
59. Lu, S.H., et al., Improved hydrophobicity of carbon nanotube arrays with
micropatterning. Langmuir, 2009. 25(21): p. 12806-12811.
60. Homma, Y., et al., Photoluminescence measurements and molecular dynamics
simulations of water adsorption on the hydrophobic surface of a carbon nanotube
in water vapor. Physical Review Letters, 2013. 110(15): p. 157402.
61. Naseh, M.V., et al., Functionalization of carbon nanotubes using nitric acid
oxidation and DBD plasma. World Academy of Science, Engineering and
Technology, 2009. 49: p. 177-179.
62. Meng, L., C. Fu, and Q. Lu, Advanced technology for functionalization of carbon
nanotubes. Progress in Natural Science, 2009. 19(7): p. 801-810.
63. Yang, F., et al., Magnetic functionalised carbon nanotubes as drug vehicles for
cancer lymph node metastasis treatment. European Journal of Cancer, 2011.
47(12): p. 1873-1882.
64. Chen, L., H. Xie, and W. Yu, Functionalization methods of carbon nanotubes and
its applications. 2011: INTECH Open Access Publisher.
65. Balasubramanian, K. and M. Burghard, Chemically functionalized carbon
nanotubes. Small, 2005. 1(2): p. 180-192.
66. Ma, P.-C., et al., Dispersion and functionalization of carbon nanotubes for polymer-
based nanocomposites: a review. Composites Part A: Applied Science and
Manufacturing, 2010. 41(10): p. 1345-1367.
67. Wei, X. and D.K. Roper, Tin sensitization for electroless plating review. Journal of
The Electrochemical Society, 2014. 161(5): p. D235-D242.
68. Worsley, K.A., et al., Functionalization and dissolution of nitric acid treated single-
walled carbon nanotubes. Journal of the American Chemical Society, 2009.
131(50): p. 18153-18158.
69. Ahmed, D.S., A.J. Haider, and M. Mohammad, Comparesion of functionalization
of multi-Walled carbon nanotubes treated by oil olive and nitric acid and their
characterization. Energy Procedia, 2013. 36: p. 1111-1118.
70. Tchoul, M.N., et al., Effect of mild nitric acid oxidation on dispersability, size, and
structure of single-walled carbon nanotubes. Chemistry of Materials, 2007. 19(23):
p. 5765-5772.
71. Datsyuk, V., et al., Chemical oxidation of multiwalled carbon nanotubes. Carbon,
2008. 46(6): p. 833-840.
72. Kanai, Y., et al., Atomistic oxidation mechanism of a carbon nanotube in nitric acid.
Physical Review Letters, 2010. 104(6): p. 066401.
73. Zhang, H., et al., Functionalization of multi-walled carbon nanotubes via surface
unpaired electrons. Nanotechnology, 2010. 21(8): p. 085706.
74. Ngo, C.L., et al., Surface modification and functionalization of carbon nanotube
with some organic compounds. Advances in Natural Sciences: Nanoscience and
Nanotechnology, 2013. 4(3): p. 035017.
Ph.D. Thesis – Ahmed M. Abdalla; McMaster University –Engineering Physics
167
75. Chusuei, C.C. and M. Wayu, Characterizing functionalized carbon nanotubes for
improved fabrication in aqueous solution environments. 2011: INTECH Open
Access Publisher.
76. Baykal, A., et al., Acid functionalized multiwall carbon nanotube/magnetite
(MWCNT)-COOH/Fe3O4 hybrid: synthesis, characterization and conductivity
evaluation. Journal of Inorganic and Organometallic Polymers and Materials, 2013.
23(3): p. 726-735.
77. Scheibe, B., E. Borowiak-Palen, and R.J. Kalenczuk, Oxidation and reduction of
multiwalled carbon nanotubes—preparation and characterization. Materials
Characterization, 2010. 61(2): p. 185-191.
78. Ngoy, J.M., et al., Covalent functionalization for multi-walled carbon nanotube (f-
MWCNT)-folic acid bound bioconjugate. Journal of Applied Sciences, 2011.
11(15): p. 2700-2711.
79. Shojaosadati, S., et al., Effect of different CNT’s oxidation methods on thiocoline
detection by surfactant modified graphite electrodes. International Journal of
Nanoscience and Nanotechnology, 2010. 6(4): p. 195-204.
80. Sánchez, A., et al., Functionalization of carbon nanotubes and polymer
compatibility studies. Journal of Materials Science Research, 2014. 3(1): p. 1.
81. Lin, T., et al., Chemistry of carbon nanotubes. Australian Journal of Chemistry,
2003. 56(7): p. 635-651.
82. Atieh, M.A., et al., Effect of carboxylic functional group functionalized on carbon
nanotubes surface on the removal of lead from water. Bioinorganic Chemistry and
Applications, 2011. 2010.
83. Griffiths, D.J. and R. College, Introduction to electrodynamics. Vol. 3. 1999:
prentice Hall Upper Saddle River, NJ.
84. Tauxe, L., et al., Essentials of Paleomagnetism, Third Web Edition. 2014.
85. Stöhr, J. and H.C. Siegmann, Magnetism. Solid-State Sciences. Springer, Berlin,
Heidelberg, 2006. 5.
86. Dionne, G.F., Magnetic oxides. Vol. 14. 2009: Springer.
87. Stefanita, C.-G., Magnetism: Basics and applications. 2012: Springer Science &
Business Media, .
88. Getzlaff, M., Fundamentals of magnetism. 2007: Springer Science & Business
Media.
89. Goldman, A., Modern ferrite technology. 2006: Springer Science & Business
Media.
90. Frenkel, J. and J. Dorfman, Spontaneous and induced magnetisation in
ferromagnetic bodies. Nature, 1930. 126(3173): p. 274-275.
91. Akbarzadeh, A., M. Samiei, and S. Davaran, Magnetic nanoparticles: preparation,
physical properties, and applications in biomedicine. Nanoscale Research Letters,
2012. 7(1): p. 1-13.
92. Bean, C. and J. Livingston, Superparamagnetism. Journal of Applied Physics,
1959. 30(4): p. S120-S129.

Ph.D. Thesis – Ahmed M. Abdalla; McMaster University –Engineering Physics
168
93. Issa, B., et al., Magnetic nanoparticles: surface effects and properties related to
biomedicine applications. International Journal of Molecular Sciences, 2013.
14(11): p. 21266-21305.
94. Vatta, L.L., R.D. Sanderson, and K.R. Koch, Magnetic nanoparticles: Properties
and potential applications. Pure and Applied Chemistry, 2006. 78(9): p. 1793-1801.
95. Ghosh, S. and I.K. Puri, Soft polymer magnetic nanocomposites: microstructure
patterning by magnetophoretic transport and self-assembly. Soft Matter, 2013.
9(6): p. 2024-2029.
96. Ghosh, S., et al., Patterning the stiffness of elastomeric nanocomposites by
magnetophoretic control of cross-linking impeder distribution. Materials, 2015.
8(2): p. 474-485.
97. Jagannatham, M., S. Sankaran, and H. Prathap, Electroless nickel plating of arc
discharge synthesized carbon nanotubes for metal matrix composites. Applied
Surface Science, 2015. 324: p. 475-481.
98. Velasco-Santos, C., A. Martinez-Hernandez, and V. Castano, Carbon nanotube-
polymer nanocomposites: The role of interfaces. Composite Interfaces, 2005. 11(8-
9): p. 567-586.
99. Mahanthesha, P., C. Srinivasa, and G. Mohankumar, Processing and
characterization of carbon nanotubes decorated with pure electroless nickel and
their magnetic properties. Procedia Materials Science, 2014. 5: p. 883-890.
100. Liebau, M., et al., Contact improvement of carbon nanotubes via electroless nickel
deposition. Applied Physics A, 2003. 77(6): p. 731-734.
101. Gong, J.-L., et al., Removal of cationic dyes from aqueous solution using magnetic
multi-wall carbon nanotube nanocomposite as adsorbent. Journal of Hazardous
Materials, 2009. 164(2): p. 1517-1522.
102. Fazelirad, H., et al., Preparation of magnetic multi-walled carbon nanotubes for an
efficient adsorption and spectrophotometric determination of amoxicillin. Journal
of Industrial and Engineering Chemistry, 2015. 21: p. 889-892.
103. Tarigh, G.D. and F. Shemirani, Magnetic multi-wall carbon nanotube
nanocomposite as an adsorbent for preconcentration and determination of lead (II)
and manganese (II) in various matrices. Talanta, 2013. 115: p. 744-750.
104. Chen, C., et al., Functionalization and magnetization of carbon nanotubes using
Co-60 gamma-ray irradiation. Journal of Magnetism and Magnetic Materials,
2014. 367: p. 47-52.
105. Huang, Y., et al., Optimization and evaluation of chelerythrine nanoparticles
composed of magnetic multiwalled carbon nanotubes by response surface
methodology. Applied Surface Science, 2014. 292: p. 378-386.
106. Wang, Z., et al., Magnetite nanocrystals on multiwalled carbon nanotubes as a
synergistic microwave absorber. The Journal of Physical Chemistry C, 2013.
117(10): p. 5446-5452.
107. Ghasemi, A., et al., Enhanced reflection loss characteristics of substituted barium
ferrite/functionalized multi-walled carbon nanotube nanocomposites. Journal of
Applied Physics, 2011. 109(7): p. 07A507.

Ph.D. Thesis – Ahmed M. Abdalla; McMaster University –Engineering Physics
169
108. Sarkar, D., et al., Enhanced broadband microwave reflection loss of carbon
nanotube ensheathed Ni–Zn–Co-ferrite magnetic nanoparticles. Materials Letters,
2014. 120: p. 259-262.
109. Weissker, U., et al., Carbon nanotubes filled with ferromagnetic materials.
Materials, 2010. 3(8): p. 4387-4427.
110. Sameera, I., R. Bhatia, and V. Prasad, Characterization and magnetic response of
multiwall carbon nanotubes filled with iron nanoparticles of different aspect ratios.
Physica E: Low-dimensional Systems and Nanostructures, 2013. 52: p. 1-7.
111. Hayashi, Y., et al., Growth and nanoscale magnetic properties of ferromagnetic
nanowire encapsulated inside carbon nanotubes. Magnetics, IEEE Transactions on,
2009. 45(6): p. 2488-2491.
112. Wang, S.-F., et al., Magnetic and electronic properties of a single iron atomic chain
encapsulated in carbon nanotubes: A first-principles study. Journal of Molecular
Structure: THEOCHEM, 2010. 962(1): p. 108-112.
113. Kaneko, T., et al., Magnetic property of FePt nanoparticles encaged in carbon
nanotubes. Vacuum, 2013. 87: p. 187-190.
114. Masotti, A. and A. Caporali, Preparation of magnetic carbon nanotubes (Mag-
CNTs) for biomedical and biotechnological applications. International Journal of
Molecular Sciences, 2013. 14(12): p. 24619-24642.
115. John, A.R. and P. Arumugam, Studies on structural and magnetic properties of
pristine and nickel-filled carbon nanotubes synthesized using LaNi 5 alloy particles
as a catalyst. Chemical Engineering Journal, 2014. 243: p. 436-447.
116. Munoz-Sandoval, E., et al., Synthesis, characterization and magnetic properties of
Co@ Au core-shell nanoparticles encapsulated by nitrogen-doped multiwall
carbon nanotubes. Carbon, 2014. 77: p. 722-737.
117. Qi, X., et al., Controllable synthesis, characterization, and magnetic properties of
magnetic nanoparticles encapsulated in carbon nanocages and carbon nanotubes.
Diamond and Related Materials, 2014. 45: p. 12-19.
118. Korneva, G., et al., Carbon nanotubes loaded with magnetic particles. Nano
Letters, 2005. 5(5): p. 879-884.
119. Kopyl, S., et al., Filling carbon nanotubes with magnetic particles. Journal of
Materials Chemistry C, 2013. 1(16): p. 2860-2866.
120. Kopyl, S., et al., FMR study of carbon nanotubes filled with Fe3O4 nanoparticles.
Journal of Magnetism and Magnetic Materials, 2014. 358: p. 44-49.
121. Demir, A., et al., Low temperature magnetic investigation of Fe3O4 nanoparticles
filled into multiwalled carbon nanotubes. Synthetic Metals, 2014. 187: p. 75-80.
122. Kim, K., et al., Formation and surface modification of Fe3O4 nanoparticles by co-
precipitation and sol-gel method. Journal of Industrial and Engineering Chemistry-
Seoul, 2007. 13(7): p. 1137.
123. Fun Chin, S. and K. Swaminathan Iyer, Fabrication of carbon nano-tubes
decorated with ultra fine superparamagnetic nano-particles under continuous flow
conditions. Lab on a Chip, 2008. 8(3): p. 439-442.
124. Yan, L., et al., Characterization of magnetic guar gum-grafted carbon nanotubes
and the adsorption of the dyes. Carbohydrate Polymers, 2012. 87(3): p. 1919-1924.

Ph.D. Thesis – Ahmed M. Abdalla; McMaster University –Engineering Physics
170
125. Xiao, D., et al., Development of novel molecularly imprinted magnetic solid-phase
extraction materials based on magnetic carbon nanotubes and their application for
the determination of gatifloxacin in serum samples coupled with high performance
liquid chromatography. Journal of Chromatography A, 2013. 1274: p. 44-53.
126. Yu, P., et al., Polyethylene glycol modified magnetic carbon nanotubes as
nanosorbents for the determination of methylprednisolone in rat plasma by high
performance liquid chromatography. Journal of Chromatography A, 2014. 1348: p.
27-33.
127. Sowichai, K., et al., Facile method to prepare magnetic multi-walled carbon
nanotubes by in situ co-precipitation route. Journal of Industrial and Engineering
Chemistry, 2012. 18(5): p. 1568-1571.
128. Zarei, H., et al., Magnetic nanocomposite of anti-human IgG/COOH–multiwalled
carbon nanotubes/Fe3 O4 as a platform for electrochemical immunoassay.
Analytical Biochemistry, 2012. 421(2): p. 446-453.
129. Romero, V., et al., In situ ultrasound-assisted synthesis of Fe3O4 nanoparticles with
simultaneous ion co-precipitation for multielemental analysis of natural waters by
total reflection X-ray fluorescence spectrometry. Journal of Analytical Atomic
Spectrometry, 2013. 28(6): p. 923-933.
130. Mendoza-Bello, S., et al., Size-controlled synthesis of Fe2O3 and Fe3O4
nanoparticles onto zeolite by means of a modified activated-coprecipitation
method: effect of the HCl concentration during the activation. Journal of
Nanoparticle Research, 2012. 14(11): p. 1-9.
131. Mascolo, M.C., Y. Pei, and T.A. Ring, Room temperature co-precipitation
synthesis of magnetite nanoparticles in a large pH window with different bases.
Materials, 2013. 6(12): p. 5549-5567.
132. Wei, Y., et al., Synthesis of Fe3O4 nanoparticles and their magnetic properties.
Procedia Engineering, 2012. 27: p. 632-637.
133. Wu, S., et al., Fe3O4 magnetic nanoparticles synthesis from tailings by ultrasonic
chemical co-precipitation. Materials Letters, 2011. 65(12): p. 1882-1884.
134. Kim, I.T. and R. Tannenbaum, Magnetic carbon nanotubes: Synthesis,
characterization, and anisotropic electrical properties. 2011: INTECH Open
Access Publisher.
135. Zhao, W., et al., Magnetic nanoparticles decorated multi-walled carbon nanotubes
by bio-inspired poly (dopamine) surface functionalization. Synthetic Metals, 2013.
169: p. 59-63.
136. Zhang, Q., et al., Synthesis and characterization of carbon nanotubes decorated
with manganese–zinc ferrite nanospheres. Materials Chemistry and Physics, 2009.
116(2): p. 658-662.
137. Ali, S.D., S.T. Hussain, and S.R. Gilani, Synthesis, characterization and magnetic
properties of carbon nanotubes decorated with magnetic M II Fe 2 O 4 nanoparticles.
Applied Surface Science, 2013. 271: p. 118-124.
138. Gabal, M., et al., MWCNTs decorated Mn0.8Zn0.2Fe2O4 :Synthesis, characterization
and compositional effect on the structural and magnetic properties. Journal of
Magnetism and Magnetic Materials, 2015. 374: p. 230-237.
Ph.D. Thesis – Ahmed M. Abdalla; McMaster University –Engineering Physics
171
139. Bittencourt, C., et al., Decorating carbon nanotubes with nickel nanoparticles.
Chemical Physics Letters, 2007. 436(4): p. 368-372.
140. Li, Q., et al., Coating of carbon nanotube with nickel by electroless plating method.
Japanese Journal of Applied Physics Part 2 Letters, 1997. 36: p. L501-L503.
141. Bak, S.-M., et al., Mesoporous nickel/carbon nanotube hybrid material prepared
by electroless deposition. Journal of Materials Chemistry, 2011. 21(6): p. 1984-
1990.
142. Ellis, A., et al., Magnetic properties of electroless nickel-phosphorus coated multi-
walled carbon nanotubes. Carbon-Science and Technology, 2008. 1(1): p. 13-18.
143. Singh, N.B., B. Bhattacharya, and U. Sarkar, Nickel decorated single-wall carbon
nanotube as CO Sensor. Soft Nanoscience Letters, 2013. 3(04): p. 9.
144. Arai, S., et al., Pure-nickel-coated multiwalled carbon nanotubes prepared by
electroless deposition. Electrochemical and Solid-State Letters, 2010. 13(12): p.
D94-D96.
145. Dobrzański, L., et al., Synthesis and characterization of carbon nanotubes
decorated with platinum nanoparticles. Journal of Achievements in Materials and
Manufacturing Engineering, 2010. 39(2): p. 184-189.
146. Choi, W.-K., et al., Electromagnetic interference shielding effectiveness of
electroless nickel-plated MWCNTs/CFs-reinforced HDPE matrix composites. Bull.
Korean Chem. Soc, 2014. 35(2): p. 597.
147. Arai, S., et al., Nickel-coated carbon nanofibers prepared by electroless deposition.
Electrochemistry Communications, 2004. 6(10): p. 1029-1031.
148. Schlesinger, M., Electroless deposition of nickel. Modern Electroplating, 2000. 4:
p. 667-684.
149. Wang, F., S. Arai, and M. Endo, The preparation of multi-walled carbon nanotubes
with a Ni–P coating by an electroless deposition process. Carbon, 2005. 43(8): p.
1716-1721.
150. Mallory, G.O. and J.B. Hajdu, Electroless plating: fundamentals and applications.
1990: William Andrew, .
151. Sarojini, K.K., et al., Electrical conductivity of ceramic and metallic nanofluids.
Colloids and Surfaces A: Physicochemical and Engineering Aspects, 2013. 417: p.
39-46.
152. Wang, J., et al., Heat transfer and pressure drop of nanofluids containing carbon
nanotubes in laminar flows. Experimental Thermal and Fluid Science, 2013. 44: p.
716-721.
153. Wan, M., et al., Temperature dependent heat transfer performance of multi-walled
carbon nanotube-based aqueous nanofluids at very low particle loadings. Johnson
Matthey Technology Review, 2015. 59(3): p. 199-206.
154. Glover, B., et al., Effective electrical conductivity of functional single-wall carbon
nanotubes in aqueous fluids. Synthetic Metals, 2008. 158(12): p. 506-508.
155. Salazar, P.F., et al., Enhanced electrical conductivity of imidazolium-based ionic
liquids mixed with carbon nanotubes: a spectroscopic study. Journal of The
Electrochemical Society, 2014. 161(9): p. H481-H486.

Ph.D. Thesis – Ahmed M. Abdalla; McMaster University –Engineering Physics
172
156. Xue, Q.-Z., Model for effective thermal conductivity of nanofluids. Physics Letters
A, 2003. 307(5): p. 313-317.
157. Strauss, M.T. and R.L. Pober, Nanotubes in liquids: Effective thermal conductivity.
Journal of Applied Physics, 2006. 100(8): p. 084328.
158. Vaisman, L., H.D. Wagner, and G. Marom, The role of surfactants in dispersion of
carbon nanotubes. Advances in Colloid and Interface Science, 2006. 128: p. 37-46.
159. Sadri, R., et al., An experimental study on thermal conductivity and viscosity of
nanofluids containing carbon nanotubes. Nanoscale Research Letters, 2014. 9(1):
p. 1-16.
160. Eapen, J., et al., The classical nature of thermal conduction in nanofluids. Journal
of Heat Transfer, 2010. 132(10): p. 102402.
161. Kraynov, A. and T.E. Müller, Concepts for the stabilization of metal nanoparticles
in ionic liquids. 2011: INTECH Open Access Publisher.
162. Berger, P., et al., Preparation and properties of an aqueous ferrofluid. Journal of
Chemical Education, 1999. 76(7): p. 943.
163. Fonseca, M.A., et al., Carbon nanotubes in a fluidic medium: Critical analysis.
2013: INTECH Open Access Publisher.
164. Hilding, J., et al., Dispersion of carbon nanotubes in liquids. Journal of Dispersion
Science and Technology, 2003. 24(1): p. 1-41.
165. Scherer, C. and A.M. Figueiredo Neto, Ferrofluids: properties and applications.
Brazilian Journal of Physics, 2005. 35(3A): p. 718-727.
166. Mehta, R. and R. Upadhyay, Science and technology of ferrofluids. Current Science,
1999. 76(3): p. 305-312.
167. Samouhos, S. and G. McKinley, Carbon nanotube–magnetite composites, with
applications to developing unique magnetorheological fluids. Journal of Fluids
Engineering, 2007. 129(4): p. 429-437.
168. Moaseri, E., et al., Improvements in mechanical properties of multi-walled carbon
nanotube-reinforced epoxy composites through novel magnetic-assisted method for
alignment of carbon nanotubes. Composites Part A: Applied Science and
Manufacturing, 2014. 64: p. 228-233.
169. Cadek, M., et al., Morphological and mechanical properties of carbon-nanotube-
reinforced semicrystalline and amorphous polymer composites. Applied Physics
Letters, 2002. 81(27): p. 5123-5125.
170. Biercuk, M., et al., Carbon nanotube composites for thermal management. Applied
Physics Letters, 2002. 80(15): p. 2767-2769.
171. Choi, E., et al., Enhancement of thermal and electrical properties of carbon
nanotube polymer composites by magnetic field processing. Journal of Applied
physics, 2003. 94(9): p. 6034-6039.
172. Correa-Duarte, M.A., et al., Alignment of carbon nanotubes under low magnetic
fields through attachment of magnetic nanoparticles. The Journal of Physical
Chemistry B, 2005. 109(41): p. 19060-19063.
173. Park, C., et al., Aligned single‐wall carbon nanotube polymer composites using an
electric field. Journal of Polymer Science Part B: Polymer Physics, 2006. 44(12):
p. 1751-1762.

Ph.D. Thesis – Ahmed M. Abdalla; McMaster University –Engineering Physics
173
174. Kim, I.T., A. Tannenbaum, and R. Tannenbaum, Anisotropic conductivity of
magnetic carbon nanotubes embedded in epoxy matrices. Carbon, 2011. 49(1): p.
54-61.
175. Sathyanarayana, S. and C. Hübner, Thermoplastic nanocomposites with carbon
nanotubes, in Structural Nanocomposites. 2013, Springer. p. 19-60.
176. Das, A., et al., Magnetite (Fe3O4)-filled carbon nanofibers as electro-
conducting/superparamagnetic nanohybrids and their multifunctional polymer
composites. Journal of Nanoparticle Research, 2015. 17(1): p. 1-14.
177. Song, W., et al., The decoration of multi-walled carbon nanotubes with metal
nanoparticles of uniform size using MeV electron beam irradiation. Carbon, 2011.
49(5): p. 1692-1698.
178. Li, X., et al., Effect of sensitizing and activating pretreatment on the electroless
plated MWCNTS, in International Conference on Composite Materials. 2011: Jeju
Island, Korea.
179. Pistone, A., et al., Synthesis and magnetic properties of multiwalled carbon
nanotubes decorated with magnetite nanoparticles. Physica B: Condensed Matter,
2014. 435: p. 88-91.
180. Chin, S.F., K.S. Iyer, and C.L. Raston, Fabrication of carbon nano-tubes decorated
with ultra fine superparamagnetic nano-particles under continuous flow
conditions. Lab on a Chip, 2008. 8(3): p. 439-442.
181. He, H. and C. Gao, Synthesis of Fe 3 O 4/Pt nanoparticles decorated carbon
nanotubes and their use as magnetically recyclable catalysts. Journal of
Nanomaterials, 2011. 2011: p. 11.
182. Maciejewska, B., et al., Experimental and theoretical studies on the mechanism for
chemical oxidation of multiwalled carbon nanotubes. RSC Advances, 2014. 4(55):
p. 28826-28831.
183. Tserpes, K.I. and N. Silvestre, Modeling of carbon nanotubes, graphene and their
composites. 2014: Springer.
184. Shan, Y., et al., Preparation and characterization of biocompatible magnetic
carbon nanotubes. Applied Surface Science, 2010. 257(2): p. 362-366.
185. Mitróová, Z., et al., Preparation and characterization of carbon nanotubes
functionalized by magnetite nanoparticles. Olomouc, Czech Republic, EU, 2010.
10: p. 12-14.
186. Chang, P.R., et al., Characterization of magnetic soluble starch-functionalized
carbon nanotubes and its application for the adsorption of the dyes. Journal of
Hazardous Materials, 2011. 186(2): p. 2144-2150.
187. Karaagac, O., et al., A simple way to synthesize superparamagnetic iron oxide
nanoparticles in air atmosphere: iron ion concentration effect. Magnetics, IEEE
Transactions on, 2010. 46(12): p. 3978-3983.
188. Maity, D. and D. Agrawal, Synthesis of iron oxide nanoparticles under oxidizing
environment and their stabilization in aqueous and non-aqueous media. Journal of
Magnetism and Magnetic Materials, 2007. 308(1): p. 46-55.
189. Lopez, J.A., et al., Synthesis and characterization of Fe3O4 magnetic nanofluid.
Revista Latinoamericana de Metalurgia y Materiales, 2010: p. 60-66.

Ph.D. Thesis – Ahmed M. Abdalla; McMaster University –Engineering Physics
174
190. Mozaffari, M., J. Amighian, and R. Tavakoli, The effect of yttrium substitution on
the magnetic properties of magnetite nanoparticles. Journal of Magnetism and
Magnetic Materials, 2015. 379: p. 208-212.
191. Murakami, K., The characteristics of ferrite cores with low Curie temperature and
their application. Magnetics, IEEE Transactions on, 1965. 1(2): p. 96-100.
192. Rezlescu, N. and E. Cuciureanu, Cation distribution and Curie temperature in some
ferrites containing copper and manganese. Physica Status Solidi (a), 1970. 3(4): p.
873-878.
193. Arulmurugan, R., et al., Mn–Zn ferrite nanoparticles for ferrofluid preparation:
Study on thermal–magnetic properties. Journal of Magnetism and Magnetic
Materials, 2006. 298(2): p. 83-94.
194. Auzans, E., et al., Synthesis and properties of Mn-Zn ferrite ferrofluids. Journal of
Materials Science, 1999. 34(6): p. 1253-1260.
195. Jeong, J.R., et al., Magnetic properties of γ‐Fe2O3 nanoparticles made by
coprecipitation method. physica status solidi (b), 2004. 241(7): p. 1593-1596.
196. Aliahmad, M. and N. Nasiri Moghaddam, Synthesis of maghemite (γ-Fe2O3)
nanoparticles by thermal-decomposition of magnetite (Fe3O4) nanoparticles.
Materials Science-Poland, 2013. 31(2): p. 264-268.
197. Tartaj, P., et al., The preparation of magnetic nanoparticles for applications in
biomedicine. Journal of Physics D: Applied Physics, 2003. 36(13): p. R182.
198. Kappiyoor, R., et al., The effects of magnetic nanoparticle properties on magnetic
fluid hyperthermia. Journal of Applied Physics, 2010. 108(9): p. 094702.
199. Ghosh, S. and I.K. Puri, Changing the magnetic properties of microstructure by
directing the self-assembly of superparamagnetic nanoparticles. Faraday
discussions, 2015. 181: p. 423-435.
200. Mørup, S., Superferromagnetic nanostructures. Hyperfine Interactions, 1994.
90(1): p. 171-185.
201. Subhankar, B. and K. Wolfgang, Supermagnetism. J. Phys. D, 2009. 42: p. 013001.
202. Lee, S.-J., et al., Synthesis and characterization of superparamagnetic maghemite
nanoparticles prepared by coprecipitation technique. Journal of Magnetism and
Magnetic Materials, 2004. 282: p. 147-150.
203. Millan, A., et al., Surface effects in maghemite nanoparticles. Journal of magnetism
and magnetic materials, 2007. 312(1): p. L5-L9.
204. Racuciu, M., D. Creanga, and G. Calugaru, Synthesis and rheological properties of
an aqueous ferrofluid. Journal of Optoelectronics and Advanced Materials, 2005.
7(6): p. 2859-2864.
205. Liu, Y., et al., Attachment of magnetic nanoparticles on carbon nanotubes using
oleate as an interlinker molecule. Materials Chemistry and Physics, 2009. 116(2):
p. 438-441.
206. Caneba, G., et al., Novel ultrasonic dispersion of carbon nanotubes. Journal of
Minerals and Materials Characterization and Engineering, 2010. 9(03): p. 165.
207. Othman, S.H., et al., Dispersion and stabilization of photocatalytic TiO2
nanoparticles in aqueous suspension for coatings applications. Journal of
Nanomaterials, 2012. 2012: p. 2.

Ph.D. Thesis – Ahmed M. Abdalla; McMaster University –Engineering Physics
175
208. Baykal, A., et al., Acid Functionalized Multiwall Carbon Nanotube/Magnetite
(MWCNT)-COOH/Fe3O4 Hybrid: Synthesis, Characterization and Conductivity
Evaluation. Journal of Inorganic and Organometallic Polymers and Materials, 2013.
23(3): p. 726-35.
209. Ganguly, R., A.P. Gaind, and I.K. Puri, A strategy for the assembly of three-
dimensional mesoscopic structures using a ferrofluid. Physics of Fluids, 2005.
17(5).
210. Ganguly, R., et al., Analyzing ferrofluid transport for magnetic drug targeting.
Journal of Magnetism and Magnetic Materials, 2005. 289: p. 331-334.
211. Ganguly, R., B. Zellmer, and I.K. Puri, Field-induced self-assembled ferrofluid
aggregation in pulsatile flow. Physics of Fluids, 2005. 17: p. 097104.
212. Roy, T., et al., Magnetic microsphere-based mixers for microdroplets. Physics of
Fluids, 2009. 21: p. 027101.
213. Ganguly, R. and I.K. Puri, Field-assisted self-assembly of superparamagnetic
nanoparticles for biomedical, MEMS and BioMEMS applications. Advances in
Applied Mechanics, 2007. 41: p. 293-335.
214. Ganguly, R. and I.K. Puri, Microfluidic transport in magnetic MEMS and
bioMEMS. Wiley Interdisciplinary Reviews: Nanomedicine and
Nanobiotechnology, 2010. 2(4): p. 382-399.
215. Puri, I.K. and R. Ganguly, Particle transport in therapeutic magnetic fields. Annual
Review of Fluid Mechanics, 2014. 46(1): p. 407-440.
216. Rosensweig, R.E., Ferrohydrodynamics. 1997: Dover Publications.
217. Massart, R., Preparation of aqueous magnetic liquids in alkaline and acidic media.
IEEE Transactions on Magnetics 1981. 17(2): p. 1247-1248.
218. Massart, R., et al., Preparation and properties of monodisperse magnetic fluids.
Journal of Magnetism and Magnetic Materials, 1995. 149(1): p. 1-5.
219. Voit, W., et al. Magnetic behavior of coated superparamagnetic iron oxide
nanoparticles in ferrofluids. in MRS Proceedings. 2001. Cambridge Univ Press.
220. Fattah, A.R.A., S. Ghosh, and I.K. Puri, Printing microstructures in a polymer
matrix using a ferrofluid droplet. Journal of Magnetism and Magnetic Materials,
2016. 401: p. 1054-1059.
221. Karthik, P. and S.P. Singh, Conductive silver inks and their applications in printed
and flexible electronics. RSC Advances, 2015. 5(95): p. 77760-77790.
222. Kamyshny, A. and S. Magdassi, Conductive nanomaterials for printed electronics.
Small, 2014. 10(17): p. 3515-3535.
223. Kolosovas-Machuca, E.S., et al., Resistance-based biosensor of Multi-Walled
Carbon Nanotubes. J Immunoassay Immunochem, 2015. 36(2): p. 142-8.
224. Soleymani, L., et al., Nanostructuring of patterned microelectrodes to enhance the
sensitivity of electrochemical nucleic acids detection. Angewandte Chemie
International Edition, 2009. 48(45): p. 8457-8460.
225. Alubaidy, M., et al., Femtosecond laser nanostructuring for femtosensitive DNA
detection. Biosensors and bioelectronics, 2012. 33(1): p. 82-87.
226. Balasubramanian, K. and M. Burghard, Biosensors based on carbon nanotubes.
Anal Bioanal Chem, 2006. 385(3): p. 452-68.
Ph.D. Thesis – Ahmed M. Abdalla; McMaster University –Engineering Physics
176
227. Chao Li, et al., Complementary Detection of Prostate-Specific Antigen Using In2O3
Nanowires and Carbon Nanotubes. J. Am. Chem. Soc., 2005. 127: p. 12484-85.
228. Chen, R.J., et al., Noncovalent functionalization of carbon nanotubes for highly
specific electronic biosensors. Proc Natl Acad Sci U S A, 2003. 100(9): p. 4984-9.
229. Cid, C.C., et al., Carbon nanotube field effect transistors for the fast and selective
detection of human immunoglobulin G. Analyst, 2008. 133(8): p. 1005-8.
230. Liu, Z., et al., Polyaniline-coated Fe3O4 nanoparticle-carbon-nanotube composite
and its application in electrochemical biosensing. Small, 2008. 4(4): p. 462-6.
231. Pozuelo, M., et al., Paper-based chemiresistor for detection of ultralow
concentrations of protein. Biosens Bioelectron, 2013. 49: p. 462-5.
232. Abdel Fattah, A.R., et al., Nickel Nanoparticles Entangled in Carbon Nanotubes:
Novel Ink for Nanotube Printing. ACS Appl. Mater. & Interfaces, 2016. 8(3): p.
1589-93.
233. Masotti, A. and A. Caporali, Preparation of magnetic carbon nanotubes (Mag-
CNTs) for biomedical and biotechnological applications. Int J Mol Sci, 2013.
14(12): p. 24619-42.
234. Balasubramanian, K. and M. Burghard, Chemically functionalized carbon
nanotubes. Small, 2005. 1(2): p. 180-92.
235. Korneva, G., et al., Carbon nanotubes loaded with magnetic particles. Nano Lett,
2005. 5(5): p. 879-84.
236. He, H. and C. Gao, Synthesis of Fe3O4/Pt Nanoparticles Decorated Carbon
Nanotubes and Their Use as Magnetically Recyclable Catalysts. Journal of
Nanomaterials, 2011. 2011: p. 1-10.
237. Abdel Fattah, A.R., S. Ghosh, and I.K. Puri, Printing Microstructures in a Polymer
Matrix using a Ferrofluid Droplet J. Mag. Mag. Mater., 2016. 401: p. 1054-1059.
238. Ganguly, R. and I.K. Puri, Field-assisted self-assembly of superparamagnetic
nanoparticles for biomedical, MEMS and BioMEMS applications. Adv. in Appl.
Mech., 2007. 41: p. 293-335.
239. Ganguly, R. and I.K. Puri, Microfluidic transport in magnetic MEMS and
bioMEMS. Wiley Interdisciplinary Rev.: Nanomed. and Nanobiotech., 2010. 2: p.
382-399.
240. Abdel Fattah, A.R., S. Ghosh, and I.K. Puri, Printing three-dimensional
heterogeneities in the elastic modulus of an elastomeric matrix. ACS Appl Mater
Interfaces, 2016.
241. Tsai, P.J., et al., Tailoring Material Stiffness by Filler Particle Organization. ACS
Applied Materials & Interfaces, 2016. 8(41): p. 27449-27453.
242. Qu, S., et al., Magnetic loading of carbon nanotube/nano-Fe(3)O(4) composite for
electrochemical sensing. Talanta, 2007. 71(3): p. 1096-102.
243. Pérez-López, B. and A. Merkoçi, Magnetic Nanoparticles Modified with Carbon
Nanotubes for Electrocatalytic Magnetoswitchable Biosensing Applications.
Advanced Functional Materials, 2011. 21(2): p. 255-260.
244. Zarei, H., et al., Magnetic nanocomposite of anti-human IgG/COOH-multiwalled
carbon nanotubes/Fe(3)O(4) as a platform for electrochemical immunoassay. Anal
Biochem, 2012. 421(2): p. 446-53.
Ph.D. Thesis – Ahmed M. Abdalla; McMaster University –Engineering Physics
177
245. Hernández, J. and I.M. Thompson, Prostate‐specific antigen: a review of the
validation of the most commonly used cancer biomarker. Cancer, 2004. 101(5): p.
894-904.
246. Fürstenberger, G. and H.-J. Senn, Insulin-like growth factors and cancer. The lancet
oncology, 2002. 3(5): p. 298-302.
247. Engel, R.H. and V.G. Kaklamani, HER2-positive breast cancer. Drugs, 2007.
67(9): p. 1329-1341.
248. Chen, B.J., et al., Small molecules targeting c-Myc oncogene: promising anti-
cancer therapeutics. Int J Biol Sci, 2014. 10(10): p. 1084-96.
249. Dang, C.V., MYC on the path to cancer. Cell, 2012. 149(1): p. 22-35.
250. D J Liao and R.B. Dickson, c-Myc in breast cancer. Endocrine-Related Cancer,
2000. 7: p. 143-164.
251. Yang, M., Y. Kostov, and A. Rasooly, Carbon nanotubes based optical
immunodetection of Staphylococcal Enterotoxin B (SEB) in food. Int J Food
Microbiol, 2008. 127(1-2): p. 78-83.
252. Mirhosseini, H., et al., Effect of Arabic gum, xanthan gum and orange oil contents
on ζ-potential, conductivity, stability, size index and pH of orange beverage
emulsion. Colloids and Surfaces A: Physicochemical and Engineering Aspects,
2008. 315(1): p. 47-56.
253. Ostolska, I. and M. Wiśniewska, Application of the zeta potential measurements to
explanation of colloidal Cr2O3 stability mechanism in the presence of the ionic
polyamino acids. Colloid and Polymer Science, 2014. 292(10): p. 2453-2464.
254. Abdalla, A.M., S. Ghosh, and I.K. Puri, Decorating carbon nanotubes with co-
precipitated magnetite nanocrystals. Diamond and Related Materials, 2016.
255. Stefansson, S., H.H. Kwon, and S.N. Ahn, Targeting Antibodies to Carbon
Nanotube Field Effect Transistors by Pyrene Hydrazide Modification of Heavy
Chain Carbohydrates. Journal of Nanotechnology, 2012. 2012: p. 1-8.
256. Patolsky, F., Y. Weizmann, and I. Willner, Long-range electrical contacting of
redox enzymes by SWCNT connectors. Angew Chem Int Ed Engl, 2004. 43(16): p.
2113-7.
257. Zhang, X., et al., Electronic Detection of Escherichia coli O157︰H7 Using Single-
Walled Carbon Nanotubes Field-Effect Transistor Biosensor. Engineering, 2012.
04(10): p. 94-98.
258. Salehi-Khojin, A., et al., Sensitivity of nanotube chemical sensors at the onset of
Poole–Frenkel conduction. Applied Physics Letters, 2010. 96(16): p. 163110.
259. Amin Salehi-Khojin, et al., On the Sensing Mechanism in Carbon Nanotube
Chemiresistors. ACS Nano, 2010. 5: p. 153-158.
260. Li, W., et al., The microstructure of Ni layer on single-walled carbon nanotubes
prepared by an electroless coating process. Journal of Nanomaterials, 2011. 2011:
p. 13.
261. Agarwala, R. and V. Agarwala, Electroless alloy/composite coatings: A review.
Sadhana, 2003. 28(3-4): p. 475-493.

Ph.D. Thesis – Ahmed M. Abdalla; McMaster University –Engineering Physics
178
262. Ang, L.-M., et al., Electroless plating of metals onto carbon nanotubes activated by
a single-step activation method. Chemistry of Materials, 1999. 11(8): p. 2115-2118.
263. Yung, K., J. Wei, and B. Tay, Electroless plating of nickel on carbon nanotubes
film, in Electronic Packaging Technology Conference. 2005, IEEE: Singapore. p.
636-638.
264. Wang, F., et al., Synthesis of carbon nanotube-supported nickel–phosphorus
nanoparticles by an electroless process. Carbon, 2006. 44(7): p. 1307-1310.
265. Van Gestel, T., et al., Manufacturing of new nano-structured ceramic–metallic
composite microporous membranes consisting of ZrO 2, Al 2 O 3, TiO 2 and
stainless steel. Solid State Ionics, 2008. 179(27): p. 1360-1366.
266. Jie, G., et al., Preparation and characterization of carboxyl multi-walled carbon
nanotubes/calcium alginate composite hydrogel nano-filtration membrane.
Materials Letters, 2015. 157: p. 112-115.
267. Jang, J.H., et al., Correlation between particle deposition and the size ratio of
particles to patterns in nano-and micro-patterned membrane filtration systems.
Separation and Purification Technology, 2015. 156: p. 608-616.
268. Abdel Fattah, A.R., S. Ghosh, and I.K. Puri, Printing three-dimensional
heterogeneities in the elastic modulus of an elastomeric matrix. ACS Applied
Materials & Interfaces, 2016. 8(17): p. 11018-11023.
269. He, X., et al., Size dependence of the magnetic properties of Ni nanoparticles
prepared by thermal decomposition method. Nanoscale Research Letters, 2013.
8(1): p. 446.
270. Kolhatkar, A.G., et al., Tuning the magnetic properties of nanoparticles.
International Journal of Molecular Sciences, 2013. 14(8): p. 15977-16009.
271. Belcher, A.M., et al., Control of crystal phase switching and orientation by soluble
mollusc-shell proteins. Nature, 1996. 381: p. 56-58.
272. Combes, S.A., Materials, structure, and dynamics of insect wings as bioinspiration
for MAVs. Encyclopedia of aerospace engineering, 2010.
273. Esposito, C.J., et al., A robotic fish caudal fin: effects of stiffness and motor program
on locomotor performance. Journal of Experimental Biology, 2012. 215(1): p. 56-
67.
274. Pozegic, T., et al., Multi-functional carbon fibre composites using carbon
nanotubes as an alternative to polymer sizing. Scientific Reports, 2016. 6.
275. Ma, C., Y. Wang, and Y. Yu, Electrical and thermal properties of carbon
nanotubes/PMMA composites induced by low magnetic fields. Plastics, Rubber and
Composites, 2010. 39(2): p. 49-53.
276. Abdalla, A.M., et al., Nickel oxide nanotubes synthesis using multiwalled carbon
nanotubes as sacrificial templates for supercapacitor application. Nanotechnology,
2016.
277. Liu, C., et al., Advanced materials for energy storage. Advanced Materials, 2010.
22(8): p. E28–E62.
278. Dai, W., et al., Electrochemical imprinted polycrystalline nickel–nickel oxide half-
nanotube-modified boron-doped diamond electrode for the detection of l-serine.
ACS Applied Materials & Interfaces, 2015. 7(41): p. 22858-22867.
Ph.D. Thesis – Ahmed M. Abdalla; McMaster University –Engineering Physics
179
279. Li, X.-H., et al., An electrokinetic route to rapid synthesis of nickel hydroxide and
nickel oxide nanotubes. Journal of Nanoscience and Nanotechnology, 2010. 10(8):
p. 5191-5195.
280. Conway, B.E., Electrochemical supercapacitors: scientific fundamentals and
technological applications. 2013, New York: Springer Science & Business Media.
281. Kötz, R. and M. Carlen, Principles and applications of electrochemical capacitors.
Electrochimica Acta, 2000. 45(15): p. 2483-2498.
282. Lokhande, C., D. Dubal, and O.-S. Joo, Metal oxide thin film based
supercapacitors. Current Applied Physics, 2011. 11(3): p. 255-270.
283. Cheng, M.-Y., et al., Size effect of nickel oxide for lithium ion battery anode. Journal
of Power Sources, 2014. 253: p. 27-34.
284. Yan, X., et al., Synthesis of hollow nickel oxide nanotubes by electrospinning with
structurally enhanced lithium storage properties. Materials Letters, 2014. 136: p.
74-77.
285. Sattarahmady, N., H. Heli, and F. Faramarzi, Nickel oxide nanotubes-carbon
microparticles/Nafion nanocomposite for the electrooxidation and sensitive
detection of metformin. Talanta, 2010. 82(4): p. 1126-1135.
286. Pang, H., et al., Facile synthesis of nickel oxide nanotubes and their antibacterial,
electrochemical and magnetic properties. Chemical Communications, 2009(48): p.
7542-7544.
287. Rai, A.K., et al., Electrochemical study of NiO nanoparticles electrode for
application in rechargeable lithium-ion batteries. Ceramics International, 2013.
39(6): p. 6611-6618.
288. Sk, M.M., et al., Review on advances in porous nanostructured nickel oxides and
their composite electrodes for high-performance supercapacitors. Journal of Power
Sources, 2016. 308: p. 121-140.
289. Feng, L., et al., Recent progress in nickel based materials for high performance
pseudocapacitor electrodes. Journal of Power Sources, 2014. 267: p. 430-444.
290. Jacob, G.M. and I. Zhitomirsky, Microstructure and properties of manganese
dioxide films prepared by electrodeposition. Applied Surface Science, 2008.
254(20): p. 6671-6676.
291. Wang, Y. and I. Zhitomirsky, Cathodic electrodeposition of Ag-doped manganese
dioxide films for electrodes of electrochemical supercapacitors. Materials Letters,
2011. 65(12): p. 1759-1761.
292. Gu, L., et al., Anodic electrodeposition of a porous nickel oxide–hydroxide film on
passivated nickel foam for supercapacitors. Journal of Materials Chemistry A,
2014. 2(20): p. 7161-7164.
293. Sun, X., et al., Porous nickel oxide nano-sheets for high performance
pseudocapacitance materials. Journal of Materials Chemistry, 2011. 21(41): p.
16581-16588.
294. Zhu, Y., et al., Ultrathin nickel hydroxide and oxide nanosheets: synthesis,
characterizations and excellent supercapacitor performances. Scientific Reports,
2014. 4.

Ph.D. Thesis – Ahmed M. Abdalla; McMaster University –Engineering Physics
180
295. Wang, Y., et al., Mesoporous transition metal oxides for supercapacitors.
Nanomaterials, 2015. 5(4): p. 1667-1689.
296. Li, J. and I. Zhitomirsky, Electrophoretic deposition of manganese dioxide–carbon
nanotube composites. Journal of Materials Processing Technology, 2009. 209(7):
p. 3452-3459.
297. Devan, R.S., et al., One‐dimensional metal‐oxide nanostructures: recent
developments in synthesis, characterization, and applications. Advanced
Functional Materials, 2012. 22(16): p. 3326-3370.
298. Song, X., L. Gao, and S. Mathur, Synthesis, characterization, and gas sensing
properties of porous nickel oxide nanotubes. The Journal of Physical Chemistry C,
2011. 115(44): p. 21730-21735.
299. Gong, M., et al., Nanoscale nickel oxide/nickel heterostructures for active hydrogen
evolution electrocatalysis. Nature Communications, 2014. 5.
300. Liu, H., et al., Highly ordered mesoporous NiO anode material for lithium ion
batteries with an excellent electrochemical performance. Journal of Materials
Chemistry, 2011. 21(9): p. 3046-3052.
301. Needham, S.A., G. Wang, and H. Liu, Synthesis of NiO nanotubes for use as
negative electrodes in lithium ion batteries. Journal of Power Sources, 2006.
159(1): p. 254-257.
302. Needham, S., et al., Nickel oxide nanotubes: Synthesis and electrochemical
performance for use in lithium ion batteries. Journal of Nanoscience and
Nanotechnology, 2006. 6(1): p. 77-81.
303. Xu, J., et al., Electrochemical capacitance of nickel oxide nanotubes synthesized in
anodic aluminum oxide templates. Journal of Solid State Electrochemistry, 2011.
15(9): p. 2005-2011.
304. Zhuo, K., M.-G. Jeong, and C.-H. Chung, Dendritic nanoporous nickel oxides for
a supercapacitor prepared by a galvanic displacement reaction with chlorine ions
as an accelerator. RSC Advances, 2013. 3(31): p. 12611-12615.
305. Meher, S.K., P. Justin, and G. Ranga Rao, Microwave-mediated synthesis for
improved morphology and pseudocapacitance performance of nickel oxide. ACS
Applied Materials & Interfaces, 2011. 3(6): p. 2063-2073.
306. Fisher, R.A., M.R. Watt, and W.J. Ready, Functionalized carbon nanotube
supercapacitor electrodes: a review on pseudocapacitive materials. ECS Journal of
Solid State Science and Technology, 2013. 2(10): p. M3170-M3177.
307. Faraji, S. and F.N. Ani, Microwave-assisted synthesis of metal oxide/hydroxide
composite electrodes for high power supercapacitors–a review. Journal of Power
Sources, 2014. 263: p. 338-360.
308. Gogotsi, Y. and P. Simon, True performance metrics in electrochemical energy
storage. Science, 2011. 334(6058): p. 917-918.
309. Stappert, S., et al. Preparation, Structure, and Sintering of Nickel Nanoparticles. in
EUREM 2000. 2000. Brno, Czech Republic.
310. Kim, C., et al., Expeditious low-temperature sintering of copper nanoparticles with
thin defective carbon shells. Nanoscale, 2015. 7(15): p. 6627-6635.
Ph.D. Thesis – Ahmed M. Abdalla; McMaster University –Engineering Physics
181
311. Ata, M., Y. Liu, and I. Zhitomirsky, A review of new methods of surface chemical
modification, dispersion and electrophoretic deposition of metal oxide particles.
RSC Advances, 2014. 4(43): p. 22716-22732.
312. Liu, Y., et al., Film deposition mechanisms and properties of optically active
chelating polymer and composites. Colloids and Surfaces A: Physicochemical and
Engineering Aspects, 2015. 487: p. 17-25.
313. Liu, Y., et al., Universal dispersing agent for electrophoretic deposition of
inorganic materials with improved adsorption, triggered by chelating monomers.
Journal of Colloid and Interface Science, 2016. 462: p. 1-8.
314. Rivas, B.L., G.V. Seguel, and K.E. Geckeler, Poly (styrene‐alt‐maleic acid)–metal
complexes with divalent metal ions. synthesis, characterization, and physical
properties. Journal of Applied Polymer Science, 2001. 81(6): p. 1310-1315.
315. Roy, P., et al., Accelerated aging of LDPE films containing cobalt complexes as
prooxidants. Polymer Degradation and Stability, 2006. 91(8): p. 1791-1799.
316. Mazi, H. and A. Gulpinar, Cu (II), Zn (II) and Mn (II) complexes of poly (methyl
vinyl ether-alt-maleic anhydride). Synthesis, characterization and thermodynamic
parameters. Journal of Chemical Sciences, 2014. 126(1): p. 239-245.
317. Nam, K.-W. and K.-B. Kim, A study of the preparation of NiO x electrode via
electrochemical route for supercapacitor applications and their charge storage
mechanism. Journal of the Electrochemical Society, 2002. 149(3): p. A346-A354.
318. Prasad, K.R. and N. Miura, Electrochemically deposited nanowhiskers of nickel
oxide as a high-power pseudocapacitive electrode. Applied Physics Letters, 2004.
85(18): p. 4199-4201.