phd thesis- amon mwangi karanja - egerton university
TRANSCRIPT

EFFECTS OF DROUGHT ON HOUSEHOLD LIVELIHOODS AND ADA PTATION
STRATEGIES IN LAIKIPIA WEST SUB-COUNTY, KENYA
Amon Mwangi Karanja
A Thesis Submitted to the Graduate School in Fulfillment for the Requirements of the Award
of the Degree of Doctor of Philosophy in Geography of Egerton University.
EGERTON UNIVERSITY
APRIL, 2018

ii

iii
COPY RIGHT
© 2018 Amon Mwangi Karanja
All rights reserved. No part of this thesis may be produced, stored in any retrievable system
or transmitted in any form or means; electronic, mechanical, photocopying, recording or
otherwise without prior permission of the author or Egerton University on that behalf.

iv
DEDICATION
I dedicate this thesis to my late dad David Karanja Gitau and Mum Mary Njeri who sacrificed
their time and resources to educate me.

v
ACKNOWLEDGEMENTS
To begin with, I am grateful to the almighty God for the opportunity, good health and
provision of resource during my education period. I extend my sincere gratitude to Egerton
University and Egerton University training committee for sponsoring my Ph.D studies
through the award of 100% tuitions fee waiver and granting me permission to study. Without
the award perhaps this research would have been different. In a special way I express my
heartfelt gratitude to my supervisors, Prof. Kennedy Ondimu and Dr. Charles Recha, whose
expertise, understanding, and patience added considerably to my graduate experience at
Egerton University. I appreciate their vast knowledge and skills in many areas which helped
to horn my skills. They provided me with direction, technical support and became critical but
truly inspirational mentors who have become my true friends.
I would also like to thank my colleagues in the Department of Geography who offered
great support during my study period. I also thank my academic mentors Prof. Chris
Shisanya, Prof. Eunice Kamaara, Prof. John Kanjogu and Dr. George Makokha for their
priceless support during my study period. I extend my gratitude to Charles Mwangi for his
assistance during data analysis process and my colleagues Richard Ochieng and Morris
Mwatu for their encouragement during the study. I am also grateful to my field assistants
David Esekon, Nicholas Larpei and Jerick Lenkirasi for their support during data collection
and Laikipia West Sub County Agriculture office, Water Resource Management Authority
Rumuruti my key informants and all my respondents for without their data this study would
not have been a success. In a special way I thank Chief Samwel Tum and Emily Kioko for a
wonderful introduction to Laikipia West sub-County.
I must acknowledge my daughter Maryvalentine Njeri who never missed to ask me
when I will become a doctor whenever I reached home. Special thanks to my son Goodluck
Kamanda whose arrival brought immense happiness and joy in our family. I sincerely thank
my wife Esther Wanjiru for her encouragement, support and understanding throughout the
studies. Finally, I extend my deepest appreciations to my family: My Mum Mary Njeri,
Brothers: Isaac Gitau, James Gachara and sisters: Esther Wanjiku, Damaris Waithira and
Rose Waithira who kept encouraging me in difficult moments of my study period. To my late
dad, David Karanja Gitau, I will forever be grateful for the sacrifices you made for me during
your life time.

vi
ABSTRACT
Prolonged and severe droughts have affected many parts of sub-Saharan Africa, increasing
cases of crop failure, hunger and destruction of habitats. Kenya has experienced worse
droughts since the turn of the 20th century, with increased frequency in the recent decades.
This study assessed effects of drought on household livelihoods and adaptation strategies in
Laikipia West sub-County. The specific objectives of the study were to: analyze temporal
drought trends in Laikipia West sub-County from 1984 to 2014; determine the impact of
drought events on household livelihoods; establish the household perceptions to drought
disasters; evaluate the household and community drought adaptation strategies and drought
adaptation determinants; evaluate the role of institutions in managing local level drought
adaptations in Laikipia West sub-County. The study adopted mixed research design where
quantitative and qualitative approaches were used. The study utilized three sets of data,
rainfall amount data (1984-2014), household surveys (N=196) and key informant interviews
(N=8). Standard Precipitation Index, logistic regression, trend analysis, Kendall rank, chi
square and percentages were used during data analysis. The severe drought years identified
were; 1984, 1985, 1987, 1991, 2005 and 2009. The study also established that the average
drought cycle in the study area is 3 years. On drought perception 53% of the households felt
that the 2009 drought was moderate, while 47% felt that it was severe. Household drought
perception was significantly related to source of income, land ownership and the length of
engagement in farming activities. According to respondents, the 2009 drought impacted crops
(75%), livestock (78%). Drought adaptations determinants are source of income, land
ownership, training on agriculture and age. Household drought adaptation strategies in
Laikipia West sub-County are: seasonal migration with animals (25%), search for
employment (15%), off-farm practices (15%) and reducing the herd (14%). Community
drought adaptation strategies are; stock cereals and grains (27%), change of cropping patterns
when drought is predicted (13%) and drilling of boreholes (9%). Both formal and informal
institutions perform the following roles: encouraging crop farmers to plant early maturing
varieties and advise pastoralist on the need for emergency livestock off takes. The study
recommends adoption of drought resistant crops such as sorghum and green grams and early
maturing crop varieties. The study also recommends creation of awareness on the need to
insure crops and livestock against drought risk. Future studies should analyze the role of
indigenous knowledge on drought adaptation strategies in Laikipia West sub-County.

vii
TABLE OF CONTENTS
DECLARATION AND RECOMMENDATION ... ………………………………………… …ii
COPY RIGHT ......................................................................................................................... iii
DEDICATION ........................................................................................................................ iv
ACKNOWLEDGEMENTS ......................................................................................................v
ABSTRACT ............................................................................................................................ vi
TABLE OF CONTENTS ....................................................................................................... vii
LIST OF TABLES .................................................................................................................. xi
LIST OF FIGURES .............................................................................................................. xiii
LIST OF PLATES .................................................................................................................xiv
LIST OF ABBREVIATIONS AND ACRONYMS ................ ................................................ xv
OPERATIONAL DEFINITION OF TERMS AND CONCEPTS ...... ............................... xvii
CHAPTER ONE .......................................................................................................................1
INTRODUCTION .....................................................................................................................1
1.1 Background of the Study ....................................................................................................... 1
1.2 Statement of the Problem ...................................................................................................... 5
1.3 Objectives of the Study ......................................................................................................... 5
1.3.1 Broad Objective .......................................................................................................... 5
1.3.2 Specific Objectives ...................................................................................................... 5
1.4 Research Questions ............................................................................................................... 6
1.5 Justification of the Study ....................................................................................................... 6
1.6 Scope and Limitation ............................................................................................................. 7
1.7 Assumptions of the Study ...................................................................................................... 9
CHAPTER TWO .................................................................................................................... 10
2.0 LITERATURE REVIEW ................................................................................................. 10
2.1 Introduction ......................................................................................................................... 10
2.2 Global Drought Characteristics and Trend ........................................................................... 10
2.3 Global Effects of Drought on Resources and Livelihoods .................................................... 12
2.4 Effects of Drought on Livelihoods in Kenya ........................................................................ 16
2.5 Perception of Climate Variability and Associated Effects ................................................... 18
2.6 Household Adaptations to Drought ...................................................................................... 20
2.7 The Institutional Components of Drought Adaptations ........................................................ 23

viii
2.8 Summary of Literature and Gaps Identified ......................................................................... 25
2.9 Theoretical Framework ....................................................................................................... 26
2.10 Conceptual Framework ...................................................................................................... 28
CHAPTER THREE ................................................................................................................ 31
3.0 RESEARCH METHODOLOGY ..................................................................................... 31
3.1 Introduction ......................................................................................................................... 31
3.2 Study Area .......................................................................................................................... 31
3.2.1 Location and Size ...................................................................................................... 31
3.2.2 Climate and Agro- ecological Zones .......................................................................... 31
3.2.3 Soil and Vegetation ................................................................................................... 34
3.2.4 Population Characteristics ......................................................................................... 34
3.2.5 Agriculture and other Economic Activities ................................................................ 35
3.3 Research Design .................................................................................................................. 35
3.4 Sampling Procedure and Sample Size .................................................................................. 36
3.4.1 Rainfall Stations ........................................................................................................ 36
3.4.2 Household Respondents ............................................................................................ 36
3.4.3 Key Informants Interviews ........................................................................................ 37
3.5 Data Collection ................................................................................................................... 38
3.5.1 Rainfall Data ............................................................................................................. 38
3.5.2 Household Survey Data ............................................................................................. 38
3.5.3 Key Informants Interview Data .................................................................................. 38
3.6 Validityand Reliability of the Data ...................................................................................... 39
3.7 Data Analysis and Tools ...................................................................................................... 39
3.7.1 Temporal Drought Trends in Laikipia West sub-County (1984-2014) ........................ 39
3.7.2 Effects of Drought Events on Household Livelihoods ................................................ 41
3.7.3 Household Perception to Drought Disasters ............................................................... 41
3.7.4 Household Drought Adaptation Strategies and Drought Adaptation Determinants ..... 43
3.7.5 Role of Institutions in Managing Drought Adaptations .............................................. 45
3.8 Ethical Considerations ......................................................................................................... 45
CHAPTER FOUR ................................................................................................................... 46
4.0 THE SOCIO-ECONOMIC CHARACTERISTICS OF THE STUDY
POPULATION. ....................................................................................................................... 46

ix
4.1 Introduction ......................................................................................................................... 46
4.2 Response Rate of the Household Survey .............................................................................. 46
4.3 Gender of the Household Heads in Laikipia West sub-County ............................................. 46
4.4 Age of the Household Head in Laikipia West sub-County ................................................... 47
4.5 Household Heads Education Level in Laikipia West sub-County ......................................... 48
4.6 Duration Household head had stayed in Laikipia West sub-County ..................................... 49
4.7 Household’s Source of Income in Laikipia West sub-County .............................................. 51
4.8 Household Farm Size in Laikipia West sub-County ............................................................. 54
4.9 Trainings in Agriculture among Household Heads in Laikipia West sub-County ................. 56
CHAPTER FIVE .................................................................................................................... 58
5.0 DROUGHT CHARACTERISTICS, TRENDS AND ITS EFFECT ON
HOUSEHOLD LIVELIHOODS . ........................................................................................... 58
5.1 Introduction ......................................................................................................................... 58
5.2 Rainfall Trend in Laikipia West sub-County 1984- 2014 ..................................................... 58
5.3 Drought Characteristics in Laikipia West sub-County (1984- 2014) .................................... 60
5.4 Effects of Drought on Household Livelihoods in Laikipia West sub-County ........................ 63
5.4.1 Effects of Drought on Crops in Laikipia West sub-County ........................................ 63
5.4.2 Effects of Drought on Livestock in Laikipia West sub-County .................................. 65
5.4.3 Social Effects of Drought in Laikipia West sub-County ............................................. 66
5.4.4 Environmental Effects of Drought in Laikipia West sub-County ................................ 68
5.4.5 Effects of Drought on Health in Laikipia West sub-County ....................................... 69
5.5 Perception of Drought Disasters in Laikipia West sub-County ............................................. 70
5.5.1 Drought Perception in Laikipia West sub-County ...................................................... 70
5.5.2 Factors Influencing Households Perception of Drought in Laikipia West sub-
County ............................................................................................................................... 71
CHAPTER SIX ....................................................................................................................... 75
6.0 DROUGHT ADAPTATION STRATEGIES AND THEIR DETERMINANT S ............ 75
6.1 Introduction ......................................................................................................................... 75
6.2 Household Drought Adaptation Strategies in Laikipia West Sub-County ............................. 75
6.3 Use of Drought Adaptation Strategies in Laikipia West sub-County .................................... 82
6.4 Role of Institutional in Managing Local level Drought Adaptation Strategies in Laikipia West
sub-County ............................................................................................................................... 85

x
6.5 Drought Adaptation Determinants in Laikipia West sub-County .......................................... 94
CHAPTER SEVEN ................................................................................................................. 98
7.0 SUMMARY OF FINDINGS, CONCLUSIONS AND RECOMMENDA TIONS ........... 98
7.1 Introduction ......................................................................................................................... 98
7.2 Summary of Findings .......................................................................................................... 98
7.2.1 Temporal Drought Trends in Laikipia West Sub-County ........................................... 98
7.2.2 Effects of Drought Events on Household Livelihoods in Laikipia West sub-County .. 98
7.2.3 Household Perceptions to Drought Disasters. ............................................................ 99
7.2.4 Drought Adaptation Strategies and Drought Adaptation Determinants. ...................... 99
7.2.5 Role of Institutions in Managing Local Level Drought Adaptations in Laikipia
West sub-County .............................................................................................................. 100
7.3 Conclusions ....................................................................................................................... 101
7.4 Recommendations ............................................................................................................. 102
7.5 Suggestions for Further Research ...................................................................................... 103
REFERENCES ...................................................................................................................... 104
APPENDICES ....................................................................................................................... 123
Appendix 1: Household Questionnaire................................................................................. 123
Appendix 2: Key Informant Interview Schedule ................................................................. 128
Appendix 3: Annual Rainfall Amount for Rumuruti and Ndaragwa Stations ................... 129
Appendix 4: Standard Precipitation Value for Rumuruti and Ndaragwa Station ............. 130
Appendix 5a: Factors Influencing Perceptions to Drought among Households .................. 131
Appendix 5b: Factors Influencing Perceptions to Drought among Households ................. 132
Appendix 6: Maize Production per 90 Kg bags (2001-2014) .............................................. 133
Appendix 7: NACOSTI Research Authorization ................................................................. 134
Appendix 8: Research Permit ............................................................................................... 135
Appendix 9: Research Team in a Data Collating and Cleaning Session ............................. 136
Appendix 10: Journal Articles Published in Refereed Journals ......................................... 137

xi
LIST OF TABLES
Table 3.1: Households Sample Population in Rumuruti Ward ................................................... 37
Table 3.2: Sample Population for Key Informants ..................................................................... 37
Table 3.3 Standard Precipitation Index (SPI) values .................................................................. 40
Table 3.4 Descriptions of variables in logistic regression........................................................... 43
Table 4.1: Age of the household head in Laikipia West sub-County .......................................... 48
Table 4.2: Households education level in Laikipia West sub-County ......................................... 48
Table 4.3: Cross tabulation of education and gender in Laikipia West sub-County .................... 49
Table 4.4: Length of household heads engagement in farming in Laikipia West sub-County ..... 51
Table 4.5: Cross Tabulation of the duration the household head had stayed in the area and
gender ....................................................................................................................................... 51
Table 4.6: Households Source of Income in Laikipia West sub-County ..................................... 52
Table 4.7: Cross Tabulation of Gender and Source of Income in Laikipia West sub-County ...... 53
Table 4.8: Household annual income in Laikipia West sub-County ........................................... 54
Table 4.9: Size of the Land Owned by Households in Laikipia West sub-County ...................... 55
Table 4.10: Cross Tabulation of the size of the land and source of income in Laikipia West
sub-County ............................................................................................................................... 56
Table 5.1: Effects of drought on household livelihoods in Laikipia West sub-County ................ 64
Table 5.2: Percentage of household crops impacted by drought ................................................. 64
Table 5.3: Effects of drought on livestock at household level in Laikipia West sub-County ....... 66
Table 5.4: Social Effects of drought in Laikipia West sub-County ............................................. 67
Table 5.5: Environmental effects of drought in Laikipia West sub-County ................................ 69
Table 5.6: Effects of drought on Health in Laikipia West sub-County ....................................... 70
Table 5.7: Odd ratios for logistic regression model on the factors influencing households
perception to drought ................................................................................................................ 74
Table 6.1: Household drought adaptation strategies in Laikipia West sub-County ..................... 76
Table 6.2: Cross tabulation of the duration household head had stayed in Laikipia West sub-
County and adaptation strategies ............................................................................................... 77
Table 6.3: Cross tabulation of gender and drought adaptation strategies in Laikipia West sub-
County ...................................................................................................................................... 78
Table 6.4: Cross tabulation of age and drought adaptation strategies in Laikipia West sub-
County ...................................................................................................................................... 78

xii
Table 6.5: Cross tabulation of land ownership and drought adaptation strategies ....................... 79
Table 6.6: Cross tabulation of source of income and drought adaptation strategies .................... 80
Table 6.7: Cross tabulation of level of education and drought adaptation strategies ................... 81
Table 6.8: Cross tabulation of Agriculture training and drought adaptation strategies ................ 82
Table 6.9: Ranked Frequency of the use of drought adaptation strategies .................................. 84
Table 6.10: Community Drought Adaptation Strategies in Laikipia West sub-County ............... 86
Table 6.11: Drought adaptation determinants in Laikipia West sub-County ............................... 97

xiii
LIST OF FIGURES
Figure 2.1: Conceptual Framework for analyzing effects of drought on livelihoods and
adaptation strategies. ................................................................................................................. 30
Figure 3.1: A map of Laikipia West sub-County showing the sampled sites. ............................. 33
Figure 4.1: Household head by gender in Laikipia West sub-County ......................................... 47
Figure 4.2 Duration of stay by the household head in Laikipia West sub-County ....................... 50
Figure 4.3: Trainings in Agriculture among household heads .................................................... 57
Figure 4.4: Trainings in Agriculture among household heads by gender .................................... 57
Figure 5.1 a: Annual rainfall trend (1984-2014) for Rumuruti station ........................................ 59
Figure 5.1 b: Annual rainfall trend (1984-2014) for Ndaragwa station ....................................... 59
Figure 5.2: Long rain season SPI results for Rumuruti and Ndaragwa station ............................ 61
Figure 5.3: Short rain SPI results for Rumuruti and Ndaragwa station ....................................... 61
Figure 5.4: Annual SPI results for Rumuruti and Ndaragwa stations .......................................... 63
Figure 5.5: Maized production in Laikipia West sub-County in bags (2001-2014) ..................... 65
Figure 6.1: Agency preferred by households to provide drought information ............................. 93
Figure 6.2: Percentages of dissemination of drought information. .............................................. 94

xiv
LIST OF PLATES
Plate 6.1: Livestock Market day at Rumuruti Township ............................................................ 86
Plate 6.2: Irrigation using water from River Ewaso Ngi’ro ........................................................ 89
Plate 6.3: Animal and human being shares a water point ........................................................... 89
Plate 6.4: Indiscriminate destruction of forest and charcoal burning .......................................... 89
Plate 6.5: Destruction of the environment through illegal logging and firewood ........................ 89
Plate 6.6: Training on the importance and use of green technology ............................................ 89
Plate 6.7: Destruction of the environment and the warning of the consequences ........................ 89
Plate 6.8: Quarrying activities in Laikipia West sub-County ...................................................... 90

xv
LIST OF ABBREVIATIONS AND ACRONYMS
AEZs Agro Ecological Zones
ASALs Arid and Semi Arid Lands
ASDSP Agriculture Sector Development Support Programme
CBOs Community Based Organizations
CDIDP County Development Integrated Development Plan
CJPC Catholic Justice and Peace Commission
CETRAD Centre for Training and integrated Research in ASAL Development
CIP International Potato Centre
COPs Conference of Parties
CWDI Community Water Deficit Index
ENSO El Niño Southern Oscillation
FAO Food and Agriculture Organization of the United Nations
GDP Gross Domestic Product
GoK Government of Kenya
HFA Hyogo Framework for Action
IFPRI International Food Policy Research Institute
IOD Indian Ocean Dipole
IPCC Intergovernmental Panel on Climate Change
ITCZ Inter Tropical Convergence Zone
KALRO Kenya Agriculture and Livestock Research Organization
KARI Kenya Agricultural Research Institute
KII Key Informant Interview
KCCAP Kenya Climate Change Action Plan
KFSSG Kenya Food Security Steering Group
KMS Kenya Meteorological Service
KNBS Kenya National Bureau of Statistics
KWS Kenya Wildlife Service
MAM March April May
MoSSP Ministry of State for Special Programmes
NALEP National Agriculture and Livestock Extension Programmes
NEMA National Environment Management Authority

xvi
NCCAC National Climate Change Awareness Campaign
NCCRS National Climate Change Response Strategies
NDVI Normalized Difference Vegetation Index
ODI Overseas Development Institute
OND October November December
PCEA Presbyterian Church of East Africa
PFE Pastoralist Forum of Ethiopia
REGLAP Regional Learning and Advocacy Programme
SCC Small Christian Community
SCF Seasonal Climate Forecast
SPI Standard Precipitation Index
TIK Transparency International Kenya
UN United Nations
UNDP United Nation Development Programme
UNFCC United Nations Framework Convention on Climate Change
UNCDD United Nations office to Combat Desertification and Drought
UNISDR United Nations International Strategy for Disaster Reduction
WEDO Women’s Environment and Development Organization
WMO World Meteorological Organization
WRMA Water Resources Management Authority
WFP World Food Programme

xvii
OPERATIONAL DEFINITION OF TERMS AND CONCEPTS
Adaptation: is the process of adjustment to actual or expected climate variability and its
effects (IPCC, 2014). In this study adaptation was defined as specific actions taken by
households to overcome effects of drought.
Climate variability: refers to fluctuations in climatic conditions from the long-term
meteorological average over a certain period of time (IPCC, 2014). In this study climate
variability is defined as variation in precipitation leading varying levels of drought.
Community: social group whose members reside in a specific locality and share government
and have a common cultural and historical heritage.
Community level factors: refers to social relationships occurring within the neighborhood
that influence individual’s adaptation to drought.
Disaster: It is a serious disruption of the functioning of a community or a society involving
widespread human, material, economic or environmental losses (UN, 2009). In this study
focused on the impacts of drought on household livelihoods such as crop failure, loss of
livestock, decreased crops and livestock production leading to hunger and increased poverty.
Drought: is a deficiency in precipitation below the norm over an extended period of time
usually a season or more which results in water shortage. It is classified as meteorological,
agricultural, hydrological and socio-economic drought (UN, 2009). This study refer to
meteorological drought which is defined by deficiency in precipitation over a predetermined
period of time. The SPI value for drought is ≤-1
Drought adaptation determinant: These are household socioeconomic characteristics that
support or limit the adoption of drought adaptation strategies.
Drought adaptation strategies: These are deliberate actions in place to transform drought
challenges into opportunities.
Drought characteristics: These are elements of drought such as frequencies, quantity and
magnitude in Laikipia West sub-County from 1984-2014.
Drought trend: This is the graphical representation of the observed drought years from 1984
to 2014 in Laikipia West sub-County.
Drought tolerant crops: These are crops that can withstand drought which are sorghum,
dolichos and green grams among others.
Economic effect: it refers to the consequences of drought on the household income in
Laikipia West sub-County.

xviii
Early warning systems: refers to the set of capacity needed to generate and discriminate
timely and meaningful warning information to enable individuals, communities and
organizations threatened by hazards to prepare and act appropriately in sufficient time to
reduce the possibilities of harm or losses (UN, 2009).
Effects of drought: refer to the consequences of drought on livelihoods. In this study
consequences of drought was analysed in terms of economic effects which are; herd losses,
decreased crop yields, crop failure, decreased milk yield, social effects: Mobility inside and
outside the sub County and health effects: livestock diseases, human diseases and
malnutrition. These effects were measured in percentages.
Health effect: it refers to the consequences of drought on the household health status in
Laikipia West sub-County.
Household: is used in the study to mean a composition of a person or group of persons
residing together within the same compound and has a household head in charge of decision
making.
Household adaptation: These are deliberate actions that are put by the households to
transform drought challenges into opportunities and increase crop and livestock productions.
Household characteristics: refers to composition by of household which are; household
head, source of income, land size and land ownership.
Household level factors: refers to household history and biological factors that influence
household behaviour and increase the likelihood of adapting to drought. They include source
of income, household size among others.
Household source of income: refers to a measure of the combined incomes of all people
sharing a particular household. In the study it was operationalized to mean; government
employment, business, maize farming, dairy farming, pastoralism and wheat farming.
Income levels: refers to an economic measure of a household income. In the study income
levels were operationalized as lower, middle and upper income groups.
Individual level factors: refers personal history and biological factors that influence how
individual behaves and increase their likelihood of adapting to drought. In the study they
were operationalized as age, level of education and agriculture training
Informal education: refers to acquisition of knowledge without enrolling in a school.
Institution : refers to the systems of rules that shape individual and collective decisions and
actions. In the study institutions were operationalized to mean non- Government

xix
organizations, elders, church organizations and government of Kenya agencies
Land ownership: refers to legal regime in which land is owned by an individual and has
legal documents.
Land size: refers to the number of acres of land an individual household holds
Level of education: It is the level of schooling one has attained. It was operationalized as
informal, primary, secondary and tertiary education
Livelihoods: is defined as assets and endowment and socio-economic strategies meant to
promote or protect household‘s well-being (Finan, West, Austin, & McGuire, 2002). In this
study livelihood refers to crop farming, salary, business and livestock keeping with an aim of
getting food and income.
Perception: in this study perception is a cognitive process of receiving information on
drought and transforming it into response and adaptation strategies. The respondents were
asked to describe the recent drought in the area. They described the 2009 drought as severe or
moderate.
Social effects: refers to the consequences of drought on the social fabric of the community
and well- being of the individual and families.
Agriculture Training: refers to dissemination of agriculture knowledge to farmers in
workshops, trade fair, field day and chief barazas.

1
CHAPTER ONE
INTRODUCTION
1.1 Background of the Study
Climate variability is one of the greatest challenges of our time (COP, 2009) and is
one of the biggest issues facing the world today (IPCC, 2014). Climate variability is expected
to increase the frequency and the severity of extreme weather events, such as extreme
precipitation, heat waves, and extreme drought, storms, tornadoes, and hail (Van Dorland et
al., 2011). The concerns are on impacts and adaptations of climate variability on agricultural
production and water availability because globally agriculture and water availability is
strongly influenced by weather and climate. Climate variability is expected to impact on
agriculture, potentially threatening established aspects of farming systems (Clark, Gornall,
Betts, Burke, Gornall, & Camp, 2010).
Climate variability results in fundamental alterations to ecosystem structures and
functions (Melese, Munyae, & Mulinge, 2013). These in turn affects human land-use and
livelihoods and have the potential to make pastoralists more vulnerable (Galvin, Thornton,
Boone and Sunderland, 2004). Climate change is a major contributing factor to conflicts,
particularly those concerning resource scarcity (Boko et al., 2007). In southern Europe crops
prevalent such as maize, sunflower and Soya beans could become viable further north and at
higher altitudes (Hildén et al., 2005; Audsley et al., 2006). Water is vital to plant growth
therefore varying precipitation patterns have a significant impact on agriculture.
Over 80% of total agriculture globally is rain-fed therefore, it is projected that future
precipitation changes would reveal the magnitude and direction of climate impacts on crop
production (Olesen & Bindi, 2002; Tubiello, Rosenzweig, Goldberg, Jagtap, & Jones, 2002).
Drought impacts vary from region to region (Parmeshwar, 2014). For instance in India,
climate models generally project a decrease in dry season precipitation and an increase during
the rest of the year including the monsoon season, but still with a large inter-model spread
(Christensen, 2007). In the decade from 2002-2012 India had three major droughts (2002,
2009 and 2012) with the 2012 drought causing 0.5% reduction in India’s gross domestic
product (GDP) (Manipadma, 2013). The cumulative damage arising from drought in
Thailand between 1989 and 2003 was estimated to be 4474.4 million THB or US $112
million (Pavelic et al., 2012). In 2010, Thailand faced its worst drought in 20 years resulting
in the water level of the Mekong River falling to its lowest level in 50 years (Danny, 2011).

2
African countries are among the most vulnerable to impacts of climate variability and
drought. The drought impacts adversely affect the wellbeing of the population. Drought
impacts in Africa are compounded by numerous factors such as poverty, high population
density and human diseases. This is expected to multiply the demand for water, food and
forage for livestock within the continent in the next thirty years (Okoro, Uzoukwu, &
Chiomezie, 2014). Drought is one of the critical natural disasters that adversely affect people,
river basins, water resource systems and ecosystems (Jahangir, Sayedur, & Saadat, 2013).
Assessment of drought conditions is critical for planning water supplies, irrigation systems,
crop and food security program, hydropower generation, water quality management and
waste disposal systems (Abad, Zade, Rohina, Delbalkish & Mohagher, 2013).
Africa is affected more severely by drought than any other regions (Yanda and
Mubaya, 2011). Increasing rainfall variability and frequent extreme climatic events especially
droughts and floods disrupt agricultural production leading to famine and severe loss of
livelihoods. Prolonged dry years have reduced the ability of African societies to cope with
droughts (Muthui, 2007). Between the early 1970s and the mid 1990s the African Sahel
experienced one of the most dramatic long-term changes in climate observed anywhere in the
world in the twentieth century, with rainfall declining on average by more than twenty per
cent (Hulme, Doherty, Ngara, New & Lister, 2001).
The above period of climatic desiccation was associated with a number of very severe
droughts, most notably in the early 1970s and 1980s, during which hundreds of thousands of
people and millions of animals died (Glantz, 1976 & 1996). Niger witnessed severe food
insecurity in 2001, 2005, 2010, and 2012 that resulted in appeal for international
humanitarian assistance and food relief due to drought. Drought was the principle trigger for
spikes in food prices and conflicts over pasture and water; it was highly correlated with some
crop pests and diseases, and it aggravates mortality and morbidity due to livestock diseases
(World Bank, 2013). Drying trends have also been observed in the northern Congo basin and
may continue resulting in a transition to savannah in the region (Warren, 2006). In East
Africa, it has been projected that water availability will decline due to drought. In addition,
there is a likelihood of increased desertification due to decline in precipitation especially
during the dry months (Wilby, Orr, Hedger, Forrow & Blakmore, 2006). These climate
changes in East Africa will have serious implications for water resources, food security, the
spread of disease, the productivity of natural resources, sea-level rise, and desertification. The

3
people at high risk in times of climatic variability are those living on flood plains, coastal
areas, mountains as well as those having no means of adapting to changes (Holmgren &
Oberg 2006). Disaster risk management, adjustments in technologies and infrastructure,
ecosystem-based approaches, basic public health measures and livelihood diversification are
reducing vulnerability, although efforts to date tend to be isolated (IPCC, 2014). According to
Kenya National Water Development Report (2006), Kenya has a long history of floods and
droughts. Both climatological records and oral knowledge show that the droughts with severe
occurrence resulting to both human and ecological impact occurred in the following years:
1928, 1933, 1934, 1942, 1944, 1952, 1955, 1960 and 1965. Over the past 50 years, Kenya has
experienced at least one main drought per decade (FAO, 2010). Droughts in Kenya have
impacted adversely on rain fed agriculture, water resources, hydropower generation and
ecosystems. The agricultural sector alone which contributes to more than 51% of the gross
domestic product (GDP) in Kenya (Mwangi, Watterhall, Dutra, Giuseppe & Pappenbenger,
2013) has been critically affected by frequent droughts.
In the recent past, there has emerged a need for perception studies on drought because
different people perceive drought differently and derive local adaptation measures based on
their individual perception. According to Jones et al. (1999) planned adaptation to future
climate will be based on current individual, community and institutional behavior. Previous
research has shown that individual risk perceptions may deviate considerably from expert risk
assessments and that risk perceptions are to a large degree shaped by personal experiences
with the hazard (Slovic, 2000). Knowledge about individual perceptions of risk is relevant
information for the formation of an effective climate variability adaptation policy for policy
makers (Botzen, Aerts and van den Bergh, 2009). Perceptions to climate variability in Kenya
differ from one region to the other as reflected in such studies as Byg and Salick (2009),
Petheram, Zander, Campbell, High, and Stacey (2010) and Shisanya and Khayesi (2007).
Over 80% of the Kenyan population earns their living through farming and
employment in the agriculture sector (Mose, 1999). According to Jaetzold and Schmidt
(2011) the main agro ecological zones (AEZs) in Kenya are based on their probability of
meeting the temperature and water requirements of the leading crops. The main agro
ecological zones refer to potentially leading crops; maize zones, wheat zones, un-irrigated
rice zones, irrigated rice zones, sorghum zones, finger millet zones and Cotton in zones while
livestock is possible in all zones (Jaetzold, Schmidt, Hornetz, & Shisanya, 2011). Over 80%

4
of Kenya land mass fall under arid and semi arid lands (ASAL), which are prone to frequent
drought. About one third of Kenya’s population lives in ASAL and largely depends on rain-
fed agriculture as their source of livelihoods. However, most of the agricultural activities are
constrained by recurrent droughts (Huho, Ngaira & Ogindo, 2010). FAO (2010) established
that between 1996 and 2010, Kenya had a total of 9 natural disasters and 3 combined natural
and human-induced disasters. Over 70% of the natural disasters in Kenya are associated with
droughts and extreme weather conditions. The severity and frequency of droughts in the
country have been increasing over the years (Wilby et al., 2006).
The human sufferings that accompany prolonged drought provide an indication of the
vulnerability of the country to climate variability (Nyongesa, Saumtally & Bindi, 2008). The
most recent severe drought by the time of data collection in the study was recorded in 2009.
The 2009 drought caused devastation in Kenya’s dry lands including loss of beef cattle
camels and sheep (KFSSG, 2011). The situation in Kenya is made worse by the presence of
over 450,000 refugees who are victims of civil unrest (KCCAP, 2013) who depends on the
government support during drought. As an adaptation measure to increasing drought severity
in Kenya, subsistence farmers’ turn to non-agricultural activities such as burning charcoal
and sand harvesting that degrades the immediate environment (Huho et al., 2010).
There are different individual drought perceptions which consequently lead to
different household and community drought adaptation strategies. Such strategies may
include: livelihood diversification, selling of livestock, weather predictions, forecasts and
warnings, land use planning; water storage among others. Laikipia west sub-County faces
frequent drought and occasional flash floods which results in negative socio-economic and
environmental effects (Huho et al., 2010). Economic, social, environmental and health effects
of drought and household drought adaptation strategies in Laikipia West sub-County is not
well understood. The existing studies on assessment of perception in Kenya have focused on
climate variability. There is need for studies that focus specifically on drought perception
since perception have an influence on household drought adaption strategies. Understanding
the physical nature of drought hazards and the corresponding impacts and underlying
vulnerability and communicating these dangers in an effective manner forms the basis for
developing informed drought adaptation and preparedness measures to reduce the effects of
drought while contributing to drought resilient societies (UN, 2009).

5
1.2 Statement of the Problem
Frequent droughts have occurred in Kenya in the last 30 years resulting to food
insecurity, scarce pasture, loss of livelihoods and human lives. Laikipia West sub-County is
more vulnerable to drought because of over reliance on rain-fed agriculture and natural
pasture just like most arid and semi-arid parts of Kenya. The major sources of livelihoods in
Laikipia West sub-County are maize farming and livestock keeping, sectors that are
vulnerable to drought. The proximity of the region to Mount Kenya National Park results to
invasion of farms by elephants during drought which lead to crop loses. In addition, frequent
land use conflicts between pastoralists and crop farmers in Laikipia West sub-County, usually
triggered by drought, motivated the study.
There are national level efforts to mitigate effects of drought in Kenya. These include
National Agriculture and Livestock Extension Program (NALEP), food relief, generation and
dissemination of climate forecasts, as well as ministerial and institutional (for example
National Drought Management Authority) intervention programs such as: Njaa Marufuku,
ASAL based and rural livelihoods support program, Laikipia Community development
assistance among others. Despite these national-level efforts, severity of droughts on
household livelihoods such as crop and livestock remain unclear in Laikipia West Sub-
County. There is need for an integrative approach that is cognizant of the physical and socio-
economic effects of drought in Laikipia West sub-County. Against this background, this
study sought to quantify and assess the effects of drought on livelihoods in Laikipia West
sub-County. The study also sought to find out the effects of 2009 drought in Laikipia West
sub-County and the household and community drought adaptation strategies in place.
1.3 Objectives of the Study
1.3.1 Broad Objective
The broad objective of the study was to make contribution to the understanding of the
effects of drought on household livelihoods and adaptation strategies in Laikipia West sub-
County, Kenya.
1.3.2 Specific Objectives
i. To analyze temporal drought trends in Laikipia West sub-County from1984 to 2014.
ii. To determine the effect of drought events on household livelihoods in Laikipia West
sub-County.

6
iii. To establish household perceptions to drought disasters in Laikipia West sub-County.
iv. To identify the most preferred drought adaptation strategy and adaptation
determinants in Laikipia West sub-County.
v. To evaluate the role of institutions in managing local level drought adaptations in
Laikipia West sub-County.
1.4 Research Questions
The study was guided by the following research questions;
i. How are the temporal drought trends in Laikipia West sub-County from 1984 to
2014?
ii. What are the effects of drought on household livelihoods in Laikipia West sub-
County?
iii. How do households in Laikipia West sub-County perceive drought disasters?
iv. What are the most preferred drought adaptation strategies and adaptation determinants
in Laikipia West sub-County?
v. What is the role of institutions in managing local level drought adaptations in Laikipia
West sub-County?
1.5 Justification of the Study
Drought is the most important agricultural risk with high probability and severity
affecting both crop and livestock production (World Bank, 2013). Impacts from recent
climate-related extremes, such as heat waves, droughts, floods, cyclones, and wildfires,
reveal significant vulnerability and exposure of some ecosystems and many human systems
to current climate variability (IPCC, 2014). There is need to quantify drought according to
severity, frequency, magnitude and spatial distribution and its effects on agriculture and
livestock (Recha, 2013). Analysis of drought characteristics in Laikipia West sub-County is
meant to identify, classify and quantify seasonal and annual drought years in the sub-County
between 1984 and 2014. The study also assessed household perceptions and factors
influencing their perception to drought which is important in understanding household
drought adaptation strategies. Research shows that any attempts to elicit adaptive behaviour
patterns should come after understanding how climate variability is perceived by stakeholders
and what shapes their perceptions (Diggs, 1991; Shisanya & Khayesi, 2007; Slegers, 2008;
Weber, 2010).

7
The Ministry of Special Programs drafted a National Disaster Management Policy
that established the guiding principles and institutional framework for disaster management
in Kenya (MOSSP, 2010). The policy stipulates that communities will be involved in
designing, management, implementation, monitoring and evaluation of disaster management
programs (TIK, 2012). Evaluation of drought adaptation determinants and drought adaptation
strategies in Laikipia West sub-County provides an understanding of household and
community drought adaptation strategies during drought. The study provides understanding
of the factors influencing adaptation strategies across the households. The result on
adaptation strategies and determinant is expected to inform the Ministry of Environment and
Natural Resources on existing drought adaptation strategies in Laikipia West sub-County that
can be used as a bench mark when assessing the implementation of the National Climate
Change Response Strategies in Kenya (2010) and National Climate Change Act 2016. The
study further contributes to the nation food security goal on the improvement of research and
extension services and improving their linkages.
Evaluation of the role of institutions is expected to improve the understanding of the
role played by various institutions in managing local level drought adaptation in Laikipia
West sub-County. While drought adaptation efforts frequently focus on the technical and
managerial aspects of drought planning and response, there are frequent acknowledgements
of the need for additional research to improve understanding of how the broader system of
institutional frameworks, social networks, and stakeholder values and beliefs affect society’s
capacity to manage drought (Lackstrom, 2015).
1.6 Scope and Limitation
Climate variability variables include drought, within season dry spells, onset,
cessation, rainfall amount and intensity among others that negatively affects livelihoods. In
this study, drought was chosen because it has been a major threat to households’ livelihoods
in Kenya in the last 30 years (Huho et al., 2010). The study assessed the effects of drought on
household livelihoods. The effects of drought were divided into two categories. The first
category was on the direct effects of drought on household livelihood which was limited to
the effects on crops and livestock. The second category was on indirect effects of drought on
household wellbeing which was limited to environment, social and health effects. For
instance, drying of rivers increases the distance to the water points which consume

8
households’ time in accessing the resource. The time spent on getting water could have been
utilized on generation of income. The effects of drought and adaptation strategies were
limited to 2009 as it was the most recent severe drought at the time of conceptualizing the
study, and therefore respondents were more likely to recall. Literature showed that it is easier
for farmers to recall more recent and/or extreme events than older or moderate ones (Taylor,
1988).
Data on the number of households was based on the records kept by the Kenya
National Bureau of Statistics. The administration of questionnaires targeted the household
heads. In the study the household head was the senior most persons present in the household
during the time of data collection. The household was selected as the main unit of analysis
because major effects of drought are more severe at household level and decisions about
adaptation to climate-induced stresses and livelihood processes are taken at that level
(Thomas, 2008). The study also focused on the community level because the Hyogo
framework for Action (2005-2015) emphasizes the need for the study on effects of drought
and adaptation strategies at the community level. From the earlier study it was noted that
disaster effects ratios increase as the unit of analysis moves from the national to the regional,
community and household levels (CDRSS, 2006).
Rainfall data was collected from WRMA rainfall stations for 30 years (1984-2014).
The 31 year was chosen because it is the minimum recommended period for climatological
analysis (WMO, 2012). There were Rumuruti, Nyahururu, Mokogondo forest, Thomson falls
and Ndaragwa rainfall stations within the study area. However, only data from Rumuruti and
Ndaragwa stations were used. Rainfall data from Mokogondo, Thomson falls and Nyahururu
stations were found to be inadequate to support a climatological analysis given the gaps
found. Laikipia West sub-County was chosen as the study area due to the variation in
livelihood options from humid mixed livelihood zones and sub- humid agro-pastoralism
livelihood zone. The choice of Laikipia West sub-County was informed by the fact that,
drought effects on household livelihood and adaptations strategies vary with the households
source of livelihoods. Although Ndaragwa station is not within the study area it was used due
to its proximity to Mutara a location within the study area and could have significant effect
on the livelihood activities in the location.
Analysis of effects of drought on crops and livestock was limited to household survey
data. This was in part attributed to lack of livestock data from Laikipia West Sub County

9
Livestock department. Notwithstanding, households information on effects was deemed
sufficient for a perception study as it gives the direction on the most affected livelihoods.
There are different methods of analyzing and quantifying drought based on type of drought
(WMO 2006). In this study, the focus was on meteorological drought because it has a direct
effect on crops and pasture in the study area. The level of education among household was a
challenge during data collection exercise. This caused delays during data collection process.
The delays were occasioned by difficulties in reading the questions among households and
required explanations at every stage.
1.7 Assumptions of the Study
The study made the following assumption
I. Rainfall is the most significant climate element (relative to other climate elements) that
affects livelihoods; notably maize and livestock in Laikipia West sub-County
II. The people of Laikipia West sub-County are engaged in adaptation practices to cushion
themselves from the effects of drought
III. Information collected from the respondent was accurate and relevant to the study

10
CHAPTER TWO
2.0 LITERATURE REVIEW
2.1 Introduction
This chapter interrogates relevant studies on global drought characteristics and trend,
effects of drought on resources and livelihoods, perception of climate variability and
associated effects, household adaptations to drought, drought disasters and preparedness,
institutional components of drought adaptations, theoretical framework and conceptual
framework.
2.2 Global Drought Characteristics and Trend
Drought occurs in every part of the globe and adversely affects the lives of a large
number of people, causing considerable damage to economies, the environment, and property
(Ominijo and Okogbue, 2014). Globally, drought has become more frequent and severe
(Wambua, Mutua and Raude, 2014). Drought characteristics and impacts vary significantly
from region to region (Wilhite, 1997). The magnitude of drought is indicated by extend with
which it falls below a threshold level over an extended period of time (Morid, Smakhtin and
Bagherzadeh, 2007). The magnitude and location of drought events in Jordan varies by the
season and months and tends somehow to increase with time (Al-Qinna et al., 2010).
Droughts tend to be more severe in some areas than in others (Ominijo and Okogbue, 2014).
The severity and frequency of droughts in Kenya have been increasing over the years. Some
of the recognizable droughts events include 1952-1955, 1973-1974, 1983-1984, 1992-1993,
1999-2000 and 2009-2011 droughts (Wilby, Hedger, Forrow and lakmore, 2006). The
severity of drought is gauged by the degree of moisture deficiency, its duration, and the size
of the area affected. If the drought is brief, it is known as a dry spell, or partial drought. A
drought spell is usually defined as more than 14 days without appreciable precipitation. Near
normal dry or mild drought was predominant in the 100 years of study.
Mild drought has the highest number of occurrence in the northern Nigeria (Ominijo
and Okogbue, 2014). Droughts events in Jordan were observed in 1970, 1973, 1977, 1978,
1979, 1982, 1984, 1986, 1993, 1996, 1999, 2000, 2001 and 2004 (Al-Qinna et al., 2010. Iran
experienced recurring drought events leaving an estimated 37 million (over half the country’s
population) vulnerable to food and water shortage. Twenty provinces experienced
precipitation shortfalls during winter and spring (Agrawala et al., 2001). Extreme drought

11
events were documented in 1964, 1983, 1997, 2005 and 2010 in Amazon basin, with great
impacts on the population and ecosystems (Tomasella et al., 2013). In addition, severe
flooding episodes have been documented in 1954, 1989, 1999, 2009, 2011 and 2012 in the
Amazon (Marengo,Tomasella, Soares, Alves and Nobre, 2011). Droughts in many parts of
the world are part of normally occurring inter-annual climate variations, and although El
Niño events may cause or intensify drought conditions, many droughts are independent of the
El Niño phenomena. This variable as a cause of drought is exemplified in Southern Africa,
where there is a strong correlation between the ENSO and rainfall patterns (Wright 1977), but
not all droughts are correlated to ENSO events and conversely not all ENSO events result in
drought conditions. According to Muga (2010) inter-annual climate variability (ENSO) has
huge impacts on the African climate. Warm ENSO events also referred to as El Niño events
produce abnormally high amounts of precipitation in parts of equatorial Africa.
According to IPCC (2007) East Africa has been faced by large variability in rainfall
with occurrence of extreme events in terms of droughts and floods. The region has
experienced droughts in the last 20 years -1983/84, 1991/92, 1995/96, 1999/2001, 2004/2005.
El-Niño related floods of 1997/98 were a very severe event enhanced by unusual pattern of
SST in the Indian Ocean. The El Niño in 1997/98 and La Niña in 1999/2000 were the most
severe in 50 years. A frequency distribution analysis of seasonal or annual rainfall amounts is
of great value giving estimates of probabilities of having more (or less) rainfall than certain
specified amounts (Tilahun, 2006). According to Williams and Funk (2011) global
temperature have grown more positive and convection and rainfall have increased over the
Indian Ocean in recent decades, precipitation totals during the long-rains season in eastern
Africa have declined. In Ethiopia and Kenya, which are reasonably well instrumented with
meteorological stations, precipitation declines have been most severe in the central and
eastern regions.
It has been documented that in sub-Saharan Africa, eight major droughts have
occurred in the last four decades: 1965/66, 1972/74, 1981/84, 1986/87, 1991/92, 1994/95,
1999/2001 and 2005/06 (Nikola, 2006). According to the National Environmental
Management Authority’s, Kenya (NEMA, 2010) serious droughts have occurred at least 12
times in the past 50 years in Kenya. Drought occurs as the result of large inter-annual and
seasonal variability in precipitation (Boochabun, et al., 2004). Drought occurs mainly due to
uneven distribution of rainfall over an area within a year or within a rainy season

12
(Limpinuntana, 2001).
Assessment using SPI and NDVI in Jordan showed that the country, during the past
35 years, faced frequent non-uniform cycles of drought/wet periods in an irregular repetitive
manner. Drought seasons appear in a random fashion of either short or long life span from
one to three consecutive years. Obviously, the severity of the observed drought incidences
increases in both magnitudes and life span by time from normal to moderately severe level
and one exceptional extreme drought level during 1999–2000. Drought in Jordan act
intensively during January, February and March and shift its position with time by alternative
migrations from the southern desert parts to northern desert parts and from the eastern desert
parts to highlands and JRV at the west (Al-Qinna et al., 2010). In the Sahel region dry
conditions occur during periods in which the southern hemisphere oceans and northern Indian
Ocean are warmer than the remaining northern hemisphere oceans, and it is a shift to such a
pattern of global temperature distributions that is now widely accepted as being responsible
for the turn towards aridity in the Sahel from the late 1960s (Giannini, Saravanan & Chang,
2003).
2.3 Global Effects of Drought on Resources and Livelihoods
Drought is a form of environmental stress that originates from a deficiency in
precipitation over an extended period of time long enough to cause moisture deficiency,
biotic loss, crop failure, loss of lives both human and bovine and general hardships (Ngaira,
2004). Drought is a deficiency in precipitation or a departure from expected or normal
rainfall conditions and a naturally part of climate variability (Lackstrom, 2015) that affects a
greater part of Laikipia West sub-County. Drought can be said to occur when rain falls below
half the long-term average or when rainfall in two or more successive years falls 75% below
average (Pratt, Le Gall & De Haan, 1997). Droughts have direct and indirect effects on
livelihoods especially where they are weather dependent. Prolonged droughts in the food-
insecure regions may cause famine, epidemics, and deaths, generate water crisis due to drying
up of perennial streams, food security and overall economic development (Karim & Rahman,
2014). Drought is one of the major threat among natural hazards to peoples livelihood and
social economic development (UN, 2009) it affects grasslands causing massive livestock and
wildlife deaths and an increase in human to human and wildlife to human conflicts (GOK,
2010). Despite the growing understanding and acceptance of the importance of disaster risk
reduction and increased disaster response capacities, disasters and in particular the

13
management and reduction of risk continue to pose a global challenge (HFA, 2005). Disasters
triggered by prolonged drought in developing countries can severely harm countries to
malnutrition, famine, loss of life and livelihoods, emigration and conflict situation; whereas
drought in developing countries primarily results in economic losses (UN, 2009).
Disasters induced by drought account for about 90% of all disasters in the horn of
Africa (UNISDR, 2012). In the Asian region, in particular India and China drought disasters
recorded the largest number of human death from 1980 to 2006 (UN, 2009). The East African
region is prone to natural disasters such as floods, drought, landslides, strong winds,
lightening and their secondary impacts such as diseases and epidemics. Drought and floods
are the most common in the East African region (UNISDR, 2012). In West Africa, disasters
triggered by natural hazard event have increased in occurrence and severity over the last
decades. Impacts of disasters have resulted into high vulnerability of West African people
and slow down the process of sustainable development to achieve the millennium
development goals in the sub region (UNISDR, 2012). Drought has been a severe challenge
faced by many crop and livestock producers in the United States in 2011 and 2012. Nearly
80% of United States agricultural land experienced drought conditions during the summer of
2012, the effects of which exacerbated the initial drought impacts of 2011 and are expected to
be felt for years to come (Wallander, Aillery, Hellerstein, and Hand, 2013).
Drought is one of the major scourges of humanity with its devastations manifested in
form of negative economic effects, massive malnutrition, human miserly and death to both
livestock and people. While drought effects are often measured in terms of economic losses
such as crop failure and livestock losses, drought conditions are also associated with
decreased levels of employment, income, nutrition, and health (Chagnon, 2000; Glantz, 1994;
Vogel, 1995). The extension of agriculture push pastoralist to historically marginal areas in
the Sahel region. These led in massive loss of livestock, the destruction of communities and
livelihood systems, and massive societal disruption on a regional scale in the Sahel (Keita,
1998). According to a study by Marshall and Hildebrand (2002) in North Africa, pastoralism
was the most sensible and viable option in the unpredictable northern African environment,
where reliable supplies of large quantities of permanent water simply did not exist. Far from
being a poor substitute for agriculture or urban living, or the result of a backwardness that
prevented the peoples of the time from advancing, pastoralism was a superior system for
ensuring food security in the African environment.

14
Pastoralism is widely practiced today and remains a dominant feature of rural East
Africa in which most households sustain their means of livelihood from keeping livestock
(Anderson & Mowjee, 2008). However, it is practiced under marginal circumstances and
high production risk because of different natural and man-made factors (Bekele & Amsalu,
2012). Since much of the pastoral household's consumption requirements are derived from
livestock or exchange with livestock products, loss of livestock due to drought is a serious
risk for the livelihoods and socio-cultural fabrics of the pastoral households (Aklilu &
Alebachew, 2009). Household herd size has extremely declined from time to time because of
the related effects of the drought such as lack of pasture and water, emaciated body condition,
susceptibility to disease, death, low production, productivity and reproduction rate, and
reduced pastoralists’ terms of trade. In addition, increased severity and frequency of drought
has affected pasture seed bank, reduced germination, growth, sprouting and regeneration
capacity of nutritious grasses, bushes and herbaceous pasture in an alarming rate (Bekele &
Amsalu, 2012). Globally, El Niño-related droughts, when coupled with high temperatures
and abnormal rainfall distribution, produce lower than average yields of rice, maize, wheat
and other agricultural products (Allen, 1996). The severity of drought has posed serious
pasture and water scarcity (Bekele & Amsalu, 2012). Water is the most fundamental physical
capital that has shaped pastoral society (Helland, 1997; Cossins & Upton, 1987).
According to Alcamo et al. (2007) decreased crop production in some Russian
regions could be compensated by increased production in others, resulting in relatively small
average changes. However, their results indicate that the frequency of food production
shortfalls could double in many crop growing areas in the 2020s, and triple in the 2070s.
Although water availability in Russia is increasing on average, the water resources model
predicted more frequent low run-off events in the already dry crop growing regions in the
south, and a significantly increased frequency of high run-off events in much of central
Russia (Alcamo, Dronin, Endejan, Golubev & Kirilenkoc, 2007).
According to Li, Wang and Yan (2009) 60–75% of observed yield reduction rates can
be explained by a linear relationship between yield reduction rate and a drought risk index
based on the present day severity index. Present-day mean yield reduction rate values are
diagnosed as ranging from 5.82% (rice) to 11.98% (maize). By assuming the linear
relationship between the drought risk index and yield reduction rate holds into the future. Li
et al. (2009) estimated that drought related yield reductions would increase by more than

15
50% by 2050 for the major crops. According to Tilahun (2006) it is essential to take into
account the unique rainfall characteristics of arid and semi-arid lands so as to be able to
optimally utilize the low rainfall areas for agricultural purposes. Drought sets a vicious cycle
of socio economic effects beginning with crop failure, unemployment, erosion of assets,
decrease in income, worsening of living conditions, poor nutrition, and subsequently,
decreased coping capacity, and thus increasing vulnerability of the poor to another drought
and other shocks as well as the risk of political instability (UNISDR, 2012). The situation is
made worse by the ever increasing world population. The impact of rapid population growth
on food security has received considerable attention over the past decades (Pinstrup-
Anderson, 1995). Population growth continues to out-strip food availability in many
countries and evidence from many developing countries indicates that countries with high
population growth are the same countries suffering from acute food insecurity (FAO, 2009).
Droughts of the 1980s and 1990s resulted in reduced livestock production and maize yields
(Harsch, 1992; Laing, 1992), including a 50% crop failure in one region of South Africa
(Vogel, 1995).
According to IPCC (2014) climate variability and extremes have long been important
in many decision-making contexts. Climate-related risks are now evolving over time due to
both climate variability and development. According to Sokona and Denton (2001) climate
variability is already exerting control over development progress, including efforts to address
food security and poverty alleviation in sub-Saharan Africa. On many occasions extreme
climate variability events leave vulnerable people in Africa and indeed in other regions of the
world totally unprepared and unable to cope. Climate change accentuates the gaps between
the worlds rich and poor. An estimated 17.5 million people are food insecure in Kenya,
Ethiopia, and Somalia, the US government has spent over $1.1 billion on food aid in these
countries since 2009. Food balance modeling suggests that this insecurity stems (in part) from
stagnating agricultural development, population growth, and recent drought (Funk, et al.,
2008; Funk & Brown, 2009).
In many societies vulnerability differs between men and women. Women are
vulnerable to environmental changes because of their responsibilities in the family, which are
exacerbated by the impacts of climate variability. Since access to basic needs and natural
resources, such as food, water and fuel, becomes hampered, women’s workload has increased
(Dankelman et al., 2008). As drought hits, women’s role become harder. They have to walk

16
further to find water and other resources and at the same time there is less food and they miss
out a meal in order that children feed (REGLAP, 2011). There is accepted view in the
developing world that women are amongst the poorest and most disadvantaged group in the
society and 70% of the 1.3 billion people in the developing world living below the poverty
threshold are women (Sokona & Denton, 2001) making them the most vulnerable group. The
climate of East Africa is characterized by a great spatial variability, ranging from arid and
semi-arid to sub humid and humid conditions. Rainfall is highly variable yet it supports
farming and environmental system in the region (UNISDR, 2012). According to Kettlewell,
Sothern & Koukkari (1999) the proportion of total rain falling in heavy rainfall events
appears to be increasing, and this trend is expected to continue as the climate continues to
warm. Soil moisture management in semi-arid and arid areas of the tropics is faced with
limited and unreliable rainfall and high variability in rainfall pattern.
According to Mpandeli and Maponya (2014) Sekhukhune District in Limpopo
Province South Africa, low rainfall results in decreases in agricultural activities including
shortage of drinking water, loss of both livestock and crops and also lack of grazing capacity.
According to Pachauri (2004) a decline in agriculture production would have serious
implications on the rural populations and this would lead to food insecurity, reduced income
and livelihoods of the poor. In recent years, food production has lagged far behind population
growth in nearly two thirds of developing countries (FAO, 2007). The Sub-Saharan region
was hard hit as food production fell in 31 of the 46 African countries (FAO, 2005).
2.4 Effects of Drought on Livelihoods in Kenya
Kenya has a landmass of about 582,350 km2 with only 17% of arable land while 83%
consists of arid and semi-arid land (NCCRS, 2010). Climate-driven changes affect resources
critical for economic development of Kenya. An example is the 1999/2000 La Niña droughts,
which left approximately 4.7 million Kenyans facing starvation (NCCRS, 2010). Drought has
become a perennial problem in Kenya with chronic vulnerability being concentrated in
ASALs. With decreasing rainfall reliability, famine cycles have reduced from 20 years (1964-
1984) to 12 years (1984-1996), to two years (2004-2006) and to yearly
(2007/2008/2009/2010/ 2011 (GoK, 2010). During the 1971-1974 droughts the Kenya
nomads suffered heavy losses, and the subsequent famines were compounded by an outbreak
of cholera and high incidence of malnutrition (Wisner 1977). The 2008-2009 droughts in
Kenya left 3.8 million pastoralists and agro-pastoralists in dire need of food relief and 1.5

17
million primary school children required feeding in the schools (KFSSG, 2009). Many
children and women starved in dry lands and others continued to suffer malnutrition due to
lack of balanced diet, especially milk and meat which is their main diet, as men left with their
herds to look for pasture and water. The poor households in urban areas suffer the effects of
drought due to escalation of food prices (KFSSG, 2009).
According to PFE (2007) pastoralism is a livelihood system and way of life practiced
by people dwelling in arid and semi-arid environments, using mainly traditional knowledge
to optimize the interaction between humans, the environment and livestock. Pastoralists are
people who primarily derive their living from the management of livestock (sheep, goat,
camel and cattle) on rangelands. According to Opiyo, Wasonga and Nyangito (2014) drought
was one of the most frequent hazards among pastoralist in Turkana, in addition to other
hazards such as conflicts, disease outbreaks and flooding. The people who are already poor in
this remote part of the Kenya are struggling to cope with the added burden of increasingly
unpredictable weather, which is triggered by climate variability. Drought affects grasslands
causing massive livestock and wildlife deaths and an increase in human-human and wildlife-
human conflicts. Cases of conflict have been reported in areas around the Lower Tana Delta,
Laikipia, and Lagdera. In Lagdera in 2005 warthogs attacked and killed goats and sheep to
drink their intestinal fluids after the warthog’s natural watering points dried up (NCCRS,
2010).
Satellite assessment on Kenya forests indicate that, between 2000 and 2007, Kenya
lost 72% of its indigenous forests (GoK, 2009). It is therefore possible that the severity of
drought in Kenya in 2009 and 2011 may have been, to some extent, attributed to the effects
of devastating forest loses in the 2000-2007 period when the Country lost 72% of its forest
cover. The projected rise in temperature and long periods of drought will lead to more
frequent and intense forest fires. Major rivers flowing from the major water towers in Kenya
including the Tana, Athi, Sondu Miriu, Ewaso Ngi’ro and Mara experience severe reduced
volumes during drought and many seasonal ones completely dry up. The parts of the country
mostly affected are the Eastern, North Eastern and parts of the Rift Valley region (NEMA,
2010). According to Karanja (2013) there is significant relationship between rainfall
characteristics and potato production in Oljoro-orok division, Nyandarua County. It is
important to understand the nature of variability of rainfall so as to be able to optimally
utilize the low rainfall areas for agricultural purposes. According to Kipkorir (2002) rainfall

18
is the most important environmental factor limiting agricultural activities in arid and semi-
arid regions of the tropics. Although irrigation is believed to be an important strategy in alle-
viating the current food crisis, rain-fed agriculture is still the dominant practice in most
developing countries.
According to Gullet, Asha, Ahmed and Mwangi (2006) prolonged periods of high
temperatures and increasingly poor rainfall in Kyuso district, Kitui County were primarily
responsible for the surge in crop and livestock diseases, total crop failure, livestock deaths,
increased food insecurity as well as rising poverty levels. In addition, there has been a notable
increase of drought in terms of frequency, duration and intensity. Any damage caused by
drought on agriculture and water resources leads to famine, humanitarian crisis, rationing of
water supply and decline in hydropower generation. Effective drought forecast allows water
resource decision makers to develop drought preparedness plans. Such plans are critical for
advance formulation of programs to mitigate drought-related environmental, social and
economic effects. Therefore, accurate drought assessment and forecasting with an adequate
lead time is paramount for formulation of mitigation measures in river basins (Sharda,
Srivasta, Kalin, Ingram & Chelliah, 2012).
2.5 Perception of Climate Variability and Associated Effects
Drought adaptations depend on how it is perceived at household level. The way local
communities perceive drought influence their adaptation strategies. Different people perceive
drought differently and derive local adaptation measures based on their individual level
perception. Research shows that any attempts to elicit adaptive behavior patterns should
come after understanding how climate variability is perceived by stakeholders and what
shapes their perceptions (Diggs, 1991; Shisanya & Khayesi, 2007; Slegers, 2008; Weber,
2010). Lack of understanding or poor perception of climate variability risk relative to other
risks among a large part of the population may lead to mal-adaptation (Leiserowitz, 2005;
Weber, 2006; Reynolds, Bostrom, Read & Morgan (2010). Tschakert (2007) characterized
the understanding of climate variability and change in the context of multiple livelihood risks.
Research findings underline the importance of tackling both climatic and non-climatic
conditions in enhancing adaptation.
According to Shisanya and Khayesi (2007) residents of Nairobi do not perceive
climate change as being a significant problem when compared to other socio-economic
19
problems such as corruption, unemployment, crime, garbage and poverty. Understanding
individuals’ perceptions of, or concern about, extreme weather events is very important for
designing and implementing climate adaptation policies. Individual judgments of climate
change-related risks can determine the perceived legitimacy as well as compliance with
adaptation policies (Peacock, Brody & Highfield, 2005). Climate variability is a complex
problem for individuals (Swim, Clayton, Doherty, Gifford, Howard, Reser, Stern and Weber
(2011), which implies that understanding the cognitive dimension and perceptions is very
important for climate variability adaptation. The absence of perceived importance to the
public and lack of public awareness or demand to take action are the main hurdles to
implementation of adaptation projects (Archie, Dilling, Milford, & Pampel, 2012).
Individual perceptions of natural hazards are important factors influencing decision-
making mitigating these risks (Burn, 1999; Flynn, Slovic, Mertz, & Carlisle., 1999). For
example, high flood-risk perceptions of individuals are related to a high demand for flood
insurance (Botzen & van den Bergh, 2012). Similarly to the household level, perceptions of
extreme weather risks at the organizational level can be expected to be an important factor
influencing the resources that an organization is willing to devote to drought adaptation.
According to Vasileiadou and Botzen (2014) individuals who have experienced an intense,
life threatening event have a significantly higher level of concern than those without such an
experience. This suggests limited intervention possibilities for communication of adaptation,
as well as for raising support for adaptation measures. Framing adaptation measures in
relation to personal circumstances and emotions during extreme events could help raise
concern about extreme weather events, as well as societal support for adaptation measures.
According to Recha (2013) the term climate change was very familiar with the
participants in Tharaka as they had heard it from the radio and agricultural officers. There
was unanimous agreement that there was climate change in Tharaka and this was attributed to
cutting of trees which had a cooling effect on the environment. According to Ndambiri, et al.
(2012) majority of the farmers were well aware that climate was changing and it was the
cause of the recurrent droughts that were ravaging the district. Majority of the farmers noted
that there was an increase in temperature, extended periods of temperature, a decrease in
precipitation, changes in the timing of rains and an increase in the frequency of droughts.
According to Hudson (2002) farmers’ perceptions of drought effects on livestock prices vary
widely. Although about 33% of the commercial and 20% of the communal farmers report that
20
drought has no effect on livestock prices, most farmers think that livestock prices fall from
10% to 50% during drought. On the average, commercial farmers report that cattle prices
decrease about 15% during drought conditions, and communal farmers report an average
decrease of 27%. Due to the lower market prices of livestock, many commercial farmers do
not sell animals in drought conditions unless they can receive the normal price for their
animals.
2.6 Household Adaptations to Drought
Drought is a serious global concern and a threat to food security for the rising global
population. While change in mean climate will have significance for global food production
and may require ongoing adaptation, greater risks to food security may be posed by changes
in year-to-year variability and extreme weather events. According to FAO (2008) the current
farming systems in the world today are adapted to local climate due to climate variability.
While coping strategies usually refer to short-term activities, they can be expanded for use in
the longer term. Adaptation strategies refer to all those responses to climatic conditions that
may be used to reduce vulnerability (IPCC, 2001; Adger, Kelly, Winkels, Huy & Locke,
2002). Adger et al. (2002), argue that adaptation will allow a system to reduce risks
associated with hazards by reducing its social vulnerability. What constitutes extreme
weather depends on geographical location. For example, temperatures considered extreme in
a region would be considered normal in other regions. Adaptation is critical in protecting
livelihoods and food security in many developing countries. It involves all actions aimed at
adaptations to drought that cannot be avoided and at reducing their negative effects.
In many regions, farmers may adapt to increase in extreme temperature events by
moving to practices already used in warmer climate. Even though uncertainties around these
projections are considerable, adaptation to extreme events is considered a priority, given the
potentially high costs of damages from extreme weather and climate variability (van Dorland
et al., 2011). An important issue is how to raise an adequate level of concern among
individuals, policy makers, and broader decision makers in companies and organizations so
that adaptation to extreme events becomes mainstream practice. Although some decision
makers are proactive about adaptation to extreme events, it seems to be a low urgency and
low priority policy option for many others (Bulkeley, 2010). The primary coping strategies
for drought occurrence as reported by farmers in the North West province, South Africa

21
include selling animals, buying fodder, obtaining grazing rights in additional pastureland,
feeding crops to animals which would otherwise be sold for cash, and combinations of these
strategies. Most commercial farmers who have a drought strategy report that they will sell
livestock to decrease their herd size thereby conserving their resources, and most communal
farmers report they will buy fodder or only sell enough animals to buy fodder (Hudson,
2002).
According to IPCC (2014) adaptation is becoming embedded in some planning
processes, with more limited implementation of responses. Engineered and technological
options are commonly implemented adaptive responses, often integrated within existing
programs such as disaster risk management and water management. There is increasing
recognition of the value of social, institutional, and ecosystem-based measures and of the
extent of constraints to adaptation. Adaptation options adapted continue to emphasize
incremental adjustments and co-benefits and are starting to emphasize flexibility and
learning. Most assessments of adaptation have been restricted to impacts, vulnerability, and
adaptation planning, with very few assessing the processes of implementation or the effects
of adaptation actions.
According to Aerts, Botzen, Bowman, Ward, and Dircke (2011) several climate
variability adaptation plans are currently being designed and implemented by national and
local governments. Individual citizens and decision makers in the private sector play a key
role in such plans for the support and implementation of climate variability adaptation
measures. Drought adaptation strategies may vary from one household to the next, from one
community to the other and from one social class to the other. According to Mpandeli (2006),
commercial farmers most of the time have wide choices during drought than subsistence and
small-scale farmers. Due to the fact that majority of the commercial farmers have strong
financial backups, they also have good infrastructure especially irrigation systems such as
Centre Pivot and drip irrigation system. According to Aerts and Botzen (2011) on increasing
resilience of New York City to flooding and climate variability stricter flood-resistant
building codes and inclusion of climate variability risks in urban planning should be
considered.
According to IPCC (2014) due to frequency of shocks in the dry land communities,
adaptive or coping capacity and mechanisms adopted by vulnerable households could well
have equal or larger ranges to that of exposure and sensitivity. Some smallholder farmers in

22
Zimbabwe, for example, have been known to sell their livestock to compensate for lack of
income because of insufficient harvest (Phillips et al., 1999; Adger et al., 2002; Patt and
Gwata, 2002). In South Africa one of the coping strategies frequently used by farmers is to
shift to crops that require less water such as sorghum (Annandale, Jovanovic, Mpandeli,
Lobit, & Sautoy, 2002). The problem with such a strategy is that majority of farmers in South
Africa have very limited access to technology, market access and farm inputs (Vogel, 2000;
Ziervogel and Downing, 2004).
According to Oba (2001) on how seven major pastoral groups in the northern part of
Kenya adapt to drought difficulties, nomads begin to move herds to dry season pastures
earlier than usual and the livestock remain there as long as the drought lasts. This involves
selective access to cross sub-sections and cross border rangelands. In the second phase,
family herds are divided into smaller but specialized units. Those with long watering intervals
are moved further away from the wells than those requiring more frequent watering. Young
men scatter in every direction with these small units in search of fresh pastures and water.
Thus, mobility is intensified. Young herders go to kinsmen and friends to beg for access to
grazing land.
According to Gulliver (1951) during ‘drought stress’ threat period a herd owner may
have to reduce the number of people dependent on the livestock for food. The women,
children and the elderly are moved out of their homesteads and sent away to live with
kinsmen and allies in towns and farming villages. This enables herders to migrate further
away from home in search of forage and water. It also helps to reduce the number of people
dependent on pastoral production, and thus saves milk for calves. This helped to improve the
survival rate of calves. Systematic culling and sale of livestock also helped keep livestock
numbers down as well as generating a cash income they could use to buy food (Gulliver,
1951). Apart from relying on kinsmen for food, the nomads would trade, farm and take up
wage employment temporarily as they waited for rains to restore pastures and allow them to
return to full-time pastoralism. These strategic responses have also been documented in
recent research carried out by Barton et al. (2001).
There was evidence that during and after the 2005-2006 drought and famine, herders
joined together in corporate groups and pooled their surviving stock in order to exploit
economies of scale. The respondents said that once the livestock had been pooled, they were
left in the hands of few selected men or families in the pasturelands as the rest moved in

23
search of food. Migrants had similarly left their families and livestock with kinsmen and
neighbors or friends as they went out in search of employment and other income generating
activities (Juma, 2009).
2.7 The Institutional Components of Drought Adaptations
The term “institution” refers to the systems of rules that shape individual and
collective decisions and actions. In addition to the formal aspects of institutions (e.g.,
policies, regulatory frameworks, legislation, organizational arrangements), institutions also
entail social practices and relationships, underlying values and norms that shape behaviors
and routinized activities that emerge and are reproduced as actors follow rules (March &
Olsen, 1989; O’Riordan & Jordan, 1999; Scott, 2008; Young, 2002). As institutions mediate
how societies govern climate risks and manage responses to environmental and social
change, understanding how institutions can contribute to more proactive management
strategies is a particularly salient topic for the drought planning community (Wilhite, 2005).
Institutions are both important component of adaptive capacity and can act as barriers to
climate adaptation efforts. Having other components of adaptive capacity (for example
material assets, technology infrastructure, or economic resources) does not necessarily
translate into action if institutional capacity does not exist (Eakin et al., 2014; Gupta et al.,
2010; McNeeley, 2014; Moser & Ekstrom 2010).
Laikipia West sub-County is a multiethnic society, making it unique due to culture,
social and economic dynamics. Understanding the role of institutions in managing local level
drought adaptation is important due to different beliefs and traditions of the people that shape
their day to day decision making. The high rate of population growth in Laikipia West sub-
County has implications for pressure on scarce pasture and land resources (Mkutu, 2001).
The dry conditions in Laikipia West sub-County accelerated fights and theft which further led
to conflicts (Mwangi, 2012). According to Mkutu (2001) violent conflict in the pastoral areas
can be caused and aggravated by a number of factors including the existence of intensified
cattle rustling; small arms proliferation; inadequate state security policies; weakening,
undermining of, or inadequate engagement with, traditional governance systems;
inappropriate government development policies; inadequate land tenure policies; political and
socio-economic marginalization of pastoralists; and inadequate arrangements to cope with
drought. In Laikipia West sub-County occurrences of such conflicts have been largely
connected with competition resources and drought (Maina, 2000). This has resulted into

24
human deaths, lack of peace, injustice, displacement of persons, and loss of property,
underdevelopment and general disorientation of people’s living patterns (Kinoti, 1994). The
conflict in Laikipia West sub-County has often pitied the farmers against pastoralists and
private ranch owners (Mwangi, 2012). Drought in Laikipia West sub-County leads to
conflicts and therefore understanding of drought adaptations strategies offers avenue for
alternative dispute resolution mechanism.
According to Akerlund (2001) the church and Church- Based Organizations (CBOs)
such as Caritas, Diakonia, Inter-life, Church of Sweden, Swedish Mission, Covenant Church,
Swedish Ecumenical Women Council and Swedish Mission Council have been involved in
peace building processes in areas affected by conflicts in Africa. According to Mwangi
(2012) the Catholic Church has set up an elaborate network of more than 700 Small
Christians Communities (SCCs) in Laikipia West sub-County. These SCCs have
representatives of the Catholic Justice and Peace Commission (CJPC) which is an arm of the
Catholic Church that promotes civic education, conflict resolution and democracy. The CJPC
representatives gather all the information regarding conflicts and other issue such as drought
and relay them to the national office who responds by giving out food, shelter and clothing
(Mwangi, 2012). Presbyterian Church of East Africa (PCEA) in Laikipia West sub-County
has similarly set up a network of districts. The districts are group of families who meet once a
week for prayers and sharing on any emergency issues. These districts channel their problems
to the congregation. The congregation may help the victims directly if they have the
resources or may contact the parish and presbytery for assistance. There are more than 500
districts in Laikipia West sub-County and have been used in offering food and shelter to the
victims of conflicts and droughts (Mwangi, 2012).
The current study assessed the implementation of Hyogo Framework for Action
which was domesticated into NCCRS (2010) on the community and household participation
in drought risk reduction and preparedness to drought in Laikipia West sub-County. The
indicators that guide the assessment of the implementation at the community level were;
i. How the communities in Laikipia West have been trained on disaster
awareness,
ii. How communities are mobilized either as self-help groups, religious
organizations or the youth or women groups during disasters.
The purpose of National Climate Change Response Strategy (NCCRS) is to put in

25
place robust measures needed to address challenges posed by climate variability and change
(NCCRS, 2010). The integration of climate information into Government policies is
important because climate is a major driving factor for most of the economic activities in
Kenya. The National Climate Change Response Strategies (2010) analyzed in Laikipia West
sub-County are: promotion of irrigated agriculture by developing irrigation schemes along
river basins, construction of water basins and pans, set up measures to institutionalize early
warning systems on drought, flood and disease outbreaks, investing in programmes to harvest
and store fodder for use during dry seasons, source livestock fodder from other regions,
promotion of economic diversification among pastoral communities and awareness
campaigns among the pastoralist communities on the importance of balancing stocking rates
with available land resources as a way of ensuring sustainable pastoralism.
2.8 Summary of Literature and Gaps Identified
In conclusion the chapter has made effort to review literature on drought
characteristics and trends, effects of drought on resources and livelihoods, perception of
climate variability, household adaptations to drought and institutional components of drought
adaptations. In this study the focus is on classification and quantification of drought-
information useful in planning for drought adaptation. The reviewed studies assessed the
global and regional impacts of drought while this study did not only assess the effects of
drought in an arid and semi arid region of Laikipia West sub-County but also the community
drought adaptation strategies in place to reduce the effects of drought. The studies on Kenya
reviewed above discussed the effects of drought on resource and livelihoods in Kenya while
the current study did not only analyze the effects of drought, but also the effects of 2009
drought episode on household income, health, environment and social effects. The study also
assessed the most impacted livelihood in Laikipia West sub-County. The reviewed studies
also assessed the perception of climate variability in both rural and urban area while the
current study looked at perception to drought among households. The current study also
analyzed the social economic characteristics of the households that influence perception to
drought. The aforementioned studies assessed adaptations to climate variability in different
regions of the world while the current study analyzed drought adaptation strategies among
households in a semi-arid part in Kenya. The study also assessed the community drought
adaptation strategies.
The studies discussed also looked at general drought disasters preparedness and

26
policy framework. The practice part of the institutions and implementation of these policies at
local level remain wanting. The current study assessed the effects of drought on crop and
livestock production and analyses the implementation of six activities of the National Climate
Change Response Strategies (2010). These activities are: formation of youth, women’s and
men’s groups, CBOs, as forums for outreach, documenting effects of drought and linking
them to community livelihoods, drought management training among households and
community members, using graphical images to pass climate change information,
encouraging individual voluntarism in raising awareness, and setting aside emergency funds
to caution vulnerable households during drought. The study also analyzed the role of
institutions in managing local level drought adaptations
2.9 Theoretical Framework
This study adopted social learning theory by Albert Bandura (1962) in understanding
households’ adaptation to drought events and Hyogo Framework for Action in understanding
drought preparedness at household and community level. Human behaviour is regulated to a
large extent by anticipated consequences of perspective actions (Bandura, 1969). During the
course of learning, people not only perform responses, but they also observe the differential
consequences accompanying their various actions. Learning cannot take place without
awareness of what is being reinforced (Dulany, 1962). In social learning theory,
psychological functions involve a continuous reciprocal interaction between behaviour and its
controlling conditions. The theory assumes that whether or not people choose to perform
what they have learned observationally is influenced by the consequences of such actions.
Social learning theory also assumes that modeling influences produce learning principally
through their informative functions and observers acquire mainly symbolic representations of
modeled activities rather than specific stimulus-response associations (Bandura & Barab,
1971).
The tenets of social learning theory are attention process, retention process, motoric
reproduction process and reinforcement and motivational process. In attention process, a
person cannot learn much by observation if he/she does not attend to or recognize the
essential features of the model behaviour. In conceptualization of social learning theory to the
study, response and adaptation to drought is the reinforcement and motivation. Attention
process was conceptualized to drought events which has significant effects on livelihoods and

27
captures the attention of the households. Retention processes explain that past influence
achieves some degree of permanence and that observational learning involves two
representational systems: imaginal and verbal. In motoric reproduction process, the learner
puts together a given set of responses according to the modeled patterns. In the study the
retention process was conceptualized to explain the past experiences the household and
community members have observed as a result of drought events.
Reinforcement and motivation process is conceptualized to strategies that produce
positive results during drought are enhanced while those that produce negative results are
ignored in future. The symbolic coding is informed by the effects on drought on households
while cognitive organization informs their perceptions to drought. Whether household
drought perception is severe or moderate is informed by the retention processes. The
retention process is a factor of social economic characteristics of the household. The
judgment of whether drought is severe influenced by experience, source of income, age,
gender, education among other variables.
In the study, understanding drought preparedness was guided by the Hyogo
Framework for Action 2005-2015. Adopted by 162 member states of the United Nations, the
Hyogo Framework for Action is the key instrument and global blue print for implementation
of disaster risk reduction. Its overarching goal is to build the resilience of nations and
communities to disaster by achieving substantive reduction of disaster losses by 2015
(UNISDR, 2012). In their approach to disaster risk reduction, states, regional and
international organizations and other actors concerned should take into consideration the key
activities listed under each of the five priorities for action which are: ensure that disaster risk
reduction is a national and a local priority with a strong institutional basis for
implementation; identify, assess and monitor disaster risks and enhance early warning; use
knowledge, innovation and education to build a culture of safety and resilience at all levels;
reduce the underlying risk factors and strengthen disaster preparedness for effective response
at all levels.
The current study considered the second, fourth and five priorities which are: Identify,
assess and monitor disaster risks and enhance early warning, reduce the underlying risk
factors and strengthen disaster preparedness for effective response at all levels. The activities
under these priorities are; develop early warning systems that are people centered, in
particular systems whose warnings are timely and understandable to those at risk, promote

28
the integration of risk reduction associated with existing climate variability and future,
prepare and periodically update disaster preparedness and contingency plans and policies at
all levels, promote regular disaster preparedness exercises, including evacuation drills, with a
view to ensuring rapid and effective disaster response and access to essential food and non-
food relief supplies, as appropriate, to local needs, promote the establishment of emergency
funds, where and as appropriate, to support response, recovery and preparedness measures
(HFA, 2005).
The study also assessed the existence of emergency funds reserved by communities’
self-help groups in Laikipia West sub-County to counter the effect of drought. The
communities’ volunteerism opportunities during drought disasters such as sharing of
information, community awareness programs and supporting the most vulnerable were
examined. The community information exchange channels were also evaluated. At the
household level the study examined how the early warning information is received and
exchanged among households. The household food and non-food relief supplies in reserve
stores for use during disaster were also assessed. The study established the existence of
emergency funds reserved by individual households in Laikipia West sub-County to counter
effect of drought.
2.10 Conceptual Framework
Figure 2.1 presents a conceptual framework of the study. It illustrates the interaction
between droughts and household characteristics, economic effects, preparedness and drought
adaptation strategies. In this study, drought characteristics affect maize and livestock in
Laikipia West sub-County. Drought characteristics such as frequency, severity and magnitude
result to economic effects such as decreased maize yields, crop failure, reduced herd size,
decreased milk yield, loss of livestock. There are also health effects such as: crop and
livestock diseases while the social effects are mobility in and outside the sub-County. The
drought characteristics determine the adaptation strategies such as: early warning, exchange
of information, food and non-food relief supplies, and emergency funds reserved, destocking,
migration with their livestock, off- farming practice, crop diversification and planting of
drought resistant seeds.
Drought adaptation strategies at the community level are training on disaster
awareness, community mobilization, emergency funds, volunteerism and exchange of

29
information. Household characteristics such as age and gender, level of education, type of
household, and access to information, experience, household head, agricultural training and
perceptions to drought inform farmers on the response and adaptation strategies to drought.
Preparedness and adaptations is likely to be influenced by household characteristics such as
the education of the household head, age, gender, type of household, experience, agriculture,
and household head (Opiyo et al., 2014). Drought characteristics linked to, household
characteristics, preparedness and adaptation lead to increased or reduced vulnerability to
drought. The independent variables are drought perceptions as either severe or moderate and
drought preparedness. The dependent variables are the social economic characteristics of the
population.

30
CHAPTER THREE
Figure 2.1: Conceptual Framework for analyzing effects of drought on livelihoods and adaptation strategies. (Source: Synthesis of literature by Author, 2015)
Drought Characteristics
Spatial-Temporal
variations of
drought
(Frequency
Severity
Magnitude)
Effects of drought on household livelihoods Reduced crop yield, crop failure, reduced herd, loss of livestock Health effects Livestock diseases, crop diseases, human diseases and malnutrition Environmental effects Drying of rivers, increased cases of fire, lack of household fuel
Social effects Conflict, mobility in and out of the sub-County
Household Characteristics Household head, Size of the household, Access to information Agriculture training Individual characteristics Age, level of education, gender, source of income and farming experience Adaptation characteristics Household level Seasonal migration with animals, reducing the herd, off practices, planting of drought resistant crops and crop diversification
Institutional level Private and Public Institutions: Livestock department, sub-County, Agriculture office, NGOs, Churches, Elders, office of the chief etc Support programmes: Drilling of boreholes, extension services, and community based training initiatives
Intervening variables Independent variables Dependent variables
Increase/ reduce vulnerability

31
CHAPTER THREE
3.0 RESEARCH METHODOLOGY
3.1 Introduction
This section deals with procedures and methods used in the study. The chapter entails
the description of the study area, research design, sampling procedures and sample size, data
collection, validity and reliability of data, data analysis and tools and ethical considerations.
3.2 Study Area
3.2.1 Location and Size
The study area is Laikipia West sub-County in Laikipia County, Kenya. Laikipia
means treeless plain in Maasai language (CDIDP, 2013). Laikipia West sub-County is
located to the north west of Mount Kenya. The sub-County lies between Latitude 0o 05’ and
0o 43’ North and between longitudes 36o 10’ and 36o50’ East and an area of 3,188.8 Km2 as
shown in Figure 3.1. The altitude of the sub-County varies between 1,000m above sea level
and 2,600 m (Thenya et al., 2011). Laikipia West sub-County has four administrative wards
namely; Rumuruti, Muhotetu, Sipili and Olmoran (KNBS, 2010). This study however was
carried out in Rumuruti ward.
3.2.2 Climate and Agro- ecological Zones
Agro-ecological zones are strongly related to distribution of rainfall and are therefore
a proxy for food insecurity and climate vulnerability, which are both important to indicate the
areas’ close representativeness of the country’s natural regions and show the general climate
of the area (Mubaya & Mafongoya, 2017). The study area is located in the rain shadow of
Mount Kenya making the area dry. The sub-County has humid, semi humid and semi-arid
agro-ecological zones. The agro ecological zone of the sampled ward (Rumuruti ward) is
maize and mixed and pastoral livelihood zones (Jaetzold et al., 2011). Laikipia West sub-
County is classified as 50 - 85% ASAL with annual rainfall varying between 500 and 800
mm (Jaetzold et al., 2011). Daily temperatures vary with altitude and season; mean
temperatures range within 22-26°C and temperature Minimum and Maximum are 6-14°C and
35°C respectively. Due to the sub-County leeward position North West of Mount Kenya, it is
comparatively dry despite its location on the Equator. The spatial distribution and the
temporal viability of rainfall are strongly influenced by Mount Kenya and Aberdare Ranges.
32
Precipitations also vary greatly in terms of time and amount along the same gradient. Rainfall
follows the seasonal movements of the Inter Tropical Convergence Zone (ITCZ) resulting in
two rainfall seasons (Huho et al., 2010). The rains primarily fall in two seasons; first is the
wet season that occurs during March-April-May and often accounting for 80% of total annual
rainfall. Second is the wet season that occurs in October-November-December (Huho et al.,
2010).

33
Map of the study Area
Figure 3.1: A map of Laikipia West sub-County showing the sampled sites. Source: IEBC (2012)

34
3.2.3 Soil and Vegetation
There are four categories of soils in Laikipia west sub-County namely: well drained to
moderately well drained, deep, very dark greyish brown, firm, cracking clay, with (thick)
humic topsoil: verto-luvic phaeozems. Well drained, shallow to moderately deep, reddish
brown, firm clay loam, with humic topsoil: chromo-luvic phaeozems, partly lithic phase.
Imperfectly drained deep, dark greyish brown, firm, cracking clay. Imperfectly drained, deep,
dark greyish brown, firm clay (hardpan), abruptly underlying a topsoil of sandy clay loam:
eutric Planosols (Jaetzold et al., 2011).
According to (Jaetzold et al., 2011), phaeozems are well drained, less weathered clay
soils (the clays consist mainly of montmorillonites) with high contents of organic/humic
substances in the topsoil and plant-available soil water; thus possessing a high fertility.
Vertisols (Black Cotton Soils) are dark montmorillonite-rich, poorly drained cracking clays
of the bottomlands with peloturbation processes. Planosols are soils with an albic E horizon,
hydromorphic properties and a slowly permeable B horizon, developing on different parent
materials of the bottomlands.
3.2.4 Population Characteristics
The sub-County has a population of 89,925 who are 44,176 male and 45,749 female.
There are 39,966 households in the sub-County (KNBS, 2010). According to the KNBS
(2009) the Laikipia West sub-County population density was at 42 persons per square
kilometer. This was projected to increase to 51 persons per km2 by the year 2017 as a result of in-
migration and natural population growth (CDIDP, 2013).
The sub-County has multiple ethnic communities with Kikuyus, Maasai and Samburu
communities forming the largest portion of its residents. Minority communities in Laikipia
West sub-County are: Kalenjin, Meru, Pokots, Somali, Turkana, European and Asian settlers
(CDIDP, 2013). Ethnic communities influence the land use systems in Laikipia West sub-
County. In the upper region (Sosian, Lorian and Ndurumo Locations) intensive maize, wheat
and beans farming is practiced as well as rearing of dairy animals is done by the Kikuyus,
Kalenjin and Meru. In the lower regions (Rumuruti, Thome and Mutara Locations) agro
pastoralism and pastoralism is practiced by the Samburu, Maasai, Turkana and the Pokot.
Irrigation farming has also been practiced in the lower region where tomatoes and onions are
grown. European and Asian settlers also own ranches in the lower region. Over 48% of the
population is classified as poor while 59.3% depend on relief aid from the Government of
35
Kenya and the World Food Program (WFP) (GOK, 2010).
3.2.5 Agriculture and other Economic Activities
According to the first Laikipia County Development Integration Plan (2013) over
60% of households in the sub-County derive their livelihood from agricultural activities.
Majority of the farming households are small scale holders whose average farm land size is 2
acres mainly for food production. The farm size for large scale holder on average is 20 acres
mainly for wheat and maize production. The ranching community holds an average of 10,000
acres. Average land holding in the group ranches per household is 23 acres. Sixty five percent
of land owners have title deeds. There are 6 distinct land use patterns heavily influenced by
the climatic conditions and the ecological zones. These include among others; pastoralism,
mixed farming, ranching, agro pastoral, marginal mixed farming and formal
employment/trade/business. In 2012, crop farming and livestock keeping sub-sector
employed 141,383 persons comprising 47% of the employed population. Agriculture
contributes 75% of the household incomes. The main crops grown are maize, beans, wheat,
Irish potatoes, cabbages and tomatoes. The main types of livestock raised are cattle, sheep,
goats, camels, donkeys, poultry and pigs.
In Laikipia County, agriculture employs over 80% of its population (Kairu, 2002).
Flower farming is a new agricultural practice in the area and has also employed a good
number of young people. Laikipia West sub-County is known for its big open ranches which
provide a significant source of beef for local consumption and export (CDIDP, 2013).
3.3 Research Design
The study adopted mixed research design that combined qualitative and quantitative
approaches to achieve the objectives. Cross sectional household survey, in-depth interview
and documentary review were used. Documentary review was used to analyze temporal
drought using SPI drought index based on rainfall data in Laikipia West sub-County from
1984 to 2014. The study utilized qualitative data from cross-sectional household survey and
key informant interviews. Quantitative data utilized in the study is rainfall data from
Ndaragwa and Rumuruti rainfall stations. Cross sectional household survey assessed the
effects of 2009 drought on household livelihoods; establish the household perceptions to
drought disasters and evaluated the household and community drought adaptation strategies
and drought adaptation determinants in Laikipia West sub-County. In-depth interview design

36
was used to evaluate the role of institutions in managing local level drought adaptations in
Laikipia West sub-County.
3.4 Sampling Procedure and Sample Size
3.4.1 Rainfall Stations
Rainfall data was collected from Rumuruti and Ndaragwa WRMA stations. The
selection of the rainfall stations was informed by the fact that they are the only reliable
stations in the study area. Although there are other weather stations such Mukogondo forest,
Thomson falls forest and Nyahururu rainfall stations in Laikipia West sub-County, the data
from these stations was unreliable and could not qualify for a climatological analysis.
3.4.2 Household Respondents
The study used Slovin’s formula (Galero, 2011) to determine the number of
household respondents. Slovin’s formula allows a researcher to sample the population with a
desired degree of accuracy. Slovin’s formula is written as
n = N / (1 + Ne2) (I)
Where:
n – Sample size,
N -Total population
e - Error of tolerance=0.05
Laikipia West sub-County had 39,966 households (KNBS, 2010) translating to 196
calculated households. Multistage cluster sampling technique was used to select respondents
and study site. In stage one, administrative wards were clustered based on their different
economic activities. There are four wards in Laikipia West sub-County (Figure 3.1). The
wards are: mixed livelihood zones which comprise of Muhotetu and Sipili and sub- humid
agro-pastoralism livelihood zone comprising of Rumuruti and Olmoran. In stage two,
purposive sampling was used to select the study ward. The selected ward was Rumuruti
whose choice was based on variation in livelihood options. The selection of Rumuruti ward a
sub-humid agro-pastoralism was informed by the fact that, effects of drought on household
livelihood and adaptations strategies are determined by economic activities of the households.
Stage three involved proportionate random sampling to select household respondents from all
the six locations in Rumuruti ward as shown in Table 3.1 using the following formula.

37
n=p⁄µ × 300 (2)
Where;
n is the sample population of the Location.
P is the population of the household in the location.
µ is the total households in the ward.
Rumuruti Ward has six locations namely: Rumuruti, Lorian, Ndurumo, Mutara,
Thome and Sosian. The Ward has eleven sub-locations namely: Rumuruti Township,
Mutamaiyo, Lorian, Ndurumo, Kagaa, Mutara, Kiamariga, Thome, Mathira, Sosian and
Maundu Miiri.
Table 3.1 Households Sample Population in Rumuruti Ward
Location Total Population Sample Population Rumuruti 16,094 67 Thome 6,612 28 Ndurumo 6,030 25 Mutara 6,226 26 Sosian 6,422 27 Lorian 5536 23 Total 46,920 196
3.4.3 Key Informants Interviews
Key informants were selected as shown in Table 3.2.Two key informants in three
categories (Chiefs, elders and NGOs) in the sampled ward were purposively selected. One
informant in each of the two categories (sub-County agriculture officer and sub-County
livestock officer) in the sampled ward was purposively selected.
Table 3.2: Sample Population for Key Informants Key Informants Number per Ward Total Sampled Chiefs 2 2 Elders 2 2 Sub-County agriculture officers 1 1 Sub-County livestock officer 1 1 NGO officials 2 2 Total 8

38
3.5 Data Collection
The description of the data collection process is objectives based
3.5.1 Rainfall Data
Daily rainfall amount data from Rumuruti and Ndaragwa Water Resource
Management Authority (WRMA) stations for the 31 years period (1984-2014) was collected.
Thirty ones year’s period was chosen because it is within the minimum period which data can
be analyzed using SPI. Data of less than 30 years shortens the sample size and weakens the
confidence (WMO, 2012).
3.5.2 Household Survey Data
Cross-sectional household survey was used to collect household data on the
household perceptions to drought, effects of drought on household livelihoods, adaptation
stratergies during the 2009 drought. Household surveys are carried out to gather statistical
information about the attributes and actions of a population by administering standardized
questionnaires to some of its members (Buckingham & Saunders, 2004). The necessity of
using surveys for this research came from the research questions, particularly research
questions ii, iii and iv which sought to investigate the effects of drought, perceptions
adaptation and to drought. Household data was collected from proportionately random
selected household in all administrative locations of the sampled ward using structured
questionnaires. A questionnaire (Appendix A1) containing structured questions was
administered. The information sought from household include: socio-economic
characteristics of the households, their perceptions and drought adaptation strategies in place.
3.5.3 Key Informants Interview Data
Key informant interviews (KIIs) are qualitative interviews with people who are aware
of what is going on in the community (Denzin & Lincoln, 2005). Key informants are people
perceived to have particular insight or opinions about the topic under study. They may be
ordinary people and not necessarily the specialists, the better educated, those in power or the
officials (Mikkelsen, 2005). In the study, the main criteria for selecting the key informants
were their profession, position in leadership, ages, and those assumed to have extensive
knowledge on effects of drought and adaptation strategies in Laikipia West sub-County. By
conducting in-depth informant interviews, it was possible to analyze not only respondents’
attitudes and behavior, particularly in relation to drought, but also the long term experiences

39
and expectations concerning drought adaptations.
Key informant interviews complemented the survey research and targeted, chiefs,
elders, sub-County agriculture and livestock officers and non governmental organization
officials. The key informant interviews are used to supplement, validate, explain, illuminate
and reinterpret quantitative data (Miles & Huberman, 1994). The key informant interviews
consisted of guiding questions (Appendix A2) for uniformity during interviews with different
categories of informants and were used to answer question v.
3.6 Validity and Reliability of the Data
Instruments used to collect data must be both reliable and valid for the study to be
credible (Gail, 2011). Validity in research refers to how accurately a study answers the study
question or the strength of the study conclusions. It refers to accuracy of measurement.
Reliability refers to whether an assessment instrument gives the same results each time it is
used in the same setting with the same type of subjects. Reliability is part of the assessment
of validity (Gail, 2011). In the current study a pilot study was conducted in the neighboring
Ndaragwa Ward to test for validity of the research instruments. The pilot study ensured that
the questionnaires were as clear as possible before the collection of primary data in the study
area. The questionnaire was revised after the pilot study and the unclear questions modified.
Rainfall data was collected from Water Resources Management Authority for
Rumuruti, Nyahururu and Ndaragwa stations for a period of 31 years. The data was
scrutinized to check the missing data. Missing data percentages was calculated to determine
its reliability. The Rumuruti and Ndaragwa station data was considered for climatological
analysis because the missing values were less than 10% for any year as per the requirements
of the world meteorological organization. The Nyahururu station data was not considered for
the analysis because more than 34% of the data was missing and failed the reliability of
climatological test.
3.7 Data Analysis and Tools
The description of data analysis was objectives based.
3.7.1 Temporal Drought Trends in Laikipia West sub-County (1984-2014)
The selected drought index was Standardized Precipitation Index (SPI). Standard
precipitation index was selected because it has been used to analyze drought severity in other
regions of the world. The Standardized Precipitation Index expresses the actual rainfall as a

40
standardized departure with respect to rainfall probability distribution function and hence the
index has gained importance in recent years as a potential drought indicator permitting
comparisons across space and time (Kumar, Murthy, Sesha & Roy 2010). The computation of
SPI requires long term data on precipitation to determine the probability distribution function
which is then transformed to a normal distribution with mean zero and standard deviation of
one. Thus, the values of SPI are expressed in standard deviations, positive SPI indicating
greater than median precipitation and negative values indicating less than median
precipitation (Edwards and McKee, 1997). Drought characteristics analyzed were; frequency,
severity and magnitude of drought. In the study SPI was used in the analysis temporal
drought in Laikipia West Sub County from 1984 to 2014.
As suggested by McKee, Doesken and Kleist (1993) SPI represents wetter and drier
climates in a similar way. The SPI is calculated as follows:
SPI= XX − (3)
σ
Where: σ - Standard deviation X – Precipitation X - Mean precipitation.
Positive SPI values indicate greater than median precipitation and negative value
indicate less than median precipitation because the SPI is normalized, wetter and drier
climates are represented in the same way; thus wet and dry periods are monitored using SPI
as in Table 3.3. The SPI values ranges from -2 to +2, with values of 2 or greater denoting
extremely wet spells and values of 2 or less indicating extremely dry spells. The condition is
said to be near normal for SPI values between -0.99 to + 0.99 (Boubacar, 2012).
Table 3.3 Standard Precipitation Index (SPI) values SPI values Drought characteristics 2.0+ Extremely wet 1.5 to 1.99 Very wet 1.0 to 1.49 Moderately wet -0.99 to 0.99 Near normal -1.0 to -1.49 Moderate dry -1.5 to -1.99 Severely dry -2 and less Extremely dry
Source: WMO (2012)

41
3.7.2 Effects of Drought events on Household Livelihoods
Data collected using questionnaire was processed to ensure that all responses were
categorized in order to make comparisons and analysis possible. The processing involved
editing, coding, classification and tabulation. Editing helped to detect errors and omissions,
and the appropriateness of the data to the study objectives. Editing also involved scrutiny of
all completed questionnaires to ensure that there was accuracy; consistence, uniformity and
that they were completely filled in order to facilitate coding, classification and tabulation.
This helped to put data into manageable categories that were consistent with the research
problem. The percentages of the household responses on the effects of 2009 drought were
computed using descriptive statistics and the various effects categories identified. The effects
of drought identified were direct effects on household income such as crop failure, reduced
herds, livestock losses, reduced crop yields among others. The indirect effects of drought
were also identified and they include effects on health, environment and social well being of
the households.
3.7.3 Household Perception to Drought Disasters
The household perceptions were analyzed using percentages and the results cross
tabulated with socio-economic characteristics. Logistic regression model was used to analyze
drought perception and factors influencing household perceptions to drought in Laikipia West
sub-County. The strength of logistic regression model is that it can take coded values.
Logistic regression technique has no assumptions on the linear relationship between
independent variables and can be used in any mix of dichotomous, discrete and continuous
predictor (independent) variables (Tabachnick & Fidell, 2001). The logistic regression readily
allows each variable in the analysis to be described in terms of its strength of contribution to
the outcome (Hair, Black, Babin, Anderson & Tatham, 2006). Logistic models are the most
appropriate econometric models to apply to the evaluation of qualitative dependent variables
that have dichotomous groups ( ‘adapted’ and ‘not adapted’) while the independent variables
are categorical, continuous and dummy (Long and Freese, 2006).
The perception of drought as either severe or moderate in this study was informed by
the choice of logistic regression model which accommodate binary variables. The two
discrete and mutually exclusive variables were regressed on explanatory factors whose choice
was based on theory and literature. These variables are: age, gender, education level, length

42
of stay in the study area, farming experience, household income, land ownership and previous
agriculture training
The logistic regression model is specified as:
1
0
1
0
11
1
ln
X
X
X
Xi
ez
e
ze
zz e
z
β
β
β
β
=+
=+
= = (4)
Where: X is the vector - independent variables in question, β is the vector of variables to
be estimated. Application of this type of model is a challenge since the dependent variable is
dichotomous in nature and has a probability of 0 or 1 and most of the predicted values by the
independent variable may fail to fall under the predesigned areas of zero and one. The
empirical model is as follows:-
0 1 1 2 2 3 3 ....iz x x xβ β β β ε= + + + + + (5)
Where:
Z�= the perception by the ith household on drought.
xi = the vector of explanatory variables of probability of perceiving drought by the ith
household.
β= the vector of the parameter estimates of the regressor’s hypothesized to influence
the probability of households
i = is perception about drought.
��=is called the error term, disturbance term. This variable captures all other factors
which influence the dependent variable Z�other than the regressors’ xi.
In the analysis of factors influencing household perception to drought using logistic
regression model, various categories of responses within socio-economic characteristics of
the households were regressed against dependent variable. The data was cross tabulated and
reference categories identified before regression. The dependent variable was the household

43
responses on the description of the 2009 drought where they were to identify whether the
drought was severe or moderate. The independent variables were the socio-economic
characteristics which were gender, age, education, time the respondent had been farming,
income, size of the land, type of land ownership and training on farming. The logistical
regression variables were coded as shown on Table 3.4. During the regression analysis one
category was left out in each variable to act as a reference category. The reference categories
in each of the socio-economic variables are; male, below 30 years, informal education, below
one year, less than two acres, and ownership of land and confirmation of attendance of
training on farming. Wald test at 5% level of significance was used to determine the factors
affecting perception to drought. Wald test can be able to detect the smaller significant
changes than chi-square.
Table 3.4 Descriptions of variables in logistic regression Variable Name Variable codes and description Perception to drought Drought characteristics were categorized as 0= moderate and 1= severe Drought determinants They were coded as 0=adaptation strategy in question and 1=for others Socio economic variables Gender 0= males and 1= female Age 0= below 30 years, 1= 31-40 years, 2= 41-50 years, 3=51-60 years and 4=
61 and above
Education 0= informal education, 1= primary education, 2= secondary education and 3= tertiary education
Length of engagement in farming 0= 0-5 years, 1= 6-10 years, 2= 11-15 years, 3= 16-20 years, 4= 21-25 years, 5= 26-30 years, and 6= above 30 years
Household source of income 0= government employment, 1= business person, 2= maize farming, 3= dairy farming, 4= pastoralism, 5= wheat farming
Annual income 0= below 120000, 1= 120000-500000 and 2= 500000 and above Household land size 0=less than 2 acres, 1= 2-5 acres, 2= 5-10 acres and 3= over 10 acres Land ownership 0= Owned land, 1= Leased land and 2= communal land ownership Training on farming Course 0= no and 1= yes
3.7.4 Household Drought Adaptation Strategies and Drought Adaptation Determinants
Chi-square test was used to analyze the association between drought adaptation
strategies and socio-economic characteristic of the households in Laikipia West sub-County.
The independent variables were the drought adaptation strategies during drought by
individual households while the dependent variables were the socio-economic characteristics
of the households. The significant threshold was measure at 5% level of significance. The chi
square formula is as follows:

44
( )E
EO 22 −Σ=χ (6)
Where, ∑- Sum of
O- Observed value,
E- Expected value
Kendall’s rank correlation was used to rank the most preferred drought adaptation
strategies by the household heads. The following scales were used, 1-Regularly, 2- Sometimes
and 3-never used. Kendall's rank correlation provides a distribution free test of independence
and consider two samples, x and y each of size n. The total number of possible pairings of x
withy observations is n (n-1)/2. Now consider ordering the pairs by the x-values and then by
the y-values. If x3>y3when ordered on both x and y then the third pair is concordant, otherwise
the third pair is discordant. S is the difference between the number of concordant (ordered in
the same way, nc) and discordant (ordered differently, nd) pairs. Tau (t) is related to S by:
( 1) / 2c dn n
n nτ −=
− (7)
If there are tied (same value) observations then tb is used:
1 1
( 1) / 2 ( 1) / 2 ( 1) / 2 ( 1) / 2b
t u
i i i ii i
st
n n t t n n u u= =
= − − − − − −
∑ ∑ (8)
Where; ti is the number of observations ties data particular rank of x and ui is the
number tie data rank of y. In the presence of ties the statistic tb is given as a variant of t
adjusted forties. When there are no ties tb=t. An approximate confidence interval is given for
tb or t. The confidence interval does not correspond exactly to the p-values of the tests because
slightly different assumptions are made (Samra and Randles, 1988). In the interpretation of
the research findings in the current study the adaptation strategy with the lowest mean is the
most frequently preferred strategy during drought.

45
3.7.5 Role of Institutions in Managing Drought Adaptations
Individual informant narratives were capture in the analysis of the role of institutions
in managing local level drought adaptation in Laikipia West sub-County. The informant’s
views were supplemented with existing data from literature on the role of institutions on
drought adaptation strategies.
3.8 Ethical Considerations
Research ethics were upheld at all stages of the study period. Honesty and objectivity
prevailed when collecting, analyzing, interpreting and presenting data. Participants in the
interviews were informed about the purpose and nature of the study, including its time period,
expected outcome and confirmation that all information would be confidential. A research
permit (Appendices 7 and 8) was obtained from National Commission for Science,
Technology and Innovations before the study was conducted.

46
CHAPTER FOUR
4.0 THE SOCIO-ECONOMIC CHARACTERISTICS OF THE STUDY
POPULATION.
4.1 Introduction
This chapter presents results and discussion on households’ socio-economic
characteristics. Understanding the household socio economic characteristics forms the
foundation in understanding drought effects on household livelihoods, drought adaptation
strategies among individual households and the community. According to the IPCC (2007)
the factors affecting agriculture include: temperatures, rainfall, humidity, carbon dioxide,
wind, seed availability and quality, access to information, education, gender, transport, and
market. The household decision making and judgment of events is influenced by their socio-
economic characteristics thus the variations in decisions, responses and adaptation strategies
among households living in the same geographical boundaries with uniform physical
characteristics.
4.2 Response Rate of the Household Survey
For the household survey, 196 questionnaires were administered to the selected
household respondents. Out of 196 questionnaires administered, 195 were filled and returned,
however 15 questionnaires were incomplete and could not be considered during analysis. One
hundred and eighty (180) questionnaires were considered during data analysis representing
92% response rate, which is considered satisfactory to make conclusions for the study.
According to Mugenda and Mugenda (2003) a 50% response rate is adequate, 60% good and
above 70% response rate very good.
4.3 Gender of the Household Heads in Laikipia West sub-County
Household heads are the pillars on the day to day decisions and solutions adopted at
the house hold levels. In order to understand the responses and adaptation strategies to the
2009 drought event in Laikipia West sub-County the study sort to know the gender of the
household heads. Results in Figure 4.1 shows that 61% were men while 39% were women. In
Laikipia West sub-County the different economic activities which are crop farming,
pastoralism and agro pastoralism attract members of either gender though the number of men

is higher than women. The high number
patriarchal social order in the African culture
by Peacock, Jowett, Dorward, Poulton
Saharan Africa is becoming a female
migration.
Figure 4.1: Household head
4.4 Age of the Household Head
Efficient and sustainable drought adaptation practices made by individual households
vary according to several factors
therefore the study sort to know the
head is an important consideration
but by other sectors such as financial institutions who offer
Results in Table 4.1 show that, 33
between 30 to 40 years and 19% between 41 to 50 years
reflection of the general age-structure of the population
represent the senior most group
farming practices, drought prediction
years are assumed to have greater responsibilities of bringing up young families and therefore
drought becomes unnecessary burden. Thought those below 30 years could lack the necessary
experience on drought adaptations they are energetic and therefore disseminated with the
right information they are in a position to implement the required drought adaptation
strategies.
39%
47
The high number of male headed households could be
patriarchal social order in the African culture. This finding contradicts the earlier argument
Peacock, Jowett, Dorward, Poulton and Urey (2004) that smallholder agriculture
female dominated sector as a consequence of faster male out
ousehold head by gender in Laikipia West sub-County
ead in Laikipia West sub-County
Efficient and sustainable drought adaptation practices made by individual households
several factors such as age. Human responsibilities increase with age and
to know the age bracket of the household heads. Age of the
consideration not only on the decisions made by an individual household
financial institutions who offer credit facilities to households
33 % of the respondents were below the age of 30 years, 32
% between 41 to 50 years. The high number of youth
structure of the population in Kenya. Those above 61 years (
senior most group and are assumed to be the most experienced in terms of
farming practices, drought prediction and drought adaptation strategies. Those below 30
years are assumed to have greater responsibilities of bringing up young families and therefore
unnecessary burden. Thought those below 30 years could lack the necessary
experience on drought adaptations they are energetic and therefore disseminated with the
right information they are in a position to implement the required drought adaptation
61%Male
Female
households could be attributed to
earlier argument
holder agriculture in sub-
sector as a consequence of faster male out-
County
Efficient and sustainable drought adaptation practices made by individual households
age. Human responsibilities increase with age and
the household
not only on the decisions made by an individual household
to households.
30 years, 32%
The high number of youth is a
Those above 61 years (7%)
experienced in terms of
Those below 30
years are assumed to have greater responsibilities of bringing up young families and therefore
unnecessary burden. Thought those below 30 years could lack the necessary
experience on drought adaptations they are energetic and therefore disseminated with the
right information they are in a position to implement the required drought adaptation

48
Table 4.1: Age of the household head in Laikipia West sub-County (N=180) Years Number of respondents Number of respondents (%) Below 30 years 59 33 30-40 Years 58 32 41-50 Years 34 19 51-60 Years 17 9 61 And Above 12 7 Total 180 100.0
Source: Field data (2016)
4.5 Household Heads Education Level in Laikipia West sub-County
Education background of the household head is an important resource that makes a
difference in the agriculture sector. Results in Table 4.2 show that, 31% of the household
head had attained primary education while 8% had attained tertiary education. The high
number of respondents who have no formal education (29%) could have missed the
opportunity to learn the importance of weather forecasting and seasonal climate forecast
which is important to farmers in determining the time of planting. Laikipia West sub-County
being a rural area in a developing country the high number of respondent without formal
education could be a limitation in adopting new technology and drought adaptation strategies.
Table 4.2: Households education level in Laikipia West sub-County (N=180)
Education Number of respondents Number of respondents (%) No formal education 53 29 Primary education 55 31 Secondary education 58 32 Tertiary education 14 8 Total 180 100.0
Source: Field data (2016)
In order to assess the disparities in education among the members of either gender, the
variable on education was cross tabulated with gender. The results presented in Table 4.3
show that 61% men and 54% of women have primary education and below. The number of
men who have informal education is higher than that of female while tertiary education,
though attained by few people, has equal number of either gender. The high number of male
with no formal education could be reflected by the higher number of male respondents and
not necessarily that women are more educated in Laikipia West sub-County than men.
The high number of households who have primary education and below from either
gender could have a negative significance on the day to day decisions made on drought
response and adaptation strategies by members of either gender. The high number of

49
respondents with informal education may be an indication of the crucial role played by
indigenous knowledge in drought adaptation strategies in Laikipia West sub-County. There
are many forums that offer learning opportunities to households such as; churches and
mosques, interaction with agriculture extension officers, chief barazas, and interaction
among themselves. The finding supports the earlier works of Bishnu (2010) in Nepal that the
level of education still remains very low in rural areas. According to Uphoff (1996) formal
education broadens the outlook and knowledge of the farmers and thus educated farmers are
more receptive to innovations and more likely to adapt to rainfall variability. According to
Karanja (2013) on the analysis of effects of rainfall variability on potato production in
Oljoro-orok Nyandarua County, educated farmers are fast in decision making which is an
indication that supplied with the right information they have the potential of increasing
yields.
Table 4.3 Cross tabulation of education and gender in Laikipia West sub-County (N=180)
Gender Education (%)
Informal Primary Secondary Tertiary level
Male 27 34 30 9
Female 31 23 33 13
Source: Field data (2016)
4.6 Duration Household head had stayed in Laikipia West sub-County
The number of years a household has lived in an area could translate to the
accumulated experience gathered on the physical, social and economic dynamics of that
region over the years. The findings in Figure 4.2 shows that 26% of respondents had lived in
the study are for a period of 6-10 years while 10% of the respondents had lived in Laikipia
West sub-County for less than five years. With the high number of household heads having
stayed in Laikipia West sub-County for a period of 6-10 years, they were in the study area
during 2009 drought which was the reference drought event for the study.
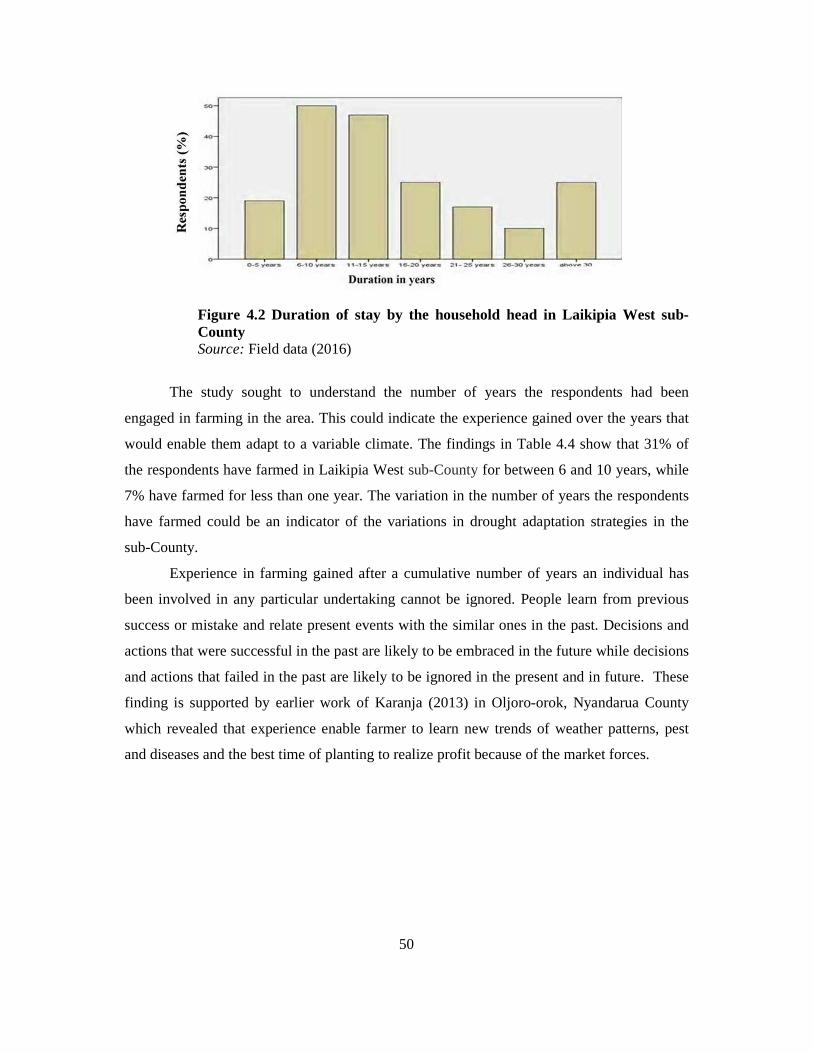
50
Figure 4.2 Duration of stay by the household head in Laikipia West sub-County Source: Field data (2016)
The study sought to understand the number of years the respondents had been
engaged in farming in the area. This could indicate the experience gained over the years that
would enable them adapt to a variable climate. The findings in Table 4.4 show that 31% of
the respondents have farmed in Laikipia West sub-County for between 6 and 10 years, while
7% have farmed for less than one year. The variation in the number of years the respondents
have farmed could be an indicator of the variations in drought adaptation strategies in the
sub-County.
Experience in farming gained after a cumulative number of years an individual has
been involved in any particular undertaking cannot be ignored. People learn from previous
success or mistake and relate present events with the similar ones in the past. Decisions and
actions that were successful in the past are likely to be embraced in the future while decisions
and actions that failed in the past are likely to be ignored in the present and in future. These
finding is supported by earlier work of Karanja (2013) in Oljoro-orok, Nyandarua County
which revealed that experience enable farmer to learn new trends of weather patterns, pest
and diseases and the best time of planting to realize profit because of the market forces.

51
Table 4.4: Length of household heads engagement in farming in Laikipia West sub-
County (N=180)
Years Number of respondents Number of respondents (%) Below 1 year 12 7 1-5 years 45 25 6-10 years 56 31 11-15 years 18 10 16-20 years 16 9 Above 20 years 33 18 Total 180 100.0
Source: Field data (2016)
The years of experience a household has gained were further operationalized into the
following categories: less experience (0-5 years), experienced (6-10 years) and more
experienced (11- and above). Further analyses of Table 4.6 reveal that 30.8 % of the
respondents have less experience, 32.5 % are experienced and 36.7 % has more experienced.
The high number of those with no and low experience could be a limitation in the drought
adaptation strategies adopted by the respondents.
The findings in Table 4.6 show that members of either gender have lived in the sub-
County for less than 20 years. Among the households who have lived in the study area for
more than 20 years 33% are male while 70% of female have lived in the sub-County for less
than 15 years. This shows that based on the experience with the weather patterns in the sub-
County men are likely to adopt better drought adaptation strategies to drought than women.
Table 4.5 Cross Tabulation of the duration the household head had stayed in the area
and gender (N= 180)
Gender Years lived in the Location (%)
0-5 6-10 11-15 16-20 21-25 26-30 Above 30
Male
Female
13 19 23 12 10 5 18
4 38 28 15 6 6 3
Source: Field data (2016)
4.7 Household’s Source of Income in Laikipia West sub-County
The study analyzed the source of households’ income in order to evaluate their
vulnerability to droughts. Source of income was broadly categorized into six categories’
namely: government employment, business person, maize farming, dairy farming,
pastoralism and wheat farming. Source of income was considered since vulnerability to

52
drought varies from one source to the other. Rain fed agriculture for example is more
vulnerable to drought events than government employment. Results presented in Table 4.6
reveal that major source of income for the households in the study area are maize farming
(34%) and pastoralism (34%). While 17% of the households observed that business is their
major source of income. Since farming and pastoralism rely heavily on rainfall, such
households are likely to be affected adversely in the situation of adverse weather. Laikipia
West sub-County which lies within the leeward side of Mount Kenya may not be favourable
for rain fed maize farming making respondents choose pastoralism as a complementary
income source.
Table 4.6: Households Source of Income in Laikipia West sub-County (N=180)
Source of income Number of respondents Number of respondents (%) Government Employment 6 3 Business Person 30 17 Maize Farming 62 34 Dairy Farming 9 5 Pastoralism 62 34 Wheat Farming 1 1 Other 10 6 Total 180 100.0
Source: Field data (2016)
In order to assess gender disparity in sources of income among households, the
findings on gender were cross tabulated with the source of income. Results in Table 4.7
shows that, the number of men is more than women in various income categories in the sub-
County. The higher number of men involved in pastoralism is an indication that it is a male
dominated activity. Maize farming and pastoralism are the dominant sources of income while
wheat farming and government employment are the least source of income among the
households. These findings show that agriculture and pastoralism are the major source of
livelihood in Laikipia West sub-County. Any threat to these sectors such as drought in the
sub-County is a threat to the lives of the households therefore the need for drought adaptation
strategies.
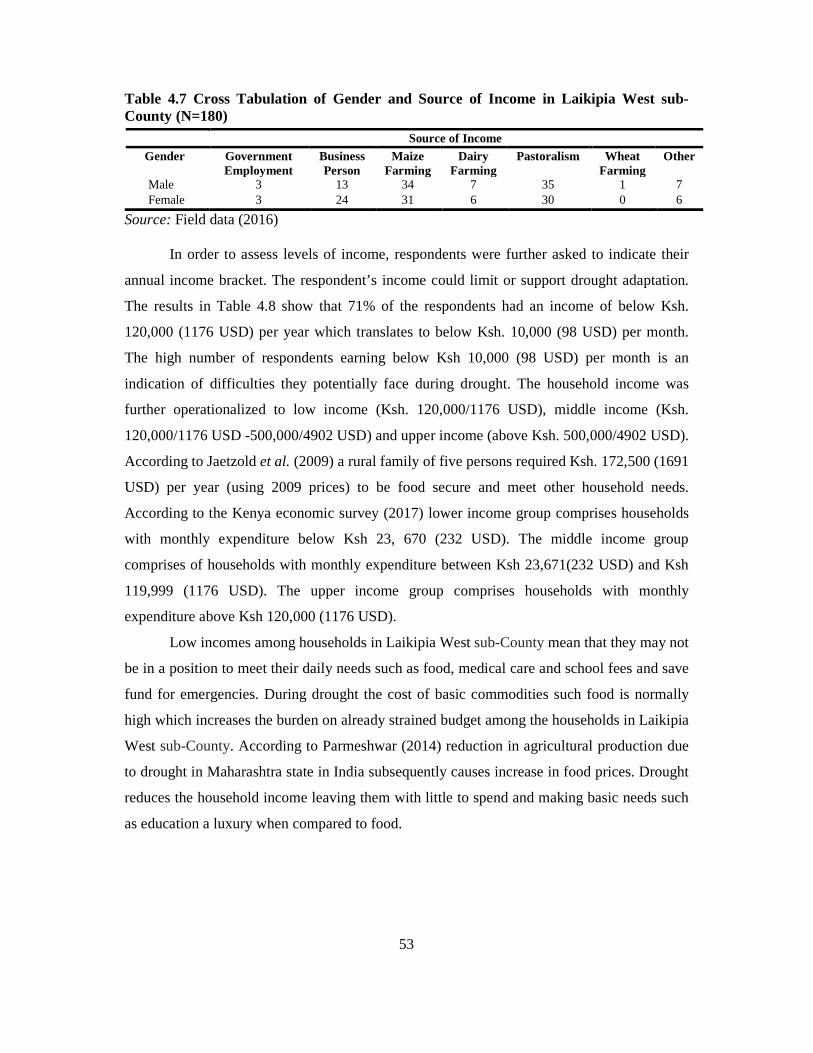
53
Table 4.7 Cross Tabulation of Gender and Source of Income in Laikipia West sub-County (N=180) Source of Income
Gender Government Employment
Business Person
Maize Farming
Dairy Farming
Pastoralism Wheat Farming
Other
Male 3 13 34 7 35 1 7 Female 3 24 31 6 30 0 6
Source: Field data (2016)
In order to assess levels of income, respondents were further asked to indicate their
annual income bracket. The respondent’s income could limit or support drought adaptation.
The results in Table 4.8 show that 71% of the respondents had an income of below Ksh.
120,000 (1176 USD) per year which translates to below Ksh. 10,000 (98 USD) per month.
The high number of respondents earning below Ksh 10,000 (98 USD) per month is an
indication of difficulties they potentially face during drought. The household income was
further operationalized to low income (Ksh. 120,000/1176 USD), middle income (Ksh.
120,000/1176 USD -500,000/4902 USD) and upper income (above Ksh. 500,000/4902 USD).
According to Jaetzold et al. (2009) a rural family of five persons required Ksh. 172,500 (1691
USD) per year (using 2009 prices) to be food secure and meet other household needs.
According to the Kenya economic survey (2017) lower income group comprises households
with monthly expenditure below Ksh 23, 670 (232 USD). The middle income group
comprises of households with monthly expenditure between Ksh 23,671(232 USD) and Ksh
119,999 (1176 USD). The upper income group comprises households with monthly
expenditure above Ksh 120,000 (1176 USD).
Low incomes among households in Laikipia West sub-County mean that they may not
be in a position to meet their daily needs such as food, medical care and school fees and save
fund for emergencies. During drought the cost of basic commodities such food is normally
high which increases the burden on already strained budget among the households in Laikipia
West sub-County. According to Parmeshwar (2014) reduction in agricultural production due
to drought in Maharashtra state in India subsequently causes increase in food prices. Drought
reduces the household income leaving them with little to spend and making basic needs such
as education a luxury when compared to food.

54
Table 4.8 Household annual income in Laikipia West sub-County (N=180)
Household annual income (Ksh.) Number of respondents Number of respondents (%)
Below 120,000(1,176 USD 128 71
120,000-500,000(1,176-4,902 USD) 38 21
Over 500,000 (4,902 USD) 14 8
Total 180 100.0
Source: Field data (2016)
4.8 Household Farm Size in Laikipia West sub-County
In order assess how farm size influence drought effects, respondents were asked to
provide information on their farm size. The data on land should be handled with care because
most of the household had no documentation as proof of ownership. However the researcher
sought to know the size of the land owned by the respondents. Results in Table 4.9 show that
10% of the respondents own 2 to 5 acres of land, 10% own over 10 acres of land. With 38%
of the households having less than 2 acres of land, intensive farming is the only viable option
to the households in Laikipia West sub-County. Crop farming being among the main
economic activity in the area and with such small land sizes, maximum returns per acre
remains the only guarantee to increased production among households.
This finding supports the earlier study by Ogola, Milton, Ayieko, Orawa and Kimani
(2011) in Nakuru which revealed that small land size is an indication that intensive farming is
the only option to enhance production. The small land sizes among the households’ leaves
them more vulnerable to weather related disasters such as drought since when they happen
the respondents have limited options. Small scale farmers have limited options since their
sources of incomes are limited leading to little savings in form of food or cash in the financial
sectors such as banks and little to spend on daily needs such as food, clothing and school
fees. The small land size in an agro pastoralist region could also be a source of conflict due to
decreased grazing fields during drought. This was observed by Ahmed (2001) who mentions
the case of Sudan and indicates that “the shrinking of land resources used by pastoralists and
agro-pastoralists has been accentuated further by instability created by conflicts and civil
wars which are becoming a major feature in the region.”

55
Table 4.9: Size of the Land Owned by Households in Laikipia West sub-County (N=180) Years Number of respondents Number of respondents
(%) Less than 2 acres 68 38 2-5 acres 18 10 5-10 acres 76 42 Over 10 acres 18 10 Total 180 100.0
Source: Field data (2016)
In order to assess whether the size of land owned by households determines the choice
of economic activity among households, the source of income was cross tabulated with the
size of the land. The findings on Table 4.10 show that 54% of household heads with less than
2 acres of land are involved in maize farming compared to 29% who are pastoralist. Twenty
two percent (22%) of the household heads who have over 10 acres of land are pastoralist as
compared to 4% who are maize farmers. All households practicing wheat farming have over
ten acres of land. This finding shows that the choice of the economic activities among
households in Laikipia sub-County depends on the size of the land holding.
Economies of scale in wheat farming make it unfavorable for those with small
portions of land but the best bet for those with large portions of land. Pastoralism requires
large portions of land since small portions will be limited in the availability of pasture. Maize
farming is flexible since it depends on the category of farmers and the reasons for farming
among various households. Those with small portions of land may practice subsistence maize
farming while those with large portions of land will practice commercial maize farming. For
respondents involved in business the size of the land may have less significance. This is
explained by the low variations in the number of respondents involved in business and the
size of land they own.

56
Table 4.10 Cross Tabulation of the size of the land and source of income in Laikipia West sub-County (N=180) Source of income Size of the Land (Acres) (%)
Less than 2 2-5 5-10 Over 10 Government Employment Business Person Maize Farming Dairy Farming Pastoralism Wheat Farming Other
16 34 50 0 33 39 24 4 54 2 40 4 25 0 67 8 29 6 43 22 0 0 0 100 23 15 54 8
Source: Field data (2016)
4.9 Trainings in Agriculture among Household Heads in Laikipia West sub-County
In order to assess the households’ opportunities for improvements on farming skills,
the respondents were asked to state whether they have attended some training on farming or
not. Results in Figure 4.3 show that 72% of the respondents have not attended any training
on farming while 28% have attended. Training in agriculture was categorized to capacity
building workshops, seminars, extension officer, formal training by resource persons during
chief’s barazas or any other forms of gathering. The high number of households (72%), who
have not attended farming training, is an indicator that they could have missed opportunities
to learn the existence of new seed varieties in the market, better strategies to deal with
weather disasters and learn sustainable management practices. Capacity building through
trainings updates household farming skills and enables them learn new farming trends.
The importance of agriculture extension officers cannot be underestimated; farming
trainings offer a platform for dissemination of emerging issues in the agriculture sector,
information of new seed varieties and availability of subsidized fertilizers and channels of
accessing credit facilities. The high numbers of respondents who have not attended training
means the households have missed the benefits associated with these trainings and that they
have missed the value for their taxes which is spent on paying the agriculture extension
officers.

Figure 4.3: Training
The findings in Figure 4.4
farming compared to 26 % who have attended
number of men compared to women
attended training perhaps due to
pastoralist migrates from one place to another
majority of men have not attended training, generally very few households
have attended these trainings and could have a negative
Laikipia West sub-County.
Figure 4.4: Trainings in
72%
0%
20%
40%
60%
80%
100%
120%
140%
Num
ber
of r
espo
nden
t (%
)
Training in Agriculture
57
rainings in Agriculture among household heads
Figure 4.4 show that 74 % of males have not attended any training i
% who have attended. In Laikipia West sub-County where
compared to women are pastoralists. This explains why they
attended training perhaps due to the nature of pastoralism as a source of livelihoods where
from one place to another in search of water and pas
majority of men have not attended training, generally very few households from either gender
and could have a negative effects on drought adaptation
Trainings in Agriculture among household heads by gender
28%
72%
Yes
No
Yes No
26%
74%36%
64%
Training in Agriculture
have not attended any training in
County where the high
they have not
the nature of pastoralism as a source of livelihoods where
in search of water and pasture. Though
from either gender
on drought adaptations in
Agriculture among household heads by gender
Female
Male

58
CHAPTER FIVE
5.0 DROUGHT CHARACTERISTICS, TRENDS AND ITS EFFECT ON
HOUSEHOLD LIVELIHOODS . 5.1 Introduction
This chapter presents results on rainfall trends, drought characteristics and effects of
2009 drought on household livelihoods, perceptions of drought disasters and factors
influencing drought perception in Laikipia West sub-County. Drought characteristic was
operationalized as severe and moderate. Drought events were analyzed at both seasonal and
annual categories. Households’ perceptions to drought were regressed against socio-
economic characteristics of the households.
5.2 Rainfall Trend in Laikipia West sub-County 1984- 2014
Rainfall data collected during the study period are shown on appendix 3. Rainfall
trend is the graphical representation of the observed drought years from 1984 to 2014 in
Laikipia West sub-County. Results in Figure 5.1a and Figure 5.1b show the trend of annual
rainfall amounts in Ndaragwa and Rumuruti stations. The highest rainfall amount was
experienced in 1997 and 1998 in Rumuruti and Ndaragwa respectively. This coincides with
the 1997/1998 El Niño phenomena in Kenya where the country received rainfall above
normal. Other periods when the region experienced high rainfalls are 1990 and 2012. The
lowest average rainfall was experienced in 1984, 1999, 2000 and 2009. When compared to
the mean rainfall, 53% of the study period in Rumuruti station received below mean rainfall
while 40 % received rainfall above the mean. This shows that during the study period more
years recorded below normal rainfall.
The lowest average rainfall experienced in 1999 and 2000 coincides with La Niña
phenomena that followed the El Niño rains of 1997 and 1998. In a related study, it was
established that in South Africa drought disasters tend to occur in the year following the onset
of El Niño and are less frequent at other times (Dilley & Heyman 1995). The lowest rainfall
amount was recorded in 1984 in Rumuruti and in 2009 in Ndaragwa stations. Ndaragwa had a
higher precipitation compared to Rumuruti and this could be due to its proximity to the
Aberdare Ranges. When compared to the mean rainfall, 47% of the study period in Ndaragwa
station received below the mean rainfall while 37 % received rainfall above the mean. This
shows that during the study period more years recorded below normal rainfall as compared to

59
the years that received above normal rainfall. During the study period only 16% of the years
received normal rainfall in Ndaragwa. The mean rainfall in Ndaragwa station is higher
compared to Rumuruti station and this could mean that Mutara location which is in proximity
to Ndaragwa could have favourable conditions to support maize (other crop) farming or
growth of pasture than the other Locations in Rumuruti Ward.
2 0 1 12 0 0 82 0 0 52 0 0 21 9 9 91 9 9 61 9 9 31 9 9 01 9 8 71 9 8 4
1 4 0 0
1 2 0 0
1 0 0 0
8 0 0
6 0 0
4 0 0
2 0 0
0
Y e a r
rain
fall
ob
se
rva
tio
n
_X = 7 3 9
U C L = 1 3 3 7
L C L = 1 4 2
R u m u r u t i S t a t i o n
Figure 5.1 a: Annual rainfall trend (1984-2014) for Rumuruti station Source: Field data (2016)
2 0 1 12 0 0 82 0 0 52 0 0 21 9 9 91 9 9 61 9 9 31 9 9 01 9 8 71 9 8 4
1 6 0 0
1 4 0 0
1 2 0 0
1 0 0 0
8 0 0
6 0 0
4 0 0
2 0 0
Y e a r
rain
fall
ob
srv
ati
on
_X = 8 6 6
U C L = 1 4 3 7
L C L = 2 9 5
1
N d a r a g w a S t a t i o n
Figure 5.1 b: Annual rainfall trend (1984-2014) for Ndaragwa station Source: Field data (2016)

60
5.3 Drought Characteristics in Laikipia West sub-County (1984- 2014)
Rainfall data has been used to identify, quantify and classify seasonal drought years,
both long and short rain seasons in Laikipia West sub-County from 1984 to 2014. Drought
characteristics have been analyzed on seasonal and annual bases. Drought analysis for the
growing seasons has been necessitated by their importance to crop growers and pastoralist
who entirely depends on rain-fed agriculture. The crop growing season and livestock pasture
in Laikipia West sub-County are March, April and May (MAM) which is a long rain season
and October, November and December (OND) which is a short rain season. The dry months
are January, February, June, July, August and September. In this study, drought was
categorized as moderate and severe. Moderate drought refers to the drought with the SPI
value of -1.0 to -1.49 and severe drought refers to drought with SPI value of -1.5 to -1.99.
Results in Figure 5.2 show that for the period under study during the long rain season,
about 19% and 16% of the years received below normal rainfall at Rumuruti and Ndaragwa
stations respectively. It is notable that; 1993 and 2000 were the driest years during the MAM
at both Rumuruti and Ndaragwa; while 1998 was the wettest year in both stations during the
same season. The recent severe drought during MAM was in 2009 in Ndaragwa and
Rumuruti stations. The SPI results in Figure 5.3 show that for the period under study, about
16% and 29% of the years received below normal rainfall during the OND at Rumuruti and
Ndaragwa stations respectively. It is notable that; 1985, 1987, 1996 and 2010 were the driest
years at both Rumuruti and Ndaragwa; while 1997 was the wettest year in both stations
during the same seasons. The recent drought during OND was in 2010 in Ndaragwa and
Rumuruti stations.
Seasonal drought events show that for the period under study, Laikipia West sub-
County has not experienced drought during the MAM and OND seasons in the same year.
This shows that in case there is drought in one season the following season is a non-drought
season. This explains the importance of seasonal climate forecast to crop farmers on placing
the best bet in maximizing production in favourable seasons and to caution them during
unfavorable seasons either by planting drought resistant seeds or opting not to cultivate crops.

61
Figure 5.2: Long rain season SPI results for Rumuruti and Ndaragwa station Source: Field data (2016)
Figure 5.3: Short rain SPI results for Rumuruti and Ndaragwa station
Source: Field data (2016)
Annual drought analysis is important because of livestock farmers who depend entirely
on natural pasture for their livestock. The standard precipitation index annual results in
Figure 5.4 show that for the period under study, about 36% and 17% of the years received
below normal annual rainfall at Rumuruti and Ndaragwa stations respectively. Also 40% and
67% of the total number of years under study received normal rainfall at Rumuruti and
Ndaragwa stations respectively. It is notable that; 1984, 1987 and 2009 were the driest years
at both Rumuruti and Ndaragwa; while 1998 was the wettest year in both stations. It is
instructive to note that in 1990, Rumuruti received above normal rainfall while Ndaragwa
received below normal rainfall. The results highlight the significance of localized factors
-2
-1.5
-1
-0.5
0
0.5
1
1.5
2
2.5
1984 1989 1994 1999 2004 2009 2014
Sea
sona
l SP
I val
ues
Year
SPI MAM for Rumuruti SPI MAM for Ndaragwa
-2
-1.5
-1
-0.5
0
0.5
1
1.5
2
2.5
3
3.5
1984 1987 1990 1993 1996 1999 2002 2005 2008 2011 2014
Sea
son
SP
I V
alue
s
Year
SPI OND- Rumuruti SPI OND- Ndaragwa

62
such vegetation cover and topography in influencing rainfall amount. Notable too is
establishment that Rumuruti ward has experienced more droughts in the past than Ndaragwa
ward.
The results presented in Figure 5.4 reveal that, moderate drought was experienced in
1995 and 2008 in Rumuruti and 1999 and 2000 in Ndaragwa; severe drought in 1985, 1987,
1991, 2005, 2009 at Rumuruti station and 2014 in Ndaragwa; while extreme drought was
experienced in 1984, 1999 and 2000 in Rumuruti and 1984, 1987 and 2009 in Ndaragwa.
The 1984 drought is on record as the most severe drought in Kenya that was triggered by La
Niña event of 1982-1984 (Shisanya, 1990). The wet years are also classified as moderately
wet, very wet and extremely wet years. These are quantified as 1.0 to 1.49, 1.5 to 1.99, and
2.0 and above respectively. The moderately wet (1.0 to 1.49) years were: 1990, 2003, 2007
and 2013 in Rumuruti and 2004, 2010 and 2013 in Ndaragwa. These results concur with
earlier studies that the drought cycle has changed in the recent time and become more
frequent, 2-3 years, giving no time to recover from the effects (Akliliu & Alebachew, 2009;
Coppock, 1994; Anderson & Mowjee, 2008).
The wet years (1.5 to 1.99) were 1998 and 2010 in Rumuruti and 2012 in Ndaragwa.
The extreme wet years (2.0 and above) were 1997 and 2011 in Rumuruti and 1998 in
Ndaragwa. The identified drought years in Rumuruti and Ndaragwa were also drought years
in Kenya as described by earlier studies that Kenya has experienced drought for the last 30
years in, 1983/84, 1987/1988, 1991/92, 1995/96, 1999/2000, 2004/2005, 2008/2009 and 2011
(Huho et al., 2010).The 1984, 1991-92, 1994 droughts were declared as national disasters by
the government of Kenya (Huho & Kosonei, 2013). Other regions of the world that
experienced drought during the same period include Thailand (Prapertchob, Bhandari &
Pandy, 2007) and South Africa (Tyson & Dyer, 1978; Vogel, 2000; Adger, 2001; Kihupi,
Kingamkono, Dihenga, & Rwamugira, 2003).

63
Figure 5.4: Annual SPI results for Rumuruti and Ndaragwa stations Source: Field data (2016)
5.4 Effects of Drought on Household Livelihoods in Laikipia West sub-County
Individual droughts vary according to intensity, duration, and spatial extent and the
types of impacts they produce (Wilhite et al., 2014). Effects of drought result from the
interplay of the event (i.e., precipitation deficiency) with the social characteristics of an area,
drought risks and perceptions also vary across regions and locales (Wilhite et al., 2007). The
effects of 2009 drought on household livelihood in Laikipia West sub-County was analyzed
at five categories. These are crops, livestock, and health, social and environmental effects.
The data on the effects of 2009 drought was obtained from the household survey. The effects
of drought were limited to 2009 drought to enable respondents recall accurately.
5.4.1 Effects of Drought on Crops in Laikipia West sub-County
Household survey results in Table 5.1 show that 2009 droughts led to reduced crop
yields (57%) and crop failure (26%). According to Wilhite, Svoboda, and Hayes (2007) the
effects of drought are as a result of the interplay between natural event (precipitation
deficiency) and social response. The findings supports the earlier argument by Boubacar
(2012) that revealed that in United State of America poor temporal spread of rainfall is
harmful to crop. The findings also supports the earlier argument by Olaoye (1999) that
regular occurrence of drought as a result of erratic rainfall distribution and cessation of rain
during the growing season reduced Nigeria’s capability for increased crop production.
-4
-3
-2
-1
0
1
2
3
1984 1989 1994 1999 2004 2009 2014
Ann
ual S
PI V
alue
s
Year
SPI for Rumuruti SPI for Ndaragwa

64
In 2014/2015 MAM season an agriculture officer observed that;
Table 5.1: Effects of drought on household livelihoods in Laikipia West sub-County
(N=180)
Number of respondents Number of respondents (%) Reduced crop yield 103 57 Crop failure 47 26 High cost of goods 30 17 Total 180 100.0
Source: Field data (2016)
On the effects of 2009 drought on crops, an extension officer observed that:
The results in Table 5.2 show that three quarter of crop area (27%) was impacted by
drought while 75% of respondents reported few livestock death in Laikipia West sub-County
(Table 5.3). This finding shows that crops are more vulnerable to droughts than livestock.
The fact that pastoralists are able to move with their animals from one place to the other in
search pasture and water increases the chances of animals’ survival. Water scarcity during
drought decreases the chances of crop growth leading to decreased yields. The current study
supports the earlier studies by Ortegren et al. (2014) and Pederson et al. (2012) in the
Southeast USA that the severity of recent drought events has highlighted the need for a better
climatological understanding of drought, particularly in order to address potential water
management challenges.
Table 5.2: Percentage of household crops impacted by drought (N=180) Crops area impacted Number of respondents Number of respondents (%) Less than 25% crop area 37 21 Less than 50% crop area 46 25 Less than 75% 48 27 Over 75% 49 27 Total 180 100.0
Source: Field data (2016)
‘Laikipia West sub-County experienced food shortages, lack of pasture, market supply shortages and high cost food during the 2009 drought. The high cost of food was caused by sourcing of food from the neighbouring sub-County hence increased cost. The increased cost of food increases burden to the already constraints households in Laikipia West sub-County.’
‘Land was prepared during the March/April rains but there was no germination. Eighty percent of the farms experienced total crop failure.’

65
The secondary data on maize production from 2001 to 2014 supports the household
data that shows decreased maize production in Laikipia West sub-County. Figure 5.5 shows
decreased maize production from 2007 to 2014. The highest maize production during the
fourteen year period was in 2005 while the lowest production was in 2014. The lowest maize
production in 2014 supports the observation by the agriculture officers that 80% of the farms
experienced total crop failure. The decreased production from 2007 to 2014 can be explained
by the drought events on Figure 5.4 where moderate drought was experienced in 2003, 2007
and 2013 while severe drought was experienced in 2009 at Rumuruti division. The lowest
production in 2010 is explained by severe drought in the same year during OND season as
shown on Figure 5.3.
Figure 5.5: Maized production in Laikipia West sub-County in bags (2001-2014)
Source: Laikipia West sub-County Agriculture office (2016)
5.4.2 Effects of Drought on Livestock in Laikipia West sub-County
Results in Table 5.3 show that 75% of the respondents indicated that the 2009 drought
led to few livestock death while 12% indicated that 2009 drought did not cause livestock
losses. The loss of animals leads to reduced livestock production. The high number of
respondents indicating that few animals died shows that drought has significant effects on
livestock production. Drought reduces forage production and water supplies, thus placing
serious pressure on the livestock industry (UNDP, 2000; UNCDD, 1999).
According to World Bank (2013) drought makes animals more susceptible to
0
50000
100000
150000
200000
250000
300000
2001 2002 2003 2004 2005 2006 2007 2008 2009 2010 2011 2012 2013 2014
Mai
ze y
ield
(B
ags)
Year
Maize yield in 90kg/ bag

66
diseases. Grain-eating birds and grasshoppers are usually reliant on pastures to meet their
food requirements. However, fodder scarcity during drought forces them to move to
cultivated areas, causing severe damage to mature crops. It was not possible to estimate the
exact number of the animals that died due to drought. This study supports the earlier
arguments by the World Bank (2013) that considering data limitations, it is difficult to
quantify the losses in the livestock sector. The economic effects of drought in Laikipia West
sub-County leads to diversion of development fund by both county and national government
in order to meet the basic needs of the affected households. These results are similar to an
earlier by Lackstrom (2015) that drought is one of the costliest hazards faced by the United
States, having caused billions of dollars in damage and affected all regions of the country
over the past two decades.
Table 5.3: Effects of drought on livestock at household level in Laikipia West sub-County (N=180) Effects on Livestock Number of respondents Number of respondents (%) No livestock died 21 12 Few livestock deaths 135 75 All livestock died 24 13 Total 180 100.0
Source: Field data (2016)
5.4.3 Social Effects of Drought in Laikipia West sub-County
Besides the effects on crop and livestock production, drought was reported to have
social effects in Laikipia West sub-County. As shown in Table 5.4, seasonal migration with
animals (28%) and increased distance to water points (28%) were the leading social effects of
drought on households. It is noteworthy that conflict over pasture (18%), job losses (11%)
and children missing school (9%) were also reported as consequences of drought in Laikipia
West sub-County. Drought creates fodder scarcity, thereby contributing conflict risk between
herders and farmers (World Bank 2013). Drought triggers conflict as in the case of 1990
second Tuareg Rebellion in Mali (Keita, 1998). According to Thébaud and Batterby (2001) in
the Sahel region, expansion of agriculture during the wet 1950s and 1960s and a shift to agro-
pastoralism pushed pastoralists into more marginal regions and led to a breakdown in the
networks connecting herders and farmers, further contributing to conflict between these
groups.

67
Table 5.4: Social Effects of drought in Laikipia West sub-County (N=180) Number of respondents Number of respondents (%) Children missed school for lack of food and school fees
16 9
Seasonal migration with animals 51 28 Increased distance to the water point 51 28 Job losses in farms 20 11 Conflict over water and pasture 33 18 Others 9 6 Total 180 100.0
Source: Field data (2016)
The key informants’ findings show that respondents who lost all their animals or
suffer total crop failure during drought committed suicide. The findings supports the earlier
study by Parmeshwar (2014) in Maharashtra state of India that hopelessness and mental
depression due to the adverse effects of drought is one of the main causes behind the
abnormally high rate of household suicide during hazards. In spite of huge expenses on
measures to mitigate effects of drought, the numbers of farmer suicides continues to grow
demonstrating a lack of social and community support in the existing drought relief packages
(Kiem, 2013). On conflicts, a Red Cross officer stated that:
According to an informant compensation of the households when their crops are
destroyed by the wild animals takes a long time however the Kenya Wildlife Service are very
prompt when a wild animal is attached. With such kind of perception among the households
there is need for community cooperation between the Kenya Wildlife Service and the
households on sustainable solution to the human-wildlife conflicts. According to Rumuruti
location Chief, alternative dispute resolution mechanisms of human conflicts are encouraged
through the use of elders and religious organizations. A similar method of dispute resolution
was used in Zimbabwe where the role of the traditional leader has continued to add value to
‘Increase in conflict in Laikipia West sub-County is as a result of high suspicion between the farmers and the pastoralist. The pastoralist feels that the decrease in the volume of the river downstream is as a result of the farmers using the water in the upstream for irrigation which leads to pastoralist grazing their animals on farms leading to conflict. The conflicts are not just human and human conflict but also human and wildlife conflicts. The elephants migrate upstream when the rivers dry up down streams invading people’s farms and in some instances leading to heavy losses to the farmers. When the farmers complain to the Kenya Wildlife Service and the Laikipia County government, it takes a very long time for them to be compensated and this makes it difficult them to meet their daily needs and educating their children.’

68
the traditional court system (Mubaya & Mafongoya, 2017). Alternative dispute resolution
mechanisms promote unity among the members of the society. The churches in Laikipia West
sub-County have been at the forefront in fostering peace using different methods particularly
submission, confession, and peace visits (Mwangi, 2012).
Seasonal migration with the animals separate families for some time and deny parents
an opportunity to raise their children together. Migration also affects school attendance
among the pastoralist children leading to loss of school time which translates to poor
performance in the national examinations. An informant stated that:
5.4.4 Environmental Effects of Drought in Laikipia West sub-County
Drought was also found to have environmental effects in Laikipia West sub-County
(Table 5.5). Drying of rivers (79%), lack of wood fuel (12%) and increased fire incidences
(8%) and the most reported environmental effect of droughts. Drying of rivers which was the
greatest environmental effects shows that people and animals had to walk a greater distance
to look for water and could also increase conflict over the few existing water sources.
Animals walking over long distances increase soil erosion hence degrading soils. Laikipia
West sub-County being a semi arid region suffers from decreased precipitation causing
drying of rivers. This study supports the earlier findings by Ahmed et al. (2001) that arid and
semi-arid environments are characterized by extreme variability and unreliability of rainfall
both between different years and between different places in the same year. Consequently,
these areas are characterized by the scarcity and seasonal variability of vegetation, and
vulnerability to drought.
The increased fire incidences lead to loss of biodiversity and subsequently to negative
consequences on the ecosystem. Other (1%) environmental effects mentioned by the
respondents when asked to specify the category on others are soil erosion and destruction of
infrastructure. Increased cases of forest fire in Laikipia have been blamed for decreased forest
cover in Laikipia West sub-County. The decreased amounts of water and scarcity of pasture
leads to death of animals which pollutes the environment due to the presence of unburied
animal carcasses.
‘There are no government initiatives such as relief food and school feeding programmes in Laikipia West sub-County to deal with drought events like it happens in other dry lands of Kenya. The support received is from the Catholic Church relief programs under the Caritas program. The program recently supported victims of fire at Mutamaiyu village.’

69
Table 5.5: Environmental effects of drought in Laikipia West sub-County (N=180)
Number of respondents Number of respondents (%) Lack of household fuel 21 12 Drying of rivers 142 79 Increased cases of fire 16 8 Others 1 1 Total 180 100.0
Source: Field data (2016)
5.4.5 Effects of Drought on Health in Laikipia West sub-County
Periods of droughts are often characterized by low hygiene standards; for instance it
was found that during drought period, the households are forced to walk for long distances to
fetch water for domestic and livestock. During such times human being and animals get the
water from a common water source which increases the chances of contamination. When
water quality is compromised, diseases incidences among both human and livestock increase.
In the study respondents were asked whether the 2009 drought had any health related
effects. The results presented in Table 5.6 reveal that the health effects include human
diseases, livestock diseases and crop diseases. Respondents observed that the 2009 drought
triggered malnutrition among members of the households (40%), livestock diseases (29%)
and increased crop pest (19%) among others. Reduced water volumes in rivers or lakes lead
to high concentration of pollutants. Increased cases of human diseases translate to low
productivity among households since more time is lost while seeking treatments as opposed
to economic development. Increased cases of livestock diseases is likely to endanger human
life considering the animal products such as milk and meat that people get from livestock.
An informant observed that:
During drought livestock health deteriorates and greater percentage of this animals
die. This study supports the earlier findings by Ahmed and Abdel (1996) in Sudan that lack
of adequate forage and drinking water, coupled with long daily walks in search of feed and
water, have imposed a serious strain on the animals, leading to poor health and increased
mortality. The contamination of water due to decreased quantity and sharing of a common
water point also exposes people to risks of water borne diseases. According to Aklilu and
‘Drought increases distance to the water points which is an additional burden to the social responsibilities of women in Laikipia West sub-County. They spend a lot of time looking for water which sometimes is dirty.’

70
Alebachew (2009) small increases in temperature can result in measurable impacts on the
health of human beings and livestock as well as the availability of water, food, and feed
resources. The current study contradicts the earlier study by Juma (2009) that improved
animal health resulted in an increase in livestock that led to the overuse of common resources
such as water.
Table 5.6: Effects of drought on Health in Laikipia West sub-County (N=180) Number of respondents Number of respondents (%) Increased cases of livestock disease 52 29 Increased crop pest 34 19 Human diseases 16 9 Human death 6 3 Malnutrition 72 40 Total 180 100.0
Source: Field data (2016)
5.5 Perception of Drought Disasters in Laikipia West sub-County
Assessment of drought perception is important because different people perceive
drought differently and derive local adaptation measures based on their individual perception.
Factor influencing drought perceptions were analyzed in order to explain why households
living within the same neighborhood perceive drought differently. According to Ndambiri et
al. (2012) in Kyuso District Kitui County, climate change is a constraint to the productive
capacity of the farm households and that farmers’ perceptions of the changing climate is a
signal for innovative adaptation strategies to be undertaken by the farmers so as to reduce
farming risks emanating from climate change.
5.5.1 Drought Perception in Laikipia West sub-County
Having noted the effects of 2009 droughts on household livelihoods in Laikipia West
sub-County, respondents were further asked on their perceptions to drought. The measureable
indicators of perception were: severe and moderate. The assumption made in the
conceptualization of drought risk in the mentioned categories was that the perceived effects
of drought to an individual household could have been determined by their past effects. This
is what Pennings and Smidts (2000) refer to as risk perception; the local people’s own
interpretation of the likelihood of being exposed to the content of risk. Assessment of local
people’s perceptions and attitudes informs us much more about the relevance of the
adaptation strategies they are likely to adopt. Household perceptions of drought were

71
categorized into two classes namely: severe and moderate. The study found that 53% of the
households felt that the 2009 drought was moderate and 47% drought was severe. The
difference in their perception could be as results of the difference in socioeconomic
characteristics of the households such as; age, gender, education, source of income,
experience, agriculture training among others. The variation of respondents’ responses on the
drought characteristics shows that drought effects differ among households in the same
neighborhood.
The households that are more vulnerable and less resilient are likely to be affected
more as opposed to the households that are less vulnerable and could be more resilient. The
variations of drought characteristics could also lead to adoption of different drought
adaptation strategies among different household living in the same region experience
common physical characteristics. Perception of drought informs households decision on short
term and long term adaptation strategies that need to be put in place in Laikipia West sub-
County. The study supports the earlier finding of Ndambiri et al. (2012) that innovations
towards farm production in Kyuso District are made in response to the farmers’ perceptions
of variable climatic conditions.
5.5.2 Factors Influencing Households Perception to Drought in Laikipia West sub-
County
In order to determine the factors that influence household perception to drought the
independent and dependent variables were regressed using logistic regression model and the
results presented in Table 5.7. The dependent variable was the question on how households
described the 2009 drought as either severe or moderate. The results show that gender of the
household head was not a significant factor of perception of drought in Laikipia West sub-
County. This could be because pastoralism as a source of livelihoods involves members of
either gender and suffer the impacts equally. For a study in an agro-pastoralist zone it is
expected that men are more likely to perceived drought more than women. This could be
because of the mobility with livestock is by men. This was not the case in Laikipia. Contrary
to the earlier work of Ndambiri et al. (2012) on perception of climate change in Kyuso, Kitui
County that the probability of a male household to perceive climate change is higher than that
of female household.
Contrary to the expectations results on education were not significantly related to

72
drought perception. It is expect that educated households have learned the different drought
magnitudes and could be able to categorize drought as either severe or moderate. It is also
expected that household with primary education are likely to perceive drought than those
with informal education. Households with secondary education are likely to perceive drought
than households with informal education while those with tertiary education are less likely to
perceive drought than those with informal education. However results show that education
level is not significant to drought perception. This could be because pastoralism being the
major source of livelihoods in Laikipia West sub-County effects of droughts does not
discriminate and all the households’ livelihoods are affected irrespective of their level of
education.
The number of years a household has engaged in farming is positively related to their
perception to drought. Length of stay in the study area was found to be significant to
perception of 2009 drought event (p= 0.0203). It is possible that experience of the
environment (study site) has contributed to a better perception of the severity of drought.
Lack of a significant relationship between 26-30 years of stay perception to the 2009 drought
can be attributed to their reduced interest in livelihood activities due to their advanced age.
Note, persons who have stayed in the study area for more than 26 years are in their 60s and
less involved in livelihood activities. This is perhaps due to their experience with weather
events such as drought. According to an earlier study by Abul, Amir and Promkhambut
(2013) in North East Thailand farmers who have 30 years farming experience were less likely
to believe that droughts were becoming more frequent; they believed that droughts frequency
remain the same. On the other hand, farmers who have less than 30 years farming experience
believed that drought will become more frequent in the near future. The results support the
earlier argument by Diggs (1991) on drought experience and perception of climatic change
among great plains in the United State farmers, that if farmers do use the availability heuristic
to form assessments of future drought, differences in the perception of drought frequency
should arise from differences in individuals’ experience.
According to the earlier study by Taylor, Steward and Downton (1988) on perceptions
of drought in the Ogallala Aquifer region in the United State, four coherent elements shape
drought perception. Previous drought experiences shape an individual’s memory and are an
important influence on how someone defines drought. What one remembers as a drought
depends on how an individual defines it; while on the other hand, what an individual defines

73
as drought depends on the droughts one remembers. The way drought is defined and the way
past droughts are remembered influence an individual’s expectation of future droughts and
one’s behavior. In Laikipia West sub-County, the study on factors that influence drought
perception was drawn in such way that the drought identifiable indicators were incorporated.
Pastoralism, as a source of income, was found to have significantly influenced the
perception of 2009 drought event (p= 0.0473). None of the other sources of income
(Government employment, business, dairy farming, maize and farming), was found to have a
significant relationship with perception of 2009 drought. Although maize, wheat and dairy
farming are more sensitive to drought than pastoralism, these may not be primary sources of
income. To most households, pastoralism is the lead source of income. Thus, in the event of
drought, most households are severely affected-this could be due to the sensitivity nature of
pastoralism on drought event. Household heads employed by the government have a regular
income which does not vary with the weather events compared to pastoralist who are worst
hit due to decreased pasture.
The study further established that farming on leased land significantly influenced the
perception of 2009 drought event (p=0.0280) than communal and privately owned land. This
could be due to the fact that effect of drought in communal land ownership is a shared
responsibility and not individual responsibility as in leased ownership. Similarly, households
who own private land reserve the option not to engage in farming and therefore averting risks
associated with land. It’s significant to note that in Laikipia West Sub-County, most
households with privately owned land are immigrants who own land and maize farmer and
could opt not to cultivate crops when droughts are predicted to avoid losses unlike those on
leased land that my still want to diversify the types of crops to recover money used to lease
land.
Size of land was not significant to drought perception in Laikipia West sub-County. It
is expected that households with large portions of land are less likely to suffer the effects of
drought compared to those with small portions of land. In a pastoralism dominated area large
farmers allow greater grazing fields than small land sizes. With decreased pasture because of
drought large portions of land are likely to have more pasture compared to small fields. The
reason why land size is not significant to drought perceptions in Laikipia could be because of
the presence of large tracks of land communally owned and also existence of absentee land
owners. Training on agriculture was also not significant to household drought perceptions. It

74
is expected that training broadens individual perceptions with the environment which is not
the case in Laikipia West sub-County. This could be because of the mobile nature of the
pastoralism as a source of income. The opportunities of interaction with extension officers
and attending such trainings are minimal in pastoral realities.
Table 5.7: Odd ratios for logistic regression model on the factors influencing households perception to drought Parameters Coefficient Estimates Wald Odd ratio estimate Gender Male (r) 1.00 Female -0.00127 0.9975 0.999 Age <30 (r) 1.00 31-40 -0.2443 0.6204 0.783 41-50 -0.7350 0.2310 0.480 51-60 -0.6184 0.0004* 0.539 61 and above -0.3007 0.7228 0.740 Education 1.00 Informal education ( r) Primary education 0.0841 0.8653 1.088 Secondary education 0.2095 0.7348 1.233 Tertiary education -1.3791 0.1045 0.252 Length of engt in farming <5 ( r) 1.00 6-10 0.0784 0.9345 1.082 11-15 1.2508 0.1896 3.493 16-20 1.6412 0.1271 5.162 21-25 1.7086 0.0203* 5.521 26-30 1.3424 0.1714 3.828 Source of income Government Employee ( r) 1.00 Business persons -1.8852 0.0814 0.152 Maize farming -1.5997 0.1382 0.202 Dairy farming -0.7920 0.5158 0.453 Pastoralism -2.1796 0.0473* 0.113 Wheat farming 11.9681 0.9923 0.212 Size008_2 -0.6723 0.1607 0.511 Size of land <2 ( r) 1.00 2-5 2.0169 0.1189 7.515 5-10 0.3384 0.6477 1.403 Type of landownership Owner ( r) 1.00 Leased land 1.3224 0.0280* 3.753 Communal ownership 0.8142 0.1231 2.257 Training Yes ( r) 1.00 No -0.8742 0.0928 0.417 * Significant at 5% level of significance Odds ratio <1 less likely to occur in the first group Odds ratio > 1 more likely to occur in the first group Odds ratio of 1 indicates event under study is equally likely to occur in both groups ( r)= Reference category Source: Field data (2016)

75
CHAPTER SIX
6.0 DROUGHT ADAPTATION STRATEGIES AND THEIR DETERMINANT S
6.1 Introduction
This chapter presents the results and discussions on the household and community
drought adaptation strategies and drought adaptation determinants. The chapter also presents
results on the role of institutions in managing local level drought adaptation in Laikipia West
sub-County. Summary tables to indicate percent distribution of dependent and independent
variables are presented. To show how each independent variable influence the outcomes,
cross tabulations were conducted and results presented. Finally chi-square of independence
was conducted to identify the determinants of drought adaptation.
6.2 Household Drought Adaptation Strategies in Laikipia West Sub-County
Household adaptation strategies are the measure put in place by members of the
household to respond to or recover from the effects of drought events. In order to understand
some of the drought adaptation strategies adopted by the households to cope with drought,
the household heads were asked to state the adaptation strategies households adopt during
drought. The most common drought adaptation strategies adapted during drought in Laikipia
West sub-County are: seasonal migration with animals, herd reduction, opting not to cultivate
crops, planting drought resistant seeds, rural-urban migration, waiting for relief food,
engaging in business, gathering wild fruits and roots and practicing charcoal burning. Studies
have shown that without adaptation to climate change, farmers will become more vulnerable
and agricultural production will be severely affected (Smit and Skinner, 2002).
The findings on Table 6.1 show that 25% of the respondents migrated with their
animals in search of water and pasture. Household heads opted to look for employment in the
construction sites or in the flower farms (15%) outside the sub-County. Cases of some of the
respondents relocating to neighbouring counties such as Nakuru were reported. There are
those who opted not to cultivate crops (15%) during the drought period, (14%) bought food
supply as a response strategy, (14%) sold their livestock, (5%) watered their crops and a
similar number of planted drought evading crops. There are those who changed their sources
of income (4%) as an adaptation strategy venturing into other income generating activities,
(2%) of the respondents slaughtered their animals for food while (1%) used other response
strategies.

76
Table 6.1: Household drought adaptation strategies in Laikipia West sub-County (N=180) Number of respondents Percentage of respondents Sold livestock 24 14 Migrated with the animals 46 25 Search for employment 27 15 Withdraw from farming 27 15 Changed source of income 7 4 Slaughtered the animals 3 2 Bought food supply 26 14 Watered crops 9 5 Planted drought evading crops 9 5 Others 2 1 Total 180 100.0
Source: Field data (2016)
The results were cross tabulated with the socio-economic characteristics of the
household and the results presented. The results in Table 6.2 show that households who had
lived in Laikipia West sub-County for a long time were not ready to sell their belongings and
migrate to other places as opposed to those who had stayed for 5 years and below. Bee
keeping was not practiced by those who have lived in the area for 16-20 years, perhaps
because they had tried before and faced challenges. Planting of drought resistant seed is
highly preferred by those who had stayed in Laikipia West sub-County for 0-5 years. Perhaps
this is because they are still open to a variety of crops to plant as opposed to those who have
stayed longer and plant according to traditions and are very rigid, being used to their
traditional ways of doing things.
The respondents who migrate to town in search of employment are those who have
stayed in Laikipia West sub-County for 11-15 years. This could be because they have
observed the drought trend longer and can be able to predict short term and long term drought
periods and able to judge when looking for a short term employment is appropriate. This
could be contrary to those who have stayed for a shorter period and are likely to underrate an
otherwise severe drought. The respondents who gathered wild fruits and roots are those who
have stayed in Laikipia West sub-County for more than 30 years. This could because they
have the knowledge on the edible fruits and roots which sometimes lead to poisoning if eaten
by inexperienced people. Some plant roots are known to have medicinal value and have been
exploited during drought to delay hunger. The traditional medical knowledge is passed from
one generation to the other and therefore it is perfected with time, this could explain why
those who have stayed longer are likely to embrace wild fruit and roots.

77
Table 6.2: Cross tabulation of the duration household head had stayed in Laikipia West sub-County and adaptation strategies Years lived in the location (%)
0-5 years
6-10 years
11-15 years
16-20 years
21- 25 years
26-30 years
above 30 years
Migrated animals in search of pasture and water
7 25 27 18 8 1 14
Sold my animals 6 22 27 18 10 4 13 Did not farm 11 25 27 8 7 9 13 Planting of drought resistant seeds 14 31 20 6 14 2 13 Bought fodder for the animals 3 22 22 21 13 3 16 Migrated to town in search of employment
9 29 40 5 5 2 10
Waited for the relief food 4 22 38 17 6 4 9 Engaged in business 9 32 32 9 8 4 6 Gathered wild fruits and roots 10 16 22 16 10 5 21 Practiced charcoal burning 3 27 35 11 5 3 14
Source: Field data (2016)
Results in Table 6.3 show cross-tabulation of drought adaptation strategies and socio-
economic characteristics of the households. The results show that more men migrate with
their livestock than women, buy fodder and sell animals during drought. Gathering of wild
fruits is also common among men than women; perhaps because they are the ones herding in
the bush most of the time. Waiting for relief food, opting not to farm and engaging in
business are common response strategies among men and women. Selling of belongings and
migrating to another area is the least preferred response among men and women. Planting of
drought tolerant crops is not common among members of either gender.
The study found that despite being an arid and semi arid region that receives
insufficient precipitation and faced with regular drought, planting of drought tolerant seeds is
not a common practice in Laikipia West sub-County. The Households depend on maize as a
source of livelihood yet the ecological conditions of the region could favor growth of drought
tolerant crops and may perform better than maize. According to the World Bank (2013)
widespread availability of drought-tolerant seed varieties and short-maturing varieties for
cereals will help in ensuring crop production during drought years. Compared to longer
maturing varieties, these short-maturing varieties will have higher yields in a drought year,
but lower yields in a normal year and they might be able to resist diseases a little longer
during drought years.

78
Table 6.3 Cross tabulation of gender and drought adaptation strategies in Laikipia West sub-County (N=180) Gender (%)
Male Female Migrated with my animals in search of pasture and water 69 31 Sold my animals 66 24 Did not farm during that period 66 34 Planting of drought resistant seeds 67 33 Bought fodder for the animals 77 23 Migrated to town in search of employment 59 31 Waited for the relief food 63 37 Engaged in business 63 37 Gathered wild fruits and roots 73 27 Practiced charcoal burning 57 23 Engaged in beekeeping 58 42
Source: Field data (2016)
The results in Table 6.4 show that households who migrated with their animals and
embrace reduction of herd during drought were aged below 50 years. Households who were
ready to sell belongings and migrate to another area were those below 30 years while none of
those between 50 to 60 years were ready to migrate. It is not clear why young household
heads were more willing to sell their livestock and relocate elsewhere compared to the older
counter parts.
Table 6.4: Cross tabulation of age and drought adaptation strategies in Laikipia West
sub-County (N=180)
Age (%) Below 30
Years 30-40 Years
41-50 Years
51-60 Years
61 and above
Migrated with my animals in search of pasture and water
38 27 22 8 5
Sold my animals 35 25 25 8 7 Did not farm during that period 25 33 21 15 6 Planting of drought resistant seeds 27 33 16 16 8 Bought fodder for the animals 35 33 17 10 5 Migrated to town in search of employment 26 39 29 5 1 Waited for the relief food 26 36 23 9 6 Engaged in business 39 39 15 5 2 Practiced charcoal burning 34 29 26 9 2
Source: Field data (2016)
The results in Table 6.5 show that households on communal land migrated with their
animals unlike those who own or in leased land. This is because in communally owned land

79
there is less restriction on the grazing fields. The high numbers of households who sell their
animals are those on communal land perhaps due to competition for the available pasture
with animals from other households. The competition is evident by the fact that the high
number of those who buy fodder for their animals are those on communal land ownership.
The households who opt not to cultivate crops are those on leased land as opposed to
those who own land. These is perhaps due to the cost of leasing the land and the probability
of returns that make those on leased land to be more cautious. The household heads who
engage in business are those that are on leased land. This could be because when they decide
not to farm they look for an alternative source of income and engage in business to maximize
the returns and to get the money to pay the landlords.
Table 6.5: Cross tabulation of land ownership and drought adaptation strategies (N=180) Land ownership (%)
Owner Leased Communal
Migrated with my animals in search of pasture and water
45 10 45
Sold my animals 50 7 43 Did not farm during that period 63 21 16 Planting of drought resistant seeds 69 22 9 Bought fodder for the animals 46 8 46 Migrated to town in search of Employment 60 11 29 Waited for the relief food 53 12 35 Engaged in business 57 18 25 Gathered wild fruits and roots 67 13 20 Practiced charcoal burning 69 9 22
Source: Field data (2016)
Results in Table 6.6 show that pastoralist respond to drought by migrating with their
animal (62%), selling of the animals (58%) and buying of fodder (46%). This can be
explained by competition for pasture during drought which force pastoralist to migrate with
their animals or even reduce their herds. Adoption of the drought adaptation strategies was
least on the government employees. This is because the salary of the employees is constant
and does not fluctuate with drought and are therefore least affected. Most of the maize
farmers opt not to farm during drought. Maize is among the most vulnerable household
activities which require evenly distributed rainfall and this explains why households will opt
not to farm rather than planting crop and fail to germinate.
Households in Laikipia West sub-County have diversified their livelihoods with 35%
of the maize farmers and 38% of pastoralist engaging in bee keeping. Bee keeping provides

80
honey that supplements the pastoralists’ regular diet during drought. In Laikipia West sub-
County charcoal burning is another source of livelihood that provides income during drought
among both crop farmers and pastoralist. During drought pastoralist diversify their sources of
livelihoods “some of the major strategies used by pastoralists with regard to diversification of
incomes include: charcoal burning, hunting, food gathering, fishing, working in urban areas,
and migration to neighboring countries for labour’ (Ali, 1996).
Table 6.6: Cross tabulation of source of income and drought adaptation strategies (N=180) Source of Income (%) Government
Employment Business Person
Maize Farming
Dairy Farming
Pastoralism Wheat Farming
Other
Migrated with animals in search of pasture and water
1 8 21 7 62 1 0
sold my animals 0 8 24 8 58 1 1 Opt not to farm 3 11 45 4 24 0 13 Planting of drought resistant seeds
6 24 50 0 8 0 22
Bought fodder for the animals 2 11 22 14 46 2 3 Migrated to town in search of employment
3 17 27 5 42 0 6
Waited for the relief food 3 10 34 7 44 0 2 Engaged in business 3 30 29 6 31 0 1 Practiced charcoal burning 0 13 32 8 45 0 2 Engaged in beekeeping 4 15 35 4 38 0 7
Source: Field data (2016)
Results in Table 6.7 show that households with secondary education engage in
business during drought. Households with tertiary education are least involved in migration
with animals during drought while it is common for those with secondary education and
below. Crop diversification as an adaptation strategy is practiced by households with primary
education and above. Charcoal burning and bee keeping are common practices for
households with primary education and below. Migration of the family to another region is
the least preferred response strategy among households of all education categories. Perhaps
this is an indication of how households in Laikipia West sub-County are determined to look
for solutions from within rather than running away from the challenge.
Gathering of fruits and charcoal burning is the least preferred response strategy
among households with secondary education and above. The strategies are preferred by those
with primary and informal education perhaps because they strategies are less complex and

81
require low technological background to succeed in their application.
Table 6.7: Cross tabulation of level of education and drought adaptation strategies (N=180) Academic Qualification (%)
Informal Education
Primary Education
Secondary Education
Diploma Degree
Sold my animals 39 33 23 5 0 Migrated with my animals in search of pasture and water
36 33 27 4 0
Opt not to farm 32 34 23 8 3 Planting of drought resistant seeds 21 33 31 13 2 Bought fodder for the animals 32 27 34 7 0 migrated with my family to another area 22 11 56 11 0 Gathered wild fruits and roots 42 11 26 21 0 Practiced charcoal burning 36 36 19 9 0 Engaged in beekeeping 38 42 15 5 0 Waited for the relief food 37 31 25 7 0 Migrated to town in search of employment 24 42 25 9 0 Engaged in business 22 28 41 9 0
Source: Field data (2016)
Results in Table 6.8 show that, household heads who gather wild fruits, engage in
charcoal burning and beekeeping have no agriculture training. The households who gather
wild fruits could still be stuck in the traditional ways of doing things. Agricultural training is
expected to broaden individuals’ ways of doing things. The aspect of modernity and diet
diversification cannot be ignored in this modern world. Though the traditional ways of doing
things is still relevant and applicable in the modern world, it should not be the only way but
should complement the modern ways. Agriculture training is conducted using both theoretical
and practical approaches. Agriculture training widens the individuals’ drought adaptation
strategies and could present various opportunities that can still be applied within a given area
before searching for employment opportunities elsewhere when local solutions fail.
According to one of the informant, households land is used for in-farm and out farm trials,
demo plots in their farms. Conservation Agriculture is emphasized during such training.
Conservation agriculture applies all technologies to utilize the available soil moisture to grow
crops.
Bee keeping could be a response strategy embraced by those with no agricultural
training because it is less involving. The medicinal value of honey and its use in delaying
hunger could have made it a response strategy by those with no agriculture training.
Migration to town in search of employment opportunity was the least preferred by those with

82
agriculture training.
Table 6.8: Cross tabulation of agriculture training and drought adaptation strategies (N=180) Training on farming courses (%)
Yes No Migrated with my animals in search of pasture and water 34 66 Sold my animals 45 55 Did not farm during that period 40 60 Planting of drought resistant seeds 47 53 Bought fodder for the animals 40 60 Migrated to town in search of employment 10 90 Waited for the relief food 33 67 Engaged in business 51 49 Gathered wild fruits and roots 7 93 Practiced charcoal burning 24 76 Engaged in beekeeping 10 90
Source: Field data (2016) 6.3 Use of Drought Adaptation Strategies in Laikipia West sub-County
The identified adaptation strategies in section 6.2 were ranked using Kendall rank test
to established the most preferred household drought adaptation strategies in Laikipia West
sub-County. The results in Table 6.9 show that engaging in business (5.93) was the most
preferred adaptation strategy among crop farmers and pastoralist. Seasonal migration with the
animals was the most preferred strategy among the pastoralist. Opting not to farm was the
most preferred drought adaptation strategies among the crop farmers. The least preferred
adaptation strategies are gathering wild fruits and selling belonging and migrating with
family to other place. According to FAO (2008) adaptation is critical in protecting livelihoods
and food security in many developing countries. The study supports the earlier argument that
there are numerous drought adaptation options available for dry land farming, most of which
focus on water conservation (Muthamilselvan et al. 2006).
Though seasonal migration with the animals is most preferred drought adaptation
strategy among the pastoralist it is unsustainable in an area known to have deep rooted
conflict over land. According to Mwangi (2012) the main causes of ethnic conflicts in
Laikipia West include land, poverty, militia gangs, gun culture, political incitement, racism
and ethnic animosity. Seasonal migration with the animals causes conflicts with ranchers,
farmers, horticulturalists and conservation area wardens, and government authorities
(www.pragya.org). Pressures on water and land resources in Laikipia West sub-County have
increased greatly in recent years due to increased farming activities, rapid population growth,

83
and periodic drought. Conflicts involving pastoralists associated with resource competition,
cattle rustling, and wide availability of small arms are widespread and of increasing concern
(Mkutu, 2001). The situation in Laikipia West sub-County is made worse due to the fact that
most of her neighbors from Isiolo, Baringo, Marsabit, Moyale, Samburu and Turkana
communities are moving in large numbers into agricultural areas of Laikipia in search of
water and pasture (www.pragya.org). On drought adaptation strategies adopted by the
pastoralist a livestock officer observed that:
Scarcity and insecure access to water and pasture land has led to constant friction with
ranchers and other users, which has led in turn to violent conflicts (www.pragya.org).
Competition over scarce grazing fields, water resources and pasture has escalated inter-ethnic
animosity, often resulting in armed conflicts, which are predatory in nature and much more
destructive. According to the informant conflicts between farmers and herders have mostly
taken place in areas where local communities have failed to improve natural resource
management, and where local conflict resolution mechanisms failed. This finding supports
the earlier study by the World Bank (2013) in Niger that successful intermediation by heads
of associations or traditional leaders and significant improvements in resource base
appreciably reduced conflicts between farming and herding communities.
Opting not to farm being the most preferred adaptation strategy among crop farmers is
also unsustainable and shows some gap in the dissemination of information by extension
officers. This is because sustainable drought adaptation strategies such as planting of drought
resistant seeds which is least preferred strategy could be a long lasting solution to drought
situations in Laikipia. The agriculture extension officers could fill the gap by educated
households on the different variety of crops that could withstand or evade drought.
Though waiting for relief food is an adaptation strategy adopted by some respondents
‘Pastoralists hire grazing land from ranchers or government holding grounds, occupying ranches and holding grounds illegally, graze and occupy abandoned sub-divided ranches illegally, encroachment and illegal grazing in private lands resulting in destruction of crops, migrating with their animals to other counties such as Nyandarua in search for pastures. Some of this strategies results to conflict especially when they graze in private land illegally. The office of the chief with the help of the elders is the key mediator during such conflicts.’

84
where they wait for the support of the well wishers, key informants revealed that the national
government no longer send relief food to Laikipia West sub-County unless during very
extreme events where multi-governmental agencies are requires to help. One of the
informants observed that:
The results of the key informant interviews found that extension officers disseminate
drought adaptation strategies to farmers in Laikipia West sub-County and they include:
Training livestock farmers and pastoralists on the need to look for alternative livelihoods
when drought has been predicted. The current study shows that various adaptation strategies
have been adopted by households in Laikipia West sub-County. The findings supports the
earlier studies that irrigation, improved crop varieties, crop diversification, farm diver-
sification, change of planting dates and income generating activities are among the adaptation
practices most frequently deployed by farmers in Bangladesh (Maddison, 2006; Uddin et al.,
2014).
Table 6.9 Ranked Frequency of the use of drought adaptation strategies (N=180)
Drought Adaptation Mean Rank Migrate with my animals in search of pasture and water 6.04 Sold my animals 6.26 Opt not to farm during drought period 6.26 Practiced crop diversification 6.67 Planting of drought resistant seeds 7.16 Sold my belongings and migrated with my family to another area 8.65 Buy fodder for the animals 6.43 Migrate to town in search of employment 6.91 Wait for the relief food 6.42 Engage in business 5.93 Gather wild fruits and roots 8.41 Practice charcoal burning 7.84 Engaged in beekeeping 8.04
Source: Field data (2016)
Distribution of relief food is based on village on how people know each other using vehicles from partner agencies. There are famine committees in every sub-location in Laikipia West sub-County. The committee identifies the hardest hit village and the most vulnerable people.

85
6.4 Role of Institutional in Managing Local level Drought Adaptation Strategies in
Laikipia West sub-County
Community drought adaptations strategies are deliberate actions taken by institutions
involved in spearheading community adaptation. These institutions include non- Government
organizations, elders, church organizations and government of Kenya agencies. Local
institutions shape impacts of climatic shocks on communities (Mubaya & Mafongoya, 2017).
The success of these adaptation efforts generally hinges upon the nature of existing formal
and informal rural institutions. Institutions encompass on one hand tangible governance and
organizational structures (formal) and on the other hand uncodified ‘rules of the game’,
cultural norms and tradition (informal or institutional arrangements) which shape behavior
and the nature of human interaction (Jones et al., 2010).
These institutional and political contexts are also considered to influence the adaptive
capacity of a community (Smit & Wandel, 2006). Agrawala (2010) suggests four ways in
which external intervention can contribute to climate change adaptation; provision of weather
and climate information, technological interventions that help increase productivity (and
which are not necessarily targeted towards climatic change but livelihood challenges in
general), financial support to assist with implementation of these technologies and leadership
efforts that promote collective action for adaptation.
The information on community drought adaptation strategies was collected from
selected households through questionnaires and complemented by key informant interviews.
In the questionnaire there were questions that targeted community drought adaptation
strategies. The information was also obtained from the selected key informants through
interviews. The result in Table 6.10 shows that there are community drought adaptation
measures in place. The results show that 29.8% of households are advised to sell their
livestock to reduce the herd. According to Huho and Kosonei (2013), large livestock herds
among pastoralist act as insurance against loss of the entire herd to droughts. There is a
livestock market at Rumuruti Township on Monday and Thursday every week which offers a
platform for the members of the community to sell part of the livestock especially when
drought has been predicted as captured on one of the market days (Plate 6.1). Reducing the
herd among pastoralist reduces losses during drought.
Other drought adaptation measures in place at the community level are, stock pile
cereals and grains (27.4%), and change of cropping patterns when drought is predicted (12.9

86
%). The changing of crop patterns enables the community to diversify their sources of
income thus cautioning them from drought. The results support the earlier finding by Hussain
and Hanjra (2004) that crop diversification, intensification and shifts from subsistence to
commercial crops were likely to help poorer households by reducing food prices. It further
supports the argument by Spielman and Pandy-Lorch (2009) that advancements in modern
agricultural practices have increased the world’s agricultural output to feed more than five
billion people, with global cereal production doubling in the last 50 years.
Table 6.10 Community Drought Adaptation Strategies in Laikipia West sub-County (N=180) Drought adaptation strategies Number of respondents (%)
Stock piling of cereals and grains for emergency aid 27.4 Rehabilitation of critical boreholes 4.8 Sale of livestock 29.8 Drilling of new boreholes 8.9 Planting trees and reforestation 4.0 Diversification of income 12.9
Recruited volunteer to offer assistance during drought 0.8 Community emergency fund 3.2 Started community-based training initiatives 7.3 Promotion of networking within the community 0.8 Total 100.0
Source: Field data (2016)
Plate 6.1: Livestock Market day at Rumuruti Township
Source: Author (2016)
Other drought adaptation measures are community emergency fund (3.2%),
recruitment of volunteers (0.8%), and promotion of networking within the community

87
(0.8%). Volunteers are important because they help in identification of most vulnerable
members and assist the sick and those who are weak to reach the hospital. Networking among
community members is an important means through which information on early warning can
reach a wider audience within a short time. According to World Bank (2013) early warning
about the impending weather season coupled with ready availability of drought-tolerant
varieties could help mitigate the risk of crop failure.
The results reveal that there is drilling of new boreholes by the members of the
communities (8.9%) while existing boreholes are rehabilitated (4.8%). According to a
WRMA official, new boreholes were drilled in 2014. Water from these boreholes and
existing rivers is used for domestic consumption and irrigation during the dry periods as
shown in plates 6.2 and 6.3. The leading horticulture crops grown under irrigation in this
region are tomatoes and onions. On water harvesting a key informant stated the following:
The finding supports the earlier work of Udmale et al. (2014) in Maharashtra State of
India that the use of available water during drought is very important. Farmers along rivers
Ewaso Ng’iro irrigate their crop during drought. Irrigation water is particularly important in
agricultural areas where rainfall is irregular, scant and insufficient, in order to supplement
water from rainfall and to avoid crop failures. It is argued that adequate, timely and equitable
water distribution is absolutely critical for enhancing agricultural productivity and improving
food security, which underpins the livelihoods of many local farmers (Hussain & Hanjra,
(2004); Lipton, Litchfield, Blackman, De Zoysa, Qureshy and Waddington (2002); Hussain,
Sakthivadivel and Bhattarai, 2002). It further supports the argument by Tilman, Cassman,
Matson, Naylor, and Polasky (2002) that increase in crop yields have come mainly from
greater inputs of fertilizers, pesticides, new crop strains and irrigation.
Other strategies are community based training initiatives (7.3%). On community
based initiatives one informant stated the following:
‘The most popular methods of rain water harvesting for drought adaptations in Laikipia West sub-County are: earth dams, water pans, farm ponds and water tanks.’

88
Other community adaptation measures aimed at conservation of the environment are:
planting of trees and reforestation (5%) done formally and informally as shown on the plates
6.4, 6.5, 6.6, and 6.7 captured in drawn graphics on buildings at shopping centers’ sponsored
by United State Agency for International Development and Action Plan. The drawings are a
public platform to create awareness on the need for environmental conservation. The message
is written in Kiswahili language which is widely spoken in most rural areas in Kenya to reach
a wider audience. The use of graphics as captured on plate 6.5 and 6.7 has deeper message
creating awareness that, ‘uharibifu wa mazingira waleta: Kiangazi, umasikini na
mmomonyoko wa udongo’ (destruction of the environment results into drought, poverty and
soil erosion). Community based training initiatives on drought preparedness (7.3%) aimed at
creating awareness among members on dangers associated with the destruction of the
environment and some of the conservation efforts that they can practice to conserve the soil.
In plate 6.6 the community is encouraged to participate in training on green energy
technology that reduces emissions: ‘Training for better life; solar panel, biogas and
community tree planting.
‘The National Drought Management Authority has contingency fund which is activated as need arises through the project procedures. There are community drought initiatives such as; weekly weather updates and advisories by Agriculture Sector Development Support Programme (ASDSP) in collaboration with Laikipia County Meteorological department.’

89
Plate 6.2 Irrigation using water from River Ewaso Ngi’ro (Source: Author, 2016)
Plate 6.3 Animal and human being shares a water point (Source: Author, 2016)
Plate 6.4 Indiscriminate destruction of forest and charcoal burning
Plate 6.5 Destruction of the environment through illegal logging and firewood
Plate 6.6 Training on the importance and use of green technology
Plate 6.7 Destruction of the environment and the warning of the consequences
Source: Plate 6.4 to 6.7 is graphics captured on buildings by the author a project supported by
USAID (feed the future programme) and Action Plan

90
According to FAO (2008) adaptation is critical in protecting livelihoods and food
security in many developing countries. The study findings supports the earlier argument that
there are numerous drought adaptation options available for dry land farming, most of which
focus on water and soil health conservation (Muthamilselvan, Manian & Kathirvel, 2006). On
drought adaptation options a key informant observed that:
This was evident through the observed quarrying activities as captured on plate 6.8.
Plate 6.8: Quarrying activities in Laikipia West sub-County Source: Author (2016)
‘Agriculture extension officers disseminate drought adaptation strategies to farmers through formal and informal trainings. Some of the highlights during such training are the need to look for alternative livelihoods when drought has been predicted.’

91
On drought adaptation strategies an informant stated the following:
In the earlier studies in Kenya, Tanzania, Algeria, and Morocco pastoralists preserved
the raised grounds or the hilly areas and the forested areas as dry season grazing areas. This
allowed natural regeneration of pasture during wet years and during mild droughts.
Pastoralists are forbidden from grazing in these areas for a period of time. This is a common
strategy among pastoralists in other parts of Kenya and world in general such as the Sukuma
of Tanzania, the Tuareg of Ahaggar in Algeria, the Il Chamus, Turkana and Rendile of
northern Kenya, the Tilemsi of Mali and the Berbers of Morocco (Niamir, 1999). On drought
adaptation strategies Agriculture extension officer observed that:
‘We advise pastoralist on the need for emergency livestock off take before the onset of drought and banking the money to be used in restocking. We also teach them on the need for optimum carrying capacity, methods of fodder and pasture conservation methods, livestock management and husbandry practices such as timely breeding, housing; disease control and proper feeding of their animals. We emphasis to the livestock keepers on grazing management strategies which are aimed at conservation of pasture such as deferred grazing, rotational grazing, tethering and continuous grazing.’
‘We encourage crop farmers to plant early maturing varieties, timely operations and planting of drought tolerant and drought resistant crops such as; sorghum, dolichos, cow peas, lima beans, and. We also offer continuous extension service and conservation agriculture (C.A). Conservation Agriculture applies all technologies to utilize the moisture available in the soil to raise crops. Farmers are also encouraged to use green house and work with other stallholders’ such as Kenya Agriculture and Livestock Research Organization (KALRO) and seed companies.

92
On drought adaptation strategies the sub-County livestock officer observed that:
On community drought adaptation strategies an extension officer observed that:
The Kenya Meteorological Services (KMS) issues seasonal and annual climate
information which is important to the households in Laikipia West sub-County. However
KMS use various agencies to disseminate climate information to the households. In designing
awareness material for the dissemination of climate information, the study sought to know the
most preferred agency by the households for dissemination of climate information. The
information on the agency preferred by the household heads to disseminate drought
information could increase the audience and have a greater impact on the decisions made
based on the disseminated information. Results in Figure 6.1 shows that 44% of the
household prefer to receive drought information from the government agencies. Household
response to relayed information depends on the trust that households have on the agency
relying the particular information and the reliability and accuracy of the past relayed
information.
‘We encourage farmers to practice Livestock water harvesting and adoption of conservation measures such as; camel keeping because they are environmental friendly and a good alternative to cattle, keeping sheep and goats since they can survive well in regions with deficiency of precipitation. As at the end of 2014 we had dug 22 water pans across the sub-County. We also encourage bee keeping for honey production since bees are also environmental friendly and do not compete with other livestock. From our records the following categories of bee hives were in place by the end of 2014; Log bee hives (8900), Kenya top bar hives (1250) and Langstroth (215). Other practices that we sensitize livestock keepers are the use of alternative or nonconventional feeds e.g. farm residues and farm by products. In addition, we advise farmers to sell their livestock to the Kenya Meat Commission to reduce herd before the onset of drought. We encourage Institutions and the nongovernmental organizations to purchase livestock for slaughter during drought and distribute the meat as relief food to schools.’
‘The common community drought adaptation strategies are: water harvesting for livelihoods such as crops, livestock and tree nurseries, water saving small scale irrigation techniques such as drip and bucket irrigation, diversification of enterprises and value chains, production of drought tolerant crop varieties and farm feed conservation, Conservation agriculture through minimum tillage, use of herbicides and cover crops, greenhouse farming, agro forestry and beekeeping.’

93
Figure 6.1: Agency preferred by households to provide drought information Source: Field data (2016) The study also sought opinions of an elder on the preferred agency of dissemination
of drought information who observed that:
However the elder’s views ignited the debate on traditional verses scientific
knowledge and to what extent should the two complement each other. The views expressed
by the informant were clear testimony of the challenges faced by practioners in disseminating
drought information. This perhaps requires a clear understanding on the challenges facing
dissemination of drought informants in the face of religious and traditional believes among
different segments of the society. Another elder stated that:
The views expressed by the elder could be an entry point for the agencies responsible
for the dissemination of drought information. As a representative of the community the
elders’ views are respected and therefore drought dissemination strategies could be tailor
‘The information can only come from God since lack of rainfall is as a result of people’s sin.’
‘There was a time we used to predict drought but today things have changed. There was a man from South Horr who was able to predict drought through observation of stars. The people said that the star wanted to eat their intestines meaning starvation due to lack of food. Unfortunately the person was killed by those people who thought he was responsible for the outcomes of the drought predictions and causes their animals to die. Since his death we have not been receiving predictions and hope one of his children will have the same wisdom when they grow up.’

94
made to fit into the current situations. The elders could be approached and informed that the
‘child’ has been born in the name of technology enabling the Kenya Meteorological Services
to issue seasonal climate forecast.
To understand the frequency of dissemination of drought information, household
heads were asked to state the number of times they preferred the information to be
disseminated to them. The frequency of dissemination of drought information could inform
the effective use of adaptation strategies. Results in Figure 6.2 shows that 48% of the
respondents prefer to receive information on drought once in every year, 30% monthly bases
and 22% every three months. Timely relay of drought predictions information is the initial
step in drought preparedness strategies. The variation in the time households require drought
predictions could be a reflection of the different livelihood activities in Laikipia West sub-
County. There are those who require regular updates while other will require the information
after some time. From literature the probability of adaptation rises with increased access to
information. This implies that farmers with access to timely weather information and other
extension services are more likely to adapt to climatic change. Similar findings have been re-
ported in Nepal and Southern Africa (Tiwari et al., 2014; Nhemachena and Hassan, 2007).
Figure 6.2: Percentages of dissemination of drought information. Source: Field data (2016)
6.5 Drought Adaptation Determinants in Laikipia West sub-County
In order to assess the factors that support or constrain drought adaptation in Laikipia
West sub-County, chi-square analysis of independence was performed. Factors can have
opposite effects on the probability of adoption across different adaptations (Van Dijl, Grogan

95
& Borisova, 2015). The independent variables were the drought adaptation strategies while
the dependent variables were the socio-economic characteristics of the households. A clear
understanding of the factors that influence farmers’ adaptation decisions is essential to the
designing of appropriate policies to promote effective adaptation in the agricultural sector
(Mabe et al., 2014).
The results in Table 6.11 show that migration with animals in search of pasture and
water is statistically dependent on source of income (p=0.000) and land ownership (p=0.000).
It can be observed that buying of fodder for livestock is statistically significant on the source
of income (p=0.000) and land ownership (p=0.001). Withdrawal from farming is statistically
dependent on landownership (p=0.007). Practicing crop diversification is statistically
dependent on source of income (p=0.000), land ownership (p=0.038) and training on
agriculture (p=0.005).
Planting of drought resistant seeds is statistically dependent on source of income
(p=0.000), land ownership (p=0.001) and training on agriculture (p=0.032). Migration to
town in search of employment is dependent on age (p=0.026), time they had lived in the area
(p=0.016) and agriculture training (p=0.010). Those who are expected to migrate to town are
those between 31-40 year and those below 30 year while respondents above 60 years could
be limited not only due to the labour laws in Kenya but also their health status. Seasonal
migration to town in search of employment could be an adaptation strategy disseminated
through agriculture training and interaction among households and their application of the
strategy could vary based on whether residents have attended trainings or no.
Waiting for relief food (p=0.035) was statistically dependent on the period responded
had lived in the area. Those who have lived in Laikipia West sub-County for a while have
mastery of the drought patterns and are able to assess some indicators and predict the
magnitude of drought for them to make a decision to look for employment as compared to
those who have not stayed there for long and have not been able to study the drought patterns.
Those who have lived in the sub-County for long are likely to migrate during the initial stage
of drought based on predictions than those who have not stayed long and could ignore the
predicted drought only to realize it was severe when it is too late. For the people who have
not stayed in Laikipia West sub-County long they are likely to wait for relief food as the only
option while those who have stayed long and could be aware that the government has not
distributed food for a while are likely to seek other adaptation strategies rather than waiting

96
for food.
Engaging in business is dependent on the age (p=0.034) of the household head and
level of education (p=0.013). Educated households are likely to access information on
drought more than the uneducated household and this will inform them on the some of the
business opportunities and stock their businesses. This supports the previous studies by
Igodan et al. (1990) that there is a positive relationship between educational level of the
household head and adoption of improved technologies. This implies that, farmers with
higher levels of education are more likely to use improved technologies in order to adapt to
climate change. This is particularly so because educated farmers are more knowledgeable due
to their ability to access information pertaining to climate change and adaptation options
(Ndamani and Watanabe, 2016). Access to credit facilities depends on individual age those
below 18 years don’t have access to credit facility. Also those who have advanced in age may
qualify but with a short repayment period and therefore it would be difficult for them to
access credit. The level of education though may not be a requirement by any law to start a
business it could inform entrepreneurs on the better marketing strategies and the demand
supply effect. Gathering wild fruits is dependent on agriculture training (p=0.011).
Selling of belongings and migrating to other regions is dependent on source of income
(p=0.001) and agriculture training (p=0.000). Decision by the households to sell their
belonging and migrating to new areas could be inspired by education and training where the
residents realize that there are other places with favourable weather patterns than. The study
supports the earlier work of Hudson (2002) that drought adaptation strategies vary, depending
upon factors such as culturally determined goals, the amount of resources available, and the
type of resources available to farmers. These resources may be natural or social, as well as
economic.

97
Table 6.11 Drought adaptation determinants in Laikipia West sub-County Adaptation Strategies Social Economic Characteristic (Asymp. Sig. (2-sided))
Gender Age Education Time Lived
Source of Income
Land ownership
Training on Agriculture
Migrated with my animals in search of pasture and water
.071
.314 .103 .166 .000 .000 .156
Sold my animals .445 .287 .100 .554 .000 .001 .545 Opt not to farm during drought .388 .276 .375 .354 .021 .007 .471 Practiced crop diversification .223 .887 .292 .400 .000 .038 .005 Planting of drought resistant seeds .438 .596 .212 .200 .000 .001 .032 Bought fodder for the animals .002 .892 .647 .108 .002 .003 .292 Migrated to town in search of employment
.459
.026 .302 .016 .634 .983 .010
Waited for the relief food .968 .420 .730 .035 .196 .404 .271 Engaged in business .931 .034 .013 .079 .003 .053 .309 Gathered wild fruits and roots .257 .935 .234 .954 .837 .074 .011 Practiced charcoal burning .278 .816 .801 .812 .856 .064 .094 Engaged in beekeeping .268 .158 .674 .260 .981 .026 .133
Source: Field data (2016)

98
CHAPTER SEVEN
7.0 SUMMARY OF FINDINGS, CONCLUSIONS AND RECOMMENDA TIONS
7.1 Introduction
This chapter presents a summary of research findings as per the study objectives,
conclusions from the findings and recommendations drawn from the study findings. The
chapter also presents suggestions for further research.
7.2 Summary of Findings
The summary of findings has been discussed as per the study objectives. 7.2.1 Temporal Drought Trends in Laikipia West Sub-County
The seasonal drought characteristics results show that 1993 and 2000 were the driest
years during the MAM at both Rumuruti and Ndaragwa. 1985, 1987, 1996 and 2010 were the
driest years at both Rumuruti and Ndaragwa during OND seasons. The seasonal drought
events show that for the period under study Laikipia sub-County has not experience drought
during the MAM and OND seasons in the same year. This shows that the household of
Laikipia West sub-County are able to recover during the following season after a drought
season. Households in Laikipia West sub-County can be cautioned from the effects of
drought through planting of drought resistant crops such as sorghum and green grams.
The years that received below normal rainfall (-0.99 to 0.99) were: 1984, 1985, 1987,
1991, 1995, 1999, 2000, 2005, 2008, 2009 and 2014. The years that experienced moderate
drought (-1.0 to -1.49) are: 1995 and 2008. The years that experienced severe drought (-1.5 to
-1.99) were: 1985, 1987, 1991, 2005, and 2009 while years that experience extreme drought
(-2 and less) were: 1984, 1999 and 2000. The very wet years (1.5 to 1.99) were: 1998 and
2010 while extreme wet (2.0 and above) years were: 1997 and 2011.The study established
that the average drought cycle in the study area is 3 years. According to SPI results the recent
severe drought experienced in Laikipia West sub-County was in 2009.
7.2.2 Effects of Drought Events on Household Livelihoods in Laikipia West sub-County
The results of the household survey shows that 26% of the households observed that
drought impacted over 75% of their crops, 24% of the households observed that the drought
impacted less than 75% of their crops, 24% of the households observed that 2009 drought
impacted less than 50% of their crops. Nineteen percent (19%) of the households observed
99
that the drought impacted less than 25% of their crops. The findings also show that 78% of
the households lost few livestock, 11% lost many livestock while 8% did not experience
livestock loss.
7.2.3 Household Perceptions to Drought Disasters
On drought perception out of 180 respondents 53% of the households felt that the
2009 drought was moderate, 47% was severe. Drought perception was significantly related to
source of income, land ownership and number of years a respondent has been farming.
Perception to drought among different households leads to variations in drought adaptation
strategies adopted by different households. The strategies adopted by individual households
greatly depend on how they perceive drought. The pastoralists are likely to perceive drought
as severe compared to those employed by the government. This could be explained by the
fact that salary from government employment does not fluctuate with seasons while milk
production and meat does.
7.2.4 Drought Adaptation Strategies and Drought Adaptation Determinants.
Household drought adaptation strategies in Laikipia West sub-County are: seasonal
migration with animals (25%), search for employment (15%), off-farm practices (15%) and
reducing the heard (14%). Drought adaptation strategies advocated by key informants
include; training livestock farmers and pastoralists on the need to look for alternative
livelihoods when drought has been predicted; emergency livestock off take before the onset
of drought and banking the money to be used in restocking during favourable conditions;
pastoralists are also taught the need for optimum carrying capacity, stocking rate and
destocking; households are taught various methods of fodder and pasture conservation
methods to ensure availability of pasture throughout the year; they are also taught livestock
management and husbandry practices such as timely breeding, housing; disease control and
proper feeding of their animals. Other strategies advocated for are; grazing management
strategies which are aimed at conservation of pasture such as deferred grazing, rotational
grazing, tethering and continuous grazing.
Community drought adaptation strategies are; 30% sale of livestock to reduce the
herd, 27% stock pile cereals and grains and 13% change of cropping patterns when drought is
predicted. According the key informant, the common community response strategies are:
Livestock keepers migrate with animals to other areas, sell their small stock such as sheep

100
and goats and also cull the old animals, crop farmers reduce the acreage under crops, crop
farmers stop selling their grain and retain stocks for household needs, seek off- farm sources
of income such as charcoal burning, casual labor.
Drought adaptations determinants are source of income, land ownership, training on
agriculture, age, time households had lived in the area and level of education. These
determinants support or constraint the adoption of adaptation strategies to drought in Laikipia
West sub-County.
7.2.5 Role of Institutions in Managing Local Level Drought Adaptations in Laikipia
West sub-County
Both formal and informal institutions play a key role in managing local level drought
adaptation. These institutions plays the following roles; encouraging crop farmers to plant
early maturing varieties, timely operations and planting of drought tolerant and drought
resistant crops, disseminate drought adaptation strategies to farmers, pastoralist are advised
on the need for emergency livestock off takes. Elders and religious organizations provide
relief food to the starving households and also participate in the alternative dispute resolution.

101
7.3 Conclusions
There has been an increase in drought years in Laikipia West sub-County from 1984
to 2014. The drought cycle has reduced from 5 years to 3 years. Drought years have been
identified and the latest severe drought in Laikipia West sub-County was in 2009. Maize
farming remains a major source of livelihood to many households. Most of the crop farmers
in Laikipia West sub-County are immigrants who carry their tradition ways of crop
production to Laikipia without taking into considerations the climatic conditions of the area.
The traditional ways of life among the immigrants make them more vulnerable to drought.
The 2009 negatively affected household sources of income in Laikipia West sub-County. The
drought led to decreased maize yield and death of livestock. The drought also led to increased
distance to the water sources and increased cases of malnutrition. Different households in
Laikipia West sub-County perceive drought differently. Perception on severity of drought
was influenced by source of income, land ownership and number of years a responded has
been farming. There are various drought adaptation strategies adopted by households to
counter the effects of drought. Engaging in business is the most preferred drought adaptation
strategy among the pastoralist and maize farmers while planting of drought resistant crops is
the least preferred. Formal institutions are more prevalent on drought adaptation compared to
informal institutions. The formal institutions plays the following roles in managing local level
drought adaptations: encouraging crop farmers to plant early maturing varieties, timely
operations and planting of drought tolerant and drought resistant crops, disseminate drought
adaptation strategies to households and advise pastoralist on the need for emergency livestock
off takes

102
7.4 Recommendations
The study recommends the following:
a) The high percentage of drought years in the study area is an indication that maize production is not a viable option in the area. Drought resistant crops and early maturing crop varieties should substitute maize to increase crop production
b) The high number of crops and animals affected by 2009 drought show the need for pooling of risks. The study recommends creation of awareness on the need to insure crops and livestock against drought risks.
c) The study recommends creation of awareness on the crop ecological requirements in Laikipia west sub-County to encourage growth of drought resistant crops such as sorghum, green grams and dolichos as an adaptation strategy to drought events.
d) Engaging in business is the most preferred adaptation strategy among pastoralist and maize farmers. The study recommends empowerment of households through youth and women fund, Uwezo Fund and other financial opportunities to start small and medium enterprises which will create more job opportunities in the area.
e) Both formal and informal institutions in Laikipia West sub-County should be engaged and their operations streamlined to establish a central command in mobilization of humanitarian assistant and any other support during drought.

103
7.5 Suggestions for Further Research
The following recommended areas of study would help enrich the understanding of the
drought discourse.
a) Research is required on the role of indigenous knowledge in drought response,
preparedness and adaptation strategies in Laikipia West sub-County. Majority of the
respondents have informal education hence its role cannot be underscored.
b) Research is required on the soil conservation and management strategies in Laikipia
West sub-County as an adaptation strategy to drought. Such a study can benefit from
earlier studies by Bandyopadhyay (2009) and Debnath (2012) that use of organic
manure in farms (for example, composting and recovery of farm yard manure and
food waste, use of green mulching, etc.) can favorably modify the physical properties
of soil such as bulk density, porosity, soil moisture, temperature, water retention
properties and water transmission properties and soil processes like evaporation,
infiltration, runoff and soil loss for better crop growth and yield. The study can also
benefit from the study by Parmeshwar (2014) that in order to improve the soil
moisture holding capacity, promotion of soil water conservation and use of organic
manures should be promoted to combat drought.
c) A study is recommended to find out why young household heads were more willing to
sell their livestock and relocate elsewhere as compared to the older households as a
way of adapting to drought.

104
REFERENCES
Abad, M.B.J., Zade, A.H., Rohina, A., Delbalkish, H. & Mohagher, S.S. (2013). The effect
of climate change on flow regime in Basher river using two meteorological and
hydrological standards. International Journal of Agriculture and Crop Sciences 5:
2852-2857.
Abul, H., Amir, F., & Promkhambut, A. (2013). Farmers’ perception of drought and its
impact on community in rural North East Thailand.
Adger, W. N. (2001). Scales of governance and environmental justice for adaptation and
mitigation of climate change. Journal of International Development, 13, 921-931.
http://dx.doi.org/10.1002/jid.833
Adger, W. N., Kelly, P. M., Winkels, A., Huy, L. Q., & Locke, C. (2002). Migration,
remittances, livelihood and trajectories and social resilience in Vietnam. Ambio, 31,
358-366.http://dx.doi.org/10.1579/0044-7447-31.4.358
Aerts, J. C., Botzen, W. J., Bowman, M. J., Ward, P. & Dircke, P. (2011). Climate
adaptation and flood risk in coastalcities. Earthscan, London, UK.
Agrawala, A. (2010). Local institutions and adaptation to climate change. In: Mearns, R.,
Norton, N. (Eds.), Social Dimensions of Climate Change: Equity and Vulnerability in
a Warming World. New Frontiers of Social Policy. The World Bank, Washington
D.C.
Agrawala, S., Barlow, M., Cullen, H., Lyon, B. (2001). Drought and humanitarian crisis in
Central and Southwest Asia: a climate perspective, IRI special report N. 01-11.
International Research Institute for Climate Prediction, Palisades, p 24
Ahmed, A. G. M. (2001). Livelihood and resource competition, Sudan. In African
pastoralism: Conflict, institutions and government, edited by M.A. Salih, M.T.
Dietz, and A. G. M. Ahmed. Pluto Press
Ahmed, A. G. M., & H. Abdel Ati, (1996). Managing scarcity: Human adaptation in
EastAfrican Drylands. Addis Ababa
Aklilu, A. and Alebachew, A. (2009). Assessment of Climate Change-induced Hazards,
Impacts and Responses in the Southern Lowlands of Ethiopia. FSS Research. Report
No.4. Addis Ababa
Annandale, J. G., Jovanovic, N. Z., Mpandeli, N. S., Lobit, P., & du Sautoy, N. (2002). Two
Dimensional Energy Interception and Water Balance Model for Hedgerow Tree

105
Crops. Paper presented at Southern African Society of Horticultural Sciences
congress at Cedara, Kwazulu Natal, 15-17 January 2002.
Ali Said. 1996. Survival strategies in the Ethiopian drylands: the case of the Afar pastoralists
of the Awash Valley in managing security. In Managing Scarcity: Human Adaptation
in East African Drylands, edited by Abdel Ghaffar M. Ahmed and Hassan A. Abdel
Ati. Addis Ababa.
Allen, R. (1996). El Niño Southern Oscillation & Climatic Variability. Collingwood, VIC,
Australia: CSIRO Press.
Alcamo J., Dronin N., Endejan M., Golubev G., and Kirilenkoc A. (2007). A new
assessment of climate change impacts on food production shortfalls and water
availability in Russia. Global Environ. Change—Hum. Policy dimension. 17, 429–
444.
Al-Qinna, M., Hammouri, N., Obeidat, M., & Ahmad, F. (2010). Drought analysis in Jordan
under current and future climates. Springer science journal 106:421–440
Anderson S.,&Mowjee, T.(2008). Climate change for Agrarian Societies in dry lands
Implications and Future path ways' presentation for the World Bank Social
development division Conference on the human Dimensions of Climate change.
March 2008
Archie, K. M., L. Dilling, J. B. Milford, & F. C. Pampel. (2012). Climate change and
western public lands: a survey of US federal land managers on the status of adaptation
efforts. Ecology and Society 17(4): 20.
Audsley, E., Pearn K. R., Simota C., Cojocaru G., Koutsidou E., Rounsevell M. D. A., Trnka
M., &Alexandrov V.(2006). What can scenario modelling tell us about future
European scale agricultural land-use and what not? Environ. Sci. Policy 9, 148–162
Bandura, A. (1962) ‘Social Learning through imitation’. In Marshall R. Jone, ed. Nebreska
symposium on motivation. University of Nebraska press.
Bandura, A. (1969). Principles of behavior modification, Holt, Rinehart and Wiston.
Bandura, A.,& Barab, P.G. (1971). ‘Conditions Governing Non reinforced imitation.
“Deveolopment psychology.
Bandyopadhyay, K.K., Hati, K.M., & Singh, R. (2009). Management Options for Improving
Soil Physical Environment for Sustainable Agricultural Production: Journal of
Agriculture and Physics; 9: 1-8.

106
Bekele, A., & Amsalu, A. (2012) effects of drought on pastoral household in Fentale Woreda
of Oromia regional state, Ethiopia. Journal of environmental issues and agriculture in
developing countries, vol. 4, no. 3.
Bishu, P. (2010) Property Rights or Property Wrong: Do property rights matter in household
Access to irrigation water; Evidence from Mid-Hills, Nepal. PhD Thesis
(Unpublished) University of York.
Boko, M., I. Niang, A. Nyong, C. Vogel, A. Githeko, M. Medany, B. Osman-Elasha, Tabo, B.,
& P. Yanda. (2007). Africa. In: Parry, M.L., O.F. Canziani, J.P. Palutikof, P.J. van
der Linden and C.E. Hanson eds. Climate change 2007: Impacts, adaptation and
vulnerability. Contributions of Working Group II to the Fourth Assessment Report of
the Intergovernmental Panel on Climate Change. Cambridge, Cambridge University
Press. Available from: http://www.ipcc.ch/pdf/assessment-report/ar4/wg2/ar4-wg2-
chapter9.pdfaccessed on 21st November 2014.
Botzen, W., Aerts, J., & van den Bergh, M. (2009). Dependence of flood risk perceptions on
socio-economic and objective risk factors. Water Resources Research 45: W10440.
Botzen, W., and van den Bergh, M. (2012). Monetary valuation of insurance against flood
risk under climate change. International Economic Review 53:1005–1025.
Boubacar, I. (2012). The Effects of Drought on Crop Yields and Yield Variability: An
Economic Assessment. International Journal of Economics and Finance; Vol. 4, No.
12; 2012
Boochabun, K., W. Tych, N. A. Chappell, P. A. Carling, Lorsirirat, K., & S. Pa-Obsaeng.
(2004). Statistical modeling of rainfall and river flow in Thailand. Geological Society
of India 64: 503-516.
Bulkeley, H. (2010). Cities and the governing of climate change. Annual Review of
Environment and Resources 35:229–253.
Burn, D. H. (1999). Perceptions of flood risk: a case study of the Red River flood of 1997.
Water Resources Research 35:3451–3458.
Byg, Anja, and Jan Salick. (2009). Local Perspectives on a Global Phenomenon – Climate
Change in Eastern Tibetan Villages. Global Environmental Change19: 156-166
CDIDP. (2013) First County Development Integrated Development Plan (2013-2017).
Laikipia County.
CDRSS. (2006). Facing Hazards and Disasters: Understanding human dimensions.

107
Washington DC: National Academy of Sciences.
Changnon, S.A. (2000). What Made El Niño 1997 - 1998 famous? The key events associated
with a unique climate event. In El Niño 1997 - 1998: The Climate Event of the century
(ed.) S.A. Changnon. Oxford: Oxford University Press.
Christensen, H., (2007). Regional climate projections in Climate change 2007: the physical
science basis. Contribution of Working Group I to the Fourth Assessment Report of
the Intergovernmental Panel on Climate Change (eds Solomon S., Qin D., Manning
M., Chen Z., Marquis M., Averyt K. B., Tignor M., Miller H. L.), pp. 847–940.
Cambridge, UK: Cambridge University Press.
Clark, R., Gornall, J., Betts, R., Burke, E ., Gornall, J., & Camp, j. (2010). Implications of
climate change for agricultural productivity in the early twenty-first century. Met
Office Hadley Centre, Fitz Roy Road Exeter, Devon EX1 3PB, UK
Cossins, N., & Upton, M. (1987). The Borena Pastoral System of Southern Ethiopia,
Agricultural System 25: 199 - 218.
Coppock, D.L. (1994). The Borena Plateau of Southern Ethiopia: Synthesis of Pastoral
Research, Development, and Change, 1980-1990. System Study No.5. International
Livestock Centers for Africa, Addis Ababa, Ethiopia, 374 PP.
COP (2009). Report of the Conference of the Parties on its fifteenth session, held in
Copenhagen from 7 to 19 December 2009.
Dankelman, I., K. Alam, A. Khurshid, W.B. Ahmed, Y.D. Gueye, N. Fatema & R.M. Kutin
(2008). Gender, climate change and human security: Lessons from Bangladesh,
Ghana and Senegal. Report prepared for Hellenic Foundation for European and
Foreign Policy by the Women’s Environment and Development Organization
(WEDO), Senegal. www.gdnonline.org/.../WEDO_Gender_CC_Human_Security.pdf.
Accessed on 20th November 2014.
Danny, M. (2011). Climate change and Thailand: impact and response. Contemporary
Southeast Asia: A Journal of International and Strategic Affairs 33(2): 229–258.
Debnath, P., Deb, P., Sen, D., Pattannaik, S.K. & Ghosh, S.K. (2012). Physiochemical
properties and its relationship with water holding capacity of cultivated soils along
altitudinal gradient in Sikkim. International Journal of Agriculture Environment
and Biotechnology; 5(1): 99-104.

108
Denzin, N.K. & Lincoln, Y. (2005). The Sage Handbook of Qualitative Research 3rd
Edition, Sage London.
Diggs, D.M. (1991). Drought experience and perception of climatic change among great
Plains farmers. Great Plains Research: A Journal of Natural and Social Sciences
1(1):113–132.
Dilley, M., & Heyman, B. N. (1995). ENSO and Disaster: Droughts, Floods and El
Niño/Southern Oscillation warm events. Disasters, 19, 181-193.
Dulany, D.E. (1962). ‘The place of hypotheses and intentions. ‘in Charles W. Eriksen, end.,
Behavior and Awareness- A symposium of research and interpretation, Duke
University press
FAO (2005). Food supply situation and crop prospects in Sub-Saharan Africa. Available on
ftp://ftp.fao.org/docrep/fao/007/J4758e/J4758e00.pdf. Accessed on 15th August 2016.
FAO (2007) Aquastat Nepal. FAO’s information system on water and agriculture. Land and
water Development division, Rome, www.fao.org/ag/agl/aglw/aquastat/countrie
s/nepal /index.stm accessed on 1st March 2016
FAO (2008). Climate change adaptation and mitigation: challenges and opportunities for
food security. High-level conference on world food security: The challenges of climate
change and bioenergy, Conference proceedings Rome, 3 – 5 June 2008.
FAO (2009) Food and Agriculture organization of the United Nations (FAO). FAO
Statistical Databases available from http://faostat.fao.org/ accessed on1st March 2016.
Food and Agriculture Organization (FAO) (2010). The state of food insecurity in protracted
crises.
Finan, T., West, C., Austin, D., & McGuire, T. (2002). Processing of adaptation to climate
variability: case study from the US Southwest. Climate Research, 21 (3), 299-310
Flynn, J., P. Slovic, C. K. Mertz, & C. Carlisle. (1999). Public support for earthquake risk
mitigation in Portland, Oregon. RiskAnalysis 19:205–216.
Funk, C. C. and Brown M. E. (2009) Declining global per capita agricultural production and
warming oceans threaten food security. Food Sec 1:271–289.
Funk, C. C., Dettinger M. D., Michaelsen J. C., Verdin J. P., Brown M. E., Barlow M. &
Hoell A. (2008). Warming of the Indian Ocean threatens eastern and southern
African food security but could be mitigated by agricultural development. Proc Nat
Acad Sci USA 105:11081–11086.

109
Gail, M. S. (2011). A primer on validity of assessment instruments. Journal of graduate
medicine education.DOI:10.4300/JGME-D-00075.1
Galero, T. E. (2011). A simplified approach to thesis and dissertation writing. Mandaluyong
City. National Book store pp. 43-44.
Galvin, K.A., P.K. Thornton, R.B. Boone & J. Sunderland (2004). Climate variability and
impacts on east African livestock herders: The Maasai of Ngorongoro Conservation
Area, Tanzania. African Journal of Range and Forage Science, 21 (3), pp. 1–2.
Giannini, A., Saravanan, R. & Chang, P. (2003). Oceanic forcing of Sahel Rainfall on
interannual to interdecadal timescales, Science 302, 1027-1030.
Glantz, M. (1996). Drought follows the Plough: Cultivating marginal areas. In Ribot et al.
(eds), Climate Variability, Climate Change and Social Vulnerability in the Semi-arid
Tropics, Cambridge University Press, pp 125-128.
Glantz, M.H. (1994). Drought, desertification and food production. in Drought follows the
plow: cultivating marginal areas(ed.) M.H. Glantz. Cambridge: University of
Cambridge Press.
Glantz, M. (1976). The Politics of Natural Disaster. Praeger Publishers.
Government of Kenya (GoK, 2010). National Climate Change Response Strategy. Ministry
of Environment and Mineral resources, Nairobi.
Government of Kenya (GoK, 2009). Changes in Forest Cover in Kenya’s Five “Water
Towers” 2000-2007,
Gulliver, P. H. (1951). A Preliminary Survey of the Turkana. A Report Compiled for the
Government of Kenya. University of Cape Town: Communication from the School of
African Studies, New Series No. 26.
Gullet, A., Asha, M., Ahmed, A. and Mwangi, A. (2006). Kenya: Floods Operations Update.
Kenya Red Cross Society.
Gupta, J., Termeer, C., Klosermann, J., Meijerink, S., van den Brink, M., Jong, P.,
Nooteboom, S., and Bergsma, E. (2010). The Adaptive Capacity Wheel: a method to
assess the inherent characteristics of institutions to enable the adaptive capacity of
society. Environmental Science & Policy 13, 459-471.
Hair, J., Black, W., Babin, B., Anderson, R. & Tatham, R. (2006). Multivariate data
analysis. 6th ed. New Jersey: Pearson Prentice Hall.

110
Harsch. (1992). Drought Devastates Southern Africa. Drought Network News (Reprint from
Africa Recovery, April 1992), 4, 17-19.
Helland, J. (1997). Developments Issues and Challenges for the Future of Borena. Report
Prepared for Norwegian Church Aid. Addis Ababa.
Hildén, M., Lehtonen, H., Bärlund, I., Hakala, K., Kaukoranta, T.,& Tattari, S. (2005). The
practice and process of adaptation in Finnish agriculture. FINADAPT Working Paper
5 Finnish Environment Institute Mimeographs no. 335. Helsinki, Finland: Finnish
Environment Institute.
Holmgren, K., & H. Öberg., (2006). Climate Change in Southern and Eastern Africa During
the Past Millennium and its Implications for Societal Development, Environment,
Development and Sustainability, 1, 185-195, Springer
Hudson J.W. (2002). Responses to Climate Variability of the Livestock Sector in the North-
West Province, South Africa Master Theses (Unpublished) Colorado State University
Fort Collins, Colorado.
Huho, J.M., & Kosonei, R.C (2013).The opportunities and challenges for mitigating
climate change through drought adaptive strategies: the case of Laikipia
county, Kenya . Journal of Social Sciences and Humanities 2223-9944
Huho, J.M., Ngaira, J.K., & Ogindo, H.O (2010). Drought severity and their effects on rural
livelihoods in Laikipia district, Kenya. Maseno University. Journal of Geography and
Regional Planning Vol. 3(3), pp. 035-043
Hulme, M., Doherty, R., Ngara, T., New, M., & Lister, D. (2001). African climate change:
1900-2100. Climate Research 17, 145-168.
Hussain, I., & Hanjra, A.M. (2004). Irrigation and Poverty Alleviation: Review of the
Empirical Evidence, Irrigation and Drainage 53pp. 1-15.
Hussain, I., Sakthivadivel, R., & Bhattarai, M. (2002a). Irrigation Impact on Income
Inequality and Poverty Alleviation: Policy Issues and Options for Improved
Management of Irrigation Systems, International Water Management Institute:
Colombo, Sri Lanka.
HFA (2005). International Strategy for Disaster Reduction International Strategy for
Disaster Reduction. www.unisdr.org/wcdr .accessed on 30th September 2015.
IEBC (Independent Electoral and Boundaries Commission) (2012). Electoral Boundaries in
Kenya. Kenya government.

111
Igodan, C.O., Ohoji, P.E. & Ekpere, J.A. (1990). Factors associated with the adoption of
recommended practices for maize production in the Lake Basin of Nigeria.
Agricultural Administration and Extension 29: 149-156.
IPCC (2014). Climate change: Impacts, adaptation, and vulnerability. Working Group II
contribution to the IPCC 5th assessment report.
IPCC (2007). Climate change2007: the physical science basis, Contribution of Working
Group to the fourth Assessment report of the intergovernmental panel on climate
change. Solomon, S., Qin, D., manning, M Chen, Z., Margiquis, M., Averyt, K.B.,
Tignor, M., and Miller, H.L (eds) Cambridge University Press Cambridge, UK and
New York, NY, USA, 996pp
IPCC (2001). Impacts, Adaptation and Vulnerability. Contribution of the Working Group II
to the Third Assessment Report on the Intergovernmental Panel on Climate Change.
UK: Cambridge University Press.
Jaetzold, R., Schmidt, H., Hornetz, B & Shisanya, C. (2011). Farm Management handbook
of KenyaVol.11 Natural Conditions and Farm Management Information –2nd Edition
Part B Central Kenya Sub part B 1b Northern Rift Valley Province. Ministry of
Agriculture, Nairobi.
Jaetzold, R., Schmidt, H. & Shisanya, C. (2009). Farm Management handbook of
KenyaVol.11 National condition and Farm Management information. 2nd Edition part
a west Kenya sub part A, Nyanza province. Ministry of Agriculture, Nairobi.
Jahangir, A.T.M., Sayedur, R.M., & Saadat, A.H.M. (2013) Monitoring Meteorological and
Agricultural Drought Dynamics in Barind Region, Bangladesh Using SPI and Markov
Chain Model. International Journal of Geomatics and Geosciences 3: 511-524.
Jones, L., Ludi, E., & Levine, S. (2010) towards a characterization of Adaptive Capacity: A
framework for analyzing adaptive capacity at the Local Level. Overseas
Development Institute (ODI), London, UK, p. 8.
Jones, P.D., Horton, B., Folland, K., Hulme, M., Parker, D., & Basnett, A. (1999) The use of
indices to identify changes in climatic extremes. Weather and Climate Extremes
42:131-149.
Juma, R.O. (2009). Turkana Livelihood strategies and adaptation to drought in Kenya. PhD
Thesis (Un-published) Victoria University of Wellington.

112
Kairu, E. (2002). Poverty, target groups and governance environment in Laikipia district. A
report for SARDEP.
Karanja, A. (2013). Analysis of rainfall variability on Irish potato production in Ol-joro-orok
Division, Nyandarua County. Master’s Thesis (Unpublished) Kenyatta University,
Kenya.
Karim, M.R.,& Rahman, M.A. (2014). Drought risk management for increased cereal
production in Asian least developed countries. Weather and Climate Extremes.
http://dx.doi.org/10.1016/j.wace.2014.10.004. Accessed on 15th December 2016.
Keita, K. (1998). Conflict and Conflict Resolution in the Sahel: The Tuareg Insurgency in
Mali. Strategic Studies Institute Monograph. 46 pp. accessed on 20th August 2016.
http://www.carlisle. army.mil/ssi/pubs/pubResult.cfm/hurl/PubID1/4200/.
KFSSG (2009). The 2009 long rains season assessment report, government of Kenya.
KFSSG (2011). Season assessment report, government of Kenya.
KCCAP (2013). National Adaptation Plan. Ministry of Environment and Mineral resources.
Nairobi
Kettlewell, P. S., Sothern, R. B., & Koukkari, W. L. (1999). UK wheat quality and economic
value are dependent on the North Atlantic oscillation. J. Cereal Sci. 29, 205–209
Kiem, A.S. (2013). Drought and water policy in Australia: Challenges for the future
illustrated by the issues associated with water trading and climate change adaptation
in the Murray-Darling Basin. Global Environment Change; 23(6): 1615-26.
Kihupi, N., Kingamkono, R., Dihenga, H., Kingamkono, M., & Rwamugira, W. (2003).
Integrating indigenous knowledge and climate forecasts in Tanzania.
Kinoti, G. (1994). Hope for Africa and What the Christians can do. Nairobi: AISRED.
Kipkorir, E.C. (2002). Analysis of rainfall climate on the Njemps Flats, Baringo District,
Kenya. J. Arid Environ. 50445-458.
Kenya Economic Survey 2017.Kenya National Bureau of Statistics. Nairobi ISBN: 978-
9966-102-00-3
KNBS (2010). Kenya population and Housing census volume 1(A). Ministry of finance,
planning and vision 2030. Government printers, Nairobi.
Kombo, D.K. & Tromp, I. A. (2009). Proposal and thesis writing, Nairobi. Kenya

113
Kumar, M.N., Murthy, C.S., Sesha, M.V.R & Roy P.S. (2010) the use of Standardized
Precipitation Index (SPI) for drought intensity assessment. National Remote Sensing
Centre, Hyderabad 500 625. India
Laing, M.V. (1992). Drought update 1991- 1992: South Africa. Drought Network News
4:15-16.
Lackstrom, K. (2015). Institutional Adaptation and Drought Management in the Carolinas.
(Doctoral dissertation). Retrieved from http://scholarcommons.sc.edu/etd/3143
Leiserowitz, A. (2005). American risk perceptions: is climate change dangerous? Risk
Analysis 25:1433–1442.
Limpinuntana, V. (2001).Physical factors related to agricultural potential and limitations in
Northeast Thailand. P. 3-17. In: S.P. Kam, C.T. Hoanh, G. Trebuil, and B. Hardy,
(Eds.), Natural resource management issues in the Nakhon Ratchasima basin of N.E.
Thailand: An overview. Los Baños, Philippines
Lipton, M., Litchfield, J., Blackman R., De Zoysa D., Qureshy, L.,& Waddington, H. (2002)
The Impact of Irrigation on Poverty, Draft Paper,
Li Y. P., Ye W., Wang M., & Yan X. D. (2009). Climate change and drought: a risk
assessment of crop-yield impacts. Clim. Res. 39, 31–46.
Long, S.T. & Freese, J. (2006). Regression Model for Categorical Dependent Variables
Using Stata. Stata, Collage Station, TX, USA.
Mabe, F.N., Gifty, S. & Samuel, D. 2014. Determinants of choice of climate change
adaptation strategies in northern Ghana. Research in Applied Economics 6: 75-94.
Maddison, D. (2006). The perception of and adaptation to climate change in Africa. Centre
for Environmental Economics and Policy in Africa, Pretoria, South Africa.
(Discussion Paper, 10).
Maina, L. (2000). Ethnicity among the Communities of Nakuru District. In Murunga G. R.
(ed) Pg 108-193.
Manipadma J. (2013). India strives to become “drought proof”. The gaurdian. 2013 Mar 12.
www.theguardian.com/environment/2013/mar/12/indiastrives-drought-
proof.Accessed on 15th September 2016
Marengo, J., Tomasella, J., Soares, W., Alves, L., and Nobre, C.A. (2011). “Extreme
Climatic Events in the Amazon Basin: Climatological and Hydrological Context of
Previous Floods,” Theoretical and Applied Climatology, Vol. (85)1-13.

114
March, J. G. and Olsen, J. P. (1989). Rediscovering Institutions: The Organizational Basis of
Politics. New York: The Free Press.
Marshall, F., & Hildebrand, E., (2002). Cattle before crops: the beginnings of food
production in Africa. Journal of World Prehistory 16, 99–143.
Melese, G., Munyae, M., & Mulinge. (2013) Impacts of Climate Change and Variability on
Pastoralist Women in Sub Saharan Africa. African books collection limited. Kampala
McKee, B, T., Doesken, J. N., & Kleist, J. (1993). The relationship of drought frequency and
duration to time scales, Proceedings of ninth Conference on Applied Climatology,
American Meteorological Society, Boston, 179-184.
McNeeley, S. M. (2014). A “toad’s eye” view of drought: regional socio-natural
vulnerability and responses in 2002 in Northwest Colorado. Regional Environmental
Change 14, 1451-1461.
Mikkelsen, B. (2005). Methods for Development Work and Research. New Delhi, India:
Sage Publications Ltd.
Miles, M.B.,& Huberman, A.M. (1994).Qualitative Data Analysis: An expanded
sourcebook(2nd edn.), Sage: London and Thousand Oaks, California.
Mkutu, K. (2001). Pastoralism and conflict in the Horn of Africa. Africa Peace
Forum/Saferworld/University of Bradford, December 2001.
Morid, S., Smakhtin, V., Bagherzadeh, K. (2007). Drought forecasting using artificial neural
networks and networks and time series of drought indices. International Journal of
climatology 27: 2103-2111.
Mose, L.O. (1999). Factors affecting the distribution and use of fertilizer in Kenya:
Preliminary assessment. http://www.aec.msu.edu/fs2/kenya/Dist_use_fert.pdf.
Moser, S. C. and Ekstrom, J. A. (2010). A framework to diagnose barriers to climate change
adaptation. PNAS 107(51),22026-22031.
MOSSP (2010). National Policy for Disaster Management in Kenya.
Mpandeli, N. S., & Maponya, P. I. (2014). Constraints and challenges facing the small scale
farmers in Limpopo Province. Journal of Agricultural Science, 6(4), 135-143.
http://dx.doi.org/10.5539/jas.v6n4p135
Mpandeli, N. S. (2006). Coping with climate variability in Limpopo Province (Unpublished
PhD thesis). University of Witwatersrand.

115
Mubaya, C., & Mafongoya, P. (2017) the role of institutions in managing local level climate
change adaptation in semi-arid Zimbabwe. Climate Risk Management 16 (2017) 93–
105
Muga, M. (2010). Climate Change: A Major Challenge and Revelation for EA Nationals. A
journal on resource, reflection and discourse for sustainable development. 32:201-
207
Mugenda, O.,& Mugenda, A. (2003). Research methods (revised edition). Acts press. Nairobi.
Kenya
Muthamilselvan, M., Manian, R., & Kathirvel, K. (2006). Moisture conservation techniques
in dryfarming - A review Agric 27(1): 67-72.
Muthui, M. (2007). The impact of climate change on agriculture, fisheries and pastoralist in
Africa. Kenya Fed. Agric. Producers (KENFAP) (www.moreandbetter.org).
Mwangi, E. (2012). Church’s Approaches to Peace building and Reconciliation in Ethnic
Conflict Areas in Kenya: A Case Study of Laikipia West District (Un-published
Master’s thesis, Kenyatta University)
Mwangi, E., Watterhall, F., Dutra, E., Giuseppe, F.D., & Pappenbenger, F. (2013).
Forecasting Droughts in East Africa. Journal of Hydrology and Earth Sciences 10:
10209-10230.
NEMA (2010). Effects of climate change and coping mechanisms. State of the Environment
report Kenya 2006/2007.
NCCRS (2010). National Climate Change Response Strategies. Government of Kenya
Ndamani, F., & Watanabe. T (2016) Determinants of farmers’ adaptation to climate change:
A micro level analysis in Ghana. Sci. Agric. (73) 201-208.
Ndambiri, H., Ritho C., Mbogoh S.G., Ng’ang’a S., Muiruri E. J., Nyangweso P.M., Kipsat,
J., Omboto, P., Ogada J., Kefa C., Kubowon P.,& Cherotwo F. (2012). Analysis of
Farmers’ Perceptions of the Effects of Climate Change inKenya: the Case of Kyuso
District. Journal of Environment and Earth Science ISSN 2225-0948
Nhemachena, C. & Hassan, R. (2007). Micro-Level Analysis of Farmers’ Adaptation to
Climate Change in Southern Africa. International Food Policy Research Institute,
Washington, DC, USA. (IFPRI Discussion Paper, 00714).
Ngaira, J.K. (2004). Basic facts in contemporary climatology. Lake publishers and
enterprises, Kisumu.

116
Niamir, F.M. (1999). ‘Conflict management and mobility among the pastoralists of
Karamoja, Uganda in: managing mobility in African rangeland’ ITDG.UK
Nikola, R. (2006). Policies and Strategies to Address the Vulnerability of Pastoralists in
Sub-Saharan Africa. Retrieved August 18 2016, http://www.fao.org/ag/pplpi.html
Nyongesa, M. Saumtally, S., & Bindi, M. (2008). Climate change – can potato stand the
heat. Kenya agricultural Research Institute (KARI), Mauritius Sugar industry Research
institute Mauritius Agricultural Meteorologist. University of Florence, Italy.
Oba, G. (2001). The Importance of Pastoralists' Indegenous Coping Strategies for Planning
Drought Management in the Arid Zone of Kenya. Nomadic People, 5(89), 89-119.
Ogola, O., Milton, W., Ayieko, A., Orawa, O., & Kimani, W. (2011). Analysis of fertilizer
use in potato production in Nakuru district, Kenya. Africa journal of Agriculture vol.
6 (16):3672-3677
Okoro, B.C., Uzoukwu, R.A.,& Chiomezie, N. M. (2014). River basins of Imo State for
sustainable water resources management. Journal of Civil and Environmental
Engineering 4: 1-8.
Olaoye, O. (1999). Developing drought tolerant varieties for the Savanna agro-ecologies of
Nigeria in 25th year Commemoratives Publications of Genesis Society of Nigeria.
pp.173-182
Olesen, J. E., & Bindi M. (2002).Consequences of climate change for European agricultural
productivity, land use and policy. Eur. J. Agron. 16, 239–262
Omonijo, T.O. and Okogbue, E.C. (2014) Trend Analysis of Drought in the Guinea and
Sudano- Sahelian Climatic Zones of Northern Nigeria (1907-2006). Atmospheric and
Climate Sciences, 4, 483-507. http://dx.doi.org/10.4236/acs.2014.44045
Opiyo, F.,Wasonga, O., & Nyangito, M. (2014). Measuring household vulnerability to
climate-induced stresses in pastoral rangelands of Kenya: Implications for resilience
programming.University of Nairobi, Kabete, Kenya
Ortegren, J. T., Weatherall, A., and Maxwell, J. T. (2014). Sub-regionalization of Low-
Frequency Summer Drought Variability in the Southeastern United States. The
Professional Geographer 66(2), 323-332.
O’Riordan, T. & Jordan, A. (1999). Institutions, climate change and cultural theory: towards
a common analytical framework. Global Environmental Change 9, 81-93.
Pachauri, R. K. (2004). Climate change and its impacts on development: The role of the

117
IPCC assessments. Climate and Development, IDS Bulletin, 35(3). Sussex: Institute of
Development Studies.
Pennings, J. M. E., & Smidts, A. (2000). 'Assessing the Construct Validity of Risk Attitude'.
Management Science, 46(10), 1337-1342.
Parmeshwar. D, Yutaka, Kiem, I, & Sadhindra, N. (2014). Drought impacts and adaptation
strategies for agriculture and rural livelihood in the Maharashtra state of India. The
open agriculture journal, 8, 41-47
Patt, A., & Gwata, C. (2002). Effective seasonal climate forecast applications: Examining
constraints for subsistence farmers in Zimbabwe. Global Environmental Change, 12,
185-195.http://dx.doi.org/10.1016/S0959-3780(02)00013-4
Peacock, W. G., S. D. Brody, & Highfield, W. (2005). Hurricane risk perceptions among
Florida single family home owners. Landscape and Urban Planning 73:120–135.
Peacock, C., Jowett, A., Dorward, A., Poulton, C., & Urey. (2004). reaching the poor: A call
to Action, Investment in small holder Agriculture in Sub-Sahara Africa. London:
Farm-Africa.
Pederson, N., Bell, A. R., Knight, T. A., Leland, C., Malcomb, N., Anchukaitis, K. J.,
Tackett, K., Scheff, J., Brice, A., Catron, B., Blozan, W., & Riddle, J. (2012). A long-
term perspective on a modern drought in the American Southeast. Environmental
Research Letters 7, 014034. doi:10.1088/1748-9326/7/1/014034
Petheram, L., K. K. Zander, B.M. Campbell, C. High, & N. Stacey. (2010). “Strange
Changes: Indigenous Perspectives on Climate Change and Adaptation in NE Arnhem
Land (Australia).” Global Environmental Change 20: 681–692.
Pavelic, P., K. Srisuk, P. Saraphirom, S. Nadee, K. Pholkern, S. Chusanathas, S. Munyou, T.
Tangsutthinon, T. Intarasut, & V. Smakhtin. (2012). Balancing-out floods and
droughts: Opportunities to utilize floodwater harvesting and groundwater storage for
agricultural development in Thailand. Journal of Hydrology 470-471: 55-64.
Pinstrup-Anderson, P. (1995) “Integrating Political and Economic Considerations in
Programs and Policies to Improve Nutrition: Lessons Learned.” Child Growth and
Nutrition in Developing Countries: Priorities for Action. Ithaca, NY: Cornell
University Press.
Prapertchob, P., & Bhandari, S. Pandy. (2007). Economic cost of Drought and rice Farmers’
coping mechanisms in Northeast Thailand.P.113-148. In: S. Pandey, H. Bhandari,

118
and B. Hardy, (Eds.). Economic costs of drought and rice farmers’ coping
mechanisms: A cross-country comparative analysis. Los Baños, Philippines: IRRI.
Prattt D.J., Le Gall F., &De Haan, C.(1997). Investing in pastoralism sustainable natural use
in arid Africa and the Middle East. Washington D.C. World Bank. World Bank
Technical paper. ISSN 9253-7494, No.365.
Recha, C.W. (2013). Effects of climate variability on water resources and livelihoods and
state of adaptive capacity in semi-arid Tharaka District, Kenya. PhD Thesis
(Unpublished) Kenyatta University, Kenya.
REGLAP (2011). Disaster risk reduction in the dry lands of the Horn of Africa. Rodwell
press limited.
Reynolds, T. W., Bostrom, A., Read, D., & Morgan, M. G. (2010). Now what do people
know about global climate change? Survey studies of educated laypeople. Risk
Analysis 30:1520–1538.
PFE (Pastoralist Forum of Ethiopia) (2007). Proceedings of the Fourth National Conference
on Pastoral Development in Ethiopia, Millennium Development Goals and Pastoral
Development: Opportunities and Challenges in the new Ethiopian Millennium UN
ECA Conference Hall August 29-30, 2007 Addis Ababa.p26.
Phillips, J., Makaudze, E., Unganai, L., Makardho, J., & Cane, M. (1999). Current and
potential use of climate forecasts for farm management in Zimbabwe. Paper
presented at the Society for Applied Anthropology Meetings. Tuscon, AZ.
Samra, B., & Randles, R.H. (1988). A test for correlation based on Kendall’s tau.
Communications in statistics-theory and methods; 17:3191-3205
Scott, W. R. (2008). Institutions and Organizations: Ideas and Interests (3rd ed.). Los
Angeles: Sage Publications, Inc.
Shisanya, C.A. (1990). The 1983-1984 drought in Kenya. Journal of Eastern African
Research and Development 20,127-148.
Shisanya, C.A.,& Khayesi, M. (2007). How is climate change perceived in relation to other
socio-economic and environmental threat in Nairobi. Kenya. Climate change 85: 271-
284
Slegers, M.F.W. (2008). “If only it would rain”: farmers’ perceptions of rainfall and drought
in semi-arid central Tanzania. Journal of Arid Environments 72(11): 2106–2123.
Slovic, P. (2000). Perceptions of risk. Earthscan, London, UK.
119
Smit, B. & Skinner, M.W. (2002). Adaptations options in agriculture to climate change: a
typology. Mitigation and Adaptation Strategies for Global Change 7: 85-114.
Smit, B., & Wandel, J. (2006). Adaptation, adaptive capacity and vulnerability. Global
Envorn. Change 16, 282–292.
Sokona, Y.,& Denton, F. (2001). Climate change impacts: Can Africa cope with the
challenges? Climate Policy 1:117-123.
Spielman, D.J.,& Pandy-Lorch, R. (2009) Highlights from Millions Fed Proven Successes in
Agricultural Development, International Food Policy Research Institute (IFPRI),
Washington D.C. available from http://www.ifpri.org/sites/default/files /publications.
pdf. Accessed on 1st March 2016.
Swim, J., Clayton, S., Doherty, T., Gifford, G., Howard, G., Reser, J., Stern, P.,& Weber, E.
(2011). Psychology and global climate change: addressing a multi-faceted
phenomenon and set of challenges. Report of the American Psychological Association
Task Force on the Interface between Psychology and Global Climate Change.
American Psychological Association, Washington, D.C., USA.
Tabachnick, B., & Fidell, L. (2001). Using multivariate statistics 4th ed. Califonia State
University. ISBN 0-321—05677-9
Thébaud, B., & Batterby, S. (2001). Sahel pastoralists: opportunism, struggle, conflict and
negotiation. A case study from eastern Niger. Global Environmental Change 11, 69-
78.
Thenya, T., Kiteme, B.P., Ouko, C.A., Kahiu, N., Njuguna, E. C., Karanja F., Ojwang’,
D., & Wambugu G, (2011). Assessment of Ecological Status and Socio-economic
Dynamic of Upper Ewaso Ng'iro Basin Wetlands. CETRAD.
Thomas, R. J. (2008). Opportunities to reduce the vulnerability of dryland farmers in Central
and West Asia and North Africa to climate change. Agriculture, Ecosystems and
Environment 126 (1–2): 36–45.
Tilahun, K. (2006). The characterization of rainfall in the arid and semi-arid regions of
Ethiopia. Water SA Vol. 32, 0378-4738
TIK. (2012). Food assistance integrity study: Analysis of the 2011 drought response in
Kenya. Transparency International Kenya.
Tilman, D., Cassman, K.G., Matson, P.A., Naylor, R., & Polasky, S. (2002). Agricultural
sustainability and intensive production practices, Nature 418 pp. 671-677.

120
Tiwari, K.T., Rayamajhi, S., Pokharel, R.K., & Balla, M.K. (2014). Determinants of the
climate change adaptation in rural farming in Nepal Himalaya. International Journal
of Multidisciplinary and Current Research 2: 2321-3124.
Tomasella, J., Pinho, P., Borma, L.S., Marengo, J., Nobre, C.A., Bittencourt, O.R., Prado,
M., Rodriguez, D., and, Cuartas, A. (2013). “The Droughts of 1997 and 2005 in
Amazonia: Floodplain Hydrology and Its Potential Ecological and Human Impacts,”
Climatic Change, Vol. 116, No. 3-4, 2013, pp. 723-746. doi:10.1007/s10584-012-
0508-3
Tubiello F. N., Rosenzweig C., Goldberg R. A., Jagtap S.,& Jones J. W.(2002).Effects of
climate change on US crop production: simulation results using two different GCM
scenarios. Part I: wheat, potato, maize, and citrus. Clim. Res. 20, 259–270.
Taylor, J.G., T. R. Steward, & M. Downton. (1988). Perceptions of Drought in the Ogallala
Aquifer Region. Environment and Behaviour 20: 150–175.
Tyson, P. D., & Dyer, T. G. J. (1978). The predicted above-normal rainfall of the seventies
and the likelihood of droughts in the eighties in South Africa. South African Journal
of Science, 74, 372-377.
Uddin, M.N., Bokelmann, W. & Entsminger, J.S. (2014). Factors affecting farmers’
adaptation strategies to environmental degradation and climate change effects: a farm
level study in Bangladesh. Climate 2: 223-241
Udmale, P., Ichikawa. Y., Manandhar, S., Ishidaira, H.,& Kiem, A.S. (2014). Farmers’
perception of drought impacts, local adaptation and administrative mitigation
measures in Maharashtra State, India. International Journal on Disaster Risk
Reduction; 10: 250-69.
UN (2009). Drought Risk Reduction Framework and practices. Geneva, Switzerland.
UNDP (2000). Report on the Status of Drought Preparedness and Mitigation in Sub-
Saharan Africa. United Nations (Volume 1). New York: Office of Combat
Desertification and Drought, United Nations Development Programme (UNDP).
UNISDR (2012). Disaster reduction in Africa. United Nations International strategy for
disaster reduction regional office for Africa (UNISDR Africa)
UNCDD (1999). Drought Preparedness and Mitigation in Sub-Saharan Africa. New York:
United Nations Office to Combat Desertification and Drought.
Uphoff, N.T. (1996). Local Institution Development: An analytical sourcebook with cases.

121
West Hartford Connecticut. Kumarian Press
Van Dijl, E.A. Grogan, K.A. & Borisova T. (2015). Determinants of adoption of drought
adaptations among vegetable growers in Florida. Journal of Soil and Water
Conservation 70(4):218-231
Van Dorland, R., B. Jansen, K. van der Sandt, B. van Hove, C. Jacobs, C., & R. Swart, R.
(2011). Staat van het klimaat 2010: actueel onderzoek en beleid nader verklaard.
PCCC, de Bil, Wageningen, The Netherlands.
Vasileiadou, A. E., & Botzen. W. J. W. (2014). Communicating adaptation with emotions:
the role of intense experiences in raising concern about extreme weather. Ecology and
Society 19(2): 36.
Vogel, C. (2000). Usable science: an assessment of long-term seasonal forecasts among
farmers in rural areas of South Africa. South African Geographical Journal, 82, 107-
116.
Vogel, C.H. (1995). People and drought in South Africa: reaction and mitigation. In People
and Environment in Africa. Tony Binns, ed. New York: Wiley and Sons.
Wallander, S., M. Aillery, D. Hellerstein, & Hand, M. (2013). The Role of Conservation -
Programs in Drought Risk Adaptation. Washington, DC: U.S. Department of
Agriculture, EconomicResearch Service, Economic Research Report No. 148.
Wambua R.M., Mutua B.M., Raude J.M. (2014) Drought Forecasting Using Indices and
Artificial Neural Networks for Upper Tana River Basin, Kenya-A Review Concept.
Journal of Civil Environ Eng 4: 152. doi:10.4172/2165-784X.1000152
Warren, R. (2006). Impacts of global climate change at different annual mean global
temperature increases. In Schellnhuber, H. J., Cramer, W., Nakicenovic, N., Wigley,
T. and Yohe (Eds.) Avoiding Dangerous Climate Change. Cambridge University
Press.
Weber, E.U. (2010). What shapes perceptions of climate change? Wiley Interdisciplinary
Reviews: Climate Change 1(3): 332– 342
Weber, E. U. (2006). Experience-based and description-based perceptions of long-term risk:
why global warming does not scare us (yet). Climatic Change 77:103–120.
Wilby, R. L., Orr, H.G., Hedger, M., Forrow, D.,& Blakmore, M. (2006). Risks posed by
climate variability to delivery of water framework directive objectives. Environ Int.
Williams, P.& Funk, C. (2011). A westward extension of the warm pool leads to a westward

122
extension of the Walker circulation, drying eastern Africa. Springer science Journal
37:2417–2435
Wilhite, D. A., Sivakumar, M. V. K., & Pulwarty, R. (2014). managing drought risk in a
changing climate: The role of national drought policy. Weather and Climate Extremes
3, 4-13.
Wilhite, D. A., Svoboda, M., and Hayes, M. (2007). Understanding the Complex Impacts
of Drought: A Key to Enhancing Drought Mitigation and Preparedness. Water
Resources Management 21(5), 763–774.
Wilhite, D. A. (Ed.). (2005). Drought and Water Crises: Science, Technology, and
Management Issues. New York: Taylor & Francis.
Wilhite, D. A. (1997) responding to drought: common threads from the past, visions for the
future. Journal Water Resource Association 33:951–959
Wisner, B. (1977). The Human Ecology of Drought in Eastern Kenya. Phd Thesis
(Unpublished). ClarkUniversity, Massachusettes.
World Bank, (2013). Agricultural Sector Risk Assessment in Niger: Moving from Crisis
Response to Long-Term Risk Management. Report Number: 74322-NE
WMO (2012): Standardized Precipitation Index User Guide (M. Svoboda, M. Hayes and D.
Wood). (WMO-No. 1090), Geneva.
Wright, P.B. (1977). The Southern Oscillation: patterns and mechanisms of the
teleconnections and the persistence. Report HIG-77-13 of Hawaii Institute
ofgeophysics. University of Hawaii Press.
Yanda, P.Z., & C.P. Mubaya., (2011). Managing a Changing Climate in Africs; Local
Level Vunerabilities and Adaptation Eperiences, Dar es Salaam, Mkuki na Nyota
Young, O. R. (2002). The Institutional Dimensions of Environmental Change: Fit,
Interplay, and Scale. Cambridge, MA: The MIT Press.
Ziervogel, G., & Downing, T. E. (2004). Stakeholder networks: improving seasonal climate
forecasts. Climatic Change, 65, 73-
101.http://dx.doi.org/10.1023/B:CLIM.0000037492.18679.9e
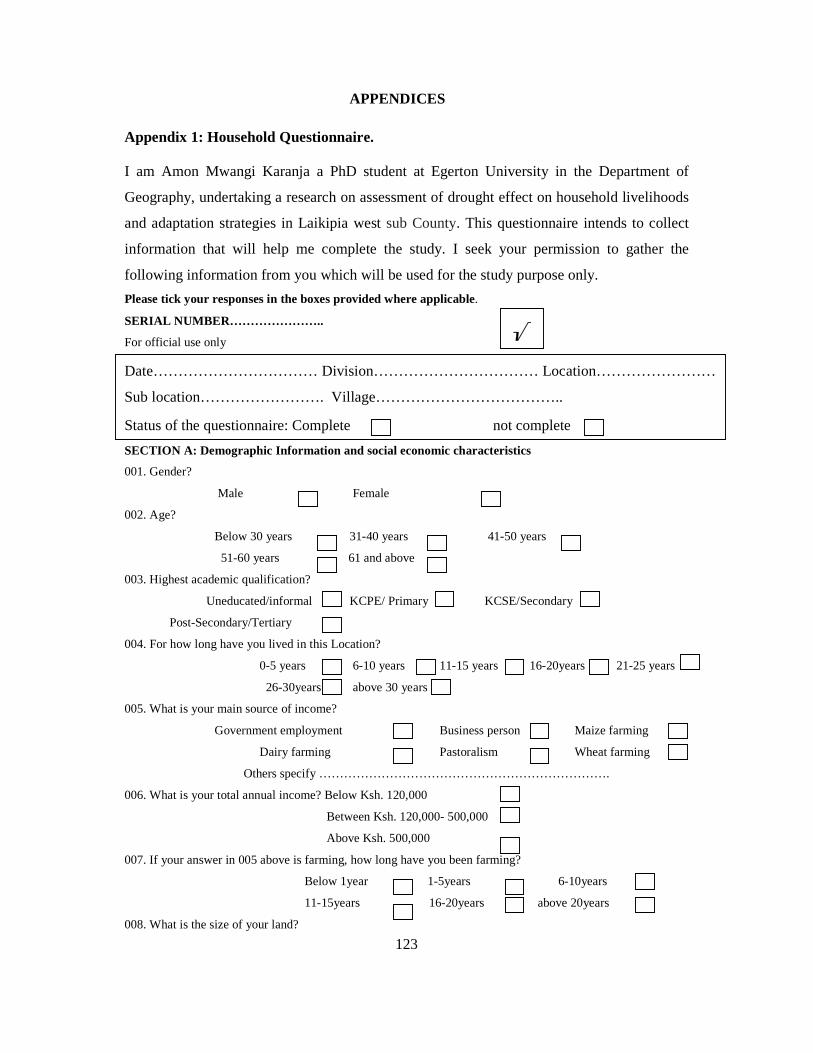
123
APPENDICES
Appendix 1: Household Questionnaire.
I am Amon Mwangi Karanja a PhD student at Egerton University in the Department of
Geography, undertaking a research on assessment of drought effect on household livelihoods
and adaptation strategies in Laikipia west sub County. This questionnaire intends to collect
information that will help me complete the study. I seek your permission to gather the
following information from you which will be used for the study purpose only.
Please tick your responses in the boxes provided where applicable.
SERIAL NUMBER…………………..
For official use only
SECTION A: Demographic Information and social economic characteristics
001. Gender?
Male Female
002. Age?
Below 30 years 31-40 years 41-50 years
51-60 years 61 and above
003. Highest academic qualification?
Uneducated/informal KCPE/ Primary KCSE/Secondary
Post-Secondary/Tertiary
004. For how long have you lived in this Location?
0-5 years 6-10 years 11-15 years 16-20years 21-25 years
26-30years above 30 years
005. What is your main source of income?
Government employment Business person Maize farming
Dairy farming Pastoralism Wheat farming
Others specify …………………………………………………………….
006. What is your total annual income? Below Ksh. 120,000
Between Ksh. 120,000- 500,000
Above Ksh. 500,000
007. If your answer in 005 above is farming, how long have you been farming?
Below 1year 1-5years 6-10years
11-15years 16-20years above 20years
008. What is the size of your land?
√
Date…………………………… Division…………………………… Location……………………
Sub location……………………. Village………………………………..
Status of the questionnaire: Complete not complete

124
Less than 2 acres 2- 5 acres 5- 10 acres
Over ten acres
009. What is your type of land ownership?
Owner Leased Communal
010. Have you ever gone for training on farming courses or training?
Yes No
Section B: Household perception and effects of the 2009 drought
011. How frequent are drought episodes in this area?
Every year
After every two years
After five years
012. What does drought mean to you?
Lack of rainfall Lack of food
Lack of pasture Drying of rivers
013. How will you describe the 2009 drought in this area?
Severe Moderate
014. What was the impact of the 2009 drought in your house hold?
(a) (i). Economic impact
Reduced crop yield Crop failure Reduced milk production
Loss of livestock High cost of goods
Others specify…………………………………………………………………………
(ii) What percentage of your crops were impacted by drought
No crops area impacted
Less than 25% crop area
Less than 50% crop area
Less than 75%
Over 75%
(iii) What was the impact of drought on Livestock?
Livestock were not impacted
Few deaths
All died
(b) Social impact
Children missed school for lack of food
Seasonal migration with animals
Increased distance to the water point
Job losses in farms
Conflict over water
Others specify……………………………………………………………………

125
(c) Environmental impact
Lack of household fuel
Drying of rivers
Increased cases of fires
Others specify………………………………………………………………………
(d) Health effects
Increase cases of livestock disease Increased crop pest
Human diseases Human death Malnutrition
Others specify……………………………………………………………………………
015. How did your respond to the 2009 drought episode?
Sold livestock Migrated with the animals Searched for employment
Opted not farm Changed my source of income Slaughtered the animals
Bought food supply watered crops Planted drought evading crops
Others specify…………………………………………………………………………….

126
Section C: Adaptation and preparedness to drought strategies
016. Did you use the following adaptation strategies during the 2009 drought?
017. How are you prepared to deal with on coming drought?
Set aside some emergency fund
Preserve food supplies
Mobilize my neighbors and charts the way forward
Attend trainings on drought management
Seek information on drought preparedness
Wait for relief food
Other specify……………………………………………………………………..................
018. Has you put in place measures to respond to drought?
Ye No
019. Which of the following measures are in place?
Stock piling of cereals and grains emergency aid
Rehabilitation of critical boreholes
Marketing of Livestock
Construction of new boreholes
Planting trees and reforestation
Changing cropping patterns
Recruited volunteer to offer assistance during drought
Established community emergency fund
Community-based training initiatives
Promotion of networking within the community
020. Who would you prefer to provide you with information on how to make your household safe from drought?
Government Agency.
News Media.
Yes No
Migrated with my animals in search of pasture and water. Sold my animals. Did not farm during that period. Practiced crop diversification. Planting of drought resistant seeds. Sold my belongings and migrated with my family to another area.
Bought fodder for the animals. Migrated to town in search of employment. Waited for the relief food. Engaged in business (Specify……………………….........) Gather wild fruits and roots. Practiced charcoal burning. Engaged in Bee keeping.

127
Non Governmental Organizations (NGO)
Red Cross.
Religious Leaders.
Others specify……………………………………………………………………………
021. How often would you like to receive such information?
Monthly
Every three months
Once every year

128
Appendix 2: Key Informant Interview Schedule
The objective of this interview is to assessment of drought effects on household livelihoods
and adaptation strategies in Laikipia West sub-County. The target populations are Chiefs,
Elders, Ward Agriculture and livestock officers, ward devolution officers and NGO Officials
.
SCHEDULED QUESTIONS
1. What does drought mean in Laikipia West sub-County?
2. What was the effect of the 2009 drought in Laikipia West sub-County?
3. How many livestock died during the2009 drought?
4. How did crops perform during the 2009 drought period?
5. What are the roles of your office during the 2009 drought?
6. What was the cost incurred by the government during the 2009 drought in the area.
7. How many people needed food aid during the 2009 drought in this location?
8. What criteria do you use in distribution of relief food?
9. How many people died as a result of the 2009 drought in this location
10. How did the households and Community respond during the 2009 drought?
11. What are the Community drought adaptations strategies used in the area?
12. What are the household drought preparedness and adaptation strategies in the area?
13. What are the government’s drought disaster preparedness strategies?
14. Describe some of the activities undertaken to enhance drought preparedness
15. What is the adaptation challenges facing household and community in Laikipia West
sub-County.
16. What do you thick should be done to enhanced drought adaptation in Laikipia West
sub-County.
Date………………….. Starting time ……………… Time ended……………………… Division……………… Location…………………… Sub location……………………... Institution……………… Position……………………

129
Appendix 3: Annual Rainfall Amount for Rumuruti and Ndaragwa Stations
YEAR Rumuruti Station Annual Rainfall (MM) Ndaragw a Station Annual Rainfall (MM) 1984 411 459 1985 514.8 847.5 1986 848.8 936.7 1987 533.2 527.6 1988 712.8 924.4 1989 729.3 811.5 1990 1029.2 962 1991 532 706.5 1992 648.4 887.1 1993 726.1 704 1994 667.6 1135.9 1995 598.5 853.4 1996 830.8 945.6 1997 1219.7 1053.1 1998 1065.4 1498.4 1999 441.8 740.9 2000 434.8 725.5 2001 694.2 881 2002 675.7 806 2003 902.6 731 2004 764.9 725 2005 494 795.1 2006 508.4 798.6 2007 1041 818.3 2008 608.2 854.7 2009 534.9 334 2010 1097.2 1071 2011 1122.6 1096.3 2012 809.6 1217.72 2013 986.7 1138.57 2014 604.9
Source: Water Resource and Management Authority, Rumuruti (2016)

130
Appendix 4: Standard Precipitation Value for Rumuruti and Ndaragwa Station Year SPI for Rumuruti SPI for Ndaragwa
1984 -2.6 -2.46777 1985 -1.92912 -0.57357 1986 0.2065 -0.13866 1987 -1.81147 -2.1333 1988 -0.67554 0.219687 1989 -0.51894 -0.42002 1990 1.488664 -0.01531 1991 -1.81914 -0.82515 1992 -0.83266 -0.3805 1993 -0.55247 -0.95465 1994 -0.94038 0.847784 1995 -1.39393 -0.42877 1996 0.076893 0.574188 1997 2.57806 0.905426 1998 1.591455 2.6 1999 -2.39588 -1.09332 2000 -2.44824 -1.16841 2001 -0.78202 -0.41024 2002 -0.5134 0.120247 2003 1.067332 0.650731 2004 -0.34332 1.330866 2005 -1.61793 0.439661 2006 -0.87455 -0.4506 2007 1.435441 -0.71594 2008 -1.34254 -0.53847 2009 -1.8006 -2.6 2010 1.794785 1.000801 2011 2.6 0.654178 2012 0.402647 1.743934 2013 1.105574 1.379045 2014 -1.61033 -1.71031
Source: Rumuruti and Ndaragwa WRMA Stations (2016)

131
Appendix 5a: Factors Influencing Perceptions to Drought among Households
Standard Wald
Parameter DF Estimate Error Chi-Square Pr >Sig.
Intercept 1 1.3860 1.5466 0.8031 0.3702
GENDER001_1 2 1 -0.00127 0.4069 0.0000 0.9975
AGE002_1 2 1 -0.2443 0.4931 0.2453 0.6204
AGE002_1 3 1 -0.7350 0.6137 1.4345 0.2310
AGE002_1 4 1 -0.6184 0.7354 0.7072 0.0004
AGE002_1 5 1 -0.3007 0.8478 0.1258 0.7228
EDUCUCATION003_1 2 1 0.0841 0.4958 0.0288 0.8653
EDUCUCATION003_1 3 1 0.2095 0.6184 0.1147 0.7348
EDUCUCATION003_1 4 1 -1.3791 0.8495 2.6358 0.1045
iffarming007_1 2 1 0.0784 0.9536 0.0068 0.9345
iffarming007_1 3 1 1.2508 0.9537 1.7204 0.1896
iffarming007_1 4 1 1.6412 1.0758 2.3274 0.1271
iffarming007_1 5 1 1.7086 1.0997 2.4139 0.0203
iffarming007_1 6 1 1.3424 0.9815 1.8706 0.1714
INCOME005_1 2 1 -1.8852 1.0820 3.0361 0.0814
INCOME005_1 3 1 -1.5997 1.0790 2.1981 0.1382
INCOME005_1 4 1 -0.7920 1.2186 0.4224 0.5158
INCOME005_1 5 1 -2.1796 1.0989 3.9339 0.0473
size008_1 2 1 -0.6723 0.4792 1.9679 0.1607
size008_1 3 1 2.0169 1.2932 2.4323 0.1189
size008_1 4 1 0.3384 0.7406 0.2088 0.6477
ownership009_1 2 1 1.3224 0.6019 4.8280 0.0280
ownership009_1 3 1 0.8142 0.5281 2.3772 0.1231
have010_1 2 1 -0.8742 0.5202 2.8245 0.0928
Source: Field data (2016)

132
Appendix 5b: Factors Influencing Perceptions to Drought among Households Odds Ratio Estimates
Point 95% Wald
Effect Estimate Confidence Limits GENDER001_1 2 vs 1 0.999 0.450 2.217
AGE002_1 2 vs 1 0.783 0.298 2.059
AGE002_1 3 vs 1 0.480 0.144 1.596
AGE002_1 4 vs 1 0.539 0.127 2.277
AGE002_1 5 vs 1 0.740 0.141 3.900
EDUCUCATION003_1 2 vs 1 1.088 0.412 2.875
EDUCUCATION003_1 3 vs 1 1.233 0.367 4.144
EDUCUCATION003_1 4 vs 1 0.252 0.048 1.331
iffarming007_1 2 vs 1 1.082 0.167 7.011
iffarming007_1 3 vs 1 3.493 0.539 22.646
iffarming007_1 4 vs 1 5.162 0.627 42.513
iffarming007_1 5 vs 1 5.521 0.640 47.661
iffarming007_1 6 vs 1 3.828 0.559 26.211
INCOME005_1 2 vs 1 0.152 0.018 1.265
INCOME005_1 3 vs 1 0.202 0.024 1.674
INCOME005_1 4 vs 1 0.453 0.042 4.935
INCOME005_1 5 vs 1 0.113 0.013 0.975
INCOME005_1 7 vs 1 0.212 0.019 2.334
size008_1 2 vs 1 0.511 0.200 1.306
size008_1 3 vs 1 7.515 0.596 94.774
size008_1 4 vs 1 1.403 0.329 5.989
ownership009_1 2 vs 1 3.753 1.154 12.207
ownership009_1 3 vs 1 2.257 0.802 6.355
have010_1 2 vs 1 0.417 0.151 1.156
Source: Field data (2016)

133
Appendix 6: Maize Production per 90 Kg bags (2001-2014) Year Rainfall Amount (MM) Maize yield Data (Bags)
2001 694.2 167,400 2002 675.7 83,700 2003 902.6 168,000 2004 764.9 143,000 2005 494 273,000 2006 508.4 85,000 2007 1041 200,000 2008 608.2 88,400 2009 534.9 80,000 2010 1097.2 50,250 2011 1122.6 50,762 2012 809.6 74,250 2013 986.7 55,936 2014 604.9 45,000
Source: Laikipia West sub-County Agriculture office (2016)

134
Appendix 7: NACOSTI Research Authorization

135
Appendix 8: Research Permit

136
Appendix 9: Research Team in a Data Collating and Cleaning Session
Source: Field data (2016)

137
Appendix 10: Journal Articles Published in Refereed Journals
1) Karanja, A ., Ondimu, K. and Recha, C. (2017) Analysis of Temporal Drought Characteristic Using SPI Drought Index Based on Rainfall Data in Laikipia West Sub-County, Kenya. Open Access Library Journal, 4: e3765. https://doi.org/10.4236/oalib.1103765
2) Karanja, A., Ondimu, K. and Recha, C. (2017) Factors Influencing Household
Perceptions of Drought in Laikipia West Sub County, Kenya. Open Access Library Journal, 4: e3764. https://doi.org/10.4236/oalib.1103764