phevs component requirements and efficiencies
TRANSCRIPT

PHEVs Component Requirements and
Efficiencies
2009 DOE Hydrogen Program and Vehicle Technologies Annual Merit Review
May 19, 2009
Phil Sharer, Aymeric RousseauArgonne National Laboratory
Sponsored by Lee Slezak
This presentation does not contain any proprietary, confidential, or otherwise restricted information
Project ID # vss_10_rousseau

Project OverviewTimeline
Start – July 2008End – September 200975% Complete
2
BudgetDOE
FY08 $ 200kFY09 $ 400k
BarriersSet targets for the different technical teamsPerform cost benefit analysis
PartnersU.S. EPAANL Battery’s group

Main Objectives
Define targets for the different technical teams.How does each assumption influence the component requirements?Can we lower a component requirement without significant fuel economy loss?What are the most appropriate battery energy/power to maximize fuel displacement?What is the best control strategy philosophy for different battery characteristics?What should the cost targets be to have specific payback?
3
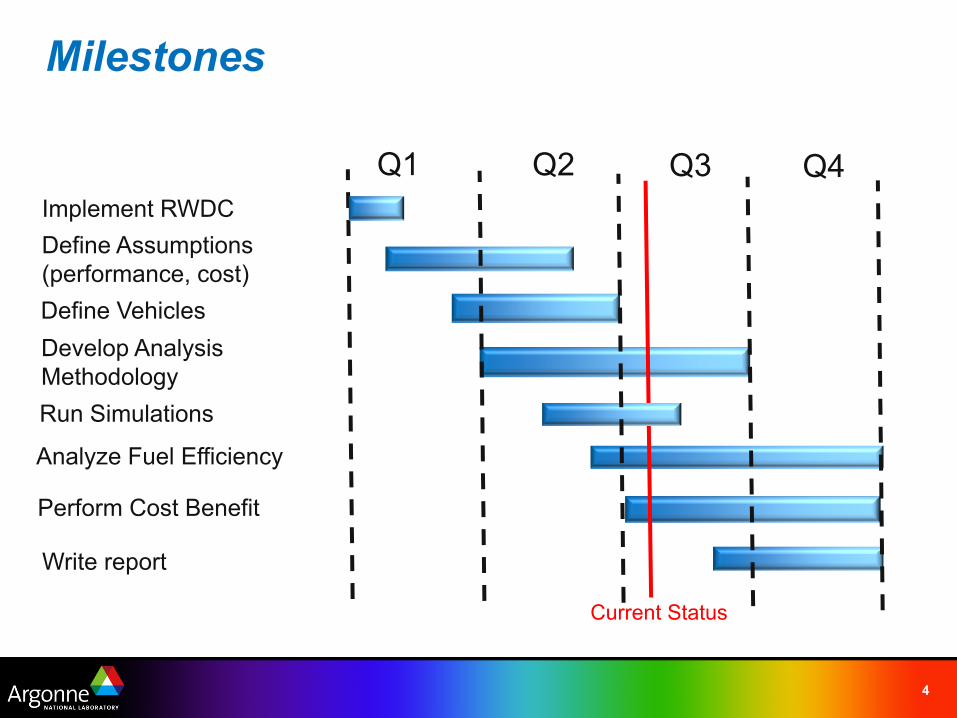
Milestones
4
Q1 Q2 Q3Implement RWDCDefine Assumptions(performance, cost)
Develop Analysis Methodology
Perform Cost Benefit
Write report
Analyze Fuel Efficiency
Current Status
Q4
Define Vehicles
Run Simulations

5
Approach
Real World Drive Cycles
>110 TripsOne day in Kansas City
Battery Power
Engine Power
Battery Energy
Convergence
Yes
No
Motor Power for Cycle
Vehicle Assumptions
AutomatedSizing
Midsize Vehicle
Analysis(Distribution)
Only Hot Conditions Assumed, no Grade!

6
Battery Power and Usable Energy Requirement as a Function of Vehicle Mass

Engine Power Requirements Provided to the Engine Tech. Team
7
Engine Power per vehicle classes
Engine Power per vehicle configuration

Different PHEV Powertrains and Battery Sizes
8
4 kWh
8 kWh
12 kWh
16 kWh
Low Energy PHEV
High Energy PHEV
Power Split PHEV
Series PHEV
Powertrain Configuration
BatteryEnergy
PHEVClass

Kernel Density Used to Compare Options
9
Mean Value

One Control per Configuration was Selected Based on a Fuel Economy and Number of Engine Starts - Criteria
10
0 1 2 3 4 5 6 7-20
0
20
40
60
80
100
120
140Mean Values
Fuel Consumption [l/100km]
Ele
ctric
al C
onsu
mpt
ion
[Wh/
km]
ConventionalSplit HEV
PHEV 8kWh Split Optimum Engine Power
PHEV 12 kWh Series Thermostat ControlPHEV 16 kWh Series Thermostat Control
PHEV 4kWh Split LoadEngPwr 10miCD
Linear relation between Electrical and Fuel Consumption
∆Fuel Consumption per added kWh Non Linear
∆1
∆2
Preliminary results

Fuel Consumption Lowers with Increasing Battery Energy
11
0 1 2 3 4 5 6 7 80
0.5
1
1.5
Fuel Consumption [liter/100km]
Den
sity
[-]
Conventional(mean = 6.53 l/100km, std = 0.30)HEV Split (mean = 4.85 l/100km, std = 0.46)PHEV 4kWh Split(mean = 3.31 l/100km, std = 0.77)PHEV 8kWh Split(mean = 2.36 l/100km, std = 0.89)PHEV 12 kWh Series(mean = 0.91 l/100km, std = 0.82)PHEV 16 kWh Series(mean = 0.67 l/100km, std = 0.67)
Preliminary results

0 20 40 60 80 100 120 140 160 180 2000
0.005
0.01
0.015
0.02
0.025
Electrical Energy Consumption [Wh/km]
Den
sity
[-]
PHEV 4kWh Split(mean = 52.43 Wh/km, std = 28.88)PHEV 8kWh Split(mean = 91.74 Wh/km, std = 35.16)PHEV 12 kWh Series(mean = 128.45 Wh/km, std = 20.14)PHEV 16 kWh Series(mean = 138.32 Wh/km, std = 17.38)
Battery Usage Linked to Usable Energy -> Different Impact on Life for Different Energies
12
These configurations offer range of battery
energy usage
Most cycles use low energy
consumptionMost cycles
use high energy
consumption
Preliminary results

4kWh Battery Energy Provides 50% of the Gains Achieved with 16 kWh Battery
13
0 10 20 30 40 50 60 70 80 900
1
2
3
4
5
6
7
8
9
10
Distance [miles]
Fuel
con
sum
ed [l
iters
]
ConventionalHEV SplitPHEV 4kWh SplitPHEV 8kWh SplitPHEV 12 kWh SeriesPHEV 16 kWh Series
Preliminary results

0 10 20 30 40 50 60 70 80 90-2
0
2
4
6
8
10
12
Distance [miles]
Ele
ctric
al e
nerg
y co
nsum
ed [k
Wh]
ConventionalHEV SplitPHEV 4kWh Split PHEV 8kWh SplitPHEV 12 kWh SeriesPHEV 16 kWh Series
Used Battery Energy as a Function of Driving Distance
14
Same control for series independently of battery energies
For medium distance, we see largest energy consumption difference due to driving characteristics
For short distance, we have similar electrical consumption -> Linked to low power demand?
Use
d B
atte
ry E
nerg
y [k
Wh]
Preliminary results

Constant Payback Period Requires Longer Driving Distances for Bigger Battery Packs
Equation for break even lines with conventional vehicle:
15
0 20 40 60 800
5
10
15
Daily Distance [miles]
Pay
back
[yea
rs]
Series 12kWh ThermoSeries 16kWh ThermoSplit 4kWh MinEngPwrSplit 8kWh MinEngPwr
Celec = 0.07 $/kWhCfuel = 3$/gallon
The further you drive, the better the payback
Preliminary results

Fuel Price Significantly Influences Payback Period
16
Celec = 0.07 $/kWh
Cbattery = 4128 $(1000$/kWh)Cbase = 30791 $
Spikes due to small number of data points for long distances
Pay
back
[yea
rs]
Benefit of 1$ increase non-linear
Preliminary results

Future Activities
■ Update the cost assumptions based on litterature search and expert discussions (D. Santini & A. Vyas).
■ Complete fuel efficiency and cost analysis■ Add HEV vehicle■ Perform cost benefit analysis based on several scenarios to define the
most approriate vehicle for different options (i.e., battery energy, battery cost, distance, fuel cost...).
■ What is the impact of assuming the vehicle can be charged during the day?
■ How does the results based on the RDWC compare with the latest J1711 Procedure (using both National and RWDC Utility Factors).
■ Perform MonteCarlo analysis on the control strategy parameters to provide an uncertainty value.
17

Summary■ Impact of RWDC on Fuel Efficiency
– Several vehicles with different powertrain configurations and battery energies were simulated.
– A single control strategy was selected for each option based on a combination of fuel efficiency and engine ON/OFF criteria.
– The fuel efficiency was compared with a conventional vehicle to assess the potential fuel displacement over the Kansas City RWDC.
■ Impact of RWDC on Cost Benefit Analysis– With current pricing, long payback period due to high battery cost– Increasing fuel price significantly influences payback period and is a
major factor for the rentability of a PHEV– Benefits of price reduction on payback nonlinear– You should regularly drive longer than what your AER theoritically
allows
18

19
ReferencesG. Singh, S. Hagspiel, M. Fellah, A. Rousseau, “Impact of RWDC on PHEVs fuel efficiency and cost for different powertrain and battery characteristics”, EVS 24, Norway, May 2009A. Rousseau, “Impact of Real-World Drive Cycles on PHEV Battery Requirements”, SAE 2009-01-1383, World Congress, April 2009 A. Rousseau, S. Pagerit, M. Fellah, “PHEV Battery Requirements Uncertainty Based on Real World Drive Cycles”, EDTA, Dec 2008, DCA. Rousseau, N., Shidore, R., Carlson, D., Karbowski, “Impact of Battery Characteristics on PHEV Fuel Economy”, AABC 2008, Tampa (May 2008)J. Kwon, J. Kim, E. Fallas, S. Pagerit, and A. Rousseau , “Impact of Drive Cycles on PHEV Component Requirements”, SAE paper 2008-01-1337, SAE World Congress, Detroit (April 2008). A. Rousseau, N. Shidore, R. Carlson, V. Freyermuth, “Research on PHEV Battery Requirements and Evaluation of Early Prototypes, AABC 2007, Long Beach (May 16-18)