phgdh expression is required for mitochondrial redox...
TRANSCRIPT
PHGDH Expression is Required for Mitochondrial Redox Homeostasis,
Breast Cancer Stem Cell Maintenance and Lung Metastasis
Debangshu Samanta1,2, Youngrok Park1, Shaida A. Andrabi1,3, Laura M. Shelton6, Daniele M.
Gilkes1,2,4, and Gregg L. Semenza1,2,4,5
1Institute for Cell Engineering, 2McKusick-Nathans Institute of Genetic Medicine, 3Department of
Neurology, 4Sidney Kimmel Comprehensive Cancer Center, 5Departments of Pediatrics, Medicine,
Radiation Oncology, and Biological Chemistry, Johns Hopkins University School of Medicine,
Baltimore, Maryland. 6Human Metabolome Technologies America, Inc., Boston, Massachusetts.
Corresponding author: Gregg L. Semenza, M.D., Ph.D., Broadway Research Building, Suite 671,
733 N. Broadway, Baltimore, MD 21205. FAX: 443-287-5618; E-mail: [email protected].
Running title: PHGDH is required for breast cancer progression
The authors disclose no potential conflicts of interest.
Grant support: This work was supported by Breast Cancer Research Program Impact Award
W81XWH-12-1-0464 from the Department of Defense and a grant from the Cindy Rosencrans Fund
for Triple Negative Breast Cancer to G.L.S.
2
Abstract
Intratumoral hypoxia stimulates enrichment of breast cancer stem cells (BCSCs), which are critical for
metastasis and patient mortality. Here we report a metabolic adaptation that is required for hypoxia-
induced BCSC enrichment and metastasis. Hypoxia-inducible factors coordinately regulate
expression of genes encoding phosphoglycerate dehydrogenase (PHGDH) and five downstream
enzymes in the serine synthesis pathway and mitochondrial one-carbon (folate) cycle. RNAi-mediated
silencing of PHGDH expression in both estrogen receptor positive and negative breast cancer cells
led to decreased NADPH levels, disturbed mitochondrial redox homeostasis, and increased
apoptosis, which abrogated BCSC enrichment under hypoxic conditions. PHGDH-deficient cells
exhibited increased oxidant levels and apoptosis, as well as loss of BCSC enrichment, in response to
treatment with carboplatin or doxorubicin. PHGDH-deficient cells were relatively weakly tumorigenic
and tumors that did form were deficient in BCSCs, abolishing metastatic capacity. Our findings
highlight a role for PHGDH in the formation of secondary (recurrent or metastatic) tumors, with
potential implications for therapeutic targeting of advanced cancers.
3
Introduction
Breast cancer (BC) mortality occurs in patients whose cancer cells metastasize to distant
sites, such as the lungs, bones, and brain. Only a small percentage of the BC cells in a primary tumor
have self-renewal capacity, which is necessary to form a metastatic tumor, and are designated as BC
stem cells (BCSCs) or tumor initiating cells (1, 2). Compared to bulk BC cells, BCSCs exhibit
increased survival when treated with cytotoxic chemotherapy (3, 4), which actively induces the BCSC
phenotype (5-7). Intratumoral hypoxia is common in advanced BCs (8) and induces the metastatic (9)
and BCSC (10) phenotypes through transcriptional activation of target genes by hypoxia-inducible
factor 1 (HIF-1) and HIF-2 (11-15). Adaptation of mammalian cells to chronic hypoxia involves a HIF-
1-dependent switch from oxidative to glycolytic metabolism, which is an adaptive response to, and
ameliorates, increased mitochondrial reactive oxygen species (ROS) production that occurs due to
decreased electron transport chain efficiency under hypoxic conditions (16-23).
Oncogenic transformation also activates pathways that generate ROS and place cancer cells
at risk for apoptosis (24). Redox homeostasis is dependent on a balance between levels of oxidants
and antioxidants. The latter are dependent upon the generation of NADPH, which is used to maintain
glutathione, the principal cellular antioxidant, in a reduced form. Two glycolytic shunt pathways utilize
glucose metabolites for NADPH generation: the pentose phosphate pathway (PPP) diverts glucose-6-
phosphate, whereas the serine synthesis pathway (SSP) converts 3-phosphoglycerate into serine via
three reactions that are catalyzed by phosphoglycerate dehydrogenase (PHGDH), phosphoserine
aminotransferase 1 (PSAT1), and phosphoserine phosphatase (PSPH). Serine is utilized as a
substrate for one-carbon (folate cycle) metabolism (1CM), either in the cytosol or mitochondria. In the
mitochondria (mito1CM), serine hydroxymethyl transferase 2 (SHMT2) catalyzes the reaction of
serine and tetrahydrofolate (THF) to glycine and 5,10-methylene-THF (MTHF). MTHF dehydrogenase
2 (MTHFD2) catalyzes the reaction of MTHF and NADP+ to generate formyl-MTHF and NADPH.
Finally, MTHFD1L splits formyl-THF into THF and formate (Fig. 1A). The cytosolic (cyto1CM)
4
reactions are catalyzed by SHMT1 and MTHFD1 (which performs reactions catalyzed by both
MTHFD2 and MTHFD1L).
PHGDH catalyzes the reaction that diverts 3-phosphoglycerate from the Embden-Meyerhof
pathway (EMP) to the SSP. A short hairpin RNA (shRNA) screen revealed that transformed breast
cells required PHGDH expression for tumor xenograft formation (25). PHGDH gene amplification was
found in 6% of BCs and shRNA-mediated knockdown of PHGDH expression inhibited proliferation of
BC cells with PHGDH amplification (25, 26). PHGDH overexpression was observed in 70% of
estrogen receptor negative (ER-) BCs (25), indicating that a mechanism other than gene amplification
must underlie PHGDH overexpression in most BCs. We hypothesized that increased expression of
PHGDH, as well as other SSP and 1CM enzymes, is required to maintain redox homeostasis in
hypoxic BC cells, especially in BCSCs, which are particularly sensitive to ROS (27).
Materials and Methods
More detailed descriptions can be found in the Supplementary Materials and Methods.
Cell culture
MCF-7, MDA-MB-231, HCC-1954, SUM-149 and SUM-159 cells were cultured as described
(6). BT-474, ZR75.1, and T47D cells were cultured in RPMI-1640 with 10% fetal bovine serum. The
cell lines were obtained from Dr. Sara Sukumar (Johns Hopkins University) in 2012. Cell
authentication was performed by PCR analysis of short tandem repeats.
Lentivirus transduction
5
Vectors encoding shRNA targeting HIF-1α and HIF-2α, and generation of MDA-MB-231 and
MCF-7 subclones, were described (13, 28). pLKO.1-puro lentiviral vectors encoding shRNA targeting
PHGDH (Supplementary Table S1) were purchased from Sigma-Aldrich. Lentiviruses were packaged
and transduced cells were selected as described (28).
Reverse transcription and quantitative real-time PCR (RT-qPCR)
Total RNA was extracted from cells and tumors using TRIzol (Invitrogen) and treated with
DNase I (Ambion). cDNA synthesis was performed using the iScript cDNA Synthesis system (Bio-
Rad). qPCR was performed using human-specific primers (Supplementary Table S2) and iQ SYBR
Green Supermix (Bio-Rad) (28).
Immunoblot assays
Whole-cell lysates were prepared in modified RIPA buffer (14). Blots were probed with
antibodies against HIF-1α, PHGDH, PSAT1, and PSPH (Novus Biologicals). HRP-conjugated anti-
rabbit and anti-mouse secondary antibodies (Santa Cruz) were used. Blots were re-probed with anti-
actin antibody (Santa Cruz).
BCSC assays
Aldefluor and mammosphere assays were performed as described (13).
MitoSOX staining
6
Cells were incubated in 5 μM MitoSOX Red (Molecular Probes) in PBS/5% FBS at 37 °C for
45 minutes and rinsed with PBS. Stained cells were filtered and subjected to flow cytometry (FC).
Apoptosis and viability assays
Apoptotic cells were quantified by FITC-Annexin V and APC-7-AAD staining followed by FC.
Viable cells were quantified by MTT assay (Invitrogen).
Glutathione and NADPH assays
Cell lysates were analyzed for glutathione and NADPH using GSH/GSSG-Glo and NADP/NADPH-Glo
assays (Promega).
Glucose uptake assay
Cells were incubated in 150 μM 2-[N-(7-nitrobenz-2-oxa-1,3-diazol-4-yl) amino]-2-deoxy-D-glucose
(Molecular Probes) and subjected to FC.
Seahorse assays
Oxygen consumption and extracellular acidification were measured using the XF24-Analyzer
(Seahorse Bioscience).
Metabolite analysis
7
Metabolites in culture media and cells were analyzed by capillary electrophoresis and single or
tandem mass spectrometry (MS) relative to internal standards (Human Metabolome Technologies) as
described (29, 30).
Bioinformatics
For the HIF signature, the TCGA Breast Invasive Carcinoma Gene Expression Dataset of 1,215
patients was analyzed (31, 32). Tumor grade was analyzed using GOBO (33). Kaplan–Meier curves
were generated using KM plotter (34).
Results
SSP and mito1CM enzyme expression is induced in hypoxic BC cells
BCs are classified as ER+, progesterone receptor positive (PR+), human epidermal growth
factor receptor 2 positive (HER2+), or triple negative (ER-/PR-/HER2-). We exposed six representative
human BC cell lines to 20% or 1% O2 for 24 hours: BT-474 (ER+/PR+/HER2+), HCC-1954 (HER2+),
MCF-7 (ER+/PR+), MDA-MB-231 (ER-/PR-/HER2-), SUM-149 (ER-/PR-/HER2-), and ZR-75.1 (ER+)
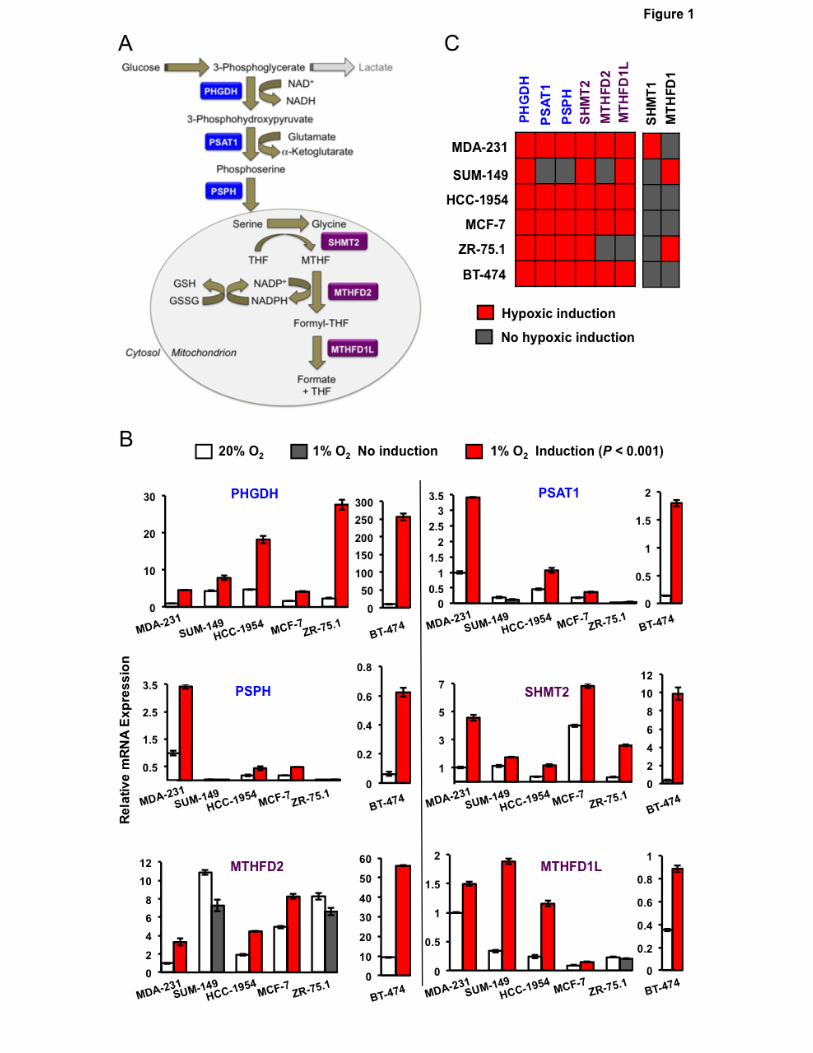
(35). Total RNA was isolated and analyzed for expression of SSP (PHGDH, PSAT1, PSPH), mito1CM
(SHMT2, MTHFD2, MTHFD1L) and cyto1CM (SHMT1, MTHFD1) mRNAs. In MDA-MB-231, HCC-
1954, MCF-7 and BT-474 cells, hypoxic exposure induced the expression of all three SSP and all
three mito1CM mRNAs, and all six BC cell lines exhibited induction of PHGDH and SHMT2 mRNA
(Fig. 1B and C), which encode enzymes catalyzing the first reaction of the SSP and mito1CM,
respectively (Fig. 1A). In contrast, expression of cyto1CM mRNAs was induced by hypoxia in only one
or two cell lines (Fig. 1B).
8
The SSP and PPP represent alternate mechanisms by which glucose metabolites are utilized
to generate NADPH. The first enzyme of the PPP is glucose-6-phosphate dehydrogenase (G6PD). In
contrast to the SSP and 1CM mRNAs, expression of G6PD mRNA was repressed by hypoxia in all
BC lines analyzed (Supplementary Fig. S1). Taken together, these data indicate that hypoxia
selectively induces the expression of mRNAs encoding SSP and mito1CM enzymes in cell lines
derived from ER+, PR+, HER2+, and triple-negative BCs.
HIFs are required for hypoxic induction of SSP and mito1CM enzymes
MDA-MB-231 subclones that were stably transfected with a vector encoding a non-targeting
control shRNA (NTC) or shRNA targeting HIF-1α (sh1α), HIF-2α (sh2α), or both HIF-1α and HIF-2α
(double knockdown [DKD]) have been used to investigate the role of HIFs in BC progression (6, 13,
28). Hypoxic induction of PHGDH, PSAT1, PSPH, SHMT2, MTHFD2 and MTHFD1L mRNA
expression, which was observed in the NTC subclone, was impaired when HIF-1α or HIF-2α or both
were silenced (Fig. 2A). Immunoblot assays demonstrated hypoxic induction of PHGDH, PSAT1, and
PSPH protein expression in the NTC subclone, which was impaired in the knockdown subclones (Fig.
2B). Similar results were obtained in MCF-7 subclones (Supplementary Fig. S2A). Hypoxia-induced
PHGDH, PSAT1 and PSPH expression in parental MCF-7 cells was abrogated, in a dose dependent
manner, by treatment with acriflavine (Supplementary Fig. S2B), which is a drug that inhibits the
heterodimerization of HIF-α and HIF-1β subunits (36). Thus, genetic and pharmacologic approaches
indicate that HIFs coordinately regulate the expression of SSP and mito1CM enzymes when BC cells
are exposed to hypoxia.
BCSCs are characterized by high aldehyde dehydrogenase (ALDH) activity and can be
identified by the Aldefluor assay, in which BODIPY-aminoacetaldehyde is converted to the fluorescent
product BODIPY-aminoacetate (37). Exposure of NTC subclones of MDA-MB-231 (Fig. 2C) and MCF-
7 (Supplementary Fig. S2C) to hypoxia for 72 hours increased the percentage of ALDH+ BCSCs,
9
whereas this response was impaired in knockdown subclones. Treatment of MCF-7 cells with
acriflavine also blocked hypoxic induction of the BCSC phenotype as determined by the
mammosphere assay (Supplementary Fig. S2D), which is based on the selective ability of BCSCs to
generate multicellular spheroids under non-adherent culture conditions (38).
Expression of SSP and mito1CM mRNAs is increased in BCSCs The preceding results demonstrated a correlation between loss of hypoxia-induced SSP and
mito1CM expression and loss of hypoxia-induced BCSC enrichment. To determine whether mRNAs
encoding these enzymes were overexpressed in BCSCs relative to non-BCSCs, we cultured MDA-
MB-231 and MCF-7 cells as either adherent monolayers or mammospheres for 7 days. HIF1α, HIF-
2α, PHGDH, PSAT1, SHMT2, MTHFD2, and MTHFD1L mRNA expression was increased in BCSC-
enriched mammosphere cultures of MDA-MB-231 cells, whereas expression of the cyto1CM enzymes
SHMT1 and MTHFD2 was decreased in mammospheres relative to adherent cells, as was the PPP
enzyme G6PD (Fig. 2D). Increased expression of HIF-1α, HIF-2α, PHGDH, SHMT2, MTHFD2, and
MTHFD1L mRNA in BCSCs relative to non-BCSCs was also observed in MCF-7 cells
(Supplementary Fig. S2E). Thus, HIF, SSP, and mito1CM mRNAs are preferentially expressed in
BCSCs, suggesting that they play an important role in the BCSC phenotype.
PHGDH knockdown abrogates hypoxia-induced BCSC enrichment
We chose to analyze the effect of PHGDH loss-of-function in BC cells for three reasons: (i)
PHGDH is required for the diversion of glucose metabolites to the SSP and 1CM; (ii) PHGDH
expression was hypoxia-inducible in all BC lines analyzed; and (iii) PHGDH was preferentially
expressed in BCSCs. MDA-MB-231 and MCF-7 cells were stably transfected with an expression
vector encoding either of two independent shRNAs targeting PHGDH (designated sh2 and sh4).
Knockdown efficiency was validated at the mRNA (Fig. 3A) and protein (Fig. 3B) levels in both cell
10
lines. PHGDH knockdown did not impair proliferation of either MDA-MB-231 (Supplementary Fig.
S3A) or MCF-7 (Supplementary Fig. S3B) cells cultured for 72 hours at either 20% or 1% O2. In
contrast, PHGDH knockdown markedly impaired the hypoxia-induced enrichment of BCSCs as
determined by Aldefluor assays (Fig. 3C) or primary and secondary mammosphere assays (Fig. 3D).
These results indicate that PHGDH expression is specifically required for hypoxic induction of the
BCSC phenotype.
PHGDH is required to maintain redox homeostasis and survival of hypoxic BC cells Acute hypoxia leads to increased mitochondrial ROS generation (23). We hypothesized that
PHGDH deficiency would lead to increased ROS levels and increased apoptosis. To test this
hypothesis, we exposed MDA-MB-231 and MCF-7 subclones to 20% or 1% O2 for 72 hours in
adherent culture and stained the cells with MitoSOX Red, which is selectively targeted to mitochondria
and generates fluorescence when oxidized by superoxide radicals, thereby serving as an indicator of
mitochondrial ROS in live cells. The NTC subclones showed no increase in ROS after hypoxic
exposure, whereas the percentage of MitoSOX+ cells was significantly increased in PHGDH
knockdown subclones (Fig. 4A). Analysis of annexin V and 7-amino-actinomycin D (7-AAD) staining
revealed no increase in apoptosis of hypoxic NTC cells, whereas the percentage of annexin V+/7-
AAD- cells was increased in the PHGDH knockdown subclones (Fig. 4B). Exposure of cells to hypoxia
in the presence of manganese (III) tetrakis (1-methyl-4-pyridyl) porphyrin (MnTMPyP), a cell-
permeable superoxide scavenger (39), rescued the apoptosis of PHGDH knockdown subclones under
hypoxia (Fig. 4C), indicating that increased apoptosis was due to increased ROS levels.
We hypothesized that PHGDH was required under hypoxic conditions for NADPH generation
to maintain glutathione in a reduced state. Exposure of NTC subclones to hypoxia increased the ratio
of reduced to oxidized glutathione (Fig. 4D), which was associated with a modest decrease in NADPH
levels (Fig. 4E). In contrast, PHGDH knockdown was associated with an impaired hypoxic induction of
11
reduced glutathione (Fig. 4D) and a significant decrease in NADPH levels (Fig. 4E). Thus, PHGDH
deficiency impairs NADPH production, which becomes a liability specifically under hypoxic conditions.
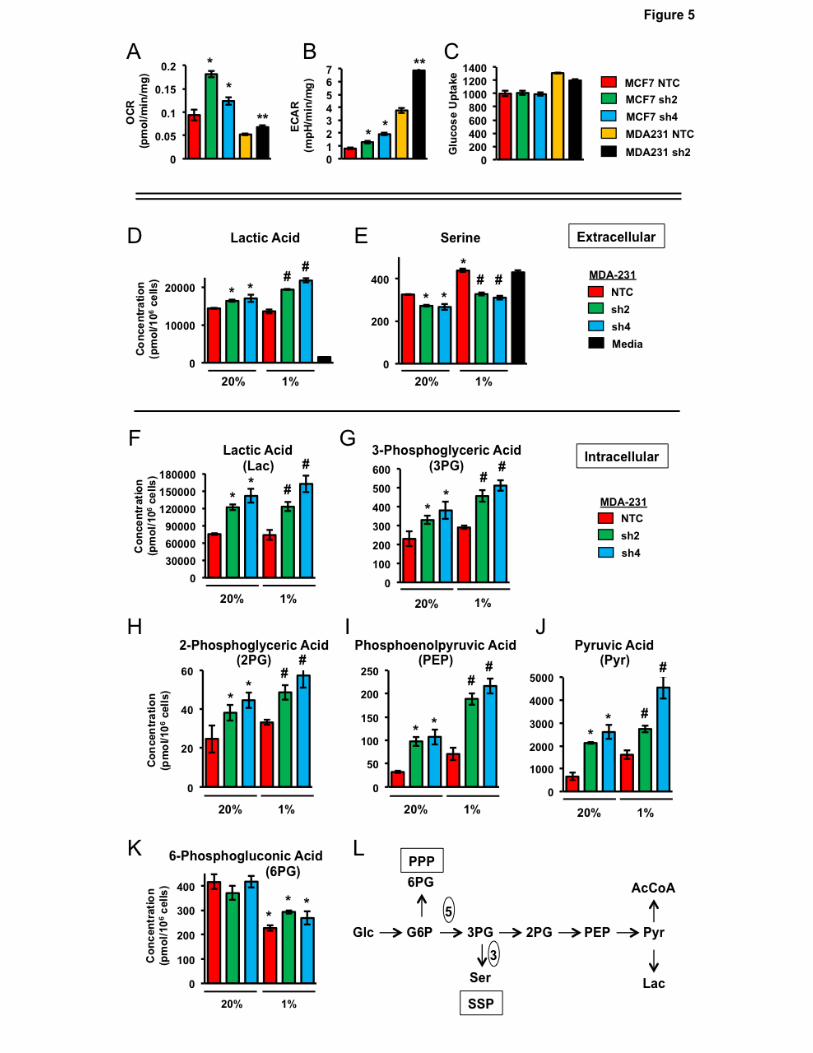
PHGDH plays a major role in determining the utilization of glucose metabolites
Glucose metabolism via the EMP leads to the production of acetyl CoA, which is utilized for
ATP generation through oxidative phosphorylation, and lactic acid, which is the terminal product of
glycolysis. PHGDH diverts glucose metabolites to the SSP, thereby reducing production of both acetyl
CoA and lactic acid. We analyzed the O2 consumption rate (OCR) and extracellular acidification rate
(ECAR) to monitor oxidative phosphorylation and glycolysis, respectively, in NTC and PHGDH
knockdown subclones. PHGDH deficiency increased the OCR (Fig. 5A) and ECAR (Fig. 5B) in both
MDA-MB-231 and MCF-7 cells. Glucose uptake was not increased in PHGDH knockdown subclones
(Fig. 5C). Taken together, these results indicate that the increased OCR and ECAR in PHGDH
knockdown subclones are due to decreased shunting of glucose metabolites from the EMP to the
SSP.
The effect of PHGDH knockdown on metabolite levels in MDA-MB-231 cells was analyzed by
MS. PHGDH knockdown was associated with increased intracellular (Fig. 5D) and extracellular (Fig.
5F) lactic acid levels under both non-hypoxic and hypoxic conditions, which was consistent with the
increased ECAR (Fig. 5B). Hypoxia increased extracellular serine levels in the NTC subclone,
whereas PHGDH deficiency reduced serine levels under both non-hypoxic and hypoxic conditions
(Fig. 5E). Thus, serine synthesis increases in NTC cells under hypoxic conditions as a result of
increased PHGDH expression, leading to decreased import and/or increased export of serine.
Hypoxia or PHGDH knockdown increased intracellular levels of all of the metabolites in the EMP at or
downstream of the SSP branch point: 3-phosphoglyceric acid (Fig. 5G), 2-phosphoglyceric acid (Fig.
5H), phosphoenolpyruvic acid (Fig. 5I), and pyruvic acid (Fig. 5J). Hypoxia decreased intracellular
levels of 6-phosphogluconic acid (Fig. 5K), the G6PD reaction product, which is consistent with
decreased G6PD expression in hypoxic cells (Supplementary Fig. S1). In contrast, PHGDH
12
knockdown did not affect 6-phosphogluconic acid levels, as expected because the PPP shunt is
upstream of the SSP shunt in the EMP (Fig. 5L). Taken together, the data presented in Fig. 5 indicate
that PHGDH shunts a significant proportion of glucose-derived 3-phosphoglycerate from the EMP to
the SSP in breast cancer cells.
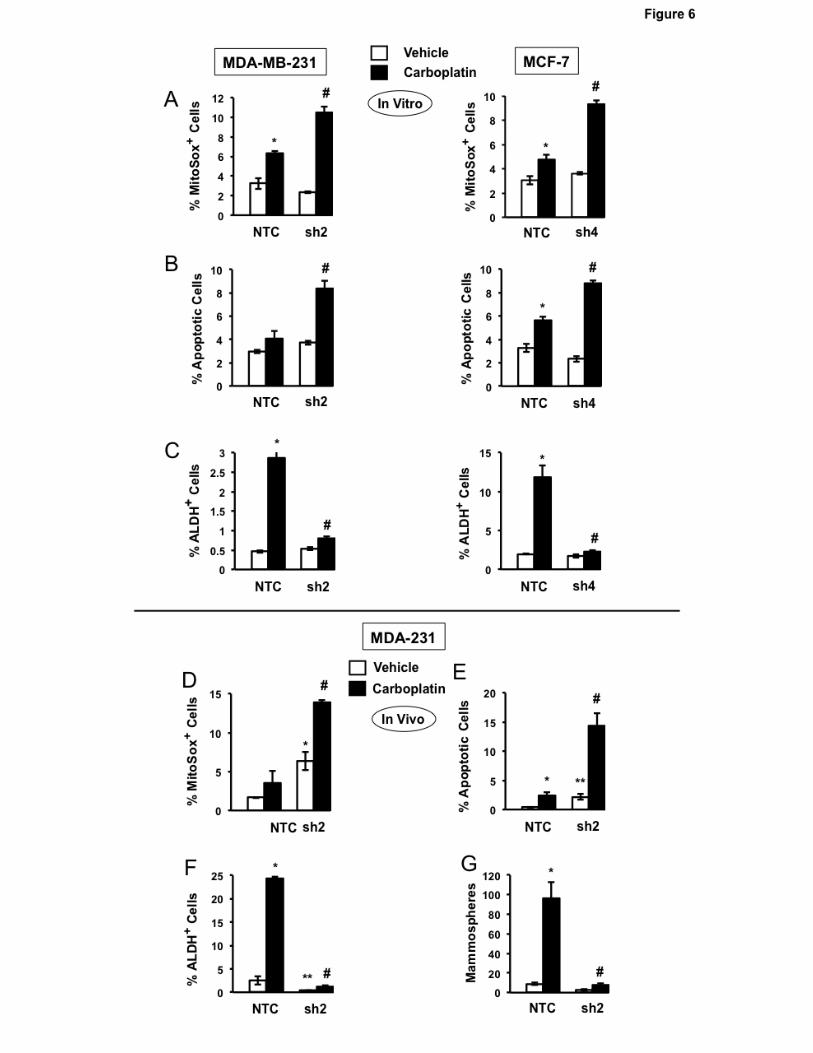
PHGDH knockdown increases the sensitivity of BC cells to chemotherapy
Since many cytotoxic cancer chemotherapies increase ROS levels (40), we hypothesized that
PHGDH deficiency would also impair the enrichment of BCSCs that occurs in response to
chemotherapy (5-7). Carboplatin is a chemotherapy agent that is used to treat BC (41, 42). Platinum
compounds increase mitochondrial ROS by forming adducts on mitochondrial DNA, thereby impairing
the transcription of electron transport chain components (43). MDA-MB-231 and MCF-7 subclones
were exposed to increasing concentrations of carboplatin for 72 hours and cell viability was
determined by MTT assay. PHGDH deficiency sensitized BC cells to carboplatin (Supplementary Fig.
S4). Compared to NTC subclones, treatment of PHGDH-deficient cells with carboplatin at IC50 led to
increased mitochondrial ROS (Fig. 6A) and apoptosis (Fig. 6B). Carboplatin treatment of NTC
subclones induced enrichment of ALDH+ BCSCs, which was abrogated in the knockdown subclones
(Fig. 6C).
We also investigated the effect of PHGDH knockdown on the response to doxorubicin, which
is an anthracycline that is commonly used in the United States to treat BC and was the first
chemotherapeutic shown to induce HIF activity (44). Compared to NTC subclones, treatment of
PHGDH-deficient cells with doxorubicin at IC50 increased mitochondrial ROS (Supplementary Fig.
S5A) and apoptosis (Supplementary Fig. S5B). Doxorubicin treatment induced enrichment of ALDH+
BCSCs, which was abrogated in the PHGDH-knockdown subclones (Supplementary Fig. S5C). Thus,
both platinum and anthracycline chemotherapy induce PHGDH-dependent BCSC enrichment.
To investigate whether carboplatin-induced BCSC enrichment in vivo also requires PHGDH
expression, MDA-MB-231 subclones (2×10⁶ cells) were implanted in the mammary fat pad (MFP) of
13
female NSG mice. When tumors reached a volume of 200 mm3, mice were treated with 15 mg/kg of
carboplatin by intraperitoneal injection every 5 days for 3 doses. Tumors were harvested 3 days after
the last dose for analysis. Compared to NTC subclones, PHGDH knockdown subclones exhibited a
greater increase in the percentage of MitoSOX+ (Fig. 6D) and apoptotic (Fig. 6E) cells. Carboplatin
treatment increased the percentage of ALDH+ cells (Fig. 6F) and number of mammosphere-forming
cells (Fig. 6G) in the NTC subclone, and these effects were abrogated by PHGDH knockdown (Fig.
6F-G). These results indicate that PHGDH deficiency sensitizes BC cells to chemotherapy and
abrogates chemotherapy-induced BCSC enrichment.
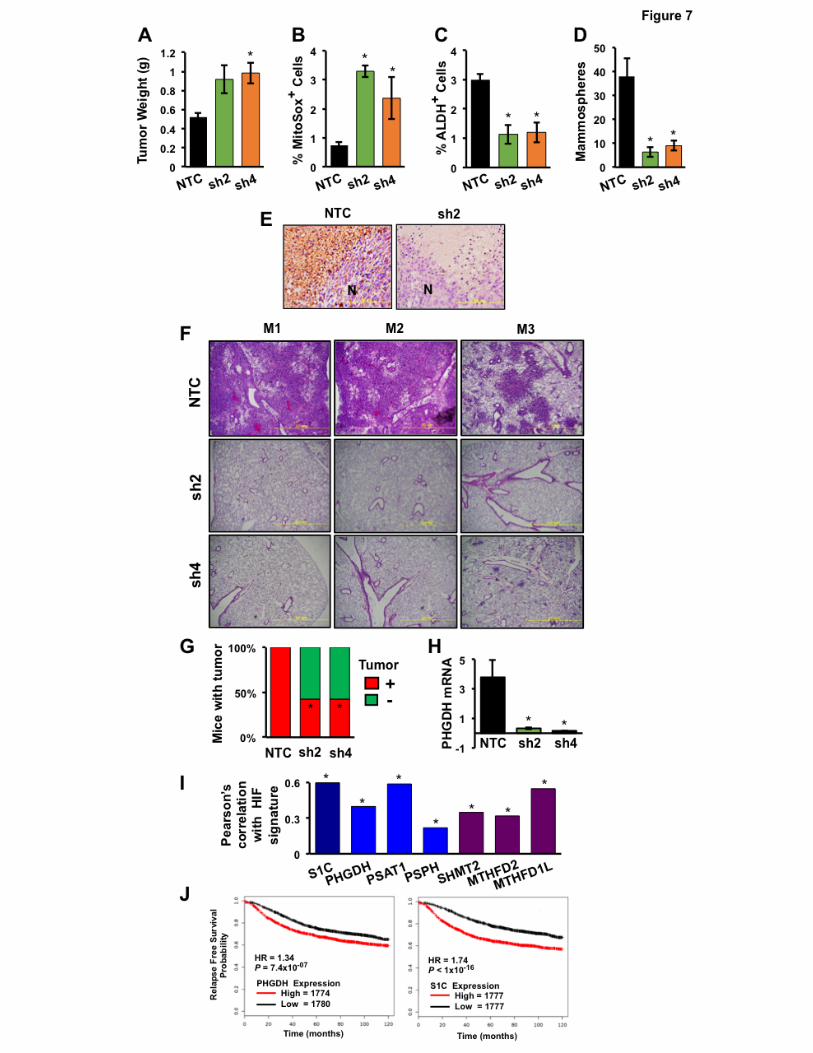
PHGDH expression promotes tumor formation and is required for BC metastasis
To investigate whether PHGDH regulates other aspects of BC progression, MDA-MB-231 NTC
and PHGDH knockdown subclones were implanted in the MFP of NSG mice and the resulting tumors
were harvested on day 35. PHGDH knockdown was associated with a significant increase in tumor
mass after orthotopic transplantation of sh2 and sh4 cells (Fig. 7A), which was consistent with cell
culture data demonstrating increased growth of the sh2 and sh4 (as well as sh3 and sh5) PHGDH-
knockdown subclones in vitro (Supplementary Fig. 3A). The tumors analyzed in Fig. 7A were derived
from the injection of 2x10⁶ cells; under these conditions, BCSCs are not limiting for primary tumor
formation. PHGDH knockdown was associated with an increased percentage of MitoSOX+ cells (Fig.
7B) and decreased BCSCs as determined by Aldefluor (Fig. 7C) and mammosphere (Fig. 7D) assays.
Immunohistochemistry revealed PHGDH expression in perinecrotic (hypoxic) regions of NTC tumors
but not in knockdown tumors (Fig. 7E).
To determine whether PHGDH is required for spontaneous metastasis from breast to lungs,
MDA-MB-231 subclones (2×10⁶ cells) were again injected into the MFP of female NSG mice. To take
into account differences in primary tumor growth, tumors and lungs were isolated when primary
tumors reached a volume of 1000 mm3. Despite growing faster, PHGDH knockdown tumors did not
14
generate lung metastases, whereas in mice bearing NTC tumors, metastatic cells occupied large
areas of the lung parenchyma (Fig. 7F).
To investigate whether PHGDH promotes the tumor-initiating potential of BC cells, we injected
only 1×10³ cells into the MFP of female SCID mice, so that BCSCs would be limiting for tumor
formation. NTC cells formed tumors by day 71 after injection in 7 out of 7 injected mice, whereas sh2
and sh4 cells each formed tumors in only 3 out of 7 mice (Fig. 7G). PHGDH mRNA levels in
knockdown tumors were significantly less than in NTC tumors (Fig. 7H).
Analysis of SSP and 1CM expression in primary human BCs
To investigate the clinical relevance of our experimental findings, we mined gene expression
databases. We first investigated whether expression of mRNA encoding SSP and mito1CM enzymes,
either individually or in aggregate (designated S1C), was correlated with the HIF signature, which
comprised expression of HIF-1α mRNA and 13 HIF target-gene mRNAs (PLOD1, VEGFA, LOX,
P4HA2, NDRG1, SLC2A1, ERO1L, ADM, LDHA, PGK1, ANGPTL4, SLC2A3, and CA9), in 1,215
breast cancer specimens (31, 32) using Pearson’s correlation test. For each of the 6 mRNAs
encoding an SSP or mito1CM enzyme, expression was significantly correlated with the HIF signature
(P < 0.0001 in each case; Fig. 7I). These results are consistent with the data obtained from BC cell
lines demonstrating that hypoxia-induced expression of these genes is HIF-dependent (Fig. 1 and 2).
Analysis of the GOBO database (33) revealed that S1C gene expression increased significantly (P <
0.00001) with increasing tumor grade (Supplementary Fig. S6A). Analysis of PHGDH or S1C mRNA
expression in > 3,500 human BC specimens using KM Plotter (34) revealed that levels greater than
the median were associated with decreased relapse-free survival (hazard ratio [HR] = 1.34 and P <
10−7 for PHGDH; HR = 1.74 and P < 10-16 for S1C; Fig. 7J). Greater-than-median expression of
SHMT2 or MTHFD2, but not PSAT1 or PSPH, was also associated with a significant decrease in
relapse-free survival (Supplementary Fig. S6B). Thus, expression of SSP and mito1CM mRNAs in
primary BCs is HIF-regulated and predictive of patient mortality.
15
Discussion Recent studies have attempted to determine the mechanisms and consequences of PHGDH
enzyme expression in BC, but these studies have focused on cell proliferation in vitro or primary
tumor growth in vivo (25, 26). Here, we demonstrate that hypoxia induces expression of PHGDH and
other SSP and mito1CM enzymes that is mediated by HIF-1 and HIF-2. This coordinate regulation of
multiple genes provides a mechanism to increase flux through the pathway. The expression of at least
four out of six genes encoding SSP/mito1CM enzymes was induced by hypoxia in each of the cell
lines analyzed, which included representative lines derived from ER+, HER2+, and triple-negative BCs.
PHGDH and SHMT2 expression was hypoxia-induced in all six BC lines and was increased in BCSC-
enriched cell populations. In addition, increased expression in primary BCs of mRNA encoding
PHGDH, SHMT2, MTHFD2 or all six SSP/mito1CM enzymes was associated with HIF target-gene
expression and an increased risk of patient mortality. Regulation of PHGDH, PSAT1, PSPH, SHMT1,
and SHMT2 expression by the transcription factors NRF2 and ATF4 in lung cancer and MYC in liver
cancer was recently reported (45, 46). Further studies are required to determine whether ATF4 or
MYC regulates basal expression of these genes in BC.
We studied the consequences of PHGDH deficiency because of its role as the first enzyme in
the SSP that is responsible for diverting glucose metabolites from the EMP and because the finding of
PHGDH gene amplification in 6% of primary BCs suggested a critical role for this enzyme in BC
progression. Our data suggest that a major determinant of increased PHGDH expression in BCs
without gene amplification is intratumoral hypoxia, which is a common finding in advanced BC (8).
The correlation between expression of PHGDH and HIF target genes in primary BCs strongly
supports this conclusion. Similar to PHGDH, SHMT2 expression was induced by hypoxia in all BC
lines studied and SHMT2 overexpression in BCs was associated with patient mortality, suggesting
that SHMT2 is also important for BC progression. The expression of SHMT2 is induced by hypoxia in
16
neuroblastoma cells and SHMT2 knockdown was shown to increase ROS levels and cell death under
hypoxic conditions, but effects on cancer stem cells and metastasis were not studied (47). These
findings point to the importance of coordinate, HIF-mediated regulation of SSP and mito1CM enzyme
expression, and suggest that this metabolic requirement is not limited to BC.
Metabolic analyses revealed that both ER+ and ER- BC cells divert a considerable proportion
of glucose-derived 3-phosphoglyceric acid to the SSP, as PHGDH knockdown led to significantly
increased oxidative and glycolytic metabolism under non-hypoxic conditions. Consistent with these
findings, metabolomic analyses revealed that PHGDH knockdown led to increased concentrations of
EMP intermediates downstream of and including 3-phosphoglyceric acid, the substrate for PHGDH.
Gene expression and clinical outcome data from thousands of BCs suggest that this metabolic
reprogramming is not limited to tissue culture cells. The orthotopic transplantation studies provide
evidence that PHGDH expression is a major determinant of BCSC abundance and metastasis.
Our data indicate that PHGDH expression is critical under hypoxic conditions to increase the
availability of reduced glutathione for maintenance of redox homeostasis. In PHGDH knockdown
subclones, NADPH levels were decreased and mitochondrial ROS levels increased under hypoxic
conditions, leading to increased apoptosis compared to NTC subclones. Gene expression and
metabolomic studies revealed increased expression of the first enzyme of the SSP and mito1CM
(PHGDH and SHMT2) and repression of the first enzyme of the PPP (G6PD) in hypoxic BC cells,
indicating a switch from cytosolic to mitochondrial production of NADPH in order to combat increased
ROS generated by the electron transport chain (23). Thus, under hypoxic conditions, HIFs mediate a
metabolic switch from oxidative to glycolytic metabolism, which reduces mitochondrial oxidant
generation (18), and a switch from cytosolic to mitochondrial NADPH generation, which augments
antioxidant defenses. The increase in NADPH complements increased glutathione synthesis, which is
also induced in hypoxic BC cells by HIF-1 (7, 48).
PHGDH knockdown reduced the number of BCSCs under both non-hypoxic and hypoxic
conditions in vitro and within orthotopic tumors. The functional consequences of this loss of BCSCs
17
included impaired capacity for tumor initiation and lung metastasis. We interpret the previously
reported failure of PHGDH knockdown cells to form tumor xenografts (25) as due to a deficiency of
BCSCs rather than an effect on cell proliferation, which we did not observe in vitro or in vivo. Similarly,
the loss of metastatic capacity we demonstrated is likely due, at least in part, to a deficiency of
BCSCs (49, 50).
PHGDH knockdown sensitized both ER+ and ER- BC lines to chemotherapy, with increased
mitochondrial ROS, increased apoptosis, and loss of chemotherapy-induced BCSC enrichment.
These findings suggest that combining chemotherapy with an inhibitor of PHGDH may improve the
survival of women with advanced BC by blocking counter-therapeutic induction of BCSCs. HIF
inhibitors may be useful to target BCSCs because, in addition to blocking induction of SSP and
mito1CM enzymes, they block multiple other pathways, which are induced by hypoxia (13, 14) or
chemotherapy (6, 7) and which promote BCSC specification or maintenance. Our findings underscore
the importance of adaptive responses to the hypoxic tumor microenvironment and to chemotherapy,
whereby cancer cells maintain metabolic and redox homeostasis, which is required for execution of
the BCSC and metastatic programs that underlie the lethal cancer phenotype.
Acknowledgments
We thank Haiquan Lu for helpful comments and Karen Padgett (Novus Biologicals) for
providing IgG and antibodies against PHGDH, PSAT1, PSPH, and Annexin V. G.L.S. is an American
Cancer Society Research Professor and the C. Michael Armstrong Professor at Johns Hopkins
University School of Medicine.
18
References
1. Al-Hajj M, Wicha M, Benito-Hernandez A, Morrison S, Clarke M. Prospective identification of tumorigenic breast cancer cells. Proc Natl Acad Sci U S A 2003;100:3983-8.
2. Charafe-Jauffret E, Ginestier C, Iovino F, Wicinski J, Cervera N, Finetti P, et al. Breast cancer cell lines contain functional cancer stem cells with metastatic capacity and a distinct molecular signature. Cancer Res 2009;69:1302-13.
3. Li X, Lewis MT, Huang J, Gutierrez C, Osborne CK, Wu MF, et al. Intrinsic resistance of tumorigenic breast cancer cells to chemotherapy. J Natl Cancer Inst 2008;100:672-9. 4. Creighton CJ, Li X, Landis M, Dixon JM, Neumeister VM, Sjolund A, et al. Residual breast cancers after conventional therapy display mesenchymal as well as tumor-initiating features. Proc Natl Acad Sci U S A 2009;106:13820-5.
5. Bhola NE, Balko JM, Dugger TC, Kuba MG, Sanchez V, Sanders M, et al. TGF-β inhibition enhances chemotherapy action against triple-negative breast cancer. J Clin Invest 2013;123:1348-58.
6. Samanta D, Gilkes DM, Chaturvedi P, Xiang L, Semenza GL. Hypoxia-inducible factors are required for chemotherapy resistance of breast cancer stem cells. Proc Natl Acad Sci U S A 111:E5429-38.
7. Lu H, Samanta D, Xiang L, Zhang H, Hu H, Chen I, et al. Chemotherapy triggers HIF-1- dependent glutathione synthesis and copper chelation that induces the breast cancer stem cell phenotype. Proc Natl Acad Sci U S A 2015;112:E4600-9.
8. Harris AL. Hypoxia – a key regulatory factor in tumor growth. Nat Rev Cancer 2002;2:38-74.
9. Sullivan R, Graham CH. Hypoxia-driven selection of the metastatic phenotype. Cancer Metastasis Rev 2007;26:319-31.
10. Conley SJ, Gheordunescu E, Kakarala P, Newman B, Korkaya H, Heath AN, et al. Antiangiogenic agents increase breast cancer stem cells via the generation of tumor hypoxia. Proc Natl Acad Sci U S A 2012;109:2784-9.
11. Schwab LP, Peacock DL, Majumdar D, Ingels JF, Jensen LC, Smith KD, et al. Hypoxia- inducible factor 1α promotes primary tumor growth and tumor-initiating cell activity in breast cancer. Breast Cancer Res 2012;14:R6.
12. Regan Anderson TM, Peacock DL, Daniel AR, Hubbard GK, Lofgren KA, Girard BJ, et al. Breast tumor kinase (Brk/PTK6) is a mediator of hypoxia-associated breast cancer progression. Cancer Res 2013;73:5810-20.
13. Xiang L, Gilkes DM, Hu H, Takano N, Luo W, Lu H, et al. Hypoxia-inducible factor 1 mediates TAZ expression and nuclear localization to induce the breast cancer stem cell phenotype. Oncotarget 2014;5:12509-27.
14. Zhang C, Samanta D, Lu H, Bullen JW, Zhang H, Chen I, et al. Hypoxia induces the breast cancer stem cell phenotype by HIF-dependent and ALKBH5-mediated m6A-demethylation of NANOG mRNA. Proc Natl Acad Sci U S A 2016;113:E2047-56.
19
15. Semenza GL. The hypoxic tumor microenvironment: A driving force for breast cancer progression. Biochim Biophys Acta 2016;1863:379-81.
16. Iyer NV, Kotch LE, Agani F, Leung SW, Laughner E, Wenger RH, et al. Cellular and developmental control of O2 homeostasis by hypoxia-inducible factor 1α. Genes Dev 1998;12:149-62.
17. Seagroves TN, Ryan HE, Lu H, Wouters BG, Knapp BG, Thibault P, et al. Transcription factor HIF-1 is a necessary mediator of the Pasteur effect. Mol Cell Biol 2001;21:3436-44.
18. Kim JW, Tchernyshyov I, Semenza GL, Dang CV. HIF-1-mediated expression of pyruvate dehydrogenase kinase: a metabolic switch required for cellular adaptation to hypoxia. Cell Metab 2006;3:177-85. 19. Papandreou I, Cairns RA, Fontana L, Lim AL, Denko NC. HIF-1 mediates adaptation to hypoxia by actively downregulating mitochondrial oxygen consumption. Cell Metab 2006;3:187-97.
20. Huang D, Li T, Li X, Zhang L, Sun L, He X, et al. HIF-1-mediated suppression of acyl-CoA dehydrogenases and fatty acid oxidation is critical for cancer progression. Cell Rep. 2014;8:1930-42.
21. Zhang H, Bosch-Marcé M, Shimoda LA, Tan YS, Baek JH, Wesley JB, et al. Mitochondrial autophagy is an HIF-1-dependent adaptive metabolic response to hypoxia. J Biol Chem 2008;283:10892-903.
22. Bellot G, Garcia-Medina R, Gounon P, Chiche J, Roux D, Pouysségur J, et al. Hypoxia- induced autophagy is mediated through hypoxia-inducible factor induction of BNIP3 and BNIP3L via their BH3 domains. Mol Cell Biol 2009;29:2570-81.
23. Chandel NS, McClintock DS, Feliciano CE, Wood TM, Melendez JA, Rodriguez AM, et al. Reactive oxygen species generated at mitochondrial complex III stabilize hypoxia-inducible factor-1α during hypoxia: a mechanism of O2 sensing. J Biol Chem 2000;275:25130-8.
24. Schumacker PT. Reactive oxygen species in cancer: a dance with the devil. Cancer Cell 2015;27:156-7.
25. Possemato R, Marks KM, Shaul YD, Pacold ME, Kim D, Birsoy K, et al. Functional genomics reveal that the serine synthesis pathway is essential in breast cancer. Nature 2011;476:346- 50.
26. Locasale JW, Grassian AR, Melman T, Lyssiotis CA, Mattaini KR, Bass AJ, et al. Phosphoglycerate dehydrogenase diverts glycolytic flux and contributes to oncogenesis. Nat Genet 2011;43:869-74.
27. Suda T, Takubo S, Semenza GL. Metabolic regulation of hematopoietic stem cells in the hypoxic niche. Cell Stem Cell 2011:9:298-310.
28. Zhang H, Wong CC, Wei H, Gilkes DM, Korangath P, Chaturvedi P, et al. HIF-1-dependent expression of angiopoietin-like 4 and L1CAM mediates vascular metastasis of hypoxic breast cancer cells to the lungs. Oncogene 2012:31:1757-70.
20
29. Soga T, Ohashi Y, Ueno Y, Naraoka H, Tomita M, Nishioka T. Quantitative metabolome analysis using capillary electrophoresis mass spectrometry. J Proteome Res 2003;2:488–94.
30. Sugimoto M, Wong DT, Hirayama A, Soga T, Tomita M. Capillary electrophoresis mass spectrometry-based saliva metabolomics identified oral, breast and pancreatic cancer–specific profiles. Metabolomics 2009;6:78–95.
31. Goldman M, Craft B, Swatloski T, Ellrott K, Cline M, Diekhans M, et al. The UCSC Cancer Genomics Browser: update 2013. Nucleic Acids Res 2013;41(Database issue):D949-54.
32. Cancer Genome Atlas Network. Comprehensive molecular portraits of human breast tumors. Nature 2012;490: 61-70.
33. Ringnér M, Fredlund E, Häkkinen J, Borg Å, Staaf J. GOBO: Gene expression based outcome for breast cancer online. PLoS One 2011;6:e17911.
34. Györffy B, Lanczky A, Eklund AC, Denkert C, Budczies J, Li Q, et al. An online survival analysis tool to rapidly assess the effect of 22,277 genes on breast cancer prognosis using microarray data of 1,809 patients. Breast Cancer Res Treat 2010;123:725-31.
35. Neve RM, Chin K, Fridlyand J, Yeh J, Baehner FL, Fevr T, et al. A collection of breast cancer cell lines for the study of functionally distinct cancer subtypes. Cancer Cell 2006;10:515-27.
36. Lee K, Zhang H, Qian DZ, Rey S, Liu JO, Semenza GL. Acriflavine inhibits HIF-1 dimerization, tumor growth, and vascularization. Proc Natl Acad Sci U S A 2009;106:17910-5.
37. Ginestier C, Hur MH, Charafe-Jauffret E, Monville F, Dutcher J, Brown M, et al. ALDH1 is a marker of normal and malignant human mammary stem cells and a predictor of poor clinical outcome. Cell Stem Cell 2007;1:555-67.
38. Ponti D, Costa A, Zaffaroni N, Pratesi G, Petrangolini G, Coradini D, et al. Isolation and in vitro propagation of tumorigenic breast cancer cells with stem/progenitor cell properties. Cancer Res 2005;65:5506-11.
39. Gardner PR, Nguyen DD, White CW. Superoxide scavenging by Mn(II/III) tetrakis (1-methyl-4- pyridyl) porphyrin in mammalian cells. Arch Biochem Biophys 1996;325:20-8.
40. Doroshow JH. Redox modulation of chemotherapy-induced tumor cell killing and normal tissue toxicity. J Natl Cancer Inst 2006;98:223-5.
41. Perez EA. Carboplatin in combination therapy for metastatic breast cancer. Oncologist 2004; 9:518-27. 42. Wang H, Li M, Rinehart JJ, Zhang R. Pretreatment with dexamethasone increases antitumor activity of carboplatin and gemcitabine in mice bearing human cancer xenografts: in vivo activity, pharmacokinetics, and clinical implications for cancer chemotherapy. Clin Cancer Res. 2004;10:1633-44. 43. Marullo R, Werner E, Degtyareva N, Moore B, Altavilla G, Ramalingam SS, et al. Cisplatin induces a mitochondrial-ROS response that contributes to cytotoxicity depending on mitochondrial redox status and bioenergetic functions. PLoS One 2013;8:e81162.
21
44. Cao Y, Eble JM, Moon E, Yuan H, Weitzel DH, Landon CD et al. Tumor cells upregulate normoxic HIF-1α in response to doxorubicin. Cancer Res 2013;73:6230-42. 45. DeNicola GM, Chen PH, Mullarky E, Sudderth JA, Hu Z, Wu D, et al. NRF2 regulates serine biosynthesis in non-small cell lung cancer. Nat Genet 2015;47:1475-81.
46. Sun L, Song L, Wan Q, Wu G, Li X, Wang Y, et al. cMyc-mediated activation of serine biosynthesis pathway is critical for cancer progression under nutrient deprivation conditions. Cell Res. 2015;25:429-44.
47. Ye J, Fan J, Venneti S, Wan YW, Pawel BR, Zhang J, et al. Serine catabolism regulates mitochondrial redox control during hypoxia. Cancer Discov 2014;4:1406-17.
48. Harris IS, Treloar AE, Inoue S, Sasaki M, Gorrini C, Lee KC, et al. Glutathione and thioredoxin antioxidant pathways synergize to drive cancer initiation and progression. Cancer Cell 2002;27:211-22.
49. Brooks MD, Burness ML, Wicha MS. Therapeutic implications of cellular heterogeneity and plasticity in breast cancer. Cell Stem Cell 2015;17:260-71.
50. Oskarsson T, Batlle E, Massagué J. Metastatic stem cells: sources, niches, and vital pathways. Cell Stem Cell 2014;14:306-21.
22
Figure Legends
Figure 1.
Hypoxia induces expression of mRNAs encoding SSP and mito1CM enzymes. A, enzymatic
reactions. Glucose-derived 3-phosphoglycerate is metabolized to glycine and NADP+ is reduced to
NADPH through the activity of SSP (blue) and mito1CM (purple) enzymes. B, mRNA expression.
Breast cancer cell lines were exposed to 20% or 1% O2 for 24 hours and expression of mRNAs
encoding SSP and 1CM enzymes were analyzed by RT-qPCR. The expression of each mRNA was
quantified relative to 18S rRNA and then normalized to the result obtained from MDA-MB-231 (MDA-
231) cells at 20% O2 (mean ± SEM; n = 3). C, summary of mRNA expression data (columns) in breast
cancer cell lines (rows). Red, significantly increased expression at 1% as compared to 20% O2 (P <
0.001; Student’s t test); gray, no induction at 1% O2.
Figure 2.
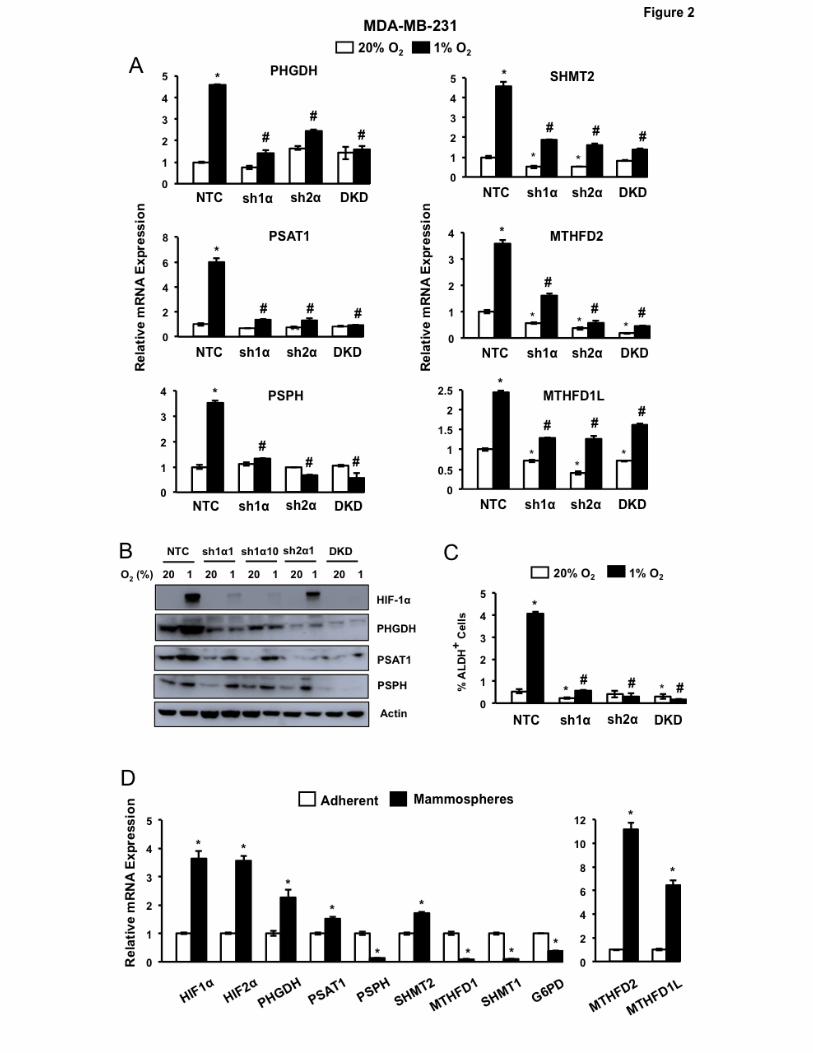
SSP and mito1CM expression is HIF-dependent and increased in BCSCs. A, analysis of mRNA
expression in MDA-MB-231 subclones, which expressed a non-targeting control shRNA (NTC) or
shRNA targeting HIF-1α (sh1α), HIF-2α (sh2α), or both HIF-1α and HIF-2α (DKD), and were exposed
to 20% or 1% O2 for 24 hours. Data were normalized to NTC at 20% O2 (mean ± SEM; n = 3). *P <
0.01 vs. NTC at 20% O2; #P < 0.001 vs. NTC at 1% O2. B, immunoblot assays of lysates prepared
from MDA-MB-231 subclones, which were exposed to 20% or 1% O2 for 48 hours. C, Aldefluor assay
of MDA-MB-231 subclones exposed to 20% or 1% O2 for 72 hours. The percentage of cells
expressing aldehyde dehydrogenase (ALDH+) was determined (mean ± SEM; n = 3). *P < 0.05, **P <
0.01 vs. NTC at 20% O2; #P < 0.01 vs. NTC at 1% O2. D, analysis of gene expression in adherent
monolayers and mammospheres. MDA-MB-231 cells were cultured on standard or ultra-low
23
adherence plates for 7 days in 20% O2 and adherent cells and mammospheres, respectively, were
harvested for RT-qPCR analyses. Results were normalized to adherent cells (mean ± SEM; n = 3).
*P < 0.001 vs. adherent cells (Student’s t test).
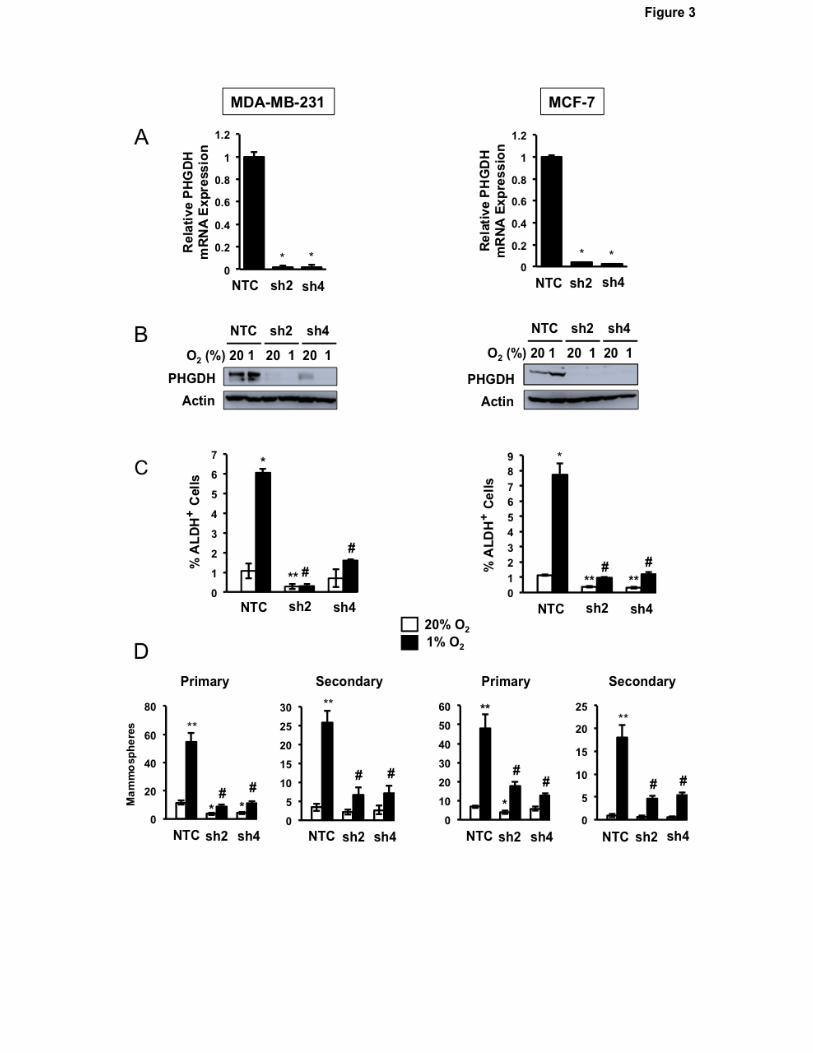
Figure 3.
Decreased PHGDH expression and hypoxia-induced BCSC enrichment in knockdown subclones. A
and B, analysis of PHGDH expression. Subclones of MDA-MB-231 (left) and MCF-7 (right) expressing
NTC shRNA or either of two different shRNAs targeting PHGDH (sh2 and sh4) were exposed to 20%
or 1% O2 for 24 (A) or 48 (B) hours and analyzed for expression of PHGDH mRNA by RT-qPCR
assay (A) and PHGDH protein by immunoblot assay (B). RNA data were normalized to NTC (mean ±
SEM; n = 3). *P < 0.001 vs. NTC. C, Aldefluor assay. Subclones were exposed to 20% or 1% O2 for
72 hours and the percentage of ALDH+ cells was determined by flow cytometry (mean ± SEM; n = 3).
*P < 0.01, **P < 0.001 versus NTC at 20% O2; #P < 0.001 versus NTC at 1% O2. D, mammosphere
assays. Subclones were exposed to 20% or 1% O2 for 72 hours, transferred to ultra-low attachment
plates, and 7 days later the number of primary mammospheres per field was counted (mean ± SEM; n
= 3). Primary mammospheres were collected, dissociated, transferred to ultra-low attachment plates,
and secondary mammospheres were counted 7 days later (mean ± SEM; n = 3). *P < 0.01, **P <
0.001 vs. NTC at 20% O2; #P < 0.001 vs. NTC at 1% O2.
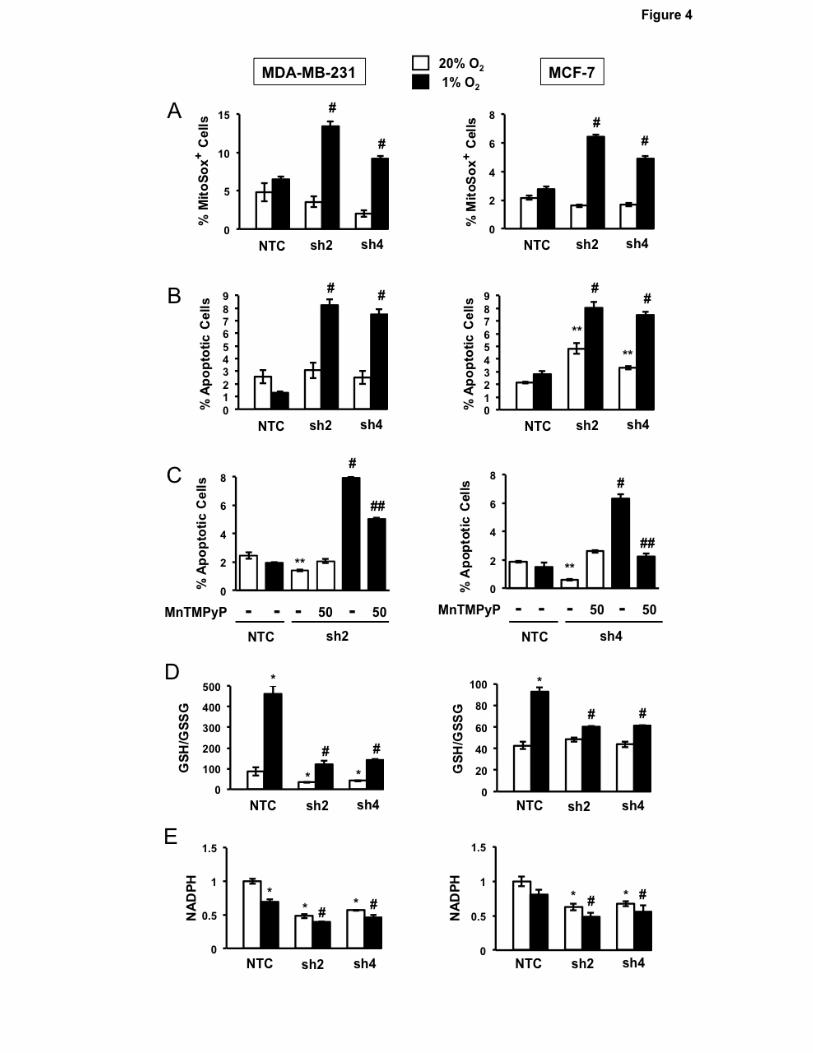
Figure 4.
Effect of PHGDH knockdown on redox homeostasis and cell survival. A, analysis of mitochondrial
ROS production. MDA-MB-231 (left) and MCF-7 (right) subclones were exposed to 20% or 1% O2 for
72 hours and the percentage of cells positive for MitoSOX Red fluorescence was determined by flow
24
cytometry (mean ± SEM; n = 3). #P < 0.001 vs. NTC at 1% O2. B, analysis of apoptosis. The
subclones were exposed to 20% or 1% O2 for 72 hours and the percentage of Annexin V+ and 7-AAD-
apoptotic cells was determined (mean ± SEM; n = 3). **P < 0.001 vs. NTC at 20% O2; #P < 0.001 vs.
NTC at 1% O2. C, rescue by ROS scavenger. The subclones were exposed to 20% or 1% O2 in the
presence or absence of 50 µM MnTMPyP for 72 hours and the percentage of Annexin V+/7-AAD-
apoptotic cells was determined (mean ± SEM; n = 3). **P < 0.001 vs. NTC at 20% O2; #P < 0.001 vs.
NTC at 1% O2; ##P < 0.001 vs. no MnTMPyP. D and E, subclones were exposed to 20% or 1% O2 for
72 hours and the GSH/GSSG ratio (D) and NADPH levels (E) were measured and normalized to NTC
at 20% O2 (mean ± SEM; n = 3). *P < 0.01 vs. NTC at 20% O2; #P < 0.001 vs. NTC at 1% O2.
Figure 5.
Metabolic consequences of PHGDH knockdown. A and B, measurement of oxygen consumption rate
(OCR) and extracellular acidification rate (ECAR). OCR (A; mean ± SEM; n = 3) and ECAR (B; mean
± SEM; n = 3) were measured in MCF-7 and MDA-MB-231 subclones incubated at 20% O2 for 72
hours. *P < 0.001 vs. MCF-7 NTC; **P < 0.001 vs. MDA-MB-231 NTC. C, analysis of glucose uptake.
Subclones cultured under 20% O2 were stained with 150 µM 2-[N-(7-nitrobenz-2-oxa-1,3-diazol-4-yl)
amino]-2-deoxy-D-glucose and the mean fluorescence intensity was determined by flow cytometry
(mean ± SEM; n = 3). D-K, metabolomic data. MDA-MB-231 subclones were exposed to 20% or 1%
O2 for 72 hours and the absolute concentrations of extracellular (D and E) and intracellular (F-K)
metabolites were determined by MS using reference standards (mean ± SEM; n = 3). *P < 0.001 vs.
NTC at 20% O2; #P < 0.001 vs. NTC at 1% O2. L, glucose (Glc) metabolic pathways. Embden-
Meyerhof (main) pathway, pentose phosphate pathway (PPP; only first reaction is shown), and serine
synthesis pathway (SSP) are shown in abbreviated form that omits the five enzymatic reactions
between glucose-6-phosphate (G6P) and 3PG, and the three reactions between 3PG and Ser.
25
Figure 6.
Effect of PHGDH knockdown on the response to chemotherapy. A-C, response to chemotherapy in
vitro. MDA-MB-231 (left) and MCF-7 (right) subclones were exposed vehicle or carboplatin for 72 hr at
IC50 (75 µM for MDA-MB-231 and 200 µM for MCF-7) and the percentage of MitoSox Red+ (A),
apoptotic (B), and ALDH+ (C) cells was determined (mean ± SEM; n = 3). *P < 0.01 vs NTC at 20%
O2; #P < 0.001 vs. NTC at 1% O2. D-G, response to chemotherapy in vivo. MDA-MB-231 subclones
were implanted into the mammary fat pad of female NSG mice. When tumor volume reached 200
mm3 (day 0), the mice were randomly assigned to receive intraperitoneal injections of saline (Vehicle)
or carboplatin (15 mg/kg) on days 0, 5, and 10. Tumors were harvested on day 13, and samples were
analyzed for the percentage of MitoSOX+ (D), apoptotic (E), and ALDH+ (F) cells and the number of
mammosphere-forming cells (G). Data are presented as mean ± SEM (n = 3). *P < 0.01 vs. vehicle-
treated NTC; #P < 0.01 vs. carboplatin-treated NTC.
Figure 7.
Effect of PHGDH knockdown on orthotopic tumor initiation and metastasis, and clinical correlates. A-
F, analysis of primary tumors and metastases. MDA-MB-231 subclones (2 x 10⁶ cells) were implanted
in the mammary fat pad (MFP) of female NSG mice. After 35 days, the tumors and lungs were
harvested. Tumor mass was determined (A) and tumor tissue was dissociated for analysis of
MitoSOX+ (B), ALDH+ (C), and mammosphere-forming (D) cells (mean ± SEM, n = 3). *P < 0.01 vs.
NTC. Tumor tissue was sectioned for PHGDH immunohistochemistry (E; scale bar, 200 μm; N,
necrosis). Lung sections (2 × 2 mm) were stained with hematoxylin and eosin to identify metastasis in
three mice (M1, M2, M3), each bearing 1000-mm3 tumors derived from NTC or PHGDH knockdown
cells (F). G and H, analysis of tumor-initiating capacity. MDA-MB-231 subclones were implanted in the
26
MFP of female SCID mice (1x10³ cells per mouse, 7 mice per subclone). Mice were scored for
palpable tumors after 71 days. *P < 0.05 vs. NTC, Chi-squared test (G). RNA was extracted from
those tumors that formed, PHGDH mRNA levels were determined, and results were normalized to
NTC (mean ± SEM; n = 3); *p < 0.01 vs. NTC (H). I, analysis of gene expression data from human
primary breast cancers. Pearson’s correlation test was performed to compare expression of the HIF
signature with expression of the six SSP/mito1CM mRNAs in aggregate (S1C) or individually using
data from 1,215 breast cancer samples. *P < 0.0001, two-tailed t test. J, correlation of gene
expression with patient mortality. Kaplan–Meier analyses of relapse-free survival over ten years were
performed using data for 3,554 breast cancer patients, who were stratified by PHGDH (left) or S1C
(right) mRNA expression levels in the primary tumor, which were greater (red) or less (black) than the
median level. The hazard ratio (HR) and P value (log-rank test) for each comparison are shown.