philippines biofuels annual philippine biofuels situation ... · 11/28/2018 · biodiesel...
TRANSCRIPT

1
THIS REPORT CONTAINS ASSESSMENTS OF COMMODITY AND TRADE ISSUES MADE
BY USDA STAFF AND NOT NECESSARILY STATEMENTS OF OFFICIAL U.S.
GOVERNMENT POLICY
Required Report - public distribution
Date: 11/28/2018
GAIN Report Number: RP 1840
Philippines
Biofuels Annual
Philippine Biofuels Situation and Outlook
Approved By:
Ryan Bedford
Prepared By:
Perfecto Corpuz
Report Highlights:
Ethanol production using sugarcane and molasses in 2018 is expected to increase to 270 million
liters (ML) from 235 ML the previous year as aggregate capacity increases. Blending peaked at 10
percent in 2014 but declined to just over 9 percent in recent years, and will further drop in 2018 due
to new taxes on petroleum fuels and motor vehicle sales. For biodiesel, consumption growth is
driven by increased diesel use since 2009 with the blend rate peaking at 2.8 percent in 2016 due to
increased motor vehicle sales. The planned 5 percent blend in 2015 has not happened due to high
coconut oil prices relative to petroleum fuel. The Philippine Department of Energy, in its latest
energy plan has recommended maintaining the current ethanol and biodiesel blends (10 and 2
percent, respectively) through 2019, and revisit blend targets through 2040 due to feedstock
concerns and pricing.
2
Post:
Manila
Executive Summary:
Signed in January 2007, the Biofuels Act or Republic Act (RA) 9367 makes the Philippines the
first country in Southeast Asia to have biofuels legislation in place. Sugarcane and molasses are
used in Philippine ethanol production, while coconut oil (CNO) is the preferred biodiesel
feedstock. The current official blend mandates are 10 percent (E10) and 5 percent (B5) for
ethanol and biodiesel, respectively. However, the actual rates are lower, particularly for
biodiesel. The Biofuels Act gives priority to local ethanol over imports, but the mandated blend
historically has largely been met through the latter. Biodiesel imports are not allowed under the
Biofuels Act.
In 2017, there were 10 fuel ethanol plants operating with a combined capacity of 282 ML,
unchanged from 2016. Two additional plants commissioned in 2018 raised aggregate capacity to
365 million liters. Despite the increased capacity, however, local ethanol production will still be
insufficient to meet the 10 percent mandate.
A quota allocation system for local ethanol makes the country one of the most open economies
for ethanol imports. In 2017, the Philippines was the fourth largest market for U.S. ethanol with
sales valued at over $101 million, marginally lower than the $103 million level in 2016. In terms
of volume, however, imports from the United States increased 7 percent from 217 ML in 2016 to
232 ML in 2017 due to fairly flat local production.
For biodiesel, imports are prohibited and there have been no exports due to traditionally high
CNO prices. Biodiesel consumption is met by purely by local production, which has consistently
supplied the one percent blend set in 2007 and the 2 percent blend (B2) requirements since 2009.
Not implemented was a B5 blend in 2015 due to high CNO prices and therefore, the high cost of
biodiesel compared to fossil fuel. In 2017, 11 refineries produced 220 ML, which amounted to an
estimated 2.5 percent blend level. Capacity utilization was only at 38 percent of total aggregate
capacity of 575 ML in 2017.
Set in 2012, the Philippine government’s (GPH) aspirational goal was to raise the biofuels blend
to E20 and B10 by 2020. However, inadequate investments in new biofuel plants and distribution
infrastructure, and inadequate tax policy and other support favoring biofuels over fossil fuel
consumption is forcing the GPH to review its plans and targets. This is embodied in the
Philippine Department of Energy’s (DOE) Philippine Energy Plan (PEP) 2017-2040 which
recommends maintaining the current blend targets, i.e., E10 and B5, through 2019, and revisiting
biofuels blends and feedstock availability (while continuing biofuels feedstock research and
development programs) in the medium- to long-term. The review is made more vital given the
enactment of a tax reform measure that imposes higher excise taxes on petroleum fuels as well as
on new motor vehicle sales starting 2018.
While the new taxes will dampen overall fuel use, the gasoline and diesel pools are still expected to
expand in the near term due to the continued growth of the Philippine economy and increasing motor
3
vehicle sales. Ethanol imports are likely to account for roughly half of increasing overall demand in
the next 3-5 years due to inadequate capacity.
For biodiesel, local coconut production can barely satisfy the strong domestic and international
demand for CNO and other coconut products. Increasing current CNO production will remain a big
challenge without a massive coconut tree-planting program. It will take roughly 10-15 years before
these trees become commercially productive, or about the time advanced biofuels (i.e. commercial
cellulosic fuel) are developed for biodiesel production. In the meantime, with biodiesel imports
banned, the blend rate cannot be substantially raised and the benefits of its use to the environment
and consequently human health will remain unrealized over the next decade.
II. Policy and Programs
RA 9367 makes the Philippines the first country in Southeast Asia to legislate the blending of
biofuels in all petroleum fuels. It seeks to develop indigenous renewable energy (RE) to reduce
dependence on imported oil; mitigate greenhouse gas emissions; increase rural employment; and
ensure the availability of RE without detriment to the environment and food security.
Implemented in June 2007, RA 9367 provides fiscal incentives to biofuels producers and
distributors including income tax holidays, duty-free importation, value added tax (VAT)
exemptions, among others.
Although the Department of Environment and Natural Resources (DENR) has no specific
mandate provided by RA 9367, the DOE must ensure that standards and guidelines for biofuels
(as well as biofuel-blended gasoline and diesel) must be compliant with Philippine National
Standards. In addition, the Biofuels Act provides that water effluents used in production shall
conform to the Philippine Clean Water Act, subject to the monitoring and evaluation of the
DENR.
The Renewable Energy Act or RA 9513 was passed in 2008. The country then was the world’s
second largest producer of geothermal energy and the first country in Southeast Asia to establish
a commercial wind farm and a grid-connected solar photovoltaic power plant. President Duterte
signed the Paris Agreement on Climate Change in February 2017. The Philippines has
committed to reduce its greenhouse gas emissions by 70 percent by 2030 but needs technical and
financial support. The GPH aims to have renewable energy capacity installed to 20,000 MW by
2040.
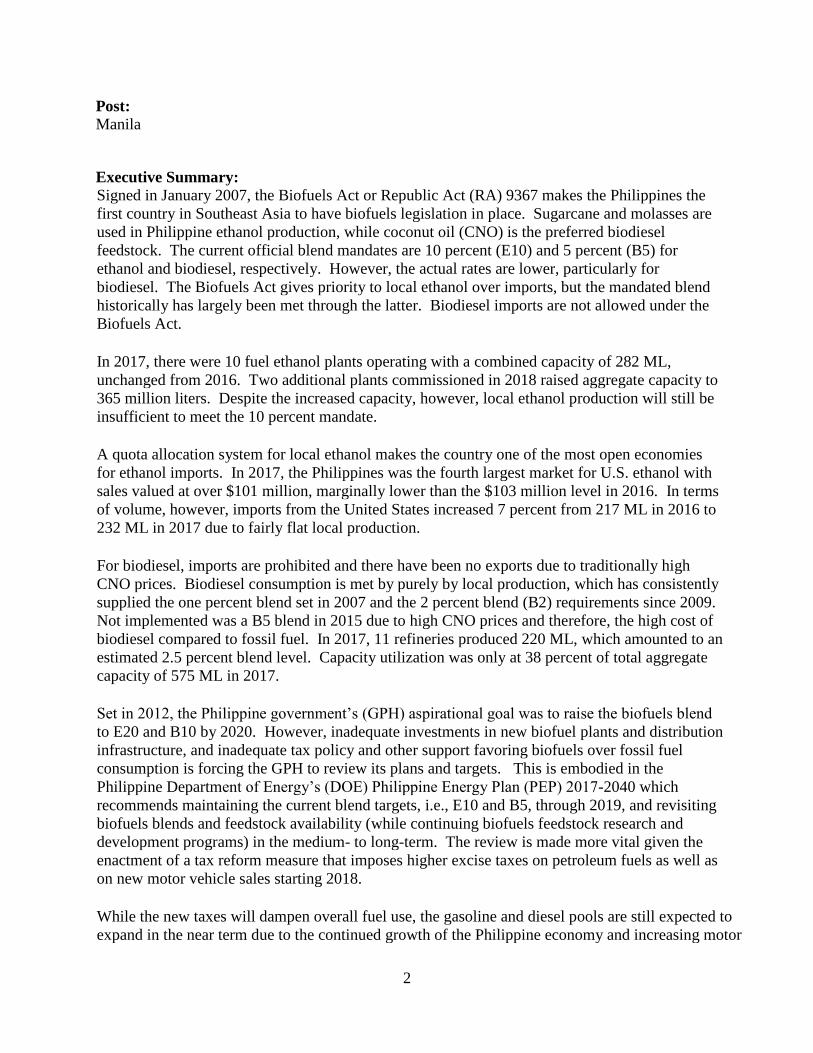
The DOE’s PEP is the basis of the country’s biofuels strategy expressed in the National Biofuels
Plan (NBP). The PEP and the NBP are ‘living documents’ and regularly reviewed and adjusted.
Following is a diagram of the Biofuels Roadmap in the latest PEP for 2017-2040:
https://www.doe.gov.ph/pep/philippine-energy-plan-2017-2040.
4
Source: PEP 2017-2040 Sectoral Plans and Roadmaps
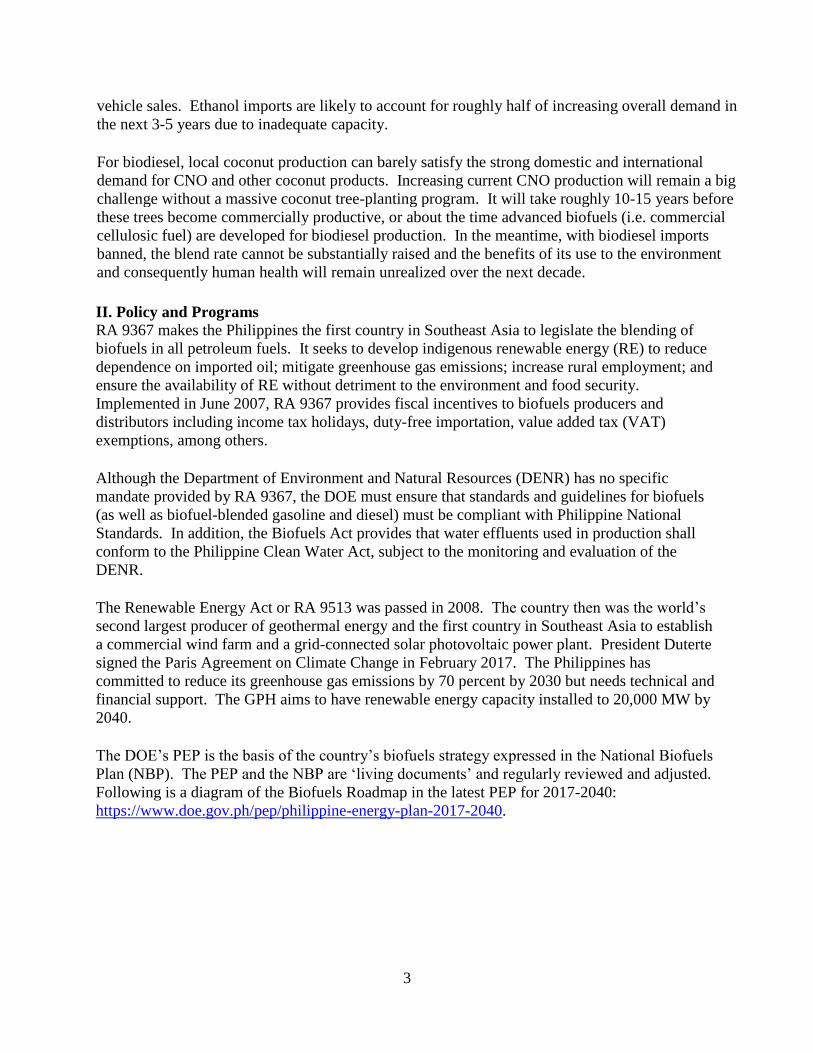
III. Gasoline and Diesel Fuel Use History (Million Liters)
Calendar Year 2009 2010 2011 2012 2013 2014 2015 2016 2017 2018f
Gasoline Total 3,784 3,918 3,882 4,114 4,365 4,547 5,211 5,741 6,028 6,200
Diesel Total 6,938 7,164 7,081 7,403 7,871 8,370 9,331 10,321 10,837 10,800
On-road 5,454 5,631 5,566 5,819 6,187 6,579 7,334 7,701 8,086 8,200
Agriculture
Construction & Mining
Shipping & Rail
Industry
Heating
Jet Fuel Total 281 291 380 454 536 673 551 737 630 785
Total Fuel Markets
11,003 11,373 11,343 11,971 12,772 13,590 15,093 16,799 17,495 17,785
f-forecast Source: DOE Gasoline, diesel and jet fuel consumption in the Fuel Use Table are based on estimates from Post
and the DOE. The local industry is deregulated and gasoline and diesel prices vary by company
and area. Although environmental consciousness is growing, price considerations remain the
dominant factor in motor vehicle sales and use in the Philippines.
Contacts estimate the number of flexi-fuel vehicles (FFVs) at 10-20 percent of overall vehicles.
Post considers this on the high side. In 2007, Ford Motor Company Philippines, Inc. (FMCPI)
opened a new P4 billion ($74 million) assembly plant in Santa Rosa, Laguna which
manufactured and subsequently sold FFVs to the market. In 2012, FMCPI announced the
cessation of its operations citing "lack of supply base and economies of scale." On March 2014,
another motor company acquired the assembly plant.

5
In 2004, the GPH, through Executive Order No. (EO) 290 entitled “Implementing the Natural
Gas Vehicle Program for Public Transport” initiated the pilot testing of locally sourced natural
gas as fuel for 200 public utility buses using compressed natural gas (CNG) from the Malampaya
gas field (located 65 kilometers northwest of the island of Palawan). While the test proved it was
technically feasible to use CNG for public utility buses (absent a pipeline), the establishment of
CNG depots was a major economic challenge. Likewise, while Malampaya provides virtually all
the country’s natural gas requirements, supply is projected to be short of demand starting 2022.
The DOE had estimated a market potential of 16,000 public units of utility buses shifting to
CNG but there has been little progress.
In 2010, an estimated 17,500 taxi units were running on liquefied petroleum gas (LPG). The
availability of new car models (for taxis), low gasoline prices (in 2014-2015) and the negative
health perception, however, dampened the interest of fleet operators to convert to LPG. The
numbers have been declining, as a result. As of 2016, the DOE estimates the total number of
commercial auto-LPG taxis at around 8,500 units supported by roughly 200 refilling stations.
On June 19, 2017, the Philippine Department of Transportation (DOTR) officially launched the
country’s Public Utility Vehicle (PUV) Modernization Program. Involved is the phase out of
PUVs, including jeepneys or PUJs (i.e., jeeps used as public utility vehicles), aged 15 years and
older, to be replaced with more environment-friendly vehicles with more efficient engines (i.e.,
Euro-4 compliant or electrically powered) by 2020. Funding constraints are an issue, however.
According to a press report, the GPH will have to invest ₱415 billion ($7.7 billion) to implement
the scheme fully. Selective program implementation is a proposed alternative (see Biodiesel
Consumption Section).
Unconfirmed estimates place the number of electric vehicles (E-vehicles) in the Philippines at
2,000 units. In 2006, EO 488 was issued to support the manufacturing of E-vehicles by reducing
tariffs for E-vehicle components. Although E-vehicles, mostly PUVs, can be seen on some roads
in major urban centers, charging stations are grossly inadequate. The first oil company had its E-
vehicle charging facility installed only in late 2017. Other companies are expected to follow.
Industry forecasts e-vehicles to comprise 10 percent of the total 200,000 PUVs over the next five
years or through 2022.
A major program of the Duterte government is a comprehensive tax reform package. The first
tranche, the Tax Reform for Acceleration and Inclusion (TRAIN) or RA 10963 was signed on
December 27, 2017. TRAIN lowers personal income tax rates while imposing new excise taxes
on petroleum products and motor vehicles, among others, starting January 1, 2018. Proceeds
from the tax reforms support an ambitious P8 trillion ($148 billion) GPH infrastructure program
called “Build, Build, Build" (www.build.gov.ph) through 2022.
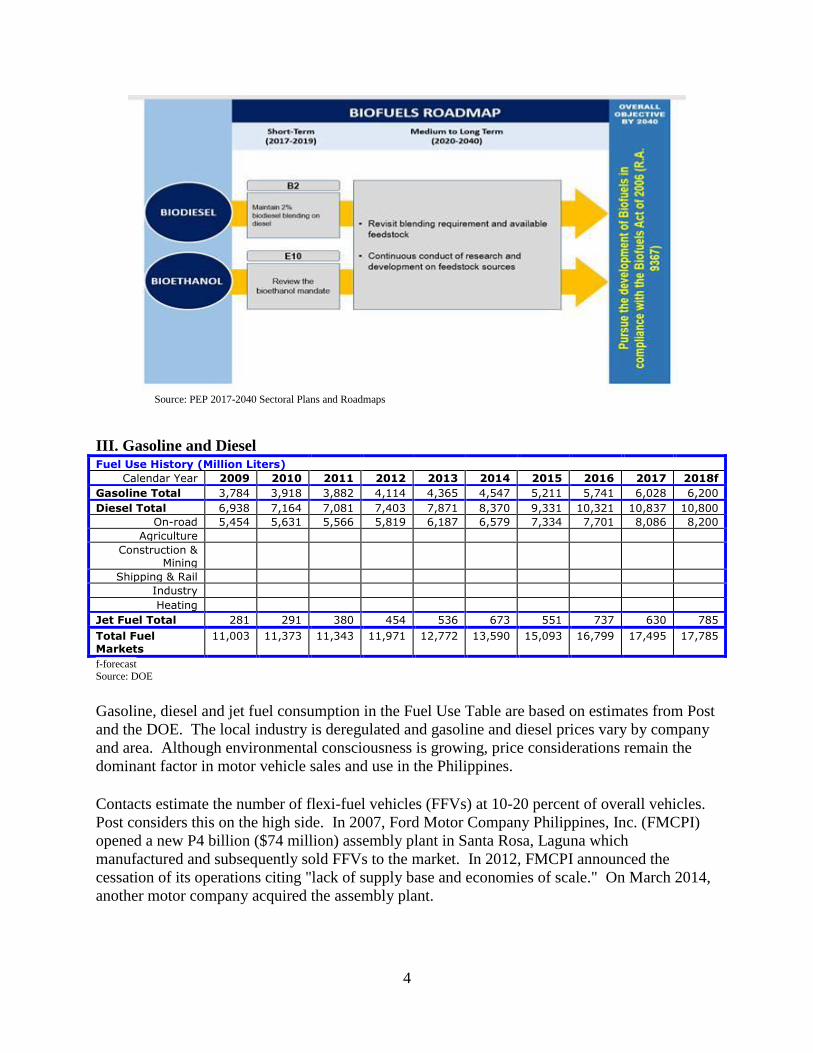
Following are the old and new TRAIN tax rates for motor vehicles. Under the TRAIN, electric
vehicles do not have to pay excise taxes while for hybrids only half of the tax is applied. Also
exempted are trucks, cargo vans, jeeps, special purpose vehicles and pick-up trucks. Although
still growing, the excise taxes on new motor vehicles have slowed down sales in 2018.
6
OLD vs NEW TRAIN AUTO EXCISE TAX RATES
Old New Old Rate (%) New Rate (%) up to P600,000 ($11,111) up to P600,000 ($11,111) 2 4
over P600,000 ($11,111) to P1,100,000 ($20,370)
over P600,000 ($11,111) to P1,000,000 ($18,520)
2
10
over P1,100,000 ($20,370) to P2,100,000 ($38,890)
P1,000,000 ($18,520) to P4,000,000 ($74,075)
P112,000 ($2,075) +40% In excess of P1,100,000
($20,370)
20
Over P2,100,000 ($38,890)
Over P4,000,000 ($74,075)
P512,000 ($9,480) +60% in excess of P2,100,000 ($38,890)
50
Source: Department of Finance
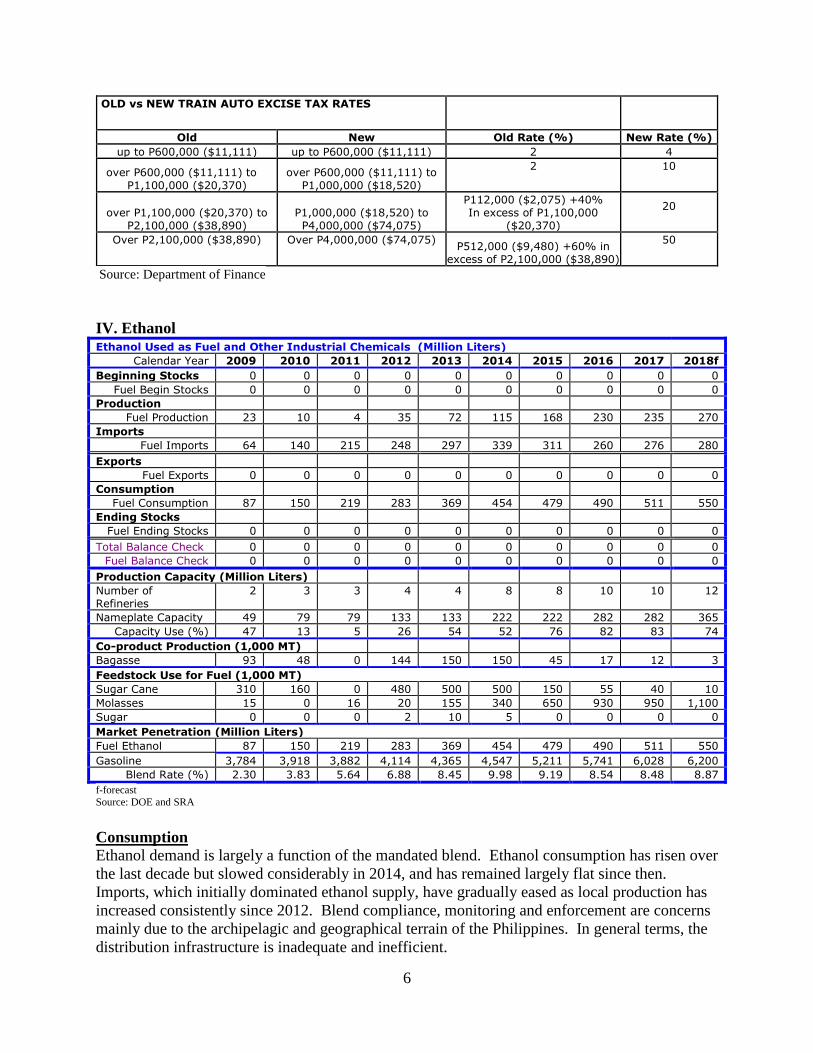
IV. Ethanol Ethanol Used as Fuel and Other Industrial Chemicals (Million Liters)
Calendar Year 2009 2010 2011 2012 2013 2014 2015 2016 2017 2018f
Beginning Stocks 0 0 0 0 0 0 0 0 0 0
Fuel Begin Stocks 0 0 0 0 0 0 0 0 0 0
Production
Fuel Production 23 10 4 35 72 115 168 230 235 270
Imports
Fuel Imports 64 140 215 248 297 339 311 260 276 280
Exports
Fuel Exports 0 0 0 0 0 0 0 0 0 0
Consumption
Fuel Consumption 87 150 219 283 369 454 479 490 511 550
Ending Stocks
Fuel Ending Stocks 0 0 0 0 0 0 0 0 0 0
Total Balance Check 0 0 0 0 0 0 0 0 0 0
Fuel Balance Check 0 0 0 0 0 0 0 0 0 0
Production Capacity (Million Liters)
Number of Refineries
2 3 3 4 4 8 8 10 10 12
Nameplate Capacity 49 79 79 133 133 222 222 282 282 365
Capacity Use (%) 47 13 5 26 54 52 76 82 83 74
Co-product Production (1,000 MT)
Bagasse 93 48 0 144 150 150 45 17 12 3
Feedstock Use for Fuel (1,000 MT)
Sugar Cane 310 160 0 480 500 500 150 55 40 10
Molasses 15 0 16 20 155 340 650 930 950 1,100
Sugar 0 0 0 2 10 5 0 0 0 0
Market Penetration (Million Liters)
Fuel Ethanol 87 150 219 283 369 454 479 490 511 550
Gasoline 3,784 3,918 3,882 4,114 4,365 4,547 5,211 5,741 6,028 6,200
Blend Rate (%) 2.30 3.83 5.64 6.88 8.45 9.98 9.19 8.54 8.48 8.87
f-forecast Source: DOE and SRA Consumption Ethanol demand is largely a function of the mandated blend. Ethanol consumption has risen over
the last decade but slowed considerably in 2014, and has remained largely flat since then.
Imports, which initially dominated ethanol supply, have gradually eased as local production has
increased consistently since 2012. Blend compliance, monitoring and enforcement are concerns
mainly due to the archipelagic and geographical terrain of the Philippines. In general terms, the
distribution infrastructure is inadequate and inefficient.
7
Local gasoline stations generally offer regular, mid-grade, and premium or high-octane gasoline.
These have octane ratings of 91, 95, and 97-octane or higher, respectively. According to an
industry expert, ethyl tert-butyl ether or ETBE is not used locally as an octane enhancer. Low to
mid ethanol-blended gasoline engines dominate Philippine gasoline-powered vehicles.
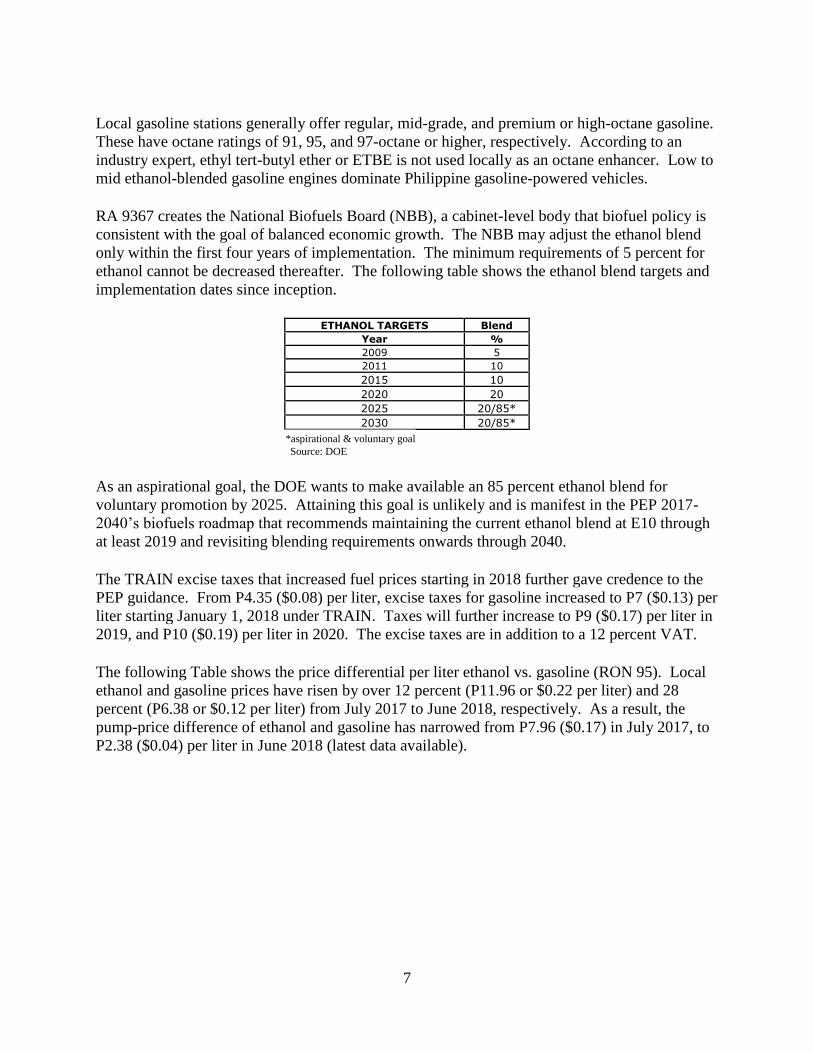
RA 9367 creates the National Biofuels Board (NBB), a cabinet-level body that biofuel policy is
consistent with the goal of balanced economic growth. The NBB may adjust the ethanol blend
only within the first four years of implementation. The minimum requirements of 5 percent for
ethanol cannot be decreased thereafter. The following table shows the ethanol blend targets and
implementation dates since inception.
ETHANOL TARGETS Blend
Year % 2009 5 2011 10 2015 10 2020 20 2025 20/85* 2030 20/85*
*aspirational & voluntary goal Source: DOE As an aspirational goal, the DOE wants to make available an 85 percent ethanol blend for
voluntary promotion by 2025. Attaining this goal is unlikely and is manifest in the PEP 2017-
2040’s biofuels roadmap that recommends maintaining the current ethanol blend at E10 through
at least 2019 and revisiting blending requirements onwards through 2040.
The TRAIN excise taxes that increased fuel prices starting in 2018 further gave credence to the
PEP guidance. From P4.35 ($0.08) per liter, excise taxes for gasoline increased to P7 ($0.13) per
liter starting January 1, 2018 under TRAIN. Taxes will further increase to P9 ($0.17) per liter in
2019, and P10 ($0.19) per liter in 2020. The excise taxes are in addition to a 12 percent VAT.
The following Table shows the price differential per liter ethanol vs. gasoline (RON 95). Local
ethanol and gasoline prices have risen by over 12 percent (P11.96 or $0.22 per liter) and 28
percent (P6.38 or $0.12 per liter) from July 2017 to June 2018, respectively. As a result, the
pump-price difference of ethanol and gasoline has narrowed from P7.96 ($0.17) in July 2017, to
P2.38 ($0.04) per liter in June 2018 (latest data available).

8
LOCAL GASOLINE VS. ETHANOL PRICES July 2017 – June 2018
Gasoline Ethanol Ethanol-Gas
Price Differential Peso per liter Jul-17 43.40 51.36 7.96 Aug-17 45.37 51.53 6.16 Sep-17 46.76 48.77 2.01 Oct-17 46.84 47.52 0.68 Nov-17 48.22 42.48 (5.74) Dec-17 47.73 43.89 (3.84) Jan-18 50.26 45.77 (4.49) Feb-18 52.31 48.26 (4.05) Mar-18 52.54 51.76 (0.78) Apr-18 53.76 53.54 (0.22) May-18 56.30 55.48 (0.82) Jun-18 55.36 57.74 2.38
Source: DOE and SRA The gap between gasoline and ethanol likely widened leading to October 2018 when gasoline
prices peaked and reached record level (Dubai prices exceeded $80 per barrel) at over P70
($1.30) per liter in some areas. Inflation rose to 6.7 percent in September 2018, the ninth
consecutive month of increase and the highest in nine years due to increasing global fuel prices,
the weakening of the Philippine Peso, and rising food prices because of weather-related issues.
Average inflation from January to September 2018 was 5 percent, higher than the 2-4 percent
target, according to the Philippine Central Bank.
While there have been calls to suspend its implementation, RA 10963 provides that suspension
of the higher tax rates can only happen if oil prices reach $80 per barrel for at least three
months.
Production According to the DOE, there were 11 ethanol plants operating in 2017 with a total production
capacity of 282 million liters. Two additional plants were commissioned in the second quarter of
2018 raising aggregate capacity to 365 million liters. Ethanol output in 2018 will likely increase
to 270 ML as a result compared to 235 ML the previous year.
As mentioned in the previous annual report, a shift from potable alcohol plants to fuel ethanol
production is a recent development as it is cheaper to modify rather than build a new facility.
The adjustments take only two to three months. The trend likewise explains the shift from cane
to molasses as the primary feedstock used.
The Philippines is also a major sugarcane producer and in addition to domestic requirements, it is
a major U.S sugar quota recipient. Raw sugar production was inadequate in Market Year (MY)
2017/18 (December/November) forcing the GPH to import 200,000 tons of sugar. The
Philippines also exported about 120,000 tons to the United States, about 16,000 short of the
quota. Raw sugar production is projected to modestly recover and reach 2.250 million tons in
MY 2018/19, up 7 percent from the previous year’s level. Local sugar production is inadequate
to meet the growing domestic and international demand for sugar, including the feedstock needs
for fuel ethanol production.

9
There are research and development efforts in using sweet sorghum (for conventional sugar
fermentation) and lignocellulosic biomass as an alternative or complementary feedstock.
However, commercial cultivation of sweet sorghum for fuel will require vast tracks of land, and
is expected to remain constrained by a longstanding Philippine agrarian reform law (which limits
private land ownership to five hectares).
The DOE rationalizes the distribution of locally produced ethanol by determining the volume of
production and allocating this quantity to local oil companies on a monthly basis. Oil
companies are required to purchase the entire monthly allocation before they can import ethanol.
Trade The quota allocation scheme, domestic feedstock limitation for local fuel ethanol production, and
effort to maintain E10 combine to make the Philippines one of the most open economies for
ethanol imports. Although Section 5.2 of the Biofuels Act allows ethanol imports only up to four
years after the 2009 blend implementation or 2013, inadequate local production has forced
importation. The quota allocation system for locally produced ethanol ensures that imports do
not displace locally produced ethanol.
Ethanol tariffs (HS 271012) under various free trade agreements within ASEAN, including the
Philippines, fell to zero in 2016, and remain duty free. Likewise, Most Favored Nation (MFN)
tariffs for World Trade Organization (WTO)-member countries, including the United States,
remain at zero percent in 2018. A duty of one percent is imposed if the ethanol is used for fuel-
blending purposes under the Philippine Fuel Ethanol Program, according to the DOE.
For molasses, imports are only allowed if used for potable ethanol production. The local ethanol
producers can only import molasses when approved by the Sugar Regulatory Administration
(SRA).
Mainly due to relatively flat production, fuel ethanol imports in 2017 increased 6 percent from
260 ML in 2016 to 276 ML in 2017, according to data from the SRA and the DOE. Imports
from the United States, however, increased 9 percent to 263 ML in 2017 from 241 ML the
previous year. The United States maintained its dominance accounting for 95 percent of total
ethanol imports in 2017, increasing its share from 93 percent in 2016. According to U.S.
Census data, the Philippines was the 6th largest market for U.S. ethanol in 2017, with sales
valued at $101 million.

10
ETHANOL IMPORTS (ML) Country of Origin 2015 2016 2017 Australia 8.26 16.60 3.85 Brazil
Indonesia Korea 7.40 1.91 5.69 Philippines (Subic) 112.54
Singapore 4.74
Thailand USA 177.67 241.04 263.07 Vietnam 0.07 2.96 Others Total 310.68 259.55 275.56
Source: SRA and DOE For 2018, ethanol imports are expected to decline to 240 ML compared to the 2017 level due to
increased production.
V. Biodiesel/Renewable Diesel
Biodiesel (Million Liters)
Calendar Year 2009 2010 2011 2012 2013 2014 2015 2016 2017 2018f
Beginning Stocks
2 8 7 17 18 20 29 32 41 57
Production 137 124 133 138 155 172 204 227 220 226
Imports 0 0 0 0 0 0 0 0 0 0
Exports 0 0 0 0 0 0 0 0 0 0
Consumption 131 125 123 137 153 163 201 218 204 210
Ending Stocks 8 7 17 18 20 29 32 41 57 73
Balance Check 0 0 0 0 0 0 0 0 0 0
Production Capacity (Million Liters)
Number of Biorefineries
10 8 9 9 9 11 11 11 11 11
Nameplate Capacity
350 436 350 393 393 585 585 575 575 575
Capacity Use (%)
39.1% 28.4% 38.0% 35.1% 39.4% 29.4% 34.9% 39.5% 38.3% 39.3%
Feedstock Use for Fuel (1,000MT)
Coconut oil 125 113 122 126 142 157 186 207 201 207
Market Penetration (Million Liters)
Biodiesel, on-road use
131 125 123 137 153 163 201 218 204 210
Diesel, on-road use
5,454 5,631 5,566 5,819 6,187 6,579 7,334 7,701 8,086 8,200
Blend Rate (%) 2.4% 2.2% 2.2% 2.4% 2.5% 2.5% 2.7% 2.8% 2.5% 2.6%
Diesel, total use 6,449 6,588 6,696 7,004 7,394 7,778 8,793 9,535 10,159 10,158
f-forecast Source: DOE and SRA Consumption Diesel is the dominant transport fuel used in the Philippines. Diesel has a price advantage over
gasoline and diesel engines run more efficiently. In June 2016, the DOE in partnership with a

11
major oil company, organized the first Euro 4 Fuel Eco Run to produce a standard measure of
fuel economy. About 70 cars from over 20 different brands participated. The top 10 cars in the
test were diesel-powered vehicles. Diesel engines reportedly can save up close to 30 percent
more of fuel consumption compared to gasoline-driven ones, due to higher energy content of
diesel and engine efficiency.
RA 9367 had mandated the use of a minimum one percent biodiesel blend in all diesel fuels (off-
road and on-road) by February 2007, to increase to a 2 percent blend by 2009. Following are the
biodiesel blends targets through 2030:
BIODIESEL TARGETS BLENDS
Year % 2007 1 2009 2 2015 5 2020 10 2025 20 2030 20
Source: DOE Biodiesel blending is currently still at 2 percent. Like ethanol, the National Biofuels Board
(NBB) may adjust the ethanol blend only within the first four years of implementation. The
minimum requirements of 2 percent for biodiesel cannot be decreased thereafter. As mentioned
in previous reports, high coconut oil (CNO) prices as a result of tight copra supplies have likely
resulted in the delay in raising the blend to B5 since 2015 (as indicated in the above table).
The taxes from the TRAIN law already increased diesel prices starting this year. From zero, the
price of diesel increased to P2.50 ($0.05) per liter on January 1, 2018 under the TRAIN. Taxes
will further increase to P4.50 ($0.08) per liter in 2019, and P6 ($0.11) per liter in 2020. The
excise taxes are on top of a 12 percent VAT.
On the other hand, copra and CNO prices have gone down considerably due to a glut in world
supply of vegetable oils and the Philippine Coconut Authority (PCA) recently appealed anew to
the National Biofuels Board (NBB) to increase the coconut methyl ester (CME) content of
biodiesel to B5 to help coconut farmers.
Following is a table on diesel and CME prices from July 2017 to August 2018 (most recent data
available). As of October 11, 2018, the common diesel retail price in Metro Manila was P49.80-
51.95 ($0.92-0.96) per liter.

12
LOCAL DIESEL AND BIODIESEL PRICES July 2017 – June 2018
Diesel CME
CME less Diesel Price Differential
Peso per liter* Low End High End Jul-17 30.57 45-90 14.43 59.43 Aug-17 32.43 45-90 12.57 57.57 Sep-17 33.52 45-90 11.48 56.48 Oct-17 34.48 63-89 28.52 54.52 Nov-17 35.22 63-90 27.78 54.78 Dec-17 35.74 63-89 27.26 53.26 Jan-18 38.81 63-90 24.19 51.19 Feb-18 41.02 63-90.75 21.98 49.73 Mar-18 40.97 57-90.49 16.03 49.52 Apr-18 42.02 60-86 17.99 43.99 May-18 43.37 56-90 12.63 46.63 Jun-18 44.71 45-90 0.29 45.29 Jul-18 44.41 49-72.64 4.59 28.23 Aug-18 44.31 47-72.5 2.69 28.19
*Average retail price after taxes Source: DOE
While the local coconut industry stakeholders have consistently expressed support for the B5
blend, economists are concerned about supply availability and pricing. As mentioned in the
previous annual report, a 2016 USAID-funded policy study recommended the postponement of
the higher blend, at least, in the short-run. While it affirms there are positive environmental and
health benefits in raising the blend, it recognized that meeting the required coconut/copra
requirements for a higher 5 percent blend would be difficult despite the optimistic production
projections by the PCA. In the medium to long term, the study further suggests a review of the
Biofuels Act “as several economic studies (such as de Gorter and Just, 2009) point to the
distortive effects of mandates and subsidies in addressing climate change issues.” Consistent
with the USAID policy recommendation is the guidance from the PEP 2017-2040 recommending
the biodiesel blend be maintained at B2.
Responding to rising inflation, on July 11 2018, the Departments of Budget, Transportation and
Energy, signed a joint memorandum circular on a fuel subsidy program (aka “Pantawid
Pasada”) which grants PUJ drivers P5,000 ($92.6) as fuel subsidy to cushion the effects of
TRAIN. An estimated P977 million ($18 million) was allocated by the Budget department for
the remaining six months of 2018. According to press reports, a subsidy of P3.86 billion ($71.5
million) would be allocated by the GPH in 2019.
On August 10, 2018, the DOE issued Order 2018-08-0012 instructing “all industry players are
hereby directed to provide Euro 2-compliant automotive diesel oil at the retail level as fuel
option for the transport and industrial customers.” Local oil companies have voiced their
opposition as a shift back to Euro 2-diesel would entail additional handling costs. The shift to
the lower Euro-2 also contradicts present GPH policy, according to a legislator.
Production An estimated 50 active CNO mills operate in the country, and around 20 cater to the export
market while roughly 30 concentrate in servicing domestic CNO needs, according to industry
contacts. Virtually all domestic biodiesel is made using CNO and is therefore also referred to as

13
CME (coconut oil-based biodiesel), an oleochemical derived from CNO. CNO is obtained from
crushing copra. Oleochemicals are also used in the manufacture of soaps, detergents and other
cosmetic items and toiletries.
According to the DOE, there were 11 registered biodiesel refineries in 2018, unchanged since
2014. Likewise, the aggregate annual capacity remains at 575 ML. Seven CME producers
operate in the island of Luzon while four are located in Mindanao island. Despite an expected
improvement in copra supply, the number of biodiesel plants and their output in 2018 are
expected to remain flat compared to the 2017 level due to strong demand for the competing uses
of CNO.
The United Coconut Association of the Philippines (UCAP) revised its earlier copra production
estimate from 2.2 million tons to 2.4 million tons in 2017. Post likewise raised its production
estimate to 2.3 million tons in October–September Market Year (MY) 16/17 due to favorable
weather conditions (see 2018 Oilseeds and Products Annual. Copra production is projected to
increase further in the next two years reaching 2.6 million tons in MY 17/18 and 2.7 million tons
in MY 18/19 due to adequate rainfall and generally favorable weather conditions in calendar
years 2017 and early 2018. As mentioned in the oilseeds annual report, copra productivity is
constrained by predominantly old and unproductive coconut palms or trees, which constitute an
estimated 20 percent of overall Philippine coconut trees. Coconut trees may start to bear nuts
after 6-10 years but take around 15-20 years to reach their peak. Coconut trees have a long
lifespan (80-90 years).
The country’s first biodiesel plant using used cooking oil (UCO) was inaugurated in August
2017 in Davao City. The Bio Diesel Fuel Plant (BDFP) has an annual processing capacity of
365,000 liters and product quality will be tested using jeepneys and garbage trucks. The Davao
city government in cooperation with the Japanese government and Japan International
Cooperation Agency (JICA) is implementing the BDFP project. Post is currently not aware of
product quality tests results.
Trade The Biofuels Act does not permit biodiesel imports. According to industry contacts, CNO
exporters avoid trade disruptions as they have longstanding export commitments to their
preferred buyers. No biodiesel exports are expected through 2018, as a result. However, if
imports were permitted, the B5 blended goal for 2015-219 set in 2007 legislation could be
achieved with its associated human health and carbon emission reduction benefits. Imports of
biodiesel above B30 to B100 (HS 382600) are levied a 3 percent Most Favored Nation (MFN)
tariff while petroleum oils containing B1 to B30 (HS 271020) are duty-free. VI. Advanced Biofuels The DOE aims to have B20 by 2025. According to a local expert, algal biodiesel would be
necessary to augment feedstock supply in order to comply with the higher mandate assuming
imports remain banned. However, commercialization of price competitive algal biodiesel is not
foreseen in the near to medium-term. There is little information on current research and
development for cellulosic fuel available, as well as on demonstration plants that prove the

14
commercial viability of advanced biofuels technology. The development of commercial
cellulosic fuel will likely entail a much longer time, closer to 2030.
VII. Notes on Statistical Data The numbers on the Fuel Use Projections, Ethanol and Biodiesel Tables are guided by the
following assumptions:
Fuel use figures through 2017 are based on consumption estimates from the DOE.
Gasoline and diesel use in 2018 in the Fuel Use Table are Post’s estimates and much
lower than the DOE’s projection in consideration of increasing inflation starting 2018 and
new and/or higher taxes on petroleum fuel and motor vehicle sales. On-road diesel was derived by multiplying total diesel use for transport by 75-80 or the
estimated percentage of on-road transport over total transport. Ethanol imports are based on data from the DOE and SRA. Biodiesel production and consumption estimates through 2017 were adjusted based on
DOE data.
Post assumes ethanol stocks to be nil due to tightness in local supply.
Co-product production and feedstock use numbers are Post’s estimates using the following
conversion factors: Sugarcane co-product (bagasse) recovery of 300 kilos (kg) per ton of cane.
For biodiesel, a ton of CNO yields around 1,090 liters of CME. A ton of sugarcane yields roughly 60 liters of fuel ethanol. A ton of molasses yields roughly 245 liters of ethanol.
A ton of sugar yields around 500 liters of ethanol.