phoenix high school - parents...balanced summative assessment plus the total number of students who...
TRANSCRIPT

2017-18 School Accountability Report Card for Phoenix High School Page 1 of 9
Phoenix High School
6150 Snell Rd. • San Jose, CA, 95123 • 408.347.6210 • Grades Greg Louie, Principal [email protected]
2017-18 School Accountability Report Card
Published During the 2018-19 School Year
----
----
East Side Union High School District
830 N. Capitol Avenue San Jose, CA 95133
(408) 347-5000 www.esuhsd.org
District Governing Board
Frank Biehl
J. Manuel Herrera
Van Thi Le
Pattie Cortese
Lan Nguyen
District Administration
Chris D. Funk Superintendent
Glenn Vander Zee Associate Superintendent
Educational Services
Chris Jew Associate Superintendent
Business Services
Dr. John Rubio Associate Superintendent
Human Resources
---- ----
School Description Phoenix High School! Phoenix High School is specifically designed to offer an alternative education experience to students who have not been successful in other academic settings. Phoenix High School has a staff of four teachers, a secretary, and is supervised by Santa Teresa administrators who are all dedicated to meeting the needs of our students and to providing them with the opportunity to graduate on time through an intensive program utilizing core academic classes, independent studies, vocational training, and community college classes. Phoenix High School is accredited through the Western Association of Schools and Colleges (WASC). All Phoenix students will RISE, becoming Responsible, Inquisitive, Socially Adept, and Educationally sound individuals.

2017-18 School Accountability Report Card for Phoenix High School Page 2 of 9
About the SARC By February 1 of each year, every school in California is required by state law to publish a School Accountability Report Card (SARC). The SARC contains information about the condition and performance of each California public school. Under the Local Control Funding Formula (LCFF) all local educational agencies (LEAs) are required to prepare a Local Control and Accountability Plan (LCAP), which describes how they intend to meet annual school-specific goals for all pupils, with specific activities to address state and local priorities. Additionally, data reported in an LCAP is to be consistent with data reported in the SARC. • For more information about SARC requirements, see the California
Department of Education (CDE) SARC web page at https://www.cde.ca.gov/ta/ac/sa/.
• For more information about the LCFF or LCAP, see the CDE LCFF web page at https://www.cde.ca.gov/fg/aa/lc/.
• For additional information about the school, parents/guardians and community members should contact the school principal or the district office.
2017-18 Student Enrollment by Grade Level
Grade Level Number of Students
Grade 11 32
Grade 12 45
Total Enrollment 77
2017-18 Student Enrollment by Group
Group Percent of Total Enrollment
Black or African American 6.5
American Indian or Alaska Native 0.0
Asian 5.2
Filipino 2.6
Hispanic or Latino 67.5
Native Hawaiian or Pacific Islander 0.0
White 13.0
Socioeconomically Disadvantaged 61.0
English Learners 11.7
Students with Disabilities 1.3
Foster Youth 0.0
A. Conditions of Learning State Priority: Basic The SARC provides the following information relevant to the State priority: Basic (Priority 1): • Degree to which teachers are appropriately assigned and fully
credentialed in the subject area and for the pupils they are teaching; • Pupils have access to standards-aligned instructional materials; and • School facilities are maintained in good repair
Teacher Credentials
Phoenix High School 16-17 17-18 18-19
With Full Credential 4 4 4
Without Full Credential 0 0 0
Teaching Outside Subject Area of Competence 0 0 0
East Side Union High School District 16-17 17-18 18-19
With Full Credential ♦ ♦ 991.5
Without Full Credential ♦ ♦ 50.6
Teaching Outside Subject Area of Competence ♦ ♦ 0
Teacher Misassignments and Vacant Teacher Positions at this School
Phoenix High School 16-17 17-18 18-19
Teachers of English Learners 0 0 0
Total Teacher Misassignments 0 0 0
Vacant Teacher Positions 0 0 0
* Note: “Misassignments” refers to the number of positions filled by teachers who lack legal authorization to teach that grade level, subject area, student group, etc. *Total Teacher Misassignments includes the number of Misassignments of Teachers of English Learners.
2017-18 School Accountability Report Card for Phoenix High School Page 3 of 9
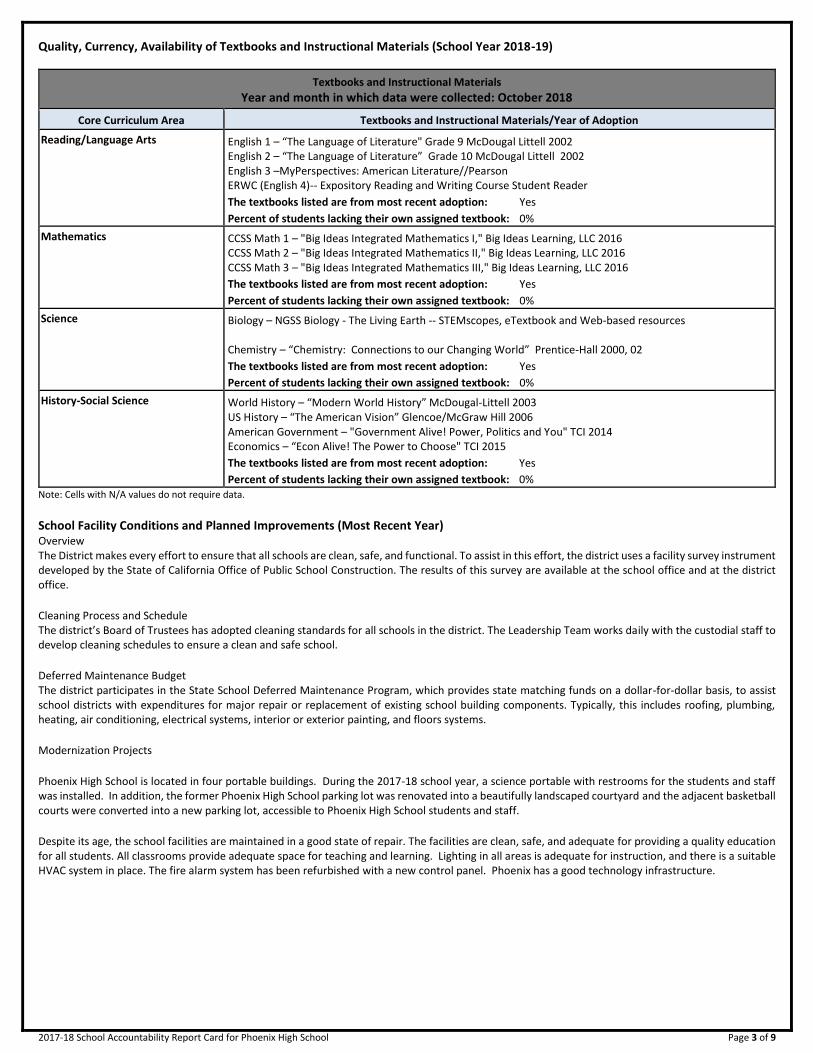
Quality, Currency, Availability of Textbooks and Instructional Materials (School Year 2018-19)
Textbooks and Instructional Materials
Year and month in which data were collected: October 2018
Core Curriculum Area Textbooks and Instructional Materials/Year of Adoption
Reading/Language Arts English 1 – “The Language of Literature" Grade 9 McDougal Littell 2002 English 2 – “The Language of Literature” Grade 10 McDougal Littell 2002 English 3 –MyPerspectives: American Literature//Pearson ERWC (English 4)-- Expository Reading and Writing Course Student Reader
The textbooks listed are from most recent adoption: Yes
Percent of students lacking their own assigned textbook: 0%
Mathematics CCSS Math 1 – "Big Ideas Integrated Mathematics I," Big Ideas Learning, LLC 2016 CCSS Math 2 – "Big Ideas Integrated Mathematics II," Big Ideas Learning, LLC 2016 CCSS Math 3 – "Big Ideas Integrated Mathematics III," Big Ideas Learning, LLC 2016
The textbooks listed are from most recent adoption: Yes
Percent of students lacking their own assigned textbook: 0%
Science Biology – NGSS Biology - The Living Earth -- STEMscopes, eTextbook and Web-based resources Chemistry – “Chemistry: Connections to our Changing World” Prentice-Hall 2000, 02
The textbooks listed are from most recent adoption: Yes
Percent of students lacking their own assigned textbook: 0%
History-Social Science World History – “Modern World History” McDougal-Littell 2003 US History – “The American Vision” Glencoe/McGraw Hill 2006 American Government – "Government Alive! Power, Politics and You" TCI 2014 Economics – “Econ Alive! The Power to Choose" TCI 2015
The textbooks listed are from most recent adoption: Yes
Percent of students lacking their own assigned textbook: 0%
Note: Cells with N/A values do not require data.
School Facility Conditions and Planned Improvements (Most Recent Year) Overview The District makes every effort to ensure that all schools are clean, safe, and functional. To assist in this effort, the district uses a facility survey instrument developed by the State of California Office of Public School Construction. The results of this survey are available at the school office and at the district office. Cleaning Process and Schedule The district’s Board of Trustees has adopted cleaning standards for all schools in the district. The Leadership Team works daily with the custodial staff to develop cleaning schedules to ensure a clean and safe school. Deferred Maintenance Budget The district participates in the State School Deferred Maintenance Program, which provides state matching funds on a dollar-for-dollar basis, to assist school districts with expenditures for major repair or replacement of existing school building components. Typically, this includes roofing, plumbing, heating, air conditioning, electrical systems, interior or exterior painting, and floors systems. Modernization Projects Phoenix High School is located in four portable buildings. During the 2017-18 school year, a science portable with restrooms for the students and staff was installed. In addition, the former Phoenix High School parking lot was renovated into a beautifully landscaped courtyard and the adjacent basketball courts were converted into a new parking lot, accessible to Phoenix High School students and staff. Despite its age, the school facilities are maintained in a good state of repair. The facilities are clean, safe, and adequate for providing a quality education for all students. All classrooms provide adequate space for teaching and learning. Lighting in all areas is adequate for instruction, and there is a suitable HVAC system in place. The fire alarm system has been refurbished with a new control panel. Phoenix has a good technology infrastructure.
2017-18 School Accountability Report Card for Phoenix High School Page 4 of 9
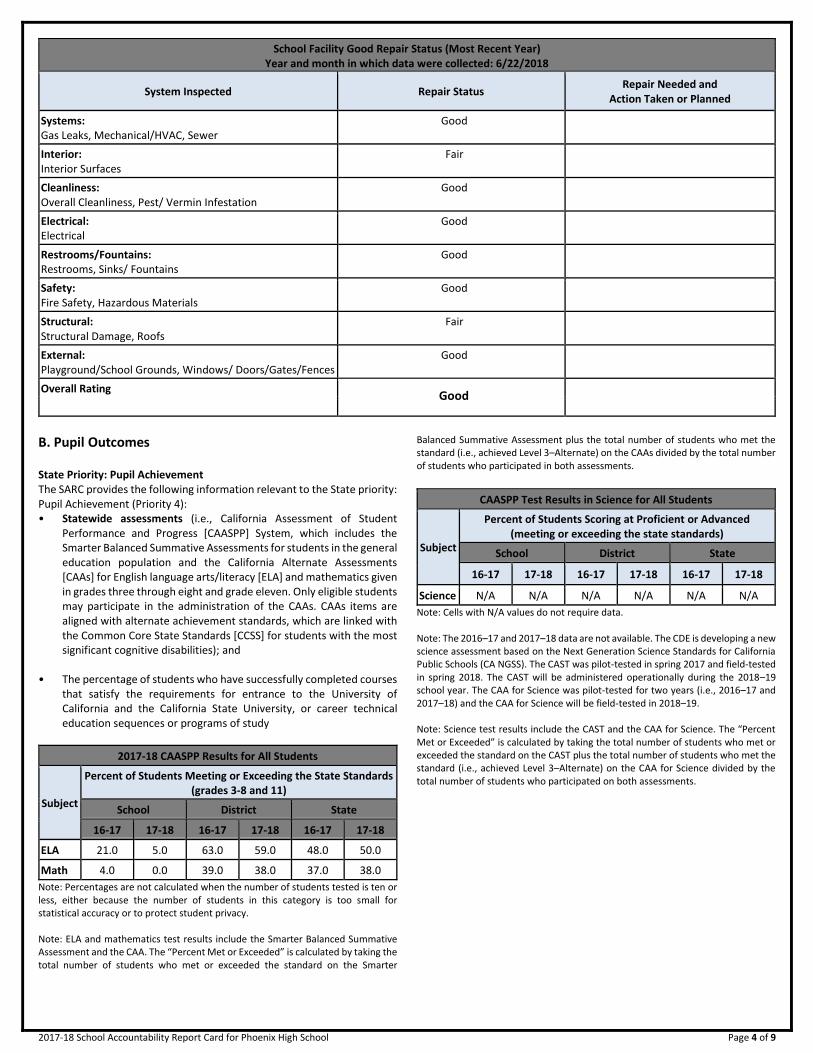
School Facility Good Repair Status (Most Recent Year) Year and month in which data were collected: 6/22/2018
System Inspected Repair Status Repair Needed and
Action Taken or Planned
Systems: Gas Leaks, Mechanical/HVAC, Sewer
XGood
Interior: Interior Surfaces
XFair
Cleanliness: Overall Cleanliness, Pest/ Vermin Infestation
XGood
Electrical: Electrical
XGood
Restrooms/Fountains: Restrooms, Sinks/ Fountains
XGood
Safety: Fire Safety, Hazardous Materials
XGood
Structural: Structural Damage, Roofs
XFair
External: Playground/School Grounds, Windows/ Doors/Gates/Fences
XGood
Overall Rating XGood
----------
B. Pupil Outcomes
State Priority: Pupil Achievement The SARC provides the following information relevant to the State priority: Pupil Achievement (Priority 4): • Statewide assessments (i.e., California Assessment of Student
Performance and Progress [CAASPP] System, which includes the Smarter Balanced Summative Assessments for students in the general education population and the California Alternate Assessments [CAAs] for English language arts/literacy [ELA] and mathematics given in grades three through eight and grade eleven. Only eligible students may participate in the administration of the CAAs. CAAs items are aligned with alternate achievement standards, which are linked with the Common Core State Standards [CCSS] for students with the most significant cognitive disabilities); and
• The percentage of students who have successfully completed courses
that satisfy the requirements for entrance to the University of California and the California State University, or career technical education sequences or programs of study
2017-18 CAASPP Results for All Students
Subject
Percent of Students Meeting or Exceeding the State Standards (grades 3-8 and 11)
School District State
16-17 17-18 16-17 17-18 16-17 17-18
ELA 21.0 5.0 63.0 59.0 48.0 50.0
Math 4.0 0.0 39.0 38.0 37.0 38.0
Note: Percentages are not calculated when the number of students tested is ten or less, either because the number of students in this category is too small for statistical accuracy or to protect student privacy. Note: ELA and mathematics test results include the Smarter Balanced Summative Assessment and the CAA. The “Percent Met or Exceeded” is calculated by taking the total number of students who met or exceeded the standard on the Smarter
Balanced Summative Assessment plus the total number of students who met the standard (i.e., achieved Level 3–Alternate) on the CAAs divided by the total number of students who participated in both assessments.
CAASPP Test Results in Science for All Students
Subject
Percent of Students Scoring at Proficient or Advanced (meeting or exceeding the state standards)
School District State
16-17 17-18 16-17 17-18 16-17 17-18
Science N/A N/A N/A N/A N/A N/A
Note: Cells with N/A values do not require data. Note: The 2016–17 and 2017–18 data are not available. The CDE is developing a new science assessment based on the Next Generation Science Standards for California Public Schools (CA NGSS). The CAST was pilot-tested in spring 2017 and field-tested in spring 2018. The CAST will be administered operationally during the 2018–19 school year. The CAA for Science was pilot-tested for two years (i.e., 2016–17 and 2017–18) and the CAA for Science will be field-tested in 2018–19. Note: Science test results include the CAST and the CAA for Science. The “Percent Met or Exceeded” is calculated by taking the total number of students who met or exceeded the standard on the CAST plus the total number of students who met the standard (i.e., achieved Level 3–Alternate) on the CAA for Science divided by the total number of students who participated on both assessments.
2017-18 School Accountability Report Card for Phoenix High School Page 5 of 9
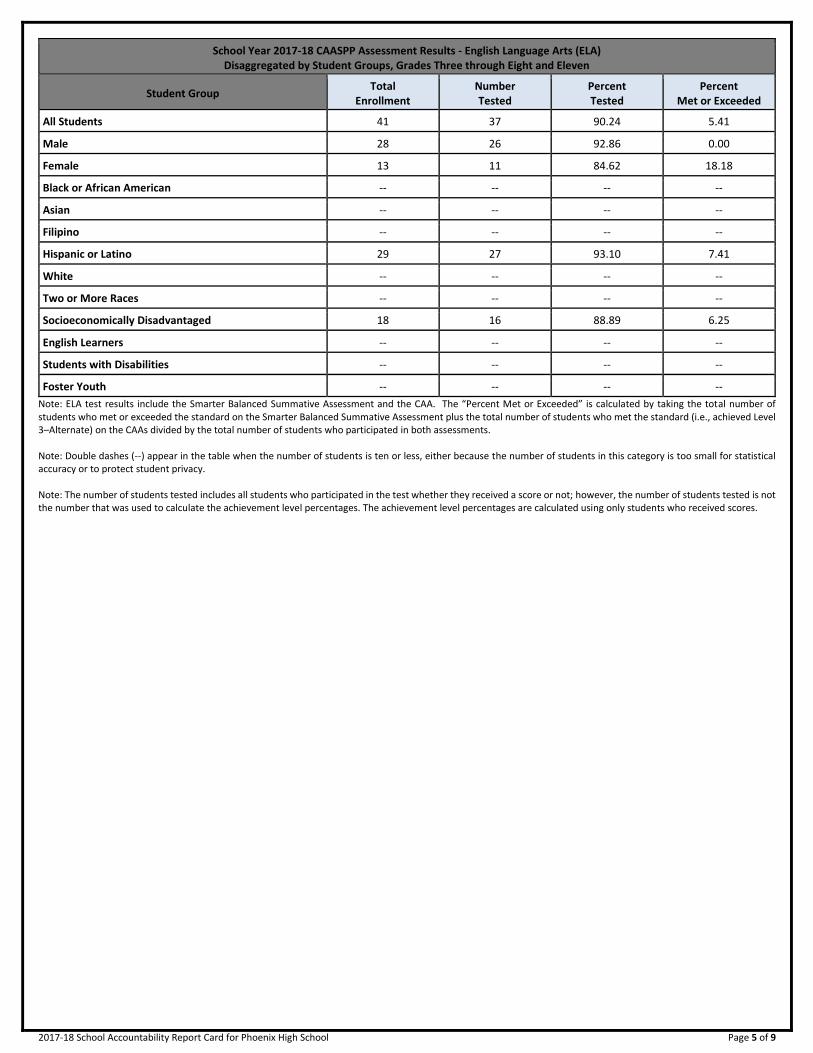
School Year 2017-18 CAASPP Assessment Results - English Language Arts (ELA) Disaggregated by Student Groups, Grades Three through Eight and Eleven
Student Group Total
Enrollment Number Tested
Percent Tested
Percent Met or Exceeded
All Students 41 37 90.24 5.41
Male 28 26 92.86 0.00
Female 13 11 84.62 18.18
Black or African American -- -- -- --
Asian -- -- -- --
Filipino -- -- -- --
Hispanic or Latino 29 27 93.10 7.41
White -- -- -- --
Two or More Races -- -- -- --
Socioeconomically Disadvantaged 18 16 88.89 6.25
English Learners -- -- -- --
Students with Disabilities -- -- -- --
Foster Youth -- -- -- --
Note: ELA test results include the Smarter Balanced Summative Assessment and the CAA. The “Percent Met or Exceeded” is calculated by taking the total number of students who met or exceeded the standard on the Smarter Balanced Summative Assessment plus the total number of students who met the standard (i.e., achieved Level 3–Alternate) on the CAAs divided by the total number of students who participated in both assessments. Note: Double dashes (--) appear in the table when the number of students is ten or less, either because the number of students in this category is too small for statistical accuracy or to protect student privacy. Note: The number of students tested includes all students who participated in the test whether they received a score or not; however, the number of students tested is not the number that was used to calculate the achievement level percentages. The achievement level percentages are calculated using only students who received scores.

2017-18 School Accountability Report Card for Phoenix High School Page 6 of 9
School Year 2017-18 CAASPP Assessment Results - Mathematics Disaggregated by Student Groups, Grades Three through Eight and Eleven
Student Group Total
Enrollment Number Tested
Percent Tested
Percent Met or Exceeded
All Students 41 34 82.93 0
Male 28 25 89.29 0
Female 13 9 69.23 0
Black or African American -- -- -- --
Asian -- -- -- --
Filipino -- -- -- --
Hispanic or Latino 29 25 86.21 0
White -- -- -- --
Two or More Races -- -- -- --
Socioeconomically Disadvantaged 18 14 77.78 0
English Learners -- -- -- --
Students with Disabilities -- -- -- --
Foster Youth -- -- -- --
Note: Mathematics test results include the Smarter Balanced Summative Assessment and the CAA. The “Percent Met or Exceeded” is calculated by taking the total number of students who met or exceeded the standard on the Smarter Balanced Summative Assessment plus the total number of students who met the standard (i.e., achieved Level 3–Alternate) on the CAAs divided by the total number of students who participated in both assessments. Note: Double dashes (--) appear in the table when the number of students is ten or less, either because the number of students in this category is too small for statistical accuracy or to protect student privacy. Note: The number of students tested includes all students who participated in the test whether they received a score or not; however, the number of students tested is not the number that was used to calculate the achievement level percentages. The achievement level percentages are calculated using only students who received scores.
C. Engagement
State Priority: Parental Involvement The SARC provides the following information relevant to the State priority: Parental Involvement (Priority 3): • Efforts the school district makes to seek parent input in making decisions for the school district and each school site
Opportunities for Parental Involvement (School Year 2018-19) At the time of the initial enrollment (orientation), a parent is required to attend a conference with the Associate Principal to discuss the expectations of all parties involved (parent, student and staff). The student's Personal Learning Plan is discussed with the student and parent to identify the specific needs that will have to be addressed in order for the student to reach his/her graduation goal, such as attending vocational training classes, night schools, and college classes. At the end of each six-week grading period, the homeroom teacher, student, and parent(s) hold a conference to discuss the student’s academic progress and any other specific needs the student may have. Phoenix parents and guardians are encouraged to be a part of the School Site Council and to volunteer during many of the Phoenix events.
State Priority: School Climate The SARC provides the following information relevant to the State priority: School Climate (Priority 6): • Pupil suspension rates; • Pupil expulsion rates; and • Other local measures on the sense of safety.

2017-18 School Accountability Report Card for Phoenix High School Page 7 of 9
School Safety Plan Phoenix has a very detailed, comprehensive safety plan that outlines protocols, systems, and procedures in the event of any/all emergencies. This plan also contains the yearly safety goals as determined by the students, staff, and parents. The Safety Plan is developed in conjunction with the Santa Teresa Safety Committee and reviewed by the School Site Council and District Safety Committee before it is presented to the East Side Union High School District Board of Trustees for adoption. The Safety Plan and drill procedures are reviewed during the year with all staff. Safety alerts are shared with all staff as needed throughout the school year. In addition, all required drills are calendared and completed and the results are communicated to all staff. Phoenix's campus is supervised by administration, advisors, campus monitor, one on-campus San Jose Police Officer, and certificated staff during school day hours. The Phoenix High School Site Safety Plan is in compliance with district polices that govern all school sites in developing, implementing a comprehensive, enforceable, and continuous living document that deals with Behavior policy, Rules and regulations, Dress code, Tardy, Attendance, Referral process, Multi-service team, Safety team and Protocols for safety/emergency drills. We have partnerships with community agencies, City of San Jose, San Jose Police Department, and other Safety and Mental Health agencies and groups that offer support services.
Suspensions and Expulsions
School 2015-16 2016-17 2017-18
Suspensions Rate 0.8 9.7 8.3
Expulsions Rate 0.0 0.0 0.0
District 2015-16 2016-17 2017-18
Suspensions Rate 3.8 4.0 3.7
Expulsions Rate 0.1 0.1 0.1
State 2015-16 2016-17 2017-18
Suspensions Rate 3.7 3.7 3.5
Expulsions Rate 0.1 0.1 0.1
D. Other SARC Information
The information in this section is required to be in the SARC but is not included in the state priorities for LCFF.
Academic Counselors and Other Support Staff at this School
Number of Full-Time Equivalent (FTE)
Academic Counselor------- 0.2
Counselor (Social/Behavioral or Career Development) 0
Library Media Teacher (Librarian) 0
Library Media Services Staff (Paraprofessional) 0
Psychologist------- 0
Social Worker------- 0
Nurse------- 0
Speech/Language/Hearing Specialist 0
Resource Specialist (non-teaching)------- 0
Other------- 0
Average Number of Students per Staff Member
Academic Counselor------- 385 * One Full Time Equivalent (FTE) equals one staff member working full time; one FTE could also represent two staff members who each work 50 percent of full time.

2017-18 School Accountability Report Card for Phoenix High School Page 8 of 9
Average Class Size and Class Size Distribution (Secondary)
Average Class Size Number of Classrooms*
1-22 23-32 33+
Subject 2015-16 2016-17 2017-18 2015-16 2016-17 2017-18 2015-16 2016-17 2017-18 2015-16 2016-17 2017-18
English------- ----------
19.0 20.0 21.0 6 2 3 2 2 1
Mathematics ----------
18.0 4
Science------- ----------
12.0 16.0 20.0 8 4 2 1
Social Science ----------
17.0 21.0 20.0 8 4 3 1
* Number of classes indicates how many classrooms fall into each size category (a range of total students per classroom). At the secondary school level, this information is reported by subject area rather than grade level.
Professional Development provided for Teachers Professional development opportunities for staff members are multifaceted and clearly and consistently linked to the state’s standards, district goals, the school’s core values, and occur during the school year and summer break. Our school has a coherent, comprehensive plan for professional development that is data driven and directly linked to teaching and learning. Not only do teachers and staff participate in staff development opportunities at the school, but they also take advantage of multiple professional development opportunities at the District and throughout the country. In addition, many teachers take professional growth classes at local colleges and universities and attend workshops offered by the Santa Clara County Office of Education. BTSA and new teacher orientation meetings support new instructors. The school has created and successfully implemented a collaboration model for professional development. School wide and departmental meetings are held regularly so that teachers can continue to work on professional development to support school-wide efforts to align curriculum with rigorous state content standards as well as to provide instructional support for literacy and differentiation to assure the achievement of all students. To ensure a cycle of continuous improvement, professional development is personalized to address the needs of all subject-area teachers, staff, and administrators. Not only do professional development activities for teachers reflect a best practices approach, but they also align with the California Standards for the Teaching Profession. Teachers and staff participate in professional development that is aligned with their individual fields and district plans at multiple levels. At the school level, professional development is structured to have a generalized focus (e.g., higher order thinking, teaching, and learning, Common Core State Standards, etc.), and specific facets of the professional development program (e.g., specific instructional strategies) are personalized to address the specific content area dynamics and needs. The district also offers a multitude of professional development opportunities to broaden teachers’ knowledge, enhance their classroom management skills, and augment their repertoire of best practices instructional strategies.
FY 2016-17 Teacher and Administrative Salaries
Category District Amount
State Average for Districts In Same
Category
Beginning Teacher Salary $55,349 $50,747
Mid-Range Teacher Salary $90,881 $86,127
Highest Teacher Salary $112,154 $106,915
Average Principal Salary (ES) $0
Average Principal Salary (MS) $0 $136,636
Average Principal Salary (HS) $146,943 $150,286
Superintendent Salary $286,275 $238,058
Percent of District Budget
Teacher Salaries 34.0 34.0
Administrative Salaries 4.0 5.0 * For detailed information on salaries, see the CDE Certificated Salaries &
Benefits webpage at www.cde.ca.gov/ds/fd/cs/.
FY 2016-17 Expenditures Per Pupil and School Site Teacher Salaries
Level Expenditures Per Pupil Average
Teacher Salary Total Restricted Unrestricted
School Site-------
$7,322 $0 $7,322 $81,086
District-------
♦ ♦ $7,376 $89,332
State------- ♦ ♦ $7,125 $85,815
Percent Difference: School Site/District -0.7 -7.4
Percent Difference: School Site/ State 10.8 -2.1
* Cells with ♦ do not require data. The California Department of Education issued guidance to LEAs on August 1, 2018, regarding how to calculate school-level per-pupil expenditures that will be reported on 2018-19 report cards.
Types of Services Funded
Phoenix High School has a 0.2 FTE Academic Counselor, funded by LCAP funds. Phoenix High School also has access to LCAP funded benefits from the Santa Teresa High School campus (ie. 1.0 FTE Social Worker, 0.5 FTE Librarian, 1.0 FTE Parent Community Involvement Specialist, etc.)

2017-18 School Accountability Report Card for Phoenix High School Page 9 of 9
Dropout Rate and Graduation Rate (Four-Year Cohort Rate)
Phoenix High School 2014-15 2015-16 2016-17
Dropout Rate 40.0 50.0 23.7
Graduation Rate 44.4 46.7 55.3
East Side Union High School District 2014-15 2015-16 2016-17
Dropout Rate 11.7 10.0 20.5
Graduation Rate 83.0 85.0 71.5
California 2014-15 2015-16 2016-17
Dropout Rate 10.7 9.7 9.1
Graduation Rate 82.3 83.8 82.7
Career Technical Education Participation
Measure CTE Program Participation
Number of pupils participating in CTE 21
% of pupils completing a CTE program and earning a high school diploma
100%
% of CTE courses sequenced or articulated between the school and institutions of postsecondary education
0%
Courses for University of California (UC) and/or California State University (CSU) Admission
UC/CSU Course Measure Percent
2017-18 Students Enrolled in Courses Required for UC/CSU Admission
100.0
2016-17 Graduates Who Completed All Courses Required for UC/CSU Admission
0.0
* Where there are student course enrollments.
2017-18 Advanced Placement Courses
Subject Number of AP Courses
Offered*
Percent of Students In AP Courses
Computer Science 0 ♦
English------- 0 ♦
Fine and Performing Arts 0 ♦
Foreign Language 0 ♦
Mathematics 0 ♦
Science------- 0 ♦
Social Science 0 ♦
All courses 0 .0
Completion of High School Graduation Requirements
Group Graduating Class of 2017
School District State
All Students 51.2 84.1 88.7
Black or African American 100.0 75.3 82.2
American Indian or Alaska Native 0.0 0.0 82.8
Asian 33.3 95.0 94.9
Filipino 0.0 92.2 93.5
Hispanic or Latino 46.0 76.3 86.5
Native Hawaiian/Pacific Islander 0.0 67.7 88.6
White 100.0 92.7 92.1
Two or More Races 0.0 89.2 91.2
Socioeconomically Disadvantaged 45.0 83.8 88.6
English Learners 42.9 62.3 56.7
Students with Disabilities 100.0 62.0 67.1
Foster Youth 0.0 59.3 74.1
Career Technical Education Programs Phoenix High School offers the following Career Technical Education Programs. These programs integrate core academic knowledge with technical and occupational knowledge to provide students with a pathway to postsecondary education and careers. Silicon Valley CTE (SVCTE)
• Variety of afternoon courses that prepare high school students for future careers and workforce. Work Experience
DataQuest DataQuest is an online data tool located on the CDE DataQuest web page at https://dq.cde.ca.gov/dataquest/ that contains additional information about this school and comparisons of the school to the district and the county. Specifically, DataQuest is a dynamic system that provides reports for accountability (e.g., test data, enrollment, high school graduates, dropouts, course enrollments, staffing, and data regarding English learners).
Internet Access Internet access is available at public libraries and other locations that are publicly accessible (e.g., the California State Library). Access to the Internet at libraries and public locations is generally provided on a first-come, first-served basis. Other use restrictions may include the hours of operation, the length of time that a workstation may be used (depending on availability), the types of software programs available on a workstation, and the ability to print documents.