physical and nutrient factors controlling algal succession
TRANSCRIPT

NATIONAL EUTROPHICATION MANAGEMENT PROGRAM
Physical and nutrient factors controlling algalsuccession and biomass in Burrinjuck
Reservoir
Technical ReportJanuary 2000
Ian Lawrence1, Dr Myriam Bormans2, Dr Rod Oliver2,Gail Ransom1, Dr Brad Sherman2, Dr Phillip Ford2, Dr Bob Wasson3
1. CRC for Freshwater Ecology2. CSIRO Division of Land and Water
3. Centre for Resources and Environmental Studies

Cooperative Research Centre for Freshwater Ecology
Ph: +61 02 6201 5168
Fax: +61 02 6201 5038
e-mail: [email protected]
http://freshwater.canberra.edu.au
ISBN: 0967704844

Burrinjuck
Bare trees must forever shiverIn this inundated land,Where the moonlight-fashioned shadowsInterlaced with silver bandsSteal across the silent water,Light and darkness hand in hand.Here the red hills old, untroubled,Curtained by the wispy fogs,Hear the boo-boo chime the hoursOer the throbbing song of frogs,Whilst sister rivers, sold to bondage,Victims of the master race,Chained to concrete walls forever,Are bloated and defaced.
Stuart Hamilton Hume
From He Heard the River Calling, The Life and Times of Stuart Hamilton Hume, Com-piled and edited by Jennifer Hume Macdougall 1996, Published by Jennifer Hume Mac-dougall
Permission of the Publisher to incorporate the poem is gratefully acknowledged.
iii

Acknowledgments
This research is part of the National Eutrophication Management Program (NEMP)which aims to develop an understanding of the causes of excessive algal activity in Aus-tralian fresh and estuarine waters, and to help managers use that understanding to reducealgal blooms. The project is jointly funded by the Land and Water Resources Researchand Development Corporation (LWRRDC) and the Murray Darling Basin Commission(MDBC).
This research was supported by the Australian Government’s Cooperative Research Cen-tre Program through the Cooperative Research Centre for Freshwater Ecology (CRCFE)and the CSIRO Division of Land and Water.
The CRCFE exists to improve the condition of Australia’s inland waters. It provides eco-logical understanding to improve inland waters through collaborative research, educationand resource management.
It is a collaborative venture between:
ACTEW Corporation La Trobe UniversityCSIRO Land and Water Lower Murray WaterDept. of Land and Water Conservation, NSW Melbourne WaterDept. of Natural Resources, Qld Monash UniversityDept. of Natural Resources and Environment, Vic Murray-Darling Basin CommissionEnvironment ACT Murray-Darling Freshwater Research CentreEnvironment Protection Authority, NSW University of CanberraEnvironment Protection Authority, Vic Sunraysia Rural Water AuthorityGoulburn-Murray Rural Water Authority Sydney Catchment AuthorityGriffith University
The contribution to this research by the CSIRO Division of Land and Water, and byDr Bob Wasson, Director of the Centre for Resources & Environmental Studies, ANU isgratefully acknowledged.
The research was substantially based on data collected by Commonwealth, ACT andNSW State agencies over the period 1976 to 1998. The support of ACT Electricity &Water, the NSW Department of Land & Water, and Environment ACT in providingstreamflow and water quality data, and in assisting in resolution of archival and qualitycontrol aspects of the data, is gratefully acknowledged.
Management implications of the research findings were developed in association withreservoir managers from around Australia, through a series of Reservoir Managers Work-shops. The contribution of the managers, and the support provided by LWRRDC,Goulburn-Murray Rural Water Authority and CSIRO Division of Land & Water in fa-cilitating the Workshops is gratefully acknowledged.
iv

Contents
Executive summary 1
1 Background and purpose of research 9
1.1 National Eutrophication Management Program . . . . . . . . . . . . . . 9
1.2 Research objectives . . . . . . . . . . . . . . . . . . . . . . . . . . . . . . 9
1.3 Outline of the Report . . . . . . . . . . . . . . . . . . . . . . . . . . . . . 10
2 Reservoir and catchment description 11
2.1 Description of Burrinjuck Reservoir . . . . . . . . . . . . . . . . . . . . . 11
2.2 Description of catchment . . . . . . . . . . . . . . . . . . . . . . . . . . . 12
2.2.1 Wastewater management . . . . . . . . . . . . . . . . . . . . . . . 12
2.3 Reservoir water quality . . . . . . . . . . . . . . . . . . . . . . . . . . . . 17
2.3.1 Data source . . . . . . . . . . . . . . . . . . . . . . . . . . . . . . 17
2.3.2 Water quality . . . . . . . . . . . . . . . . . . . . . . . . . . . . . 18
2.3.3 Algal biomass . . . . . . . . . . . . . . . . . . . . . . . . . . . . . 19
2.3.4 Algal composition . . . . . . . . . . . . . . . . . . . . . . . . . . . 24
2.4 Reservoir sediments . . . . . . . . . . . . . . . . . . . . . . . . . . . . . . 24
2.4.1 Analysis of cores . . . . . . . . . . . . . . . . . . . . . . . . . . . 24
2.5 External loading characteristics . . . . . . . . . . . . . . . . . . . . . . . 25
2.5.1 Meteorological conditions . . . . . . . . . . . . . . . . . . . . . . 25
2.5.2 Inflow and nutrient loading on Reservoir . . . . . . . . . . . . . . 28
3 Reservoir physical processes 35
3.1 Background . . . . . . . . . . . . . . . . . . . . . . . . . . . . . . . . . . 35
3.2 Stratification . . . . . . . . . . . . . . . . . . . . . . . . . . . . . . . . . 35
3.2.1 Previous studies . . . . . . . . . . . . . . . . . . . . . . . . . . . . 35
3.2.2 Analysis of data from 1976 to 1998 . . . . . . . . . . . . . . . . . 36
3.3 Mixing and inflow pathways . . . . . . . . . . . . . . . . . . . . . . . . . 37
3.3.1 Previous studies . . . . . . . . . . . . . . . . . . . . . . . . . . . . 37
v

3.3.2 Analysis of data from 1976 to 1998 . . . . . . . . . . . . . . . . . 38
3.4 Light conditions . . . . . . . . . . . . . . . . . . . . . . . . . . . . . . . . 43
3.4.1 Previous studies . . . . . . . . . . . . . . . . . . . . . . . . . . . . 44
3.4.2 Analysis of the 1976 to 1998 data . . . . . . . . . . . . . . . . . . 44
4 Reservoir nutrient pathways 49
4.1 Range of possible nutrient pathways . . . . . . . . . . . . . . . . . . . . . 49
4.1.1 Previous studies . . . . . . . . . . . . . . . . . . . . . . . . . . . . 49
4.1.2 Analysis of the 1976 to 1998 data . . . . . . . . . . . . . . . . . . 50
4.2 Bio-availability of nutrients . . . . . . . . . . . . . . . . . . . . . . . . . . 59
4.2.1 Previous studies . . . . . . . . . . . . . . . . . . . . . . . . . . . . 60
4.2.2 Analysis of the 1976 to 1998 data . . . . . . . . . . . . . . . . . . 60
4.3 Role of the sediments . . . . . . . . . . . . . . . . . . . . . . . . . . . . . 61
4.3.1 Previous studies . . . . . . . . . . . . . . . . . . . . . . . . . . . . 61
4.3.2 Analysis of the 1976 to 1998 data . . . . . . . . . . . . . . . . . . 62
4.3.3 Modifiers of sediment redox processes . . . . . . . . . . . . . . . . 66
4.4 Role of external loads . . . . . . . . . . . . . . . . . . . . . . . . . . . . . 68
4.4.1 In-stream modification to pattern and composition of nutrient dis-charge to the reservoir . . . . . . . . . . . . . . . . . . . . . . . . 69
4.4.2 Morphology of reservoir . . . . . . . . . . . . . . . . . . . . . . . 69
5 Factors determining algal biomass 71
5.1 Background . . . . . . . . . . . . . . . . . . . . . . . . . . . . . . . . . . 71
5.1.1 Availability of light . . . . . . . . . . . . . . . . . . . . . . . . . . 71
5.1.2 Availability of nutrients . . . . . . . . . . . . . . . . . . . . . . . 72
5.2 Previous Burrinjuck studies . . . . . . . . . . . . . . . . . . . . . . . . . 74
5.3 1976 to 1998 data: Algal biomass conditions . . . . . . . . . . . . . . . . 76
5.4 1976 to 1998 data: Explanatory analysis . . . . . . . . . . . . . . . . . . 83
5.4.1 Pre sewage phosphorus removal period: 1976 to 1978 . . . . . . . 83
5.4.2 Sewage phosphorus and nitrogen removal period: 1978 to 1983 . . 84
5.4.3 Post sewage phosphorus removal period: 1984 to 1998 . . . . . . . 85
5.5 Conclusions . . . . . . . . . . . . . . . . . . . . . . . . . . . . . . . . . . 86
6 Factors determining algal composition 87
6.1 Background . . . . . . . . . . . . . . . . . . . . . . . . . . . . . . . . . . 87
6.2 Previous Burrinjuck studies . . . . . . . . . . . . . . . . . . . . . . . . . 88
6.3 1976 to 1998 data: Algal composition conditions . . . . . . . . . . . . . . 89
6.4 1976 to 1998 data: Explanatory analysis . . . . . . . . . . . . . . . . . . 93
vi

6.4.1 Mixing conditions . . . . . . . . . . . . . . . . . . . . . . . . . . . 94
6.4.2 Limiting nutrient . . . . . . . . . . . . . . . . . . . . . . . . . . . 94
6.4.3 Form of nutrient . . . . . . . . . . . . . . . . . . . . . . . . . . . 95
6.4.4 Prevailing wind speeds and openness of water . . . . . . . . . . . 96
6.5 Conclusions . . . . . . . . . . . . . . . . . . . . . . . . . . . . . . . . . . 96
6.5.1 Entire analysis period: 1976 to 1998 . . . . . . . . . . . . . . . . . 97
6.5.2 Pre sewage nutrient removal period: 1976 to 1978 . . . . . . . . . 97
6.5.3 Sewage phosphorus and nitrogen removal period 1978 to 1983 . . 97
6.5.4 Post sewage phosphorus removal period . . . . . . . . . . . . . . . 98
7 Management Implications 99
7.1 What new understanding does the research provide? . . . . . . . . . . . . 99
7.2 What are the Reservoir management issues? . . . . . . . . . . . . . . . . 100
7.3 What are the Reservoir management options? . . . . . . . . . . . . . . . 102
7.4 What are the management information needs? . . . . . . . . . . . . . . . 102
7.5 What decision support tools are needed? . . . . . . . . . . . . . . . . . . 103
7.6 What are the monitoring needs? . . . . . . . . . . . . . . . . . . . . . . . 105
7.7 What are the research needs? . . . . . . . . . . . . . . . . . . . . . . . . 106
8 Bibliography 109
Appendices 113
A Description of the data base 113
A.1 Quality assurance . . . . . . . . . . . . . . . . . . . . . . . . . . . . . . . 113
A.2 Data storage structure and protocols . . . . . . . . . . . . . . . . . . . . 114
A.3 Future of the data set . . . . . . . . . . . . . . . . . . . . . . . . . . . . . 115
A.4 Statistical summaries . . . . . . . . . . . . . . . . . . . . . . . . . . . . . 115
B Outline of analysis methods 119
B.1 Water temperature . . . . . . . . . . . . . . . . . . . . . . . . . . . . . . 119
B.2 Mixing depth . . . . . . . . . . . . . . . . . . . . . . . . . . . . . . . . . 119
B.3 Euphotic depth . . . . . . . . . . . . . . . . . . . . . . . . . . . . . . . . 119
B.4 Nitrogen concentration . . . . . . . . . . . . . . . . . . . . . . . . . . . . 120
B.5 Internal reservoir nutrient loading . . . . . . . . . . . . . . . . . . . . . . 120
B.6 External loading on the Reservoir . . . . . . . . . . . . . . . . . . . . . . 121
B.7 Organic loading . . . . . . . . . . . . . . . . . . . . . . . . . . . . . . . . 123
B.8 Temperature of inflow to Reservoir . . . . . . . . . . . . . . . . . . . . . 124
vii

B.9 Inlet depositional zone redox analysis . . . . . . . . . . . . . . . . . . . . 125
B.10 Hypolimnetic P analysis . . . . . . . . . . . . . . . . . . . . . . . . . . . 125
B.11 Algal biomass . . . . . . . . . . . . . . . . . . . . . . . . . . . . . . . . . 126
C Glossary 127
D Abbreviations 133
viii

List of Tables
2.1 Details of Reservoir . . . . . . . . . . . . . . . . . . . . . . . . . . . . . 12
2.2 Details of catchment . . . . . . . . . . . . . . . . . . . . . . . . . . . . . 13
2.3 Summary of sub-catchments and land use . . . . . . . . . . . . . . . . . 15
2.4 Canberra and Queanbeyan population growth . . . . . . . . . . . . . . . 16
2.5 Summary of major wastewater treatment plants across the catchment . . 16
2.6 Summary of LMWQCC Tertiary treatment by-passes . . . . . . . . . . . 17
2.7 Summary of chemical symbols . . . . . . . . . . . . . . . . . . . . . . . 18
4.1 Estimate of relative contribution of FRP to Surface Mixed Layer . . . . . 52
4.2 In-stream modification to nutrient composition . . . . . . . . . . . . . . 70
6.1 Summary of factors determining algal composition . . . . . . . . . . . . 88
6.2 Association of algal composition with physical and chemical factors . . . 93
A.1 Summary of the Burrinjuck Reservoir Data set . . . . . . . . . . . . . . 114
A.2 Burrinjuck Reservoir algal data. . . . . . . . . . . . . . . . . . . . . . . 115
A.3 Burrinjuck Reservoir physical data. . . . . . . . . . . . . . . . . . . . . 116
A.4 Burrinjuck Reservoir nutrient data. . . . . . . . . . . . . . . . . . . . . 116
A.5 Burrinjuck Reservoir Inflows — Yearly Water and Nutrient Loads. . . . 117
A.6 Burrinjuck Reservoir Inflows — Daily Water and Nutrient Loads. . . . . 117
ix

x

List of Figures
2.1 Burrinjuck Reservoir site map . . . . . . . . . . . . . . . . . . . . . . . . 13
2.2 Hypsometric curve for volume, Burrinjuck Reservoir . . . . . . . . . . . . 14
2.3 Hypsometric curves for surface area, Burrinjuck Reservoir . . . . . . . . . 14
2.4 Channel cross sections, Murrumbidgee River arm. . . . . . . . . . . . . . 15
2.5 TP concentration, Site 104. . . . . . . . . . . . . . . . . . . . . . . . . . 20
2.6 FRP concentration, Site 104. . . . . . . . . . . . . . . . . . . . . . . . . . 20
2.7 TN concentration, Site 104. . . . . . . . . . . . . . . . . . . . . . . . . . 21
2.8 NOx concentration, Site 104. . . . . . . . . . . . . . . . . . . . . . . . . . 21
2.9 NH3 concentration, Site 104. . . . . . . . . . . . . . . . . . . . . . . . . . 22
2.10 Si concentration, Site 104. . . . . . . . . . . . . . . . . . . . . . . . . . . 22
2.11 Chlorophyll ’a’ and algal cell numbers by major groups . . . . . . . . . . 23
2.12 Precipitation for Yass meterological station. . . . . . . . . . . . . . . . . 26
2.13 Wind speed at 9:00 am for Yass meterological station. . . . . . . . . . . . 26
2.14 Wind speed at 3:00 pm for Yass meterological station. . . . . . . . . . . . 27
2.15 Daily mid-range air temperature for Yass meterological station. . . . . . 27
2.16 Average daily solar radiation, Canberra. . . . . . . . . . . . . . . . . . . 28
2.17 External water load and water level, Burrinjuck Reservoir. . . . . . . . . 29
2.18 External TP load, Burrinjuck Reservoir. . . . . . . . . . . . . . . . . . . 30
2.19 External TN load, Burrinjuck Reservoir. . . . . . . . . . . . . . . . . . . 30
2.20 External Si load, Burrinjuck Reservoir. . . . . . . . . . . . . . . . . . . . 31
2.21 External TOC load, Burrinjuck Reservoir. . . . . . . . . . . . . . . . . . 31
2.22 External TP point and non point source load . . . . . . . . . . . . . . . . 32
2.23 Cumulative external loads, Burrinjuck Reservoir. . . . . . . . . . . . . . . 32
3.1 Average temperature profile, 1976 to 1996 . . . . . . . . . . . . . . . . . 37
3.2 Longitudonal temperature profile, Summer . . . . . . . . . . . . . . . . . 38
3.3 Longitudonal temperature profile, Winter . . . . . . . . . . . . . . . . . . 39
3.4 Conductivity and FRP profiles, Chaffey Reservoir. . . . . . . . . . . . . . 40
3.5 Reservoir surface temperature and inflow temperature at Uriarra . . . . . 41
xi

3.6 Reservoir dominant flow pathways . . . . . . . . . . . . . . . . . . . . . . 42
3.7 The effect of light availability on algal growth . . . . . . . . . . . . . . . 43
3.8 Turbidity, Site 104. . . . . . . . . . . . . . . . . . . . . . . . . . . . . . . 46
3.9 Secchi depth (1977 to 1998). . . . . . . . . . . . . . . . . . . . . . . . . . 46
3.10 Seasonal pattern of surface mixed layer depth . . . . . . . . . . . . . . . 47
3.11 Euphotic depth, Sites 101, 104 & 108. . . . . . . . . . . . . . . . . . . . . 47
3.12 Mixed layer depth and euphotic depth. . . . . . . . . . . . . . . . . . . . 48
4.1 FRP Load, Taemus Bridge and External . . . . . . . . . . . . . . . . . . 51
4.2 TP Load, Taemus Bridge and External . . . . . . . . . . . . . . . . . . . 52
4.3 Hypolimnetic phosphorus and algal volume, Chaffey Reservoir. . . . . . . 53
4.4 Algal biomass vs. hypolimnetic FRP at turnover . . . . . . . . . . . . . . 54
4.5 Lake redox model estimates of Chlorophyll ’a’ . . . . . . . . . . . . . . . 56
4.6 Nutrient sedimentation and remobilisation . . . . . . . . . . . . . . . . . 57
4.7 FRP contributed by pore water as a function of drawdown . . . . . . . . 58
4.8 Reach based TP internal loading . . . . . . . . . . . . . . . . . . . . . . 63
4.9 Reach based internal TN loading . . . . . . . . . . . . . . . . . . . . . . 64
4.10 Reach based internal SS loading . . . . . . . . . . . . . . . . . . . . . . . 65
4.11 Sequence of sediment redox processes . . . . . . . . . . . . . . . . . . . . 67
5.1 Factors influencing algal growth and composition . . . . . . . . . . . . . 72
5.2 Chlorophyll ’a’ vs bioavailable phosphorus, SE-Australia . . . . . . . . . 73
5.3 Environmental characteristics supporting Cyanobacteria blooms . . . . . 75
5.4 Reservoir average TP as a function of time and station. . . . . . . . . . . 77
5.5 Reservoir average FRP as a function of time and station. . . . . . . . . . 78
5.6 Reservoir average NOx as a function of time and station. . . . . . . . . . 79
5.7 Reservoir average NH3 as a function of time and station. . . . . . . . . . 80
5.8 Reservoir average NH3:NOx ratio as a function of time and station. . . . 81
5.9 Reservoir average Chlorophyll ’a’ as a function of time and station. . . . 82
5.10 Chlorophyll ’a’ to TP ratio . . . . . . . . . . . . . . . . . . . . . . . . . . 83
5.11 Bottom DO and NH3 to NOx ratio, Station 104 . . . . . . . . . . . . . . 84
6.1 Sucession of Cyanobacteria, Chlorophyta and Diatoms. . . . . . . . . . . 89
6.2 Reservoir average Diatoms as a function of time and station. . . . . . . . 90
6.3 Reservoir average Cyanobacteria as a function of time and station. . . . . 91
6.4 Reservoir average Chlorophyta as a function of time and station. . . . . . 92
6.5 (NOx+ NH3):FRP ratio in the SML . . . . . . . . . . . . . . . . . . . . . 95
6.6 Redox scale and equilibrium phases for selected nutrients and metals . . 96
xii

7.1 Algal processes and catchment land use and management. . . . . . . . . 104
B.1 Reach based internal reservoir loading. . . . . . . . . . . . . . . . . . . . 122
xiii

xiv

Executive summary
Background
The National Eutrophication Management Program was established in 1995 by the Landand Water Resources Research Corporation and the Murray-Darling Basin Commission,to provide the scientific underpinning necessary for the effective management of algalblooms.
The Burrinjuck algal succession research project was one of a large number of projectsfunded in a multi-pronged approach to research. The primary focus of the projecthas been analysis to better describe the factors driving algal growth in reservoirs anddetermining algal composition in reservoirs.
Algal blooms are now a widespread and recurrent reservoir management problem, havingthe potential for severe environmental, social and economic impacts. An importantcomponent of the Burrinjuck project has been the development, in collaboration withmanagers, of guidelines that enable better management of reservoirs in limiting theincidence and severity of algal blooms.
Factors determining algal growth and composition in reservoirs
The availability of nutrient, light and mixing conditions, the water residence time andtemperature are the major determinants of algal growth and composition. Both biomasslevels and composition may be further modified by grazing by zooplankton. The inter-play of these factors are complex and variable, even within a single reservoir, reflectinglatitude; catchment land uses and management; reservoir depth, shape and drawdownconditions; and seasonal climatic variability.
Physical conditions prevailing within Burrinjuck Reservoir
A range of important vertical and longitudinal physical partitioning conditions have animpact on nutrient pathways and on algal biomass and composition. During early sum-mer, the surface waters of lakes are heated by adsorption of solar radiation, progressively
1

Executive summary
becoming warmer than the deeper waters. The Burrinjuck analysis indicated that thereis a strong pattern of vertical thermal gradients over summer periods, partitioning theReservoir into a surface epilimnion zone (or surface mixed layer) and a deep hypolimnionzone (or bottom waters), separated by a thermocline.
With cooling of the mixed surface layer during autumn, the depth of the surface mixedlayer increases, progressively entraining the cool bottom waters, until the full Reservoirdepth is mixed (reaches a uniform temperature). This transition from a stratified to afully mixed condition is sometimes referred to as reservoir turnover.
There is also a strong pattern of longitudinal partitioning of water, with well mixed inletzones in the upper shallow reaches, and stable stratified zones across the deeper middleand downstream reaches during summer months, but fully mixed waters over the lateautumn to spring months.
The attenuation of light (by absorption and scattering) through water with depth, limitsthe zone in which algal growth is possible to the surface layer (defined as the euphoticdepth). The extent of light penetration may be further reduced as a result of elevatedturbidity. The ionic composition of Burrinjuck waters is predominantly sodium. As aresult, the Reservoir is characterised by sustained high levels of fine suspended clay andorganic particles which limit light penetration into the water column, thereby limitinglight availability for algae other than those able to maintain a position close to thesurface.
There is a seasonal pattern of light conditions, with low euphotic depth and deep mixedlayer depth in winter, and higher euphotic depth and shallower mixed layer depth insummer.
Nutrient availability within Burrinjuck Reservoir
In addition to sufficient light the algae also require nutrients. Although a wide rangeof nutrients are required it is the availability of nitrogen and phosphorus that usuallyregulate algal growth when light conditions are sufficient.
The Burrinjuck research identified seven possible pathways for nutrient transfer to thesurface mixed layers, with several pathways potentially contributing at any one time, andwith switching between pathways over time dependant on physical mixing conditions,reservoir outlet arrangements and reservoir drawdown. The research indicates that inBurrinjuck:
1. the ’direct pathway’ (algal up-take of nutrients directly discharged into reservoirs)is the least likely nutrient pathway for many Australian reservoirs;
2. the ’internal loading related pathways’ (release of nutrients from the sediments asa result of elevated organic loading) are the most likely nutrient pathways.
The algal growth stimulus provided by the transfer of nutrients may be further modified
2

Executive summary
by the nutrient bio-availability. Some forms of nutrients are not bio-available, others arenot directly bio-available, while inorganic forms are assumed to be directly bio-available.The level of bio-availability of organic carbon is a critical factor in determining themicrobial growth rates potentially resulting in reducing conditions in sediments. Organiccarbon also exhibits a range of bio-availability levels from low rates of bio-availability(refractory) to high rates of bio-availability (labile) forms.
The research identified that reservoir sediments are the major pool of nutrients, whichlargely mediate (via internal loading) the availability of nutrients for algal growth. Con-sequently, an understanding of sediment redox processes is critical to an understandingof the conditions and rates of release of nutrients to overlying waters. The rate of supplyand deposition of organic carbon (from external loads) is the major driver of reducingconditions. Thermal stratification significantly exacerbates the reducing potential dueto the barrier to oxygen transfer from the atmosphere, through the water column to thesediments.
It appears that it is the availability of nutrients which largely determines algal biomassin Burrinjuck Reservoir, so it appears likely that neither light limitation nor grazing havea significant impact on biomass levels.
Algal composition and succession within Burrinjuck Reservoir
Algae which are dependent on mixing currents for circulation through the euphotic zoneare disadvantaged under the low mixing conditions which commonly prevail over summerperiods across Australian temperate regions. Consequently, mixing conditions are animportant factor influencing algal composition and succession.
Algal composition and succession patterns in Burrinjuck reflected seasonal flow, temper-ature, mixing and nutrient factors, as follows:
1. elevated levels of inflow and associated mixing, and silica concentrations in Spring,with dominance of Diatoms under these conditions;
2. reduced inflow and thermal stratification (reduced levels of mixing and nutrients)over summer, with a shift in dominant algae to greens in early Summer;
3. potential nutrient limitation and depressed mixing regimes in late summer, with ashift in dominant algae to non-N-fixing blue-green algae (under high ammonia orreducing conditions) or motile forms of green algae (under low ammonia—high ni-trate conditions), or N-fixing blue-green algae in situations where nitrogen becomeslimiting over the summer period.
While a substantial amount of zooplankton data had been collected, the level of spe-ciation was insufficient to assess the potential impact of grazing on algal biomass andcomposition.
3

Executive summary
Response to reduction in nutrients discharged in Canberra sewage effluent
In 1978, the ACT authorities commissioned a new sewage treatment plant, incorporatingprovision for removal of both phosphorus (97%) and nitrogen (95%). The plant phos-phorus removal facility was commissioned over the period 1978 to 1980, with operationof the nitrogen removal facility for limited periods during 1980 to 1983.
As noted above, the research identified a complex range of factors determining Reservoiralgal responses and processes, such that it is difficult to disassociate one factor from thecumulative and interactive range of factors. Never the less, as a result of the analysis,it is now possible to make a number of observations with reasonable confidence. In theperiod post 1983, there was:
1. a significant reduction in phosphorus concentration and change in nutrient forms;
2. a substantial diminution of redox conditions in bottom waters during the non ni-trogen removal periods;
3. a substantial reduction in algal biomass, except for periods of low Reservoir levels;
4. a shift in algal composition, from dominance of blue-greens over summer periodsto greens and flagellated algae.
The research highlighted the importance of substantial reduction in phosphorus andBOD, and the provision of a well nitrified effluent, in contributing to these changes. There-occurrence of blue-green algal blooms under conditions of Reservoir drawdown pointto the continued significant levels of organic carbon loading from the catchment. Theprovision of an effluent high in nitrate (NO3) appears to buffer the affect of the organiccarbon under conditions other than low Reservoir operating levels. As noted below, themanagement objective needs to be one further reducing the organic loading from thecatchment in the future.
Reservoir management
As part of the Burrinjuck algal research project, Reservoir Managers’ Workshops wereundertaken with a view to:
1. transferring the new understanding of the major factors driving algal growth andcomposition in reservoirs;
2. identifying the major implications and operational issues for reservoir managers;
3. identifying the range of possible reservoir algal management options;
4. developing management guidelines and identifying related information needs.
4

Executive summary
Implications of findings for management
Management of algal blooms is strongly related to other water quality managementconsiderations: thermal pollution; DO; metals; organics; pathogens. Consequently, thereis a need to consider algal management in association with other in-reservoir water qualityand water supply objectives, and information guiding reservoir management respondingto all of these objectives.
Reservoirs are just one line of defence in the management of algae, taste and odour,pathogens, etc. There is a need for an integrated strategy together with catchmentmanagement, stream management, water supply treatment, and consumer awarenessand management responsibilities.
The new understanding of pathways and processes points to the adoption of differentmanagement options requiring new supporting information and guidelines, for example,sources and management of organic carbon, inlet zone management, criteria regardingpotential for drawdown impacts, and guidelines on selection of outlet level.
The research highlights the complexity of different and changing pathways and processes,and the need to provide the reservoir manager with information necessary to determineprevailing processes and appropriate management responses. How is this informationto be packaged such that it is accessible and relevant and covers a diverse range ofconditions?
Management options
In the light of the information on processes, a wide range of options for better managingalgal blooms was identified. They included:
1. Improved information related strategies, including raising awareness of community(living with blue-green algae), and managers (pressure-state pathways and process-es and management options).
2. adoption of catchment management strategies, including at-source managemen-t, interception and in-stream management strategies, to address loading on theReservoir.
3. reservoir management strategies:
• inlet zone management strategies;
• control of draw-down rates and minimum reservoir levels;
• selection of off-take level;
• sediment redox management;
• mechanical aeration and oxygenation of bottom waters;
• bio-manipulation;
• turbidity: sediment re-suspension management;
5

Executive summary
• chemical coagulation of suspended soil particles or precipitation of nutrients;
• use of algacides.
Management information needs
In order to select options appropriate to local conditions, and to apply the options inoperational terms, the Reservoir Managers Workshops identified the need for a range ofinformation, including:
1. better definition of management objectives, particularly in the case of multi-purposereservoir operation;
2. guidance on techniques for assessment of risk of algal bloom occurrence for localreservoirs and changing seasonal conditions;
3. simple tools for determining the dominant pathway/process for local reservoirs;
4. information on the range of possible options, including guidelines on the selectionof options and decision support tools guiding reservoir operations;
5. guidance on techniques for assessment of performance of options.
Management guidelines
The preliminary development of management guideline frameworks has been undertakenas part of the Burrinjuck project. They include an outline of Reservoir and CatchmentManagement Guidelines, and are included in the Reservoir Managers’ Workshops Report(Lawrence et al. 2000).
Monitoring needs
In order to respond to the information needs and reservoir operation decision guidelines,a range of monitoring programs are required. Monitoring covers operations related moni-toring, performance assessment related monitoring, and system understanding (research)related monitoring. In addition, the research pointed to a number of limitations of cur-rent programs that need to be addressed. The monitoring needs are listed in Chapter 7of this Report.
Research needs
The new understandings regarding algal processes require further elaboration and testing,particularly related to their translation into reservoir management decision support tools.Research needs include:
6

Executive summary
1. Further description of the form and pattern of delivery of nutrient and organicmaterial to reservoirs, and sedimentation patterns in the the inlet and shallowdepositional zones, including the impact of rapid drawdown.
2. Development of onditions and processes associated with nutrient transfer from bot-tom waters to surface waters during periods of stratification, including spatial andtemporal scale aspects.
3. Development of improved models for estimating general mixing and light condi-tions, including consideration of temperature stratification, wind mixing, particleaggregation, and photosynthetic pigments of natural waters.
4. Examine the role of different forms of nitrogen, and critical light requirements ofCyanobacteria and microalgae, to develop a more reliable basis for predicting theinfluence of mixing and turbidity on their growth.
5. Examine the environmental conditions influencing the growth of benthic algae andtheir impact on nutrient and carbon dynamics.
6. The development of a reservoir classification system as the basis for translation ofbroadly based management option guidelines to local condition.
7. The development of simple dynamic models enabling managers to link reservoiralgal responses with catchment runoff and stream flow and nutrient delivery pro-cesses, and reservoir drawdown and discharge level factors.
7

8

Chapter 1
Background and purpose of research
1.1 National Eutrophication Management Program
The National Eutrophication Management Program (NEMP) was established in 1995by the Land and Water Resources Research Corporation and the Murray-Darling BasinCommission to provide the scientific underpinning necessary for the effective manage-ment of algal blooms.
Burrinjuck Reservoir was selected as one of a large number of NEMP projects, in view ofthe extensive streamflow, water quality and algal data base available for the Reservoir,covering the period 1976 to 1998; and in view of the significant reduction (90%) inphosphorus loading on the Reservoir in 1978, resulting from the commissioning of anutrient removal wastewater treatment plant in Canberra. The Project was undertakenby the Cooperative Research Centre for Freshwater Ecology, in association with theCSIRO Division of Land & Water. Dr Bob Wasson, initially from CSIRO and later fromthe Australian National University, was also a contributor to the Project.
1.2 Research objectives
Objectives of the Project comprised:
1. To provide an enhanced understanding of the relationship between reservoir inflow,nutrient loading, mixing and drawdown and algal biomass and composition, for theperiod 1976 to 1996. In view of the re-emergence of algal blooms in the period1997/1998, the study was later extended to include this period.
2. To collate a valuable and long term reservoir physical, chemical and biological waterquality data set.
3. To develop, in association with reservoir managers, guidelines on reservoir manage-ment practices.
9

Chapter 1. Background and purpose of research
1.3 Outline of the Report
Chapter 2 summarises:
1. the Reservoir details and history in respect to volume, surface area, and externalwater, nutrient and organic loads;
2. the in-reservoir water quality;
3. the catchment details and history in respect to area, land use, population growth,wastewater management.
Chapter 3 describes the physical mixing and light conditions prevailing in the reservoir forthe period 1976 to 1998, and examines the factors determining these responses, includinginflow temperature and discharge arrangement.
Chapter 4 examines the pathways and processes determining the availability of nutrientto algae in surface waters, the bio-availability of nutrients, the role of sediments, and therole of external loads in modifying nutrient pathways and supply rates.
Chapters 5 and 6 examine the factors determining algal biomass and composition, in-cluding mixing, light availability, and nutrient availability.
Chapter 7 considers the implications of the findings for reservoir and catchment man-agement.
Management options and guidelines are addressed in a separate report, Factors control-ling algal growth and composition in reservoirs (Lawrence et al. 2000).
10

Chapter 2
Reservoir and catchment description
2.1 Description of Burrinjuck Reservoir
Construction of Burrinjuck Dam (originally Barren Jack) commenced in 1907, with com-mencement of storage in 1913. The Reservoir was designed as an irrigation storage servic-ing the Murrumbidgee Irrigation Area. The uses of water from the Murrumbidgee Riverdownstream of the Dam were later extended to include the South Western TablelandsWater Supply Scheme.
Rapid growth in the Murrumbidgee and Colleambally Irrigation Areas through the 1960sresulted in greater annual abstraction of water from Burrinjuck for irrigation water sup-ply purposes than pre 1960. Diversion of part of the Snowy River to the MurrumbidgeeRiver at Gundagai (via Blowering Dam and the Tumut River) also contributes watersupply for these irrigation areas.
The Reservoir has a dendritic shape, with long and narrow reaches for each of the threerivers discharging to the Reservoir. This is shown in Figure 2.1, a plan of BurrinjuckReservoir.
Figure 2.1 also identifies the location of the major water quality sampling stations. Whilelongitudinal comparisons have been made through the Reservoir, the bulk of the analysishas focussed on Station 104 as typical of other stations, and having the most extensiveand intensive data set. Where analysis is performed on a reach basis (for example,internal Reservoir nutrient loading) the area defined as the ’reach’ extends from thelisted station in both an up and down-stream direction, to a point that is half way tothe next station. For example, Station 101 reach starts mid-way between Station 201and 101, and ends midway between Station 101 and 102.
Figures 2.2 and 2.3, hypsometric curves for Burrinjuck Reservoir, illustrate the changein volume and surface area as a function of depth at the Dam wall. Separate curves werecomputed for each of the Murrumbidgee arm reaches, in order to undertake the massbalances of pollutants over time.
11

Chapter 2. Reservoir and catchment description
Table 2.1: Details of Reservoir
Volume 1026 GLSurface area 6000 haFull supply level AHD 363.6 mMean depth 17.1 mLength (Murrumbidgee Arm) 55 kmMean annual inflow 1400 GLMean annual water load 23 mMean annual TP load:
Pre Canberra sewage nutrient removal 3.6 g/m2
Post Canberra sewage nutrient removal 0.7 g/m2
Outlet structure:Bottom penstocks power station AHD 322.4 mBottom needle valves AHD 322.4 m & 314.2 mSluice gate AHD 349.9 m
(high inflow release)Stratfication pattern MonomicticOperation Irrigation water supply release
November to February
Figure 2.4, cross sections Murrumbidgee River arm, indicate the significant variation inthe Reservoir cross section longitudinally.
2.2 Description of catchment
The catchment draining to Burrinjuck Reservoir comprises predominantly low intensi-ty grazing and national park land uses. The Canberra and Queanbeyan urban areasconstitute the major population centre within the catchment, and up until 1978, themost significant source of nutrients discharging in the catchment. Details are given inTables 2.2 to 2.4.
2.2.1 Wastewater management
Over the last 15 years, there has been development of feed lots and aquaculture facili-ties within the catchment. Environmental controls have been put in place to limit thedischarge of nutrients from these sites. There has also been progressive upgrading ofwastewater treatment plants at Queanbeyan (phosphorus removal), Yass (land disposal)and Cooma (phosphorus removal) over the last 15 years.
During the 1970s and early 1980s, nuisance algal blooms emerged over the spring, summerand early autumn periods, in the Murrumbidgee and Yass arms of the Reservoir, andalong the Murrumbidgee River downstream of Canberra. Both the recreational amenityof the Reservoir and downstream water supply were impacted as a result of the blooms.
12

Chapter 2. Reservoir and catchment description
Figure 2.1: Burrinjuck Reservoir site map
Table 2.2: Details of catchment
Area 13,000 km2
Land use 47% rural (grazing), 50% national park & forest, 1% ruralresidential (4 ha to 16 ha lots), and 2% urban.
Climate Sub-alpine mountain ranges to semi-arid plains.Geology Granites, odivician & silurian sedimentary shales, limestone.Soils Alpine humus soils in alpine areas, lithosols on upper slopes,
podsolics on the intermediate slopes, solodic soils on footslopes and plains, and alluvium on floodplains.
Rainfall Over 1000 mm/yr (sub-alpine areas) to 500 mm/yr (semi-aridareas).
Catchment runoff 1400 GL/yr as measured at Burrinjuck Dam.Water chemistry Na+ > Mg2+ + Ca2+ :: HCO −
3 > Cl− > SO 2−4
13

Chapter 2. Reservoir and catchment description
0
10
20
30
40
50
60
70
0 200000 400000 600000 800000 1000000Volume (Ml)
Dep
th (
m)
VolumeMeasured volume
Figure 2.2: Hypsometric curve for volume, Burrinjuck Reservoir
0
10
20
30
40
50
60
70
0.00E+00 1.00E+07 2.00E+07 3.00E+07 4.00E+07 5.00E+07 6.00E+07Surface Area (m2)
Dep
th (
m)
Surface areaMeasured SA
Figure 2.3: Hypsometric curves for surface area, Burrinjuck Reservoir
In 1973, the Commonwealth authorities commenced the construction of a tertiary wastew-ater treatment plant, designed to treat all of Canberra’s domestic wastewater. Designof the plant, the Lower Molonglo Water Quality Control Centre (LMWQCC), included
14

Chapter 2. Reservoir and catchment description
310
315
320
325
330
335
340
345
350
355
360
365
0 200 400 600 800 1000 1200
Width (m)
Hei
ght (
AH
D)
Site 101Site 102Site 103Site 104Site 108
Figure 2.4: Channel cross sections, Murrumbidgee River arm.
Table 2.3: Summary of sub-catchments and land use
Sub-catchment
Land use area (km2) Mean annual flow
Nativevegeta-tion &grazing
Forestplanta-tion
Horti-culture
Ruralresi-dential
Urban Total Flow(GL/year)
Percentof total
Murrumbidgee 9075 203 36 128 225 9667 1010 73Yass 1495 1 23 75 4 1598 83 6Goodradigbee 1110 1110 290 21Burrinjuck 331 331Total 12011 204 59 202 229 12704 1383Percent 94.5 1.6 0.5 1.6 1.8 100 100
provision for 97% removal of phosphorus, 95% removal of nitrogen, and 98% removalof BOD. Commissioning of the new plant occurred in May 1978, with application of Premoval over the period 1979 to 1980, and P and N removal for the period 1981 to 1983.
The nitrogen removal component of the plant was closed in April 1983, and has notbeen operated since. The decision to close the nitrogen removal component was basedon the absence of any measured reduction in algal blooms over the 1981 to 1983 period,difficulties incurred in operating the component, and the high cost (methanol baseddenitrification process) of operating the component. Assessment of the performanceof the plant in reducing algal blooms over this period was complicated by significant
15

Chapter 2. Reservoir and catchment description
Table 2.4: Canberra and Queanbeyan population growth
Year Population Average annualstormwater discharge
(ML/yr)1950 50,000 10,0001960 90,000 18,0001970 170,000 34,0001980 260,000 52,0001990 330,000 66,0001995 360,000 72,000
drawdown (to 5% of storage volume) of the Reservoir over the 1980 to 1983 drought.
Following the refilling of the Reservoir in May 1983, and continued operation of the plantwith phosphorus removal only, the Reservoir was free of algal blooms until 1997.
A summary of the major wastewater treatment plants across the Burrinjuck catchmentis given in Table 2.5.
Table 2.5: Summary of major wastewater treatment plants across the catchment
Facility Description of treatmentprocess
Year SS/BOD/TPEffluent (mg/L)
Weston Ck STW Sedimentation, tricklingfilter.
1927 to 1978 40/50/8
Belconnen WPCC Activated sludge, aerationponds.
1970 to 1980 15/15/8
Fyshwick STW Sedimentation, tricklingfilter, aeration ponds.
1963 onwards Diverted toWeston Ck/LM
Queanbeyan STW Activated sludge, tricklingfilter, aeration ponds.
1940 to 19801980 onwards
30/30/815/15/0.5
Yass STW Pasaveer ditch, aerationponds.
1960 to 19801980 onwards
40/50/8Land disposal
Cooma STW Sedimentation tanks,trickling filter, aerationponds.
1950 to 19951995 onwards
30/30/830/30/1
Lower MolongloWQCC
Lime dosage, sedimentation,nitrification, clarification,filtration, chlorination/de-chlorination.
1978 onwards 5/5/0.03
16

Chapter 2. Reservoir and catchment description
During the period 1986 to 1995, LMWQCC experienced a number of operation difficul-ties, resulting in by-passing of the Tertiary (filtration) treatment stage, and on threeoccasions, loss of biological media from the nitrification tank.
Based on information provided by Environment ACT, the additional TP load in theby-pass was estimated as shown in Table 2.6.
Table 2.6: Summary of LMWQCC Tertiary treatment by-passes
Year TP Proportion ofbypassed annual load
(kg) (%)1986 210 3.31987 nil nil1988 929 91989 2953 271990 497 51991 3753 361992 3 0.21993 42 1.61994 1 <0.11995 389 12
These estimates have been included in the estimates of total load on Burrinjuck Reservoir,for purposes of algal response analysis.
In 1995, the construction of a by-pass dam, designed to intercept all potential by-passesup to a 1 in 6 year wet weather by-pass situation, was constructed.
2.3 Reservoir water quality
2.3.1 Data source
As part of the eutrophication abatement program, the Commonwealth authorities (until1989) and ACTEW and Environment ACT post 1989, together with the NSW Depart-ment of Land & Water Resources, have maintained a comprehensive streamflow, reservoirlevel, and physical, chemical and biological water quality monitoring program to assessReservoir response to management actions across the catchment.
Commencing in 1976, monitoring comprised fortnightly sampling of surface and bottomwaters across 10 sites through the Reservoir. In 1980 the program was reduced toapproximately monthly sampling, and this has been maintained to the present time.
Through the collaboration of ACTEW, DLWC and Environment ACT, an extensiveperiod of Reservoir water quality and algal data and stream flow and nutrient loadingdata has been made available, as the basis for the research Project. A major component
17

Chapter 2. Reservoir and catchment description
of the Project has been the acquisition and compilation of the data into a single dataset for the period 1976 to 1998, including quality validation of the data. Meteorologicaldata for the Dam site (DLWC) and Yass and Canberra Airport (Bureau of Meteorology)have been added to the data set. This data, together with Burrinjuck Reservoir sedimentcores taken and analysed by CSIRO Division of Land & Water, have been the sole basisof the research. Refer to Appendix A for details on the data set.
In the interests of clarity and conciseness, the chemical compounds are described through-out this Report by their chemical symbols. The following list, Table 2.7 summarises themajor nutrient groups addressed in the Report. Further information is available in theglossary in Appendix C.
Table 2.7: Summary of chemical symbols
P — PhosphorusTP — Total PhosphorusFRP — Filterable Reactive Phosphorus
N — NitrogenTN — Total NitrogenTKN — Total Kjeldahl NitrogenNOx — Nitrate + Nitrite NitrogenNH3 — Ammonia Nitrogen
C — CarbonTOC — Total Organic CarbonBOD — Biological Oxygen Demand
Si — Silica
2.3.2 Water quality
Previous studies
The Commonwealth authorities (Australian Department of Construction et al. 1978)undertook a study of Burrinjuck water quality and algal processes in 1978, based ondata collected over the November 1976 to August 1977 period (referred to hereafteras the ACT Region Water Quality Study (1978)). The monitoring was preceded bysignificant floods in August 1974 and October 1976.
The Study found that waters downstream of Canberra and Queanbeyan were heavilypolluted by nitrogen, phosphorus, bacteria, and after floods, by suspended material.Over a normal (streamflow) year, about three quarters of the nitrogen and phosphorusstem from sewage effluents and the remainded from runoff from rural and urban land.
18

Chapter 2. Reservoir and catchment description
The Study found that algal growth in the Murrumbidgee River downstream of Canberrahas been substantial and has given rise to unsightly floating mats during summer. It con-cluded these excessive growths are attributable to the release of nitrogen and phosphorusfrom Canberra.
The Study concluded that the quality of the waters of Burrinjuck Reservoir is determinedby that of the entering rivers. Major growth of algae in the Reservoir has been stimulatedby nutrients entering from the Murrumbidgee River.
FRP values monitored for surface waters were in the range of 50 to 400 µg/L in the inletzone, but 10 µg/L or less for the middle and lower reaches of the Reservoir.
Analysis of data from 1976 to 1998
Water quality data for the period 1976 to 1998 is summarised in the time series plots(Figures 2.5 to 2.10) of in-Reservoir water quality.
Both Figures 2.5 and 2.6 (TP and FRP respectively) indicate a significant reduction insurface and bottom concentrations of phosphorus post 1983.
Measurement of TKN, or direct measurement of TN, is only available for the period 1993onwards. Estimates of TN prior to this period were based on the sum of inorganic Nforms and Chlorophyll ’a’ measurements. The estimation of TN is described in furtherdetail in Appendix B.4.
The time series plots of TN, NOx and NH3 (Figures 2.7, 2.8 and 2.9 respectively) indi-cate a signficant reduction in nitrogen during the LMWQCC denitrification treatmentoperation periods (Sept 1979 to April 1981 and Sept 1981 to May 1983), but a significantincrease in NOx after the May 1983 period as compared to conditions prior to that time.
Figure 2.9 indicates a significant reduction in NH3 levels post 1983 in the bottom waters,whereas there is a marked increase in NOx in both top and bottom waters post 1983(Figure 2.8).
Figure 2.10 indicates Silica levels for Station 104. Low Silica levels in 1978/1979 areassociated with low flows during this period, while high Silica levels in 1992/1993 areassociated with high inflow conditions.
2.3.3 Algal biomass
Previous studies
A survey of algal composition in Burrinjuck over the period 1972 to 1975 (May V., 1978)identified a total of 31 species of algae. Toxic species included Anacystis (Microcystis)cyanea and Anabaena circinalis. Typically, the summer bloom commenced as Anabaena
19

Chapter 2. Reservoir and catchment description
0.00
0.05
0.10
0.15
0.20
0.25
0.30
1976 1980 1984 1988 1992 1996
TP
(m
g/L)
TP (bottom waters)TP (surface mixed layer)
0.9
Figure 2.5: TP concentration, Site 104 Burrinjuck Reservoir.
0.00
0.02
0.04
0.06
0.08
0.10
0.12
0.14
1976 1980 1984 1988 1992 1996
FR
P (
mg/
L)
FRP (bottom waters)
FRP (surface mixed layer)
0.26
Figure 2.6: FRP concentration, Site 104 Burrinjuck Reservoir.
20

Chapter 2. Reservoir and catchment description
0.0
0.5
1.0
1.5
2.0
2.5
3.0
3.5
4.0
4.5
1976 1980 1984 1988 1992 1996
TN
(m
g/L)
TN (bottom waters)
TN (surface mixed layer)5.58
Figure 2.7: TN concentration (calculated), Site 104 Burrinjuck Reservoir.
0.0
0.5
1.0
1.5
2.0
2.5
3.0
1976 1980 1984 1988 1992 1996
NO
x (m
g/L)
NOx (bottom waters)
NOx (SML)
Figure 2.8: NOx concentration, Site 104 Burrinjuck Reservoir.
21

Chapter 2. Reservoir and catchment description
0.0
0.2
0.4
0.6
0.8
1.0
1.2
1.4
1976 1980 1984 1988 1992 1996
NH
3 (m
g/L)
NH3 (bottom waters)
NH3 (surface mixed layer)
2.2
Figure 2.9: NH3 concentration, Site 104 Burrinjuck Reservoir.
0
1
2
3
4
5
6
7
1976 1980 1984 1988 1992 1996
Si (
mg/
L)
Figure 2.10: Si concentration, Site 104 Burrinjuck Reservoir.
22

Chapter 2. Reservoir and catchment description
from July to February, and Anacystis from November to August.
During the 1973-1974 summer, Anabaena was plentiful throughout the Reservoir, occur-ring from July 1973 to February 1974, with bloom levels from November to February.Anacystis occurred from November 1973 to August 1974, with a dense bloom fromNovember to February.
A major flood in August 1974 appeared to have flushed much of the algae from theReservoir, with growth in 1974/1975 much more sparse.
The ACT Region Water Quality Study (1978) identified algal biomass levels (Chlorophyll’a’) in the range of 40 to 80 µg/L in the inlet zone of the Murrumbidgee arm of theReservoir, with rapid reduction to levels of 10 µg/L through the middle and lower reachesof the Reservoir.
Algal monitoring undertaken by the Department of Housing and Construction identifiedAnabaena at Station 104 in February 1981 to 1983 (ACTEW Field Notes 1980-1983).
Analysis of data from 1976 to 1998
Algal biomass data for the period 1976 to 1998 is summarised in Figure 2.11, a timeseries plot of Chlorophyll ’a’ and algal cell numbers (by major groups) for Station 104.The Figure indicates a significant decrease in average annual algal biomass from 20 µg/LChlorophyll ’a’ pre 1983 to 5 µg/L Chlorophyll ’a’ post 1983.
0.1
1
10
100
1000
10000
100000
1000000
1976 1980 1984 1988 1992 1996
Alg
ae (
no
./mL
)
Cyanophyta (no/mL)Chlorophyta (no/mL)Diatoms (no/mL)Chlorophyll-A (ug/L)
Figure 2.11: Chlorophyll ’a’ and algal cell numbers (by major groups), Station 104 BurrinjuckReservoir.
23

Chapter 2. Reservoir and catchment description
Average annual values increase again, to an average 9 µg/L Chlorophyll ’a’, for theReservoir drawdown periods 1994 to 1995 and 1997 to 1998.
2.3.4 Algal composition
Previous studies
The ACT Region Water Quality Study (1978) noted that the succession pattern for1976/1977 comprised Diatoms following the flood event, followed by Chlorophyta inlate Spring, and Cyanobacteria in late December to March. There was a return ofChlorophyta through the middle and lower reaches of the Reservoir post March, butsustained high levels of Microcystis in the upstream reaches.
Analysis of data from 1976 to 1998
Figure 2.11 provides a time series plot of algal composition (by major groups) for theperiod 1976 to 1998 for Station 104. The figure indicates dominance of Cyanobacteriafor the period 1976 to 1983, and Chlorophyta for the period 1983 to 1996. Cyanobacteriais largely absent over the period 1983 to 1996, but re-appears in 1997/1998.
2.4 Reservoir sediments
The available data on both the sediments and the sediment nutrient release rates inBurrinjuck Dam is quite limited. Several cores were taken from the deepest part ofthe dam in 1985 and dated using 137Cs supplemented by charcoal and pollen variations.Phosphorus, iron and other major element concentrations in the solid material weremeasured by XRF and a detailed stratigraphy developed (Olley et al. 1995, Wassonet al. 1987). The results of this analysis are described below. Since this core is nowapproximately 12 years old, a more recent core (1997) was analysed also, and the resultsincorporated into this report. More recent work (Wasson et al., in press) used a rangeof algal pigments preserved in the sediments to infer the changes in species over time.In addition a detailed history of sediment deposition in different regions of the dam wasdeveloped. The sediment core data has a coarse time resolution and reflects flow eventsand changes in algal abundance on a yearly basis.
2.4.1 Analysis of cores
The longer core collected from the deepest part of the reservoir has been dated using137Cs and the chemical composition determined by XRF. The most significant finding isa significant change in the atomic P:Fe ratio from approximately 0.03 to 0.05 at a depthcorresponding to 1965 to 1970. The P:Fe ratio remained at this higher level throughout
24

Chapter 2. Reservoir and catchment description
the 1970s before starting to decline in the 1980s. While the decline has been attributed tothe operation of the LMWQCC, the explanation of the increase in the late 1960s remainsuncertain, though it coincides with an abrupt increase in the Canberra population anda significant shift from a prolonged dry to a wet period. It has yet to be shown whetherthe Canberra increase in nutrient loading caused a major increase of the catchment nonpoint source load in that period. The effects of a major inflow event in 1983 also needs tobe considered, as this event, together with other flood events, delivered a large fractionof the total P delivered to the reservoir during its existence.
The Chlorophyll ’a’ content of the sediments increases at the same point in the core withthe increase in the P:Fe ratio, suggesting that the total biomass reflects the abundanceof phosphorus i.e. it is a phosphorus limited system.
The pigments most characteristic of blue green algae also show a sudden increase inrelative abundance from 1967/1968. The second core was taken opportunistically fromthe mud banks of the river during low water in the dam. The Fe:P ratio is intermediatebetween the high and low values observed in the deeper core suggesting we have eitherfortuitously sampled sediment from the intermediate transition zone from the late 1960sor, more likely, that it is reworked material which combines sediments of different ages.The C:N ratio of this material is about 15:1, which is higher than the norm for sedimentsdominated by algal debris of 8:1, but considerably less than the ratio for terrestriallyderived organic materials (C:N of greater than 20). The simplest interpretation is thatthis material is a mixture of both the algal and terrestrial sources. Investigation of theC and N isotopic values of this material which may clarify this point is yet to be done.
2.5 External loading characteristics
2.5.1 Meteorological conditions
Figures 2.12 to 2.15 provide time series plots of daily meteorological conditions (precipita-tion, wind speed and air temperature) for the Meteorological Station at Yass. Figure 2.16summarises the estimates of seasonal solar radiation conditions for the Canberra region,based on sunshine hours at the Reservoir itself.
Analysis of data from 1976 to 1998
With the exception of rainfall, analysis of meteorological conditions indicates that windspeeds, temperature, humidity and solar radiation are predominantly seasonally based.
The wind data at Yass was compared with wind data measured at the Reservoir (Dam)for a limited period 29 November 1995 to 5 September 1996. The correlation of bothwind speed and direction is very poor, suggesting that meteorological conditions awayfrom the Reservoir are not representative of the factors influencing mixing conditionson the water. For example, for the period of comparison the average wind speed at
25

Chapter 2. Reservoir and catchment description
0
10
20
30
40
50
60
70
1976 1980 1984 1988 1992 1996
Pre
cip
itat
ion
(m
m/d
ay)
95 141
Figure 2.12: Precipitation for Yass meterological station.
0
2
4
6
8
10
12
14
16
18
20
1976 1980 1984 1988 1992 1996
Win
d s
pee
d (
m/s
)
41
Figure 2.13: Wind speed at 9:00 am for Yass meterological station.
26

Chapter 2. Reservoir and catchment description
0
2
4
6
8
10
12
14
16
18
20
1976 1980 1984 1988 1992 1996
Win
d s
pee
d (
m/s
)
Figure 2.14: Wind speed at 3:00 pm for Yass meterological station.
0
5
10
15
20
25
30
35
1976 1980 1984 1988 1992 1996
Tem
per
atu
re (
deg
.C)
Figure 2.15: Daily mid-range air temperature for Yass meterological station.
27

Chapter 2. Reservoir and catchment description
0
50
100
150
200
250
300
350
400
1976 1980 1984 1988 1992 1996
So
lar
rad
iati
on
(W
/m2)
Figure 2.16: Average daily solar radiation, Canberra.
Burrinjuck Reservoir is 3.4 m/s compared to an average wind speed at Yass of 3.0 m/s.
2.5.2 Inflow and nutrient loading on Reservoir
Previous studies
A study on the Lake Burley Griffin nutrient budget (Cullen & Rosich 1978) indicatedthat flood events contributed 69% of the TP loading on the lake for the 18 month periodmonitored, but these floods occupied only 9% of the time. A point source, Queanbeyansewage effluent, was the major source of TP during normal and drought flow periods,where it contributed 72% and 90% of TP load respectivly.
Catchment nutrient exports under high flow conditions were dominated by agriculturaland forested areas of catchments. The form of P from these areas was 67% to 93%particulate P and 7% to 33% FRP. Phosphorus discharged in sewage effluent comprised9% to 17% particulate P and 83% to 91% FRP under normal to low flow conditions.Consequently, flow conditions impacted on both the level of export and the compositionof phosphorus.
Flow conditions also influenced the proportion of TP retained in the lake, with 91%retained under low flow conditions, 65% under normal flow conditions, and 12% to 32%under flood flow conditions.
28

Chapter 2. Reservoir and catchment description
The ACT Region Water Quality Study (1978) notes that waters downstream of Canberraand Queanbeyan are heavily polluted by nitrogen, phosphorus, bacteria, and after floods,by suspended material. Over a normal (streamflow) year, about three quarters of thenitrogen and phosphorus stem from sewage effluents and the remainder from runoff fromrural and urban land.
The Study also noted that less than one third of the FRP and one tenth of the ammoniapassing the Molonglo-Murrumbidgee Rivers confluence, reach the Reservoir (under themedian to low flow conditions monitored).
Analysis of data from 1976 to 1998
Figures 2.17 to 2.21 provide time series plots of daily loading of water, TP, TN, Siand TOC on the Reservoir respectively. Figure 2.22 provides a breakdown of dailyTP loading in terms of point and non-point derived sources. Figure 2.23 provides acumulative loading plot for the period 1976 to 1998 for TP, TN, NOx and NH3.
0
50000
100000
150000
200000
1976 1980 1984 1988 1992 1996
Ext
erna
l Wat
er L
oad
(ML/
day)
0
10
20
30
40
50
60
70
Res
ervo
ir Le
vel (
m)
Water Load (ML/day)Reservoir Level (m)
Figure 2.17: External water load and water level, Burrinjuck Reservoir.
Figure 2.17 indicates that streamflow is extremely varied, from cessation of flow (otherthan point source effluent discharges) to extreme flood flows, equalling the whole Reser-voir volume in just a few days. The figure also indicates the pattern of water leveldrawdown during October to March irrigation water release period.
The Reservoir level in general is inversely related to annual inflow, with substantialdrawdown over the 1977, 1980 to 1983, 1988 and 1994 to 1998 drought periods. In thecase of the extended drought periods, the Reservoir was drawn down to less than 5%
29

Chapter 2. Reservoir and catchment description
1
10
100
1,000
10,000
100,000
1,000,000
1976 1980 1984 1988 1992 1996
TP
Lo
ad (
kg/d
ay)
TP load (total)
TP load (from LMWQCC)
Figure 2.18: External TP load, Burrinjuck Reservoir.
10
100
1,000
10,000
100,000
1,000,000
10,000,000
1976 1980 1984 1988 1992 1996
TN
Lo
ad (
kg/d
ay)
TN load (total)TN load (from LMWQCC)LMWQCC denitrification onLMWQCC denitrification off
Figure 2.19: External TN load, Burrinjuck Reservoir.
30

Chapter 2. Reservoir and catchment description
100
1,000
10,000
100,000
1,000,000
10,000,000
1976 1980 1984 1988 1992 1996
Si (
kg/d
ay)
Figure 2.20: External Si load, Burrinjuck Reservoir.
10
100
1,000
10,000
100,000
1,000,000
1976 1980 1984 1988 1992 1996
TO
C L
oad
(kg
/day
)
Figure 2.21: External TOC load, Burrinjuck Reservoir.
31

Chapter 2. Reservoir and catchment description
0
1
10
100
1,000
10,000
100,000
1,000,000
1976 1980 1984 1988 1992 1996
TP
Lo
ad (
kg/d
ay)
TP load (non-point source)
TP load (LMWQCC point source)
Figure 2.22: External TP point and non point source load, Murrumbidgee arm of Burrinjuck Reser-voir.
0
1,000,000
2,000,000
3,000,000
4,000,000
5,000,000
6,000,000
7,000,000
8,000,000
9,000,000
10,000,000
1976 1980 1984 1988 1992 1996
Cum
ulat
ive
load
(kg
)
Cumulative TN load (in-out)
Cumulative NH4 load (in-out)
Cumulative NOx load (in-out)
Cumulative TP load (in-out)
Figure 2.23: Cumulative external loads, Burrinjuck Reservoir.
32

Chapter 2. Reservoir and catchment description
of its capacity. Figure 2.17 also indicates the rapid rate of drawdown, with up to 30 mdrawdown in the 12 week irrigation water release period (drawdown rates of the orderof 3 m per week).
For the period 1976 to 1998, the Murrumbidgee River catchment contributed 66% of thetotal water load, Goodradigbee River 31% of the load and the Yass River just 3% of theload.
Figures 2.18 and 2.21 indicate the substantial reduction in TP and TOC loads associatedwith the improvement in P and TOC removal operation in the new LMWQCC in 1980.The Figures also illustrate periods of extreme loads of all nutrients associated withelevated runoff from the catchment area.
Figure 2.22 breaks down the TP loading into point and non-point sources. Prior to1980, the point sources (municipal wastewater) represented the major proportion of TPloading. Post 1980, the point-source represented less than 10% of the total TP loading.However, under low flow conditions (less than 1000 ML/day) typical of summer, it is75% of total loading.
Figure 2.19 presents the time series plot of TN loading on the Reservoir. Except for thebrief periods of de-nitrification treatment at LMWQCC in 1980 and 1981 to 1983, therehas been little change in the total TN loading. As noted previously (see Section 2.3.2),there has however been significant change in the form of the nitrogen, from high NH3
and organic forms pre 1980 to substantially NOx forms of N post 1980.
The time series plot of cumulative loads on Burrinjuck Reservoir (Figure 2.23) indicatesthat the Reservoir retained some 3000 tonnes of TP over the period 1976 to 1998. Thisvalue is of the same order as the estimate of TP in sediments derived from the sedimentcore analysis undertaken by CSIRO Division of Land & Water (Wasson 1999, pers.comm.).
33

34

Chapter 3
Reservoir physical processes
3.1 Background
The availability of nutrient, light and mixing conditions, the water residence time andtemperature, are the major determinants of algal growth and composition. Both biomasslevels and composition may be further modified by grazing by zooplankton. The inter-play of these factors are complex and variable, even within a single reservoir, reflectinglatitude, catchment conditions and land uses and management, and reservoir depth,shape and drawdown conditions.
The following sections seek to explain the components of each of these factors, and themanner in which they collectively determine algal biomass and composition.
3.2 Stratification
Stratification has significant implications for lake water quality and biological processes.The thermocline creates a barrier to the transfer of oxygen adsorbed by surface watersinto deeper waters, and the transfer of nutrient rich bottom waters into the surfacemixed layer (SML). The level of mixing within the SML is a function of wind strengthand travel distance over the water surface. Burrinjuck, as is the case for most deepAustralian temperate region reservoirs, is monomictic in that it experiences a singleannual stratification and turnover cycle.
3.2.1 Previous studies
The ACT Region Water Quality Study (1978) notes that the Reservoir stratified overthe period November 1976 to March 1977.
A study based on the application of DYRESM to Burrinjuck (Humphries & Imberger
35

Chapter 3. Reservoir physical processes
1981) noted an annual pattern of thermal stratification with depth, commencing inSeptember and mixing in April. The study concluded that the stratification reflected:
1. heating and cooling of the water surface;
2. river inflows;
3. outlet depth and discharge volume.
Analysis of the mixing depth in summer noted mixing depths of 2—8 m, usually lessthan 5 m at night less than 2 m during the daytime.
3.2.2 Analysis of data from 1976 to 1998
During early summer, the surface waters of lakes are heated by adsorption of solarradiation, progressively becoming warmer than the deeper waters. Given that the densityof water decreases as the temperature rises, the warming of the surface layers relative tothe deeper layers creates a physical separation of the surface and bottom layers in termsof density resistance to mixing. The depth of the surface mixed layer is a function of thesolar radiation, differences in air and water temperatures, evaporation rates and winddriven eddy currents.
This pattern was assessed for Burrinjuck using the temperature profiles measurementsavailable from monitoring (Figure 3.1 Monthly Average temperature profile at Station108). The Figure indicates thermal stratification over summer months for BurrinjuckReservoir, with deepening of the surface mixed layer in the autumn period until thewhole depth is isothermal (mixed).
With cooling during autumn, the depth of the surface mixed layer increases, progressivelyentraining the cool bottom waters, until the full Reservoir depth is mixed (uniformtemperature).
Figures 3.2 and 3.3 indicate the pattern of longitudinal temperature profiles for theMurrumbidgee River arm of Burrinjuck Reservoir. The plot for the stratified conditions(Figure 3.2) indicates a mixed zone at the upstream end of the Reservoir, followed byrapid establishment of stratified conditions downstream. Drawing on the inferred solarradiation, evaporation rates, and wind strength (refer to Chapter 2.5.1), the surfaceheat flux was calculated and plotted versus the mixed layer depth at Site 104. Theinverse relationship found indicated that the mixed depth was mainly determined bysolar radiation and evaporative fluxes at the surface, and that wind was not a significantfactor in modifying mixed depth.
36

Chapter 3. Reservoir physical processes
Jan Feb Mar Apr May Jun Jul Aug Sep Oct Nov Dec
30
25
20
15
10
5
0
Month
Dep
th (
m)
9.3
9.3
10.1
10.1
10.1
10.8
10.8
10.8
11.6
11.6
11.6
12.3
12.3
12.3
13
13
13
13.8
13.8
13.8
14.5
14.5
14.5
15.3
15.3
15.3
15.3
16
16
16
16.8
16.8
16.8
16.8
17.5
17.5
17.5
17.5
18.3
18.3
19
19.8
20.521.3
Figure 3.1: Average temperature profile (1976 to 1996), Station 108 Burrinjuck Reservoir.
3.3 Mixing and inflow pathways
3.3.1 Previous studies
The ACT Region Water Quality Study notes that the Reservoir stratified over the periodNovember 1976 to March 1977, and that Murrumbidgee River water reaching BurrinjuckReservoir under low flow summer conditions was relatively warm and therefore spreadover the surface water layer.
As an inland irrigation storage within the temperate region of SE Australia with alarge rural catchment, Chaffey Reservoir has a number of similarities with BurrinjuckReservoir, and provides some useful pointers in relation to Burrinjuck processes.
The Chaffey Reservoir monitoring dramatically illustrated the nature of event inflowincursions into the Reservoir water body. Conductivity profile measurements followinga major inflow event during February 1997 indicated that the inflow formed an intru-sion just below the surface mixing layer. The level of the intrusion was determinedby the temperature of the inflow relative to thermal stratification within the reservoir(Figure 3.4).
In Chaffey Reservoir, nutrients that accumulated in the hypolimnion were a significantdeterminant of the following year’s average annual algal biomass. Artificial destratifica-
37

Chapter 3. Reservoir physical processes
Site 108 104 103 102 101
30
25
20
15
10
5
0
Dep
th (
m)
12.3
12.8
13.3
13.8
14.314.3
14.914.9
15.415.4
15.915.9
16.416.4 16.9
16.917.4
17.417.4
17.9 17.9
17.918.4
18.418.4
18.9
18.9
19.419.4
19.9
19.9
20.4
Figure 3.2: Longitudonal temperature profile (Site 101 to 108), Summer 1984-1985.
tion was observed to reduce the internal nutrient load by about 85% and algal biomasswas much lower during the years following artificial destratification. However, artificialdestratification did not eliminate blue-green algae from the phytoplankton population.
Another common observation at Chaffey Reservoir was that of low algal biomass duringlate summer due to the depletion of epilimnetic nutrients. The biomass would remain lowuntil the surface mixed layer deepened as a result of wind stirring and autumnal coolingsufficiently to entrain nutrients that had accumulated below the SML. Algal biomassincreased rapidly following the entrainment of nutrients and then eventually diminishedwhen the SML deepened enough that light availability limited algal growth.
3.3.2 Analysis of data from 1976 to 1998
Inlet zones, with their shallow depth and more elevated flows (smaller cross section) arenormally mixed, but may be prone to thermal stratification for short periods under lowflow and elevated solar radiation conditions during summer, particularly where surfacewater turbidity is elevated following a storm event inflow.
Figures 3.2 and 3.3 (Temperature profiles of the Murrumbidgee arm during Summer andWinter) show stratification over the summer/autumn period for the deeper downstreamSites 103 to 108, but substantially isothermal conditions within the shallow inlet reaches101 and 102.
38

Chapter 3. Reservoir physical processes
Site 108 104 103 102 101
30
25
20
15
10
5
0
Dep
th (
m)
9
99.19.29.
2
9.3
9.3
9.4
9.4
9.4
9.5
9.5
9.5
9.5
9.5
9.5
9.6
9.6
9.6
9.7
9.7
9.7
9.7
9.7
9.8
9.8
9.9
9.9
9.9
9.9
10
10.1
10.110.2
Figure 3.3: Longitudonal temperature profile (Site 101 to 108), Winter 1984.
The pathway followed by water discharged from streams feeding reservoirs will depend onthe temperature of inflow relative to the temperature of the surface mixed layer. Analysisof monitored Murrumbidgee River temperature (Uriarra Crossing) indicates a significantcorrelation with flow, with flows greater than median flows having temperatures lessthan that of the surface mixed layer, and consequently diving to the bottom waters.Conversely, the temperature of flows less than median levels were warm relative to thesurface mixed layer temperature, and consequently, occurred as surface water flows.This is illustrated in Figure 3.5 for the Murrumbidgee arm of Burrinjuck Reservoir. Insummer, an inflow of up to 1000 ML/day has on average a higher temperature than thatof the SML. In winter however, inflow generally has a lower temperature than that ofthe Reservoir SML and so will plunge to the bottom waters.
This pattern of surface or bottom water inflows has significant implications for the avail-ability of nutrients to surface water algae over summer periods (refer to Chapter 4).
Several aspects of these findings are addressed for Burrinjuck in the following material.
The location of the reservoir outlet relative to surface waters or bottom waters has animportant bearing on water and associated nutrients pathways through reservoirs.
Under conditions of bottom water release over summer months, when inflow is low or tothe bottom waters, there will be drawdown of bottom waters when the release exceedsinflow. The surface waters may remain isolated from high nutrient bottom waters or,
39

Chapter 3. Reservoir physical processes
Figure 3.4: Conductivity (top) and FRP and TP (bottom) profiles measured at Chaffey Reservoirbefore and after the Feb 97 inflow. Conductivity profiles are offset by 0.002 S m−1; grey verticallines are located at 0.031 S m−1 for each profile. The trajectory of the maximum surface mixedlayer depth between profile is shown by the heavy line in the upper figure. Reprinted from Shermanet al. (in press).
40

Chapter 3. Reservoir physical processes
0
5
10
15
20
25
30
Jan Feb Mar Apr May Jun Jul Aug Sep Oct Nov Dec
Tem
pera
ture
(de
g.C
)Average Surface Temperature, Site 101
Calculated Temperature at 10 ML/day
Calculated Temperature at 100 ML/day
Calculated Temperature at 1000 ML/day
Calculated Temperature at 10000 ML/day
Figure 3.5: Surface temperature at Site 101 and inflow temperature at Uriarra Crossing showing anaverage decrease in temperature with increasing flow. When the temperature of the inflow dropsbelow that of the reservoir the flow will be to the bottom waters.
when inflow is to the surface water and release from the bottom water, may be entrainedinto the bottom waters.
Under conditions of surface water release over summer months, when inflow is low orto the bottom waters, there will be drawdown of the surface waters where the releaseexceeds inflow. However, as the mixed depth (zmix) is a function of solar radiation andwind mixing, the zmix will remain relatively constant relative to the surface of the Reser-voir. Consequently, under these conditions, nutrient rich bottom water is progressivelyentrained into the surface mixed layer.
Figure 3.6, Reservoir dominant flow pathways, illustrates the longitudinal and verticaltransfers between surface and bottom waters for a range of outlet arrangements, and forthe ’reservoir turnover’ condition.
Except for during periods of spillway overflow, the release from Burrinjuck Reservoiris via bottom outlet penstock and valves. Consequently, upwelling or entrainment ofbottom waters into the SML in the lower reaches of the Reservoir would not be expected.
Analysis of internal loading indicates a net loss from the SML to the bottom waters andsediments for the middle reaches of the Reservoir.
41

Chapter 3. Reservoir physical processes
Inflow
Mixed
Mixed phase to stratified phase
Stratified Mixed
RecycledNutrient
Key:
Sedimentation Remobilisation
Flow Recycled nutrient
Reservoir mixed
Bottom layer
Sediment
Surface layer
Inflow
Top releaseDischarge
Incorporation of bottomwater into surface water
Inflow
Bottom release
Discharge
Incorporation ofsurface water
into bottom water Surface mixed later transfer
Figure 3.6: Reservoir dominant flow pathways
42

Chapter 3. Reservoir physical processes
3.4 Light conditions
The microalgae that grow suspended in the water column are referred to as phytoplank-ton. Unlike land plants that are fixed in position, phytoplankton are moved verticallyand horizontally through the water column by mixing processes and by their own in-trinsic bouyancy or flagella. As a result the light that they encounter is not simply afunction of the daily incident sunlight but also the extent to which mixing moves thecells through the area of water where light penetrates.
In all aquatic systems, even those with very clear water, the light intensity diminisheswith depth due to absorption and scattering by dissolved compounds and particles withinthe water column. The depth at which light is 1% of its surface value is called theeuphotic depth (zeu) and below this level the algal cells have very little light to supportalgal photosynthesis and must rely on using stored energy to maintain their growth.
However, stored reserves of energy are limited and will only last for a relatively shortperiod of time. Consequently if the phytoplankton spend too much time below theeuphotic zone then growth will not continue. If the depth of water mixing (zmix) isgreater than the euphotic depth then the motion will carry cells in and out of the lightzone. The proportion of time that the cells spend in the light is then determined bythe ratio of the euphotic depth to the mixing depth (zeu:zmix). This is illustrated inFigure 3.7. If the mixing depth is large then the cells will spend a relatively short periodof time in the light and growth will be restricted. To assess the impact of light climateon algal growth it is necessary to know the depths of the euphotic zone and of the mixinglayer.
Depth of lightpenetration
zeuMixing depths
zmix
zmix 1
zmix 2
zeu
Figure 3.7: The effect of light availability on algal growth. The fraction of time that phytoplanktonspend in light is given by the ratio of light penetration depth to mixing depth, zeu:zmix.
The optical characteristics of the water that determine the extent of light penetrationdo not usually change very rapidly and so light measurements can be made at intervalsof one or two weeks and sometimes longer. In contrast, mixing in reservoirs is drivenlargely be meteorological conditions including wind speed, differences in air and watertemperatures, and evaporation rates. These conditions can change rapidly and conse-
43

Chapter 3. Reservoir physical processes
quently so can the mixing environment. Changes in mixing are usually tracked fromdetailed temperature changes in the water column. This requires a series of temperaturesensors suspended at different depths (a thermistor chain) to gather data at frequentintervals, sometimes every few minutes, in order to characterise the mixing conditions.These changes can be related to meteorological conditions if a weather station is situatedon the reservoir surface. Detailed information on water mixing acquired from temper-ature measurements provides a basis for tracing water movement, but if the algae arenot fully captured in the water motion then they will not be mixed to the extent thatthe temperature measurements indicate. The rate of water movement can be estimatedfrom the meteorological data in conjunction with the temperature data and if this iscompared with the floating or sinking rate of algae then the extent to which the algaeare entrained in the movement can be estimated. This can be particularly importantwhen bloom forming blue-green algae are a problem because these organisms are able tofloat up into the well illuminated layers when mixing is sufficiently weak.
3.4.1 Previous studies
Kirk (1993) has compiled characteristics of the underwater light regime for an extensiverange of water bodies, including Burrinjuck Reservoir. The measurements on Burrinjuckshow the vertical attenuation coefficient for the photosynthetically active wavelengths(400—700 nm) ranging between 0.71 and 3.71 m−1. These are high values compared toNorth American and European standards but typical of australian inland lakes (Kirk1993, p.68, 103, 141). Analysis of the adsorption of photosynthetically active radiationby particulate and dissolved components indicated that 46% of adsorption was by colour,26% by suspended particles including phytoplankton and 28% by the water. Burrinjuckwas classified as a ’dissolved colour, rather low turbidity and plentiful phytoplankton’optical type water body (Kirk 1994).
Photosynthesis achieved by a phytoplankton cell depends on the rate of capture of quantaof light field. This is a function of the light adsorption properties of the photosyntheticbiomass, and the intensity and spectral quality of the light field. Major differencesexist between the main taxonomic groups of aquatic plants with respect to the kinds ofphotosynthetic pigment present and associated differences in the absorption spectra.
Given the variation in intensity and spectral quality of the light field in the aquaticenvironment, it is likely that photosynthetic pigment composition could be a majorfactor determining which species of aquatic plant grow in relation to variation in lightclimate with depth, seasonal changes and between reservoirs.
3.4.2 Analysis of the 1976 to 1998 data
Figure 3.8 presents a time series plot of turbidity at Station 104. This figure indicateselevated turbidity levels associated with high inflows (floods in 1977, 1978 and 1991Figure 2.17) and with periods of intermediate Reservoir drawdown (1982/1983 and 1995).Under conditions of extreme Reservoir drawdown, Station 104 is dry.
44
Chapter 3. Reservoir physical processes
Figure 3.9 presents plots of Secchi disk depth for Stations 101 to 108. The Figureindicates a strong inverse relationship between turbidity and euphotic depth. Sources ofturbidity are the abiotic particulate material discharged from the catchment during stormevents, and biotic particulate material (phytoplankton) over spring to autumn periods.Generally, there is a pattern of increasing Secchi depth over the late Spring periodassociated with decreased inflows and sedimentation of abiotic particulates, followed bydecreasing depth over the summer periods, associated with increased algal cell numbers.
The Figure also indicates a pattern of increasing Secchi depth with distance downstreamof the inlet zone, reflecting both the reduction in abiotic particles as a result of upstreamsedimentation, and the reduced algal levels.
Analysis of the mixed layer depth indicated that the depth was determined predomi-nantly by solar radiation, temperature and evaporation factors, with wind having limiteddiscernible impact. The seasonal pattern of mixed layer depth is shown in Figure 3.10for Site 104 at the Reservoir.
Figure 3.11 shows a time series plot of euphotic depth for Stations 101, 104 and 108. Thefigure shows the horizontal variability in zeu from the shallow upstream reaches down tothe deeper parts of the Reservoir. The station 101 to 108 reach was selected to assess thetransition from the ’mixed’ condition for the relatively shallow water upstream zones ofStation 101 to the stratified conditions for the deeper water zones of Station 108. Station108 is a distance of 37 km downstream of the entry point of the Murrumbidgee Riverto the Reservoir and just 18 km upstream of the Dam wall. Figure 3.12 presents a timeseries plot of zeu:zmix ratio for Station 104. The euphotic to mixed depth ratio rangesfrom 0.1 to 1, with a strong seasonal pattern evident both in mixed depth and in thezeu:zmix ratio. This has important implications for algal composition discussed later inthe Report (see Chapter 6). Zeu is calculated from measurement of Secchi depth usingthe relationship
zeu = 2.7× zsecchi. (3.1)
45

Chapter 3. Reservoir physical processes
0
50
100
150
200
250
1976 1980 1984 1988 1992 1996
Tur
bidi
ty (
NT
U)
Figure 3.8: Turbidity, Site 104 Burrinjuck Reservoir.
0.0
0.5
1.0
1.5
2.0
2.5
3.0
3.5
4.0
4.5
101 102 103 104 106 108Site
Sec
chi d
epth
(m
)
MinimumAverageMaximum
Figure 3.9: Secchi depth (1977 to 1998), Sites 101 to 108 Burrinjuck Reservoir.
46

Chapter 3. Reservoir physical processes
0
5
10
15
20
25
30
35
Jan Feb Mar Apr May Jun Jul Aug Sep Oct Nov Dec
Mix
ed la
yer
dept
h (m
)Minimum MLDMaximum MLDAverage MLD
Figure 3.10: Seasonal pattern of surface mixed layer depth, Site 104 Burrinjuck Reservoir.
0
2
4
6
8
10
12
14
1981 1985 1989 1993 1997
Eup
hotic
Dep
th (
m)
Station 101Station 104Station 108
Figure 3.11: Euphotic depth, Sites 101, 104 & 108 Burrinjuck Reservoir.
47

Chapter 3. Reservoir physical processes
0.0
0.5
1.0
1.5
2.0
2.5
3.0
3.5
4.0
1976 1980 1984 1988 1992 1996
Zeu
/Zm
ix
7.0
Figure 3.12: Mixed layer depth and euphotic depth, Site 104 Burrinjuck Reservoir.
48

Chapter 4
Reservoir nutrient pathways
4.1 Range of possible nutrient pathways
In addition to sufficient light algae also require nutrients for growth. Although a widerange of nutrients are required it is the availability of nitrogen and phosphorus thatusually regulate algal growth when light conditions are sufficient. This section examinesthe range of possible nutrient pathways in relation to availability for algal growth. Theissue of bio-availability of nutrients is also discussed.
Harris notes that in a dynamic approach to lake and reservoir management, we must focuson rates of transfers between pools, on loads and fluxes and not simply on concentrations(Harris 1996). The questions then become: What is the relative magnitude of externaland internal loads? How do microbial interactions influence the fluxes and the cyclingof elements? What is the role of the detrital pathways in these systems?
Harris also stresses the importance of addressing inputs and outputs of elements at avariety of scales if we are to understand and manage these highly complex and variablesystems. Time scales and the magnitude of extreme events are of great importance inAustralian systems. Australian rivers are pulsed systems; irregular flow events dominatesystem function at a range of scales.
4.1.1 Previous studies
The ACT Region Water Quality Study (1978) noted that during floods, most of thephosphorus in the rivers is in the unavailable (particulate) form associated with soilparticles, and settles to the bottom of Burrinjuck reservoir. A large proportion of thenitrogen, on the other hand, can be in a bio-available form.
During dry periods, available nitrogen and phosphorus, derived largely from sewageeffluent and often in high concentrations, can stimulate growth of algae, especially theattached algae in the River. The available nutrients are thus substantially depleted in
49
Chapter 4. Reservoir nutrient pathways
concentration by the time the water reaches Burrinjuck Reservoir.
Water reaching Burrinjuck Reservoir under low flow summer conditions is relativelywarm and spreads over the surface water layer. Depending on the concentrations ofnutrients remaining after uptake by attached algae upstream, nutrients in this dischargemay stimulate algal growth in surface waters of Burrinjuck Reservoir.
Following turnover (mixing) of the reservoir, considerable amounts of available nutrientswhich are present in the bottom waters during stratified conditions are mixed into surfacewaters, stimulating growth throughout the Reservoir.
Harris notes that in addition to loadings determining the overall trophic state of waterbodies for time scales up to a decade after the event, the timing of the event loadingswill have significant downstream ecological consequences on the seasonal succession ofspecies (Harris 1996). This can be seen in the weekly data from North Pine storage inBrisbane (Harris & Baxter 1996) where individual storm events had consequences foryears afterwards.
4.1.2 Analysis of the 1976 to 1998 data
Chapter 3 describes the flow pathways, and the manner in which they are modifiedby stratification (physical separation of the warmer surface water layer from the coolerbottom water layer), inflow temperature relative to the surface water layer, and theimpact of the discharge arrangement on flow pathways within the reservoir. These flowpatterns are one of the primary determinants of nutrient movement within reservoirs,and availability to surface water algae.
This research has identified seven potential nutrient pathways in reservoirs. They com-prise:
1. direct uptake of bio-available nutrients flowing in to the surface mixed layer (bothdeep and shallow reservoirs);
2. mixing of nutrient rich bottom waters at times of reservoir turnover (deep reser-voirs);
3. development of anoxic sediments in shallow lakes;
4. re-mobilisation of nutrients from sediments in inlet depositional zones (both deepand shallow reservoirs);
5. mixing, drainage and re-suspension of anoxic sediment pore water, which is high innutrients, with the surface mixed layer under conditions of rapid drawdown (deepreservoirs);
6. entrainment of nutrient rich bottom waters in the surface mixed layer under con-ditions of surface water discharge from the reservoir (deep reservoirs);
7. direct recycling of nutrients between algae by microbial processes (both deep andshallow reservoirs).
50

Chapter 4. Reservoir nutrient pathways
These pathways are described in more detail in the following text.
Direct uptake of bio-available nutrients flowing in to the surface mixed layer
Under conditions of direct discharge of wastewater effluent or irrigation discharge toreservoir surface waters experiencing low, non-point source inflow (low suspended solids),the elevated phosphate and inorganic nitrogen in discharges becomes readily availableto algae.
Where the discharge occurs to a feeder river some distance upstream from the reservoir,the level of bio-available nutrients will be gradually reduced as a result of instream uptakeby attached algae, biofilm and benthic Diatoms, dependant on the stream morphology,substrate and light conditions. This pattern occurs within the Murrumbidgee Riverupstream of Burrinjuck Reservoir both for the pre and post LMWQCC nutrient removalperiods.
This pattern is evident in Figures 4.1 and 4.2, Instream modification to loads, Mur-rumbidgee River 1976–1980. During periods of low flow, there is uptake of some 90%of the FRP monitored over the 40 km of River from the Molonglo River confluence toTaemas Bridge. A similar pattern occurred during 1983–1998. Analysis of FRP contri-
0
200
400
600
800
1000
1200
1400
1600
1800
2000
1976 1977 1978 1979 1980
FR
P L
oad
(kg/
day)
FRP Load, Taemus Bridge
External FRP Load,Murrumbidgee arm
10,000
Figure 4.1: Burrinjuck Reservoir FRP Load, Taemus Bridge and External (Murrumbidgee Arm)
bution to surface waters for Burrinjuck Reservoir indicates that only a small proportionof the observed algae can be explained by this pathway. Estimates of relative contribu-tion of FRP to the Surface Mixed Layer are shown in Table 4.1. Here, the hypolimnionestimate is based on an average hypolimnion volume of 330,000 ML multiplied by the av-erage FRP at turnover for the period. Direct inflow FRP estimates are based on averageFRP at Station 201 for low inflows (less than 1000 ML/day) for the period, multipliedby the sum of low inflows.
51

Chapter 4. Reservoir nutrient pathways
0
500
1000
1500
2000
2500
3000
3500
4000
1976 1977 1978 1979 1980
TP
Loa
d (k
g/da
y)
TP Load, Taemus Bridge
External TP Load,Murrumbidgee arm
Figure 4.2: Burrinjuck Reservoir TP Load, Taemus Bridge and External (Murrumbidgee Arm)
This represents a significant departure from the reported major nutrient pathway fornorthern hemisphere lakes and reservoirs. The Ca2+ dominant and low abiotic suspendedsolids nature of many northern hemisphere waters, and the sustained flows and deepstreams, limit the instream adsorption and biological uptake prior to discharge to lakesand reservoirs. In addition, the large size of lakes is often such that there are directdischarges of municipal wastewater to the lakes.
Table 4.1 further illustrates the minor role of direct inflow of nutrients as compared tobottom water sources.
Table 4.1: Estimate of relative contribution of FRP to Surface Mixed Layer
Period FRP Source Annual load (kg)Pre 1980 Hypolimnion 20,000
Direct inflow 15Post 1983 Hypolimnion 3,300
Direct inflow 0.6
Mixing of nutrient rich bottom waters at time of reservoir turnover
During periods of reservoir stratification, nutrients may be released from sediments tothe bottom waters as a result of the decomposition of sedimented organic material underanoxic conditions. Over late autumn, the surface mixed layer cools until they are atthe same temperature as the bottom waters. At this point full mixing of waters ofthe reservoir occurs, and the nutrient rich bottom waters are mixed throughout thesurface waters. Subject to inflow conditions over the following winter and early spring
52

Chapter 4. Reservoir nutrient pathways
period, these nutrients may be available in the surface mixed layer for algal growth inthe following spring and summer growth periods.
Analysis undertaken on Chaffey Reservoir indicated that the amount of algae that de-velops in the growth season is often reliant on the amount of phosphorus released fromthe sediments into the anoxic deeper waters during the preceding year (Figure 4.3). Thisphosphorus is mixed into the surface layers when the lake is fully mixed and determinesthe concentration in the surface layer when temperature stratification re-develops. It isthis phosphorus that supports algal growth in the next growing season.
Figure 4.3: Maximum hypolimnetic phosphorus and mean annual algal volume just prior to turnoverat the start of the algal growing year at Chaffey Reservoir. Open circles denote that the destratifierwas operating
An analysis was undertaken of Burrinjuck algal biomass versus hypolimnetic FRP atturnover for the previous autumn. The estimate of FRP in surface waters is based onthe mass of hypolimnetic water FRP at turnover in the previous autumn period. Theanalysis is presented at Figure 4.4. The Figure indicates that:
1. during the pre LMWQCC nutrient removal period (1976 to 1980), the measuredChlorophyll ’a’ to estimated FRP levels in surface waters are close to a 1:1 ratio,with a correlation coefficient of 0.87;
2. during the post LMWQCC phosphorus removal period (1984 to 1998), the measuredChlorophyll ’a’ to estimated FRP ratio was 1:3, with a correlation coefficient of−0.3.
The high Chlorophyll ’a’ to estimated FRP ratio in the case of the pre-sewage nutrientremoval period indicates that hypolimnetic P is the major source of nutrient during thisperiod. The lower ratio in the post-sewage nutrient removal period indicates that thehypolimnetic FRP was a less significant source for this period.
53

Chapter 4. Reservoir nutrient pathways
y = 0.3998xR2 = 0.966
y = 0.1334x + 0.0048
R2 = 0.1437
0.00
0.01
0.02
0.03
0 0.01 0.02 0.03 0.04 0.05 0.06 0.07 0.08
Estimated mixed FRP (mg/L) following turnover in April
Mea
sure
d A
v C
hlor
ophy
ll 'a
' (m
g/L)
for
the
follo
win
g S
ept -
Oct
Measured data (pre 1980)Measured data (post 1983)Linear regression (pre 1980)Linear regression (post 1983)
Figure 4.4: Algal biomass vs. hypolimnetic FRP at turnover, Burrinjuck Reservoir.
The high correlation coefficient in the case of the pre-sewage nutrient removal period isindicative of the high organic loading on the Reservoir sustained by Canberra sewagedischarges. This has masked the effect of other factors such as drawdown, washout andnon-point source contributions, on the actual mass of hypolimnetic P mixed into andretained in the surface mixed layer. Conversely, for the post-sewage nutrient removalperiod, the sewage derived nutrients and organic material is no longer dominant, with arange of factors influencing the transfer of hypolimnion P to the surface mixed layer.
Development of anoxic sediments in shallow waters
Shallow lakes (less than 1 m in depth) may have a high level of internal productivity,given their generally mixed condition and high light availability.
Periodic calm (low wind) conditions may lead to development of anoxic sediments inshallow waters and high productivity lakes. The anoxic sediment may result when:
1. there are short periods of reduced wind and high solar radiation, such that steepthermal gradients develop in the water column, limiting dissolved oxygen transferto the sediments;
2. there is elevated organic material decomposition resulting from high macrophyteand attached algal growth associated with shallow lakes or deposition of organicmaterial from a storm inflow just prior to period of low winds.
54

Chapter 4. Reservoir nutrient pathways
This is understood to be more a feature of open shallow lakes and reservoirs, rather thandeep reservoirs. In view of the depth of Burrinjuck, it is unlikely to be a significantpathway in this case.
For this pathway, wind is the major factor determining nutrient availability and algalgrowth dynamics.
Re-mobilisation of nutrients from sediments in inlet depositional zones
Suspended solids and organic material, discharged to reservoirs under storm inflow con-ditions, settle rapidly upon entering the relatively calm flow conditions within reservoirs.Typically, a large proportion of organic material settles out in a zone close to the inletpoint. Consequently, the loading of organic material per square metre of sediment withinthese zones is significantly greater than for sediments further within the reservoir.
The significantly greater transfer of oxygen through these shallow and mixed inlet zonewaters than for the deeper downstream (stratified) waters is normally sufficient to offsetthe oxygen depletion associated with decomposition of the organic material. However,where there is a rapid reduction in flow following the storm event, the elevated turbidityand high summer solar radiation in association with low wind conditions may lead to thedevelopment of a steep temperature gradient vertically through the water column. Thismay occur for waters as shallow as 1 m. Under these conditions, there will be substantialreduction of oxygen transfer through the water column, with a high potential for thedevelopment of reducing conditions in the sediments and the release of nutrients in ahighly bio-available form.
These nutrients will be available to algae either as a result of sporadic limited mixing asa result of thermal cooling in the evening or light winds, or as a result of alga varyingtheir depth in response to light conditions (via buoyancy control). Algae will be washedthrough downstream surface waters under the low (warm water) inflow conditions, or inassociation with reservoir drawdown.
The potential for re-mobilisation of nutrients via this pathway will be significantly ex-acerbated by dendritic shaped reservoirs, with narrow and contained inlet zones andreduced wind exposure.
Burrinjuck Reservoir receives a continuous flow of water even during the dry summer asa result of the discharge from a large sewage treatment plant and stormwater dischargesfrom urban areas. In this system the interaction of flow, nutrient content in the discharge,and the delivery of organic carbon to the narrow and relatively shallow receiving armsof the Reservoir, regulates algal growth. When nutrients are high during the growingseason then algal concentration is high. Historically nutrients were high because thesewage treatment works discharged large quantities of nutrients. Micro- and macro-algae growing in the river upstream of the Reservoir initially captured the nutrients, butduring high flows this plant material was transported to the Reservoir and sedimented inthe shallow receiving arms. The breakdown of the organic material in the shallow armsreleased nutrients that stimulated micro-algal growth.
55

Chapter 4. Reservoir nutrient pathways
For this pathway, the pattern of event or ’pulsed’ inflow of catchment drainage, nutrientsand organic material, and the shape of the inflow hydrograph, are important factorsdetermining nutrient availability and algal growth dynamics.
When nutrient release from the sewage treatment works was decreased around 1980the peak algal biomass in the Reservoir also declined. However, recently increased algalgrowth has again occurred within the Reservoir and is associated with increased nutrientconcentrations in the water column. However, this increase in nutrient concentrationsdoes not seem to be due to increased nutrient release from the sewage treatment plants.
The recent increase in algal biomass appears to be strongly associated low Reservoirlevels. In this case inflow is to a much reduced and restricted volume in the shallowreceiving arms of the Reservoir. As a result the same river nutrient load has a largerimpact on nutrient concentrations in the receiving water, particularly if the transportedmaterial is sedimented to the bottom prior to metabolism and release of nutrients. Theincreased nutrient concentrations stimulate algal growth. This is supported by increasedconcentrations of other nutrients (Figures 2.6 and 2.9) that also come from the sedi-ments, including ammonia, and by analysis of sediment redox conditions for the inletdepositional zone.
Figure 4.5 presents the results of model analysis of inflow, washout, sedimentation, sed-iment redox and P release, and algal uptake of released P for the inlet reach Station 101to 102. The model estimates a high FRP release as a result of severely reduced sedimentsfollowing a storm event (deposition of organic material) in early August 1978, and theuptake of the released FRP by algae. The pattern of estimated Chlorophyll ’a’ closelyreflects the monitored Chlorophyll ’a’ values for the period.
0.00
0.01
0.02
0.03
0.04
0.05
0.06
0.07
0.08
0.09
0.10
Aug-78 Sep-78 Oct-78 Nov-78 Dec-78 Jan-79 Feb-79 Mar-79 Apr-79
Chl
orop
hyll
'a' (
mg/
L)
Modelled chlorophyll 'a'
Measured chlorophyll 'a'
Figure 4.5: Lake redox model estimates of Chlorophyll ’a’, Burrinjuck Reservoir inlet depositionalzone
Figure 4.6 presents a time series plot of daily inflow, TP sedimentation and FRP release
56

Chapter 4. Reservoir nutrient pathways
from sediments for the inlet depositional zone. The estimate of FRP has been drawn fromthe model analysis outlined above. The figure indicates the limitation of mass balancebased analysis, with both sedimentation of particulate P and release of FRP occurringsimultaneously. A simple mass balance based solely on TP analysis would conclude thatthere is a net loss of P to the sediments for this period, but when the different forms ofP are considered, a net release of FRP is apparent.
0
500
1000
1500
2000
2500
3000
Aug-78 Sep-78 Oct-78 Nov-78 Dec-78 Jan-79 Feb-79 Mar-79 Apr-79
Tra
nsfe
r pe
r da
y
TP sedimentation (kg/d)
FRP release (kg/d)
Inflow (ML/d)
7527
Figure 4.6: Nutrient sedimentation and remobilisation, Burrinjuck Reservoir inlet depositional zone
It is concluded that for low Reservoir level conditions, Reservoir algal growth is theresult of a complex interplay of nutrient release from sediments as a result of depositionof storm event organic material, followed by low inflow (mixing) and wind driven mixingconditions.
Nutrients released into the water column will be washed through (either as dissolvednutrients or algae) into surface waters of downstream reaches under the low flow condi-tions, with algal cycling of nutrients sustaining algal biomass through subsequent reaches.With each cycle of nutrients there is some loss, reflected in declining algal biomass withdistance downstream.
Mixing, drainage and re-suspension of anoxic sediment pore water with the surface mixedlayer
Under conditions of rapid drawdown, some areas of anoxic sediments previously existingwithin the anoxic bottom water zone, will be entrained in the surface mixed layer, or evenemerge from the receding reservoir water surface. Under these conditions the nutrientrich pore water is mixed with the surface waters, or where the sediments are left abovethe receding reservoir water level, the pore water drains to the receding surface waters.The analysis of the inlet depositional zones indicated increases in algal levels associated
57

Chapter 4. Reservoir nutrient pathways
with continued drawdown and low water depths (refer to Figure 4.5). The algal biomassexceeded levels which could be explained by the sediment redox modelling and inflow.The analysis suggests that there is another significant source of nutrients under theseconditions. Drainage of pore water from the exposed sediments and increases in algallevels over and above that explained by remobilisation of nutrients for the sediment inthe inlet depositional zone was put forward as a hypotheses explaining this anomoly.
Drawing on hypsometric curves for Station 102 reach, a surface mixed layer depth of 3 m,a porosity of 30% and a sediment exchangeable pore water depth of 50 mm, an analysisof internal loading associated with drawdown for this reach was undertaken. The resultsof the analysis are summarised in Figure 4.7. The figure indicates that as the reach poolapproaches substantially reduced volumes, and drainage is invoked from the lower flattervalley slopes, the contribution from sediment pore water drainage becomes significant(refer to methods at Appendix B).
0.00
0.02
0.04
0.06
0.08
0.10
0.12
0 20 40 60 80Drawdown depth (percent)
Por
e w
ater
con
trib
utio
n to
sur
face
wat
er
FR
P (
mg/
L)
Monitored TPTP derived from calculated pore water drainage
Figure 4.7: FRP contributed by sediment pore water as a function of Reservoir drawdown, Station102 reach.
The analysis suggests that while this pathway is not significant relative to other pathwaysfor normal reservoir levels, as the reservoir reaches shallow (reduced volume) conditionsin association with substantial drawdown, the pathway become significant. Where reser-voirs are interconnected with substantial groundwater systems, this pathway would besignificantly exacerbated.
Entrainment of nutrient rich bottom waters in surface mixed layer.
Where the discharge of water from the reservoir is via a top outlet, under low surfaceinflow conditions and high surface water release (typical summer water supply situation),
58

Chapter 4. Reservoir nutrient pathways
the surface mixed layer would normally be depleted. However, as the mixed depth islargely determined by solar radiation and air temperature, and consequently remainsrelatively constant, nutrient rich bottom waters are progressively entrained in the SML.
As Burrinjuck Reservoir is currently a bottom release based system, this potential path-way does not apply.
Recycling of nutrients between algae by microbial processes.
Under conditions of limited dissolved nutrients algae have an ability to recover nutrientsfrom dead cells by way of biological processes. In this way, algal biomass may be sus-tained, even where there are no new sources of nutrient transferred to the surface mixedlayer.
This pathway is seen as the explanation of sustained algal biomass through the Reservoirsurface waters during periods where fresh sources of nutrients via the pathways outlinedabove, are not evident.
4.2 Bio-availability of nutrients
As the nutrient pathways involve transformations in the form of nutrients, it is im-portant to understand the relationship between the form of the nutrients and theirbio-availability.
The primary form of P used by phytoplankton is inorganic phosphate (PO4 — P) al-though some organic forms of P may be used, particularly when ortho-phosphate isscarce in oligotrophic lakes (Harris 1994). Clearly, if the majority of P loading is in aform which is readily available for algal growth then the resulting biomass will be greaterthan if much of the P is in particulate or organic forms which are not readily availableto the algae.
Harris also notes that the question of P availability in Australian waters is complicatedby terminology and deciding what is the “limiting” nutrient. Because of the wide vari-ety of processes in operation in natural waters (growth, grazing, microbial metabolism,sedimentation) and the rapid turnover of some P pools, it is possible to argue that oversufficient time, all the P in the system will be available for the accumulation of phy-toplankton biomass. What will determine the biomass produced will be the exchangecoefficients between all the chemical and biological forms of P in the system and the finaldistribution of pool sizes. What controls the rate of growth of the phytoplankton is theflux of P which links the uptake of P by the algae to the turnover and depletion of theother pools.
59

Chapter 4. Reservoir nutrient pathways
4.2.1 Previous studies
The ACT Region Region Water Quality Study (1978) noted that during floods, most ofthe phosphorus in the rivers is in the unavailable (particulate) form associated with soilparticles, and settles to the bottom of Burrinjuck reservoir. A large proportion of thenitrogen, on the other hand, can be in an available form.
4.2.2 Analysis of the 1976 to 1998 data
Some portion of total phosphorus may be present in crystalline form, and not be bio-available.
Some portion of total phosphorus may be present as iron phosphate, a highly boundcondition in which the P is not bio-available unless separated by a process of reductionof the iron (III) to iron (II) and release of the phosphate.
Iron is typically associated with surface coating of fine suspended particles, or maybe chelated with natural organic compounds. Rivers discharging into Burrinjuck haverelatively high iron levels at 0.1 to 0.3 mg/L.
Some ortho-phosphate may be adsorbed, together with iron, onto the surfaces of abioticparticles. Fine suspended particles may also be coated with a bio-film, incorporatingphosphorus and nitrogen. While not as readily bio-available to algae as dissolved phos-phate or inorganic forms of nitrogen, algae may be able to access this form by biologicalbreakdown processes. However, where the suspended solids settle out of the surfacewaters to the bottom sediments, the adsorbed ortho-phosphate and the bio-film coatedparticulate potential sources outlined above may removed too quickly to be available tothe algae.
Phosphorus that has been synthesised into organic material may become bio-available byprocesses of mineralisation (oxidation) of the organic material, or by way of a biologicalbreakdown process whereby the algae can access this source directly.
Un-adsorbed forms of phosphate are highly bio-available for algal uptake. The bio-available (soluble) component of total phosphorus is best measured by filtering the TPsample through a 0.003 µm filter. The Standard Methods determination of FRP is basedon a 0.45 µm filter, and is the basis of all FRP determinations in the Burrinjuck datasets.
In the case of nitrogen, the inorganic forms are highly mobile and bio-available. Organicforms require mineralisation (oxidation) before becoming available to algae.
Organic carbon also exhibits a range of bio-availability levels which is critical in respect tothe sediment microbial decomposition processes. Organic material deriving from nativevegetation is typically low in labile (rapidly assimilable portion) carbon and high inrefractory (slowly assimilable portion) carbon. Organic material derived from fertilisers,municipal or agricultural wastewater, grass and algae, have a high labile carbon content,
60

Chapter 4. Reservoir nutrient pathways
and are much more likely to result in anoxic and reducing conditions than for the nativevegetation derived material.
BOD analysis of a range of organic materials within the Murrumbidgee River catchmentindicate that wastewater organic material and algae have BOD5day rates an order higherthan for local native vegetation derived organic material.
4.3 Role of the sediments
Mention has been made in Chapter 3 of nutrient release from sediments to bottom watersand inlet zone waters, as a result of reducing conditions in sediments. The relativeimportance of these internal releases (loads) vis-a-vis the external loading depends on anumber of factors including stratification of the dam, organic material loading, extent ofdrawdown over summer and the magnitude of episodic inflows.
Nutrients are released from the sediments as a result of the reducing conditions createdby bacterial breakdown of organic matter delivered during inflows or dead algae producedwithin the reservoir itself. The coarse (inflow derived) organic matter is concentrated atthe upstream end of the reservoir. The algal detritus and slowly settling fine particlesare distributed throughout the reservoir sediments.
The bacteria use oxygen in breaking down the organic matter leading to anoxic bottomwaters and reducing conditions in persistently stratified reservoirs. The nutrient concen-trations in the pore waters and bottom waters build up to high concentrations especiallyof ammonia and FRP under reducing conditions. Dissolved iron and manganese con-centrations rise significantly in the pore waters and bottom waters and any nitrate inthe anoxic water column is consumed by bacteria (denitrified). Under oxic conditionsthe ammonia released from sediments is directly transformed into nitrate (nitrification)while the dissolved phosphate is not released due to the iron present in the sediments.
4.3.1 Previous studies
A study on the Lake Burley Griffin nutrient budget (Cullen & Rosich 1978) concludedthat sedimentation was the major process for removal of P from lake water, but bio-assay studies showed that sediment P is potentially available to promote algal and plantgrowth.
Rosich (1983) noted that the P, N and C content of the sediments of Lake Burley Griffinand Lake Ginninderra were comparable, even though Lake Burley Griffin received asewage effluent discharge and Lake Ginninderra did not. Laboratory experiments wereundertaken, placing equal amounts of sediments from each Lake in the bottom of glassjars, and filling the columns with water. The columns were then capped and subjectedto anaerobic conditions. The Lake Burley Griffin sediments released phosphorus levels40 times that released from the Lake Ginninderra sediments.
61

Chapter 4. Reservoir nutrient pathways
It was concluded that there was a vast difference between Lake Burley Griffin andLake Ginninderra sediments which was not explained by differences in gross parame-ters (TOC). It was hypothesised that given direct discharge (ex sewage) of bio-availableP in the case of Lake Burley Griffin, there was accumulation of bio-available carbonin the sediments, whereas, in the case of Lake Ginninderra, the sediment bio-availablecarbon was extensively worked over.
4.3.2 Analysis of the 1976 to 1998 data
Figures 4.8 to 4.10 present the results of internal loading analysis for TP, TN and SSrespectively. For each reach, input load comes from the upstream reach, and output goesto the next reach downstream. Within each reach, transfer of material occurs verticallybetween the atmosphere, the surface mixed layer, the bottom waters, and the sediments.Analysis was undertaken on a reach by reach basis (refer to Appendix B for method).The results of the analysis of each reach are presented in terms of a set of bars, showingthe net loss from the surface mixed layer, the net loss from the bottom waters, and thenet gain in the sediments. A bar below the axis in the case of the sediments indicates anet release from the sediments back into the bottom waters.
The Figures indicate high interannual variability, and a pattern of high net loss of TP,TN and SS to the sediments, particularly during the elevated inflow spring period, andparticularly in the inlet depositional zone (Station 201 to 101 or 102). The Figures alsodemonstrates the high net sediment release of P and N back into the bottom waters forthe deeper downstream reaches (Stations 102, 103 and 104). Figure 4.9 indicates a netrelease of N from the sediments within the inlet (mixed) depositional zone for the 1988and 1993 Spring periods. Given the high rate of TP adsorption onto surfaces of SS andremoval to the sediments by settling, periods of remobilisation are masked by the periodsof high deposition of particulate P during inflow events.
Figure 4.6 presented the results of the inlet depositional zone redox analysis modelling,including daily inflows and washout, analysis of organic material deposition rates, rateof decomposition and oxygen depletion, and sediment redox levels, using a daily timestep. Figure 4.6 indicates the significant FRP release from the sediments under thesevere reducing conditions following inflow events, where the inflow events are followedby low flow conditions. The modelled algal biomass (Figure 4.5) correlates closely withmonitored values for the inlet depositional zone and downstream reaches. This was asignificant source of nutrients driving algal growth in the pre 1980 period, and possiblythe dominant source of nutrients in the post 1983 period, particularly where the Reservoiris at a low level.
In the case of event inflow plunging into the bottom waters, some organic material willbe transported through and settle out onto the sediments of these downstream reaches.
62

Chapter 4. Reservoir nutrient pathways
Murrum bidgee Arm : TP flux Spring 1978
-20000
0
20000
40000
60000
80000
100000
120000
140000
Stn 201 Stn 101 Stn 102 Stn 103 Stn 104To
tal T
P f
lux
(kg
) fo
r p
eri
od
Surf Spr Bot Spr Sedim Spr
Murrum bidgee Arm: TP flux Summer 1978/79
-20000
0
20000
40000
60000
80000
100000
120000
140000
Stn 201 Stn 101 Stn 102 Stn 103 Stn 104To
tal T
P f
lux
(kg
) fo
r p
eri
od
Surf Sum Bot Sum Sedim Sum
Murrum bidgee Arm : TP flux Spring 1984
-20000
2000400060008000
10000120001400016000
Stn 201 Stn 101 Stn 102 Stn 103 Stn 104To
tal T
P f
lux
(kg
) fo
r p
eri
od
Surf Spr Bot Spr Sedim Spr
Murrum bidgee Arm: TP flux Summer 1984/85
-2000
0
2000
4000
6000
8000
10000
12000
14000
16000
Stn 201 Stn 101 Stn 102 Stn 103 Stn 104To
tal T
P f
lux
(kg
) fo
r p
eri
od
Surf Sum Bot Sum Sedim Sum
Murrum bidgee Arm : TP flux Spring 1988
-5000
0
5000
10000
15000
20000
25000
Stn 201 Stn 101 Stn 102 Stn 103 Stn 104
To
tal T
P f
lux
(kg
) fo
r p
eri
od
Surf Spr Bot Spr Sedim Spr
Murrum bidgee Arm : TP flux Sum mer 1988/89
-5000
0
5000
10000
15000
20000
25000
Stn 201 Stn 101 Stn 102 Stn 103 Stn 104
To
tal T
P f
lux
(kg
) fo
r p
eri
od
Surf Sum Bot Sum Sedim Sum
Murrum bidgee Arm : TP flux Spring 1993
-5000
5000
15000
25000
35000
45000
Stn 201 Stn 101 Stn 102 Stn 103 Stn 104To
tal T
P f
lux
(kg
) fo
r p
eri
od
Surf Spr Bot Spr Sedim Spr
Murrum bidgee Arm: TP flux Summer 1993/94
-5000
5000
15000
25000
35000
45000
Stn 201 Stn 101 Stn 102 Stn 103 Stn 104To
tal T
P f
lux
(kg
) fo
r p
eri
od
Surf Sum Bot Sum Sedim Sum
Figure 4.8: Reach based internal TP loading, Murrumbidgee arm of Burrinjuck Reservoir
63

Chapter 4. Reservoir nutrient pathways
Murrum bidgee Arm : TN flux Spring 1978
-250000
250000
750000
1250000
1750000
Stn 201 Stn 101 Stn 102 Stn 103 Stn 104To
tal T
N f
lux
(kg
) fo
r p
eri
od
Surf Spr Bot Spr Sedim Spr
Murrum bidgee Arm: TN flux Summer 1978/79
-250000
250000
750000
1250000
1750000
Stn 201 Stn 101 Stn 102 Stn 103 Stn 104To
tal T
N f
lux
(kg
) fo
r p
eri
od
Surf Sum Bot Sum Sedim Sum
Murrum bidgee Arm : TN flux Spring 1984
-300000
-100000
100000
300000
500000
Stn 201 Stn 101 Stn 102 Stn 103 Stn 104
To
tal T
N f
lux
(kg
) fo
r p
eri
od
Surf Spr Bot Spr Sedim Spr
Murrum bidgee Arm: TN flux Sum mer 1984/85
-300000
-100000
100000
300000
500000
Stn 201 Stn 101 Stn 102 Stn 103 Stn 104
To
tal T
N f
lux
(kg
) fo
r p
eri
od
Surf Sum Bot Sum Sedim Sum
Murrum bidgee Arm : TN flux Spring 1988
-200000
-100000
0
100000
200000
300000
400000
500000
600000
Stn 201 Stn 101 Stn 102 Stn 103 Stn 104
To
tal T
N f
lux
(kg
) fo
r p
eri
od
Surf Spr Bot Spr Sedim Spr
Murrum bidgee Arm: TN flux Summer 1988/89
-200000
-100000
0
100000
200000
300000
400000
500000
600000
Stn 201 Stn 101 Stn 102 Stn 103 Stn 104
To
tal T
N f
lux
(kg
) fo
r p
eri
od
Surf Sum Bot Sum Sedim Sum
Murrum bidgee Arm : TN flux Spring 1993
-200000
-100000
0
100000
200000
300000
400000
500000
600000
Stn 201 Stn 101 Stn 102 Stn 103 Stn 104
To
tal T
N f
lux
(kg
) fo
r p
eri
od
Surf Spr Bot Spr Sedim Spr
Murrum bidgee Arm: TN flux Sum mer 1993/94
-200000
-100000
0
100000
200000
300000
400000
500000
600000
Stn 201 Stn 101 Stn 102 Stn 103 Stn 104
To
tal T
N f
lux
(kg
) fo
r p
eri
od
Surf Sum Bot Sum Sedim Sum
Figure 4.9: Reach based internal TN loading, Murrumbidgee arm of Burrinjuck Reservoir
64

Chapter 4. Reservoir nutrient pathways
Murrum bidgee Arm : SS flux Spring 1993
-10000
0
10000
20000
30000
40000
50000
60000
Stn 201 Stn 101 Stn 102 Stn 103 Stn 104To
tal S
S f
lux
(t)
for
pe
rio
d
Surf Spr Bot Spr Sedim Spr
Murrum bidgee Arm : SS flux Spring 1994
-15000
-10000
-5000
0
5000
10000
15000
20000
25000
Stn 201 Stn 101 Stn 102 Stn 103 Stn 104
To
tal S
S f
lux
(t)
for
pe
rio
d
Surf Spr Bot Spr Sedim Spr
Murrum bidgee Arm : SS flux Spring 1995
-5000
0
5000
10000
15000
20000
25000
30000
35000
Stn 201 Stn 101 Stn 102 Stn 103 Stn 104To
tal S
S f
lux
(t)
for
pe
rio
d
Surf Spr Bot Spr Sedim Spr
Murrum bidgee Arm : SS flux Sum mer 1993/94
-10000
0
10000
20000
30000
40000
50000
60000
Stn 201 Stn 101 Stn 102 Stn 103 Stn 104To
tal S
S f
lux
(t)
for
pe
rio
dSurf Sum Bot Sum Sedim Sum
Murrum bidgee Arm : SS flux Sum mer 1994/95
-15000
-10000
-5000
0
5000
10000
15000
20000
25000
Stn 201 Stn 101 Stn 102 Stn 103 Stn 104
To
tal S
S f
lux
(t)
for
pe
rio
d
Surf Sum Bot Sum Sedim Sum
Murrum bidgee Arm: SS flux Sum mer 1995/96
-5000
0
5000
10000
15000
20000
25000
30000
35000
Stn 201 Stn 101 Stn 102 Stn 103 Stn 104To
tal S
S f
lux
(t)
for
pe
rio
d
Surf Sum Bot Sum Sedim Sum
Figure 4.10: Reach based internal SS loading, Murrumbidgee arm of Burrinjuck Reservoir
65

Chapter 4. Reservoir nutrient pathways
4.3.3 Modifiers of sediment redox processes
There are a number of potential modifiers of these sediment redox processes, as outlinedin the following notes.
Previous studies
Surveys of algal composition over the period 1973 to 1975 (May 1978) indicated thatthe 1974 flood significantly modified algal biomass and composition, with significantdepletion of algae during 1975, and removal of the species Anabaena circinalis.
Analysis of the 1976 to 1998 data
There is evidence indicating that extreme floods are an important modifier of sedimentredox conditions. Several processes are associated with these modifications:
1. elevated inflows causing re-suspension of previous sedimented material and transferto downstream deeper zones of the Reservoir, or discharge from the Dam outlets;
2. inflow of extreme suspended solids loads, high in abiotic material, with significantblanketing of organic sediments.
The effect of these changes is to significantly reduce for a period the redox conditions ofthe sediments (SOD) as a result of the depletion of previously stored organic material,and by blanketing of organic material under a layer of abiotic particles, having a highadsorption capacity.
As noted in Section 2.4, the results from sediment core dating analysis for the secondcore indicated significant discontinuities in the layer sequence, with presumably removalof layers under extreme flow conditions (Wasson et al., in press).
Discharges high in NO3 act as a significant buffer to reducing conditions in bottomwaters (internal loading). In situations where there is a high residue of organic materialin the sediments as a result of earlier wastewater discharges (SOD), or there remainselevated levels of organic material (BOD) in discharges, there may be a case for the useof wastewater effluent high in NO3 as a means of redox manipulation.
Conversely, effluent high in BOD or COD (such as nht) will exacerbate the redox condi-tions in the reservoir.
Analysis of bottom water DO, nox, NH3 and P concentrations for summer (stratified)conditions for Burrinjuck indicate depletion of DO and high NH4 and P levels in the presewage nutrient removal period, but low NH3 (high NOx) and low P levels for the postsewage P removal period.
66

Chapter 4. Reservoir nutrient pathways
It is concluded that while there is sufficient sediment BOD to deplete DO in the bottomwaters over the post 1983 periods of stratification, the NOx buffers further reduction suchthat denitrification occurs as N2 gas rather than NH3, and reducing levels are limitedsuch that the release of P is substantially diminished. As a result, the major nutrientpathway for the pre-sewage nutrient removal period is now substantially diminished,with other pathways becoming more important. Increases in pH will generally increasethe redox energy required to transform iron to soluble forms.
Sulphate in reservoir waters will act as an oxidant of organic matter. However, thetransformed HS- will then act as a reducer in respect to ferric iron, releasing PO4 to thewater column.
The modifiers of sediment redox processes are shown in Figure 4.11. The chemicalcomposition of sediments is an important determinant of their transformation responsesto reducing conditions. Sediments high in iron will reduce to dissolved forms at moderateredox levels, releasing PO4 to the water column. Sediments high in aluminium willrequire much higher energy to release the bonded PO4.
HPO4DO
Nitrate
FerricIron
Sulphate
N2(g)
FerrousIron
H2SO2
BOD
REDUCTION OXIDATION
StormEvent Algal Growth
O2 BOD
Figure 4.11: Sequence of sediment redox processes
As noted previously, high levels of residual organic material in sediments may create asignificant benthic oxygen demand. Organic material deposited from external loadingmay significantly exacerbate the level of sediment oxygen demand.
Consequently, sediments represent a major store (usually 90% to 98%) of phosphorus inreservoir systems. Nutrients and organic material accumulate under the reduced watertemperatures over the autumn and spring periods. Organic carbon is consumed morerapidly under the increased water temperatures over the late spring and summer periods,potentially leading to severe reducing conditions in the sediment, and release of P andN into the water column.
67

Chapter 4. Reservoir nutrient pathways
It could be argued that as the P and N stored in the sediments have originally come fromexternal loading, they are the drivers of algal growth. This view fails to recognise that thenormal geomorphological process is one of deposition and burial of organic material andP and their re-integration into the earth’s geology. The management issue is the excesslevel of disassociated nutrients available at any one time in surface waters. Secondly, atthe time of deposition, much of this material is bound or in a non-bioavailable form. Asa result of excessive loading of sediments with labile C, the N and P are transformedinto highly bio-available forms and released back into the water column.
4.4 Role of external loads
There is a need to examine the role of external supply of organic carbon and nutrients,and the manner in which they modify the nutrient pathways and supply rates outlinedin Section 4.1.
The external loading (nutrients and organic material discharged from the catchment) arelinked to reservoir water quality and ecological impacts on the basis of our understandingof:
1. in-stream transport, interception, re-suspension and transformation processes andpathways and their implications for spatial and temporal pattern of delivery to thereservoir, and for their composition;
2. the manner in which the discharges influence in-reservoir nutrient pathways.
Normally base flows are low in suspended solids (SS). In situations where a point sourcedischarge with elevated nutrient levels is superimposed on non-point source flows, thenutrients are subject to uptake by attached algae and biofilm within the river channelupstream of the reservoir. Inflows to reservoir surface waters are low in nutrients underthese conditions.
Elevated or event flows are typically high in SS. Under these conditions, there is rapidadsorption of P onto surfaces of SS and re-suspension of attached algae and biofilm thathad accumulated in the river channel under periods of low flow prior to the event flow.Inflow to the reservoir is characterised by high levels of abiotic SS and biotic particulatematerial and its rapid sedimentation in upstream shallow pools. Some SS and organicmaterial are transported through into bottom waters, depending on the magnitude andduration of the flow event.
Consequently, the total nutrient and organic material load (point or non-point sources)across the catchment and the phosphorus bio-availability and labile carbon content com-position of discharges, are important determinants of the in-reservoir nutrient pathways,and of the ultimate availability of nutrients for algal growth in reservoirs.
Where a catchment comprises predominantly low intensity grazing free of point sourcedischarges, levels of bio-available nutrients during periods of low flow will normally be
68

Chapter 4. Reservoir nutrient pathways
limited, limiting algal biomass under the direct discharge low flow conditions. Underhigh discharge conditions from non-point sources across the catchment, high loads of SSand limited organic material loading on inlet depositional zones and on bottom watersediments will again limit the potential for remobilisation of nutrients from either themixed inlet zone waters or the bottom water sediments.
Where a catchment comprises intensive agriculture or wastewater or irrigation drainagewater discharges, high levels of bio-available nutrients during periods of low flow mayincrease algal biomass under direct discharge low flow conditions. Under high dischargeconditions from non-point sources across the catchment, high loads of SS and organicmaterial on inlet depositional zones and on bottom water sediments will occur, leadingto remobilisation of nutrients from both the inlet zone and bottom water sediments.
The analysis of algal biomass and composition in Burrinjuck as a function of nutrient andorganic material loading pre and post-sewage nutrient removal phases, illustrates boththe rural catchments with high point source nutrient discharges, and rural catchmentswith low point source nutrient discharge conditions.
Analysis of internal C loading and external C loading indicates that the external loadingis some 40 times the internal loading pre sewage nutrient removal (98 vs 2.3 g/m2/a),and some 10 times the internal loading post sewage nutrient removal (9.8 vs 0.8 g/m2/a).For further detail on these calculations, refer to Section B.7
4.4.1 In-stream modification to pattern and composition of nutrient discharge tothe reservoir
The in-stream modification to nutrient composition and temporal pattern of delivery out-lined above are a function of catchment types and flow conditions. They are summarisedin Table 4.2.
Figures 4.2 and 4.1 summarise the analysis of TP and FRP daily loads at the confluenceof the Molonglo and Murrumbidgee Rivers 40 km upstream of the discharge to BurrinjuckReservoir (Taemus Bridge), and the monitored daily load at Taemas Bridge.
The substantial loss of nutrients under low flow conditions indicates the in-stream (bi-ological) uptake of FRP between the Molonglo River confluence and Taemus Bridge.The substantial delivery during elevated flow conditions of the Molonglo River conflu-ence load, or delivery of loads in excess of the confluence load, indicate the scouring andre-suspension of nutrients lost during the low flow periods.
4.4.2 Morphology of reservoir
The shape and depth of the reservoir has important implications for processes suchas wind mixing depth, stratification patterns, and the distribution of organic materialdeposited per unit area across the reservoir sediments.
69

Chapter 4. Reservoir nutrient pathways
Table 4.2: In-stream modification to nutrient composition
Catchment type Low flow conditions Elevated flowconditions
Lowland rural stream Low SS, low nutrient andorganic material. Warmstream relative toreservoir in summer enterssurface mixed layer.
Elevated SS, elevatednutrients and organicmaterial. Cold streamrelative to reservoir insummer plunges belowsurface mixed layer.
Lowland rural stream+ WWTP discharge
As above plus in-streamuptake of nutrients byattached algae and biofilm(riffles, sand beds).
As above plusre-suspension of organicmaterial accumulatedduring low flow periods.
Lowland rural stream+ WWTP and urbancatchment discharges
As above plus reduced lowflow duration due tourban stormwater runoff.
As above plus increasedfrequency of elevated flowevents, with sharphydrographs and reducedevent flow duration.
Direct discharge ofWWTP effluent toreservoir
Direct uptake of dissolvednutrients. Elevated BOD,remobilisation ofsedimented nutrients.
An open reservoir shape will experience higher wind velocities and increased surfacemixing than a dendritic shaped reservoir such as Burrinjuck. The reservoir depth relativeto the mixed depth will determine the potential extent of anoxic bottom waters (internalloading) over the summer period.
A broad delta arrangement at inflow points to the reservoir will maximise the distributionof sedimented organic material, thereby limiting the deposition per unit area per dayand consequently the redox potential, as compared to a constrained linear shape such asBurrinjuck.
70

Chapter 5
Factors determining algal biomass
5.1 Background
Like all plants, algae require nutrients, light and an adequate temperature to grow (Fig-ure 5.1). The mass of cells that results when these environmental conditions are satisfac-tory is also influenced by cell losses resulting from animal grazing, sedimentation fromthe water column, wash-out by high flows and cell death due to disease. Despite thesecomplicating factors, the initial development of algal populations is largely dependent onthe physical and chemical conditions supportive of growth. Because responses can varybetween reservoirs, the modelling of algal growth requires information on the specificcharacteristics of a site and in particular the availability of light and nutrients and thedegree of water mixing and hydraulic retention time. The purpose here is to describesome of these characteristics and their importance in an assessment of reservoir function.
5.1.1 Availability of light
The microalgae that grow suspended in the water column are referred to as phytoplank-ton. Unlike land plants that are fixed in position, phytoplankton are moved verticallyand horizontally through the water column by mixing processes. As a result, the lightthat they encounter is not simply a function of the daily incident sunlight but also theextent to which mixing moves the cells away from the illuminated surface layers.
A description of the light characteristics through the water column, with reduction withdepth, to a point where light is insufficient to support algal photosynthesis (zeu or euphot-ic depth) is provided in Chapter 3. A description of factors driving mixed depth is alsoprovided in Chapter 3. The material highlights the importance of the zeu:zmixratio as anindicator of availability of light. At ratios of less than 0.3, algae dependant on mixing willbe disadvantaged in relation to other alga having other strategies for maintaining theirposition in the euphotic zone (blue-green alga having bouyancy vacules, dino-flagellateshaving swimming flagella). Conversely, the green alga require some vertical mixing to
71

Chapter 5. Factors determining algal biomass
Organiccarbon
Microbialbiomass
Sedimentchemistry
WindStrength
Flow LightIntensity
Diffuse orPoint source
Lightdepth
Mixing &turbulence
Algal biomass
Algal composition
Sedimentation
Total nutrient- particulate-dissolved
Lightavailability
Bio-availablenutrients
Grazing
Gasbalance
(O2, CO2)
Figure 5.1: Factors influencing algal growth and composition
cycle them through the euphotic zone. Under calm (low mixing) conditions typical ofmid to late summer, green alga will be further disadvantaged in relation to other algawhich have strategies for maintaining their position in the euphotic zone.
5.1.2 Availability of nutrients
In addition to sufficient light the algae also require nutrients. Although a wide rangeof nutrients are required it is the availability of nitrogen and phosphorus that usuallyregulate algal growth when light conditions are sufficient. In freshwater ecosystemsphosphorus is often in shortest supply and runs out first as the algae grow. As a result,the quantity of phosphorus that is available to the algae will determine the maximumalgal concentration that can form.
This dependency has been used in many lakes to try and predict the amount of algaethat will develop in the growth season from the amount of phosphorus present in thewater preceding the growth period. Although this has been very successful for specific
72

Chapter 5. Factors determining algal biomass
reservoirs, the relationships differ significantly between reservoirs. As a result there isnot a simple, single relationship that can be used in all situations. One reason for thisvariability is that the techniques generally used to measure phosphorus are not specificto the form of the nutrient that is available to algae. In some cases the cells cannot accessa large amount of the measured phosphorus and so the maximum population shows norelationship to the phosphorus concentration. Recently techniques have been improvedto directly measure the forms of phosphorus available to the algal cells and this appearsto improve the models relating phosphorus to cell development.
In eight reservoirs across southern Australia a single relationship was developed to predictthe summer algal growth (Oliver, R. 1999, pers comm). This is illustrated in Figure 5.2.In these systems thermal stratification was persistent through the summer period. Con-sequently, available nutrients were largely limited to those within the surface mixed layer.
Fe-desorbed P (mg m-3)
Max
imu
m c
hlor
ophy
ll-a
(mg
m-3
)
0
10
20
30
40
50
60
70
80
0 50 100 150 200
Chl-a = 1.06FeP + 5n=8, r2=0.8, P<0.005
Figure 5.2: Maximum summer Chlorophyll ’a’ concentration as a function of bioavailable phosphorusfor eight reservoirs in SE-Australia.
Harris notes the relationship between the total P concentration in natural waters andthe biomass of algae in water. Chlorophyll ’a’:TP ratios decline from about 1.0 foroligotrophic lakes to 0.2 to 0.3 for eutrophic lakes (Harris 1986).
It appears from these reservoir studies that the availability of phosphorus regularly con-trols the final biomass of algae that develops and this is consistent with findings frommany lakes around the world. However this does not mean that nitrogen, the othermajor nutrient required for cell growth, is always abundant and has no influence onalgal growth. There are important interactions resulting from the relative availabilitiesof nitrogen and phosphorus that are particularly relevant to the management of algalblooms.
73

Chapter 5. Factors determining algal biomass
In weir pools on the Darling River and Murrumbidgee River it has been shown thatnitrogen can initially be the nutrient in shortest supply and the first to run out as algaegrow (Webster et al. 1996). In these systems an initial nitrogen limitation was observedto occur just as often as an initial phosphorus limitation, and at times nitrogen limita-tion regulated the algal biomass. The influence of nitrogen limitation on algal growthcontinued in these systems so long as mixing of the water column was maintained, dis-advantaging the growth of buoyant blue-green algae. However, as soon as flows declinedand intense temperature stratification occurred, problematic blooms appeared. Theseconditions are particularly suitable for buoyant blue-green algae that are not reliant onwater motion to sustain their suspension in the water.
Certain species of blue-green algae can capture nitrogen gas that has dissolved intothe water from the atmosphere and are able to use this as a source of nitrogen. Forexample blue-greens blooms of the group Anabaena commonly occur. Because theseorganisms can overcome the nitrogen limitation in the water they are advantaged overcompeting algae. The supply of nitrogen from the atmosphere is effectively inexhaustibleand consequently the nitrogen fixing blue-green algae continue to grow until a secondarylimitation occurs. In many cases it is the availability of phosphorus that determinesthe potential final biomass of the population. In these situations nitrogen limitationprovided a growth advantage to an undesirable species that causes considerable waterquality problems. A reduction in the phosphorus load to such systems can reduce thefinal biomass of nitrogen fixers that will develop. It can also reduce the likelihood ofnitrogen limitation and so reduces the probability that nitrogen fixing blue-greens willappear.
Loss factors such as grazing and sedimentation modify the species composition of algalcommunities and can decouple relationships between nutrients and biomass. Much moreinformation is required on these complex interactions. The complexity can be demon-strated by a decision support tree (Oliver & Ganf 1999) that was devised in an effort toexplain the major factors influencing the appearance of particular genera of blue-greenalgae (Figure 5.3). This highlights especially the interplay of light, mixing and formsof nitrogen in determining the success of particular Cyanobacteria. It provides a se-ries of hypotheses about physical, chemical and biological interactions that need furtherresearch.
5.2 Previous Burrinjuck studies
A dimensional analysis performed to evaluate factors governing algal and nutrient dis-tributions (Humphries & Imberger 1981) concluded that:
1. under elevated flow conditions, flow driven advection mixing is important;
2. horizontal mixing considered was not important;
3. phosphorus is the most likely the limiting nutrient.
74

Chapter 5. Factors determining algal biomass
YES
YES
YES
AVAILABLE-P>10 mg m-3
YES
NO SEDIMENT-P SUPPLYHIGH
YES
CYANOBACTERIALBIOMASS LOW
TURNOVER TIME DUE TOFLUSHING> 10 DAYS
YES
NO
TURBULENT VELOCITY (U*)FLOATING VELOCITY (V)
U*<15V
YES
NO
NO
RESTRICTED ZMIX AS LAKESHALLOW OR INTENSELYSTRATIFIED, WELL MIXED
FREQUENT L:D CYCLESZEU/ZMIX> 0.3
YES
WATER TEMPERATURE>10oC
YES
GRAZINGBCLAD/BPHYTO<0.1
NO
INOCULUMCELLS/ML>15
NO
NO
YES
INORGANIC-NN>100 mg m-3
NO
YES
OSCILLATORIATYPE
LARGE TOMODERATE
MICROCYSTISCOLONIES
NO
INORGANIC-NN>100 mg m-3
LARGE TOSMALL
CLUMPEDANABAENA ETC
APHANIZO-MENON
ETC
ZEU>ZMIX
NO
YES
INORGANIC-NN>100 mg m-3
YESNO
SMALL SINGLEFILAMENTSANABAENA
ETC
SEDIMENT-PCONTENTENRICHED
NO
NO
SUBSTANTIALAREA OF LAKE
BOTTOMILLUMINATED
NH4:NO3
LOW
BENTHICRECRUITEMENT
EG.GLOEOTRICHIA
YES NO
REDUCEDRISK
HIGHRISK
METALIMENTICPOPULATIONS
DISPERSEDPOPULATIONS
WIND SPEED<3 m s-1
DISPERSED INSURFACE
MIXED LAYER
NO YES
TIME PERIODOF WINDtW<L/CS
YES
NO
SURFACE BLOOM
ACCUMULATION ON LEE SHORE
YES
SURFACENUTRIENTS
HIGH
NOYES
NO
Figure 5.3: Flow chart summarising prominent environmental characteristics supporting the devel-opment of Cyanobacteria blooms and selecting for particular genera.
75

Chapter 5. Factors determining algal biomass
Monitoring undertaken in the period 1981 to 1986 (Office of ACT Administration 1987)indicated that in the case of Lake Burley Griffin, algal biomass correlated with nutrientlevels in the Molonglo River (Sewage treatment plant discharge 3 km upstream), whereasin the case of Lake Ginninderra (urban and rural non-point source (event) discharges),there was no correlation between in-lake nutrient levels and algal biomass.
Concentrations of in-lake TP and FRP were 3 to 6 times higher in Lake Burley Griffinthan in Lake Ginninderra. The TN:TP ratio was 5–10 for Lake Burley Griffin and 20–30for Lake Ginninderra. The NH3:NOxratio (gravimetric) was 0.33 for Lake Burley Griffinand 0.28 for Lake Ginninderra. The Chlorophyll ’a’:TP ratio ranges from 0.43 to 0.63for the two lakes.
The middle reach sediments of Lake Burley Griffin had similar median TP composition(0.43 mg P/g) to Lake Ginninderra sediments (0.35 mg P/g). However, the sedimentsin the upstream basin of Lake Burley Griffin had a median TP value of 0.7 mg P/gsediment.
Redox analysis (column based analysis) indicated mean release rates of 17 g P/m2/dayfor Lake Burley Griffin upstream basin versus 0.4 mg P/m2/day for Lake Ginninderra atthe same DO level (1 mg/L). Helium gas was used to strip DO. There was no addition oforganic material to the columns, with sole reliance on SOD to drive redox levels down.
5.3 1976 to 1998 data: Algal biomass conditions
Figures 5.4 to 5.9 summarise the average TP, FRP, NH3, NOx, NH3:NOxratio and Chloro-phyll ’a’ for the summer periods 1976 to 1998 longitudinally through the Reservoir.
The contours illustrate a general pattern of elevated TP, FRP, NH3 levels and NH3:NOxratiofor the period 1976 to 1981, followed (with the exception of 1996/1997) by substantiallyreduced values thereafter. The NH3:NOxratio shifts from ranges of 0.4 to 1.0 (gravi-metric) pre 1981, to 0.2 to 0.1 post 1985. An exception occurs in 1996/1997 whenNH3:NOxratios again increase to the order of 0.4 to 0.8.
The contours also illustrate the significantly higher levels of TP, FRP,NH3,NH3:NOxratioin the inlet zone to the Reservoir, with gradual decay in values with distance downstreamof the inlet zone towards the Dam wall.
Figure 5.9, average Chlorophyll ’a’ values illustrates the elevated levels (20 to 80 µg/L)pre 1981, and substantially reduced levels (20 to <1 µg/L) for the post 1985 period, butwith elevated levels for the period 1996/1997. Again, the Figure illustrates a pattern ofhigher levels of Chlorophyll ’a’ in the inlet zone as compared to downstream reaches.
The inlet zone (’hot spots’ on the contour graph) moves downstream during periodsof significant Reservoir drawdown, such that the shallow inlet depositional zones mayoccupy a lower reach previously considered a deep and stratified middle reach.
Figure 5.10, Chlorophyll ’a’:TP ratios for surface waters, indicates Chlorophyll ’a’ to
76

Chapter 5. Factors determining algal biomass
TP ratios of 0.1 to 1.5, with a mean of the order of 0.4. High ratios appear to beassociated with periods of severe drawdown (pore water high in FRP), while low ratiosare associated with periods of high inflow (high abiotic particulates, adsorption of P).Average TP (mg/L) (12-4)
�
101 102 103 104 105 106 107 108
1980
1985
1990
1995
0.06
0.06
0.04
0.04
0.04
0.04
0.04
0.04
0.02
0.02
0.06 0.04
0.04
0.02
0.04
0.04
0.04
0.04
0.02 0.02
0.04 0.04
0.04
0.02 0.06 0.06
0.06 0.06
0.06
0.04 0.04
0.04 0.02
0.10
0.08
0.08
0.08
0.20 0.18 0.16 0.14 0.12
0.12 0.10 0.10
0.10
0.08
0.08
0.08
0.08
0.10
0.06
0.06
0.06
0.06
0.06
0.06
0.12 0.10 0.08
0.08 0.10
0.10 0.08
0.12
0.16 0.14
Figure 5.4: Reservoir average TP (mg/L) as a function of time and station.
77

Chapter 5. Factors determining algal biomass
Average Dissolved Phosphorus (mg/L) (12-4) �
101 102 103 104 105 106 107 108
1980
1985
1990
1995
0.01
0.01 0.01
0.01
0.01
0.01 0.01
0.01 0.01
0.01 0.01
0.03
0.02
0.02
0.02
0.02 0.02
0.02
0.02
0.02 0.02
0.02
0.03 0.02 0.01
0.01
0.01
0.01
0.03
0.04
0.03
0.03
0.03
0.03
0.06 0.05 0.04
0.05
Figure 5.5: Reservoir average FRP (mg/L) as a function of time and station.
78

Chapter 5. Factors determining algal biomass
Average NOx (mg/L) (12-4) �
101 102 103 104 105 106 107 108
1980
1985
1990
1995 0.50 0.50
0.75 0.75
0.75
0.75
0.75
0.50 0.50
0.50
0.50 0.50
0.50
0.25 0.25
0.50
0.50
0.50
0.50 0.50
0.25 0.25 0.25
0.50 0.50 0.50
0.25 0.25
0.25
0.25
0.75
0.75
0.75
0.75 0.75 1.00
1.00
1.00
1.00
1.00
0.75
0.75
0.25
0.25
0.25
1.75 1.50 1.25 1.00
2.25 2.00 1.75 1.50 1.25
1.00
1.00 0.75
0.50
1.75 1.50 1.25 2.00
1.75 1.50 1.25
1.75 1.50 1.25
0.75
1.00 0.75
0.50
Figure 5.6: Reservoir average NOx (mg/L) as a function of time and station.
79

Chapter 5. Factors determining algal biomass
Average Ammonia (mg/L) (12-4) �
101 102 103 104 105 106 107 108
1980
1985
1990
1995
0.2 0.2
0.2 0.1
0.1 0.1
0.1
0.1
0.1
0.1
0.1 0.1
0.1 0.1
0.1 0.1
0.1
0.5 0.4
0.4
0.3
0.3
0.4 0.3
0.3 0.2
0.2
0.2
0.4
0.4
0.3 0.3
0.3
0.2
0.2
0.2
0.1
0.1
0.4 0.3 0.2 0.1
0.1 0.4 0.3 0.2
0.8 0.7 0.6
0.5
0.1
0.4 0.3 0.2
Figure 5.7: Reservoir average NH3 (mg/L) as a function of time and station.
80

Chapter 5. Factors determining algal biomass
Average Ammonia/NOx (molar) (12-4) �
101 102 103 104 105 106 107 108
1980
1985
1990
1995
20
20 20 20
40
40
40 20
40 20
100 80
60
40 20
Figure 5.8: Reservoir average NH3:NOx ratio (molar) as a function of time and station.
81

Chapter 5. Factors determining algal biomass
Average Chlorophyll-A (ug/L) (12-4) �
101 102 103 104 105 106 107 108
1980
1985
1990
1995
40 20
40 40
20 20
40 40
40 20 20
20 20 20
20
20
0 0
80 60 60
60 40
40
40
80 60
20
20
20
40
20
20
40
20
40
40
Figure 5.9: Reservoir average Chlorophyll ’a’ (µg/L) as a function of time and station.
82

Chapter 5. Factors determining algal biomass
0.0
0.2
0.4
0.6
0.8
1.0
1.2
1.4
1.6
1.8
1976 1980 1984 1988 1992 1996
Chl
orop
hyll
'a'/T
P r
atio
Pre 1983 data
Post 1983 data
Figure 5.10: Chlorophyll ’a’ to TP ratio, Station 108 Burrinjuck Reservoir.
5.4 1976 to 1998 data: Explanatory analysis
The analysis identified the following key processes and pathways:
5.4.1 Pre sewage phosphorus removal period: 1976 to 1978
During this period, Canberra sewage effluent discharges were high in nutrients, ammonia,suspended solids and BOD. A high rate of uptake of nutrients is evident in the data forthe Murrumbidgee River downstream of the wastewater effluent discharges, with theattached algae (Hydrodictyon, Cladophora) forming kilometres of algal mats across theRiver water surface. Periodic sloughing of material occurred as a result of urban stormdischarges or wider catchment discharges.
Under these conditions, there was significant sedimentation of organic matter dischargedduring inflow events in inlet depositional zones of the Reservoir, or across several reachesunder high and sustained inflow conditions. The deposition of organic material lead toreduction of sediments and remobilisation of FRP in a bio-available form. Bottom watersexhibited depletion of DO and high levels of NH3 and FRP, indicative of severe reducingconditions in these waters. The mixing of nutrient rich bottom waters with surfacewaters at the time of Reservoir turnover appears to be the major source of nutrientsdriving algal growth for this period. There were high levels of algal biomass as a result.
83

Chapter 5. Factors determining algal biomass
5.4.2 Sewage phosphorus and nitrogen removal period: 1978 to 1983
The de-nitrification unit of the LMWQCC was operated during:
December 1978 to April 1979 (limited de-nitrification achieved);September 1979 to April 1980;August 1980 to April 1981;September 1981 to May 1983.
This operation is evident on the time series plot of TN loading on the Reservoir (Fig-ure 2.19).
The algal response (increase in Cyanobacteria cell numbers) to operation of the de-nitrification unit was complicated by the significant Reservoir drawdown over this peri-od. The NH3:NOxratio (refer to Figure 5.11, Bottom NH3:NOx ratio, Site 104) increasedsignificantly (ratio 1.0) during periods of de-nitrification as compared to levels for sim-ilar stratification periods of P removal but no de-nitrification (ratio of 0.1) from 1984onwards.
The inference is that the reducing conditions within sediments of the Reservoir wereexacerbated by de-nitrification.
0.001
0.01
0.1
1
10
100
1000
1976 1980 1984 1988 1992 1996
Bot
tom
NH
4:B
otto
m N
Ox
0
2
4
6
8
10
12
14B
otto
m D
O (
mg/
L)
NH4/NOx at bottomDO at bottom
Figure 5.11: Bottom DO and NH3 to NOx ratio, Station 104 Burrinjuck Reservoir
84

Chapter 5. Factors determining algal biomass
5.4.3 Post sewage phosphorus removal period: 1984 to 1998
Medium to high Reservoir storage levels
While there was continued high rate of sedimentation of SS discharged during inflowevents in upstream (mixed) reaches of the reservoir, the substantial reduction in organicmaterial discharged limited the potential for reduction of sediments and therefore remo-bilisation of P. This is reflected in the low nht:NOx ratios within the water column, andsubstantial reduction in algal biomass.
While bottom waters generally exhibit low to zero DO, they continue to maintain highlevels of NOx, indicating limited redox conditions even in the bottom waters. Underthese conditions, the bottom waters ceased to be a major source of nutrients to thesurface waters at the time of Reservoir turnover. As a consequence, there was substantialreduction in algal biomass to oligotrophic levels.
The application of inflows having high NOx is analogous to the injection of NOx intosediments of lakes applied in the northern hemisphere, as a means of oxidising organicmaterial in the sediments to restore lake water quality.
For medium to high Reservoir storage level conditions, the substantial area of the inletdepositional zone ensured low levels of organic carbon loading per area, thereby limitingthe potential for remobilisation of nutrients within the inlet zones.
Periods of significant Reservoir drawdown
Under conditions of significant Reservoir drawdown the volume and the surface area ofupstream reaches are significantly reduced (to 10% to 20% of their Reservoir full levels).As a result, the deposition of organic material per square metre of sediment area issignificantly increased, leading to the development of severe redox conditions and theremobilisation of P.
A lake model analysis indicates good fit between predicted and observed TP and algalgrowth data, except for the close to empty conditions, when observed TP and algallevels are in excess of model estimates. Significant drainage of P rich pore waters fromsediments exposed by Reservoir drawdown is postulated as a possible explanation of thisanomaly.
The release of significant P to surface waters led to significant increase in algal biomassunder these conditions.
85

Chapter 5. Factors determining algal biomass
5.5 Conclusions
It is concluded that the availability of phosphorus in the surface mixed layer appearsto be the major determinant of algal biomass. Major phosphorus sources or pathwayscomprise:
1. hypolimnetic P during the period of high nutrient and organic carbon loading onthe Reservoir (1976 to 1980);
2. remobilisation of sediment P in inlet depositional zones following inflow events inspring and summer, particularly under low Reservoir level conditions;
3. drainage of P rich pore waters and re-suspension of particulates from sediments(exposed by rapid drawdown of Reservoir) to receding Reservoir surface water.
86

Chapter 6
Factors determining algal composition
6.1 Background
The composition of the algal community is influenced by a range of physical, nutrientavailability and composition (forms), and grazing processes. As a result, algal composi-tion reflects in large measure:
1. the seasonal changes that occur in mixing conditions:
• turbulent conditions with elevated inflows in early spring;
• thermal stratification over late spring through summer;
2. potential reduction in available light as a result of self-shading of algal growth;
3. potential depletion in one or other nutrients to limiting levels;
4. build-up (grazing) of zooplankton populations.
Frequently the first algal types to increase in concentration in early spring are the Di-atoms, followed by green algae, then blue-green algae and finally dinoflagellates. Astemperature stratification breaks down in autumn there can be a resurgence of some ofthese populations before the algal numbers fall away to low levels through winter.
Harris notes that a knowledge of the factors underlying seasonal species successions maymake it possible to predict the occurrence of particular species (Harris 1994). Droughtsand floods tend to switch Australian water bodies between Cyanobacteria blooms (whicheither regulate their buoyancy or float) and Diatoms (which sink rapidly) so the climatevariability has a major impact on the biota and the biogeochemistry of the ecosystem(Heaney et al. 1995).
Diatoms are favoured by short residence times, vertical mixing, optically deep watercolumns and strongly pulsed external sources of silica (Harris & Baxter 1996). They haverelatively high sedimentation rates and are physiologically suited to growth under deeply
87

Chapter 6. Factors determining algal composition
mixed, low light conditions (Harris 1978) when silica is available. Diatoms thereforerespond to increased flows.
Cyanobacteria are favoured by long residence times, quiescent (stratified) states, lowdissolved inorganic nitrogen (DIN) in surface waters, and in monomictic systems, stronghypolimnial anoxia. Many Australian storages have anoxic hypolimnia with a strongbuild-up of ammonia, phosphate and sulphides in bottom waters. Cyanobacteria whichshow buoyancy faculty are able to regulate their depth through a mechanism of gasvacuoles and ballast accumulation which is linked to photosynthesis and the underwaterlight climate (Reynolds et al. 1987). This buoyancy regulation mechanism is necessarilyrather slow so rapid fluctuation in turbulence and the underwater light climate do notfavour this growth strategy.
Sediment fluxes of N, which regulate the form and concentration of N in surface waters(especially ammonia from anoxic sediments), are important in determining both thebiomass and species composition (Harris 1996). A recent paper (Blomquist et al. 1994)has shown that the species composition of dominant Cyanobacteria in freshwater maybe manipulated by changing the dominant form of DIN in the system. Small-celled, nonN-fixing Cyanobacteria (Microcystis) appear to be favoured by the presence of high levelsof ammonia in the water, whereas N-fixing Cyanobacteria (Anabaena, Aphanizomenon)are favoured by low concentrations of nitrate.
Table 6.1 shows a summary of factors determining algal composition. Mixing conditionsrefers to vertical circulation as a result of wind or inflow forces:
High mixing zeu:zmix < 0.2Moderate mixing zeu:zmix 0.2–0.4Low mixing zeu:zmix > 0.4
Table 6.1: Summary of factors determining algal composition
Nutrient environment Mixing conditions in the surface mixed layerHigh Moderate Low
High Si, High P, High N Diatoms Greens Blue-Greens(high biomass) (high biomass)
Low Si, Low P, Limiting N Diatoms Greens Blue-Greens(low biomass) (low biomass)
6.2 Previous Burrinjuck studies
The ACT Region Water Quality Study (1978) noted that the succession pattern for1976/1977 comprised Diatoms following the flood event in October 1976, followed bygreens in late Spring, and blue-greens in late December to March. There was a returnof the greens through the middle and lower reaches of the Reservoir post March, butsustained high levels of Microcystis in the upstream reaches.
88

Chapter 6. Factors determining algal composition
A study based on the application of DYRESM to Burrinjuck (Humphries & Imberger1981) concluded that the shallow mixing layer depth conditions prevailing in BurrinjuckReservoir advantaged the floating species (Cyanobacteria) over the mixing dependent(sinking) species
6.3 1976 to 1998 data: Algal composition conditions
Figures 6.1 to 6.4 summarise the algal cell numbers for the major algal Divisions, for theperiod 1976 to 1998, longitudinally through the Reservoir. Figure 6.1 illustrates the
Jan Feb Mar Apr May Jun Jul Aug Sep Oct Nov Dec0
1
2
3
4x 10
4 Blue Greens
Alg
ae (
No.
/mL)
Jan Feb Mar Apr May Jun Jul Aug Sep Oct Nov Dec0
2000
4000
6000
8000
Greens
Alg
ae (
No.
/mL)
Jan Feb Mar Apr May Jun Jul Aug Sep Oct Nov Dec
0
2000
4000
6000Diatoms
Alg
ae (
No.
/mL)
Month
Figure 6.1: Succession of Cyanobacteria, Chlorophyta and Diatoms.
strong seasonal succession pattern with Diatoms generally dominant over the autumn toearly spring period, greens over mid spring to early summer, and blue-greens throughsummer to early autumn. Figure 6.2 illustrates relatively constant Diatom numbersthroughout the 1976 to 1998 period, except for a few periods of high and prolongedinflow to the Reservoir (1978, 1984 and 1994).
89

Chapter 6. Factors determining algal composition
Average Diatoms (no/mL) (2-9) �
101 102 103 104 105 106 107 108
1980
1985
1990
1995 2000 2000
2000
2000
2000
3000 3000
3000
3000
3000
2000 2000 1000 1000
1000
1000
1000 1000
1000 1000
1000
4000 3000
3000
4000 4000
2000
2000
2000
2000
2000 2000
2000
4000
1000 2000
3000
3000 5000 4000
6000 5000 4000
1000
6000
Figure 6.2: Reservoir average Diatoms as a function of time and station.
90

Chapter 6. Factors determining algal composition
Average Cyanophyta (no/mL) (12-4) �
101 102 103 104 105 106 107 108
1980
1985
1990
1995
4.0e+4 4.0e+4
2.0e+4
4.0e+4 4.0e+4 2.0e+4
2.0e+4
1.0e+5 8.0e+4 8.0e+4
6.0e+4
6.0e+4 4.0e+4
4.0e+4 2.0e+4 2.0e+4
6.0e+4
6.0e+4 4.0e+4
6.0e+4
6.0e+4
6.0e+4
4.0e+4
4.0e+4
4.0e+4
2.0e+4
2.0e+4
2.0e+4
2.0e+4
1.4e+5 1.2e+5 1.0e+5
1.0e+5
8.0e+4
8.0e+4
8.0e+4
6.0e+4 4.0e+4
4.0e+4
8.0e+4 6.0e+4
1.0e+5
8.0e+4
8.0e+4
2.0e+4 1.4e+5 1.2e+5 1.0e+5
0.0
8.0e+4 6.0e+4 4.0e+4 2.0e+4
1.0e+5
0.0
4.0e+4
6.0e+4
2.0e+4
8.0e+4 6.0e+4
4.0e+4
Figure 6.3: Reservoir average Cyanobacteria as a function of time and station.
91

Chapter 6. Factors determining algal composition
Average Chlorophyta (no/mL) (12-4) �
101 102 103 104 105 106 107 108
1980
1985
1990
1995
4000 2000
4000
4000
2000
2000
2000
2000 2000
6000
6000
6000 6000
4000 4000 2000 2000
4000 4000
2000
2000
4000
2000
2000
2000 2000
4000 4000
4000 2000 2000
2000 2000 2000 2000
2000 2000
2000
2000
6000 6000
8000 8000 8000
6000 6000 6000
12000 10000 8000
8000 6000 6000
6000
4000 4000
4000 4000
4000
4000
4000
4000
10000
6000
4000
4000
8000
8000 6000
4000
4000
4000
2000
10000 8000 6000
14000 12000
6000
2000
4000 2000
8000 6000
2000
6000
Figure 6.4: Reservoir average Chlorophyta as a function of time and station.
92

Chapter 6. Factors determining algal composition
Figure 6.3 illustrates the high numbers of Cyanobacteria for the period 1976 to 1983,and virtual absence thereafter until 1995. Figure 6.4 illustrates the relatively constantChlorophyta numbers throughout the 1976 to 1998 period. Higher numbers are evidentat the inlet zones, particularly during periods of high drawdown.
The inlet zone (hot spots on the contour graph) moves significantly downstream duringperiods of low Reservoir levels associated with low inflows and high water abstraction.
6.4 1976 to 1998 data: Explanatory analysis
In general, Burrinjuck Reservoir exhibits the succession of Diatoms, Cyanobacteria andChlorophyta (Figure 2.11) . As temperature stratification breaks down in autumn therecan be a resurgence of Diatoms before populations fall away to low levels over winter. Al-though this general pattern is often observed, it can be significantly modified dependingon the flow conditions and Reservoir levels prevailing each year.
A number of shifts in the seasonal pattern of algal composition were observed for Bur-rinjuck for the period 1976 to 1998.
Table 6.2: Association of algal composition with physical and chemical factors for the October toApril growth period, Murrumbidgee arm Burrinjuck Reservoir
Year Spring Summer Spring Reser- zeu:zmix Wastewater Summerdia- dominance inflows voir nutrient discharge TN:TPtoms Cyano Chloro level in SML
1976/77 D D F VH H High P and NH3 3–301977/78 D D F L H–E High P and NH3 3–401978/79 D D F VH H 0.5–0.2 Low P, High NOx 4–301979/80 D D F L H–E Low P, Low N 9–401980/81 D D F L L–E 0.3 Low P, Low N 1–601981/82 F D F M H–M 0.3 Low P, Low N 2–201982/83 F D F VL M–E 0.5–0.3 Low P, Low N 4–1001983/84 F A D H H 1.0–0.1 Low P, High NOx 20–301984/85 D A D M H–M 0.4 Low P, High NOx 30–401985/86 D A D M H–M 0.5–0.3 Low P, High NOx 20–1001986/87 D A D H H–M 0.5–0.3 Low P, High NOx 30–1001987/88 F A D L H–E 0.5–0.3 Low P, High NOx 30–1001988/89 F A D H H 0.5–0.1 Low P, High NOx 15–301989/90 F A D M H–M 0.5–0.1 Low P, High NOx 1001990/91 F A D M–L H–M 0.5–0.2 Low P, High NOx 4–801991/92 D A D M–L H–M 0.5–0.2 Low P, High NOx 20–1001992/93 M D F M H 0.5–0.1 Low P, High NOx 20–801993/94 M A D M H–M 0.4–0.2 Low P, High NOx 801994/95 F A D VL M–L 0.3–0.1 Low P, High NOx 1001995/96 D* D F M H 0.5–0.3 Low P, High NOx 1001996/97 D D F M H– L 0.5–0.3 Low P, High NOx 30–801997/98 D D F L H–E Low P, High NOx
93

Chapter 6. Factors determining algal composition
Key for Table 6.2D Dominant F Few M MediumA Absent VH Very High H HighL Low VL Very Low E Empty* late summer dominance
6.4.1 Mixing conditions
Elevated spring inflows appear important in terms of supply of silica, together with wellmixed Reservoir conditions (elevated wind over spring period and elevated inflows), indetermining Diatom dominance over the spring period.
While the summer zeu:zmix ratio is low throughout the 22 year period of data, Cyanobac-teria is the dominant group only for the high wastewater nutrient discharge period (1976to 1983), and for periods of low Reservoir levels. At other times, Chlorophyta is the dom-inant algal group. The Chlorophyta group adapts to the low zeu:zmix ratio by shifting todominance by the flagellated genera in late summer.
6.4.2 Limiting nutrient
Discharges to the reservoir that are low in nitrogen relative to phosphorus, or losses ofnitrogen from the reservoir as a result of de-nitrification, may reduce inorganic nitrogento limiting values, providing a competitive advantage for the N-fixing blue-green algaover the green alga.
Under elevated suspended solids, elevated iron and low bio-available P discharges to thereservoir (catchments free of point source discharges), there may be limitation of bio-available P for microbial growth in the sediments, with accumulation of TP and organicmaterial in the sediments resulting.
The ratios of total nitrogen to total phosphorus concentration are commonly used toassess the relative availability of nitrogen and phosphorus for algal growth. Unfortunatelythis can be very misleading as the nutrient forms included in the analyses of total amountsare not all available to algae.
The (NOx+NH3):PO4–P ratio for surface waters for Station 104 is presented at Fig-ure 6.5. The graph indicates that limiting N conditions (N:P less than 16 molar, or lessthan 7 gravimetric), with ratios as low as 1 gravimetric, occurred over the period 1976to 1980. During periods of de-nitrification at LMWQCC, low ratios (less than 1) againoccurred over the period 1980 to 1983. The growth of Anabaena circinalis was reportedover this period, in association with Microcystis. Under N limiting conditions, alga hav-ing N-fixing capabilities such as Anabaena circinalis, will have a competitive advantageover other alga.
94

Chapter 6. Factors determining algal composition
0.1
1
10
100
1000
10000
1976 1980 1984 1988 1992 1996
(NO
x +
NH
4)/P
O4
at s
urf
ace
Figure 6.5: (NOx+ NH3):FRP ratio (gravimetric) in the surface mixed layer, Station 104 BurrinjuckReservoir).
6.4.3 Form of nutrient
Different forms of the same nutrient can also have substantial impacts on the composi-tion of algal communities. When the physical environment is stable and suitable for thegrowth of large buoyant Cyanobacteria, their occurrence is influenced by the forms ofnitrogen that are available. As discussed in the preceding section, nitrogen fixing generaare advantaged when nitrogen limitation occurs. When nitrogen is in limiting concentra-tions but present as nitrate then green algae seem to have an advantage. However, whennitrogen is limiting in the surface waters but present as ammonia in the deeper anoxiclayers then the colonial blue-green algae like Microcystis often dominate. These subtleeffects on algal species composition of relative nutrient concentrations and the relativeconcentrations of different forms of the same nutrient are still not well understood.
Figures 2.8 and 2.9, Surface NOx and NH3 for Station 104, presents data for the period1976 to 1998. The Figures indicate the high proportion (30% to 70%) of NH3 for theperiod 1976 to 1983 and, excepting for periods of low Reservoir level, the dominance(80% to 90%) of NOx thereafter. This is one possible explanation for the dominance byCyanobacteria in the 1976 to 1983 period.
The elements C, N, O, S, Fe and Mn are predominant participants in the aquatic redoxprocess. Photosynthesis (C106H263O110N16P) and externally derived organic matter arethe major causes of disequilibrium redox conditions in natural waters, producing localcentres of highly negative redox.
While the generation of N compounds such as NH3 are biologically mediated, the amountof NH3 maintained in the water column is a function of redox equilibria. Consequently,
95

Chapter 6. Factors determining algal composition
the composition of N forms is very much a reflection of the redox and pH environmentof the water body.
Iron (III), often present in natural waters in significant amounts, will bond with P toform insoluble Fe3PO4. However, under low redox levels, the Fe(III) is transformed toFe(II), a soluble form of iron, with release (bio-availability) of P into the water column.
The redox diagram in Figure 6.6 provides some important insights into algal managemen-t, namely the need to limit organic carbon loading (both direct and indirect pathways)on waters to levels maintaining pε values:
• above +4 to limit amounts of NH −4 maintained in the water column and enhancing
Microcystis formation;
• above 0 to minimise the net release of Fe(II) from the sediments and associatedrelease of PO 3−
4− .
Fe2+
4+
NH-
3NO
2-
NO
Fe3+
N2(aq)
Redox scale (p ε)
0 +4 +8 +12-8 -4
Figure 6.6: Redox scale and equilibrium phases for selected nutrients and metals (Adapted fromStumm and Morgan 1970)
6.4.4 Prevailing wind speeds and openness of water
An open reservoir shape and/or strong prevailing winds, will normally deepen the mixedsurface layer depth, through greater travel across the water surface, and greater shearforces. While it is difficult to assess the wind induced mixing in Burrinjuck given thesparsity of wind data over the Reservoir itself, it is noted that the dendritic shapeof Burrinjuck would further mitigate the mixing power of wind. The Reservoir depthrelative to the mixed depth will determine the potential extent of anoxic bottom waters(internal loading) over the summer period.
6.5 Conclusions
The key processed determining algal composition are summarised in the following text.
96

Chapter 6. Factors determining algal composition
6.5.1 Entire analysis period: 1976 to 1998
Diatoms appear the dominant algal group throughout the early Spring growth periods.This is a reflection of the availability of Si and the well mixed — turbulent conditionstypical of this season.
6.5.2 Pre sewage nutrient removal period: 1976 to 1978
Cyanobacteria is the dominant group only for the high wastewater nutrient dischargeperiod (1976 to 1978).
Cyanobacteria develops from low numbers in December to increased numbers throughJanuary, February and March. There appear to be a number of factors contributing tothe dominance of Cyanobacteria under these conditions, including:
1. the low wind and hence low mixing energy resulting in dominance of Cyanobacteriaas a result of its buoyancy faculty;
2. the high level of P availability through this period;
3. the low zeu:zmix ratios throughout the summer period;
4. the potential direct involvement of Microcystis in the redox process (as an electronacceptor);
5. the high NH3 composition of inorganic N.
Elevated turbidity as a result of high inflow events over this period, together with highalgal biomass, further reduced the zeu:zmix ratio over summer periods.
While (NOx + NH3): PO4–P ratios during this period are frequently less than thegravimetric ratio (7) below which N may become limiting, NH3 levels are generally abovethe 100 µg/L threshold level below which N-fixing Cyanobacteria become dominant.
The low N:P ratio, along with elevated NH3:NOx ratios typical of much of this periodindicate the elevated redox conditions prevailing in the Reservoir under these conditions.
6.5.3 Sewage phosphorus and nitrogen removal period 1978 to 1983
The algal response (increase in Cyanobacteria (Microcystis) cell number, and occurrenceof Anabaena circinalis) to operation of the de-nitrification unit was complicated by thesignificant Reservoir drawdown over this period. The NH3:NOx ratio increased signif-icantly (to a ratio of 1.0) during periods of de-nitrification as compared to levels forsimilar stratification periods of P removal but no de-nitrification (ratio of 0.1) from 1984
97

Chapter 6. Factors determining algal composition
onwards. The level of inorganic N was frequently depressed to 0.1 mg/L or less dur-ing this period. As noted previously, alga having N-fixing capabilities such as Anabaenacircinalis, will have a competitive advantage over other alga under N limiting conditions.
The inference is that the reducing conditions within sediments of the Reservoir wereexacerbated by de-nitrification.
6.5.4 Post sewage phosphorus removal period
Normal Reservoir operating levels
The reduction in direct and indirect (in-stream transformation of bio-available nutrients)discharge of organic material as a result of substantial reduction in P and BOD insewage effluent, significantly eased the potential for reduction of Reservoir sedimentsand associated remobilisation of P, and production of NH3. As a consequence, there wasshift from Cyanobacteria dominance to dominance by Chlorophyta.
The reduced turbidity levels associated with reduced algal biomass resulted in an increasein the zeu:zmix ratio, further enhancing the competitive advantage of Chlorophyta overCyanobacteria. Under the calm (low mixing) conditions of mid to late summer, motileforms of alga of the Chrysophyta and Euglena Divisions became dominant.
Periods of significant Reservoir drawdown
The increased deposition of organic material per area of sediments resulting from thereduced area of inlet depositional zones exacerbated the reducing conditions to the pointwhere P and NH3 were released. The release of significant mass of P to surface watersled to significant increase in algal biomass under these conditions.
The rapid drawdown conditions resulted in local re-suspension of fine colloids, which,together with the increased algal biomass, significantly reduced euphotic depth. Underthe reduced zeu:zmix ratio conditions and the elevated NH3 levels, the Cynaophyta wereadvantaged over the Chlorophyta. There is also the possibility that as a result of directinvolvement of Microcystis in the redox process (as an electron acceptor), growth of theCyanobacteria was favoured over that of Chlorophyta.
98

Chapter 7
Management Implications
7.1 What new understanding does the research provide?
The research highlighted the importance of establishing water and nutrient pathwaysand transformation patterns, in order to understand algal responses. In addition, theresearch identified a number of key processes determining algal biomass and compositionresponses, including:
1. the rapid transition from fully mixed to stratified and poorly mixed within 2 to 3weeks, and sustained stratification over the late spring to early autumn period;
2. the importance of event frequency and event duration as drivers of organic materialdelivery to the Reservoir, of distribution through the Reservoir, and of the extentof mixing post peak of event;
3. the indirect pathways (internal loading) as the major nutrient source for the surfacewater layer (driven by organic carbon rather than by N or P);
4. the significant role of in-river processes in modifying the pattern (timing) and formof delivery of nutrients and organic material to the Reservoir;
5. non-point discharges from catchments having soils in which P is normally limitingin respect to biological growth;
6. the role of wastewater discharges in providing P and organic material sources nec-essary to generate redox conditions (the remobilisation of sediment P);
7. the significance of NH3 vs NO3 in determining redox conditions (release of P) anda potential for blue-green algae.
8. the important role of NOx as a redox buffer for deep stratified reservoirs havinghigh rates of organic loading;
9. the major driver of algal biomass is the amount of bio-available phosphorus trans-ferred to the surface mixed layer;
99

Chapter 7. Management Implications
10. the major drivers of algal composition are the availability of light (zeu/zmix ratio —function of abiotic particulates and algal biomass) and mixing conditions.
The primary implications of this new understanding for algal management comprise:
1. the substantial storage of P accumulated in the sediments, as a potential source ofP supporting algal growth;
2. the need to minimise both direct and indirect sources of organic loading on reser-voirs;
3. where it is not possible to substantially reduce organic loading (sediment BOD,external sources), the important role of NOx as a redox buffer, limiting the level ofnutrient remobilisation and algal biomass and blue-green algal dominance;
4. the need to ensure well nitrified wastewater effluent, low in BOD and P (indirectsource of organic matter);
5. the wide range of possible reservoir water and nutrient pathways, and implication-s for the selection of outlet valves (drawoff depth relative to surface or bottomwaters);
6. the increased risk of algal blooms under conditions of low reservoir levels and highrates of drawdown;
7. the role of in-stream interception, transformation and re-suspension of organic mat-ter and nutrients, and implications of land use change on catchment hydrology.
7.2 What are the Reservoir management issues?
A series of Reservoir Managers’ Workshops were conducted to enable the identificationof management concerns, management options and information needs related to algaland wider reservoir management issues.
The concerns identified included:
Risk assessment and better management
In view of the serious impacts of algal blooms on treatability of water, and of treatmentcosts, recreational values, aesthetic values and ecology, how can the risk of algal bloomsand severity be better assessed, and how can reservoirs be better managed to limit theincidence of algal blooms and/or algal entrainment in water abstracted for water supply?
100

Chapter 7. Management Implications
Management in terms of a range of (conflicting) issues
Algal management is just one of a range of issues reservoir managers have to balancein their operation of reservoirs. Other issues include thermal pollution associated withthe discharge of colder bottom waters, and the formation of odours, taste, colour, or-ganics and toxicants in anoxic bottom waters under stratified and high organic loadingconditions. What are the means of determining the trade-offs between in-reservoir envi-ronmental values and the downstream ecological and water use values?
There is a need for predictive tools and decision support tools which enable integratedconsideration of the full range of issues. The research, with its strong process focus,indicated that the physical, chemical and biological factors contributing to nuisancealgal growth are also critical in relation to a range of other water quality managementissues.
Fragmentation of water cycle management
Previously, catchment management, reservoir management and treatment were consid-ered integrally. The fragmentation of some agencies, separation of purchaser and providerfunctions, and out-sourcing of some functions (treatment provision) are a few of the fac-tors leading to separate management consideration of each component, with boundaryconditions prescribed in contractual arrangements (including penalties). How can man-agers respond to these reservoir specific requirements?
The research indicated a strong nexus between inflow characteristics (catchment man-agement) and reservoir processes and responses. How is this critical link to be managedin a fragmented reservoir and catchment based approach?
The role of water supply reservoirs as one line of defence in management of pathogens.What are the water abstraction level policies related to minimising risk of abstractionof waters high in pathogens, and what are the monitoring requirements necessary toimplement these policies?
Implications of complexity for delivery of information
There is a significant increase in information needs related to responding to an environ-ment of increased social demands (multi-purpose operation), technical complexity andaccountability (audits, liability). How can information be packaged in a form that isadequate and accessible to managers to respond to this new environment?
How can management related information be packaged in a way capable of addressingthe diversity of structures, catchment and water use values?
101

Chapter 7. Management Implications
7.3 What are the Reservoir management options?
At the series of Reservoir Managers’ Workshops (Lawrence et al. 2000), the reservoirmanagers in association with the research scientists, identified a range of managementoptions available to better manage algae in reservoirs, as follows.
Reservoir based algal management options:
1. design and selection of outlet structures;
2. pre-impoundment treatment;
3. destratification, oxygenation and hypolimnetic aeration;
4. use of well nitrified effluent as a redox buffer;
5. storage levels — limit drawdown rate, limit minimum depths;
6. establish pre-treatment forebays or swales ;
7. use of bio-manipulation (macrophytes, fish) techniques;
8. littoral zone management;
9. use of chemical flocculants and/or algacides as contingency measure.
Catchment based algal management options:
1. the development, implementation and review of catchment management plans;
2. management of point source discharges — ensure well nitrified wastewater effluent,low in BOD and P;
3. management of non-point source discharges, in terms of land use and location, man-agement practices, set backs, buffer zones, wetlands, vegetated waterways, erosionand sediment control;
4. riparian zone management of streams.
Some preliminary guidelines for the selection of management options have been providedas part of the Reservoir Managers’ Workshops Report (Lawrence et al. 2000).
7.4 What are the management information needs?
Drawing on the list of Management concerns, the range of possible management options,and the enhanced understanding of the factors and processes determining reservoir algalbiomass and composition, the Reservoir Managers’ Workshops identified the followinginformation needs. The research team’s responses to each of the identified needs are
102

Chapter 7. Management Implications
provided (material in brackets). Also refer to Figure 7.1, a diagram of the relationshipbetween reservoir algal processes and catchment land use and management.
1. Better definition of management objectives, particularly in the case of multi- pur-pose reservoirs. (This is seen as a matter for reservoir management agencies.)
2. Better information on the major determinants of algal biomass and composition.(This report, together with the Reservoir Managers’ Workshops Report, providesa substantial enhancement of information regarding processes and determinants ofalgal biomass and composition, and the range of options for their management.Gaps in knowledge are addressed in Section 7.7.)
3. Better predictive tools and techniques for assessment of the risk of bloom conditions.(This important need is addressed under Section 7.5 below.)
4. Better information on the range of management available options, and guidelineson the selection of options appropriate to local conditions. (The Reservoir Man-agers’ Workshops Report includes preliminary guidelines on the selection of reser-voir and catchment management options. Two approaches are recommended tothe expansion of this framework into specific criteria; the development of reservoirclassification system, and the application of decision support tools which deal withthe complex range of processes in an integrated and dynamic manner. Furtherdetails of each are provided in Section 7.7.)
5. Development of a reservoir classification system to aid managers in identifyingalgal response processes, management and monitoring protocols. (It is proposedthat the Classification system build on our evolving understanding of the majordeterminants of reservoir algal response processes, including:
• reservoir depth, shape, outlet arrangements and drawdown conditions;
• catchment description: hydrology; point and non-point source loads and nu-trient composition; catchment soils and land use;
• reservoir lattitude and elevation and light environment (light and temperaturedepth profiles, mixing depth);
• the range of in-reservoir and downstream environmental and water use valuesor objectives.)
6. Provide profiles and watching briefs on emerging issues, such as new monitoringdevices, analytical methods, destratification or hypolimnetic aeration techniques,decision support tools, monitoring design, data analysis, etc. (A range of gov-ernment agencies and water research centres such as LWRRDC, MDBC, CRC forFreshwater Ecology, CRC for Water Quality, CRC for Catchment Hydrology andCSIRO Division of Land & Water are emerging as centres for information of thistype.)
7.5 What decision support tools are needed?
The Reservoir Managers’ Workshops identified the need for a range of decision sup-port tools, including monitoring guidelines, data analysis techniques, criteria guiding
103

Chapter 7. Management Implications
In-stream interception,transformation and re-suspension of organic Cand nutrients.
Catchment non-pointsource discharges ofnutrients, organic C andsuspended solids.
Wastewater eff luent andirrigation drainage dischargesof nutrients, organic C andsuspended solids.
Hydrology - river flowpatterns.
Source of surface waternutrients driving algal
growth
Internal loading oforganic C –remobili sation of nutrientsfrom sediments.
External loading oforganic C.External loading of bio-available nutrients.
RESERVOIR
CATCHMENT
Figure 7.1: Relationship between reservoir algal processes and catchment land use and management.
the selection of outlet levels, criteria guiding the selection and design of managementoptions. The reservoir managers stressed the importance of limiting the complexity andparameterisation requirements of tools, while ensuring that the tools are scientificallybased.
Harris questions the relevance of ’average annual load — steady state’ based modelsto Australian catchment, characterised by pulsed (event driven) exports of nutrients,extreme variability in sedimentation losses, and nutrient composition comprising a highparticulate nutrient component (Harris 1994).
Vollenweider’s models of the impact of nutrient loading on phytoplankton biomass inlakes assume equilibrium at scales of a year. They therefore cannot, strictly speaking,be used for highly perturbed systems which are subject to periods of high flow. Anew generation of dynamic based models is required which incorporates more terms andprocesses (Harris 1996). The Burrinjuck analysis suggests that this argument may not
104

Chapter 7. Management Implications
hold in the case of the hypolimnetic P dominant pathway.
Harris notes that Australian aquatic ecosystems are characterised by highly dynamic,non-steady state behaviour, at a range of scales. In these systems, fluxes of elements arestrongly dependent on catchment processes, sediment exchanges and biological processesat a range of scales. Flow regulation has a major impact on in-water processes in rivers,storages and estuaries. In particular, flow regulation alters the balance of external vsinternal loads and diffuse vs point sources of nutrients.
There now exists a range of appropriate process based catchment, river and lake modelswhich can provide guidelines for land use change, point-source loads and managementoptions. These should be used in preference to standard guidelines based on concentra-tion and nutrient ratios. These new models provide a means of working backwards fromecosystem impacts and desired ecosystem values to the calculation of critical loads adthe means of achieving them. They can be applied at regional scales to solve large scaleresource management problems (Harris 1996).
The Burrinjuck research has highlighted the dynamic nature of nutrient pathways, withinflow patterns and load composition as major determinants of the dominant pathwaysat any one time. Modelling approaches need to be capable of representing the dominantsystems and their switching factors, if they are to provide a reliable decision supporttool to managers.
7.6 What are the monitoring needs?
In responding to the management issues, management options and information needs, anumber of monitoring implications were identified.
The research team observed that the value of the monitored data provided by agenciescould be substantially enhanced by reducing the emphasis on the routine monthly mon-itoring program and instead incorporating occasional intensive monitoring of responsesto selected events based programs. The installation of solid state probes capable of con-tinuous monitoring of pH, DO, temperature and light would also substantially enhancethe data.
Special note was made of the importance of placing the design of monitoring programin the context of:
1. the purpose/issues to be addressed by monitoring data;
2. the understanding of dominant pollutant transport and transformation pathwaysand processes.
The managers also stressed the importance of being clear on the separation of re-search/descriptive studies related monitoring needs from operation related monitoringneeds.
105

Chapter 7. Management Implications
The specific monitoring needs identified by the workshop comprised:
1. effective monitoring of external loads and discharges (flow, nutrients);
2. improved information on mixing conditions — establishment of thermistor chainsand vertical profiles of DO and light;
3. algal characterisation/monitoring — Chlorophyll ’a’, major genera cell numbers,production/respiration (diurnal DO, pH);
4. zooplankton — determine species dominance and populations by size (grazing pres-sure);
5. provision of guidelines on techniques for the interpretation of data;
6. integration of quality assurance processes into sampling, analysis and archivingprocesses;
7. monitoring wind speed and direction and solar radiation on reservoir surfaces.
7.7 What are the research needs?
A number of research needs were identified during the Reservoir Managers Workshops.They included:
1. field investigation of the impact of rapid drawdown and shallow depths in remobil-ising and re-suspending sediment nutrients;
2. further description of the form and pattern of nutrient and organic material dis-charge, and of the pattern of organic material deposition in inlet depositional zonesand bottom waters within middle reaches, and sediment redox responses;
3. identification of the conditions and processes associated with nutrient transfer be-tween the bottom waters and the surface mixed layer, including spatial and tem-poral scale effects;
4. the development of improved models for estimating general mixing and light condi-tions, including consideration of temperature stratification, wind mixing, particleaggregation and photosynthetic pigments of natural waters;
5. examination of the role of different forms of nitrogen and the critical light re-quirements of Cyanobacteria and micro-algae, to develop a more reliable basis forpredicting the influence of mixing and turbidity on growth;
6. examination of the environmental conditions influencing the growth of benthic algaeand their impact on nutrient and carbon dynamics;
7. the development of a reservoir classification system to aid managers in determiningappropriate management and monitoring protocols for local reservoirs;
106

Chapter 7. Management Implications
8. the development of simple dynamic models to enable managers to link reservoiralgal responses with catchment runoff and stream flow and nutrient delivery pro-cesses, and reservoir drawdown and discharge level factors.
The Burrinjuck project has built on data provided by DLWC, ACTEW, EnvironmentACT and the Bureau of Meteorology. The integrated nature of the data set and thevalidation of data associated with the project has resulted in the consolidation of anextremely valuable data set from a research perspective. There is an opportunity forfurther substantial benefits to be derived from further analysis of this data.
There is a strong case to make this data available more widely to research institutions, inthe interest of promoting ongoing reservoir water quality and algal management relatedresearch. Consultation is proceeding with the data providers to explore opportunitiesfor placing the data set on the Web.
107

108

Chapter 8
Bibliography
Burrinjuck Reservoir related references
Australian Department of Construction and Binnie International (Aust) in associationwith Maunsell & Partners 1978, ACT Region Water Quality Study, 3 vols, Reportto National Capital Development Commission.
Commonwealth Parliament 1984, Murrumbidgee River in the ACT Region, Report ofthe Joint Committee on the Australian Capital Territory, AGPS.
Cullen, P. & Rosich, R. 1978, A Phosphorus Budget for Lake Burley Griffin and Man-agement Implications for Urban Lakes, AWRC Technical Paper No.31, AGPS.
Department of Construction 1980–83, Algal Survey Field Notes (unpublished).
Department of Land and Water Conservation 1996, State of the Rivers Report, Mur-rumbidgee Catchment 1994–1995 (2 volumes), DLWC Murrumbidgee Region.
Humphries, S. E. & Imberger, J. 1982, The influence of the internal structure anddynamics of Burrinjuck Reservoir on phytoplankton blooms, Centre for Water Re-search, University of WA.
Humphries, S. E., Lyne, V. D. 1988, ’Cyanophyte blooms : the role of cell buoyancy’,Limnology and Oceanography 33(1): 79–91.
Keenan, H., ’Algae in the Murrumbidgee River Catchment’, Murrumbidgee RegionalAlgal Coordinating Committee Annual Report 1996–1997, Technical Report No:97/09 Department of Land and Water Conservation.
Lawrence, I., Bormans, M., Oliver, R., Ransom, G., Sherman, B., Ford, P., Schofield,N. (in press), Factors controlling algal growth and composition in reservoirs: Reportof Reservoir Managers’ Workshops January 2000, LWRRDC, Canberra.
May, V. 1978, ’Areas of recurrence of toxic algae within Burrinjuck Dam, NSW, Aus-tralia’, in Telopea 1 (5): 295–313.
National Capital Development Commission 1981, Waters of the Canberra Region, Tech-nical Paper No.30, NCDC.
109

Chapter 8. Bibliography
National Capital Planning Authority 1994, Regional Water Quality Study: Upper Mur-rumbidgee Catchment, NCPA.
Olley, J., Caitcheon, G., Donnelly, T., Olive, L., Murray, A., Short, D., Wallbrink, P.,& Wasson, R. 1995, Sources of suspended sediment and phosphorus to the Mur-rumbidgee River. CSIRO Consulting Report 95–32.
Office of ACT Administration 1987, Water Quality Monitoring Lake Burley Griffin andLake Ginninderra, December 1981 to June 1986, 2 vols.
Rosich, R. 1983, ’The Role of Sediments’, in Proceedings of Lake Burley Griffin Seminar,Gutteridge Haskins & Davey Pty Ltd for NCDC.
SCM Consultants 1992, Lower Molonglo Water quality Control Centre Environmentand Process Audit, SCM Consultants.
State Pollution Control Commission 1978, A Water Quality Survey of Burrinjuck Reser-voir and the Upper Murrumbidgee River, 1973 to 1975, SPCC.
Wasson, R. J., Clark, R. L. & Nanninga, P.M. 1987, 210Pb as a chronometer and tracer,Burrinjuck Reservoir, Australia, Earth Surface processes and landforms 12: 399–414.
Wasson, R. J., Clark, R. L., Downes, M. T., Olley, J., Outhet, D., Plumb, L., & WilletI. R. (in press), Burrinjuck Reservoir; Interoperations of change.
General references
Blomquist, P., Pettersson, A., & Hyenstrand, P. 1994, ’Ammonium nitrogen: A keyregulatory factor causing dominance of non-nitrogen fixing cyanobacteria in aquaticsystems.’ Archiv fur Hydrobiologia, 132: 141–164.
Harris, G. P. 1978, ’Photosynthesis, productivity and growth: the physiological ecologyof phytoplankton: Ergebnisse der Limnologie.’ (beiheft Archiv fur Hydrobiologie)10: 1–171.
Harris G. P., Nutrient Loading and algal blooms in Australian waters—a discussionpaper, Occasional paper No.12/94, DLWRRDC.
Harris, G. P. 1996, Catchments and Aquatic Ecosystems: Nutrient ratios, flow regulationand ecosystem impacts in rivers like the Hawkesbury-Nepean, CRC for FreshwaterEcology Discussion Paper.
Harris, G. P. & Baxter, G. 1996, ’Interannual variability in phyoplankton biomass andspecies composition in North Pine Dam, Brisbane’, Freshwater Biology 35: 545–560.
Heaney, S. I., Parker, J. E., Butterwick, C. & Clarke, K. J. 1996, ’Interannual variabilityof algal populations and their influence on lake metabolism’, Freshwater Biology 35:561–578.
Horne, A. J., Goldman C.R. 1994, Limnology, 2nd Edition. McGraw-Hill, New York.
110

Chapter 8. Bibliography
Kirk, J. T. O. 1983, 2nd edn 1994, Light and photosynthesis in aquatic ecosystems,Cambridge University Press, Cambridge.
MathWorks 1996, Using Matlab, MathWorks Inc, MA.
Oliver, R. L. & Ganf, G. G. 1999, ’Freshwater Blooms’ in Whitton, B. A. & Potts, M.(eds.) The Ecology of Cyanobacteria: Their diversity in time and space, KluwerAcademic Publishers.
Reynolds, C. S. 1984, The Ecology of Freshwater Phytoplankton, Cambridge UniversityPress, Cambridge.
Sherman, B., Ford, P., Hatton, P., Whittington, J., Green, D., Oliver, R., Shiel, R., vanBerkel, J., Beckett, R., Grey, L. & Maher, W. (in press), The Chaffey Dam Story,CSIRO Canberra.
Stumm, W. & Morgan, J. J. 1970, Aquatic Chemistry: An Introduction EmphasizingChemical Equilibria in Natural Waters, Wiley-Interscience.
Sutcliffe, D. W. & Gwynfryn-Jones, J. 1992, Eutrophication: Research and applicationto water supply, Freshwater Biological Association, Ambleside.
Webster, I.T., Jones, G.J., Oliver, R.J., Bormans, M. and Sherman, B.S. 1996, Con-trol strategies for cyanobacterial blooms in weir pools. Final report to the NationalResource Management Strategy Grant No. M3116, Center for Environmental Me-chanics Technical Report No. 119.
Data sources
ACT Water Database 1976–98, <http://www.act.gov.au/Water Quality/start.cfm>,Environment ACT
ACTEW Reservoir Water Quality Data Archive 1976–1998, ACT Electricity & Water
ACTEW Stream Gauging Data Archive 1976–1998, ACT Electricity & Water
Australian Climate Computer Archive (database), Commonwealth Bureau of Meterol-ogy Australia
Environment ACT Stream Water Quality Data Base 1976–1998, Environment ACT.
DLWC Water Quality Database 1991–1998, Department of Land and Water Conserva-tion
DLWC Stream Gauging Database 1976–1998, Department of Land and Water Conser-vation
111

112

Appendix A
Description of the data base
The initial stage of this project involved the consolidation of over 20 years of measureddata for both Burrinjuck Reservoir and its catchment area. The data was compiledfrom various sources, primarily ACT Electricity and Water, the Department of Landand Water Conservation, Environment ACT and the Bureau of Meterology. The datacollected spans a period of over 20 years, from 1 January 1976 to 31 March 1998, thoughmany of the variables were sampled sporadically during this time and some do not spanthe entire period.
The meterological data comprises evaporation, air temperature, rainfall, wind directionand speed recorded at daily or twice daily intervals for the entire study period.
The water quality data comprises data collected at six Reservoir stations for the period1976 to 1998 and data from another five stations for the period 1992 to 1998. Samplingfrequency is irregular, generally ranging from weekly to monthly with occasional gapsof several months to several years at some sites. At each sampling event, samples wereusually taken at varying depth profiles, ranging from water surface to the reservoirbottom.
The hydrographic data comprises streamflow data for inflows to and discharge from theReservoir for the period 1976 to 1998, including daily reservoir levels. A summary of thecompiled data is given below in Table A.1
A.1 Quality assurance
Quality control of data was undertaken at the source agencies. After compilation ofthe data this was followed by further validation using simple techniques such as visualexamination for expected data magnitude and temporal alignment. Many anomalies werediscovered during this validation in both the raw data and subsequent interpretation ofthe data, so the process of reconstructing a correct data set became a time consumingbut necessary task. Difficulties involved factors such as varying data formats (eg. unitsof data, format of dates) and meanings over the 20 year period. For example in one data
113

Appendix A. Description of the data base
Table A.1: Summary of the Burrinjuck Reservoir Data set
Raw Data LocationAlgae Cyanophyta, Chlorophyta, Diatoms,
Chrysophyta, Xanthophyceae,Euglenophyta, Chrysophyceae,Chlorophyll-A
Burrinjuck Dam sites
Zooplankton Cladocera, Copepoda Calanoida, CopepodaCyclopoida, Copepoda Harpacticoi,Rotifera, Nymphs, Ciliophora
Burrinjuck Dam sites.
PhysicalCharacteristics
True colour, Secchi depth, Turbidity,Specific conductance, pH, Suspended solids,Temperature, Dissolved Oxygen.
Burrinjuck Dam and siteson inflows to the dam.
Chemistry Calcium, Chloride, Total Iron, Magnesium,Manganese, Potassium, Silicon, Sodium,Sulphate
Burrinjuck Dam and siteson inflows to the dam.
Nutrients Total Nitrogen, NH3, NOx, TKN, TotalPhosphorus, FRP
Burrinjuck Dam and siteson inflows to the dam.
Stream Flow Inflows from theMurrumbidgee R., Yass R.and Goodradigbee R.
Meterological data Evaporation Burrinjuck DamAir Temperature (min and max),Precipitation, Wind Direction, Wind Speed
Yass
Relative Humidity, Sunshine Canberra city and airportReservoir height Burrinjuck dam wall
set the same field entry signified either surface water, a tube sample or unknown depthdepending on the time period. Difficulties or time delays in finding archival informationon older data formats and meanings of fields were also encountered.
A.2 Data storage structure and protocols
Data is currently stored in Microsoft Excel’s proprietory format, with individual variablescombined into logical groups with a common abscissa (date). The editing or updatingof these files is centrally administered to ensure data integrity.
Most of the processing and analysis of data was done using Matlab (Mathworks 1996)and Microsoft Excel so derived data and results are also stored in both delimited textand Microsoft’s proprietory file format.
A web site was established to allow all project members access to the data and to provideinformation on the project. The site is divided into areas for the data base, for generalinformation and for analysis. For the duration of the project, the entire site was restrictedby password protection to members of the project team
114
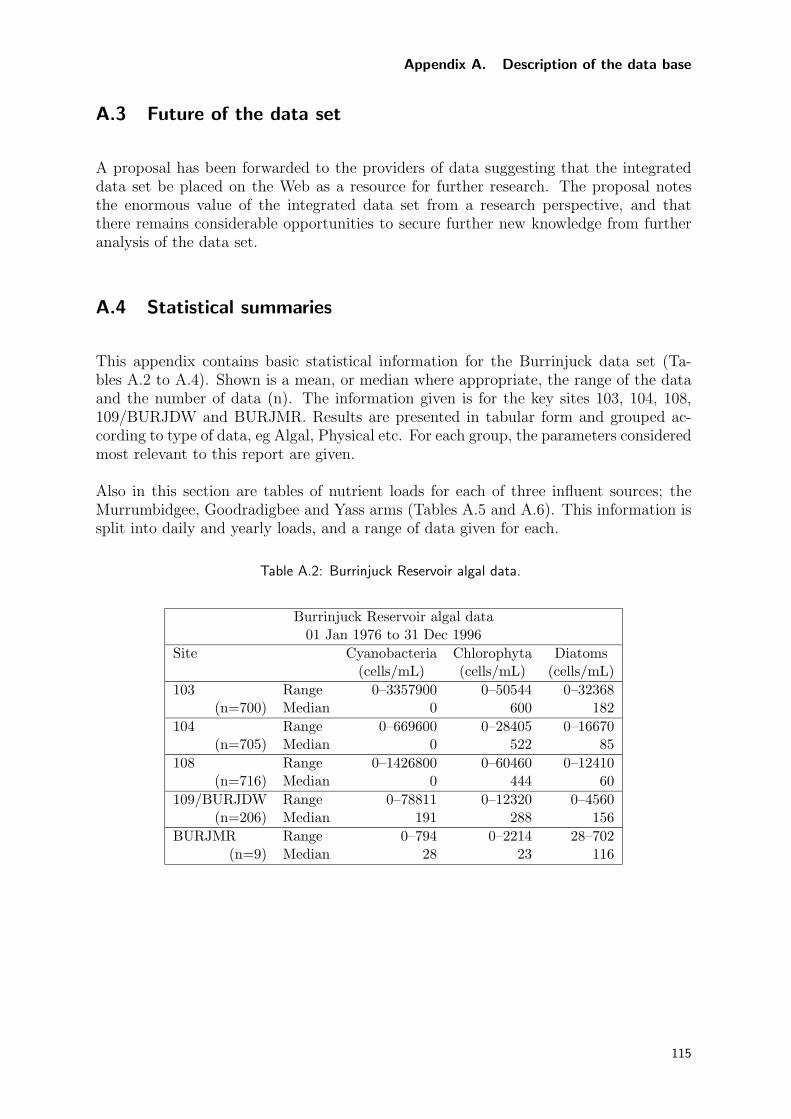
Appendix A. Description of the data base
A.3 Future of the data set
A proposal has been forwarded to the providers of data suggesting that the integrateddata set be placed on the Web as a resource for further research. The proposal notesthe enormous value of the integrated data set from a research perspective, and thatthere remains considerable opportunities to secure further new knowledge from furtheranalysis of the data set.
A.4 Statistical summaries
This appendix contains basic statistical information for the Burrinjuck data set (Ta-bles A.2 to A.4). Shown is a mean, or median where appropriate, the range of the dataand the number of data (n). The information given is for the key sites 103, 104, 108,109/BURJDW and BURJMR. Results are presented in tabular form and grouped ac-cording to type of data, eg Algal, Physical etc. For each group, the parameters consideredmost relevant to this report are given.
Also in this section are tables of nutrient loads for each of three influent sources; theMurrumbidgee, Goodradigbee and Yass arms (Tables A.5 and A.6). This information issplit into daily and yearly loads, and a range of data given for each.
Table A.2: Burrinjuck Reservoir algal data.
Burrinjuck Reservoir algal data01 Jan 1976 to 31 Dec 1996
Site Cyanobacteria Chlorophyta Diatoms(cells/mL) (cells/mL) (cells/mL)
103 Range 0–3357900 0–50544 0–32368(n=700) Median 0 600 182
104 Range 0–669600 0–28405 0–16670(n=705) Median 0 522 85
108 Range 0–1426800 0–60460 0–12410(n=716) Median 0 444 60
109/BURJDW Range 0–78811 0–12320 0–4560(n=206) Median 191 288 156
BURJMR Range 0–794 0–2214 28–702(n=9) Median 28 23 116
115

Appendix A. Description of the data base
Table A.3: Burrinjuck Reservoir physical data.
Burrinjuck Reservoir Physical Data01 Jan 1976 to 31 Dec 1996
Site Turbidity Specific(NTU) Conductance
(µS)103 n 766 768
Range 0.7–152 69–479Mean 17.62 176.27
104 n 790 830Range 0.91–240 75–458Mean 16.04 174.91
108 n 789 830Range 0.45–230 84–481Mean 14.25 175.99
109/ n 273 365BURJDW Range 0.5–160 94–256
Mean 11.94 168.53BURJMR n 66 78
Range 2–37 121–245Mean 11.20 170.68
Table A.4: Burrinjuck Reservoir nutrient data.
Burrinjuck Reservoir Nutrient Data01 Jan 1976 to 31 Dec 1996
Site N NH3 NOx FRP TP Si(mg/L) (mg/L) (mg/L) (mg/L) (mg/L) (mg/L)
103 n 82 787 787 772 679 22Range 0.66–3 0–1.92 0–3.28 0–0.31 0–0.612 0.5–11.5Mean 1.49 0.10 0.50 0.02 0.07 4.98
104 n 91 806 806 795 712 15Range 0.39–6.4 0–2.2 0–3 0–0.26 0–1.16 0.2–6.2Mean 1.25 0.09 0.47 0.02 0.06 2.25
108 n 89 807 807 790 713 16Range 0.43–2.7 0–1.7 0–2.43 0–0.235 0–0.42 0.2–5.9Mean 1.10 0.08 0.44 0.02 0.05 2.42
109/ n 10 219 230 220 225 42BURJDW Range 0.46–1.0 0.003–0.73 0.001–1.78 0.001–0.4 0.007–0.362 0.2–15.4
Mean 0.81 0.047 0.31 0.01 0.044 7.29BURJMR n 2 30 37 37 54 19
Range 1.0–1.0 0.01–0.22 0.124–0.85 0.002–0.04 0.007–0.14 1.8–11.6Mean 1.00 0.04 0.58 0.01 0.04 8.05
116
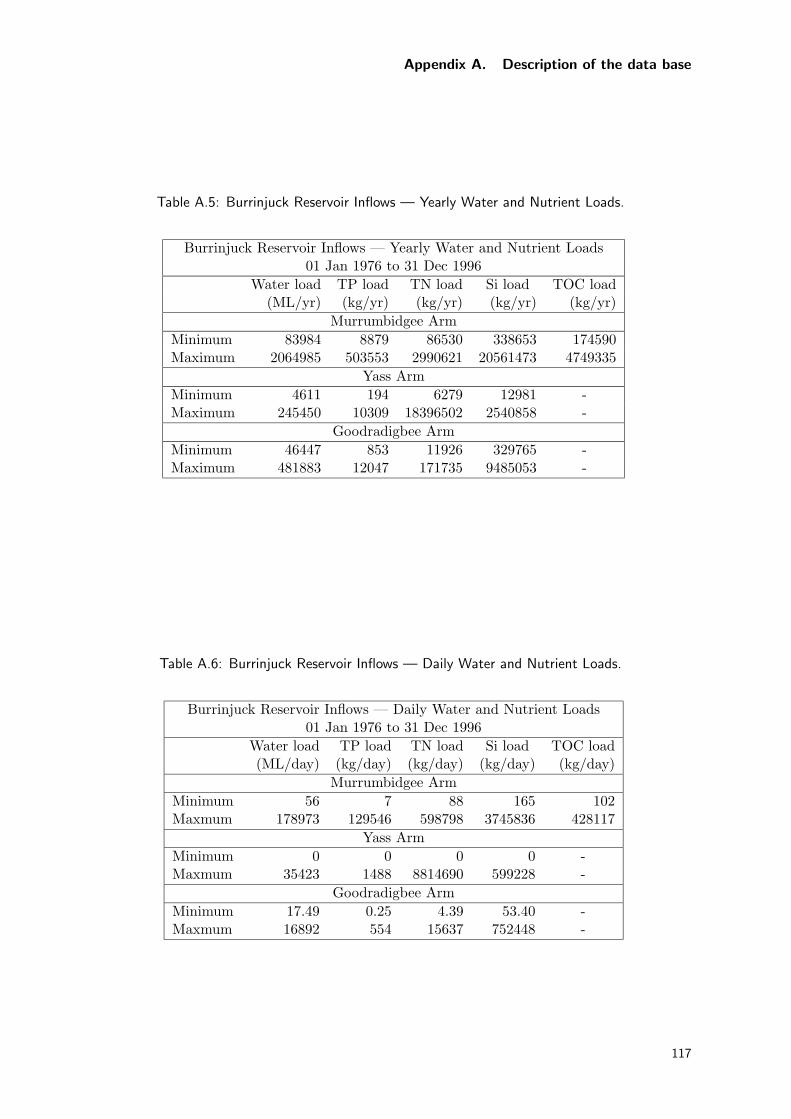
Appendix A. Description of the data base
Table A.5: Burrinjuck Reservoir Inflows — Yearly Water and Nutrient Loads.
Burrinjuck Reservoir Inflows — Yearly Water and Nutrient Loads01 Jan 1976 to 31 Dec 1996
Water load TP load TN load Si load TOC load(ML/yr) (kg/yr) (kg/yr) (kg/yr) (kg/yr)
Murrumbidgee ArmMinimum 83984 8879 86530 338653 174590Maximum 2064985 503553 2990621 20561473 4749335
Yass ArmMinimum 4611 194 6279 12981 -Maximum 245450 10309 18396502 2540858 -
Goodradigbee ArmMinimum 46447 853 11926 329765 -Maximum 481883 12047 171735 9485053 -
Table A.6: Burrinjuck Reservoir Inflows — Daily Water and Nutrient Loads.
Burrinjuck Reservoir Inflows — Daily Water and Nutrient Loads01 Jan 1976 to 31 Dec 1996
Water load TP load TN load Si load TOC load(ML/day) (kg/day) (kg/day) (kg/day) (kg/day)
Murrumbidgee ArmMinimum 56 7 88 165 102Maxmum 178973 129546 598798 3745836 428117
Yass ArmMinimum 0 0 0 0 -Maxmum 35423 1488 8814690 599228 -
Goodradigbee ArmMinimum 17.49 0.25 4.39 53.40 -Maxmum 16892 554 15637 752448 -
117

Appendix A. Description of the data base
118

Appendix B
Outline of analysis methods
B.1 Water temperature
At each station the water temperature was obtained from the profiles done on at least amonthly basis. Seasonal variations in temperature were plotted for each year as well asan average over the 20 years. A similar pattern was obtained each year. Stratificationbuilding up from September to February, convective cooling from March to Augustmixing the reservoir to complete overturning in winter.
B.2 Mixing depth
From the temperature profiles, the depth of the surface mixed layer was calculated as themaximum depth where the temperature gradient was less than 0.2◦C per meter. Thetemperature profiles are taken around mid-day and, particularly during Summer, thesurface layer is strongly stratified at this time. During the night however the mixing ismuch deeper. So to try to gauge the maximum surface mixed layer in a 24 hour period,as an indication of how deep the algae would have been mixed down overnight, only thewater below 3m depth was used. This is a crude way of assessing the surface mixed layerdepth but in our view the only possible way given a single profile per day.
B.3 Euphotic depth
The euphotic depth, zeu, is the depth at which 1% of the surface radiation penetratesinto the water column. It is used as a measure of the depth below which photosynthesisis limited. In this study it was calculated from secchi depth data from the commonlyused relationship
zeu = 2 .7 × zsecchi (B.1)
119

Appendix B. Outline of analysis methods
where the secchi depth is the depth at which a secchi disk lowered in the water columndisappears from sight.
B.4 Nitrogen concentration
Measurement of reservoir concentrations of TKN, or direct measurement of TN, is onlyavailable for the period 1993 onwards. Estimates of TN prior to this period were basedon the sum of inorganic N forms and Chlorophyll ’a’ measurements:
TN =∑
inorganic N + (5 × Chlorophyll ′a ′) (B.2)
where organic N was calculated from organic P using the Redfield gravimetric ratio:
organic N = organic P × 7 .2 (B.3)
and organic P was calculated from Chlorophyll ’a’:
organic P = 0 .7 × Chlorophyll ′a ′ (B.4)
B.5 Internal reservoir nutrient loading
Internal nutrient loads in the Murrumbidgee arm of the reservoir were calculated on areach by reach basis. Each reach, or pond, is treated as a separate system with inputs,outputs and current and previous states. For any reach, input load comes from theupstream pond, and output goes to the next downstream pond. The current state is afunction of input, output and previous state, with the mass balance equation:
Input + Previous State = Output + Current State. (B.5)
The current state is comprised of up to three components and two transfers. The firstpool is assumed to be fully mixed and so has a nutrient load in the water and also in thesediment and a transfer between sediment and water. Subsequent pools are stratified, sothe nutrient load in these pools is further broken down into surface and bottom watersand a transfer of nutrients between the two stratified layers.
This model for the Murrumbidgee arm is shown in Figure B.1. Pool 1 is the reach fromStation 201 to 101, Pool 2 is from Station 101 to 102, and so on until Station 104.
Input to Pool 1 consists of the nutrient load calculated for the Murrumbidgee upstreamof Station 201. Both point and non-point sources contribute to this load, including thecatchments of the Murrumbidgee River and Ginninderra Creek and the output fromLower Molonglo Water Quality Control Centre. Transfer of nutrients to and from thesediment is calculated using the mass balance equation:
Lin + Ln−1 = Lout + Ln + Tsed (B.6)
120

Appendix B. Outline of analysis methods
whereLin is the nutrient load into the pool from the Murrumbidgee;Lout is the nutrient load out of the pool, to Pool 2;Ln is the nutrient load in Pool 1 at time n;Tsed is the transfer of nutrients to the sediment.
This pool is fully mixed so the input into Pool 2, which is stratified, can enter either atthe surface or bottom. Whether the inflow to Pool 2 enters at the surface or bottomwaters is calculated from the volume of inflow to Pool 1, a greater volume over the timeperiod signifying a plunging flow (see Section B.8). The transfer of nutrient between thesurface and bottom layers of Pool 2 is calculated from:
Lsin + Lsn−1 = Lsout + Lsn + Tb (B.7)
whereLsin is the load into the surface layer from Pool 1;Lsout is the load out of the surface layer of the pool, to Pool 3;Lsn is the load in the surface layer of the pool at time n;Tb is the transfer of nutrients to the bottom water layer.
Sediment transfer in Pool 2 occurs only with the bottom water, so the previous sedimenttransfer mass balance now becomes:
Lbin + Lbn−1 + Tb = Lbout + Lbn + Tsed (B.8)
whereLbin is the load into the bottom water layer from Pool 1;Lbout is the load out of the bottom layer of the pool, to Pool 3;Lbn is the load in the bottom water layer of the pool at time n;Tb is the transfer of nutrients to the bottom water layer;Tsed is the transfer of nutrients to the sediment.
Pools 3 and 4 are also stratified and so are modelled in the same way as Pool 2. Resultsfrom this analysis can be found in Section 4.3.
B.6 External loading on the Reservoir
The analysis of algal biomass and succession patterns in Burrinjuck Reservoir over the1976 to 1998 period requires the analysis of daily water, nutrient (C, N, P, Si) and heatloadings on each of the reservoirs arms, the Murrumbidgee, Yass and Goodradigbee.
These external loads were calculated on a daily frequency from total daily flow,∑f(t),
and from concentration, c, measured as a point quantity. When these concentrationmeasurements are assumed to represent the daily average, a constant c , nutrient load,l, can be calculated as
121

Appendix B. Outline of analysis methods
L1,0
L1,1Lin1,1
Lsed1,1
Pool 1 (mixed)
Lsout2,2
Ls2,1
Lb2,1
Lbout2,2
Lsed2,2
∆∆Ps/Pb2,2
Lb2,2
Lout1,1
Ls2,2Lout1,1
Pool 2 (stratified)
Ls4,3
Lb4,3
Lsout4,4
Lbout4,4
Lsed4,4
∆∆Ps/Pb4,4
Lb4,4
Ls4,4
Pool 4 (stratified)
Ls3,2
Lb3,2
Lsout3,3
Lbout3,3
Lsed3,3
∆∆Ps/Pb3,3
Lb3,3
Ls3,3
Pool 3 (stratified)
LegendLp,t Nutrient load in pool p at time tLs Nutrient load in surface waterLb Nutrient load in botttom waterLsed Nutrient load in sediment∆∆Ps/Pb Nutrient load transfer from surface
to bottom waters
Figure B.1: Reach based internal reservoir loading.
l = c∑
f (t). (B.9)
While daily measured values for total flow and instantaneous concentration are available,gaps do exist in the data and for analysis purposes these were filled to bring the completedata set to daily frequency. The approach taken for flow was to fill gaps with datafrom other upstream stations, summed and adjusted for catchment size in order toapproximate the downstream flow. The adjustment for catchment size was calculated asa ratio of catchment areas to the power of 0.7 (Fitzgerald 1975, pers. comm.) i.e.
catchment adjustment =catchment area0 .7
upstream catchment area0 .7. (B.10)
Periods of no data in the chemistry data sets were much larger than those in flow,with monitoring for some analyands commencing after the start of the study period.To estimate the missing data the chemistry data was modelled with a simple linear orcurvilinear regression with flow. Where a wastewater treatment plant discharge occurred,the data was separated into pre and post discharge periods (see Section 2.2.1) and aregression line was calculated for each period.
Generally, to estimate missing sewage treatment plant effluent concentrations, two ap-proaches were taken:
122

Appendix B. Outline of analysis methods
1. Where gaps were small a linear line fit was applied to the outlying points
2. For Belconnen WPCC, Weston Creek STW, and the early period of LMWQCCoperation, up to April 1983, reported average concentrations from the Environmentand Process Audit were used (SCM Consultants 1992).
The calculation of nitrogen concentrations from LMWQCC was more complex as the dataset is sparse, and also because several periods of trial denitrification occurred between1978 and 1993. From the commencement of operation in 1978 to May 1983, total nitrogenvalues are taken from LMWQCC Environment and Process Audit (SCM Consultants1992). During this period NOx and NH3 are calculated as 80% and 10% of total nitrogenrespectively. During the periods when denitrification occurred these proportions changesto 60% and 30% respectively. From 1983 when trial denitrification ceased, up until June1985, both NOx and NH3 are estimated from a regression with flow on the measureddata that exist from July 1985 to the end of the study period. During this time and upuntil November 1993 when measured data commences, total nitrogen is calculated as themaximum of the sum of NOx, NH3 and a constant factor to represent organic nitrogen,and the reported median values in LMWQCC Environment and Process Audit (1992).
B.7 Organic loading
This analysis relates to the role of internally or externally derived P (Hypolimnetic P)analysis.
Internal organic load
The internal load was calculated for:
1. an average Reservoir depth of 40 m summer;
2. a 3000 ha surface area.
In the period before nutrient removal at LMWQCC, average algal biomass was 15 µg/LChlorophyll ’a’. BOD (decay of algae) was calculated as:
BODload = 3× 10⁷ m2 area× 15 µg/L Chlorophyll ′a′
× 0.7 g P/g Chlorophyll ′a′ × 41 g C/g P
× 2.1 g BOD/g C (B.11)
= 2.3 g/m2/a.
123

Appendix B. Outline of analysis methods
In the period after nutrient removal at LMWQCC, average algal biomass was 5 µg/LChlorophyll ’a’. BOD (decay of algae) was calculated as in Equation B.11:
BODload = 0.8 g/m2/a.
External organic load
In the period after nutrient removal at LMWQCC, outputs of phosphorus were 8000 kg/day.External TOC loading was calculated as:
TOCload = 8000 kg/day P× 41 g TOC/g P (B.12)
= 2920× 103 kg TOC/a
= 98 g/m2/a.
In the period after nutrient removal at LMWQCC, outputs of phosphorus are 800 kg/day.External TOC loading was calculated as:
TOCload = 800 kg/day P× 41 g TOC/g P (B.13)
= 292× 103 kg TOC/a
= 9.8 g/m2/a.
B.8 Temperature of inflow to Reservoir
A substantial stream flow temperature data set (weekly to fortnightly) was available forthe Murrumbidgee River at Uriarra Crossing, along with streamflow data. A regressionanalysis was undertaken of the 22 years of temperature data as a function of flow andmonth. A significant correlation was indicated between temperature and flow on amonthly basis (R2 = 0.1 to 0.4, n = 60/month).
This regression analysis was used as the basis for estimating the temperature of streaminflow to Burrinjuck Reservoir. It was assumed that there was no significant change intemperature for the 40 km of further travel of water downstream from Uriarra Crossingto Taemus Bridge (inlet zone to Reservoir). This is typically a travel time of 1 to 2 dayswithin a deep gorge.
The temperature of inflow was then compared with the average surface temperature forthe month for the Murrumbidgee River arm of the Reservoir in order to ascertain thelocation of inflow:
1. where inflow temperature > surface water temperature, inflow is to the surfacemixed layer;
2. where inflow temperature < surface water temperature, inflow is to the bottomwater layer.
124

Appendix B. Outline of analysis methods
B.9 Inlet depositional zone redox analysis
A process based water quality model developed for Canberra’s lakes and ponds wasapplied to the inlet zone of the Reservoir. The model comprises daily analysis of:
1. inflow, washout and mixing for TP TN, SS, BOD and algae;
2. sedimentation of particulates (including adsorbed nutrients) as a function of reachvolume and surface area;
3. inventory of settled organic material, less microbial utilisation;
4. DO balance in bottom layer and sediment redox levels;
5. daily transfer of DO through the water column, as a function of wind velocity,depth and temperature, offsetting (oxidation) reducing levels;
6. reduction of Fe(III) to Fe(II) and release of PO4 to the water column;
7. uptake of released P by algae (Chlorophyll ’a’).
The volume and surface area of the reach was adjusted on a daily basis to reflect Reservoirdrawdown conditions (based on Reservoir level and hypsometric curves for the reach).
Model estimates of TP concentrations and Chlorophyll ’a’ were compared with monitoredvalues for the analysis period.
B.10 Hypolimnetic P analysis
The FRP concentration of bottom waters and the surface mixed layer immediately priorto mixing (turnover) in autumn was determined for each year, and the mixed concentra-tion of FRP following turnover calculated:
FRPmixed =VolSML × CSML + VolBW × CBW
VolSML + VolBW
(B.14)
whereVolSML is the volume of the surface mixed layer;CSML is the FRP concentration in the surface mixed layer;VolBW is the volume of the bottom waters;CBW is the FRP concentration in the bottom waters.
Regression analysis was undertaken for the Chlorophyll ’a’ vs the FRPmixed for the pre-vious autumn, with separation of the years 1976 to 1980 from 1984 to 1998.
125

Appendix B. Outline of analysis methods
A correlation coefficient close to 1.0 was interpreted as indicating that the hypolimneticFRP represented a substantial component of the P driving algal growth in the subse-quent growth period. A correlation coefficient less than 0.4 was interpreted as indicatingthat the hypolimnetic P was only a minor source of FRP driving algal growth in thesubsequent growth period.
B.11 Algal biomass
In the case of Cyanobacteria Division alga, the ’Cyanobacteria’ Chlorophyll ’a’ estimateswere based on:
1. regression analysis of total Chlorophyll ’a’ versus Cyanobacteria cell numbers forthose periods where Cyanobacteria were dominant;
2. application of regression relationship to Cyanobacteria cell counts for the whole ofthe data period.
126

Appendix C
Glossary
Abiotic particulates Soil particles comprising crystallized minerals.
Adsorption The adherence of nutrients, metals, organics to a surface.
Alga Simple, usually unicellular, organisms capable of photosynthesis.
Algal blooms Excessive number of algae in a water body, often associated with an overabundance of nutrients in combination with suitable physical conditions.
Anoxic The absence of oxygen.
Attached algae Algae which are attached to a substrate (macrophytes, rocks, sand)
Anabaena A genus of Cyanobacteria (blue-green algae). Anabaena is widespread inAustralia and is one of the toxic bloom forming blue-green algae. As Anabaenahave the ability to fix nitrogen from the atmosphere, these organisms can overcomea nitrogen limitation in the water and thus are advantaged over competing algaein a nitrogen limited environment.
Benthic Benthic organisms are those that inhabit the bottom substrates of their (fresh-water) habitat.
Benthic oxygen demand The ongoing oxygen demand imposed by sediments on thewater column. Associated with the accumulation of more refractory (low rate ofbio-availability) organic material in the sediments.
Bio-available Nutrients in a dissolved form, free of adsorption or other complexity,such that they are readily available for plant uptake, or organic material in a labileform.
Biochemical oxygen demand (BOD) The oxygen demand associated with the mi-crobial decomposition of organic material. Normally measured as the oxygen de-pletion (mg/L) in a sample of water containing the organic material after 5 days.
Biofilm Film on a range of subtrates created by micro-organisms, including benthicalgae and bacteria.
Biomass The weight of living organisms.
127

Appendix C. Glossary
Biotic A process that requires the action of living organisms.
Chelated Complex molecules comprising metal ions and non-metal atoms (ligands).
Chemical oxygen demand (COD) The amount of oxygen required to oxidise all or-ganic matter that is susceptible to oxidation by a strong chemical oxidant.
Chlorophyta (green algae) A division of algae. Green algae are dependent on verticalmixing in the water column to cycle them through the euphotic zone.
Conductivity The electrical conductivity of water (µS/cm), as a measure of the totaldissolved salts concentration of the water. Total Dissolved Salts are typically 0.68x conductivity (µS/cm)
Cyanobacteria (blue-green algae) A division of algae, some species of which com-monly form nuisance blooms in Australian waterways. Cyanobacteria have buoy-ancy vacuoles allowing them to regulate their vertical position in the water column,giving them an advantage over other algae when mixing moves the algae out of theeuphotic zone for significant periods of time. Certain species of blue-green algae,for example Anaebena can capture nitrogen gas that has dissolved into the waterfrom the atmosphere and are able to use this as a source of nitrogen.
Dendritic Having a branching form.
Destratification When the temperature of the surface mixed layer and the bottomwaters equilize allowing mixing between the two layers.
Detritus Disintegrating organic material. In the case of algae, the dead cell matter.
Diatoms A division of algae. The cell walls comprise overlapping silica shells.
Epilimnion Surface mixed layer in stratified water bodies
Euphotic depth (zeu) The point in the water column at which light intensity hasreduced to 1% of its intensity at the surface.
External loading The supply of nutrients to the reservoir from sources outside of thereservoir, for example catchment runoff delivered via an input stream.
Filterable reactive phosphorus (FRP) The amount of phosphorus passing a finefilter. In this report, unless stated otherwise, FPR refers to the filtrate from a 0.45µm filter.
Flagella tail like extension used by the alga for movement.
Hypolimnion the bottom water layer, extending from the sediment to the base of thethermocline.
Inlet depositional zone The zone over which the bulk of particulate materials dis-charged by streams into reservoirs is sedimented.
Inorganic The non-biological forms of nutrients, such as nitrate, nitrite, ammonia andphosphate.
Internal loading The release of nutrients from sediments and from recycling betweenalgae within the reservoir.
128

Appendix C. Glossary
Isothermal Single temperature throughout the reservoir
Labile carbon Forms of carbon which are more readily available for uptake by het-erotrophic bacteria associated with the decomposition of organic material.
Littoral zone Shallow edge waters.
Macro-algae Large algae such as seaweed, or algae such as Hydrodictyon, Cladophoraand Spirogyra comprising large colonies or long filaments of interlinked cells.
Macrophytes Large vascular aquatic plants. May be attached to sediments and emer-gent or submerged, or may be free floating.
Metalimnion The zone intermediate between the epilmnion and hypolimnion. Alsoreferred to as the thermocline.
Micro-algae Very small single cell, colonies or filaments generally requiring a micro-scope for identification.
Microcystis A genera of blue-green alga that commonly cause algal blooms. Theseblooms can be toxic and have been implicated in severe dermatitis in humans, andpoisoning of animals that injest the chemicals secreted by these algae.
Mineralisation Oxidation of organic material
Mixing depth (zmix) The depth at which the buoyant energy of the surface layer (tem-perature reducing with depth) is equal to the kinetic energy resulting from surfacewind stress.
Nitrification The oxidation of organic nitrogen to form nitrate or nitrite or ammonia.
Nitrogen One of several essential plant nutrients required for photosynthesis in lakesand streams. It occurs in a number of forms, including nitrite NO−2 , nitrate NO−3 ,ammonia NH3 and organic forms (measured as Total Kjeldahl Nitrogen). TotalNitrogen is the sum of all forms of nitrogen.
Non-point source A diffuse source of nutrients that does not originate from a singlepoint. eg. catchment runoff.
Oxic The presence of oxygen.
Oxidation A chemical process where a molecule loses an electron.
Particulate Abiotic particles of minerals and biotic particles.
Plankton Organisms (animal or plant) that drift in the water column.
Phosphorus One of several essential plant nutrients required for photosynthesis in lakesand streams. It occurs in a number of forms, including inorganic phosphate PO3−
4 ,HPO−4 , organic P. Total Phosphorus is the sum of all forms of phosphorus.
Photosynthesis The process of synthesising organic material from water, carbon diox-ide and salts using sunlight as the source of energy, and Chlorophyll ’a’ as a catalyst.
Phytoplankton Free-floating microscopic plants in water bodies.
129

Appendix C. Glossary
Point source A source of nutrient input to the reservoir that originates from a point,for example the effluent from a wastewater treatment plant.
Pore water Water trapped in the voids of soil or sediments.
Redox A measure of the electron activity or oxidising-reducing conditions of sediments.
Reduction A chemical process where a molecule gains an electron.
Refractory carbon Forms of carbon which are less readily available for uptake byheterotrophic bacteria associated with the decomposition of organic material.
Remobilisation The chemical transformation of nutrients to soluble forms, such asnitrification of organic nitrogen, or release of nutrients as a result of transformationof metals from an insoluble to soluble form. eg: the reduction of ferric iron toferrous iron, with the release of PO3−
4 .
Reservoir turnover The transition of a stratified reservoir to a fully mixed reservoir,usually around April for temperate regions.
Riffle zones Shallow reaches of streams comprising beds of gravel or cobbles, uponwhich biofilm attaches.
Riparian zones Zone of ephemeral and terrestrial plants along banks and edges ofstreams.
Scouring Physical re-suspension of sediment or sloughing of biofilm and attached algaeas a result of elevated streamflow velocities.
Sediment Accumulation of abiotic and biotic materials on the beds of streams, lakesand reservoirs.
Sediment oxygen demand expressed ad g/m2/day, resulting from accumulation oforganic material in the sediment.
Stratification The warming of reservoir surface water relative to deeper waters createsa physical separation, thermocline, of the surface and bottom waters in terms ofdensity resistance to mixing.
Suspended solids (SS) Particles retained on a 0.45 µm filter.
Surface mixed layer (SML) The surface layer of lakes or reservoirs which is isother-mal as a result of mixing energy resulting from surface wind stress, or thermalcooling of surface waters.
Thermocline The point of greatest temperature gradient in the water column. Thethermocline separates the surface mixed layer or epilmnion from the bottomwaters or hypolimnion.
Thermistor A temperature sensitive electrical resistor used for monitoring water tem-perature.
Turbidity A measure of the light absorption by suspended abiotic and biotic particlesin a water body.
130

Appendix C. Glossary
Water column A theoretical ’column’ of water representative of the vertical physicaland chemical properties of a lake or reservoir.
Zooplankton The animal portion of plankton.
131

132

Appendix D
Abbreviations
ACTEW ACT Electricity & WaterAHD Australian Height DatumAWT Australian Water TechnologiesBOD Biochemical oxygen demandCOD Chemical oxygen demandCRCFE Co-operative Research Centre for Freshwater EcologyCSIRO Commonwealth Science & Industry Research OrganisationDIN Dissolved inorganic nitrogenDLWC Department of Land & Water ConservationDNR Department of Natural ResourcesDYRESM Dynamic Reservoir Simulation ModelEPA Environment Protection AgencyFRP Filterable reactive phosphorusLMWQCC Lower Monlonglo Water Quality Control CentreLWRRDC Land & Water Resources Research & Development CorporationMDBC Murray Darling Basin CommissionN NitrogenNEMP National Eutrophication Management ProgramP PhosphorusSML Surface mixed layerSOD Sediment oxygen demandSS Suspended solidsSTW Sewage treatment worksTHM Tri-halo methanesTKN Total kjeldahl nitrogenTN Total nitrogenTP Total phosphorusWWTP Waste water treatment plantXRF X-Ray Fractionationzmix Mixing depthzeu Euphotic depth
133

Appendix D. Abbreviations
Units
Algal cellsno./mL Number of cells per milli-litre (10−3 litres) of water
Concentrationmg/L Milli-grams per litre — 10−3 grams per litreµg/L Micro-grams per litre — 10−6 grams per litre (equivalent to mg/m3)
Loadkg/day Kilograms per day
ConductivityµS/cm Micro-siemens per centimetreS m−1 Siemens per metre.
Temperaturedeg.C Degrees celcius
Timed days
VolumeML Mega-litres — 106 litres (equivalent to 1000m3)GL Giga-litres — 109 litres
134