monitoring of seasonal algal succession and ... 48 bailey canadarago.pdfphytoplankton biovolume and...
TRANSCRIPT

Monitoring of Seasonal Algal Succession and Characterization of the Phytoplankton Community: Canadarago Lake, Otsego County, NY & Canadarago Lake Watershed Protection Plan Carter Lee Bailey
Occasional Paper No. 48
STATE UNIVERSITY OF NEW YORK COLLEGE AT ONEONTA

OCCASIONAL PAPERS PUBLISHED BY THE BIOLOGICAL FIELD STATION
No. 1. The diet and feeding habits of the terrestrial stage of the common newt, Notophthalmus viridescens (Raf.). M.C. MacNamara, April 1976 No. 2. The relationship of age, growth and food habits to the relative success of the whitefish (Coregonus clupeaformis) and the cisco (C. artedi)
in Otsego Lake, New York. A.J. Newell, April 1976. No. 3. A basic limnology of Otsego Lake (Summary of research 1968-75). W. N. Harman and L. P. Sohacki, June 1976. No. 4. An ecology of the Unionidae of Otsego Lake with special references to the immature stages. G. P. Weir, November 1977. No. 5. A history and description of the Biological Field Station (1966-1977). W. N. Harman, November 1977. No. 6. The distribution and ecology of the aquatic molluscan fauna of the Black River drainage basin in northern New York. D. E Buckley, April
1977. No. 7. The fishes of Otsego Lake. R. C. MacWatters, May 1980. No. 8. The ecology of the aquatic macrophytes of Rat Cove, Otsego Lake, N.Y. F. A Vertucci, W. N. Harman and J. H. Peverly, December 1981. No. 9. Pictorial keys to the aquatic mollusks of the upper Susquehanna. W. N. Harman, April 1982. No. 10. The dragonflies and damselflies (Odonata: Anisoptera and Zygoptera) of Otsego County, New York with illustrated keys to the genera and
species. L.S. House III, September 1982. No. 11. Some aspects of predator recognition and anti-predator behavior in the Black-capped chickadee (Parus atricapillus). A. Kevin Gleason,
November 1982. No. 12. Mating, aggression, and cement gland development in the crayfish, Cambarus bartoni. Richard E. Thomas, Jr., February 1983. No. 13. The systematics and ecology of Najadicola ingens (Koenike 1896) (Acarina: Hydrachnida) in Otsego Lake, New York. Thomas Simmons,
April 1983. No. 14. Hibernating bat populations in eastern New York State. Donald B. Clark, June 1983. No. 15. The fishes of Otsego Lake (2nd edition). R. C MacWatters, July 1983. No. 16. The effect of the internal seiche on zooplankton distribution in Lake Otsego. J. K. Hill, October 1983. No. 17. The potential use of wood as a supplemental energy source for Otsego County, New York: A preliminary examination. Edward M.
Mathieu, February 1984. No. 18. Ecological determinants of distribution for several small mammals: A central New York perspective. Daniel Osenni, November 1984. No. 19. A self-guided tour of Goodyear Swamp Sanctuary. W. N. Harman and B. Higgins, February 1986. No. 20. The Chironomidae of Otsego Lake with keys to the immature stages of the subfamilies Tanypodinae and Diamesinae (Diptera). J. P.
Fagnani and W. N. Harman, August 1987. No. 21. The aquatic invertebrates of Goodyear Swamp Sanctuary, Otsego Lake, Otsego County, New York. Robert J. Montione, April 1989. No. 22. The lake book: a guide to reducing water pollution at home. Otsego Lake Watershed Planning Report #1. W. N. Harman, March 1990. No. 23. A model land use plan for the Otsego Lake Watershed. Phase II: The chemical limnology and water quality of Otsego Lake, New York.
Otsego Lake Watershed Planning Report Nos. 2a, 2b. T. J. Iannuzzi, January 1991. No. 24. The biology, invasion and control of the Zebra Mussel (Dreissena polymorpha) in North America. Otsego Lake Watershed Planning Report
No. 3. Leann Maxwell, February 1992. No. 25. Biological Field Station safety and health manual. W. N. Harman, May 1997. No. 26. Quantitative analysis of periphyton biomass and identification of periphyton in the tributaries of Otsego Lake, NY in relation to selected
environmental parameters. S. H. Komorosky, July 1994. No. 27. A limnological and biological survey of Weaver Lake, Herkimer County, New York. C.A. McArthur, August 1995. No. 28. Nested subsets of songbirds in Upstate New York woodlots. D. Dempsey, March 1996. No. 29. Hydrological and nutrient budgets for Otsego lake, N. Y. and relationships between land form/use and export rates of its sub -basins. M. F.
Albright, L. P. Sohacki, W. N. Harman, June 1996. No. 30. The State of Otsego Lake 1936-1996. W. N. Harman, L. P. Sohacki, M. F. Albright, January 1997. No. 31. A self-guided tour of Goodyear Swamp Sanctuary. W. N. Harman and B. Higgins (Revised by J. Lopez),1998. No. 32. Alewives in Otsego Lake N. Y.: A comparison of their direct and indirect mechanisms of impact on transparency and Chlorophyll a. D. M.
Warner, December 1999. No.33. Moe Pond limnology and fish population biology: An ecosystem approach. C. Mead McCoy, C. P. Madenjian, V. J. Adams, W. N. Harman,
D. M. Warner, M. F. Albright and L. P. Sohacki, January 2000. No. 34. Trout movements on Delaware River System tail-waters in New York State. Scott D. Stanton, September 2000. No. 35. Geochemistry of surface and subsurface water flow in the Otsego lake basin, Otsego County New York. Andrew R. Fetterman, June 2001. No. 36 A fisheries survey of Peck Lake, Fulton County, New York. Laurie A. Trotta. June 2002. No. 37 Plans for the programmatic use and management of the State University of New York College at Oneonta Biological Field Station upland
natural resources, Willard N. Harman. May 2003. No. 38. Biocontrol of Eurasian water-milfoil in central New York State: Myriophyllum spicatum L., its insect herbivores and associated fish. Paul H.
Lord. August 2004. No. 39. The benthic macroinvertebrates of Butternut Creek, Otsego County, New York. Michael F. Stensland. June 2005. No. 40. Re-introduction of walleye to Otsego Lake: re-establishing a fishery and subsequent influences of a top Predator. Mark D. Cornwell.
September 2005. No. 41. 1. The role of small lake-outlet streams in the dispersal of zebra mussel (Dreissena polymorpha) veligers in the upper Susquehanna River
basin in New York. 2. Eaton Brook Reservoir boaters: Habits, zebra mussel awareness, and adult zebra mussel dispersal via boater. Michael S. Gray. 2005.
No. 42. The behavior of lake trout, Salvelinus namaycush (Walbaum, 1972) in Otsego Lake: A documentation of the strains, movements and the natural reproduction of lake trout under present conditions. Wesley T. Tibbitts. 2008.
No. 43. The Upper Susquehanna watershed project: A fusion of science and pedagogy. Todd Paternoster. 2008. No. 44. Water chestnut (Trapa natans L.) infestation in the Susquehanna River watershed: Population assessment, control, and effects. Willow
Eyres. 2009. No. 45. The use of radium isotopes and water chemistry to determine patterns of groundwater recharge to Otsego Lake, Otsego County, New
York. Elias J. Maskal. 2009. No. 46. The state of Panther Lake, 2014 and the management of Panther Lake and its watershed. Derek K. Johnson. 2015. No. 47. The state of Hatch Lake and Bradley Brook Reservoir, 2015 & a plan for the management of Hatch Lake and Bradley Brook Reservoir.
Jason E. Luce. 2015. Annual Reports and Technical Reports published by the Biological Field Station are available at: http://www.oneonta.edu/academics/biofld/publications.asp

Monitoring of Seasonal Algal Succession and Characterization of the Phytoplankton Community: Canadarago Lake, Otsego County, NY & Canadarago Lake Watershed Protection Plan Carter Lee Bailey
Biological Field Station, Cooperstown, New York bfs.oneonta.edu
STATE UNIVERSITY COLLEGE
AT ONEONTA

The information contained herein may not be reproduced without permission of the author(s) or the SUNY Oneonta
Biological Field Station

1
Abstract
The analysis of phytoplankton seasonal periodicity, often referred to as seasonal succession, can offer insight into the ecological functioning of a water body. Canadarago Lake is a dimictic lake of glacial origin in northern Otsego County, NY. It has long been considered naturally eutrophic, although years of cultural eutrophication have significantly impacted water quality in the past. All quantitative lake sampling for this study was conducted from one open water (pelagic) station, located in the deepest section of the main channel, from 26 April 2013 through 1 November 2013. Results from this testing were also compared to historical data sets in order to ascertain changes in long term water quality. Seasonal changes in phytoplankton biovolume over the summer of 2013 were found to reasonably parallel the commonly accepted periodicity of phytoplankton succession in a eutrophic system. In terms of total biovolume, diatoms tended to dominate the majority of sampling periods. Maximum summertime phytoplankton biovolume and mean annual cyanobacteria biovolume as documented in this study were significantly lower than that of all previous historical data sets. The Canadarago Lake phytoplankton community appears to have returned to a less impacted state.
2
Contents Abstract ………………………………………………………………………….………..... 1
Monitoring of seasonal algal succession and characterization of the phytoplankton community: Canadarago Lake, Otsego County, NY
Introduction …………………………………………….…………………….………………4 Methods ………………………………………………….………………….……………..…4 Results ……………………………………………………………………….……….………7
Physical and chemical factors ………………………..………………….…………….…7 Biovolume production …………………………………..………………………………10 Seasonality of genera …………………………………..…………………..……………11 Algal diversity ……………………………………………….……………..……………17 Littoral algal production ……………………………………….………………..………18 Long range analysis (1968-2013) ……………………………..…...……………………18
Discussion & Conclusion ……………………………………………………………………21 Work cited ……………………………………………………………...……………………25 Appendix …………………………………………………………………….………………28
Canadarago Lake watershed protection plan Introduction ……………………………………………………………………………….…31
Goals and priorities …………………………………………………………………...…31 About the lake ……………………………………………………………………...……32
Survey results ……………………………………………………………………..…………32 Lake issues ……………………………………………………………………..……………32
Lake level ……………………………………………………………..…………………32 Sanitary waste ………………………………………………………...…………………33 Richfield Springs Wastewater Treatment Plant …………………………………………35 Primary production ………………………………………………………...……………35
1. Algal blooms …………………………………...……………………………35 2. Aquatic plants (macrophytes) …………………….…………………………36
Exotic Species ………………………………………………...…………………………36 1. Non-native species not currently in Canadarago Lake …………..………….36 2. Alewives ……………………………………………………….……………37 3. Zebra mussels ………………………………………………..………………37 4. Exotic plants (macrophytes) ……………………………...…………………38
Fishery …………………………………………………………………………...………38 Recreational use …………………………………………………………………………39 Shoreline preservation …………………………………..………………………………39 Blueway Trail, Otsego Land Trust (OLT) ………………………………………………40
Streams and tributaries ………………………………………………………………………40 Agricultural management …………………..…………………………..…..……………40
3
Logging and silviculture …………………………….……………...….….….…………41 Roadway maintenance ……………………………….………………...….….…………41 Herkimer Creek sedimentation ……………………..………….…….…….……………42
Continued monitoring …………….…………………….…….…………….….……………43 Baseline monitoring ………………………………………………..……………………43 Invasive plant monitoring ………………………………..….……………......…………43
Work cited ……………………………………………………………………..……...…………44 Appendix ………………………………………………………..……………………...………..47

4
Introduction Planktonic algae tend to dominate pelagic primary production within temperate waterbodies. Individual species often occur in an annual reoccurring sequence commonly referred to as the seasonal succession of phytoplankton (Reynolds 1980, Sommer 1987). Many physical, chemical, and biological factors influence this process; oftentimes lakes displaying similar intrinsic properties share similar algal populations and seasonal occurrences. Canadarago Lake is a dimitic lake of glacial origin in northern Otsego County, NY. The lake has long been considered naturally eutrophic, although years of cultural eutrophication have significantly impacted water quality in the past (Fuhs 1973; Harr et al. 1980). Proper characterization of the lake’s algal community has been limited since the late 1970’s, despite other various recent biological and limnological investigations (Albright & Waterfield 2011, Brooking et al. 2012). Phytoplankton often play a key role in both the aquatic food web and human perception of water quality. Recent increasing trends regarding the presence of cyanobacteria in the form of Harmful Algal Blooms (HABs) across greater New York State has raised both public and scientific concern about changes in algal ecology within lentic systems of the region (Davis et al. 2010; Kishbaugh 2013). The objective of this study was to characterize the seasonal successional patterns of the phytoplankton community within Canadarago Lake and compare current production levels to historical data sets. The lake’s planktonic algal production, in terms of biovolume, was expected to be lower than that of the historical data sets due to marked decreases in external nutrient loading since the 1970’s. Methods
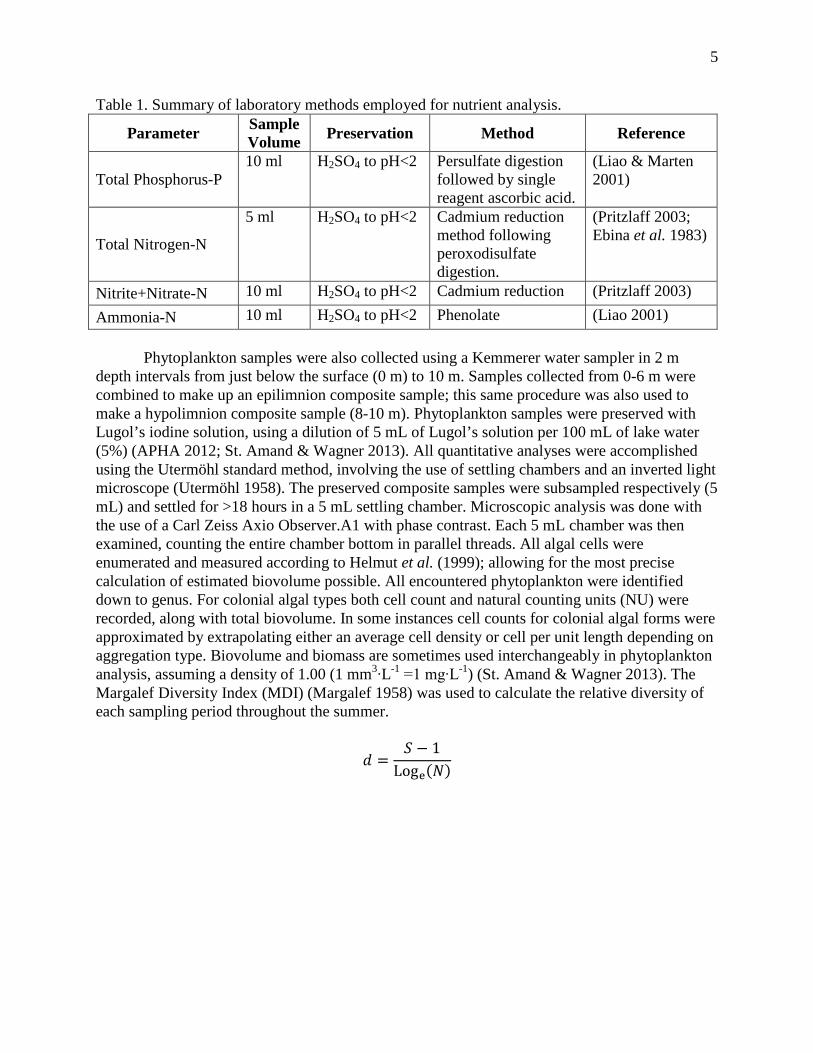
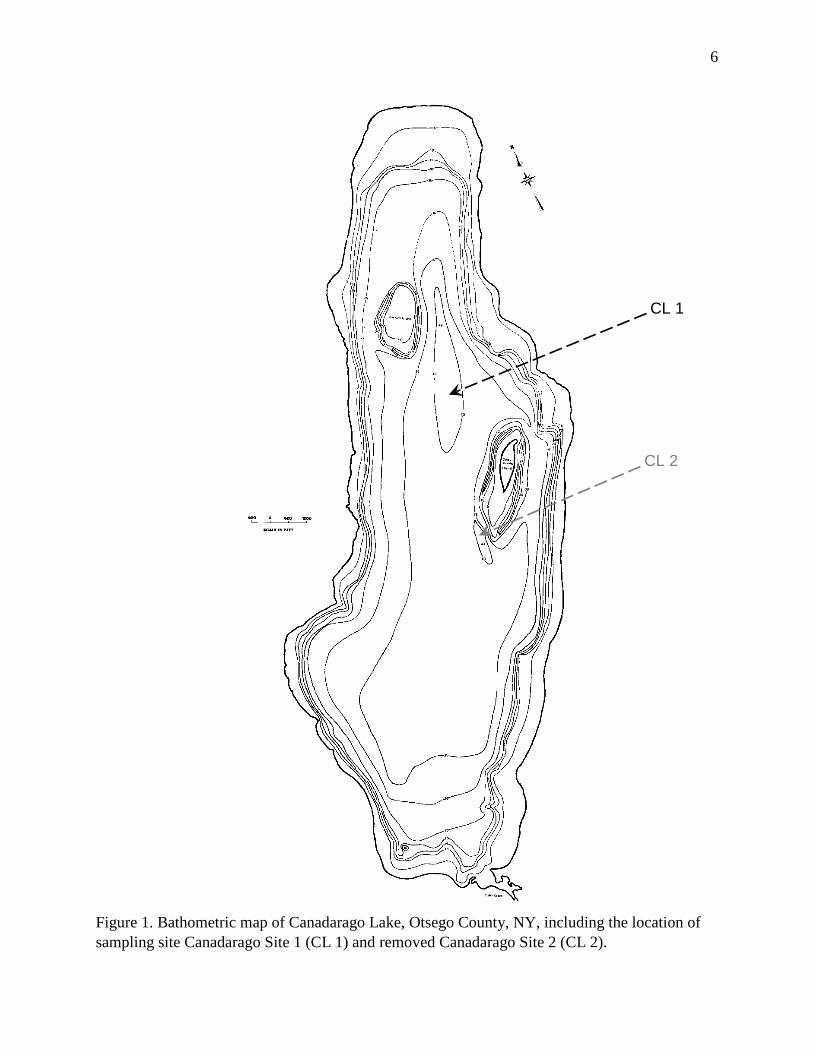
All quantitative lake sampling was conducted from one open water (pelagic) station, Canadarago Site 1 (CL 1) located in the deepest section of the main channel, from 26 April 2013 through 1 November 2013 (Figure 1). In the testing phase of this experiment two open water sites were sampled, with the second site (CL 2) located just south of the Deowongo Island shelf complex. This site was removed as the two sites showed little to no variation in algal composition (p = 0.553) and a single site allowed for a more rapid assessment of phytoplankton. Sampling was conducted approximately bi-weekly with a total of 11 sampling periods in 2013. Water samples for nutrient analysis were collected in 3 m depth intervals using a Kemmerer water sampler from the surface to just off the bottom (12 m). These samples were analyzed for ammonia, nitrite+nitrate, total nitrogen (TN) and total phosphorus (TP) (Table 1). Physical water quality data (temperature, dissolved oxygen, pH, and conductivity) was collected in 2 m depth intervals (0-12 m) using an YSI® 650 MDS multiparameter sonde calibrated to manufacturer’s specification (YSI Inc. 2009).
5
Table 1. Summary of laboratory methods employed for nutrient analysis.
Parameter Sample Volume Preservation Method Reference
Total Phosphorus-P 10 ml H2SO4 to pH<2 Persulfate digestion
followed by single reagent ascorbic acid.
(Liao & Marten 2001)
Total Nitrogen-N
5 ml H2SO4 to pH<2 Cadmium reduction method following peroxodisulfate digestion.
(Pritzlaff 2003; Ebina et al. 1983)
Nitrite+Nitrate-N 10 ml H2SO4 to pH<2 Cadmium reduction (Pritzlaff 2003)
Ammonia-N 10 ml H2SO4 to pH<2 Phenolate (Liao 2001) Phytoplankton samples were also collected using a Kemmerer water sampler in 2 m
depth intervals from just below the surface (0 m) to 10 m. Samples collected from 0-6 m were combined to make up an epilimnion composite sample; this same procedure was also used to make a hypolimnion composite sample (8-10 m). Phytoplankton samples were preserved with Lugol’s iodine solution, using a dilution of 5 mL of Lugol’s solution per 100 mL of lake water (5%) (APHA 2012; St. Amand & Wagner 2013). All quantitative analyses were accomplished using the Utermöhl standard method, involving the use of settling chambers and an inverted light microscope (Utermöhl 1958). The preserved composite samples were subsampled respectively (5 mL) and settled for >18 hours in a 5 mL settling chamber. Microscopic analysis was done with the use of a Carl Zeiss Axio Observer.A1 with phase contrast. Each 5 mL chamber was then examined, counting the entire chamber bottom in parallel threads. All algal cells were enumerated and measured according to Helmut et al. (1999); allowing for the most precise calculation of estimated biovolume possible. All encountered phytoplankton were identified down to genus. For colonial algal types both cell count and natural counting units (NU) were recorded, along with total biovolume. In some instances cell counts for colonial algal forms were approximated by extrapolating either an average cell density or cell per unit length depending on aggregation type. Biovolume and biomass are sometimes used interchangeably in phytoplankton analysis, assuming a density of 1.00 (1 mm3∙L-1 =1 mg∙L-1) (St. Amand & Wagner 2013). The Margalef Diversity Index (MDI) (Margalef 1958) was used to calculate the relative diversity of each sampling period throughout the summer.
𝑑 =𝑆 − 1
Loge(𝑁)
6
Figure 1. Bathometric map of Canadarago Lake, Otsego County, NY, including the location of sampling site Canadarago Site 1 (CL 1) and removed Canadarago Site 2 (CL 2).
CL 1
CL 2

7
Periphyton and tycoplanktonic (turbulence driven) aggregations of filamentous algal types were not formally quantified but were collected and identified on occasion throughout the summer of 2013 as per request of local residents. This haphazard sampling regime essentially included collecting a sample from any surface aggregations encountered. No biovolume calculations were carried out on these samples, as they were strictly qualitative.
Previous studies also focusing on the algal composition of Canadarago Lake (1968-1969,
1973-1976) allowed for the comparison of changes in algal densities over time. The majority of this historical data was obtained from Fuhs 1973 and Harr et al. 1980. These historical data sets were used for a long range comparison in an attempt ascertain long term trends in water quality focusing on total biovolume and percent composition of cyanophyta. Based on changes in external nutrient loading to the lake, as a result of the implementation of secondary treatment phosphorus removal at the Richfield Springs Wastewater Treatment Plant in 1972, three data series were used: pre-phosphorus removal (1968-1969), post-phosphorus removal (1973-1976), and long range (2013). These were then transformed into standardized monthly data by taking an average of all readings collected in a single month (April-November), resulting in eight data points per data series. Annual mean biovolume and annual mean cyanophyta biovolume were also calculated by averaging all concentrations in one sampling year (April-November). Trend analysis was carried out on this data by plotting monthly biovolume over time, and annual mean cyanophyta biovolume over annual mean biovolume. Correlation coefficients (r) were calculated for these two scatter plots. Further statistical analysis was conducted on these tree data series (pre-, post-, long range) using a one-way analysis of variance (ANOVA). This test was used to determine if the variance in standardized monthly biovolume between these three periods was statistically significant.
Results Physical and Chemical Factors
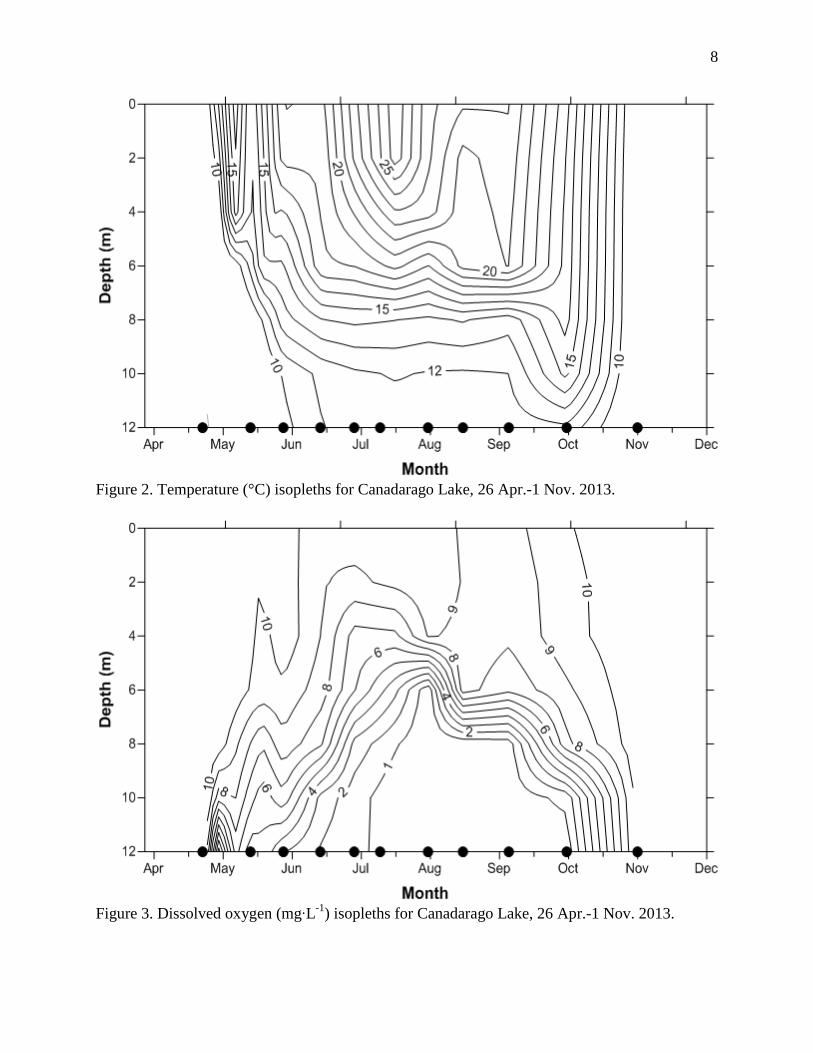
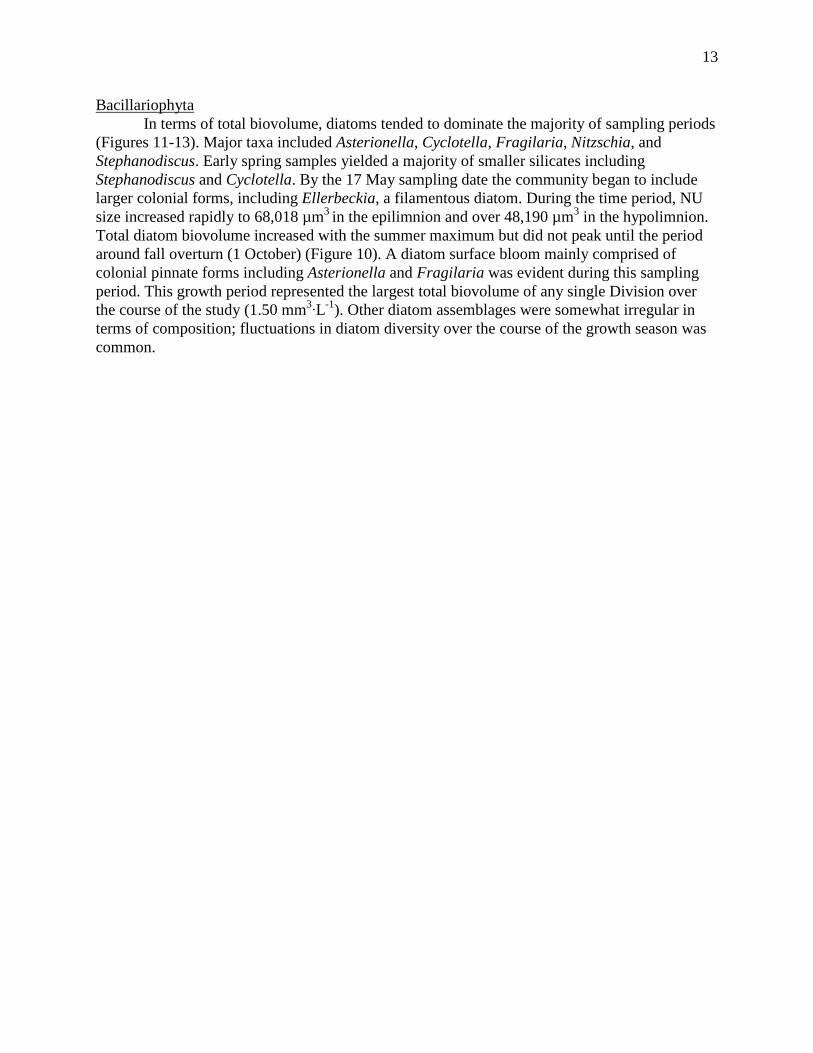
In 2013, complete ice-out did not take place until late April, which was visually observed on 19 April. The onset of summertime thermal stratification took place between 26 April and 17 May sampling dates, with the lake becoming completely stratified by 17 June (Figure 2). Persistent rain events were noted during the early spring particularly during the month of June where the lake reached flood stage levels. Oxygen depletion within the hypolimnion was evident after thermal stratification but did not reach anoxia levels until 19 July (Figure 3). Elevated concentrations of total phosphorus (TP) were recorded in the bottoms waters (12 m) starting 2 August. These levels increased throughout the next few sampling periods, peaking on 6 September at 516 µg∙L-1 (Figure 4). Springtime epilimnetic total phosphorus levels averaged around 15 µg∙L-1. Total nitrogen accumulated in the hypolimnion over the course of stratification (Figure 5). Average Secchi depth (May- November) was calculated at 3.1 m (SE = ± 0.2 m).
8
Figure 2. Temperature (°C) isopleths for Canadarago Lake, 26 Apr.-1 Nov. 2013.
Figure 3. Dissolved oxygen (mg∙L-1) isopleths for Canadarago Lake, 26 Apr.-1 Nov. 2013.

9
Figure 4. Total phosphorus (µg∙L-1) isopleths for Canadarago Lake, 26 Apr.-1 Nov. 2013.
Figure 5. Total nitrogen (mg∙L-1) isopleths for Canadarago Lake, 26 Apr.-1 Nov. 2013.

10
Biovolume Production Seasonal changes in algal biovolume varied by two orders of magnitude over the growing season (0.01- 2.03 mm3∙L-1) peaking mid-summer on 19 July. A clear water phase was observed 31 May and a decline in productivity due to decreased nutrient availability (autogenic shift) was apparent from 2 August - 6 September (Figures 4-6). A resurgence of phytoplankton biovolume was evident around the period of fall turnover (thermal destratification), where algal concentrations approached levels observed during the summer maximum (Figure 6). Epilimnetic algal biovolume was consistently higher than that of the hypolimnion even despite increased nutrient availability due to internal loading (Figure 6).
Figure 6.Total biovolume of phytoplankton within epilimnion and hypolimnion samples; 2013.
Figure 7. Phytoplankton cell concentration within epilimnion and hypolimnion samples; 2013.
0.0
0.5
1.0
1.5
2.0
2.5
A M J J A S O N D
Tota
l Bio
volu
me
(mm
3 ∙L-
1 )
Month
Epilimnion Hypolimnion
0
500
1,000
1,500
2,000
2,500
3,000
3,500
A M J J A S O N D
Tota
l Cel
ls (c
ells∙L
-1)
Month
Epilimnion Hypolimnion

11
Figure 8. Average cell size within epilimnion and hypolimnion samples; 2013.
Figure 9. Average natural counting unit (NU) size within epilimnion and hypolimnion samples; 2013. Seasonality of Genera Cyanophyta
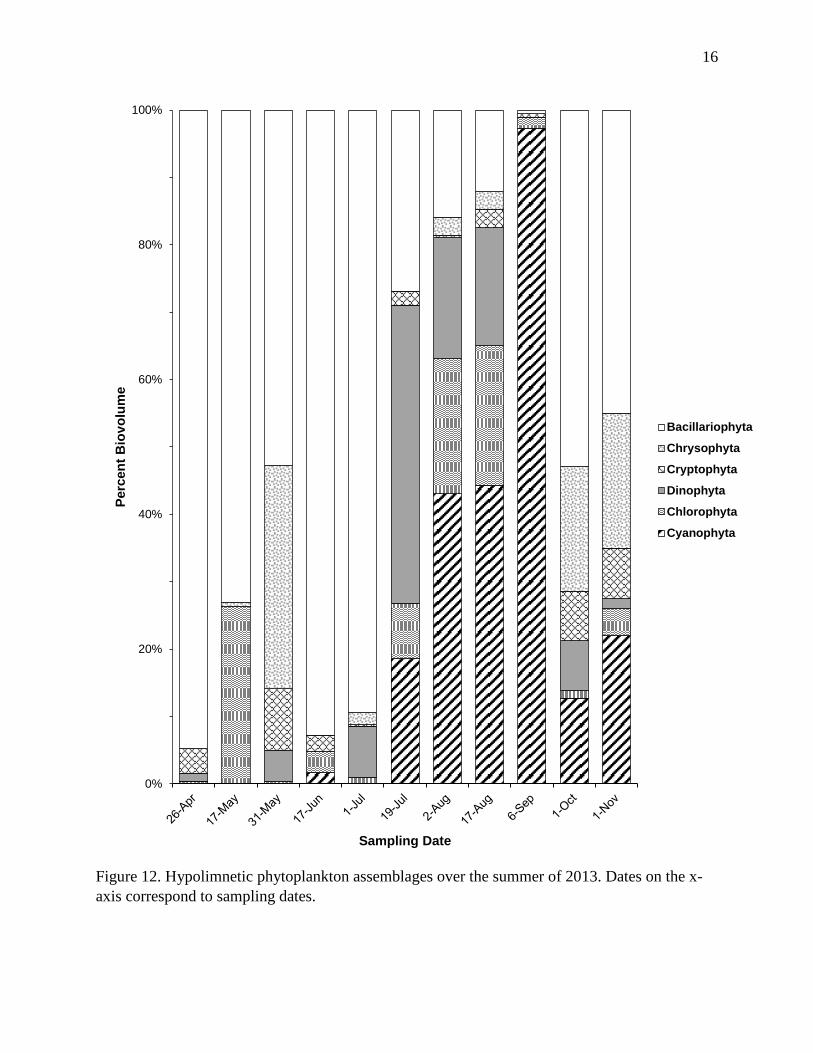
The main bulk of cyanobacterial production occurred during the latter part of the growing season, from 19 July- 1 November (Figures 10-13). Major blue green contributors included Anabaena, Coelosphaerium, Lyngbya, Merismopedia, Microcystis, and Planktothrix. In the upper waters these genera never accounted for more than 30% of the total biovolume (Figure 10a). Also, no visual blooms were present during any of the sampling events over the course of the summer. Increased cyanobacteria was apparent within the hypolimnion, strongly corresponding to increases in internal phosphorus levels, between 19 July and 6 September (Figure 12). At the peak of hypolimnetic cyanobacterial production the community was primarily composed of Anabaena, Merismopedia, Microcystis, and Planktothrix. Other genera such as Coelosphaerium and Planktothrix were common mid-growing season but then dissipated as the
0
5,000
10,000
15,000
20,000
A M J J A S O N D
Aver
age
Cel
l Siz
e (µ
m3 )
Month
Epilimnion Hypolimnion
0
20,000
40,000
60,000
80,000
100,000
A M J J A S O N D
Aver
age
NU
Siz
e (µ
m3 )
Month
epilimnion hypolimnion

12
season progressed into the fall. Late fall cyanobacterial composition was dominated by Anabaena and Microcystis. Two distinct morphotypes of Microcystis were noted, mainly differentiated by cell diameter, with one averaging 2.30 µm in diameter and the other averaging 3.18 µm in diameter.
Chlorophyta Chlorophytes were present throughout the summer growth season, despite never becoming a dominant proportion of the total phytoplankton biovolume (Figure 13). Seasonal variation in growth assemblages commonly included Chlamydomonas, Cosmarium, Dictyosphaerium, Eudorina, Oocystis, and Sphaerocystis. Chlamydomonas was abundant in the spring, giving way to larger Tetrasporales and Chlorococcales mid-summer. On 19 July, chlorophyta, mainly Sphaerocystis and Eudorina, made up 33% of the algal biovolume in the epilimnion. Green algal production tended to coincide with general accumulations of algal biovolume, peaking with the summer phytoplankton maximum, while also growing well under the nutrient limitations of the summer minimum (Figures 4-5, 10). Euglenophyta This Division had negligible contributions to the overall biovolume of the summertime phytoplankton community. Two genera were identified over the course of the study, Euglena and Trachelomonas, typically occurring in the epilimnion and accounting for 0-3% of the total biovolume within this area of the lake (Figure 11). Euglenophyta abundance was greatest in the early fall. Cryptophyta Cryptomonas and Rhodomonas were extremely common throughout the growing season, especially within the epilimnion. The relatively small cell size of these taxa limits the degree in which they impacted total biovolume over the growing season, even though they were evident on every sampling date (Figures 10-13). Cryptomonas size ranged from 13-35 µm in length, and Rhodomonas size ranged from 10-13 µm in in length. Chrysophyta Two main colonial chrysophytes, Dinobryon and Synura, were evident over the course of this study. Dinobryon become abundant near the end of summer and beginning of the fall accounting for 20% of the total biovolume by the beginning of November. Hypolimnetic samples showed increases in Dinobryon on 1 October, this growth trend continued into the fall, with both composite samples (shallow and deep) displaying high Dinobryon levels during the month of November (Figures 10-13). Dinophyta Smaller bodied dinoflagellates were common during springtime sampling. Early season genera included Gymnodinium and Peridinium. These taxa were present in limited quantities typically accounting for 1-3.5% of the total biovolume. Mid-summer assemblages shifted to include larger bodied Ceratium, accounting for 37% of the total biovolume by 1 July (Figure 11). This trend continued throughout the summer maximum, with dinoflagellate biovolume remaining high in both the epilimnion and hypolimnion through 2 August (Figure 10).
13
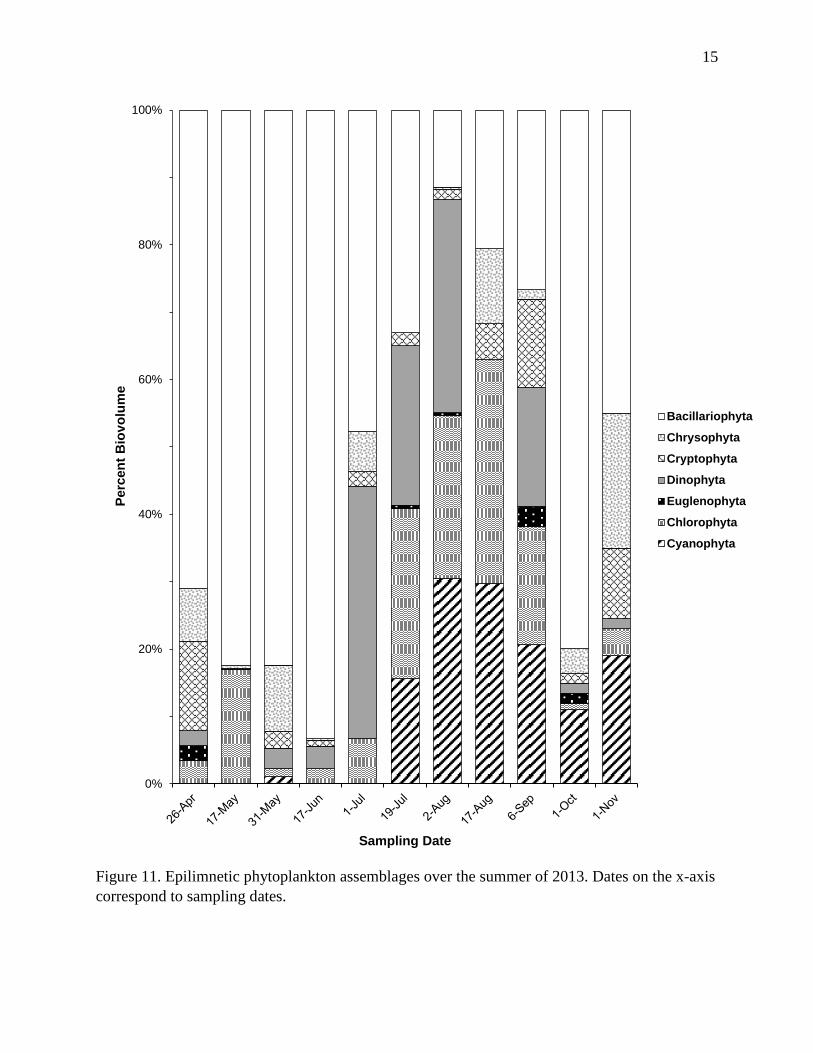
Bacillariophyta In terms of total biovolume, diatoms tended to dominate the majority of sampling periods (Figures 11-13). Major taxa included Asterionella, Cyclotella, Fragilaria, Nitzschia, and Stephanodiscus. Early spring samples yielded a majority of smaller silicates including Stephanodiscus and Cyclotella. By the 17 May sampling date the community began to include larger colonial forms, including Ellerbeckia, a filamentous diatom. During the time period, NU size increased rapidly to 68,018 µm3 in the epilimnion and over 48,190 µm3 in the hypolimnion. Total diatom biovolume increased with the summer maximum but did not peak until the period around fall overturn (1 October) (Figure 10). A diatom surface bloom mainly comprised of colonial pinnate forms including Asterionella and Fragilaria was evident during this sampling period. This growth period represented the largest total biovolume of any single Division over the course of the study (1.50 mm3∙L-1). Other diatom assemblages were somewhat irregular in terms of composition; fluctuations in diatom diversity over the course of the growth season was common.

14
Figure 10. Productivity of important Divisions over the summer of 2013. Note differnces in scale on the y-axis.
0.00
0.10
0.20
0.30
0.40
Biov
olum
e (m
m3 ∙L
-1)
Cyanophyta
0.00
0.20
0.40
0.60
0.80
Biov
olum
e (m
m3 ∙L
-1)
Chlorophyta
0.00
0.20
0.40
0.60
0.80
Biov
olum
e (m
m3 ∙L
-1)
Dinophyta
0.00
0.10
0.20
0.30
0.40
Biov
olum
e (m
m3 ∙L
-1)
Cryptophyta Chrysophyta
0.00
0.40
0.80
1.20
1.60
Biov
olum
e (m
m3 ∙L
-1)
Bacillariophyta
a.
b.
c.
d.
e.
15
Figure 11. Epilimnetic phytoplankton assemblages over the summer of 2013. Dates on the x-axis correspond to sampling dates.
0%
20%
40%
60%
80%
100%Pe
rcen
t Bio
volu
me
Sampling Date
Bacillariophyta
Chrysophyta
Cryptophyta
Dinophyta
Euglenophyta
Chlorophyta
Cyanophyta
16
Figure 12. Hypolimnetic phytoplankton assemblages over the summer of 2013. Dates on the x-axis correspond to sampling dates.
0%
20%
40%
60%
80%
100%Pe
rcen
t Bio
volu
me
Sampling Date
Bacillariophyta
Chrysophyta
Cryptophyta
Dinophyta
Chlorophyta
Cyanophyta

17
Figure 13. Epilimnetic phytoplankton biovolume sorted by Division; 2013. Algal Diversity Diversity of the phytoplankton community tended to increase throughout the early part of the growing season peaking on 17 August and dropping off later into the fall. Scoring a 6.6 on the Margalef Diversity Index (MDI), the 17 August sampling date contained 27 different genera and occurred after the summer maximum (Figure 14). The lowest diversity was recorded on the initial sampling date, 26 April. Chlorophyta was the greatest contributor of divisional cohorts, displaying 16 genera over the course of the entire study with, 12 of them occurring on 17 August.
0.0
0.5
1.0
1.5
2.0B
iovo
lum
e (m
m3 ∙L
-1) Bacillariophyta
CryptophytaChrysophyta
Dinophyta
Euglenophyta
Chlorophyta
Cyanophyta

18
Figure 14. Phytoplankton diversity calculated using the Margalef Diversity Index; 2013. Littoral Algal Production Three major filamentous algal types were encountered during the littoral haphazard sampling regime, Spirogyra, and Mougeotia (chlorophyta), and Oscillatoria (cyanophyta). Spirogyra and Mougeotia, both members of family Zygnemataceae, were collected on subsequent sampling dates in July in what looked to be near mutually exclusive, monospecific aggregations. Oscillatoria appeared to be the dominant filament of the littoral area at northern end of the lake, often forming a dense benthic mat and emerging as a floatable scum layer later on in the growth season (August). This growth form often distinguished itself from pelagic Planktothrix specimens collected, microscopically displaying greater girth and filament length. Long Range Analysis (1968-2013) Maximum summertime phytoplankton biovolume recorded in this study were lower than that of all previous historical data sets. Monthly Canadarago Lake algal concentrations in 2013, when compared to previous data sets (1968-1969, 1973-1976) indicate a trend in decreased algal productivity since 1968. Using a linear correlation coefficient, this trend in monthly biovolume was found to be statistically significant (p = 0.002) (Figure 15).
Similar trends were found using a one-way ANOVA. The analysis of variance for standardized monthly biovolume, among the three time periods, was determined to be significant, F (2, 20) = 13.28, p = .002 (r = .63). The distribution of monthly biovolume was found to significantly decrease over the three time periods (pre M = 13.25, post M = 6.66, and long range M = 0.856) (Figure 16; Table 2). In summary, the data collected from 2013 generally indicates lower levels of productivity when compared to both pre- and post-phosphorus removal data sets.
Contributions of cyanobacteria over these three periods also appears to be decreasing.
On average, cyanobacteria annually contribute over 63% of the total biovolume and explains 89% of the annual variability in total biovolume (p < 0.0005) (Figure 17). This analysis indicates that years with high overall productivity strongly correspond to years with increased levels of cyanobacteria production.
0
1
2
3
4
5
6
7
A M J J A S O N D
MD
I (d)
Month
Margalef Diversity Index
d = (S-1) / Ln(N) N = 51

19
Figure 15. Standardized monthly total phytoplankton biovolume (1968-1969; 1973-1976; 2013) scatter plot. Trend line indicates a significant decrease in total biovolume over time (p = 0.002). Data sources: Fuhs 1973; Harr et al. 1980.
y = -0.0006x + 25.596 r² = 0.163; p = 0.002
0.0
10.0
20.0
30.0
40.0
50.0
60.0To
tal B
iovo
lum
e (m
m3 ∙
L-1 )
Year

20
Figure 16. Boxplot of standardized monthly biovolume corresponding to three time periods (1968-1969; 1973-1976; 2013). ANOVA analysis, F(2, 20) = 13.28, p = .0022 (r = .63). Table 2. Mean standardized monthly biovolume, all three time periods were found to be significantly different, F(2, 20) = 13.28, p = .0022 (r = .63).
Means with the same letter are not significantly different.
Grouping Mean N Period
A 13.248 7 Pre (1968-1969)
B 6.659 8 Post (1973-1976)
C 0.856 8 Long Range (2013)
(mm
3 ·L-1
)

21
Figure 17. Mean annual cyanobacteria biovolume plotted against mean annual total biovolume (1968-1969; 1973-1976; 2013). Cyanobacteria on average, accounts for 63% of the annual total biovolume and explains 89% of the annual variability in total biovolume (p < 0.0005). Data sources: Fuhs 1973; Harr et al. 1980. Discussion & Conclusion
Seasonal changes in phytoplankton biovolume over the summer of 2013 were found to reasonably parallel the commonly accepted periodicity of phytoplankton succession in a eutrophic system (Reynolds 1980, Carpenter et al. 1987, Sommer 1987). However, some variation from the typical successional pattern did occur including a relatively small spring maximum and larger than anticipated increase in biovolume in an around the period of fall overturn. The spring maximum was somewhat atypical in respect to both total biovolume and average NU size (Figures 7, 9). Commonly one would expect mid-May to be associated with a large abundance of small algal types. In 2013 colonial diatoms dominated the 17 May sampling event; Ellerbeckia alone accounted for 70% of the total biovolume. This suggests that the true spring maximum may have been missed by the biweekly sampling protocol and that on Canadarago Lake, in at least some years, the spring maximum may happen quickly (20-30 days) after ice-out.
Relatively high biovolume concentrations in and around the period of fall overturn
appears to be a somewhat standard occurrence on Canadarago Lake. This was observed in 2013, during the testing phase of this project in 2012 and appears to be reflected in the historical data sets (1968-1969, 1973-1976). This phenomenon may be linked to the redistribution of summertime internal phosphorus (P) loading, into the hypolimnion. Fall turnover (thermal
y = 0.6305x - 1.0953 R² = 0.888
0
4
8
12
16
20
0 4 8 12 16 20
Cya
noph
yta
Bio
volu
me
(mm
3 ∙L-1
)
Total Biovolume (mm3∙L-1)
(1968, 1969)
(1973-1976) (2013)
22
destratification) occurred as expected in 2013 and as observed in the past (Fuhs 1973; Harr et al. 1980; Albright & Waterfield 2011) (Figure 2). Nitrogen (N) and phosphorus (P) redistribution throughout the water column also showed no significant variation from past descriptions, with a N and P build-up in the hypolimnion from a combination of bottom settling dead and senescent algal cells and the concurrent release of ammonia and phosphorus from benthic sediments due to anoxia (Figures 3-5). On Canadarago Lake it appears that a third maximum, in phytoplankton production, occurs frequently in and around the period of fall thermal destratification.
Average phytoplankton cell size started off small in the spring and rapidly increased into
the early summer. This is assumed to be a result of increased grazing pressure by smaller zooplankters which is commonly seen during this time period (Carpenter et al. 1987) (Figure 8). Larger diatoms and dinoflagellates are considered to be more grazing resistant due to increased size, explaining their rise in dominance leading up to the summer maximum, where average cell size was found to peak 1 July (Figure 8). Top-down pressure has been proven to play a key role in the size of and composition of organisms throughout the aquatic food web (Brooks & Dodson 1965). It would be interesting to look at zooplankton concentrations and relative size over this same time period, in order to evaluate the impact of higher trophic levels on the phytoplankton community.
The negative impacts of cyanobacteria in the form of harmful algal blooms (HABs) have
been well documented (Codd et. al. 2005; Davis et al. 2010; O’Neil et al. 2012). This, along with recent trends in increased occurrences of cyanobacterial blooms across New York State (Davis et al. 2010; Kishbaugh 2013), have made the role of cyanobacteria within Canadarago Lake a point of concern for this study. Overall, the contribution of blue-greens to the lake’s phytoplankton biomass, when compared to historical data sets (Fuhs 1973; Harr et al. 1980), appears to be down. Multiple toxin producers were identified over the summer of 2013, including Anabaena, Microcystis, Planktothrix (Oscillatoria), and Lyngbya. No visible blooms were recorded during this sampling period, and it was presumed that toxin levels were also negligible. A visible Anabaena bloom was apparent during the testing phase of this study in the fall of 2012, indicating that bloom formation does not have a predictable annual pattern. On 6 September Merismopedia and Planktothrix largely dominated the hypolimnetic sample, comprising nearly 97% of the total biovolume (Figure 12). This assemblage was most likely driven by the internally-loaded phosphorus accumulating within the lake at that time (Figure 4), though no surficial remnant of these populations were evident in subsequent sampling events.
The summer maximum epilimnion sample (19 July) contained a balanced phytoplankton community comprised of chlorophyta (25.5%), dinophyta (23.6%), and bacillariophyta (33.1%). Later on in the growing season it is typical to see declines in phytoplankton populations due to the self-exhaustion of nutrients within the water column (Reynolds 1980, Sommer 1987). All major divisions showed this pattern of decline between the periods of 19 July and 6 September, which is consistent with the nutrient limiting (N, P) conditions in the epilimnion (Figures 4-5, 13). Silica can often be limiting to certain phytoplankton taxa, most notably diatoms and some chrysophytes (Dinobryon). In general, silica levels tend to decrease throughout the summer and rebound once again around the period of fall overturn, along with other nutrients (Sommer
23
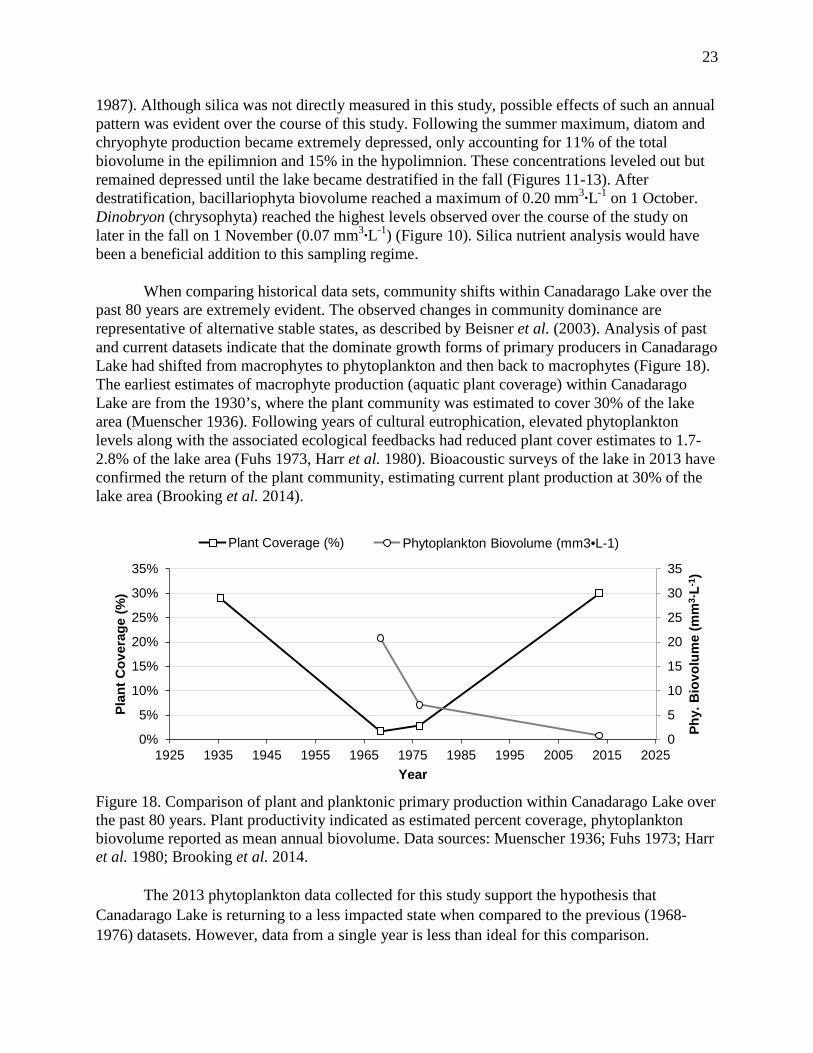
1987). Although silica was not directly measured in this study, possible effects of such an annual pattern was evident over the course of this study. Following the summer maximum, diatom and chryophyte production became extremely depressed, only accounting for 11% of the total biovolume in the epilimnion and 15% in the hypolimnion. These concentrations leveled out but remained depressed until the lake became destratified in the fall (Figures 11-13). After destratification, bacillariophyta biovolume reached a maximum of 0.20 mm3∙L-1 on 1 October. Dinobryon (chrysophyta) reached the highest levels observed over the course of the study on later in the fall on 1 November (0.07 mm3∙L-1) (Figure 10). Silica nutrient analysis would have been a beneficial addition to this sampling regime. When comparing historical data sets, community shifts within Canadarago Lake over the past 80 years are extremely evident. The observed changes in community dominance are representative of alternative stable states, as described by Beisner et al. (2003). Analysis of past and current datasets indicate that the dominate growth forms of primary producers in Canadarago Lake had shifted from macrophytes to phytoplankton and then back to macrophytes (Figure 18). The earliest estimates of macrophyte production (aquatic plant coverage) within Canadarago Lake are from the 1930’s, where the plant community was estimated to cover 30% of the lake area (Muenscher 1936). Following years of cultural eutrophication, elevated phytoplankton levels along with the associated ecological feedbacks had reduced plant cover estimates to 1.7-2.8% of the lake area (Fuhs 1973, Harr et al. 1980). Bioacoustic surveys of the lake in 2013 have confirmed the return of the plant community, estimating current plant production at 30% of the lake area (Brooking et al. 2014).
Figure 18. Comparison of plant and planktonic primary production within Canadarago Lake over the past 80 years. Plant productivity indicated as estimated percent coverage, phytoplankton biovolume reported as mean annual biovolume. Data sources: Muenscher 1936; Fuhs 1973; Harr et al. 1980; Brooking et al. 2014.
The 2013 phytoplankton data collected for this study support the hypothesis that Canadarago Lake is returning to a less impacted state when compared to the previous (1968-1976) datasets. However, data from a single year is less than ideal for this comparison.
0
5
10
15
20
25
30
35
0%
5%
10%
15%
20%
25%
30%
35%
1925 1935 1945 1955 1965 1975 1985 1995 2005 2015 2025
Phy.
Bio
volu
me
(mm
3 ∙L-1
)
Plan
t Cov
erag
e (%
)
Year
Plant Coverage (%) Phytoplankton Biovolume (mm3•L-1)

24
Development of a longer term data set with regular phytoplankton sampling is needed for a more thorough trend analysis. It has been demonstrated that lakes whose phytoplankton has been annually monitored over several seasons will show distinctive fluctuations in magnitude of production (Reynolds 1980). The magnitude of change observed between the historical and present data sets indicate that the changes in productivity are significant. Other factors influencing trophic changes could also include recent introductions of invasive species, such as Alewives (Alosa pseudo-harengus) in 1999, zebra mussels (Dreissena polymorpha) in 2000, (Potamogeton crispus) in the 1940’s, Eurasian watermilfoil (Myriophyllum spicatum) in the 1980’s, and starry stonewort (Nitellopsis obtusa) in 2010, along with others.

25
Work Cited Albright, M.F., and H.A. Waterfield. 2012. The state of the lake Canadarago Lake, 2011. BFS
Technical Report #30. SUNY Oneonta Biological Field Station. Cooperstown, NY.
APHA, AWWA, AND WEF. 2012. Standard methods for the examination of water and wastewater 22nd Ed. American Public Health Association. Beisner, B.E., D.T. Haydon, and K. Cuddington. 2003. Alternative Stable States in Ecology. Front. Ecol. Environ. 7: 376-382. Brooking, T.E., L.G. Rudstam, J.R Jackson, Hotaling C. W., and VanDeValk A.J. 2014. Habitat
mapping of Oneida and Canadarago Lakes. Study 2: Ecology and management of Warmwater Fish Communities Job 4. Cornell Biological Field Station. Bridgeport, NY.
Brooking, T.E., J.R Jackson, L.G. Rudstam, and N.D. McBride. 2012. Fisheries surveys of Canadarago Lake, NY. Cornell Warmwater Fisheries Unit. Bridgeport, NY.
Brooks, J.I., and S.I. Dodson. 1965. Body size, and composition of plankton. Science New Series. 150: 28-35.
Carpenter, S.R., J.F. Kitchell, J.R. Hodgson, P.A. Cochran, J.J. Elser, M.M. Elser, D.M. Lodge, D. Kretchmer, X. He, and C.N. VonEnde. 1987. Regulation of lake primary productivity by food web structure. Ecology. 68: 1863-1876.
Codd, G., L Morrision, and J. Metcalf. 2005. Cyanobacterial toxins: risk managment for health protection. Toxicology and Applied Pharmacology 203: 264-272. Cox, E.J. 1996. Identification of freshwater diatoms from live material.
Chapman & Hall.
Davis, T., D. Berry, G. Boyer, and C. Gobler. 2010. The effects of temperature and nutrients on the growth and dynamics of toxic and non-toxic strains of microcystis during cyanobacteria blooms. Harmful Algae 8: 715-725. de Baar, H.J.W. 1994. Von Liebig's Law of the Minimum and plankton ecology (1899–1991). Progress in Oceanography. 33: 347-386. Ebina, J., T. Tsutsui, and T. Shirai. 1983. Simultaneous determination of total nitrogen and total
phosphorus in water using peroxodisulfate oxidation. Water Resources. 17: 1721-1726. Fuhs, G.W. 1973. Canadarago Lake eutrophication study: Lake and tributary surveys 1968-1970.
26
New York State Department of Environmental Conservation: Environmental Quality, Research and Development Unit. Albany, NY.
Harr, T.E., G.W. Fuhs, D.M. Green, L.J. Helting, S.B. Smith, and S.P. Allen. 1980. Limnology of Canadarago Lake. Lakes of New York State Volume III Ecology of East-Central NY Lakes. 3: 129-264. Academic Press, Inc., New York City, NY.
Helmut, H., C.L. Dürselen, D. Kirschtel, U. Pollingher, and T. Zohary. 1999. Biovolume calculation for pelagic and benthic microalgae. Journal of Phycology. 35: 403-424.
Hutchinson, G. 1961. The paradox of the plankton. The American Naturalist. 882: 137-143. Kishbaugh, S. 2013. Update on harmful algal blooms in New York State. NYS DEC Bureau of
Water Assessment Management. NYSFOLA 30th annual conference and membership meeting. Hamilton, NY.
Liao, N. 2001. Determination of ammonia by flow injection analysis. QuikChem® Method 10- 107-06-1-J. Lachat Instruments, Loveland, Colorado.
Liao, N. and S. Marten. 2001. Determination of total phosphorus by flow injection analysis
colorimetry (acid persulfate digestion method). QuikChem® Method 10-115-01-1-F. Lachat Instruments. Loveland, Colorado.
Margalef, R. 1958. Temporal succession and spatial heterogeneity in phytoplankton. Perspectives in Marine Biology. University of California Press. Berkeley, CA. Muenscher, W.C. 1936. Aquatic vegetation of the Susquehanna and Delaware areas. In A Biological Survey of the Delaware and Susquehanna watersheds, Suppl. 25th Ann. Rep., 1935. New York State Department of Environmental Conservation. Albany, NY. O’Neil, J.M., T.W. Davis, M.A. Burford, and C.J. Gobler. The rise of harmful cyanobacteria
blooms: The potential roles of eutrophication and climate change. Harmful Algae. 14: 313-334.
Pritzlaff, D. 2003. Determination of nitrate/nitrite in surface and wastewaters by flow injection analysis. QuikChem® Method 10-107-04-1-C. Lachat Instruments. Loveland, Colorado.
Reynolds, C.S. 1980. Phytoplankton assemblages and their periodicity in stratifying lake
systems. Holarctic Ecology. 3: 141-159.
St. Amand, A. and K. Wagner (Co-Chairs). 2013. Algal Identification Workshop. PhycoTech Inc. Saint Joseph, MI.
27
Sommer, U. 1987. Factors controlling the seasonal variation in phytoplankton species composition- A case study for a deep, nutrient rich lake. Progress in Phycological Research. 5: 123-178.
Utermöhl, H. 1958. For the perfecting of the quantitative phytoplankton methodology. Mitt. Internationale Ver. Theoretische und Angewandte Limnologie. 9: 1-38. Wehr, J.D. and R.G. Sheath. 2003. Freshwater algae of North America. Academic Press. YSI Incorporated. 2009. 6-Series multiparameter water quality sonde user manual.
Yellow Springs, OH.

28
Appendix Table 3. List of all collected phytoplankton genera for Canadarago Lake, summer of 2013. Organized by Division. Division & Genus Reference Cyanophyta (Wehr & Sheath 2003) Anabaena Chroococcus Coelosphaerium Gloeocapsa Gmphosphaeria Gonium Lyngbya Merismopedia Microcystis (1) Microcystis (2) Planktothrix Pseudanabaena Chlorophyta (Wehr & Sheath 2003) Ankistrodesmus Asterococcus Chlamydomonas Closterium Cosmarium Dictyosphaerium Dysmorphococuss Eudorina Oocystis Pediastrum Quadrigula Sphaerocystis Staurastrum Tetraspora Ulothrix Volvox Euglenophyta (Wehr & Sheath 2003) Euglena Trachelomonas Cryptophyta (Wehr & Sheath 2003) Cryptomonas Rhodomonas Chrysophyta (Wehr & Sheath 2003) Dinobryon Mallomonas Synura Tribonema

29
Dinophyta (Wehr & Sheath 2003) Ceratium Gymnodinium Peridinium Bacillariophyta (Cox 1996) Asterionella Cyclotella Cymbella Denticula Ellerbeckia Fragilaria Gyrosigma Navicula Nitzschia Stephanodiscus Surirella Synedra

30
Canadarago Lake Watershed Protection Plan

31
Introduction This publication is intended to be a comprehensive lake and watershed management plan for the community surrounding Canadarago Lake, aiming to help residents establish both social well-being in the community and sustainable ecological function within their water body. Protection of the lake’s natural beauty and environmental integrity will be mutually beneficial for the local economy, homeowners, and wildlife inhabitants. This management plan comes after years of research on the lake and watershed, including Canadarago Lake Eutrophication Study (1972), Limnology of Canadarago Lake (1980), The State of Canadarago Lake (2011), Canadarago Lake Beneficial Use Study: Hydrology and Hydraulics Study (2011), and Fisheries Survey of Canadarago Lake (2012). The Canadarago Lake watershed is comprised of five towns (Columbia, Exeter, Otsego, Richfield, and Warren), two counties (Otsego, and Herkimer), the Village of Richfield Springs, and two New York State Department of Environmental Conservation (NYS DEC) regions (4 and 6) (Figure 1). We began the process of drafting a lake and watershed protection plan by reaching out for partners and establishing the Canadarago Lake Watershed Partnership. This partnership includes the following agencies and organizations which have a vested interest in Canadarago Lake and/or its watershed:
• Canadarago Lake Improvement Association (CLIA)*Founding entity • Otsego County Soil and Water Conservation District (SWCD) • Herkimer County Soil and Water Conservation District (SWCD) • SUNY Oneonta Biological Field Station (BFS) • Town of Richfield • Town of Exeter • Town of Otsego • Town of Columbia • Village of Richfield Springs • NYS Department of Environmental Conservation: Region 4 Office (NYS DEC) • Otsego County Planning Department • Otsego Land Trust (OLT) • Otsego County Conservation Association (OCCA) • Catskill Regional Invasive Species Partnership (CRISP)
Goals and Priorities This partnership has enabled us to pool our resources and come together as a community to develop a bottom-up management plan for a local keystone natural resource. Following upgrades to the village of Richfield Springs wastewater treatment plant in 1973, the New York State high phosphate detergent ban in the same year, and overall reductions in watershed nutrient loading between 1970 and 2010, water quality within Canadarago Lake has been on the upswing. This partnership has been charged with continuing these types of efforts within the lake and watershed to maximize future increases in overall lake health. Numerous groups, municipalities, and organizations are concerned with the water quality and management of natural resources

32
within the Canadarago Lake watershed. Future public policy needs to focus on developing effective solutions to the following issues at a basin-wide scale. Many of these efforts are large scale endeavors, which we recognize may require outside support and/or some degree of lake and watershed support personnel to help with the coordination, implementation, and structuring of these projects. By tackling the issues currently facing Canadarago Lake we hope to secure the overall integrity of the area- creating a more desirable destination for people and their families, improving the quality of life for year round and seasonal residents, and increasing property values within the region, as they are strongly tied to the condition of the lake. About the Lake
Canadarago Lake is a dimitic lake of glacial origin located in northern Otsego County, NY. The lake sits within the north-eastern section of the Allegany plateau, helping to make up the head waters of the Susquehanna River and Chesapeake Bay watersheds. The lake’s 67 square mile drainage basin extends northward, and is comprised of large portions of both Otsego and Herkimer Counties. Canadarago Lake has a maximum depth 44 ft and a surface area of 1,934 ac, and has long been considered naturally eutrophic (Fuhs 1973; Harr et al. 1980). An Island, known as Deowongo Island, is centrally located in the lake approximately 400 yards from the eastern shoreline. The lake ecosystem supports a diverse warmwater fishery, containing 37 species, making Canadarago a popular fishing destination for anglers from across greater New York State. Canadarago Lake is also home to various other types of recreational activities including motor cruising, rowing, canoeing, kayaking, and swimming. The village of Richfield Springs, located north of the lake, is the largest population center within the watershed, being home to approximately 1,250-1,500 people. The lakeshore community has long been considered a blue collar demographic with many residents and users coming from nearby locations looking to relax, recreate, and enjoy the lake.
Survey Results In order to establish the primary social needs of local and seasonal residents, a blanket survey was distributed by mail throughout the watershed. This survey was comprised of 2,008 mailings, using the best available mailing list provided by the Otsego County Planning Department. Of the 2,008 surveys 288 were returned, with a return percentage of 14.4%. The key environmental issues identified by this survey included: 1.Shoreline flooding and lake level, 2.Shoreline sanitary waste and septic systems, 3.Exotic species introductions, and 4.Algal blooms and aquatic plant growth. It was also noted that there was strong agreement between lakeshore and watershed residents regarding these top environmental issues. By establishing the primary social needs of the local residents, it was possible to develop a hierarchy for addressing issues within the watershed based upon both human need and recent scientific reports. Lake Issues Lake Level
Canadarago Lake drains to the south through the lake’s outlet, Oaks Creek. A small concrete weir known as Panther Mountain Dam is located approximately one mile downstream of the lake along Oaks Creek, and serves to stabilize minimum lake levels during the summer

33
months. A 2009 hydrologic survey of Oaks Creek showed a gradual increase in streambed elevation between the dam and its confluence with downstream Lidell and Phinney Creeks (Figure 2). This elevated stream bed creates a backup of water that limits outflow from the lake and reduces the effectiveness of the existing and proposed spillway. Dredging of Oaks Creek downstream of the dam, as described in Malcolm Pirnie, Inc. 2011, was found to be non-beneficial to creek flow. The study also indicated that a significantly increased amount of dredging would be required in order to create the proper slope necessary to benefit the drainage time of the lake, and was not further evaluated due to the potential significant impacts on Oaks Creek and associated costs. Other issues not formally investigated in Malcolm Pirnie, Inc. 2011 include, potential negative impacts on downstream infrastructure, draining of associated wetlands within the Oaks Creek basin, and lack of permitting support. Removal of the dam and spillway was found to maximize the lake drainage and flow of Oaks Creek, but would eliminate the ability to maintain a higher water surface elevation (WSEL) for recreational use.
Approach
Repair of the dilapidated dam is necessary as it poses an immediate risk if not addressed. According to Malcolm Pirnie, Inc. 2011, the existing dam and spillway should be repaired in order to maintain the current functionality, and the concrete weir elevation should be lowered to allow for a lower winter level thereby creating additional spring flood storage. However, no modifications to the existing structure could both significantly reduce peak flood levels and maintain the existing summertime recreational lake level. Upon repair to the existing spillway, the concrete weir should be lowered one foot (WSEL 1,277 ft) below current height. This will allow for the installation of an additional I-beam and increase spillway control.
Mitigation of flood impacts should also be considered. Current weather patterns in New York State, specifically the Catskill Region, indicate a trend in increased average annual precipitation and intensity of storm events over the past 50 years (Figure 3). Continued increases in regional precipitation and runoff should be expected with continued global climate change (Burns et. al 2007). A comprehensive appraisal of waterfront properties should be performed to identify high risk areas. Techniques for dealing with these areas could include the following.
• Developing a low lying property buyout plan. • Physically raising properties and critical public infrastructure out of the floodplain. • Relocating, eliminating, or establishing publically owned treatment facilities for low
lying septic systems. • Increase hydraulic retention in the upper watershed, through wetland creation and storm
water control. • Increase law enforcement at the public boat launch during flood events to prevent boat
access and the subsequent negative impacts of boat wake on inundated properties.
Sanitary Waste As of 2013, there are an estimated total of >625 homes, cottages, or camps along the 10 miles of shoreline surrounding Canadarago Lake. The vast majority of these dwellings rely on septic systems (onsite wastewater treatment systems) for sanitary waste treatment. The watershed

34
partnership has raised concerns about failing lake shore septic systems and their potential role in external nutrient loading and as a source of harmful pathogens. The effectiveness of lake shore septic systems are typically limited by the depth and porosity of soil (seasonally high ground water), depth to restrictive layers (fragipan, bedrock, etc.), surface area available (footprint), and distance from the respective water body (NDWRCDP 2004). Poor site conditions compounded by repeated flooding, and the recently reported 51% septic failure rate on neighboring Otsego Lake (McIntyre 2009), have all added to the septic concerns on Canadarago Lake. Recent shoreline fecal coliform bacteria testing (2008-2013) has been inconclusive in the documenting full extent of the problem (Figure 4). According to Part 703 of the NYS Surface Water and Groundwater Quality Standards and Groundwater Effluent Limitations, the monthly geometric mean, from a minimum of five examinations, shall not exceed 200 colonies per 100 ml for recreational surface waters. Out of 109 samples collected, only one recorded reading was found to be above this threshold and was extremely high, 19 July 2010 in shoreline Zone 5 at >2,000 colonies/100 ml. Monthly fecal coliform bacteria averages were found to generally increase throughout the recreational season, peaking in July, suggesting that seasonal use may have an important impact on bacteria levels. A comprehensive septic system inspection program would be needed to draw further conclusions from this study. Approach
Community support is very limited for a comprehensive septic system inspection program, and given the high variability in lake water level it is questionable if a septic system inspection program would be effective in mitigating the issues at hand. Ultimately, any onsite wastewater treatment system inundated with water is in failure. Resources would best be used to establish a municipal sewer district around Canadarago Lake to provide wastewater treatment for shoreline residents. Lakes with municipal sewer districts tend to more closely resemble undeveloped water bodies; showing relatively lower levels of eutrophication when compared to lakes with high densities of personal shoreline septic systems (Moore et al. 2003). Canadarago Lake and its community are in a unique situation where the overall size of the lake is conducive to such a system and the lake is in close proximity to an active wastewater facility, the Richfield Springs Wastewater Treatment Plant which is located 0.5 mi (0.8 km) north of the lake. A municipal district could also potentially provide municipal drinking water to lakeshore residents, as many currently draw from the lake or wells drilled in the immediate vicinity, and Canadarago Lake is not zoned as a drinking water supply (New York State Department of Health 2011). These factors have led the partnership to strongly consider this option, and evaluate the potential of this prospective project with a feasibility study which is needed for further decision making. Revisions to this section of the plan are expected upon completion of that report.
• Conduct a shoreline municipal sewer and water district feasibility study. • Update shoreline zoning laws to reflect an environmentally conscious minimum property
size. Lakeshore property sizes have the potential to change dramatically upon completion of municipal districts if not zoned properly.
35
Richfield Springs Wastewater Treatment Plant The Richfield Springs Wastewater Treatment Plant is a 0.60 million gallon per day (MGD) municipal sewer system that services an estimated 1,250-1,500 people within the village of Richfield Springs, NY. The plant discharge is located 0.5 mi north of the lake along Ocquions Creek within the Canadarago Lake watershed (Figure 1). The facility has been updated as recently as 2010, with many updates over the years including the implementation of secondary treatment phosphorus (P) removal in 1972, and other subsequent improvements in 1998, 1992 and 2002. Independent sampling of the plant effluent conducted by the SUNY Oneonta BFS (2008-2011) indicated that the plant was consistently below the total phosphorus (TP) limit of 0.5mg/L or 913 lbs/year as regulated by the state (Albright & Waterfield 2012; SPDES Permit #: NY0031411). Prior to phosphorus removal, it was calculated that 50% of the phosphorus budget entering the lake originated from the plant outflow (Helting & Sykes 1973). Increases in lake water quality over the past 40 years are generally attributed to this reduction in nutrient loading. Nitrogen (N) is not removed from effluent, the ammonia form is limited to 2.2 mg/L (June 1-Oct. 31) and 7.0 mg/L (Nov. 1- May 31). Approach
The success and proper functionality of the plant continues to be a concern of Canadarago Lake residents and lake users. In the interest of water quality and human health, the partnership would like to see that the Richfield Springs Wastewater Treatment Plant maintain compliance with their associated SPDES permitting. As part of the NYS Sewage Pollution Right to Know Act (2012), the partnership would expect that any overflows or discharges of untreated or partially untreated sewage not in compliance with SPDES Permit #: NY0031411 be reported to the Otsego County Department of Health (along with other required agencies). This notification system is designed to protect potential lake users and allow them to make informed decisions about fishing, swimming, and recreation in affected waters.
Primary Production 1. Algal Blooms
Lakes are often in a delicate balance between weed based and algal based primary production. Internal loading of phosphorus, caused by the depletion of oxygen within hypolimnion during summer stratification, periodically results in seasonal blue-green algae (cyanobacteria) blooms in and around the period of fall overturn. These blooms are potentially harmful to human health, since they can commonly produce cyanotoxins. Fortunately, minimal recreational activity is taking place on the lake during this time period (October- November), lowering the probability of human interaction with a toxic bloom. Concentrations of blue-green algae within the lake have decreased overall since the 1960’s and the algal community appears to be recovering from long periods of cultural eutrophication (Bailey 2014). It is presumed that the majority of public concern is generated by the presence of summertime, near shore aggregations of filamentous mat/surface scum forming algal types, which were sporadically observed in 2013. Readily available shoreline nutrients stemming from failing septic systems and/or runoff are assumed to play a key role in the formation of these near shore scums/mats. These surface
36
aggregations can then be further concentrated by wind and wave activity further impacting near shore recreation.
2. Aquatic Plants (Macrophytes)
Canadarago Lake has a relatively large littoral zone (areas less than 18 ft depth; Brooking et al. 2014). The littoral zone within Canadarago Lake accounts for 30% of the benthic habitat and 65% of the lake’s total volume. This area of the lake is capable of supporting large amounts of aquatic vegetation. Studies have indicated that the lake has had a long history of predominant plant growth (Muenscher 1936; Harr et al. 1980; Albright & Waterfield 2012). The introduction of zebra mussels has also been documented to stimulate increased plant productivity, due to associated increases in water clarity, and deposition of nutrient rich detritus from the water column to the lake bottom though filter feeding. The use of large scale aquatic herbicide treatments, mechanical harvesting, and/or biomanipulation to reduce aquatic plant populations can often have undesirable results (harmful algal blooms, fishery decline, and resurgence of least desirable weeds). Aquatic herbicide treatments and mechanical harvesting are typically considered to be non-selective strategies, impacting both target and non-target plant species, favoring fast-growing exotic species in subsequent growth years. The impacts on non-target organisms varies when considering biomanipulation strategies, selective organisms such as the milfoil weevil (Euhrychiopsis lecontei), tend to limit undesirable outcomes when compared to non-selective organism such as grass carp (Ctenopharyngodon idella). In general, aquatic plant beds offer positive value for both the aquatic food web and sportsmen by providing essential fish habitat.
Approach
The partnership feels that the best way to continue to manage excessive aquatic plant and algal growth (primary production) is through a long term nutrient reduction strategy, with localized clearing of vegetation as needed (around docks, swimming areas, etc.).
• If aquatic plant growth is detrimental to recreational use, we ask that property owners and public facilities clear aquatic vegetation from localized areas surrounding docks and swimming areas as needed.
• Some potential removal options may include: hand harvesting, hydroraking, and/or benthic barriers. (State and local regulations may apply; contact NYS DEC region 4 office for more information)
• For visible blue-green algae blooms, a warning should be displayed on the CLIA website: http://www.canadaragolake.com
Exotic Species 1. Non-native species not currently in Canadarago Lake
The Canadarago Lake public boat launch is operated by the New York State Office of Parks Recreation and Historic Preservation (OPRHP) through the Glimmerglass State Park office located on neighboring Otsego Lake. The public boat launch is presumed to be the gateway for many of the invasive exotics which have become established within Canadarago Lake. The 2013 boat launch data shows that Canadarago Lake is a popular destination, with boaters coming from
37
across greater New York State. There is also a high risk of aquatic invasion from the Erie Canal which is located only 15 miles north of the lake (Coe 2013). Past introductions of invasive species have had negative impacts on the lake’s recreational use, shoreline and household infrastructure, aquatic food web structure, ecological community dynamics, and game fishery.
Approach
The prevention of future introductions is a far easier and more cost effective strategy for the management of invasive species, when compared to the eradication of a currently established population. The prevention of future invasive species introductions to Canadarago Lake is a top priority of our partnership. Some strategies for accomplishing this goal are as follows.
• Stimulate community awareness about the potential impacts of invasive species through outreach and education.
• Continue participation in the Catskill Regional Invasive Species Partnership (CRISP) boat launch stewardship program for the monitoring and stewardship of the Canadarago Lake public boat launch.
• Pursue high pressure hot water washing facilities for the Canadarago Lake public boat launch.
• Consider local town legislation against the transport of harmful invasive species.
2. Alewives Alewives (Alosa pseudo-harengus) were first discovered in Canadarago Lake in 1999.
Alewives have the potential to negatively impact the aquatic food web by consuming large numbers of zooplankton and larval fish. This can contribute to a rise in algal dominance and have a negative impact on the success of native fish reproduction.
Approach
Invasive alewife populations can theoretically be kept in check through the establishment or supplementation of a predatory fish population, a strategy is known as a top-down control. The ongoing walleye (Sander vitreus) stocking program taking place in Canadarago Lake is hoped to help control alewife populations though increased predation while supplementing a desirable game fish population for anglers.
• Continue the NYS DEC walleye stocking program (40,000 fall fingerlings per year).
3. Zebra mussels Based upon the largest individuals collected in 2002 it is estimated that zebra mussels
(Dreissena polymorpha) have been present in Canadarago Lake since at least 2001, and that the initial invasion occurred sometime in 2000 (Horvath & Lord 2003). Zebra mussels have the ability to outcompete, live on, and kill native unionid clams. They also disrupt the food web through intensive filter feeding and deposition of detritus on the lake floor. Shoreline infrastructure and swimming areas have all been negatively impacted by the establishment of zebra mussels. In Canadarago Lake, they are of particular concern due to the relatively large amount of suitable habitat that exists within the lake, increasing the degree in which they continue to impact the lake.

38
Approach • At this point in time no management strategies exist for the control of zebra mussels. • Provide lake users and shoreline property owners with the proper information about how
to deal with and prevent the spread of zebra mussels to other uninfested water bodies.
4. Exotic plants (Macrophytes) Canadarago Lake contains three major invasive exotic plant species, curly-leaf pondweed
(Potamogeton crispus), Eurasian watermilfoil (Myriophyllum spicatum), and the macroalgae starry stonewort (Nitellopsis obtusa). All of these species have contributed to the displacement of native species and overall decline in plant biodiversity since the 1930’s (Muenscher 1936; Harr 1980; Albright & Waterfield 2012). Since its introduction to the lake sometime in the 1940’s curly-leaf pondweed has become one of the most abundant if not the dominant pondweed within the lake. Eurasian watermilfoil was first documented in the lake in the late 1980’s and also quickly became one of the most abundant plants in the lake. The most recently established exotic macrophyte in Canadarago Lake is starry stonewort. This species of macroalgae was first discovered in 2010, and is similar to the native musk grass (Chara vulgaris). Currently it is unclear what effects it will have on the plant community over time. It has the ability to form dense mats along the benthic substrate, choking out other plant species, and potentially impacting fish spawning habitat. Preliminary reports indicate that starry stonewort is becoming more common in the lake’s north end and may have negative impacts on the native macrophyte community, and recreational use of the lake.
Approach
• Continue to monitor the lake for changes in exotic plant populations, specifically looking for changes in starry stonewort abundance.
• Allow aquatic insects, milfoil weevil (Euhrychiopsis lecontei) and pyralid moth (Acentria ephemerella), to continue to control Eurasian watermilfoil populations.
Fishery Canadarago Lake supports a diverse warmwater fish community (containing 37 species),
making it a popular open-water and ice fishing destination for anglers from across greater New York State. Predator fish populations within the lake include largemouth bass (Micropterus salmoides), smallmouth bass (Micropterus dolomieu), and chain pickerel (Esox niger). Yellow perch (Perca flavescens) and sunfish (Lepomis sp.) are the dominant forage species, along with the recently introduced alewife (Alosa pseudoharengus) (Brooking et al. 2011). Ongoing studies of the lake have confirmed poor recruitment of walleye and yellow perch in recent years (2005-2014). Illegally introduced to the lake in the late 1990’s, alewife have the ability to effectively prey on larval fish. Research indicates that walleye numbers could decline dramatically from alewife predation, and the effects on larval yellow perch could be similar but are not anticipated to be as dramatic (Brooking et al. 2011). The supplemental stocking of walleye is intended to offset the impacts of alewife predation on natural fish populations. In theory, the supplementation of walleye should boost the number that survive to adulthood and become top
39
predators, leading to a food web structure in which walleye primarily consume small-medium sized alewife.
Approach
The fisheries of Canadarago Lake has been intensively studied by the Cornell Warmwater Fisheries Unit (CWFU) in partnership with the New York State Department of Environmental Conservation (NYS DEC) since the early 1970’s. This contract will expire at the end of this sampling year (2014). Currently there are no plans of renewing this contract. The NYS DEC Region 4 office will continue their efforts, including both fall stocking and fishery monitoring program.
• Increase stakeholder input in fisheries management. • Continue the NYS DEC walleye stocking program (40,000 fall fingerlings per year)
along with continued monitoring including electroshocking and bi-annual gillnetting surveys.
• Update strategy as needed based on the results of NYS DEC monitoring efforts.
Recreational Use According to the public opinion survey, the major recreational uses of Canadarago Lake include relaxing at residence, swimming, rowing/canoeing/ kayaking, motor cruising, and fishing. The vast majority of people surveyed felt that public access to the lake is sufficient and that the present recreational patterns on the lake are of little concern. The greatest use of the lake occurs between the hours of noon and six in the evening, with greater use on weekends and holidays. Approach
• Support New York State boating regulations (NYS Navigational Law §30-79), paying special attention to the following: 1. Boat vessel speed is limited to 5 mph when within 100 feet of the shore, a dock, pier,
raft, float, or anchored boat. This regulation is still in effect regardless of the presence or absence of no-wake zone buoys.
2. For houseboats, discharge of any sewage is not permitted on any land locked lake which is located completely within the borders of New York State. Sewage must be pumped out ashore using the proper pump-out equipment and/or facility.
• Limit public boat launch access during flood events due to the negative impacts of boat wake on inundated properties.
• Pursue funding and gather local support for the installation and maintenance of no-wake zone buoys.
Shoreline Preservation The majority of the Canadarago Lake shoreline was once surrounded by miles of wetland (Muenscher 1936), providing a vegetative buffer protecting the shoreline and reducing the impact of water level fluctuation. Today much of this has been converted to residential development, for recreation and enjoyment of the lake’s natural beauty. Lakescaping is a lawn

40
design that lowers care and maintenance cost, reduces shoreline erosion/runoff, discourages or eliminates migratory bird (geese) impacts on lawn areas, and increases shoreline terrestrial and aquatic biodiversity (Henderson et al. 1999). Approach
The goal of lakescaping is to return 50-75% of the shoreline to a vegetated state, replacing monoculture lawns with a diversity of native wetland plants, shrubs, and trees- establishing shorelines which can withstand periods of high water and abuse, while restoring the lake’s natural beauty and increasing lakeshore property values (Figure 6).
• Where possible, encourage lake shore property owners to return sections of shoreline to native vegetation (Figure 6).
Blueway Trail, Otsego Land Trust (OLT) Land trusts can serve as important partners for the conservation of natural resources and wildlife habitat in ecologically sensitive areas. The Otsego Land Trust (OLT) is a private non-profit organization that works with landowners and communities to protect healthy lands, clean waters, and the rural culture and history of the Upper Susquehanna River region, now and into the future. The Blueway Trail is a major land acquisition program focused on conservation of lands within the Upper Susquehanna basin, including the Canadarago Lake watershed (Figure 1). The Blueway itself is a series of OLT owned properties and protected lands along these waters that provide public recreation (fishing, hiking, paddling, and bird watching), educational opportunities, and foremost, environmental preservation. On the shores of Canadarago Lake and Oaks Creek, OLT owns and stewards a series of public access sites and easement-protected properties (most notably Deowongo Island and Fetterley Forest). A conservation easement is a voluntary legal agreement between a landowner and a land trust that permanently conserves a parcel of land, protecting the integrity of the land while remaining in private hands. Approach Continued partnership with the Otsego Land Trust and the Blueway Trail has the potential to be an important watershed conservation resource for the community surrounding Canadarago Lake. Conservation easements can provide individual landowners with ability to protect the lake and the conservation value of their lands while still owning, working, and enjoying them. The OLT’s commitment to water quality improvement through wetland preservation could help support a low lying property buyout plan, should funding become available. The Blueway project also offers the ability to increase public awareness about issues affecting Canadarago Lake through OLT sponsored public outreach and education. Streams and Tributaries Agricultural Management
Land under agricultural production is currently estimated to account for 34% of the watershed (14,490 ac) (Table 2) (NLCD 2001; Homer et al. 2007). This is down from previous studies conducted in the 1970’s which estimated agricultural lands at 51% (21,980 ac) (Harr et al. 1980). This change in land use has generally resulted from the return of marginal farm land

41
back to woody or forested areas. In agricultural watersheds it has been shown that up to 90% of annual algal-available phosphorus (P) export comes from only 10 percent of the land area during a few relatively large storms (Pionke et al. 1997). Storm event monitoring within the lake’s basin would suggest that large storm events play a crucial role in the overall nutrient budget of Canadarago Lake (Bailey & Albright 2010).
Approach
Long term management and reduction of agricultural runoff within the watershed is intended to support both local farmers and lake water quality by retaining nutrients (N, P) on agricultural lands and helping to prevent the accelerated eutrophication of the lake. The partnership would like to continue to support the efforts of the SWCD, NRCS, and the farming community at large through the implementation of agricultural best management practices (BMPs). These efforts should focus on a site’s potential for surface runoff and/or erosion. Areas of high transport potential should be considered first and stabilized accordingly. Some steps in this process could include.
• Identification and remediation of specific locations of mass erosion. • Increased riparian buffer zones (tree and vegetation planting). • Implementation of various agricultural BMPs (conservation tillage, contour farming, crop
rotation, terraces, ground cover management) and barnyard management projects.
Logging and Silviculture Flowing water in and around logging operations has a tremendous ability to transport
loose soil. In general, every gallon of water flowing down a skid trail or through a log landing has the capacity to carry away several pounds of sediment (Chemung County SWCD 1997). Over time this water has the potential to wash away hundreds of tons of forest soil, negatively impacting both forest regeneration and downstream aquatic ecosystems.
Approach
The use of forestry BMPs reduces the amount of forest soil that is washed away in adverse weather conditions, helping to minimize the impacts on localized water bodies. Any logging operations within the Canadarago Lake watershed should follow the recommended practices outlined in the Silviculture Management Practices Catalog (NYS DEC 1993).
• Encourage landowners to properly plan logging operations using forestry BMPs to ensure successful and sustainable timber harvests.
• Support post-harvest stabilization efforts in highly erosive areas. • Household tree and vegetation removal in environmentally critical areas, including the
lake shoreline, should be conducted in accordance with state and local regulations. Local Shoreline Protection Area laws do apply.
Roadway Maintenance
The New York State Department of Transportation (NYSDOT) offers environmentally related training which is available to all highway superintendents and staff. This is in an effort to maximize effectiveness of environmental programs and designs.
42
Approach • Work with local highway departments to optimize area road maintenance practices with
the intent to limit nutrient contributions to the lake from road maintenance operations within the watershed, paying close attention to the roadways immediately adjacent to the lake.
• Support SWCD in efforts to reduce erosion along municipal infrastructure. Including such practices such as hydroseeding and reinforcement of unstable banks and ditches.
Herkimer Creek Sedimentation In recent years there has been much concern over the sand bar developing at the southern end of Canadarago Lake. This sand bar is a raised bed of sediments occurring along the lake bottom at the confluence of Herkimer Creek and the extreme southern end of Canadarago Lake near the outlet of Oaks Creek, approximately one mile upstream of the dam (Figure 1). Studies have shown that Herkimer Creek is a massive contributor of suspended sediments and limiting nutrients (N, P) under high flow or storm runoff conditions (Bailey & Albright 2010). The sand bar was found to limit the degree to which the lake water level could be lowered to provide flood storage in advance of springtime high runoff conditions, but any gain in flood storage from removal of the sand bar was found to be negligible under flood conditions due to the controlling downstream streambed elevation (Malcolm Pirnie Inc. 2011). The creation of the Panther Mountain Dam in 1964 is presumed to have exacerbated the natural growth of this formation by raising the minimum lake level to WSEL 1,278 ft and reducing the potential ability of Oaks Creek to flush these sediments downstream. However, the primary cause of this sand bar is the high risk watershed of Herkimer Creek, which is susceptible to storm runoff and high rates of sedimentation during large rain events. Approach The removal of the sand bar would increase the aesthetics and navigational functionality of the southern end of the lake but addressing the sand bar alone would prove fruitless due to the high risk of its return in the near future. The partnership has concluded that the sediment load from Herkimer Creek must be addressed and reduced before taking any action against the existing sand bar. Some potential runoff attenuation projects within the Herkimer Creek basin include the following.
• Identification and remediation of specific locations of mass erosion. • Increase riparian buffer zones (tree and vegetation planting). • Consider sediment retention basins along Herkimer Creek before the confluence with
Canadarago Lake. • Increase hydraulic retention in the upper watershed, through wetland creation and storm
water control. • Implementation of various agricultural and forestry BMPs (conservation tillage, contour
farming, crop rotation, terraces, ground cover management).

43
Continued Monitoring Baseline Monitoring
As part of their fishery study the CWFU annually collected a large amount of water quality data on Canadarago Lake, including monthly (May- October) temperature, dissolved oxygen, and water clarity (Secchi disk); surface total phosphorus, nitrate, and chlorophyll-a; and a vertical zooplankton tow. This study has come to an end as of 2014. The NYS DEC Division of Water last sampled Canadarago Lake in 2009, and are not scheduled to return until 2018. Water quality monitoring is an important tool for quantifying improvements in the lake as a result of management efforts.
Approach
• Work to reestablish an annual or semiannual sampling regime on the lake (May-October). • Continue the NYS DEC fisheries monitoring including electroshocking and bi-annual
gillnetting surveys.
Invasive Plant Monitoring Early detection is crucial when trying to prevent the establishment of newly introduced
aquatic invasive species. CRISP boat launch stewards should be trained to identify important invasive/exotic plants. Some major invasive plants of concern that are currently not present in Canadarago Lake as of 2013 include, Brazilian elodea (Egeria densa), European frogbit (Hydrocharis morsus-ranae), hydrilla (Hydrilla verticillata), and water chestnut (Trapa natans).
Approach
• In cooperation with volunteer members of the CLIA, the CRISP boat launch stewards should conduct an annual summertime plant survey within the lake in search of any newly established invasive plants. Submergent plants should be sampled using a plant rake and a modified version of the Point Intercept Rake Toss Relative Abundance Method (PIRTRAM) (Lord & Johnson 2006).
• Any new populations of invasive plants should be reported initially to the SUNY Oneonta Biological Field Station (BFS) and dealt with accordingly based on initial evaluation at that time.
• All lake users should be keeping an eye out for water chestnut. It was stopped from entering the lake twice in the summer of 2013 (Coe 2013). If discovered early it can be carefully removed and eradicated. If you think you have seen water chestnut on the lake please contact: [email protected]

44
Work Cited Albright, M.F. and H.A. Waterfield. 2012. The state of the lake Canadarago Lake, 2011. BFS
Technical Report #30. SUNY Oneonta Biological Field Station. Cooperstown, NY.
Bailey, C.L. and M.F. Albright. 2010. Continued monitoring of Canadarago Lake and its tributaries. In 42nd Annual Report (2009). SUNY Oneonta Biological Field Station. Cooperstown, NY.
Bailey, C.L. 2014. Monitoring of seasonal algal succession and characterization of the phytoplankton community: Canadarago Lake, Otsego County, NY. M.S. thesis. SUNY Oneonta Biological Field Station. Cooperstown, NY.
Brooking, T.E., J.R Jackson, L.G. Rudstam and N.D. McBride. 2012. Fisheries surveys of Canadarago Lake, NY. Cornell Warmwater fisheries Unit. Bridgeport, NY.
Brooking, T.E., L.G. Rudstam, J.R Jackson, C.W. Hotaling and A.J. VanDeValk. 2014. Habitat mapping of Oneida and Canadarago Lakes. Study 2: Ecology and management of Warmwater Fish Communities Job 4. Cornell Biological Field Station. Bridgeport, NY.
Burns, D.A., J. Klaus and M.R. McHale. Recent climate trends and implications for water resources in the Catskill Mountain region, New York, USA. Journal of Hydrology. 336: 155-170.
Carlson, R.E. 1977. A trophic state index for lakes. Limnology and Oceanography. 22: 361-369. Chemung County SWCD. 1997. Best Management Practices (BMPs) during timber harvesting
operations. Horseheads, NY.
Coe, E. J. 2013. Canadarago Lake watershed stewardship end-of-year report. Prepared for the Canadarago Lake Improvement Association. Richfield Springs, NY.
Fuhs, G.W. 1973. Canadarago Lake eutrophication study: Lake and tributary surveys 1968-1970. New York State Department of Environmental Conservation: Environmental Quality, Research and Development Unit. Albany, NY.
Harr, T.E., G.W. Fuhs, D.M. Green, L.J. Helting, S.B. Smith and S.P. Allen. 1980. Limnology of Canadarago Lake. Lakes of New York State Volume III Ecology of East-Central NY lakes. 3: 129-264. Academic Press, Inc., New York City, NY.
Helting, L.J. and R.M. Sykes. 1973. Sources of nutrients in Canadarago Lake. Journal Water Pollution Control Federation. 45:145-156.

45
Henderson, C.L., C. Dindorf and F. Rozumalski. 1999. Lakescaping for wildlife & water quality. Minnesota Department of Natural Resources. Saint Paul, MN.
Homer, C., Dewitz, J., Fry, J., Coan, M., Hossain, N., Larson, C., Herold, N., McKerrow, A., VanDriel, J.N. and J. Wickham. 2007. Completion of the 2001 national land cover database for the conterminous United States. Photogrammetric Engineering and Remote Sensing.73: 337-341.
Horvath, T.G. and P.H. Lord. 2003. First report of zebra mussels (Dreissena polymorpha) in Canadarago Lake. In 35th Annual Report (2002). SUNY Oneonta Biological Field Station. Cooperstown, NY.
Lord, P.H. and R.L. Johnson. 2006. Aquatic plant monitoring guidelines. NYS DEC Division of Water. Albany, NY.
Malcolm Pirnie, Inc. 2011. Canadarago Lake Beneficial Use Study. Prepared for the Otsego County Soil & Water Conservation District. Cooperstown, NY.
McIntyre, W. 2009. Otsego Lake management program for onsite wastewater treatment systems (OWTS). Unpublished. Cooperstown, NY.
Moore, J.W., D.E. Schindler, M.D. Scheuerell, D. Smith and J. Fodge. 2003. Lake eutrophication at the urban fringe, Seattle Region, USA. Ambio. 32: 13-18.
Muenscher, W.C. 1936. Aquatic vegetation of the Susquehanna and Delaware areas. In A Biological Survey of the Delaware and Susquehanna watersheds, Suppl. 25th Ann. Rep., 1935. New York State Department of Environmental Conservation. Albany, NY.
National Decentralized Water Resources Capacity Development Project (NDWRCDP). 2004. Creative community design and wastewater management. NDWRCDP Project Number: WU-HT-00-30. University of Rhode Island Cooperative Extension. Kingston, RI.
NYS DEC. 1999. Part 703: Surface water and groundwater quality standards and groundwater effluent limitations. Environmental Conservation Law. Albany, NY.
NYS DEC. 2013. Sewage pollution right to know act. Section 17-0826-a. Conservation Law. Albany, NY.
NYS DEC. 2013. Village of Richfield Springs WWTP SPDES Discharge Permit. SPDES Permit number: NY0031411. Albany, NY.
NYS DOH. 2011. Subpart 5-1 - Public water supplies. Public Health Law, Section 225. Albany, NY.
46
NYS Legislature. Laws of New York. NAV – Navigation §30-79. Albany, NY. Pionke, H.B., W.J. Gburek, A.N. Sharpley and J.A. Zollweg. 1997. Hydrologic and chemical
controls on phosphorus loss from catchments.
Phosphorus Loss to Water from Soil to Water. 225–242. Commonwealth Agricultural Bureau International (CABI). Cambridge, UK.
Silviculture Management Practices Sub-Committee of the NYS Nonpoint Source Management Practices Task Force. 1993. Silviculture management practices catalogue for nonpoint source pollution prevention and water quality in NYS. Albany, NY.
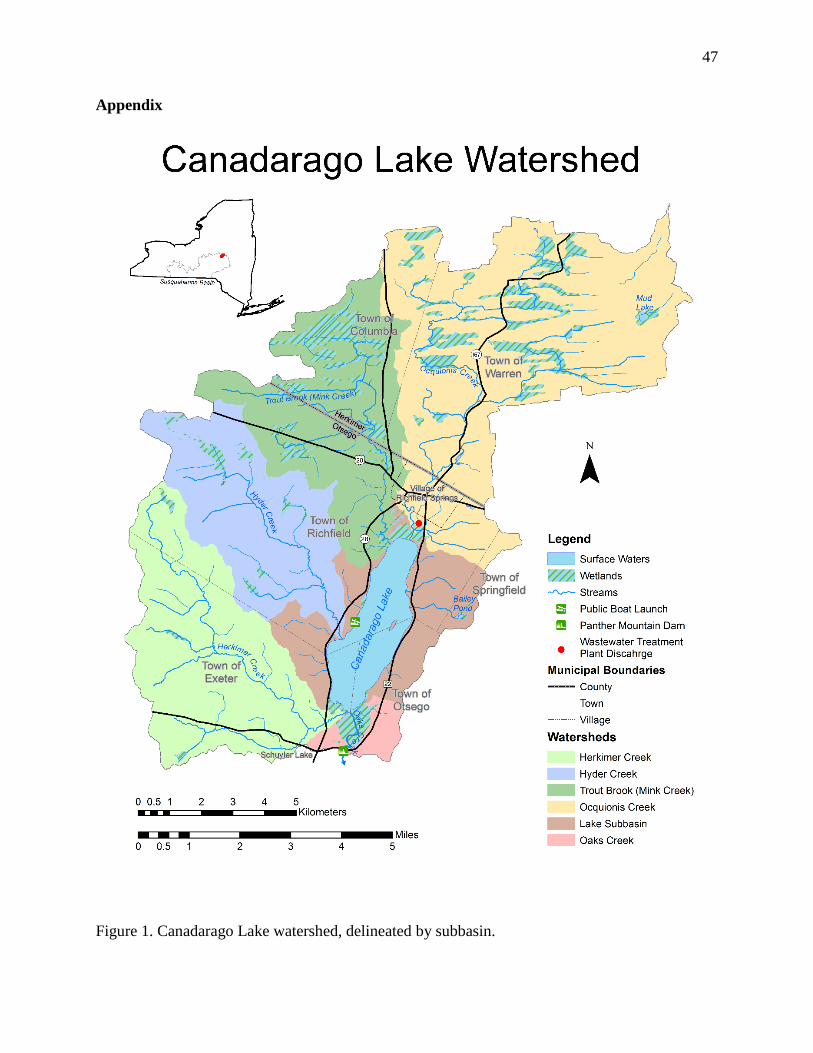
47
Appendix
Figure 1. Canadarago Lake watershed, delineated by subbasin.

48
Table 1. Important measures concerning the management of Canadarago Lake. Lake Statistics Surface Area 1,933.97 ac 782.65 ha Max Depth 43.96 ft 13.40 m Mean Depth 24.75 ft 7.54 m Relative Depth 42.44 % Volume 1.56 x10¹⁰ gal 5.9 x10⁷ m3 Max Length 4.04 mi 6.50 km Max Eff. Length 4.04 mi 6.50 km Max Width 1.38 mi 2.22 km Max Eff. Width 1.38 mi 2.22 km Mean Width 0.75 mi 1.20 km Shoreline Length 9.97 mi 16.05 km Shoreline Development 1.62 Watershed to Lake Ratio 22:1 Areal Hypolimnetic Oxygen Deficit (AHOD) 1.10 mg·m-2day-1
Trophic State Index (1990-2013) (Carlson 1977) 47 (Meso-Eutrophic)
Table 2. Land use statistics for the Canadarago Lake Watershed (NLCD 2001; Homer et al. 2007).
Watershed Statistics Land Use ha ac mi2 % Forest 9,489.31 23,437.78 36.62 54.38 Agriculture 5,866.69 14,490.22 22.64 33.62 Wetland 973.71 2,404.98 3.76 5.58 Parks and Mowed Areas 741.63 1,831.75 2.86 4.25 Residential 191.95 474.10 0.74 1.10 Open Water 174.50 431.00 0.67 1.00 Commercial, Industrial 8.73 21.55 0.03 0.05 Rock, Quarry, Gravel 3.49 8.62 0.01 0.02 Total 17,450.00 43,100.00 67.34 100
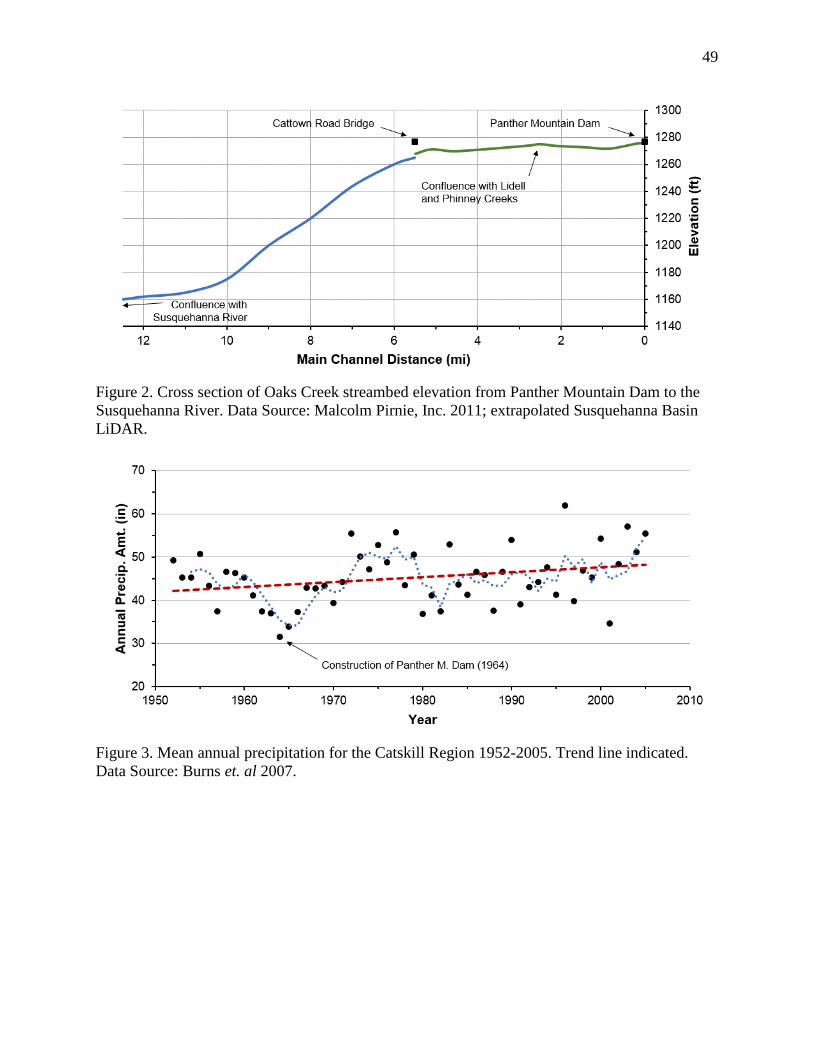
49
Figure 2. Cross section of Oaks Creek streambed elevation from Panther Mountain Dam to the Susquehanna River. Data Source: Malcolm Pirnie, Inc. 2011; extrapolated Susquehanna Basin LiDAR.
Figure 3. Mean annual precipitation for the Catskill Region 1952-2005. Trend line indicated. Data Source: Burns et. al 2007.
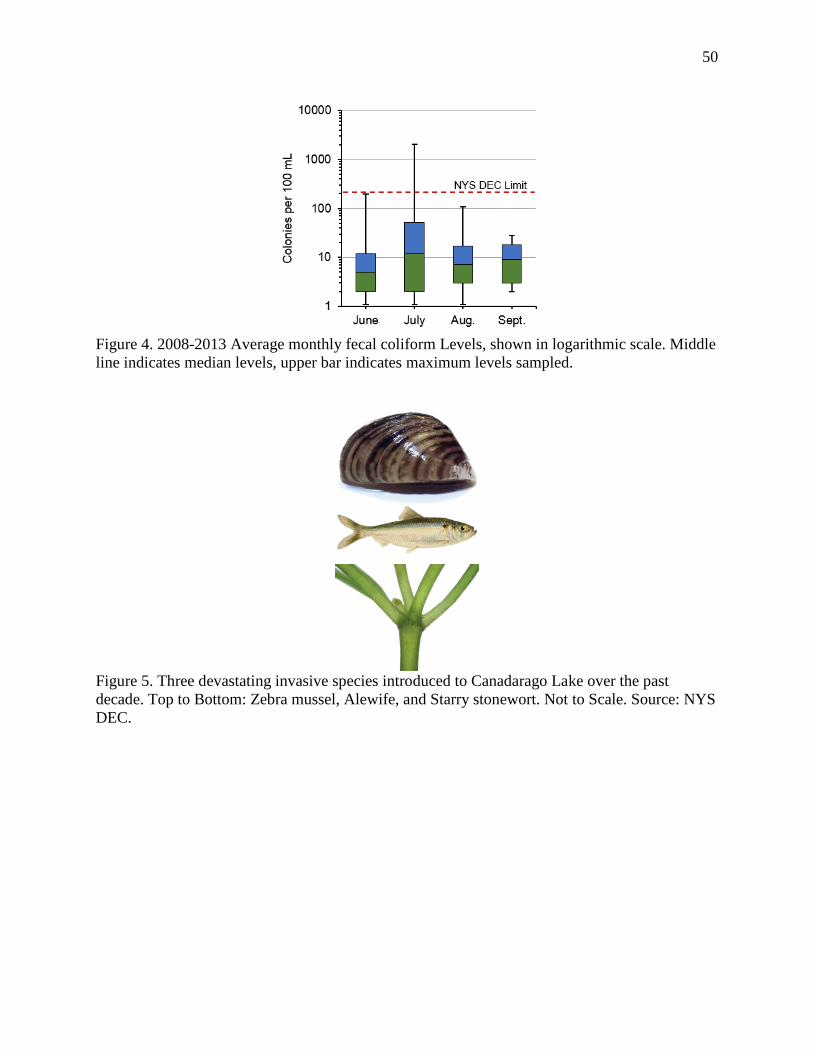
50
Figure 4. 2008-2013 Average monthly fecal coliform Levels, shown in logarithmic scale. Middle line indicates median levels, upper bar indicates maximum levels sampled.
Figure 5. Three devastating invasive species introduced to Canadarago Lake over the past decade. Top to Bottom: Zebra mussel, Alewife, and Starry stonewort. Not to Scale. Source: NYS DEC.
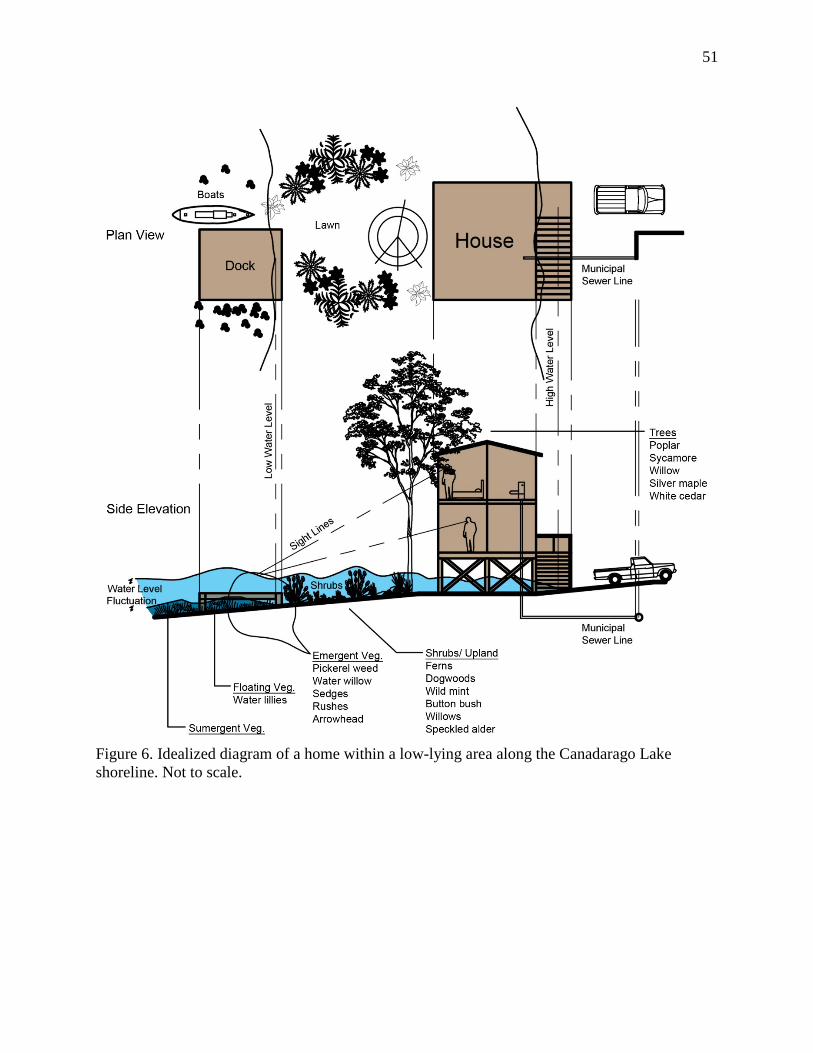
51
Figure 6. Idealized diagram of a home within a low-lying area along the Canadarago Lake shoreline. Not to scale.
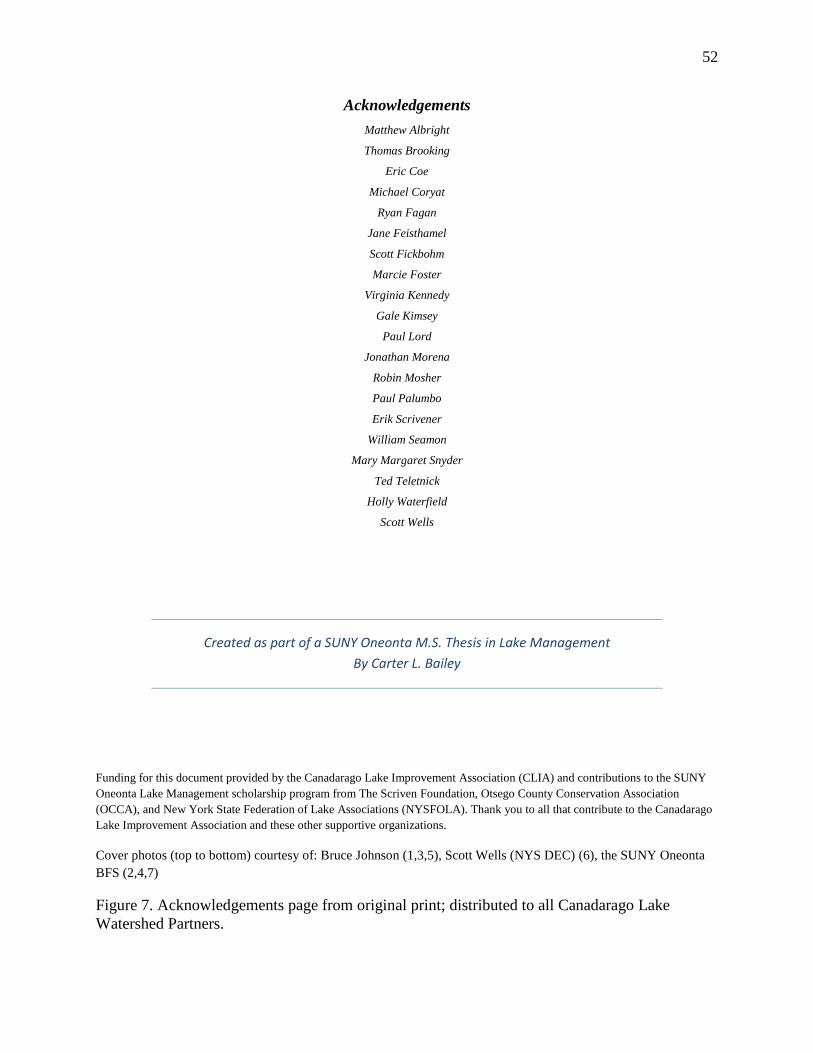
52
Acknowledgements Matthew Albright
Thomas Brooking
Eric Coe
Michael Coryat
Ryan Fagan
Jane Feisthamel
Scott Fickbohm
Marcie Foster
Virginia Kennedy
Gale Kimsey
Paul Lord
Jonathan Morena
Robin Mosher
Paul Palumbo
Erik Scrivener
William Seamon
Mary Margaret Snyder
Ted Teletnick
Holly Waterfield
Scott Wells
Created as part of a SUNY Oneonta M.S. Thesis in Lake Management By Carter L. Bailey
Funding for this document provided by the Canadarago Lake Improvement Association (CLIA) and contributions to the SUNY Oneonta Lake Management scholarship program from The Scriven Foundation, Otsego County Conservation Association (OCCA), and New York State Federation of Lake Associations (NYSFOLA). Thank you to all that contribute to the Canadarago Lake Improvement Association and these other supportive organizations.
Cover photos (top to bottom) courtesy of: Bruce Johnson (1,3,5), Scott Wells (NYS DEC) (6), the SUNY Oneonta BFS (2,4,7)
Figure 7. Acknowledgements page from original print; distributed to all Canadarago Lake Watershed Partners.
53
Figure 8. Cover page from original print; distributed to all Canadarago Lake Watershed Partners.