physical and socio-economic profile - la trinidad,...
TRANSCRIPT
PHYSICAL AND SOCIO-ECONOMIC PROFILE
I. PHYSICAL PROFILE1
Geographic Location
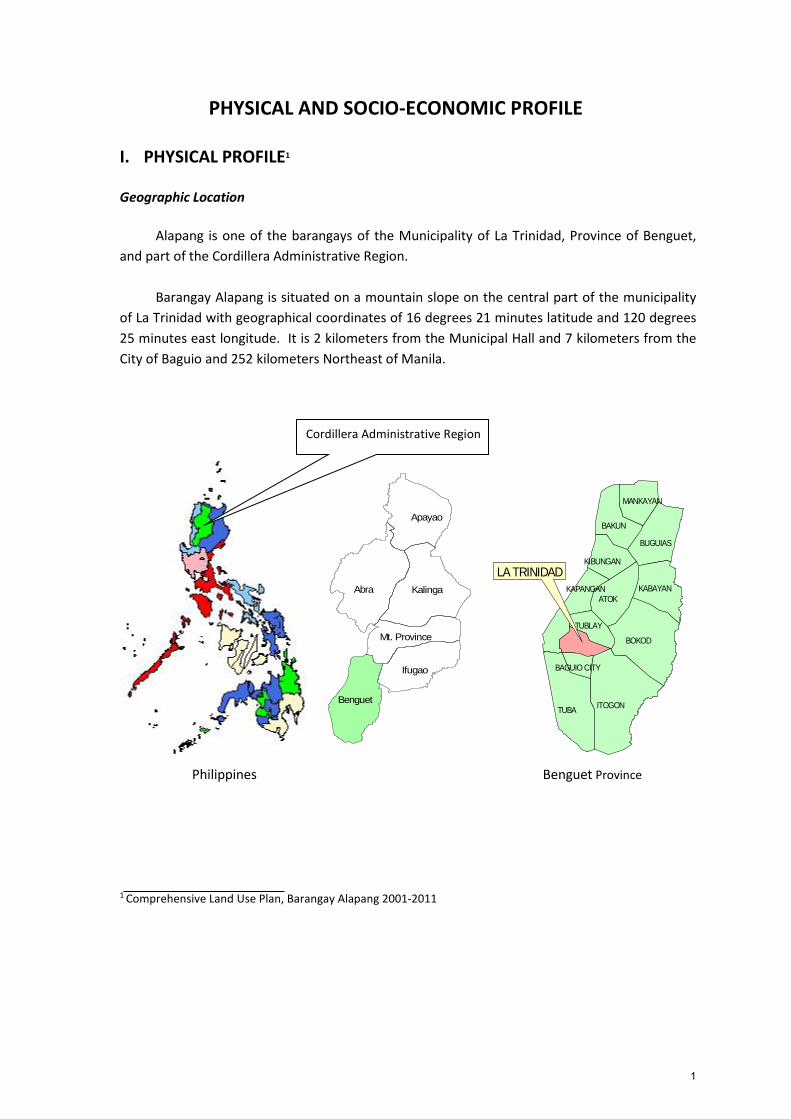
Alapang is one of the barangays of the Municipality of La Trinidad, Province of Benguet, and part of the Cordillera Administrative Region.
Barangay Alapang is situated on a mountain slope on the central part of the municipality
of La Trinidad with geographical coordinates of 16 degrees 21 minutes latitude and 120 degrees 25 minutes east longitude. It is 2 kilometers from the Municipal Hall and 7 kilometers from the City of Baguio and 252 kilometers Northeast of Manila.
1 Comprehensive Land Use Plan, Barangay Alapang 2001-2011
Abra Kalinga
Apayao
Ifugao
Benguet
Mt. Province
ITOGONTUBA
BOKOD
ATOK
BAKUN
BUGUIAS
KABAYAN
TUBLAY
KIBUNGAN
MANKAYAN
KAPANGAN
BAGUIO CITY
LA TRINIDAD
Cordillera Administrative Region
Philippines Benguet Province
1

Barangay Bineng
Barangay Alno
Barangay Cruz
Barangay Bahong
POLITICAL MAP OF BARANGAY ALAPANG
Not to Scale
Prepared By: MPDO La Trinidad under the CBMS Project, 2013
2

3

Land Area
The DENR-Cadastral Survey (Lot 1024-D) shows that Alapang has a total land area of 201.22 hectares, representing 2.49% of the total municipal area. It is the 5th smallest Barangay in La Trinidad.
Political Subdivisions
Alapang is one of the barangays of the Municipality of La Trinidad, Province of Benguet. It has five (5) sitios namely: Samoyao, Alapang Proper, Dapiting, Ettong and Camp Dangwa.
Accessibility Barangay Alapang is accessible by passing by barangay Cruz via Baguio-Bontoc National Road. The barangay is about 2 kilometers away from the Municipal Hall. Public utility vehicles are available.
II. NATURAL AND PHYSICAL CHARACTERISTICS
Climate and Rainfall
The average temperature in Alapang ranges from 16 t0 20 degrees centigrade. The coldest months are from December, January and February.
It has two pronounced seasons, dry and rainy. Rainy days are usually from May to
September with August being the wettest month with an average rainfall of 1 meter. It is dry during the rest of the year.
Topography and Slope Alapang is generally hilly to mountainous from gentle slopes to very steep slopes ranging from 18° to 30°. Elevation ranges from 900 t0 1,400 meters above sea level.
Soil Type There are two types of soil in the barangay namely: loam and coarse loam, the so-called Puguis gravelly loam and Bineng loam are found in the area and offers good to excessive drainage. These types of soil are suitable to a wide variety of vegetables and fruit crops including cut flowers.
Water Bodies There are two (2) common springs and one (1) creek, named Alapang Creek. Alapang Creek drains from the Busol Watershed from barangay Ambiong. Water from Alapang Creek comes from the Balili River through the Bahong caves. Water from the Alapang Creek finally joins the Payeng River which drains down the Lingayen Gulf. The creek serves as drainage and source of irrigation water.
4
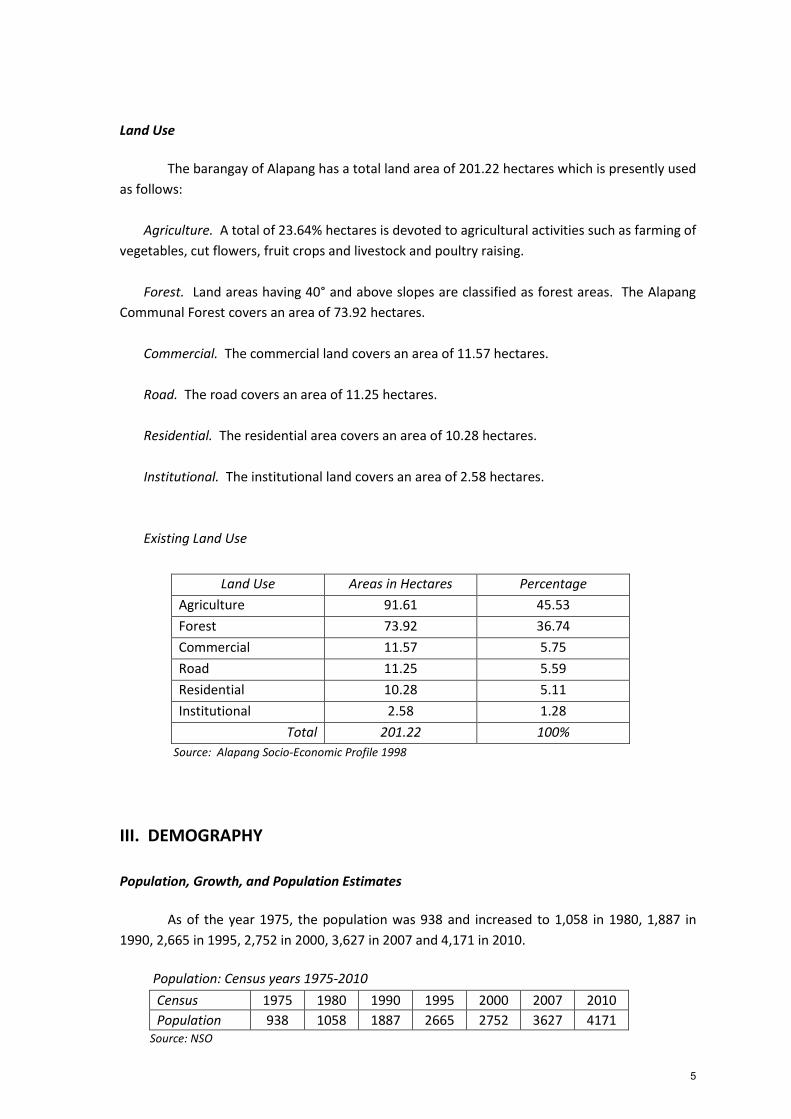
Land Use The barangay of Alapang has a total land area of 201.22 hectares which is presently used as follows: Agriculture. A total of 23.64% hectares is devoted to agricultural activities such as farming of vegetables, cut flowers, fruit crops and livestock and poultry raising.
Forest. Land areas having 40° and above slopes are classified as forest areas. The Alapang Communal Forest covers an area of 73.92 hectares.
Commercial. The commercial land covers an area of 11.57 hectares. Road. The road covers an area of 11.25 hectares. Residential. The residential area covers an area of 10.28 hectares. Institutional. The institutional land covers an area of 2.58 hectares.
Existing Land Use
Land Use Areas in Hectares Percentage Agriculture 91.61 45.53 Forest 73.92 36.74 Commercial 11.57 5.75 Road 11.25 5.59 Residential 10.28 5.11 Institutional 2.58 1.28
Total 201.22 100% Source: Alapang Socio-Economic Profile 1998
III. DEMOGRAPHY
Population, Growth, and Population Estimates As of the year 1975, the population was 938 and increased to 1,058 in 1980, 1,887 in 1990, 2,665 in 1995, 2,752 in 2000, 3,627 in 2007 and 4,171 in 2010. Population: Census years 1975-2010
Census 1975 1980 1990 1995 2000 2007 2010 Population 938 1058 1887 2665 2752 3627 4171
Source: NSO
5

The population growth rate of barangay Alapang between years of 1990 and 1995 was high at 6.8%. This dropped down to 0.69 between 1995 and 2000. Between 2000 and 2007, population growth rate increased to 4.023. The growth rate slightly increased to 4.77 between year of 2007 and 2010.
Intercensal Growth Rate AVERAGE GROWTH RATE 1990-1995 1995-2000 2000-2007 2007-2010
6.8 0.69 4.023 4.77 4.07 Source: LT Physical and Socio-Economic Profile 2011
Adopting the derived average growth rate of 4.07, the projected population for 2013 is at 4,701 persons with 1,175 estimated households. For the year 2014, the projected population is 4,893 with 1,223 households. For 2015, the projected population is at 5,092 with an estimated number of households of 1,273.
Source: MPDO Estimates based on Census 1995, 2000, 2007, & 2010 Population Doubling Time : 17.2 years
In a separate survey conducted jointly by the municipal and barangay local governments, the total population of Alapang in 2010 was 3,735, wherein the total male population was 1,892, representing 50.66% of the total. The female population was 1,843, representing 49.34%. The total number of households was 878, with an average household size of 4.
Total Number of Households: 878 Average Household Size : 4
Source: CBMS 2010
Population by Sitio
Year Projected Population Estimated No. of HHs 2011 4341 1085 2012 4517 1129 2013 4701 1175 2014 4893 1223 2015 5092 1273 2016 5299 1325 2017 5515 1379 2018 5739 1435 2019 5973 1493 2020 6216 1554
Sex # % Male 1,892 50.66% Female 1,843 49.34%
Total 3,735 100.00%
6

A big proportion of the population or 1,482 individuals are residents of Sitio Camp Dangwa. This is followed by Dapiting with 982 residents representing 26%. Alapang proper with 610 residents, Samoyao with 410 residents or, and Ettong with 251 representing 16%, 11%, and 7% respectively.
Sitio/Purok Households Population # % #
Camp Dangwa 354 40% 1,482 Dapiting 223 26% 982 Alapang Proper 140 16% 610 Ettong 59 7% 251 Samoyao - Alapang 102 11% 410
Total 878 100% 3,735 Source: CBMS 2010
Density & Classification The population density in Alapang increased from 9.38 persons per square kilometer in 1990, to 13.24 in 1995, and 13.68 in 2000. From 2000 to 2007, the density increased to 18.03 persons per square kilometer. This increased further to 21 persons per square kilometer in 2010. Based on this, Alapang is classified as an urban barangay. Population Density (Persons per Square Km)
Census year 1990 1995 2000 2007 2010 Density 9.38 13.24 13.68 18.03 21
Source: LT Physical & Socio-Economic Profile 2011
Population by Sex & Age Groups Females aging 15-19 have the greatest number, representing 6.02% of the total population. Males ageing 10-14 have the highest population in the male group, representing 5.70% of the total population. The total sex ratio was 103% which means that for every 100 female, there are 103 males. The age group 75-79 shows that the sex ratio is 100%, which indicates that there were equal numbers of males to females. A ratio higher than 100 indicates that there is predominance of the male population as can be seen in the age groups 0-4, 5-9, 10-14, 25-29, 30-34, 35-39, 40-44, 50-54 and 65-69. While in the age groups of 15-19, 20-24, 45-49, 55-59, 60-64, 70-74 and 80 and above, there were more females than males. Only for the age groups 75-79, do we find the equal male population to the female population.
7
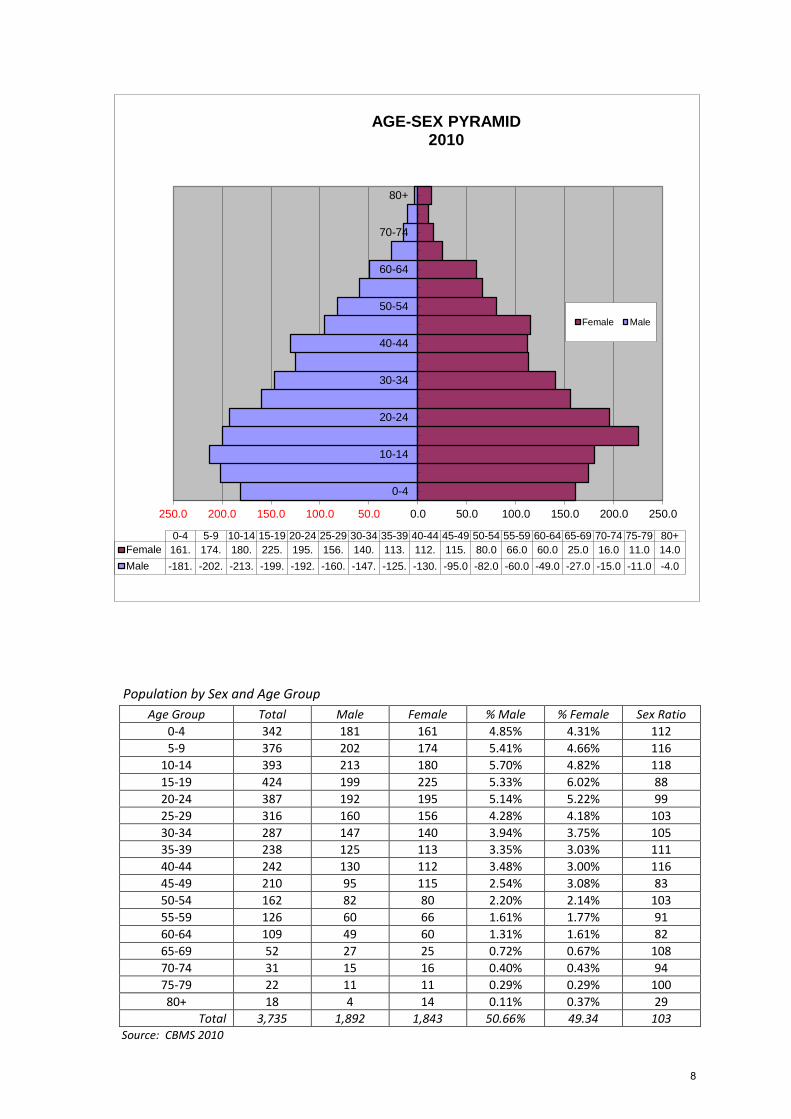
Population by Sex and Age Group
Age Group Total Male Female % Male % Female Sex Ratio 0-4 342 181 161 4.85% 4.31% 112 5-9 376 202 174 5.41% 4.66% 116
10-14 393 213 180 5.70% 4.82% 118 15-19 424 199 225 5.33% 6.02% 88 20-24 387 192 195 5.14% 5.22% 99 25-29 316 160 156 4.28% 4.18% 103 30-34 287 147 140 3.94% 3.75% 105 35-39 238 125 113 3.35% 3.03% 111 40-44 242 130 112 3.48% 3.00% 116 45-49 210 95 115 2.54% 3.08% 83 50-54 162 82 80 2.20% 2.14% 103 55-59 126 60 66 1.61% 1.77% 91 60-64 109 49 60 1.31% 1.61% 82 65-69 52 27 25 0.72% 0.67% 108 70-74 31 15 16 0.40% 0.43% 94 75-79 22 11 11 0.29% 0.29% 100 80+ 18 4 14 0.11% 0.37% 29
Total 3,735 1,892 1,843 50.66% 49.34 103 Source: CBMS 2010
250.0 200.0 150.0 100.0 50.0 0.0 50.0 100.0 150.0 200.0 250.0
0-4
10-14
20-24
30-34
40-44
50-54
60-64
70-74
80+
0-4 5-9 10-14 15-19 20-24 25-29 30-34 35-39 40-44 45-49 50-54 55-59 60-64 65-69 70-74 75-79 80+Female 161. 174. 180. 225. 195. 156. 140. 113. 112. 115. 80.0 66.0 60.0 25.0 16.0 11.0 14.0Male -181. -202. -213. -199. -192. -160. -147. -125. -130. -95.0 -82.0 -60.0 -49.0 -27.0 -15.0 -11.0 -4.0
AGE-SEX PYRAMID2010
Female Male
8
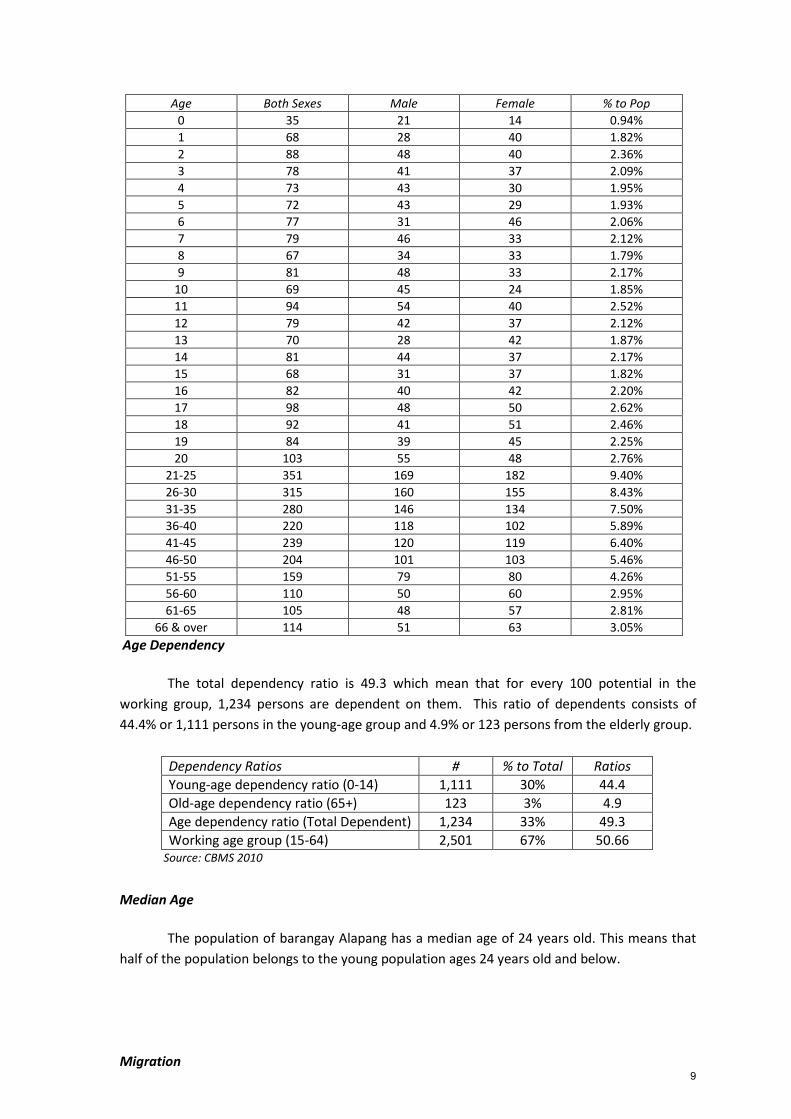
Age Both Sexes Male Female % to Pop 0 35 21 14 0.94% 1 68 28 40 1.82% 2 88 48 40 2.36% 3 78 41 37 2.09% 4 73 43 30 1.95% 5 72 43 29 1.93% 6 77 31 46 2.06% 7 79 46 33 2.12% 8 67 34 33 1.79% 9 81 48 33 2.17%
10 69 45 24 1.85% 11 94 54 40 2.52% 12 79 42 37 2.12% 13 70 28 42 1.87% 14 81 44 37 2.17% 15 68 31 37 1.82% 16 82 40 42 2.20% 17 98 48 50 2.62% 18 92 41 51 2.46% 19 84 39 45 2.25% 20 103 55 48 2.76%
21-25 351 169 182 9.40% 26-30 315 160 155 8.43% 31-35 280 146 134 7.50% 36-40 220 118 102 5.89% 41-45 239 120 119 6.40% 46-50 204 101 103 5.46% 51-55 159 79 80 4.26% 56-60 110 50 60 2.95% 61-65 105 48 57 2.81%
66 & over 114 51 63 3.05% Age Dependency
The total dependency ratio is 49.3 which mean that for every 100 potential in the working group, 1,234 persons are dependent on them. This ratio of dependents consists of 44.4% or 1,111 persons in the young-age group and 4.9% or 123 persons from the elderly group.
Dependency Ratios # % to Total Ratios Young-age dependency ratio (0-14) 1,111 30% 44.4 Old-age dependency ratio (65+) 123 3% 4.9 Age dependency ratio (Total Dependent) 1,234 33% 49.3 Working age group (15-64) 2,501 67% 50.66
Source: CBMS 2010
Median Age The population of barangay Alapang has a median age of 24 years old. This means that half of the population belongs to the young population ages 24 years old and below. Migration
9

The total number of migrants in Alapang is 1,258, representing 33.68% of the total population. Out of the total number of migrants, 620 or 49.28 % are males and 638 or 50.72% are females. The In-migration rate is very high at 301.61 indicating that Alapang is an in-migration area.
Migrants by Sex # % Male 620 49.28 Female 638 50.72 Total to Population 1,258 33.68
Source: CBMS 2010 In –Migration Rate : 301.61
Length of Residency In terms of length of residency 1,260 have resided in Alapang for 0-5 years, representing 33.73% of the population. There are 724 persons who have resided in the barangay for a period of 6-10 years, and 538 residents who have resided for 11-15 years.
Length of Residency # % Length of Residency # % 0 - 5 Years 1,260 33.73% 46 - 50 Years 41 1.10% 6 - 10 Years 724 19.38% 51 - 55 Years 29 0.78% 11 - 15 Years 538 14.40% 56 - 60 Years 20 0.54% 16 - 20 Years 367 9.83% 61 - 65 Years 22 0.59% 21 - 25 Years 223 5.97% 66 Years and Above 32 0.86% 26 - 30 Years 179 4.79% Since Birth 1 0.03% 31 - 35 Years 101 2.70% Not Stated 57 1.53% 36 - 40 Years 80 2.14% Total 3735 100.00%
Source: CBMS 2010
IV. SOCIAL CHARACTERISTICS
A. CULTURAL ATTRIBUTES
Religious Affiliation Most of the residents of Alapang belong to the Catholic sector with 2,929 members or 78.42% of the total population. Born Again Christian members were at 211 or 5.65% of the total. Members of Anglican Church accounted to 119 or 3.19%. The rest of the population belongs to various different religious denominations.
Religion Total % Religion Total % Aglipay 1 0.03% Jehovah’s Witnesses 73 1.95%
10

Anglican 119 3.19% Jesus is Alive 1 0.03% Assembly of God 62 1.66% Kingdom of Christ 2 0.05% Baptist 71 1.90% KKMI 8 0.21% Born Again Christian 211 5.65% Lutheran 11 0.29% Catholic 2,929 78.42% Methodist 10 0.27% Church of Father & Son 6 0.16% Mormon 19 0.51% CSPI 7 0.19% Pentecostal 21 0.56% Episcopalian 3 0.08% Protestant 74 1.98% Espiritista 5 0.13% Seventh Day Adventist 21 0.56% Evangelical 2 0.05% UCCP 13 0.35% Full Gospel 11 0.29% None 8 0.21% Iglesia ni Cristo 31 0.83% Not Stated 13 0.35% Islam 3 0.08% Total 3,735 100.00%
Source: CBMS 2010
Membership to a Community Organization (10 years old and above) In terms of community affairs participation, 417 are members of a community organization representing 13.82% of the total population. Out of the total members of organizations, 165 of them were males and 251 were females. While 2600 or 86.18% of the total population were not members of any organization with 1,314 males and 1,256 females.
Membership to a Community Organization Male Female Total % Member 165 251 417 13.82% Non-Member 1,314 1,256 2,600 86.18%
Total 1,479 1,471 3,017 100.00% Source: CBMS 2010
Among the residents who are members of the organizations, 157 or 37.63% were members of civic associations. One hundred five (105) were members of cooperatives representing 25.18% of the total, and 75, or 17.99% were members of the senior citizens group.
Organization Membership by Type # % Religious Group 19 4.56% Youth Group 4 0.96% Cultural Group 0 0.00% Political Group 1 0.24% Women's Organization 29 6.95% Agriculture-based Organization 7 1.68% Labor Organization 1 0.24% Civic Association 157 37.65% Cooperative 105 25.18% Senior Citizens 75 17.99% Others 19 4.56%
Total 417 100.00% Source: CBMS 2010 Ethnicity
11

More than one third of the total population or 1,412 persons belong to Ibaloi ethnic group, representing 37.80% of the total population. About 21.29% are Kankanaey, and 3.94% are Ifugao. The rest belong to various 18 other indigenous groups.
Indigenous Group # Total Indigenous Group # Total Aberling/Aborlin 7 0.19% Kalinga 57 1.53% Applai 5 0.13% Kankanaey 795 21.29% Bago 3 0.08% Mandaya 4 0.11% Balangao 16 0.43% Mangyan 1 0.03% Bontoc 143 3.83% Muslim 1 0.03% Cebuano 1 0.03% Palawano 1 0.03% Ibaloi 1,412 37.80% Tingguian 6 0.16% Ibanag 12 0.32% Tuwali 5 0.13% Ifugao 147 3.94% Others 1 0.03% Ilongo 1 0.03% No Indigenous Tribe 1,095 29.32% Itneg 8 0.21% Kalanguya 14 0.37% Total 3,735 100.00%
Source: CBMS 2010
B. EDUCATION
Literacy (10 years old and above) The literacy rate of Alapang is high at 97.88% of the population who are 10 years old and above. Out of the 2,949 literate, 1,469 were males and 1,480 were females. The number of illiterate was 64 or 2.12% of the population. Thirty-seven were males and twenty seven were females.
Literacy by sex Male Female Total % Literate 1,469 1,480 2,949 97.88% Illiterate 37 27 64 2.12%
Total 1,506 1,507 3,013 100.00% Source: CBMS 2010 Of the total population, 33.07% are still going to school. And 66.93% were not attending school, (this number includes all age brackets). Of the total number of persons going to school, 634 were males and 601 were females. Persons not attending school were at 2,500, comprising 1,258 males and 1,242 females.
Attending School by Sex Male Female Total % Attending School 634 601 1,235 33.07% Not attending School 1,258 1,242 2,500 66.93%
Total 1,892 1,843 3735 100% Source: CBMS 2010 Educational Attainment of Population Aged 3 years old and above According to educational attainment, there are 305 who are not in school with 162 males and 143 females representing 8.61% of the total population. Fifty six (56) were able to go to day care with 36 males and 20 females. Sixty seven (67) were able to enter nursery, kindergarten or preparatory with 41 males and 26 females.
12

Source: CBMS 2010 There were also 510 persons who were in elementary. A number of 232 were able to graduate elementary, (130 males and 102 females) representing 6.55% of the total population (3 years old and above). Three hundred eighty five (385) were able to enter high school. 495 graduated from high school with 243 males and 250 females, representing 13.97%. Individuals who were able to reach college level accounted to 494 individuals. While 818 were able to graduate from college with 356 males and 460 females representing 23.08%. 15 individuals were able to obtain units in masters and or doctorates, 7 males and 8 females. While 23 were able to finish their doctors and or Master’s degree, 9 males and 14 females representing 0.65% of the total population. Educational Attainment of those in School For those who were attending school, the grade level with the most number of enrolled pupils was grade 2, with 99 pupils, representing 8.02% of the total population of those attending school. Out of the 99 pupils, 54 were males and 45 were females. This is followed by Grade 3 with 79 enrolled pupils where 42 were males and 37 were female representing 6.40%. Grade 1 had 78 enrolled pupils with 48 males and 30 females representing 6.32%. Nursery, kindergarten or preparatory had 76 enrolled pupils with 44 males and 32 female representing 6.15% of the total.
Educational Attainment (3 y/o +) Male Female Total % No Grade 162 143 305 8.61% Day Care 36 20 56 1.58% Nursery/Kindergarten/Preparatory 41 26 67 1.89% Grade 1 61 48 109 3.08% Grade 2 57 44 101 2.85% Grade 3 56 31 87 2.45% Grade 4 49 42 91 2.57% Grade 5 63 42 105 2.96% Grade 6/7 11 6 17 0.48% Elementary Graduate 130 102 232 6.55% 1st Year High School 51 59 110 3.10% 2nd Year High School 79 62 141 3.98% 3rd Year High School 54 48 102 2.88% 4th/5th Year High School 15 17 32 0.90% High School graduate 243 250 495 13.97% 1st year Post Secondary 6 3 9 0.25% 2nd year Post Secondary 14 11 25 0.71% 3rd year Post Secondary 3 9 12 0.34% Post Secondary graduate 51 47 98 2.77% 1st year College 75 73 148 4.18% 2nd year College 83 104 187 5.28% 3rd year College 64 67 131 3.70% 4th year College or higher 16 12 28 0.79% College graduate 356 460 818 23.08% With units Masters/Doctors 7 8 15 0.42% Doctors/Master’s degree 9 14 23 0.65%
Total 1,792 1,748 3,544 100%
13

Grade/Year Level of those going to School Male Female # % Day Care 33 35 68 5.51% Nursery/Kindergarten/Preparatory 44 32 76 6.15% Grade 1 48 30 78 6.32% Grade 2 54 45 99 8.02% Grade 3 42 37 79 6.40% Grade 4 35 24 59 4.78% Grade 5 31 33 64 5.18% Grade 6/7 45 26 71 5.75% Elementary Graduate 1 1 2 0.16% 1st Year HS 42 49 91 7.37% 2nd Year HS 28 47 75 6.07% 3rd Year HS 43 29 72 5.83% 4th/5th Year HS 25 27 52 4.21% 1st year Post Secondary (PS) 10 3 13 1.05% 2nd year PS 3 1 4 0.32% 3rd year PS 1 2 3 0.24% 1st year College 33 60 93 7.53% 2nd year College 47 43 90 7.29% 3rd year College 38 45 83 6.72% 4th year College or higher 27 28 55 4.45% With units Masters/Doctors 4 4 8 0.65%
Total 634 601 1235 100.00% Source: CBMS 2010
There were 91 students enrolled in first year high school with 42 males and 49 females representing 7.37% of the total population. Second year high school had 75 enrolled students with 28 males and 47 females representing 6.07% of the total. Third year had 72 enrolled students with 43 males and 29 females representing 5.83%. For fourth year, 52 were enrolled with 25 males and 27 females representing 4.21%. Some 93 students were enrolled in first Year College, comprising 33 males and 60 females representing 7.53% of the total population of attending school. Second year college had 90 enrolled students, with 47 males and 43 females. There were 83 enrolled in third year, 38 of them were males and 45 were females, which accounted to 6.72% of the total number of attending school. Fifty five (55) or 4.45% were enrolled in fourth year, with 27 males and 28 females. Eight (8) persons were enrolled with some units for master or doctors, where 4 were male and 4 were female representing 0.65% of the total.
Attending school by Age Group (3 to 21 years old) From the school going age of 3 to 21 years old, there were a total of 1,524 members of the community. Out of the 1,524, 790 were males and 734 were females. A total of 1,159 or 76.05% were in school and 365 or 23.95% were not in school. Attending/Not Attending School by Age Group (3 to 21 years old)
Sex In School Out of School
14

Age Group Male Female Total # % to Age Group # % to Age
Group 3 41 37 78 2 2.56% 76 97.44% 4 43 30 73 19 26.03% 54 73.97% 5 43 29 72 47 65.28% 25 34.72% 6 31 46 77 67 87.01% 10 12.99% 7 46 33 79 75 94.94% 4 5.06% 8 34 33 67 65 97.01% 2 2.99% 9 48 33 81 78 96.30% 3 3.70%
10 45 24 69 67 97.10% 2 2.90% 11 54 40 94 92 97.87% 2 2.13% 12 42 37 79 77 97.47% 2 2.53% 13 28 42 70 68 97.14% 2 2.86% 14 44 37 81 76 93.83% 5 6.17% 15 31 37 68 61 89.71% 7 10.29% 16 40 42 82 75 91.46% 7 8.54% 17 48 50 98 75 76.53% 23 23.47% 18 41 51 92 67 72.83% 25 27.17% 19 39 45 84 59 70.24% 25 29.76% 20 55 48 103 60 58.25% 43 41.75% 21 37 40 77 29 37.66% 48 62.34%
3-21 790 734 1,524 1,159 76.05% 365 23.95% 22-25 132 142 274 51 18.61% 223 81.39% 26-30 160 155 315 18 5.71% 297 94.29% 31-35 146 134 280 4 1.43% 276 98.57%
36 & over 567 584 1151 3 0.26% 1148 99.74% Total 1,795 1,749 3,544 1,235
2,309
Source: CBMS 2010
For those in the pre-school age, most of them were not in school. For those in elementary ages of 6 to 12 years old, most of them where at least more than 95% were in school except for those in 6 and 7 years old age bracket were only 87.01% and 94.94% respectively were in school. For those in the ages appropriate for high school, at least more than 90% were in school except for those in the 15 age bracket where only 89.71% were in school. For those ages appropriate for college, there were less compared to those in the lower school levels.
Educational Facilities and Enrollment
School Level Name of School Enrollment (SY 2011-12)
Category
Elementary Alapang Elementary School 581 Public Source: DepEd-LT, TESDA, 2012
Type of School Enrolled In Out of 1,235 total populations of those in school, 682 were enrolled in Public Schools representing 55.22%. While 553 were enrolled in private schools comprising 44.78% of the total.
Enrollment by School Type Total % Public School 682 55.22% Private School 553 44.78%
Total 1,235 100.00% Source: CBMS 2010
15

Sports & Recreation Facilities : Alapang E/S Playground
C. HEALTH
Health Facilities
The Barangay Health Station is located at the Alapang Multi-Purpose Hall. The barangay midwife conducts home visits on Tuesdays and holds clinic on Thursdays. Private clinics and the Benguet General Hospital (provincial hospital) are found about two (2) kilometers away at the core of La Trinidad. Other hospital and clinics are also available at nearby Baguio City. Treatment for Sickness There were 842 households with members who got sick in year 2010. Out of the 842, 224 members of the households who got sick availed of medical treatment, and 618 or 70.39% did not avail of any treatment or cure. Only 36 households or 4.10% of the total number of households had members who did not get sick.
Availed of Treatment/Cure for Sickness HHs % Yes 224 25.51% No 618 70.39% Did Not Get Sick 36 4.10%
Total 878 100.00% Source: CBMS 2010 Access to Health Facilities Out of the 224 who received treatment, there were 111 patients who received treatment in the provincial public hospital representing 49.55% of the total. Some 52 patients received treatment in a private hospital or clinic representing 33.48%. There were 16 who received treatment in municipal or city public hospital, and 16 patients received cure in national public hospital representing 7.14% for each place of treatment.
Place Where Received Treatment # % Public hospital (provincial) 111 49.55% Public hospital (municipal/city) 16 7.14% Public hospital (district) 2 0.89% Public hospital (national) 16 7.14% Private hospital/clinic 75 33.48% Rural health units 2 0.89% Brgy. health station/center 2 0.89%
Total 224 100.00% Source: CBMS 2010 Mortality
There were 16 individuals who died in the community in 2010. Ten (10) of them were males and 6 were females representing 0.43% of the total population. The causes of death
16

were: disease of the heart with 3 males and 1 female casualty; 2 males and 3 females died due to disease of the vascular system; and 2 males and a female casualty who died due to cancer, representing 25%, 31.25% and 18.75% respectively. Four (4) other deaths were recorded, 3 males and a female representing 25% of the total number of deaths.
Cause of Death Male Female Total % Diseases of the heart 3 1 4 25.00% Diseases of the vascular system 2 3 5 31.25% Cancer 2 1 3 18.75% Others 3 1 4 25.00%
Total 10 6 16 100.00% Source: MHO 2012
Nutritional Status of Children (0 to 5 years old)
In 2012, there were 660 children from ages 0-5 years old where 362 of them were males and 298 were females. Of the total, 644 are of normal weight, 352 males and 292 females representing 97.58% of the total number of children from ages 0-5. Thirteen (13) or 1.97% was underweight, and 3 were overweight, or 0.46% of the total children weighed.
Nutritional Status of Children 0-5 Years Old Male Female Total % Overweight 3 0 3 0.45% Normal 352 292 644 97.58% Underweight 7 6 13 1.97% Severely Underweight 0 0 0 0.00%
Total 362 298 660 100.00% Source: MHO 2012
Family Planning Methods Usage
There were 524 women of child-bearing age. Out of the 524 couples, only 285 were practicing family planning or 57% of the total number of couples.
Number of Married Women of Child-bearing Age : 524
Couples Practicing Family Planning : 285
There were 127 couples who use pills as a family planning method, representing 44.56% of the total number of couples practicing family planning. Tubal ligation is adapted by 65 couples representing 22.81%. Injectable is adapted by 38 couples and 20 couples used the Standard Days Method representing 13.33% and 7.02% respectively.
Family Planning Method # %
Barrier Method 10 3.51% Basal Body Temperature 2 0.70% Billings Ovulation Method 0 0.00% Injectable 38 13.33%
17

IUD 4 1.40% Lactational Amenorrhea Method 1 0.35% Pills 127 44.56% Standard Days Method 20 7.02% Symtothermal Method 0 0.00% Tubal Ligation 65 22.81% Vasectomy 1 0.35% Don't Know 0 0.00% Others 17 5.96%
Total 285 100% Source: CBMS 2010 Contraceptive Prevalence Rate : 54.4% of Currently Married Women (CWM) 15-49 years old use contraceptive methods 51.1% of CWM 15-49 years old use Modern Contraceptive Method 3.2% of CWM 15-49 years old use Traditional Contraceptive Method
Environmental Sanitation Solid Waste Management Waste Generation. In 2011, a total of 3 metric tons (mt) of waste were generated daily
at Alapang. From the residential area, 1.96 metric tons are generated, from institutions (schools and offices), 0.87 metric tons was produced. Only 0.22 metric tons of garbage comes from the business establishments and 0.07 metric tons was produced from the farms.
Estimated Total Waste Generated : 3 metric tons (mt) daily Residential : 1.96 mt Commercial : 0.22 mt Institutional : 0.87 mt Agriculture : 0.07 mt Markets : 0.00 mt
Source: MPDO estimate based on 0.534 kg/person/day
System of Garbage Disposal. There were various ways of disposing garbage adapted by the community in Alapang. Garbage collection was done by 845 households representing 96.24% of the total households. Another 750 households segregate their waste representing 85.42% of the total. Recycling was done by 471 households or 53.64% of the total. About 284 households do composting accounted to 32.35%. Some 153 households still burn their garbage.
System of Garbage Disposal # % to total HHs Garbage Collection 845 96.24% Burning 153 17.43% Composting 284 32.35% Recycling 471 53.64%
18

Waste Segregation 750 85.42% Compost Pit with Cover 73 8.31% Compost Pit without Cover 82 9.34% Others 16 1.82%
Source: CBMS 2010
Garbage Collection. Most of the garbage of the community was collected by the municipal garbage collector. There were 821 households whose garbage was collected by the municipal garbage collector in the designated collection points at scheduled days of collection representing 93.51% of the total number of households. Twenty two (22) households’ garbage was collected by the barangay garbage collector representing 2.51% of the total. Garbage of other 2 households was collected by private garbage collector representing 0.23% of the total number of households (probably recyclable garbage). For some 33 households or 3.76% of the total are not serviced by any garbage collector at all.
Who Collects the Garbage # % Municipal garbage collector 821 93.51% Barangay garbage collector 22 2.51% Private garbage collector 2 0.23% None 33 3.76%
Total 878 100.00% Source: CBMS 2010 Collection Frequency. According to the survey last 2010, 481 households or 54.78% of the total households said that their garbage was being collected once a week. There were also 205 households whose garbage was collected daily representing 23.35%. One hundred twenty four households ’garbage was collected twice a week representing 14.12% and 35 households’ garbage was collected thrice a week representing 3.99%.
Frequency of Garbage Collection # %
Daily 205 23.35% Thrice a Week 35 3.99% Twice a Week 124 14.12% Once a Week 481 54.78% None 33 3.76%
Total 878 100.00% Source: CBMS 2010
Sanitation Facilities There were 730 households who have their own flush toilets with septic tanks representing 83.14% of the total households. For the 100 households, they shared with others’ septic tank representing 11.39%. Other households still use pits with 30 who uses closed pit and 18 open pits representing 3.42% and 2.05% respectively.
19

Kind of Toilet Facility # % Water-sealed Flush to Sewerage/Septic Tank- own 730 83.14% Water-sealed Flush to Sewerage/Septic Tank- shared 100 11.39% Close Pit 30 3.42% Open Pit 18 2.05% No Toilet 0 0.00%
Total 878 100.00% Source: CBMS 2010
D. HOUSING Residential Construction As per records of the Municipal Engineering Office, 15 new buildings were constructed in Alapang. This represents 5% of total buildings constructed in La Trinidad.
House Ownership There were 427 owners of house and lot representing 48.99% of the total households. There were 118 households who rent a house or room including lot, representing 13.44%. Households who own house with rent-free lot without consent of owner accounted to 135 owners, representing 15.38% of the total. Households living in a rent-free house and lot with consent of owner accounted to 116 households representing 13.21%. Other 42 households accounted to other tenure status representing 4.78% of the total number of households.
Households by Tenure Status # % Owner, owner-like possession of house and lot 427 48.63% Rent house/room including lot 118 13.44% Own house/rent lot 6 0.68% Own house, rent-free lot with consent of owner 24 2.73% Own house, rent-free lot without consent of owner 135 15.38% Rent-free house and lot with consent of owner 116 13.21% Rent-free house and lot without consent of owner 10 1.14% Other tenure status 42 4.78%
Total 878 100.00% Source: CBMS 2010
Average Imputed Rent2 per Month for the House and/Lot: Ᵽ 3,676
Minimum Imputed Rent : Ᵽ 100
Maximum Imputed Rent : Ᵽ300,000
Construction Materials of Housing Units According to type of materials used for walls of houses, there were 662 households whose walls were made of strong materials representing 75.40% of the total households in the barangay. While walls made up of mixed materials, but predominantly strong materials were at 172 representing 19.59% of the total. There were 20 households with houses made out of light
20

wall materials, representing 2.28%. Sixteen (16) households had mixed but predominantly light materials representing 1.82%. 2 Imputed Rent: if the house and lot is owned or being used for free, the imputed rent refers to the amount the owner would charge to rent the housing unit.
Households by Type of Materials Used for Walls # % Strong Materials 662 75.40% Light Materials 20 2.28% Salvaged/Makeshift Materials 6 0.68% Mixed but Predominantly Strong 172 19.59% Mixed but Predominantly Light 16 1.82% Mixed but Predominantly Salvage 2 0.23%
Total 878 100.00% Source: CBMS 2010 With regards to the type of the materials used for the roof, 624 households have strong materials representing 71.07% of the total households. Roofs made of mixed but predominantly strong materials accounted to 210 representing 23.92%. There were also 24 households with roof made of mixed but predominantly light materials representing 2.73%. Light roof materials were at 13 households representing 1.48% of the total.
Households by Type of Materials Used for Roof # % Strong Materials 624 71.07% Light Materials 13 1.48% Salvaged/Makeshift Materials 4 0.46% Mixed but Predominantly Strong 210 23.92% Mixed but Predominantly Light 24 2.73% Mixed but Predominantly Salvage 3 0.34%
Total 878 100.00% Source: CBMS 2010
Household Conveniences The most commonly owned appliance were LPG Gas Stove/Range with 829 households representing 94.42% of the total number of households. This is followed by cellular phones with 792 representing 90.21%, and 765 households owned a television representing 87.13%. There were 737 households who own a radio or radio cassette which accounted to 83.94% of the total.
21
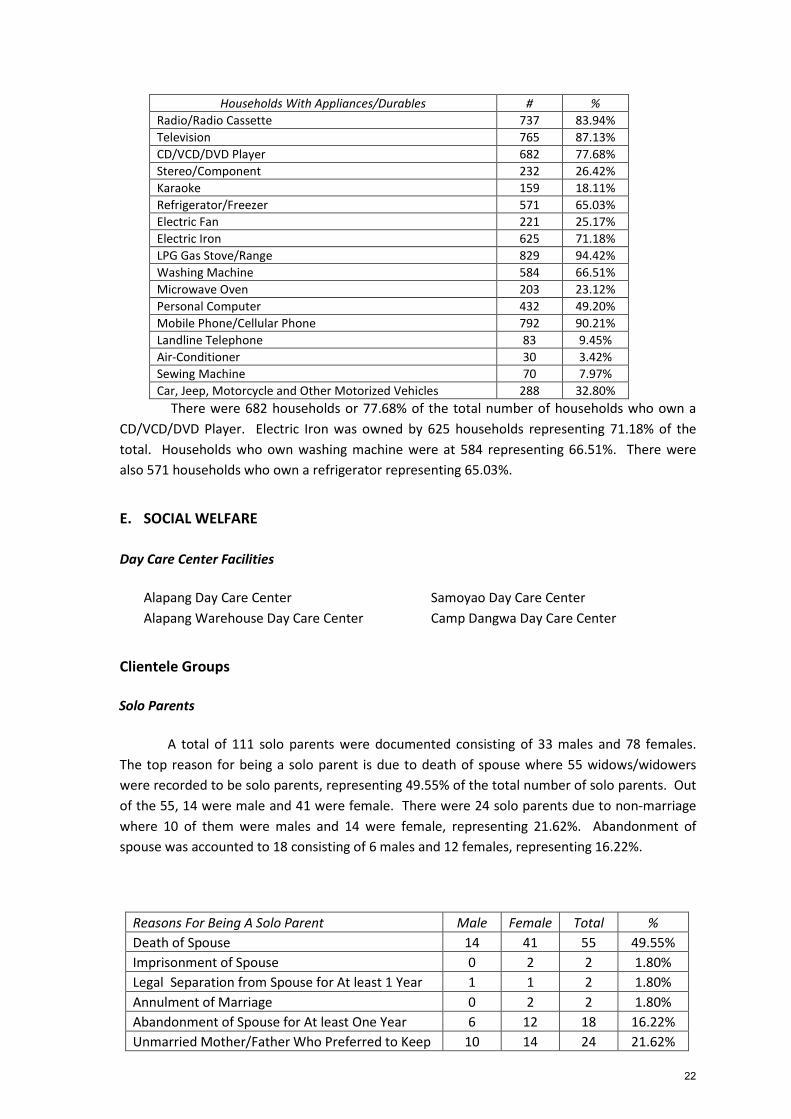
Households With Appliances/Durables # % Radio/Radio Cassette 737 83.94% Television 765 87.13% CD/VCD/DVD Player 682 77.68% Stereo/Component 232 26.42% Karaoke 159 18.11% Refrigerator/Freezer 571 65.03% Electric Fan 221 25.17% Electric Iron 625 71.18% LPG Gas Stove/Range 829 94.42% Washing Machine 584 66.51% Microwave Oven 203 23.12% Personal Computer 432 49.20% Mobile Phone/Cellular Phone 792 90.21% Landline Telephone 83 9.45% Air-Conditioner 30 3.42% Sewing Machine 70 7.97% Car, Jeep, Motorcycle and Other Motorized Vehicles 288 32.80%
There were 682 households or 77.68% of the total number of households who own a CD/VCD/DVD Player. Electric Iron was owned by 625 households representing 71.18% of the total. Households who own washing machine were at 584 representing 66.51%. There were also 571 households who own a refrigerator representing 65.03%.
E. SOCIAL WELFARE
Day Care Center Facilities Alapang Day Care Center Samoyao Day Care Center Alapang Warehouse Day Care Center Camp Dangwa Day Care Center
Clientele Groups
Solo Parents
A total of 111 solo parents were documented consisting of 33 males and 78 females. The top reason for being a solo parent is due to death of spouse where 55 widows/widowers were recorded to be solo parents, representing 49.55% of the total number of solo parents. Out of the 55, 14 were male and 41 were female. There were 24 solo parents due to non-marriage where 10 of them were males and 14 were female, representing 21.62%. Abandonment of spouse was accounted to 18 consisting of 6 males and 12 females, representing 16.22%.
Reasons For Being A Solo Parent Male Female Total % Death of Spouse 14 41 55 49.55% Imprisonment of Spouse 0 2 2 1.80% Legal Separation from Spouse for At least 1 Year 1 1 2 1.80% Annulment of Marriage 0 2 2 1.80% Abandonment of Spouse for At least One Year 6 12 18 16.22% Unmarried Mother/Father Who Preferred to Keep 10 14 24 21.62%
22

the Child Instead of Others Caring for Them Assumes the Responsibility of the Head of the Family 0 3 3 2.70% Other Reason 2 3 5 4.50%
Total 33 78 111 100.00% Source: CBMS 2010
Persons with Disability
There were 60 persons with disabilities recorded in Alapang, where 47 were male and 13 were female, representing 1.61% of the total population. Five have mild cerebral palsy, with 2 males and 3 females, representing 8.33% of the total number of persons with disability. There were 3 males who were partially blind, representing 5%. There were also 3 males who were regularly impaired by mental illness, representing 5% of the total. Three (3) males have hard of hearing, representing 5%. Other 3 have severe cerebral palsy consisting of 2 males and a female, representing 5%.
Persons with Disability by Type/Sex Male Female Total % Total Blindness 1 0 1 1.67% Partial Blindness 3 0 3 5.00% Low Vision 2 0 2 3.33% Totally Deaf 1 0 1 1.67% Partially Deaf 1 0 1 1.67% Hard of Hearing 3 0 3 5.00% Oral Defect 2 0 2 3.33% One Leg 1 0 1 1.67% Mild Cerebral Palsy 2 3 5 8.33% Severe Cerebral Palsy 2 1 3 5.00% Regularly Intellectually Impaired 2 0 2 3.33% Regularly Impaired by Mental Illness 3 0 3 5.00% Severely Impaired by Mental Illness 3 0 3 5.00% Regularly Multiple Impaired 2 0 2 3.33% Severely Multiple Impaired 1 0 1 1.67% Others 18 9 27 45.00%
Total 47 13 60 100.00% Source: CBMS 2010 There were 30 disabled persons which was in-born with 23 males and 7 females representing 50% of the total. Twenty two (22) were due to illness representing 36.67%. Another 7 who were all males were due to accident representing 11.67% of the total number of persons with disability.
Cause of Disability Male Female Total % In-born 23 7 30 50.00% Illness 16 6 22 36.67% Accident 7 0 7 11.67% Others 1 0 1 1.67%
Total 47 13 60 100.00% Source: CBMS 2010
23

Financial Assistance was received by 8 disabled persons representing 13.33% of the total. Four (4) persons or 6.67% received medical assistance. Another two (2) availed discount on medicines representing 3.33%. The sources of assistance received were from government having 6 recipients, 1 from non-government agency and 7 from other sources.
Assistance Received # % Medical Assistance 4 6.67% Financial Assistance 8 13.33% Discount on Medicine 2 3.33%
Total 14 23.33% Source: CBMS 2010
Source of Assistance Received # % Government 6 10.00% NGO 1 1.67% Others 7 11.67%
Total 14 23.33% Source: CBMS 2010
Senior Citizens
There were 232 senior citizens with 107 males and 125 females representing 6.21% of the total population of Alapang. Only 168 seniors consisting of 71 males and 97 females have their identification cards. Sixty four (64) seniors with 36 males and 28 females do not have identification cards representing 27.59%. Nineteen (19) senior citizens were able to use their identification cards, 9 males and 10 females representing 8.19% of the total number of seniors.
Senior Citizen ID Usage Male Female # % Members Who Has Able to Use ID 9 10 19 8.19% With Identification Card 71 97 168 72.41% Without Identification Card 36 28 64 27.59%
Total 107 125 232 6.21% Source: CBMS 2010
Access to Government Programs Majority of the households or about 464 households or 52.85% of the total number of households were able to benefit from all various types of the Government programs. There were 154 households who were recipients of the Supplemental Feeding program, representing 33.19% of the total. The Credit program had 112 recipients representing 24.14%. Another 80 households or 17.24% of the total were beneficiaries of the Philhealth for Indigents program. Forty (40) households were recipients of the Housing program representing 8.62% of the total. Given these programs, 97% said that the effects of the programs are good.
Types of Programs Received/Availed by the HHs # HHs % Recipient of CARP 0 0.00%
24

Philhealth for Indigents 80 17.24% Supplemental Feeding Program 154 33.19% Health assistance program 28 6.03% Education / scholarship program 26 5.60% Skills or livelihood training program 4 0.86% Housing program 40 8.62% Credit program 112 24.14% Other types of program, specify 20 4.31%
Total 464 100.00% Source: CBMS 2010
Effect of the Programs # %
Positive 451 97.20% No Effect 10 2.16% Negative Effect 3 0.65%
Total 464 100.00% Source: CBMS 2010
F. PUBLIC SAFETY
Peace and Order There were 51 incidents of crime in Alapang last 2012, most of which are vehicular accidents at 53% of all crime in the barangay. Theft and robbery comes in as second and third top most crimes in the barangay.
Victims of Crime # % Child Abuse 2 3.92% Other Non-index 3 5.88% Physical Injuries 2 3.92% Robbery 7 13.73% Theft 9 17.65% VAWC 1 1.96% Vehicular Accidents 27 52.94%
Total 51 100.00% Source: PNP-La Trinidad, 2012 data
Calamity
A total of 56 households said that they were affected by natural and/or man-made disasters in 2010. There were 44 households affected by typhoon representing 78.57% of the total. Twelve (12) were due to flood representing 21.43%.
Types of Calamities # % Typhoon 44 78.57% Flood 12 21.43%
25

Drought 0 0.00% Earthquake 0 0.00% Volcanic Eruption 0 0.00% Armed Conflict 0 0.00% Fire 0 0.00% Others 0 0.00%
Total 56 100.00% Source: CBMS 2010
V. ECONOMY A. SOURCES OF INCOME Entrepreneurial Activities Regarding income, 413 households or 47% of the total number of households were engaged in entrepreneurial activities which includes agricultural activities. There were 142 households who were in wholesale and retail trade activities with minimum income of P1,000, maximum income of P480,000 and an average annual income of P100,514. Crop farming and gardening has 118 households with an average annual income of P80, 113, minimum P3, 000 and maximum of P601, 000. While a number of 59 households were engaged in transportation, storage and communication services having an average income of P123, 995, a minimum of P34, 100 and a maximum of P541, 500.
Entrepreneurial Activities by Income Households Income (P) # % Minimum Average Maximum
Crop Farming and Gardening 118 13.44% 3,000.00 80,113.00 601,000 Livestock and Poultry Raising 15 3.63% 1,000.00 43,400.00 224,000.00 Fishing Activities 1 0.11% 56,000.00 56,000.00 56,000.00 Forestry and Hunting Activities 1 0.11% 31,000.00 31,000.00 31,000.00 Wholesale & Retail Trade Activities 142 16.17% 1,000.00 100,514.00 480,000.00 Manufacturing Activities 7 0.80% 48,000.00 77,286.00 120,000.00 Community, Social and Personal 20 2.28% 40,000.00 265,850.00 2,300,000 Transportation, Storage and Communication Services 59 6.72% 34,100.00 123,995.00 541,500.00
Mining and Quarrying Activities 6 0.68% 28,800.00 122,133.00 200,000.00 Construction 16 1.82% 800.00 177,300.00 480,000.00 Other Activities 28 3.19% 10,000.00 112,014.00 420,000.00
Total 413 Source: CBMS 2010
Salaries and Wages
Majority or 54.21% of households in the barangay were wage earners. This is comprised of 426 households having an annual minimum income of P2,000, a maximum income of P1,078,000 and an average income of P235,048 annually.
Salaries and Wages by Income Households Income (P) # % Minimum Average Maximum
Salaries and Wages 476 54.21% 2,000.00 235,048.00 1,078,000.00 Source: CBMS 2010
26

Additional Sources of Income
A total of 681 households had other sources of income aside from their main source of income. Out of 681, 197 households received remittances from Overseas Filipino Workers with P2,000 minimum income received, a maximum of P360,000 and an average of P57,732. Another 112 households received additional income from retirement pensions, with an average annual income of P187,322, a minimum income of P2, 800 and maximum income of P1,176,000. There were also 69 households who received interest payments for additional income at a minimum of P150, a maximum of P720,000 and an average annual income of P12,822. Sixty two (62) households had additional income from cash receipts, support, assistance and relief from domestic sources with a minimum of P1,000, a maximum of P150,000 and an average annual income of P17,970. Forty two (42) households made additional income from rentals received from agricultural lands, spaces, buildings and other properties with an average annual income of P74,034, a minimum of P2,400 and maximum of P420,000.
Additional Sources of Income # of HHs
Minimum Income
Average Income
Maximum Income
Net Share of Crops, Livestock, and Poultry Raised by Other HHs
16 2,280.00 57,732.00 360,000.00
Remittances from Overseas Filipino Workers 197 2,000.00 138,256.00 960,000.00 Receipts from Abroad 15 4,000.00 73,814.00 480,000.00 Receipts from Domestic Sources 62 1,000.00 17,970.00 150,000.00 Rentals Received 42 2,400.00 74,034.00 420,000.00 Interest Earned 69 150.00 12,822.00 720,000.00 Pension and Retirement Received 112 2,800.00 187,322.00 1,176,000 Dividends from Investment 8 150.00 24,695.00 164,400.00 Other Sources 160 1,000.00 142,984 12,200,000
Total 681 Source: CBMS 2010
Annual Per Capita Poverty Threshold
Of the 878 total numbers of households in Alapang, only 71 households had an annual per capita income of less than P15, 820 (poverty threshold), representing 8.09% of the total. The annual per capita poverty threshold is the minimum annual income required to be spent by each member of a family to satisfy their nutritional requirements and other basic needs. Nonetheless, none of them said that they experienced food shortage for the past three months.
Agriculture
There were 118 households who were engaged in agriculture, representing 13.44% of the total number of households in Alapang. Tenure Status. Out of 118 households who were engaged in farming, 62.71% or 74 farmers owned the agricultural land they were working on. A number of 25 farmers rent the agricultural land they were tilling, representing 21.19% of the total farmers. Sixteen (16) farmers representing 13.56% of the total farmers, do not actually own the land they were tilling but have the consent of the owner. Three (3) farmers did not specify the tenure status of the agricultural land they were working on.
27

Tenure Status(Agricultural Land) # %
Owned or owner-like possession 74 62.71% Rent 25 21.19% Not owned but with consent of owner 16 13.56% Not owned and without consent of owner 0 0.00% Other 3 2.54%
Total 118 100.00% Source: CBMS 2010
Agricultural Land Area. Seventy four (74) households worked on an agricultural land area less than one hectare representing 83.90% of the total number of farmers. There were also 17 households who cultivated 1-3 hectares of agricultural land
Agricultural Implements. There were 182 farmers who owned the equipment and facilities they used, representing 94.30% of all farmers. Eleven (11) farmers said that they do not own the equipment and facilities they used representing 5.70% of the total. The insecticide or pesticide sprayer was the most commonly used agricultural equipment which accounted to 104 farmers or 53.89% of the total number of farmers. Another 32 farmers owned a harrow, representing 16.58%. Twenty six (26) farmers had a mower, representing 13.47%. Lastly, the harvester was the least-owned equipment representing 4.66% of the total, or owned by 9 farmers.
Source: CBMS 2010 Livestock Raising. Only 13 households were engaged in livestock raising. Seven (7) households raised hog for fattening, representing 53.85% of all who were engaged in livestock raising. Chicken were raised by 5 households which accounted to 38.46% of the total. Only one (1) household raised sow representing 7.69%.
Livestock Being Raised by Households # % Hog for Fattening 7 53.85% Sow 1 7.69% Goat 0 0.00% Carabao 0 0.00% Cow 0 0.00%
Ownership of Equipments/Facilities # % Yes 182 94.30% No 11 5.70% Type of Agricultural Equipment or Facilities Used # % Beast of Burden 1 0.52% Plow 5 2.59% Harrow 32 16.58% Mower 26 13.47% Insecticide or Pesticide Sprayer 104 53.89% Farm Tractor 4 2.07% Hand Tractor 2 1.04% Harvester, Any Crop 9 4.66% Irrigation Pump 5 2.59% Other Equipment/Facilities 5 2.59%
28

Chicken 5 38.46% Chicken for Egg Laying 0 0.00% Duck 0 0.00% Other Livestock/Poultry 0 0.00%
Total 13 100.00% Source: CBMS 2010
There were 163 live animals, 3,780 kilograms of meat, 2 liters of milk and 1,202 pieces of eggs were produced annually by those households engaged in livestock or poultry raising.
Volume of Production of Livestock/Poultry Volume of Production Live animals 163 heads Meat 3,780 kgs. Milk 2 liters Eggs 1,202 pcs.
Source: CBMS 2010
Fishing A total of 40 kilograms of fish were harvested from fishpond with an area of less than one hectare.
Fishing Grounds # % Fishpond 1 100.00% Fish cage 0 0.00% Sea 0 0.00% Marsh 0 0.00% Lake 0 0.00% River 0 0.00% Stream/Creek 0 0.00% Others 0 0.00%
Total 1 100.00% Source: CBMS 2010
B. EMPLOYMENT Labor Force
The potential labor force of Alapang (those who are 15 to 64 years old) is 2,497 persons, with 1,236 males and 1,261 females. The actual labor force is 1,468 persons, which does not include those unable, not available and not looking for work (e.g. housewives, students, disabled, retired persons and seasonal workers). There were 1,375 persons who were employed which composed of 1,348 persons (who are 15 to 64 years old) and 27 persons (aged 65 years old and above) garnering a high 93.67% employment rate. Ninety three (93) persons were not employed representing 6.34% of the actual labor force.
29
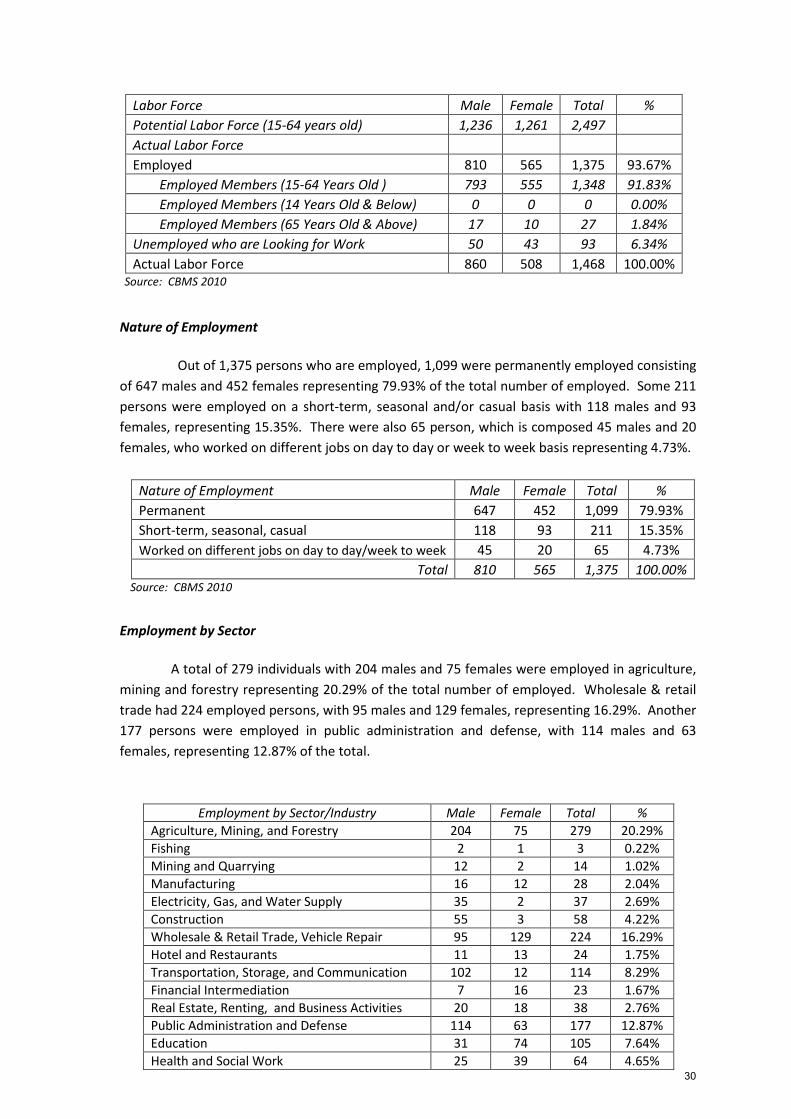
Labor Force Male Female Total % Potential Labor Force (15-64 years old) 1,236 1,261 2,497
Actual Labor Force Employed 810 565 1,375 93.67%
Employed Members (15-64 Years Old ) 793 555 1,348 91.83% Employed Members (14 Years Old & Below) 0 0 0 0.00% Employed Members (65 Years Old & Above) 17 10 27 1.84% Unemployed who are Looking for Work 50 43 93 6.34% Actual Labor Force 860 508 1,468 100.00%
Source: CBMS 2010
Nature of Employment
Out of 1,375 persons who are employed, 1,099 were permanently employed consisting of 647 males and 452 females representing 79.93% of the total number of employed. Some 211 persons were employed on a short-term, seasonal and/or casual basis with 118 males and 93 females, representing 15.35%. There were also 65 person, which is composed 45 males and 20 females, who worked on different jobs on day to day or week to week basis representing 4.73%.
Nature of Employment Male Female Total % Permanent 647 452 1,099 79.93% Short-term, seasonal, casual 118 93 211 15.35% Worked on different jobs on day to day/week to week 45 20 65 4.73%
Total 810 565 1,375 100.00% Source: CBMS 2010
Employment by Sector
A total of 279 individuals with 204 males and 75 females were employed in agriculture, mining and forestry representing 20.29% of the total number of employed. Wholesale & retail trade had 224 employed persons, with 95 males and 129 females, representing 16.29%. Another 177 persons were employed in public administration and defense, with 114 males and 63 females, representing 12.87% of the total.
Employment by Sector/Industry Male Female Total % Agriculture, Mining, and Forestry 204 75 279 20.29% Fishing 2 1 3 0.22% Mining and Quarrying 12 2 14 1.02% Manufacturing 16 12 28 2.04% Electricity, Gas, and Water Supply 35 2 37 2.69% Construction 55 3 58 4.22% Wholesale & Retail Trade, Vehicle Repair 95 129 224 16.29% Hotel and Restaurants 11 13 24 1.75% Transportation, Storage, and Communication 102 12 114 8.29% Financial Intermediation 7 16 23 1.67% Real Estate, Renting, and Business Activities 20 18 38 2.76% Public Administration and Defense 114 63 177 12.87% Education 31 74 105 7.64% Health and Social Work 25 39 64 4.65%
30
Other Community, Social/Personal Activities 62 51 113 8.22% Private HHs with Employed Persons 16 55 71 5.16% Extra- territorial Organization 3 0 3 0.22%
Total 810 565 1,375 100.00% Source: CBMS 2010
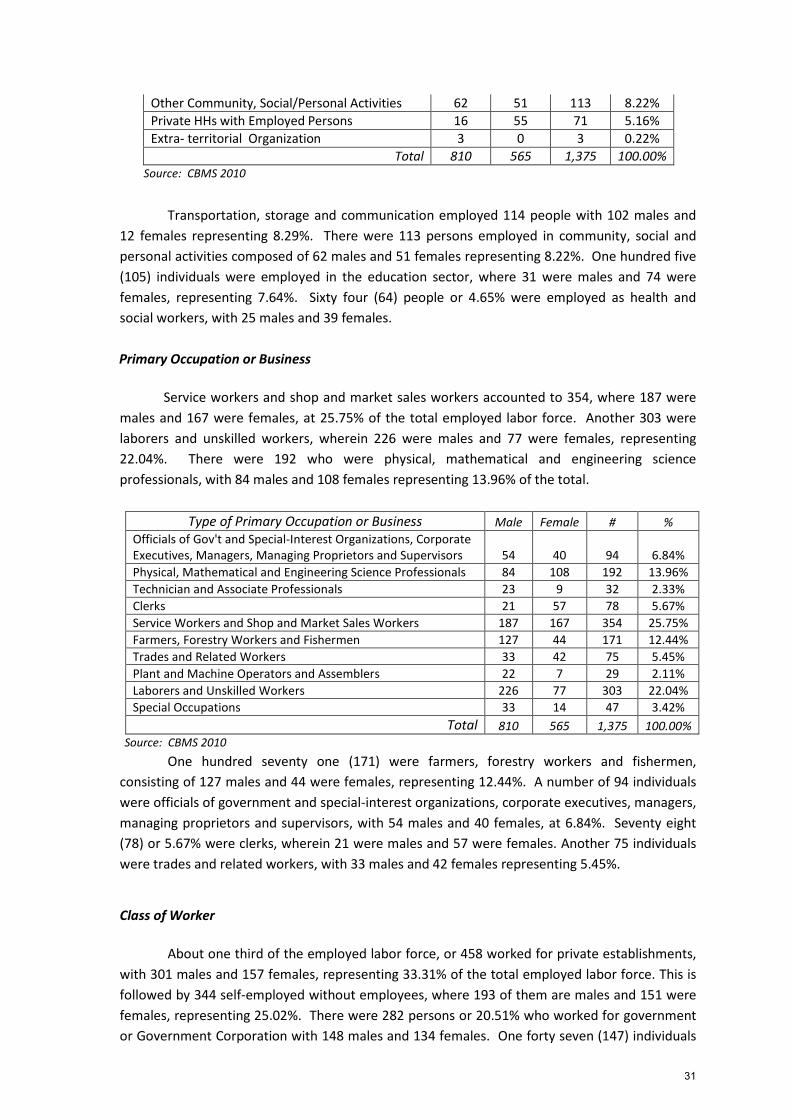
Transportation, storage and communication employed 114 people with 102 males and 12 females representing 8.29%. There were 113 persons employed in community, social and personal activities composed of 62 males and 51 females representing 8.22%. One hundred five (105) individuals were employed in the education sector, where 31 were males and 74 were females, representing 7.64%. Sixty four (64) people or 4.65% were employed as health and social workers, with 25 males and 39 females.
Primary Occupation or Business
Service workers and shop and market sales workers accounted to 354, where 187 were males and 167 were females, at 25.75% of the total employed labor force. Another 303 were laborers and unskilled workers, wherein 226 were males and 77 were females, representing 22.04%. There were 192 who were physical, mathematical and engineering science professionals, with 84 males and 108 females representing 13.96% of the total.
Type of Primary Occupation or Business Male Female # %
Officials of Gov't and Special-Interest Organizations, Corporate Executives, Managers, Managing Proprietors and Supervisors
54
40
94 6.84%
Physical, Mathematical and Engineering Science Professionals 84 108 192 13.96% Technician and Associate Professionals 23 9 32 2.33% Clerks 21 57 78 5.67% Service Workers and Shop and Market Sales Workers 187 167 354 25.75% Farmers, Forestry Workers and Fishermen 127 44 171 12.44% Trades and Related Workers 33 42 75 5.45% Plant and Machine Operators and Assemblers 22 7 29 2.11% Laborers and Unskilled Workers 226 77 303 22.04% Special Occupations 33 14 47 3.42%
Total 810 565 1,375 100.00% Source: CBMS 2010
One hundred seventy one (171) were farmers, forestry workers and fishermen, consisting of 127 males and 44 were females, representing 12.44%. A number of 94 individuals were officials of government and special-interest organizations, corporate executives, managers, managing proprietors and supervisors, with 54 males and 40 females, at 6.84%. Seventy eight (78) or 5.67% were clerks, wherein 21 were males and 57 were females. Another 75 individuals were trades and related workers, with 33 males and 42 females representing 5.45%. Class of Worker
About one third of the employed labor force, or 458 worked for private establishments, with 301 males and 157 females, representing 33.31% of the total employed labor force. This is followed by 344 self-employed without employees, where 193 of them are males and 151 were females, representing 25.02%. There were 282 persons or 20.51% who worked for government or Government Corporation with 148 males and 134 females. One forty seven (147) individuals
31

(where were 74 males and 73 were females) worked for a household representing 10.69% of the total.
Class of Worker Male Female Total % Worked for a household 74 73 147 10.69% Worked for a private establishment 301 157 458 33.31% Worked for government/ government corporation 148 134 282 20.51% Self-employed without employees 193 151 344 25.02% Employer in own family-operated farm or business 43 27 70 5.09% Worked with pay on own family operated farm/ business 16 8 24 1.75% Work without pay on own family operated farm/business 35 15 50 3.64%
Source: CBMS 2010
Professionals There were a total of 290 individuals who were professionals, of which 237 were males and 53 were females, representing 7.76 % of the total population. Almost a third were professional teachers at 88, with 68 males and 20 females representing 30.34% of the total number of professionals. This is followed by 63 nurses, of which 47 were males and 16 were females at 21.72%. Criminologists accounted to 36, with 34 males and 2 females representing 12.41% of the total. Fifteen (15) individuals were civil engineers, with 14 males and a female. There were also 9 attorneys, all males, representing 3.10% of the total number of professionals. Eight (8) were Certified Public Accountants, all males representing 2.76%. There were 7 Aeronautical engineers, wherein there were 5 males and 2 females, representing 2.41%.
Type of Professionals Male Female Total % Aeronautical Engineer 5 2 7 2.41% Agriculturist 4 2 6 2.07% Architect 3 0 3 1.03% Attorney-at-Law 9 0 9 3.10% Certified Public Accountant 8 0 8 2.76% Civil Engineer 14 1 15 5.17% Criminologist 34 2 36 12.41% Dentist 3 0 3 1.03% Elect. and Comm. Engineer 7 0 7 2.41% Forester 2 0 2 0.69% Geodetic Engineer 1 0 1 0.34% Mechanical Engineer 3 0 3 1.03% Medical Doctor 1 1 2 0.69% Medical Technologist 2 0 2 0.69%
32

Midwife 2 0 2 0.69% Nurse 47 16 63 21.72% Nutritionist Dietitian 0 1 1 0.34% Pharmacist 3 0 3 1.03% Physical Therapist 1 0 1 0.34% Physician 2 0 2 0.69% Professional Mechanical Engineer 1 0 1 0.34% Professional Teacher 68 20 88 30.34% Social Worker 0 1 1 0.34% Third Mate 1 0 1 0.34% Veterinarian 1 0 1 0.34% Others 15 7 22 7.59%
Total 237 53 290 100.00% Source: CBMS 2010
Unemployment and Job Search Method
There were 93 unemployed members of the labor force who were searching for work in year 2010, wherein 50 were males and 43 were females. About one fourth of them, or twenty three (23) individuals registered in a public employment agency as their method of searching for a job. About 12 of them were males and 11 were females, representing 24.73% of the total number of unemployed. Another 23 individuals placed or answered private advertisements, with 15 males and 8 females, representing 24.73%. Seventeen (17) unemployed members approached their relatives or friends, of which 9 were males and 8 were females representing 18.28%. Another 15 individuals approached the employer directly, with 8 males and 7 females, representing 16.13%. Thirteen (13) unemployed members registered in private employment agencies, wherein 5 were males and 8 were females, representing 13.98%.
Job Search Method Male Female Total %
Registered in public employment agency 12 11 23 24.73% Registered in private employment agency 5 8 13 13.98% Approached employer directly 8 7 15 16.13% Approached relatives/friends 9 8 17 18.28% Placed or answered private advertisements 15 8 23 24.73% Others 1 1 2 2.15%
Total 50 43 93 100.00% Source: CBMS 2010
Reason for Not Searching or Applying for a Job
Of the potential labor force aged 15 to 64 years old, 1,056 individuals or 42.29% were not searching or applying for work. Most of them were students, which accounted to 500, where 238 were males and 262 were females, representing 47.35% of the total. Some 312 persons were not in search for job due to housekeeping duties, representing 29.55%. Seventy six (76) or 7.20% were either too young or too old, retired, and/or permanently disabled.
Reasons For Not Looking For Work Male Female Total % Believes no work is available 7 4 11 1.04% Awaiting results of previous job application 7 5 12 1.14% Temporary illness/disability 26 13 39 3.69% Bad Weather 0 1 1 0.09% Waiting for rehire/job recall 9 5 14 1.33% Too young/old, retired, permanently disabled 38 38 76 7.20%
33

Housekeeping 26 286 312 29.55% Schooling 238 262 500 47.35% Other reasons 42 49 91 8.62%
Total 393 663 1,056 100.00% Source: CBMS 2010
There were also 39 individuals, with 26 males and 13 females, who were temporarily ill or disabled which represents 3.69% of the total number of members who were not looking for a job. Fourteen (14) people were waiting to be rehired, and 12 individuals were waiting for the results of previous job application, representing 1.33% and 1.14% respectively.
Overseas Employment
There were 129 former members of the households in Alapang who were Overseas Filipino workers, where 77 were males and 52 were females.
Twenty (20) individuals were workers in Saudi Arabia representing 15.50% of the total number of OFWs. There were 16 or 12.40% Overseas Filipino Workers in United States of America. Canada hired 14 individuals representing 10.85%. Workers in Hong Kong were at 12, representing 9.30%. Other 11 individuals were in Japan representing 8.53% of the total.
Source: CBMS 2010
Kind of Work Abroad
As to kind of work abroad, 46 individuals were laborers or unskilled workers, with 30 males and 16 females, representing 35.66% of the total number of OFWs. There were 39 people, 22 males and 17 females, who were service, shops and market sales workers representing 30.23%. Another 34 workers with 21 males and 13 females were physical, mathematical and engineering science professionals representing 26.36%.
Kind of Work in Abroad Male Females Total %
Officials of Gov’t & Special-Interest Organizations, Corporate Executives, Managers, Managing Proprietors and Supervisors 2 0 2 1.55% Physical, Mathematical and Engineering Science Professionals 21 13 34 26.36% Technician and Associate Professionals 0 4 4 3.10% Clerks 0 1 1 0.78%
Country of Work # % Country of Work # % Australia 2 1.55% Morocco 1 0.78% Bahrain 2 1.55% New Zealand 1 0.78% Central African Republic 1 0.78% Qatar 4 3.10% Canada 14 10.85% Saudi Arabia 20 15.50% China 4 3.10% Singapore 6 4.65% Greece 2 1.55% Spain 1 0.78% Hong Kong 12 9.30% Taiwan 1 0.78% Israel 3 2.33% Trinidad and Tobago 1 0.78% Italy 6 4.65% Turks and Caicos Islands 2 1.55% Japan 11 8.53% United Arab Emirates 4 3.10% Korea 4 3.10% United Kingdom o 2 1.55% Kuwait 1 0.78% United States of America 16 12.40% Macao 1 0.78% Other Country 5 3.88% Malaysia 2 1.55% Total 129 100.00%
34

Service Workers and Shop and Market Sales Workers 22 17 39 30.23% Farmers, Forestry Workers and Fishermen 0 1 1 0.78% Trades and Related Workers 0 0 0 0.00% Plant and Machine Operators and Assemblers 0 0 0 0.00% Laborers and Unskilled Workers 30 16 46 35.66% Special Occupations 2 0 2 1.55%
Total 77 52 129 100.00% Source: CBMS 2010
C. INFRASTRUCTURE & UTILITIES
Electricity
There were 844 households has electrical connections with BENECO, accounted to 96% of the total population. Thirty three (33) households had no electrical connection, representing 3.76%. The average monthly electrical bill was at Ᵽ881.00. Number of Households with Electricity Connections: 844 (96% of total households)
Number of Households w/o Electrical Connections : 33 (4% of total households)
Average Monthly Electrical Bill : Ᵽ881.00
Source of Electricity # %
Electric Company 844 96.13% Generator 0 0.00% Solar 0 0.00% Battery 0 0.00% Others 1 0.11% None 33 3.76%
Total 878 100.00% Source: CBMS 2010
Access to Safe Drinking Water Only 212 households or 24.15% of the total number households have access to safe drinking water (bottled water). There were 462 households or 52.62% whose water is connected to the community water system and 29 households have shared water system. Rivers, stream, lake and/or spring were the sources of drinking water for 132 households representing 15.03%. Forty two (42) households have water delivered through tanker trucks and /or peddlers. This represents 4.78% of the total number of households.
Source of Drinking Water # %
Community Water System-own 462 52.62% Community Water System-shared 29 3.30% Deep Well-own 1 0.11% Deep Well-shared 0 0.00% Artesian Well-own 0 0.00%
35

Artesian Well-shared 0 0.00% Dug/Shallow Well-own 0 0.00% Dug/Shallow Well-shared 0 0.00% River, Stream, Lake, Spring 132 15.03% Bottled Water 212 24.15% Tanker Truck/Peddler 42 4.78% Others 0 0.00%
Total 878 100.00% Source: CBMS 2010
More than half of the total number of households, or 51.14%, had sources of drinking water within their premises. Households whose source of drinking water is outside their premises, and more than 250 meters, were at 117, representing 13.33%. There were also 58 households whose source of drinking water is outside premises but just around 250 meters or less.
Distance of Source of Drinking Water # % Within Premises 449 51.14% Outside Premises But 250 Meters/Less 58 6.61% 251 Meters or More 117 13.33% Don't Know 0 0.00% Not Stated 254 28.93%
Total 878 100.00% Source: CBMS 2010
Domestic Water System
The Barangay Alapang Multi-Purpose Cooperative (BALMUCO) runs a domestic water system which serves majority of the households in the barangay. About 491 households are serviced by the system covering Camp Dangwa, Dapiting, Alapang Proper, Ettong and Samoyao-Alapang. As per record of La Trinidad Water District, about 186 households were serviced by their domestic water system. Roads
Name of Road Length (km)
Road ROW (m)
Area of Jurisdiction
Remarks
Alno-Tuel-Balway Road 8.550 4.000 Provincial Concrete/Gravel/Dirt Alapang Prop-Samoyao Road Barangay Concrete Samoyao-Bagto Road 0.854 2.440 Barangay Concrete Samoyao-Peril-Ongasan Road 1.441 2.970 Barangay Concrete
Source: CLUP 2000-10 & 2013-2023
CBMS Indicators of Poverty
The informal settler is the most felt problem in Alapang where majority of the informal settlers are located at Camp Dangwa. Some 153 informal settlers were in Camp Dangwa, 2 in Alapang Proper, 2 in Dapiting and only one in Ettong.
36
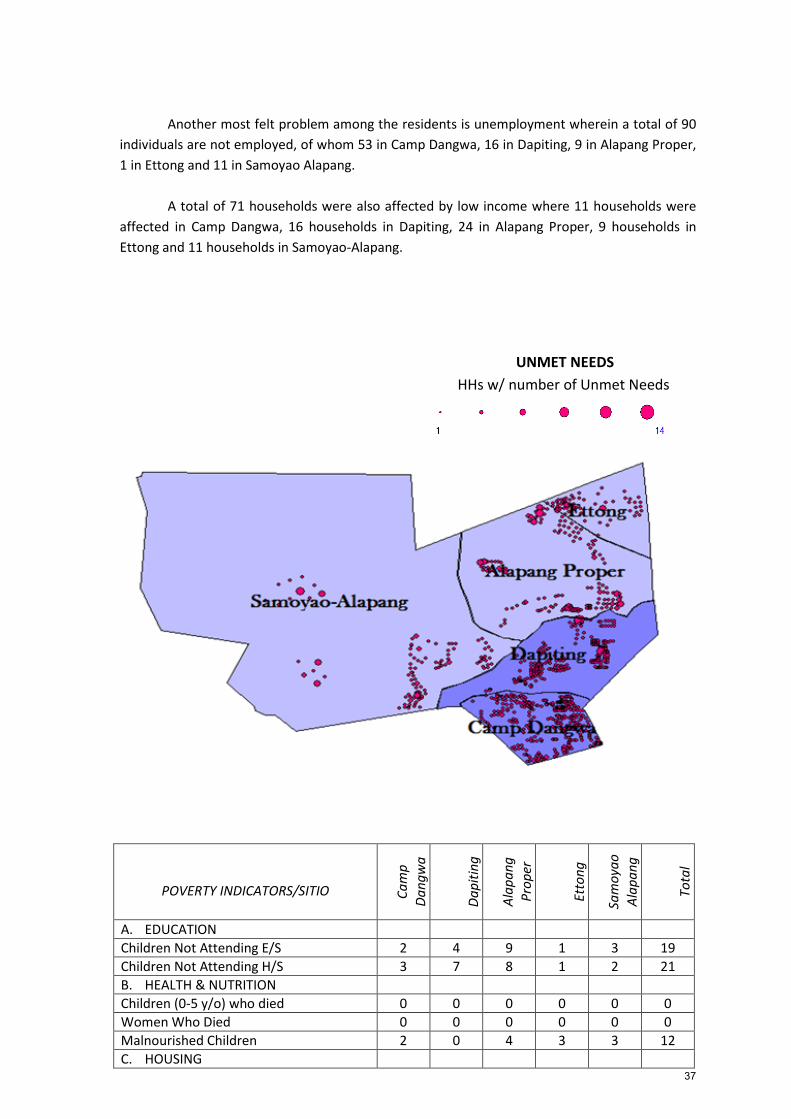
Another most felt problem among the residents is unemployment wherein a total of 90 individuals are not employed, of whom 53 in Camp Dangwa, 16 in Dapiting, 9 in Alapang Proper, 1 in Ettong and 11 in Samoyao Alapang. A total of 71 households were also affected by low income where 11 households were affected in Camp Dangwa, 16 households in Dapiting, 24 in Alapang Proper, 9 households in Ettong and 11 households in Samoyao-Alapang.
POVERTY INDICATORS/SITIO Ca
mp
Dang
wa
Da
pitin
g
Alap
ang
Prop
er
Et
tong
Sam
oyao
Alap
ang
To
tal
A. EDUCATION Children Not Attending E/S 2 4 9 1 3 19 Children Not Attending H/S 3 7 8 1 2 21 B. HEALTH & NUTRITION Children (0-5 y/o) who died 0 0 0 0 0 0 Women Who Died 0 0 0 0 0 0 Malnourished Children 2 0 4 3 3 12 C. HOUSING
UNMET NEEDS HHs w/ number of Unmet Needs
37

HH Who are Squatters 153 2 2 1 0 158 HH in Makeshift Housing 1 1 5 1 2 10 D. INCOME & LIVELIHOOD HH w/ incomes Below Poverty Threshold 11 16 24 9 11 71 HH w/ Incomes Below Food Threshold 2 10 11 4 6 33 HH who Experience Hunger 0 0 0 0 0 0 Unemployed 53 16 9 1 11 90 E. WATER & SANITATION HH w/o Access to Safe Water 0 0 10 5 4 19 HH w/ No Sanitary Toilet 0 0 1 0 2 3
Source: CBMS 2010, as verified by Barangay Officials in 2012
38