physician clinic measures
TRANSCRIPT

pHysiCian CliniC Measures | November 2010 | 2010 Health Care Quality Report12
region 4region 4 southwest, southeast and south Central, Big Stone, Blue Earth, Brown, Chippewa, Cottonwood, Dodge, Faribault, Fillmore, Freeborn, Goodhue, Houston, Jackson, Kandiyohi, Lac qui Parle, Le Sueur, Lincoln, Lyon, Martin, McLeod, Meeker, Mower, Murray, Nicollet, Nobles, Olmsted, Pipestone, Redwood, Renville, Rice, Rock, Sibley, Steele, Swift,, Wabasha, Waseca, Watonwan, Winona, Yellow Medicine
Physician Clinic Measures
November 2010 | 2010 Health Care Quality Report | pHysiCian CliniC Measures 13
Quality of Care for CHroniC ConDitions . . . . . . . . . . . . . . . . . . . . . . . . . . 15
Table of Results . . . . . . . . . . . . . . . . . . . . . . . . . . . . . . . . . . . . . . . . . . . . . . . . . . . . 25
Quality of Care for aCute ConDitions . . . . . . . . . . . . . . . . . . . . . . . . . . . . 18
Table of Results . . . . . . . . . . . . . . . . . . . . . . . . . . . . . . . . . . . . . . . . . . . . . . . . . . . . 25
Quality of preventive Care . . . . . . . . . . . . . . . . . . . . . . . . . . . . . . . . . . . . . . . 21
Table of Results . . . . . . . . . . . . . . . . . . . . . . . . . . . . . . . . . . . . . . . . . . . . . . . . . . . . 25
Choose the health care quality topic you want to learn about. Physician clinic quality information is available for three main topics in this section. These areas include:
n Chronic Conditions (Ongoing Conditions)
n Acute Conditions (Shorter Term Illnesses)
n Preventive Care (Avoiding Illness)
One topic may be of greater interest to you than others. For ex-ample, if you or a loved one has a chronic or ongoing condition like diabetes, you will probably be interested in the “Chronic Conditions” topic. However, if you are interested in finding out how well your clinic does with keeping you healthy, check out the “Preventive Care” section.
Physician Clinic Measures

Quality HealtH Care Measures | November 2010 | 2010 Health Care Quality Report14
Each topic includes information on several different quality indica-tors. A quality indicator is information, in this case a percentage rate, that shows how often patients had a particular experience when they received medical care. These experiences reflect a par-ticular aspect of health care quality. Each health topic is briefly de-scribed below, with examples of quality indicators for that topic. To learn about all the indicators presented for each topic, please turn to the appropriate page noted in the index at the start of this section.
Chronic Conditions: Chronic conditions are ongoing and cannot be cured, but can be managed with the right kinds of treatments. This section includes measures related to chronic conditions like diabe-tes, vascular care, high blood pressure, and asthma.
acute Conditions: Acute conditions are illnesses that don’t last very long, typically less than three months. This section includes measures for the treatment of acute conditions like colds and sore throats in children, as well as bronchitis in adults.
preventive Care: Preventive care can help keep you healthy, as well as detect certain illnesses early, when treatment can be more effective. This section includes preventive measures like cancer screenings, chlamydia tests, and childhood immunizations.
More Information about the ResultsBe sure to note whether a higher or lower percentage rate is bet-ter for the measure you are interested in. for all of the physician clinic measures, a higher percentage rate is always going to be better. Keep in mind the percentage rate is related to how many patients out of one hundred reached the treatment goals, or received the right type of medication. For example, if the clinic rate for the “Best Care for Adults with Diabetes” measure is 36%, this means 36 out of 100 patients achieved the five goals outlined in this measure.

November 2010 | 2010 Health Care Quality Report | pHysiCian CliniC Measures 15
Quality of Care for Chronic Conditions
Quality of Care for CHroniC ConDitions seCtion Contents
The Best Care for Adults with Diabetes . . . . . . . . . . . . . . . . . . . . . . . . . . . . 16
The Best Care for Adults with Vascular Disease . . . . . . . . . . . . . . . . . . . . . . 16
The Best Care for Adults with High Blood Pressure . . . . . . . . . . . . . . . . . . . 17
The Best Care for Children and Adults with Asthma . . . . . . . . . . . . . . . . . . . 17
Table of Results . . . . . . . . . . . . . . . . . . . . . . . . . . . . . . . . . . . . . . . . . . . . . . . 25
Appendix Table . . . . . . . . . . . . . . . . . . . . . . . . . . . . . . . . . . . . . . . . . . . . . . . . 90
Chronic health conditions are ongoing health conditions like diabetes or heart disease. These conditions are preva-lent and costly. For example, in 2007 about 7.8% of the US population had diabetes. This translates to a cost of $174 billion in direct costs like medical expenses, and indirect costs like disability and work loss. Not only are these con-ditions expensive, but they can be difficult to manage and lead to other medical conditions. However, there are treat-ments and treatment goals which have been proven to help those with chronic conditions stay healthy and limit their risk of other complications. The following section includes measures that help patients with chronic conditions stay healthy.

pHysiCian CliniC Measures | November 2010 | 2010 Health Care Quality Report16
The Best Care for Adults with Diabetes
What is the measure?The best care for diabetes includes helping patients achieve five goals. This measure shows the percentage of diabetes patients, ages 18-75, who met all five goals:
1) Blood Sugar Control: Most recent HbA1C test in the last 12 months has a level of less than 8%
2 Blood Pressure Control: Most recent blood pressure in the last 12 months was less than 130/80 mm Hg
3) Cholesterol Control: Most recent LDL or “bad” cholesterol was less than 100 mg/dl
4) Daily aspirin use (or a documented contraindication) for those ages 41 or older
5) Tobacco free status: No smoking or chewing of tobacco
Why is this important?The five goals identified in this measure have been shown to have the greatest im-pact on the health of those with diabetes. Heart disease and stroke are the leading causes of early death among people with diabetes. Those diabetes patients who meet the five goals outlined in this mea-sure will greatly lower their risk of heart attacks, blood vessel damage and other vascular diseases. They will also experience fewer problems with their kidneys, eyes and nervous system.
performance on this measure ranged from zero percent to 57 percent.
Measure sourCe: optimal Diabetes Care Composite
The Best Care for Adults with Vascular Disease
What is the measure?The best care for vascular disease includes helping patient achieve four goals. This measure shows the percentage of vascular patients ages 18-75, who met all four goals:
1) Blood Pressure Control: Most recent blood pressure in the last 12 months was less than 130/80 mm Hg
2) Cholesterol Control: Most recent LDL or “bad” cholesterol was less than 100 mg/dl
3) Daily aspirin use (or a documented contraindication) 4) Tobacco Free Status: No smoking or chewing of tobacco
Why is this important? Vascular disease is any condition that affects the blood vessels and lim-its their ability to supply blood, oxygen and nutrients to the body from the heart. Vascular disease is most commonly due to hardening of the arteries or the slow build-up of fatty substances over time along the blood vessel wall, which make it harder for the heart to pump blood through the artery. Depending on which arteries become blocked, dif-ferent parts of the body can be affected by this reduction in blood flow, which is also called ischemia. A blockage in the coronary arteries, or the blood vessels of the heart, can lead to chest pain or a heart attack. Achieving the four treatment goals in this measure will help stop the build-up of fatty substances along the blood vessel wall that make it harder for the heart to pump blood.
performance on this measure ranged from zero percent to 63 percent.
Measure sourCe: optimal vascular Care Composite
When choosing a clinic, look for the clinic that has a
higher rate.
When choosing a clinic, look for the clinic that has a
higher rate.

November 2010 | 2010 Health Care Quality Report | pHysiCian CliniC Measures 17
When choosing a clinic, look for the clinic that has a
higher rate.
When choosing a clinic, look for the clinic that has a
higher rate.
The Best Care for Adults with High Blood Pressure
What is the measure?The best treatment for high blood pressure includes keeping blood pressure below 140/90 mmHg. This measure shows the percentage of adults, ages 18-85, diagnosed with high blood pressure that had a blood pressure reading lower than 140/90 mmHg.
Why is this important?High blood pressure, also known as hypertension, is a major risk factor for other diseases including heart attack, heart disease, kidney failure and stroke. Having your blood pressure monitored regularly and working with your doctor to keep your blood pres-sure below 140/90 mmHg can reduce your risk of developing these conditions.
High blood pressure is often called the “silent killer” because many people don’t know they have it. The only way to know is to have your blood pressure checked.
performance on this measure ranged from 34 percent to 85 percent.
Measure sourCe: HeDis: Controlling High Blood pressure
The Best Care for Children and Adults with Asthma
What is the measure?The best treatment for asthma includes a prescription medica-tion (such as an inhaler) to control the symptoms. This measure shows the percentage of asthma patients, ages 5-56, who were prescribed appropriate medication.
Why is this important? Asthma is one of the most common chronic conditions in the United States. It causes the tiny airways that bring air to the lungs to narrow, reducing the flow of oxygen to the body. For asthma sufferers, a trigger such as cigarette smoke, perfume, allergies or dust in the air can cause the tiny airways to constrict, choking the flow of oxygen to the body’s systems. Symptoms of asthma include difficulty breathing or shortness of breath, a tight feeling in the chest, coughing and wheezing. Inhaled corticosteroids are the recommended therapy for those with moder-ate to severe asthma. When used regularly they are proven to reduce the inflammation in the airways caused by asthma.
performance on this measure ranged from 81 percent to 97 percent.
Measure sourCe: HeDis: use of appropriate Medications for people
with asthma

pHysiCian CliniC Measures | November 2010 | 2010 Health Care Quality Report18
Quality of Care for Acute Conditions
Quality of Care for aCute ConDitions seCtion Contents
The Best Care for Children with a Cold . . . . . . . . . . . . . . . . . . . . . . . . . . . . . 19
The Best Care for Children with a Sore Throat . . . . . . . . . . . . . . . . . . . . . . . 19
The Best Care for Adults with Bronchitis . . . . . . . . . . . . . . . . . . . . . . . . . . . . 20
Table of Results . . . . . . . . . . . . . . . . . . . . . . . . . . . . . . . . . . . . . . . . . . . . . . . 25
Appendix Table . . . . . . . . . . . . . . . . . . . . . . . . . . . . . . . . . . . . . . . . . . . . . . . 120
Acute health conditions usually happen suddenly and do not last long. Typically, acute illnesses last less than three months. A sore throat or a cold are both considered acute conditions. Treating these illnesses might not involve any prescription medication. In fact, the best treatment could be over-the-counter medication or getting some rest. The fol-lowing section includes measures for acute conditions where the best treatment was given for the identified illness. This includes measures showing whether antibiotics were appro-priately prescribed.

November 2010 | 2010 Health Care Quality Report | pHysiCian CliniC Measures 19
When choosing a clinic, look for the clinic that has a
higher rate.
When choosing a clinic, look for the clinic that has a
higher rate.
The Best Care for Children with a Cold
What is the measure?Treatment of the common cold should not include prescribing antibiotics. This measure shows the percentage of children, 3 months to 18 years, diagnosed with a cold and not given an antibiotic.
Why is this important?The most effective cure for the common cold is self-care at home. This can include over-the-counter medication, drinking fluids, and getting plenty of rest. There are over 200 viruses which can cause this illness, and antibiotics are not effective against viruses such as colds.
Remember, antibiotics are medicines that kill bacteria, not vi-ruses. Taking antibiotics for viral illnesses, like the common cold, will not work. Even worse, using antibiotics when they are not needed may make them less likely to work for other illnesses in the future.
performance on this measure ranged from 40 percent to 97 percent.
Measure sourCe: HeDis: appropriate treatment for Children with
upper respiratory infection
The Best Care for Children with a Sore Throat
What is the measure?In some cases, the treatment of a sore throat includes prescrib-ing antibiotics. This measure shows the percentage of children, ages 2-18, diagnosed with a sore throat and given a strep test and antibiotics rather than just receiving antibiotics without a strep test.
Why is this important? Most sore throats are caused by viruses and go away on their own after about a week. Sore throats not caused by viruses are usually caused by a bacterium called group A Streptococcus, and commonly called strep throat. Strep throat can be treated with antibiotics. Untreated strep throat can lead to rare but serious complications.
performance on this measure ranged from 27 percent to 99 percent.
Measure sourCe: HeDis: appropriate testing for Children with
pharyngitis

pHysiCian CliniC Measures | November 2010 | 2010 Health Care Quality Report20
When choosing a clinic, look for the clinic that has a
higher rate.
The Best Care for Adults with Bronchitis
What is the measure?Treatment of bronchitis in adults should not include prescribing antibiotics. This measure shows the percentage of adults 18 - 64 years, diagnosed with acute bron-chitis and not given an antibiotic.
Why is this important?Acute bronchitis is sometimes also called a chest cold. The most effec-tive cure for acute bronchitis is similar to when you have a cold. It can include over-the-counter medication to help quiet your cough, drinking fluids and getting plenty of rest.
Antibiotics are medicines that kill bacteria. Only one in ten cases of bronchitis are bacterial, which means 9 out of 10 cases of bronchitis won’t be cured with an antibiotic. Also, using antibi-otics when they are not needed may make them less likely to work for other illnesses in the future.
performance on this measure ranged from seven percent to 57 percent.
Measure sourCe: HeDis: avoidance of antibiotic treatment in adults
with acute Bronchitis

November 2010 | 2010 Health Care Quality Report | pHysiCian CliniC Measures 21
Quality of Preventive Care
Quality of preventive Care seCtion Contents
The Best Care to Help Prevent Breast Cancer . . . . . . . . . . . . . . . . . . . . . . . . 22
The Best Care to Help Prevent Cervical Cancer . . . . . . . . . . . . . . . . . . . . . . 22
The Best Care to Help Prevent Colorectal Cancer . . . . . . . . . . . . . . . . . . . . . 23
The Best Care to Help Prevent Cancer . . . . . . . . . . . . . . . . . . . . . . . . . . . . . 23
The Best Care to Detect Chlamydia . . . . . . . . . . . . . . . . . . . . . . . . . . . . . . . . 24
The Best Care to Provide Childhood Immunizations . . . . . . . . . . . . . . . . . . . 24
Table of Results . . . . . . . . . . . . . . . . . . . . . . . . . . . . . . . . . . . . . . . . . . . . . . . 25
Appendix Table . . . . . . . . . . . . . . . . . . . . . . . . . . . . . . . . . . . . . . . . . . . . . . . 150
Preventive care keeps you healthy by avoiding an illness altogether or detecting it early when treatment can be most effective. Receiving the right screenings and treatments are an important part of health care quality. For example, can-cer screenings done at the right time can help detect abnor-mal cells early before they turn into cancer. The following section includes preventive care measures where the right screenings or treatments were given at the right time for the identified illness.

pHysiCian CliniC Measures | November 2010 | 2010 Health Care Quality Report22
When choosing a clinic, look for the clinic that has a
higher rate.
When choosing a clinic, look for the clinic that has a
higher rate.
The Best Care to Help Prevent Breast Cancer
What is the measure?Women of a certain age should get a regular mammogram to check for signs of breast cancer. This measure shows the per-centage of women, ages 52-69, who had a mammogram during the past two years.
Why is this important?A mammogram is the screening test used to check for breast cancer. It detects cancer early, when it can be treated most successfully. Breast cancer is the most common cancer affecting women in the United States. It is also the second leading cause of cancer death in women.
performance on this measure ranged from 55 percent to 91 percent.
Measure sourCe: HeDis: Breast Cancer screening
The Best Care to Help Prevent Cervical Cancer
What is the measure?Prevention of cervical cancer in women includes getting a regular Pap test. This measure shows the percentage of wom-en, ages 24-64, who received a Pap test in the last 3 years.
Why is this important? Cervical cancer develops slowly. Getting regular screenings can lead to early detection and successful treatment. Screening is done using Pap tests in which cells are taken from the cervix. The cells are then examined for abnormalities.
performance on this measure ranged from 50 percent to 89 percent.
Measure sourCe: HeDis: Cervical Cancer
screening

November 2010 | 2010 Health Care Quality Report | pHysiCian CliniC Measures 23
When choosing a clinic, look for the clinic that has a
higher rate.
When choosing a clinic, look for the clinic that has a
higher rate.
The Best Care to Help Prevent Colorectal Cancer
What is the measure?Adults of a certain age should receive a test to check for col-orectal cancer. This measure shows the percentage of adults, ages 51-80, who received one or more of four proven screening tests:
n Fecal occult blood test n Flexible sigmoidoscopy n Double contrast barium enema n Colonoscopy
Why is this important?Most colorectal cancer begins as a polyp. A polyp is a growth projecting from the colon or rectum. Polyps can be detected during screening exams. The removal of the polyp can be the key to preventing colon cancer.
performance on this measure ranged from 43 percent to 94 percent.
Measure sourCe: HeDis: Colorectal Cancer screening
The Best Care to Help Prevent Cancer
What is the measure?Tests to check for cancer are an important part of preventive care for people of a certain age. This measure shows the per-centage of adults, ages 51-80, who received appropriate cancer tests.
For women, this measure includes getting tested for:n Breast cancern Cervical cancer, and n Colorectal cancer
For men, this measure includes getting tested for:n Colorectal cancer
Why is this important? Cancer is the result of uncontrolled growth and spread of abnormal cells. Each type of cancer varies in how fast it grows and how it may spread in the body. The causes of cancer are complex and they may involve the individual’s inherited genetics, as well as outside factors such as exposure to chemicals, smoke and the sun. Getting the right cancer screenings can catch the cancer early, leading to more successful treatment.
performance on this measure ranged from 15 percent to 89 percent.
Measure sourCe: HeDis: Cancer screening Combined

pHysiCian CliniC Measures | November 2010 | 2010 Health Care Quality Report24
When choosing a clinic, look for the clinic that has a
higher rate.
When choosing a clinic, look for the clinic that has a
higher rate.
The Best Care to Detect Chlamydia
What is the measure?Testing for Chlamydia is important for the health of teenage and young women who are having sex. This measure shows the percentage of sexually-active females, ages 16-25, who re-ceived a Chlamydia test.
Why is this important?Chlamydia is the most common sexually-transmitted infection in the United States. Many infected people have no symptoms. If left untreated, it can lead to infertility, or complications during pregnancy.
performance on this measure ranged from 15 percent to 81 percent.
Measure sourCe: HeDis: Chlamydia screening in Women
The Best Care to Provide Childhood Immunizations
What is the measure?Protecting children from diseases involves getting important shots (vaccinations) when they will do the most good. This mea-sure shows the percentage of children who received all of these vaccinations by the age of two:
n Diphtheria and Tetanusn Polion Measles, Mumps and Rubella n H Influenza Type B n Hepatitis B n Chicken Pox n Pneumococcal
Why is this important? Before immunizations, infectious diseases often harmed or even killed infants, children and adults. While some of these diseases have been greatly reduced or even eliminated, these diseases could return and spread if children are not immunized against them. It is important that vaccinations are given at the right time for them to work the best.
performance on this measure ranged from 54 percent to 92 percent.
Measure sourCe: HeDis: Childhood immunization status

November 2010 | 2010 Health Care Quality Report | pHysiCian CliniC Measures 25
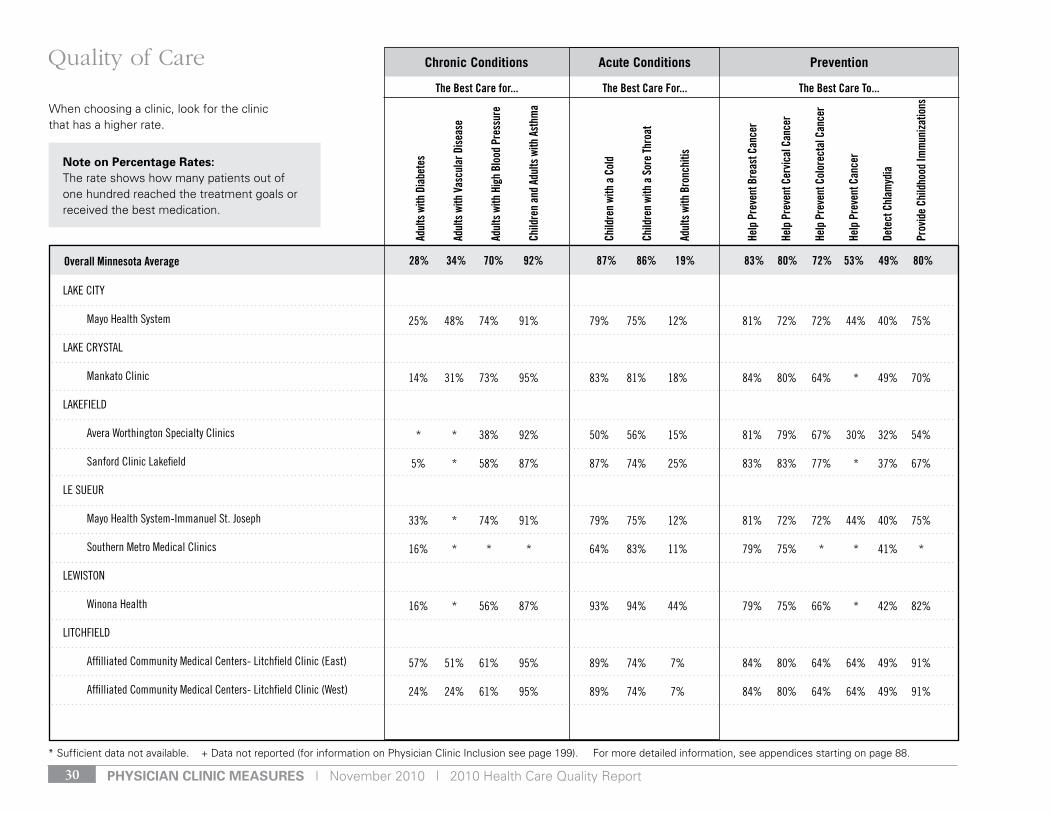
Chronic Conditions PreventionAcute Conditions
When choosing a clinic, look for the clinic that has a higher rate.
Overall Minnesota Average 28% 34% 70% 92% 87% 86% 19% 83% 80% 72% 53% 49% 80%
The Best Care for... The Best Care For... The Best Care To...
* Sufficient data not available. + Data not reported (for information on Physician Clinic Inclusion see page 199). For more detailed information, see appendices starting on page 88.
Adul
ts w
ith D
iabe
tes
Adul
ts w
ith V
ascu
lar D
iseas
e
Adul
ts w
ith H
igh
Bloo
d Pr
essu
re
Child
ren
and
Adul
ts w
ith A
sthm
a
Child
ren
with
a C
old
Child
ren
with
a S
ore
Thro
at
Adul
ts w
ith B
ronc
hitis
Help
Pre
vent
Bre
ast C
ance
r
Help
Pre
vent
Cer
vical
Can
cer
Help
Pre
vent
Col
orec
tal C
ance
r
Help
Pre
vent
Can
cer
Dete
ct C
hlam
ydia
Prov
ide
Child
hood
Imm
uniza
tions
Quality of Care
note on percentage rates:The rate shows how many patients out of one hundred reached the treatment goals or received the best medication.
10% * 58% 87% 87% 74% 25% 83% 83% 77% * 37% 67%
20% 29% 74% 91% 79% 75% 12% 81% 72% 72% 44% 40% 75%
6% * 51% 91% 73% 72% 12% 79% 76% 43% 15% 35% 70%
3% 12% * * * 95% * 74% 66% * * * *
21% 33% 74% 91% 79% 75% 12% 81% 72% 72% 44% 40% 75%
+ + * * * * * * * * * * *
35% 42% 61% 95% 89% 74% 7% 84% 80% 64% 64% 49% 91%
10% 31% * * 82% * * * * * * * *
AdriAn
Sanford Clinic Adrian
Albert leA
Mayo Health System- Albert lea Medical Center
Appleton
Appleton Clinic
Arlington
Sibley Medical Center
AuStin
Mayo Health System- Austin Medical Center
Smart Clinic
benSon
Affilliated Community Medical Centers
blue eArtH
united Hospital district Clinic

pHysiCian CliniC Measures | November 2010 | 2010 Health Care Quality Report26
Chronic Conditions PreventionAcute Conditions
When choosing a clinic, look for the clinic that has a higher rate.
Overall Minnesota Average 28% 34% 70% 92% 87% 86% 19% 83% 80% 72% 53% 49% 80%
The Best Care for... The Best Care For... The Best Care To...
* Sufficient data not available. + Data not reported (for information on Physician Clinic Inclusion see page 199). For more detailed information, see appendices starting on page 88.
Adul
ts w
ith D
iabe
tes
Adul
ts w
ith V
ascu
lar D
iseas
e
Adul
ts w
ith H
igh
Bloo
d Pr
essu
re
Child
ren
and
Adul
ts w
ith A
sthm
a
Child
ren
with
a C
old
Child
ren
with
a S
ore
Thro
at
Adul
ts w
ith B
ronc
hitis
Help
Pre
vent
Bre
ast C
ance
r
Help
Pre
vent
Cer
vical
Can
cer
Help
Pre
vent
Col
orec
tal C
ance
r
Help
Pre
vent
Can
cer
Dete
ct C
hlam
ydia
Prov
ide
Child
hood
Imm
uniza
tions
Quality of Care
note on percentage rates:The rate shows how many patients out of one hundred reached the treatment goals or received the best medication.
22% 19% 57% 93% 82% 87% 8% 87% 78% 56% * 46% 81%
29% 33% 74% 91% 79% 75% 12% 81% 72% 72% 44% 40% 75%
14% 17% 58% 87% 87% 74% 25% 83% 83% 77% * 37% 67%
21% * 74% 91% 79% 75% 12% 81% 72% 72% 44% 40% 75%
13% * 57% 93% 82% 87% 8% 87% 78% 56% * 46% 81%
* * 51% 91% 73% 72% 12% 79% 76% 43% 15% 35% 70%
* * 51% 91% 73% 72% 12% 79% 76% 43% 15% 35% 70%
21% * * * * * * * * * * * *
byron
olmsted Medical Center
CAledoniA
Mayo Health System- Franciscan Skemp
CAnby
Sanford Clinic Canby
CAnnon FAllS
Mayo Health System- Cannon Falls Medical Center
CHAtField
olmsted Medical Center
ClArA City
Clara City Clinic
ClArkField
Clarkfield Clinic
dASSel
Hutchinson Area Health Care- dassel Medical Centr

November 2010 | 2010 Health Care Quality Report | pHysiCian CliniC Measures 27
Chronic Conditions PreventionAcute Conditions
When choosing a clinic, look for the clinic that has a higher rate.
Overall Minnesota Average 28% 34% 70% 92% 87% 86% 19% 83% 80% 72% 53% 49% 80%
The Best Care for... The Best Care For... The Best Care To...
* Sufficient data not available. + Data not reported (for information on Physician Clinic Inclusion see page 199). For more detailed information, see appendices starting on page 88.
Adul
ts w
ith D
iabe
tes
Adul
ts w
ith V
ascu
lar D
iseas
e
Adul
ts w
ith H
igh
Bloo
d Pr
essu
re
Child
ren
and
Adul
ts w
ith A
sthm
a
Child
ren
with
a C
old
Child
ren
with
a S
ore
Thro
at
Adul
ts w
ith B
ronc
hitis
Help
Pre
vent
Bre
ast C
ance
r
Help
Pre
vent
Cer
vical
Can
cer
Help
Pre
vent
Col
orec
tal C
ance
r
Help
Pre
vent
Can
cer
Dete
ct C
hlam
ydia
Prov
ide
Child
hood
Imm
uniza
tions
Quality of Care
note on percentage rates:The rate shows how many patients out of one hundred reached the treatment goals or received the best medication.
* * * * * * * * * * * * *
18% 20% 51% 91% 73% 72% 12% 79% 76% 43% 15% 35% 70%
3% 18% 69% * 62% 86% * 81% 76% * * 34% *
* * 38% 92% 50% 56% 15% 81% 79% 67% 30% 32% 54%
+ + * * * * * * * * * * *
+ + * * * * * * * * * * *
+ + * * * * * * * * * * *
16% 31% 74% 91% 79% 75% 12% 81% 72% 72% 44% 40% 75%
+ + * * * * * * * * * * *
37% 40% 76% 91% 92% 88% 14% 81% 80% 72% 45% 61% 81%
Meeker Memorial Clinic
dAwSon
dawson Clinic
eden VAlley
paynesville eden Valley Medical Clinic
edgerton
edgerton Family Clinic Avera
FAirFAx
Fairfax Medical Clinic
FAirMont
braaten Medical Clinic
dulcimer Medical Center
Mayo Health System-Fairmont Medical Center
Smart Clinic
FAribAult
Allina Medical Clinic

pHysiCian CliniC Measures | November 2010 | 2010 Health Care Quality Report28
Chronic Conditions PreventionAcute Conditions
When choosing a clinic, look for the clinic that has a higher rate.
Overall Minnesota Average 28% 34% 70% 92% 87% 86% 19% 83% 80% 72% 53% 49% 80%
The Best Care for... The Best Care For... The Best Care To...
* Sufficient data not available. + Data not reported (for information on Physician Clinic Inclusion see page 199). For more detailed information, see appendices starting on page 88.
Adul
ts w
ith D
iabe
tes
Adul
ts w
ith V
ascu
lar D
iseas
e
Adul
ts w
ith H
igh
Bloo
d Pr
essu
re
Child
ren
and
Adul
ts w
ith A
sthm
a
Child
ren
with
a C
old
Child
ren
with
a S
ore
Thro
at
Adul
ts w
ith B
ronc
hitis
Help
Pre
vent
Bre
ast C
ance
r
Help
Pre
vent
Cer
vical
Can
cer
Help
Pre
vent
Col
orec
tal C
ance
r
Help
Pre
vent
Can
cer
Dete
ct C
hlam
ydia
Prov
ide
Child
hood
Imm
uniza
tions
Quality of Care
note on percentage rates:The rate shows how many patients out of one hundred reached the treatment goals or received the best medication.
41% 38% 74% 91% 79% 75% 12% 81% 72% 72% 44% 40% 75%
* * 38% 92% 50% 56% 15% 81% 79% 67% 30% 32% 54%
11% 18% 51% 91% 73% 72% 12% 79% 76% 43% 15% 35% 70%
5% 18% * * * * * 75% 81% * * * *
38% 45% 61% 95% 89% 74% 7% 84% 80% 64% 64% 49% 91%
+ + 72% 94% 93% 84% 36% 89% 75% 80% * 40% *
12% * 51% 91% 73% 72% 12% 79% 76% 43% 15% 35% 70%
9% 25% 51% 91% 73% 72% 12% 79% 76% 43% 15% 35% 70%
Mayo Health System-Cannon Valley Clinic
FuldA
Avera worthington Specialty Clinics
glenCoe
glencoe regional Health Services
grACeVille
graceville Health Center Clinic
grAnite FAllS
Affilliated Community Medical Centers
HArMony
gundersen lutheran
HeCtor
renville County Hospital and Clinics
HendriCkS
Hendricks Clinic p.A.

November 2010 | 2010 Health Care Quality Report | pHysiCian CliniC Measures 29
Chronic Conditions PreventionAcute Conditions
When choosing a clinic, look for the clinic that has a higher rate.
Overall Minnesota Average 28% 34% 70% 92% 87% 86% 19% 83% 80% 72% 53% 49% 80%
The Best Care for... The Best Care For... The Best Care To...
* Sufficient data not available. + Data not reported (for information on Physician Clinic Inclusion see page 199). For more detailed information, see appendices starting on page 88.
Adul
ts w
ith D
iabe
tes
Adul
ts w
ith V
ascu
lar D
iseas
e
Adul
ts w
ith H
igh
Bloo
d Pr
essu
re
Child
ren
and
Adul
ts w
ith A
sthm
a
Child
ren
with
a C
old
Child
ren
with
a S
ore
Thro
at
Adul
ts w
ith B
ronc
hitis
Help
Pre
vent
Bre
ast C
ance
r
Help
Pre
vent
Cer
vical
Can
cer
Help
Pre
vent
Col
orec
tal C
ance
r
Help
Pre
vent
Can
cer
Dete
ct C
hlam
ydia
Prov
ide
Child
hood
Imm
uniza
tions
Quality of Care
note on percentage rates:The rate shows how many patients out of one hundred reached the treatment goals or received the best medication.
HouSton
gunderson lutheran
HutCHinSon
Hutchinson Medical Center
iVAnHoe
ivanhoe Clinic
JACkSon
Sacred Heart Mercy Health Care Center
Sanford Clinic Jackson
kASSon
Mayo Clinic
lA CreSCent
Mayo Health System-Franciscan Skemp
lAke benton
lake benton Healthcare Center
+ + 72% 94% 93% 84% 36% 89% 75% 80% * 40% *
28% 37% 48% 93% 90% 89% 11% 73% 71% 65% 31% 42% 56%
+ + * * * * * * * * * * *
+ + * * * * * * * * * * *
11% 8% 58% 87% 87% 74% 25% 83% 83% 77% * 37% 67%
23% 39% 62% 96% 89% 76% 11% 89% 74% 91% 65% 41% 79%
41% 33% 74% 91% 79% 75% 12% 81% 72% 72% 44% 40% 75%
* * 38% 92% 50% 56% 15% 81% 79% 67% 30% 32% 54%
pHysiCian CliniC Measures | November 2010 | 2010 Health Care Quality Report30
Chronic Conditions PreventionAcute Conditions
When choosing a clinic, look for the clinic that has a higher rate.
Overall Minnesota Average 28% 34% 70% 92% 87% 86% 19% 83% 80% 72% 53% 49% 80%
The Best Care for... The Best Care For... The Best Care To...
* Sufficient data not available. + Data not reported (for information on Physician Clinic Inclusion see page 199). For more detailed information, see appendices starting on page 88.
Adul
ts w
ith D
iabe
tes
Adul
ts w
ith V
ascu
lar D
iseas
e
Adul
ts w
ith H
igh
Bloo
d Pr
essu
re
Child
ren
and
Adul
ts w
ith A
sthm
a
Child
ren
with
a C
old
Child
ren
with
a S
ore
Thro
at
Adul
ts w
ith B
ronc
hitis
Help
Pre
vent
Bre
ast C
ance
r
Help
Pre
vent
Cer
vical
Can
cer
Help
Pre
vent
Col
orec
tal C
ance
r
Help
Pre
vent
Can
cer
Dete
ct C
hlam
ydia
Prov
ide
Child
hood
Imm
uniza
tions
Quality of Care
note on percentage rates:The rate shows how many patients out of one hundred reached the treatment goals or received the best medication.
lAke City
Mayo Health System
lAke CryStAl
Mankato Clinic
lAkeField
Avera worthington Specialty Clinics
Sanford Clinic lakefield
le Sueur
Mayo Health System-immanuel St. Joseph
Southern Metro Medical Clinics
lewiSton
winona Health
litCHField
Affilliated Community Medical Centers- litchfield Clinic (east)
Affilliated Community Medical Centers- litchfield Clinic (west)
25% 48% 74% 91% 79% 75% 12% 81% 72% 72% 44% 40% 75%
14% 31% 73% 95% 83% 81% 18% 84% 80% 64% * 49% 70%
* * 38% 92% 50% 56% 15% 81% 79% 67% 30% 32% 54%
5% * 58% 87% 87% 74% 25% 83% 83% 77% * 37% 67%
33% * 74% 91% 79% 75% 12% 81% 72% 72% 44% 40% 75%
16% * * * 64% 83% 11% 79% 75% * * 41% *
16% * 56% 87% 93% 94% 44% 79% 75% 66% * 42% 82%
57% 51% 61% 95% 89% 74% 7% 84% 80% 64% 64% 49% 91%
24% 24% 61% 95% 89% 74% 7% 84% 80% 64% 64% 49% 91%

November 2010 | 2010 Health Care Quality Report | pHysiCian CliniC Measures 31
Chronic Conditions PreventionAcute Conditions
When choosing a clinic, look for the clinic that has a higher rate.
Overall Minnesota Average 28% 34% 70% 92% 87% 86% 19% 83% 80% 72% 53% 49% 80%
The Best Care for... The Best Care For... The Best Care To...
* Sufficient data not available. + Data not reported (for information on Physician Clinic Inclusion see page 199). For more detailed information, see appendices starting on page 88.
Adul
ts w
ith D
iabe
tes
Adul
ts w
ith V
ascu
lar D
iseas
e
Adul
ts w
ith H
igh
Bloo
d Pr
essu
re
Child
ren
and
Adul
ts w
ith A
sthm
a
Child
ren
with
a C
old
Child
ren
with
a S
ore
Thro
at
Adul
ts w
ith B
ronc
hitis
Help
Pre
vent
Bre
ast C
ance
r
Help
Pre
vent
Cer
vical
Can
cer
Help
Pre
vent
Col
orec
tal C
ance
r
Help
Pre
vent
Can
cer
Dete
ct C
hlam
ydia
Prov
ide
Child
hood
Imm
uniza
tions
Quality of Care
note on percentage rates:The rate shows how many patients out of one hundred reached the treatment goals or received the best medication.
lonSdAle
FamilyHealth Medical Clinic
luVerne
Sanford Clinic
MAbel
winneshiek Medical Center
MAdeliA
Mayo Health System-immanuel St. Joseph
MAdiSon
lac Qui parle Clinic
MAnkAto
between the bridges Health Center
Mayo Health System-immanuel St. Joseph- Mankato eastridge
Mayo Health System-immanuel St. Joseph- Mankato Specialty Clinic
Mankato Clinic- Main Street
9% * * * 90% 89% 25% 82% 75% * * 15% *
12% 15% 58% 87% 87% 74% 25% 83% 83% 77% * 37% 67%
+ + * * * * * * * * * * *
31% 37% 74% 91% 79% 75% 12% 81% 72% 72% 44% 40% 75%
8% * 51% 91% 73% 72% 12% 79% 76% 43% 15% 35% 70%
+ + * * * * * * * * * * *
26% 31% 74% 91% 79% 75% 12% 81% 72% 72% 44% 40% 75%
25% 35% 74% 91% 79% 75% 12% 81% 72% 72% 44% 40% 75%
16% 30% 73% 95% 83% 81% 18% 84% 80% 64% * 49% 70%

pHysiCian CliniC Measures | November 2010 | 2010 Health Care Quality Report32
Chronic Conditions PreventionAcute Conditions
When choosing a clinic, look for the clinic that has a higher rate.
Overall Minnesota Average 28% 34% 70% 92% 87% 86% 19% 83% 80% 72% 53% 49% 80%
The Best Care for... The Best Care For... The Best Care To...
* Sufficient data not available. + Data not reported (for information on Physician Clinic Inclusion see page 199). For more detailed information, see appendices starting on page 88.
Adul
ts w
ith D
iabe
tes
Adul
ts w
ith V
ascu
lar D
iseas
e
Adul
ts w
ith H
igh
Bloo
d Pr
essu
re
Child
ren
and
Adul
ts w
ith A
sthm
a
Child
ren
with
a C
old
Child
ren
with
a S
ore
Thro
at
Adul
ts w
ith B
ronc
hitis
Help
Pre
vent
Bre
ast C
ance
r
Help
Pre
vent
Cer
vical
Can
cer
Help
Pre
vent
Col
orec
tal C
ance
r
Help
Pre
vent
Can
cer
Dete
ct C
hlam
ydia
Prov
ide
Child
hood
Imm
uniza
tions
Quality of Care
note on percentage rates:The rate shows how many patients out of one hundred reached the treatment goals or received the best medication.
Mankato Clinic- wickersham Campus
open door Health Center
MApleton
Mankato Clinic
MArSHAll
Affiliated Community Medical Centers- bruce Street
Affilliated Community Medical Centers- Marshall Clinic- Market Street
Avera Marshall Specialty Clinic
MilAn
Milan Clinic
MonteVideo
Chippewa County Montevideo Hospital & Medical Clinic
MontgoMery
Southern Metro Medical Clinics- Montgomery Medical Clinic
MountAin lAke
Sanford Clinic
21% 36% 73% 95% 83% 81% 18% 84% 80% 64% * 49% 70%
2% * * * * * * * * * * * *
24% 34% 73% 95% 83% 81% 18% 84% 80% 64% * 49% 70%
31% 38% 61% 95% 89% 74% 7% 84% 80% 64% 64% 49% 91%
36% 45% 61% 95% 89% 74% 7% 84% 80% 64% 64% 49% 91%
n/A n/A n/A n/A n/A n/A n/A 81% 79% n/A n/A 32% n/A
* * 51% 91% 73% 72% 12% 79% 76% 43% 15% 35% 70%
14% 15% 51% 91% 73% 72% 12% 79% 76% 43% 15% 35% 70%
4% * * * 64% 83% 11% 79% 75% * * 41% *
9% * 58% 87% 87% 74% 25% 83% 83% 77% * 37% 67%
November 2010 | 2010 Health Care Quality Report | pHysiCian CliniC Measures 33
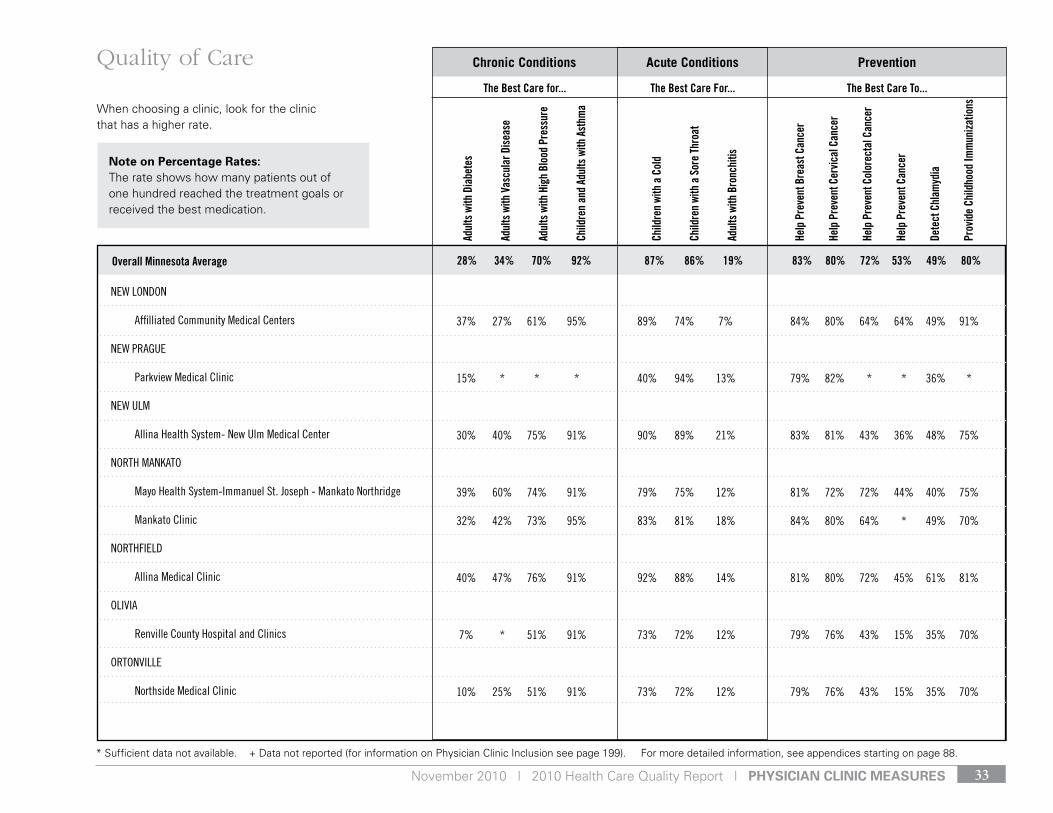
Chronic Conditions PreventionAcute Conditions
When choosing a clinic, look for the clinic that has a higher rate.
Overall Minnesota Average 28% 34% 70% 92% 87% 86% 19% 83% 80% 72% 53% 49% 80%
The Best Care for... The Best Care For... The Best Care To...
* Sufficient data not available. + Data not reported (for information on Physician Clinic Inclusion see page 199). For more detailed information, see appendices starting on page 88.
Adul
ts w
ith D
iabe
tes
Adul
ts w
ith V
ascu
lar D
iseas
e
Adul
ts w
ith H
igh
Bloo
d Pr
essu
re
Child
ren
and
Adul
ts w
ith A
sthm
a
Child
ren
with
a C
old
Child
ren
with
a S
ore
Thro
at
Adul
ts w
ith B
ronc
hitis
Help
Pre
vent
Bre
ast C
ance
r
Help
Pre
vent
Cer
vical
Can
cer
Help
Pre
vent
Col
orec
tal C
ance
r
Help
Pre
vent
Can
cer
Dete
ct C
hlam
ydia
Prov
ide
Child
hood
Imm
uniza
tions
Quality of Care
note on percentage rates:The rate shows how many patients out of one hundred reached the treatment goals or received the best medication.
37% 27% 61% 95% 89% 74% 7% 84% 80% 64% 64% 49% 91%
15% * * * 40% 94% 13% 79% 82% * * 36% *
30% 40% 75% 91% 90% 89% 21% 83% 81% 43% 36% 48% 75%
39% 60% 74% 91% 79% 75% 12% 81% 72% 72% 44% 40% 75%
32% 42% 73% 95% 83% 81% 18% 84% 80% 64% * 49% 70%
40% 47% 76% 91% 92% 88% 14% 81% 80% 72% 45% 61% 81%
7% * 51% 91% 73% 72% 12% 79% 76% 43% 15% 35% 70%
10% 25% 51% 91% 73% 72% 12% 79% 76% 43% 15% 35% 70%
new london
Affilliated Community Medical Centers
new prAgue
parkview Medical Clinic
new ulM
Allina Health System- new ulm Medical Center
nortH MAnkAto
Mayo Health System-immanuel St. Joseph - Mankato northridge
Mankato Clinic
nortHField
Allina Medical Clinic
oliViA
renville County Hospital and Clinics
ortonVille
northside Medical Clinic

pHysiCian CliniC Measures | November 2010 | 2010 Health Care Quality Report34
Chronic Conditions PreventionAcute Conditions
When choosing a clinic, look for the clinic that has a higher rate.
Overall Minnesota Average 28% 34% 70% 92% 87% 86% 19% 83% 80% 72% 53% 49% 80%
The Best Care for... The Best Care For... The Best Care To...
* Sufficient data not available. + Data not reported (for information on Physician Clinic Inclusion see page 199). For more detailed information, see appendices starting on page 88.
Adul
ts w
ith D
iabe
tes
Adul
ts w
ith V
ascu
lar D
iseas
e
Adul
ts w
ith H
igh
Bloo
d Pr
essu
re
Child
ren
and
Adul
ts w
ith A
sthm
a
Child
ren
with
a C
old
Child
ren
with
a S
ore
Thro
at
Adul
ts w
ith B
ronc
hitis
Help
Pre
vent
Bre
ast C
ance
r
Help
Pre
vent
Cer
vical
Can
cer
Help
Pre
vent
Col
orec
tal C
ance
r
Help
Pre
vent
Can
cer
Dete
ct C
hlam
ydia
Prov
ide
Child
hood
Imm
uniza
tions
Quality of Care
note on percentage rates:The rate shows how many patients out of one hundred reached the treatment goals or received the best medication.
29% 33% 74% 91% 79% 75% 12% 81% 72% 72% 44% 40% 75%
21% * 57% 93% 82% 87% 8% 87% 78% 56% * 46% 81%
4% 14% 38% 92% 50% 56% 15% 81% 79% 67% 30% 32% 54%
28% * 57% 93% 82% 87% 8% 87% 78% 56% * 46% 81%
20% * 57% 93% 82% 87% 8% 87% 78% 56% * 46% 81%
28% 32% 74% 93% 89% 95% 20% 82% 82% 79% 58% 57% 84%
38% 41% 61% 95% 89% 74% 7% 84% 80% 64% 64% 49% 91%
4% * 51% 91% 73% 72% 12% 79% 76% 43% 15% 35% 70%
owAtonnA
Mayo Health System-owatonna Clinic
pine iSlAnd
olmsted Medical Center
pipeStone
Avera- pipestone County Medical Center
plAinView
olmsted Medical Center
preSton
olmsted Medical Center
red wing
Fairview red wing Medical Center
redwood FAllS
Affilliated Community Medical Centers
renVille
renville County Hospital and Clinics
November 2010 | 2010 Health Care Quality Report | pHysiCian CliniC Measures 35
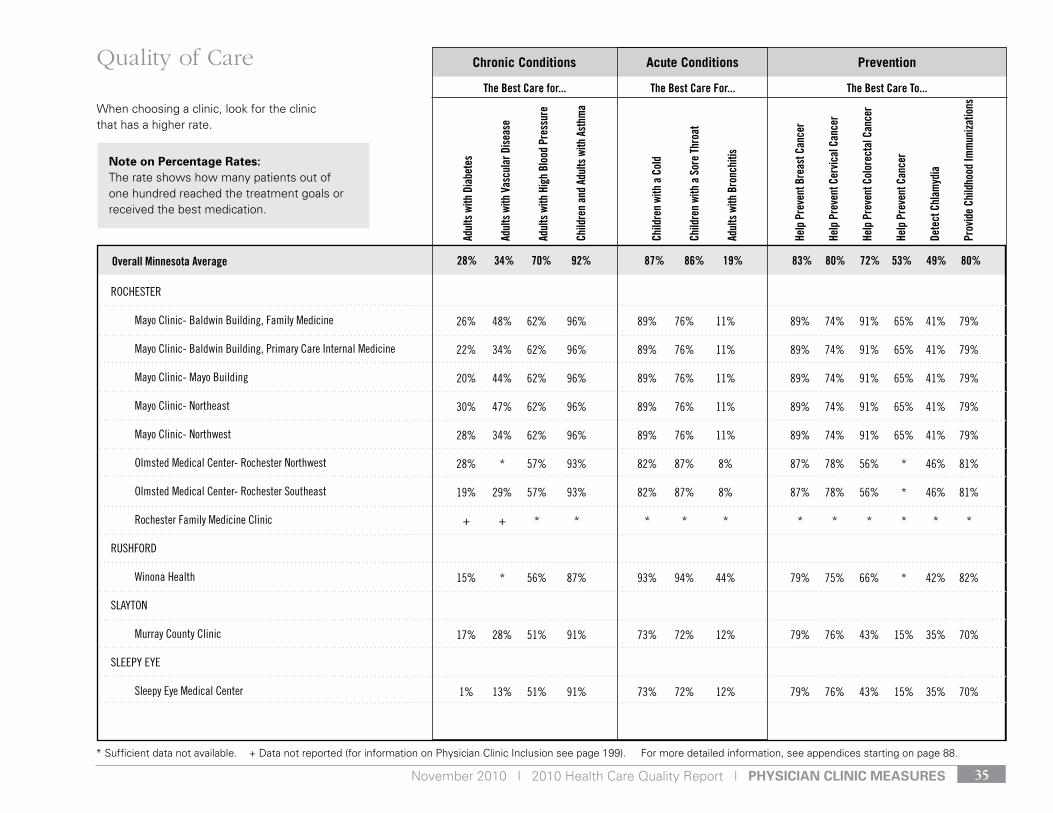
Chronic Conditions PreventionAcute Conditions
When choosing a clinic, look for the clinic that has a higher rate.
Overall Minnesota Average 28% 34% 70% 92% 87% 86% 19% 83% 80% 72% 53% 49% 80%
The Best Care for... The Best Care For... The Best Care To...
* Sufficient data not available. + Data not reported (for information on Physician Clinic Inclusion see page 199). For more detailed information, see appendices starting on page 88.
Adul
ts w
ith D
iabe
tes
Adul
ts w
ith V
ascu
lar D
iseas
e
Adul
ts w
ith H
igh
Bloo
d Pr
essu
re
Child
ren
and
Adul
ts w
ith A
sthm
a
Child
ren
with
a C
old
Child
ren
with
a S
ore
Thro
at
Adul
ts w
ith B
ronc
hitis
Help
Pre
vent
Bre
ast C
ance
r
Help
Pre
vent
Cer
vical
Can
cer
Help
Pre
vent
Col
orec
tal C
ance
r
Help
Pre
vent
Can
cer
Dete
ct C
hlam
ydia
Prov
ide
Child
hood
Imm
uniza
tions
Quality of Care
note on percentage rates:The rate shows how many patients out of one hundred reached the treatment goals or received the best medication.
26% 48% 62% 96% 89% 76% 11% 89% 74% 91% 65% 41% 79%
22% 34% 62% 96% 89% 76% 11% 89% 74% 91% 65% 41% 79%
20% 44% 62% 96% 89% 76% 11% 89% 74% 91% 65% 41% 79%
30% 47% 62% 96% 89% 76% 11% 89% 74% 91% 65% 41% 79%
28% 34% 62% 96% 89% 76% 11% 89% 74% 91% 65% 41% 79%
28% * 57% 93% 82% 87% 8% 87% 78% 56% * 46% 81%
19% 29% 57% 93% 82% 87% 8% 87% 78% 56% * 46% 81%
+ + * * * * * * * * * * *
15% * 56% 87% 93% 94% 44% 79% 75% 66% * 42% 82%
17% 28% 51% 91% 73% 72% 12% 79% 76% 43% 15% 35% 70%
1% 13% 51% 91% 73% 72% 12% 79% 76% 43% 15% 35% 70%
roCHeSter
Mayo Clinic- baldwin building, Family Medicine
Mayo Clinic- baldwin building, primary Care internal Medicine
Mayo Clinic- Mayo building
Mayo Clinic- northeast
Mayo Clinic- northwest
olmsted Medical Center- rochester northwest
olmsted Medical Center- rochester Southeast
rochester Family Medicine Clinic
ruSHFord
winona Health
SlAyton
Murray County Clinic
Sleepy eye
Sleepy eye Medical Center

pHysiCian CliniC Measures | November 2010 | 2010 Health Care Quality Report36
Chronic Conditions PreventionAcute Conditions
When choosing a clinic, look for the clinic that has a higher rate.
Overall Minnesota Average 28% 34% 70% 92% 87% 86% 19% 83% 80% 72% 53% 49% 80%
The Best Care for... The Best Care For... The Best Care To...
* Sufficient data not available. + Data not reported (for information on Physician Clinic Inclusion see page 199). For more detailed information, see appendices starting on page 88.
Adul
ts w
ith D
iabe
tes
Adul
ts w
ith V
ascu
lar D
iseas
e
Adul
ts w
ith H
igh
Bloo
d Pr
essu
re
Child
ren
and
Adul
ts w
ith A
sthm
a
Child
ren
with
a C
old
Child
ren
with
a S
ore
Thro
at
Adul
ts w
ith B
ronc
hitis
Help
Pre
vent
Bre
ast C
ance
r
Help
Pre
vent
Cer
vical
Can
cer
Help
Pre
vent
Col
orec
tal C
ance
r
Help
Pre
vent
Can
cer
Dete
ct C
hlam
ydia
Prov
ide
Child
hood
Imm
uniza
tions
Quality of Care
note on percentage rates:The rate shows how many patients out of one hundred reached the treatment goals or received the best medication.
9% * 69% * 62% 86% * 81% 76% * * 34% *
+ + 72% 94% 93% 84% 36% 89% 75% 80% * 40% *
8% 26% 57% 93% 82% 87% 8% 87% 78% 56% * 46% 81%
34% 38% 74% 91% 79% 75% 12% 81% 72% 72% 44% 40% 75%
26% * 57% 93% 82% 87% 8% 87% 78% 56% * 46% 81%
25% 34% 74% 91% 79% 75% 12% 81% 72% 72% 44% 40% 75%
+ + * * * * * * * * * * *
36% 38% 74% 91% 79% 75% 12% 81% 72% 72% 44% 40% 75%
SpiCer
paynesville green lake Medical Clinic
Spring groVe
gundersen lutheran
Spring VAlley
olmsted Medical Center
SpringField
Mayo Health System-immanuel St. Joseph
St. CHArleS
olmsted Medical Center
St. JAMeS
Mayo Health System-immanuel St. Joseph
Moulton & parsons Mds
St. peter
Mayo Health System-immanuel St. Joseph

November 2010 | 2010 Health Care Quality Report | pHysiCian CliniC Measures 37
Chronic Conditions PreventionAcute Conditions
When choosing a clinic, look for the clinic that has a higher rate.
Overall Minnesota Average 28% 34% 70% 92% 87% 86% 19% 83% 80% 72% 53% 49% 80%
The Best Care for... The Best Care For... The Best Care To...
* Sufficient data not available. + Data not reported (for information on Physician Clinic Inclusion see page 199). For more detailed information, see appendices starting on page 88.
Adul
ts w
ith D
iabe
tes
Adul
ts w
ith V
ascu
lar D
iseas
e
Adul
ts w
ith H
igh
Bloo
d Pr
essu
re
Child
ren
and
Adul
ts w
ith A
sthm
a
Child
ren
with
a C
old
Child
ren
with
a S
ore
Thro
at
Adul
ts w
ith B
ronc
hitis
Help
Pre
vent
Bre
ast C
ance
r
Help
Pre
vent
Cer
vical
Can
cer
Help
Pre
vent
Col
orec
tal C
ance
r
Help
Pre
vent
Can
cer
Dete
ct C
hlam
ydia
Prov
ide
Child
hood
Imm
uniza
tions
Quality of Care
note on percentage rates:The rate shows how many patients out of one hundred reached the treatment goals or received the best medication.
20% 40% 73% 95% 83% 81% 18% 84% 80% 64% * 49% 70%
* * * * * * * * * * * * *
8% 28% 57% 93% 82% 87% 8% 87% 78% 56% * 46% 81%
14% 21% 58% 87% 87% 74% 25% 83% 83% 77% * 37% 67%
8% 17% 38% 92% 50% 56% 15% 81% 79% 67% 30% 32% 54%
30% 37% 74% 91% 79% 75% 12% 81% 72% 72% 44% 40% 75%
14% * 57% 93% 82% 87% 8% 87% 78% 56% * 46% 81%
21% 46% 74% 91% 79% 75% 12% 81% 72% 72% 44% 40% 75%
4% * 69% * 62% 86% * 81% 76% * * 34% *
Mankato Clinic- daniel’s Health Center
river’s edge Clinic
StewArtVille
olmsted Medical Center
trACy
Sanford Clinic tracy/balaton/walnut grove
tyler
tyler Medical Clinic
wAbASHA
Mayo Health System-wabasha Clinic
wAnAMingo
olmsted Medical Center
wASeCA
Mayo Health System-immanuel St. Joseph
wAtkinS
paynesville watkins Medical Clinic

pHysiCian CliniC Measures | November 2010 | 2010 Health Care Quality Report38
Chronic Conditions PreventionAcute Conditions
When choosing a clinic, look for the clinic that has a higher rate.
Overall Minnesota Average 28% 34% 70% 92% 87% 86% 19% 83% 80% 72% 53% 49% 80%
The Best Care for... The Best Care For... The Best Care To...
* Sufficient data not available. + Data not reported (for information on Physician Clinic Inclusion see page 199). For more detailed information, see appendices starting on page 88.
Adul
ts w
ith D
iabe
tes
Adul
ts w
ith V
ascu
lar D
iseas
e
Adul
ts w
ith H
igh
Bloo
d Pr
essu
re
Child
ren
and
Adul
ts w
ith A
sthm
a
Child
ren
with
a C
old
Child
ren
with
a S
ore
Thro
at
Adul
ts w
ith B
ronc
hitis
Help
Pre
vent
Bre
ast C
ance
r
Help
Pre
vent
Cer
vical
Can
cer
Help
Pre
vent
Col
orec
tal C
ance
r
Help
Pre
vent
Can
cer
Dete
ct C
hlam
ydia
Prov
ide
Child
hood
Imm
uniza
tions
Quality of Care
note on percentage rates:The rate shows how many patients out of one hundred reached the treatment goals or received the best medication.
14% 11% 58% 87% 87% 74% 25% 83% 83% 77% * 37% 67%
34% 44% 61% 95% 89% 74% 7% 84% 80% 64% 64% 49% 91%
33% 33% 74% 89% 96% 96% 11% 80% 83% * * 70% *
6% * 38% 92% 50% 56% 15% 81% 79% 67% 30% 32% 54%
15% 21% * * * * * * * * * * *
9% * 58% 87% 87% 74% 25% 83% 83% 77% * 37% 67%
+ + * * * * * * * * * * *
24% 24% * * * * * 73% 72% 53% 36% 16% *
21% 39% 56% 87% 93% 94% 44% 79% 75% 66% * 42% 82%
4% * 81% 90% 76% 95% 14% 75% 76% 67% 58% 48% *
weStbrook
Sanford Clinic westbrook
willMAr
Affilliated Community Medical Centers
Family practice Medical Center of willmar
windoM
Avera- united Medical Clinic
Hartberg Medical Clinic
Sanford Clinic windom
windom Family Medical Center
winonA
Family Medicine of winona
winona Health- winona Health Clinics
winSted
ridgeview winsted Clinic

November 2010 | 2010 Health Care Quality Report | pHysiCian CliniC Measures 39
Chronic Conditions PreventionAcute Conditions
When choosing a clinic, look for the clinic that has a higher rate.
Overall Minnesota Average 28% 34% 70% 92% 87% 86% 19% 83% 80% 72% 53% 49% 80%
The Best Care for... The Best Care For... The Best Care To...
* Sufficient data not available. + Data not reported (for information on Physician Clinic Inclusion see page 199). For more detailed information, see appendices starting on page 88.
Adul
ts w
ith D
iabe
tes
Adul
ts w
ith V
ascu
lar D
iseas
e
Adul
ts w
ith H
igh
Bloo
d Pr
essu
re
Child
ren
and
Adul
ts w
ith A
sthm
a
Child
ren
with
a C
old
Child
ren
with
a S
ore
Thro
at
Adul
ts w
ith B
ronc
hitis
Help
Pre
vent
Bre
ast C
ance
r
Help
Pre
vent
Cer
vical
Can
cer
Help
Pre
vent
Col
orec
tal C
ance
r
Help
Pre
vent
Can
cer
Dete
ct C
hlam
ydia
Prov
ide
Child
hood
Imm
uniza
tions
Quality of Care
note on percentage rates:The rate shows how many patients out of one hundred reached the treatment goals or received the best medication.
9% 22% 38% 92% 50% 56% 15% 81% 79% 67% 30% 32% 54%
5% 13% 58% 87% 87% 74% 25% 83% 83% 77% * 37% 67%
22% 32% 74% 93% 89% 95% 20% 82% 82% 79% 58% 57% 84%
wortHington
Avera worthington Specialty Clinic
Sanford Clinic
ZuMbrotA
Fairview red wing Zumbrota Clinic