physiological influences can outweigh environmental
TRANSCRIPT

MARINE ECOLOGY PROGRESS SERIESMar Ecol Prog Ser
Vol. 500: 245–264, 2014doi: 10.3354/meps10699
Published March 17
INTRODUCTION
The chemical composition of biomineralised struc-tures such as fish otoliths reflects, at least in part, thephysicochemical conditions of the surrounding environ -ment, and comparisons of tissue chemistry are com -
monly used to infer population structure and individ-ual movements (Campana 1999). It is widely acceptedthat the mechanisms controlling uptake and incorpo-ration of elements into the otolith are me diated byboth exogenous (e.g. salinity) and en dogenous (e.g.growth) factors (Walther et al. 2010). For most otolith
© Inter-Research 2014 · www.int-res.com*Corresponding author: [email protected]
Physiological influences can outweighenvironmental signals in otolith microchemistry
research
Anna M. Sturrock1,4,*, Clive N. Trueman1, J. Andy Milton1, Colin P. Waring2, Matthew J. Cooper1, Ewan Hunter3
1Ocean and Earth Science, National Oceanography Centre Southampton, University of Southampton Waterfront Campus, European Way, Southampton, Hampshire SO14 3ZH, UK
2University of Portsmouth, Institute of Marine Sciences, Ferry Road, Eastney, Hampshire PO4 9LY, UK3Centre for Environment, Fisheries and Aquaculture Science, Lowestoft Laboratory, Pakefield Road, Lowestoft,
Suffolk NR33 0HT, UK
4Present address: Institute of Marine Sciences, A317 Earth & Marine Sciences Building, University of California, Santa Cruz, 1156 High Street, Santa Cruz, California 95064, USA
ABSTRACT: Most studies that infer geographic distributions of fish using otolith microchemistryassume that environmental factors (e.g. temperature, salinity) outweigh intrinsic effects (e.g. size,condition); however, this assumption has not been rigorously tested, particularly in marine fish.Here, we report the results of a long-term experimental study of European plaice Pleuronectesplatessa L. and explore relationships between blood plasma and ambient water chemistry over a12 mo reproductive cycle. Overall, blood plasma was found to be highly regulated, with few ele-ments exhibiting strong, if any, correlation with ambient concentrations. This sets a first orderlimit on the sensitivity of otolith chemistry to fluctuations in ambient seawater chemistry. Theobserved temporal, ontogenetic and sex-specific variations in blood plasma elemental concentra-tions indicated significant physiological influences on elemental uptake and processing mecha-nisms. Physiological variables exerted relatively strong influences on the uptake and regulation ofthe softer, more thiophilic elements (Mn, Cu, Zn, Se and Pb), as well as Sr and Ca. By contrast, sea-sonal and sex-related variations were relatively minor among the hard acid metal ions (Li+, Mg2+,K+, Rb+, Ba2+). Overall, plasma elemental concentrations covaried most strongly and consistentlywith plasma protein concentrations. For this exclusively marine species, seasonal changes in phys-iology governed intra-annual variations in blood chemistry and, by implication, also regulate ionavailability to the otolith. Based on these observations, we recommend that sex and age should becontrolled for in future experimental designs using otolith microchemistry to infer stock structureor migration patterns.
KEY WORDS: Trace metals · Blood plasma · Otolith microchemistry · Plaice · Reproductive cycles
Resale or republication not permitted without written consent of the publisher
FREEREE ACCESSCCESS

Mar Ecol Prog Ser 500: 245–264, 2014
microchemistry applications, it is assumed that environ -mental ‘signals’ outweigh phy siological ‘noise’; how -ever, their relative importance is poorly understoodand can vary among species, habitats, populationsand life stages (Walther et al. 2010, Clarke et al. 2011).
To pass from the environment to the otolith, ele-ments (or ions) must be transferred across severalkey interfaces. The mechanisms controlling the com-position of otoliths can be viewed as a series of barri-ers or filters, each of which potentially alters theabsolute or relative concentration of elements avail-able for transfer (e.g. Campana 1999). Movement ofions between the environment and blood representsthe first and potentially most complex of these barri-ers. This initial step is likely to be regulated for allelements to some degree, as the persistence of inter-nal homeostasis is vital to health and survival, andthe circulatory system is integral to maintaining ionicbalance (Evans 1993). Fish blood is in constant flux,with elements assimilated via the gills, gut and tissueturnover and removed by excretion and storage indifferent tissues. Approximately half of the bloodfluid is comprised of plasma, which contains dissol -ved ions, proteins, metabolites, hormones, plateletsand waste products (Williams 1971). Blood proteinsare critical in the transport of many trace elements,and can vary in concentration and composition (and,thus, relative metal-binding capacity) in response tothe physiological and nutritional status of the individ-ual (e.g. Hille 1982). Such variations in blood proteincomposition provide a clear mechanism for the phys-iological fractionation of elements between the envi-ronment, blood and otolith (Kalish 1991).
Seasonal cycles in elemental concentrations havebeen observed in the blood plasma, endolymph andotoliths of mature adults of the bearded rock codPseudophysis barbatus, an exclusively marine spe-cies (Kalish 1991). Otolith Sr/Ca ratios were largelyexplained by physiological factors and were hypoth-esised to vary as a function of protein composition,questioning the importance of environmental con-trols on this frequently applied otolith marker (Kalish1991). More recently, laboratory studies have pro-vided insight into ion movement pathways betweenplasma, endolymph and otoliths (e.g. Tohse & Mu -giya 2001, Payan et al. 2002, 2004a) and relationshipsbetween manipulated conditions and otolith concen-trations (e.g. Bath et al. 2000, Hicks et al. 2010, Miller2011). However, such experiments tended to focus ona limited suite of elements (primarily Sr and Ba),using larval or juvenile fish grown in simplified andexaggerated conditions that do not reflect the envi-ronmental experiences of fully marine species. Des -
pite known ontogenetic shifts in elemental process-ing (e.g. De Pontual et al. 2003), few studies haveexamined elemental uptake mechanisms in adult fish(e.g. Melancon et al. 2009), in part because of theconsiderable challenges associated with their long-term maintenance. Investigations into seasonal andontogenetic changes in fish blood elemental chem-istry are even fewer (Sturrock et al. 2013). Given con-tinued growth in the field of otolith microchemistry(Sturrock et al. 2012) and increasing subtlety of thequestions being asked (Elsdon et al. 2008), there is acritical need for an improved understanding of ele-ment uptake and processing mechanisms and, thus,the fundamental assumptions underpinning the useof otolith microchemistry in fish ecology.
In the present study, we quantified monthly concen-trations of 12 elements in the blood plasma of maleand female European plaice Pleuronectes pla tessa L.maintained in near-natural conditions for 1 yr. The elements were broadly organised into 3 categories:Group I and Group II ‘hard acid metal ions’ (Li, K, Rb;Mg, Ca, Sr, Ba) and more thiophilic ‘soft acid metalions’ (Mn, Cu, Zn, Se, Pb) (after Sturrock et al. 2012).Our objective was to determine the en vironmentaland/or physiological factors driving variations inblood microchemistry in this exclusively marine fish.
MATERIALS AND METHODS
Animal collection and experimental design
Wild plaice were collected by beam trawl from Liv-erpool Bay in the Irish Sea (IS) in February 2009 (n =56) and from the English Channel (EC) near East-bourne, UK, in August 2009 (n = 22). The fish weretransported to the Centre for Environment, Fisheriesand Aquaculture Science (CEFAS) Lowestoft aquar-ium and maintained in a single 9 m3 outdoor tanksupplied with continuously flowing, directly sourcedcoastal seawater. The tank roof was open during day-light hours (avoiding exposure to direct sunlight) toestablish natural photoperiodism. The fish were nothandled for at least 2 mo following transfer to thisregime to ensure that common blood parameters hadreturned to basal levels (Bourne 1986). The fish werefed twice weekly using a generous diet of live lug-worms Arenicola marina sourced from a single near -by beach, equivalent to 2.5% total weight per day(Horwood et al. 1989). Uneaten food was removedwithin 24 h. Blood sampling was carried out between08:00 h and 10:00 h on days prior to feeding to avoiddiurnal or food-related artefacts.
246
Sturrock et al.: Controls on fish blood plasma microchemistry
During the year-long ‘common garden’ experi-ment, a suite of physiological and environmentalvariables were monitored on a daily to monthly basis,as described below. All experiments were performedin compliance with Home Office guidelines (ProjectLicense no. 80/2260).
Physiological variables
Blood samples and physiological data were col-lected on a monthly basis. On each sampling day,total length (TL), total weight (TW), Fulton’s condi-tion factor (TW/TL3 × 100) and average daily growthrate (ΔTL/Δd) were recorded, and female plaice werephoto graphed for estimation of the gonadosomaticindex (GSI).
Gonadosomatic index
GSI was estimated using the non-destructive methods of Kennedy et al. (2008). Photographs ofthe females were taken on a lightbox, and the area ofthe ovary shadow posterior to the body cavity wasmeasured using ImageJ (Abramoff et al. 2004). Therelationship between ovary area (Oa, average of 3blind measurements) and ovary mass (Om) was cali-brated using the ovaries from females that died dur-ing the study or that were sacrificed on completion ofthe experiment. This relationship was used to gener-ate monthly estimates of Om and GSI (Om/TW × 100).Given that no females died during the spawning season, measurements from 6 gravid plaice fromKennedy et al. (2008) were used to constrain theupper bounds of the calibration curve.
Blood sampling and analysis
Blood samples (usually <0.3 ml) were collected bycaudal venepuncture for elemental and protein ana -lyses. On the first sampling day (2 June 2009 for ISfish, 27 October 2009 for EC fish), individuals wereinjected into the body cavity with oxytetracycline(Oxytetrin 20 LA, Schering Plough; dose rate 50 mgkg−1 TW) to leave a visible ‘start check’ on the otolithfor use in a companion study (Sturrock 2012). Theoxy tetracycline was pre-diluted using a plaice- specific Ringers solution (8.22 mg ml−1 NaCl in Milli-Q water, after Cobb et al. 1973) to reduce osmoticshock, and was administered after the blood had beencollected. Passive integrated transponder tags (www.
wyremicrodesign.co.uk) were inserted intramuscu-larly to provide each fish with a unique identificationcode. At the start of the spawning season (18 January2010), approximately half the fish were treated withgonadotropin-releasing hormone (GnRH) to encour-age spawning, and an additional sampling date wasadded in February. On termination of the experiment(28 May 2010), animals were sacrificed and their agesdetermined by counting translucent growth bands onotolith transverse sections.
Full details of blood treatment and analysis are pro-vided in Sturrock et al. (2013). In brief, samples werecentrifuged within 3 h of collection and the plasma ex-tracted for protein and elemental analyses and werethen stored at −20°C. Because of resource limitations,not all blood samples could be analysed, so followingtermination of the experiment, samples belonging toindividuals with higher otolith growth rates were prioritized (n = 19; 6 IS males, 7 IS fe males, 6 EC fe-males), along with 6 randomly selected fish (4 IS males,1 IS female, 1 EC female). The results presented here-after relate only to this subset of fish (n = 25).
Total (bound and unbound) concentrations of Li,Mg, K, Ca, Mn, Cu, Zn, Se, Rb, Sr, Ba and Pb in bloodplasma were quantified using high-resolution induc-tively coupled plasma-mass spectrometry (HR-ICP-MS; ELEMENT XR, Thermo Fisher Scientific) andexternal calibration using synthetic standards prepa -red from single element standards (Inorganic Ven-tures and ROMIL). Samples and standards wereinternally spiked to correct for any matrix differ-ences. Accuracy and precision were assessed usingSeronorm reference material and procedural stan-dards (detailed in Sturrock et al. 2013).
Total plasma protein was determined using theBiuret test (Harding et al. 1978). Standards weremade in replicate using bovine serum albumin (Sig -ma-Aldrich) and concentrations calculated by vol-ume, using direct calibration and Standard Curvesoftware. When blood sampling efforts were less suc-cessful and low volumes of plasma obtained, resam-pling was not attempted, and elemental analyseswere prioritised over protein analyses. Missing pro-tein values (n = 12 of 282) were replaced with themean of the previous and subsequent measurementsfor the same individual.
Environmental sampling
The CEFAS Lowestoft aquarium sources its sea -water directly from a proximal offshore filter. Conse-quently, water temperature, salinity and elemental
247

Mar Ecol Prog Ser 500: 245–264, 2014
concentrations varied with ambient conditions, ex -cept during summer months, when water tempera-tures were capped at ~14°C for welfare reasons.Tank temperature was monitored daily and salinitymeasured weekly at the CEFAS nutrient laboratory.
Water sampling for elemental analysis was carriedout on a near-weekly basis using acid-cleaned con-sumables (after Kremling 1999) and acid-cleaned0.2 µm nylon Millex© filters. Samples were acidifiedusing sub-boiled trace metal grade HNO3 (Fisher Scientific) and stored at −20°C. Milli-Q water(>18.2 MΩ) blanks were prepared in an identicalmanner. Aliquots were diluted 1000-fold and ana-lysed for 24Mg, 39K, 44Ca and 88Sr by quadrupole ICP-MS (XSERIES 2, Thermo Fisher Scientific) in peakjumping mode, operated with an RF power of 1400 Wusing a Peltier cooled cyclonic/impact bead-typespray chamber and standard Ni Xt sample and skim-mer cones. Typical auxiliary and cooling gas flowswere 0.8 and 13 l min−1, respectively. Additional ali -quots were diluted 15-fold and analysed in low (7Li,85Rb, 86Sr, 137Ba, 208Pb), medium (55Mn, 65Cu, 66Zn)and high (77Se, 78Se) resolution mode by HR-ICP-MS(ELEMENT XR). 118Sn was monitored in case of inter-ferences on 115In. Multi-element standard solutionswere prepared using 3% sub-boiled HNO3 and single element standards (Inorganic Ventures andROMIL). Samples and standards were spiked withinternal standards (Be at 10 ng g−1, In and Re at 5 ngg−1) to correct for instrument drift and signal suppres-
sion, and NASS-5 (nearshore seawater referencematerial for trace metals, National Research CouncilCanada) was used as a ‘base’ in the calibration seriesto improve matrix matching between standards andsamples. NASS-5 is characterised by low heavymetal content but was diluted 1.2× beforehand toensure points above and below the unknowns ineach calibration curve. Concentrations were calcu-lated by weight. To estimate external precision andaccuracy, CASS-4 (nearshore seawater referencematerial, National Research Council Canada) and arandomly selected seawater sample (‘proceduralstandard’) were analysed throughout the run.
Raw counts were drift-corrected and blank-sub-tracted offline. Concentrations in the NASS-5 ‘base’were determined by standard addition and accoun -ted for within the external calibration curves (all r2 >0.999). Estimates of precision and limits of detection(LOD) are provided in Table 1. In the seawater sam-ples, 55% of Zn and 2% of Mn measurements were<LOD, but all other elements were >LOD. In theCASS-4 samples, all elements were >LOD except forZn; however, the mean measured Zn concentration(including sub-LOD measurements) was almostwithin the certified range (Table 1). As the methodfor setting LOD is somewhat arbitrary and can lead tothe loss of potentially valuable information, somestudies include sub-LOD values in their datasets (e.g.Ben-Tzvi et al. 2007). Here, it was impossible toobtain matrix-matched blanks, leading to further
248
LOD Precision (%RSD) CASS-4 concentration (ng g−1) Internal External (ng g−1)
(n = 56) Procedural CASS-4 Measured Certifiedstandard (n) (n = 4) (n = 4) range
XSERIES 21000× dilution Mg 0.071 0.98 1.81 (4) 0.57 1.115 × 10⁶ –
K 1.5 1.06 1.81 (4) 0.78 3.34 × 10⁵ –Ca 1.8 1.56 0.77 (4) 1.18 3.44 × 10⁵ –Sr 0.0013 0.62 0.76 (4) 0.64 6.31 × 10³ –
ELEMENT XR15× dilution Li 0.27 1.84 0.46 (3) 1.61 152.78 –
Mn 0.13 3.02 2.87 (3) 0.83 2.93 2.59−2.97Cu 0.04 1.98 2.82 (3) 6.46 0.631 0.537−0.647Zn 4.00 4.51 15.4 (3) 52.5 0.308 0.324−0.438Se 0.012 1.76 3.17 (3) 7.95 0.063 –Rb 0.0095 1.31 1.05 (3) 0.64 110.92 –Ba 0.029 1.00 0.68 (3) 0.25 6.84 –Pb 0.015 2.69 1.16 (3) 30.04 0.0097 0.0062−0.0134
Table 1. Limits of detection (LOD, 3 SD of procedural blanks, corrected to relevant dilution factor) and average internal andexternal precision for seawater analyses carried out on the XSERIES 2 inductively coupled plasma-mass spectrometer (ICP-MS) and ELEMENT XR high-resolution ICP-MS. Zn concentrations were <LOD in the procedural standard and CASS-4 refer-ence material, but were still included in the dataset. Accuracy was assessed using certified acceptable ranges for CASS-4
where available; all except Zn were within range. RSD = relative standard deviation

Sturrock et al.: Controls on fish blood plasma microchemistry
ambiguity in the setting of the LOD. Also, as Zn is ahighly mobile element (Versieck & Cornelis 1989),exclusion of sub-LOD values was deemed likely toskew the dataset towards potentially contaminatedsamples. For these reasons, all measurements wereretained. Congruence in temporal trends among the‘soft’ metals (Zn, Cu and Pb in particular) instilledfurther confidence in the Zn measurements; how-ever, the results should be taken with caution. Accu-racy was otherwise deemed satisfactory, with Cu, Mnand Pb measurements all within certified ranges(Table 1). Outliers (>median + 3 SD) were excluded.
Data analysis
All data analyses were carried out using R soft-ware. Note that throughout this article, ‘ElX’ repre-sents element concentrations in medium ‘X’, and‘El/CaX’ represents the ratio of element to Ca con-centrations in medium ‘X’, where ‘X’ is either water(W) or blood plasma (B).
Smoothing
While physiological sampling was carried out atleast once per month, there was variability in samp -ling dates within each month. As such, local poly -nomial regression fitting (LOESS) was used tosmooth data and predict temperature, salinity, ElWand El/CaW values for specific sampling dates.LOESS fits a polynomial model using a weightedleast squares linear regression and a variable ‘span’or window size (Cleveland et al. 1992). For tempera-ture and salinity, a narrower window was used (span= 0.25). ElW and El/CaW were generally noisier, pre-sumably because of lower sampling frequency andgreater processing and instrument error. To avoidover-fitting these data, a span of 0.5 (equivalent to anapproximately 3 wk moving average) was used, anda span of 0.6 was used for elements close to the LOD(Mn, Zn and Se).
Modelling
Linear mixed-effects (LME) models (lme4 pack-age) were used to examine which physiologicaland/or environmental variables best explainedvariations in blood elemental concentrations. LMEmodels allow for non-independence and autocor -relation of the response variable by inclusion of a
random effect (in this case, the identity of the indi-vidual fish). We allowed intercepts to vary by indi-vidual (Crawley 2007, Zuur et al. 2009) and used asystematic model selection and assessment proce-dure. First, a ‘global model’ predicting ElB was builtincluding all fixed effects (sex, GnRH treatment,origin, temperature, salinity, ElW, El/CaW, day, pro-tein concentration, condition, growth rate, TL, age)and their first order interactions. For each element,models were built using data for all fish and forfemales only, including GSI. Where necessary, datawere log10, natural log or square root transformedto meet assumptions of homogeneity and normallydistributed residuals. Note that TW was excludedfrom the model selection criteria, as it was tightlycorrelated with TL (r = 0.9), and TL and conditionwere considered more appropriate measures of fishsize and ‘fatness’, respectively. First, the number ofinteractions was reduced using analysis of deviance(ANOVA, car package) and maximum likelihoodmethods. While p-values are generally incompatiblewith mixed-effects models because of the lack ofan underlying F-distribution, they can still provideguidance on the relative importance of individualterms. As such, interactions displaying p-values<0.01 were retained, along with any deemed likelyto have particular biological relevance. All singleorder terms were retained. Finally, the reducedmodel was standardized (arm package) to centreand scale the predictor and response variables,then analysed using restricted maximum likelihoodestimation. Dredge (MuMIn package) was used tofind the most parsimonious model(s) by ranking allpossible models by the Akaike information criterion(AIC). AIC, also known as a ‘penalised log-likelihood’,measures model fit while penalising for the numberof terms (Crawley 2007). A ‘best model’ was se -lected if it had ΔAIC > 2 compared with all othercandidates. If multiple models exhibited similarlylow AIC values, then the model with the best per-formance (based on the criteria below) was selected,and any subjectivity was highlighted for furtherdiscussion.
Models were judged to be ‘performing well’ ifthey exhibited low multicollinearity (variance infla-tion factor < 5, ‘kappa’ < 30) and their residualstructure was normally distributed, homogeneousand exhibited low autocorrelation. Model fit andthe proportion of variance explained by fixed andrandom effects were estimated using Nagelkerkepseudo-r2 values (Nagelkerke 1991), and p-valueswere assigned to individual terms using analysis ofdeviance.
249

Mar Ecol Prog Ser 500: 245–264, 2014
Correlations and distribution coefficients
Pearson product-moment correlation coefficients(r) were used to indicate coarse relationships amongvariables, primarily focusing on ElW vs. ElB pairwisecorrelations. To examine relative enrichment of theblood relative to ambient concentrations, distributioncoefficients from seawater to blood were calculatedas DEl (B/W) = ElB/ElW.
RESULTS
Physiological conditions
Om (in g) was significantly related to Oa (in cm2) bya polynomial relationship (r2 = 0.98, n = 41, p <0.0001):
Om = [0.13 (±0.008 SE) × Oa]2 − [0.58 (±0.21 SE) × Oa] + 2.03 (±1.05 SE)
Estimated GSI values ranged from 0.33 to 30.4%,which is within realistic ranges for flatfish (e.g. Mad-dock & Burton 1998). The IS males and females weregenerally mature and similar in age, and despitebeing larger, the EC females were younger and pre-dominantly immature (Table 2, Fig. 1d), with signifi-cantly lower GSI than the IS females at the height ofthe spawning season (5.1 vs. 15.4% in March 2010,F1,13 = 6.27, p = 0.026). Only 1 EC female spawned,while a GnRH-treated female had ovaries full of un -hydrated eggs at the end of the experiment in May,which likely would have been resorbed through atre-sia. Of the IS females, only 1 individual (4 yr old)exhibited no ovary development and was deemedimmature.
During the 12 mo experiment, mean TL increasedby 2.5 cm ± 0.62 SE in the IS females [t(7) = 4.01 p =0.005] and by 2.7 cm ± 0.47 SE in the males [t(9) =5.80 p < 0.001], and mean TW increased by 102.1 g ±21.5 SE [t (7) = 4.74 p = 0.002] and 72.8 g ± 11.4 SE[t (9) = 6.37 p < 0.001], respectively. The EC females
were introduced to the experiment 4 mo later, andwhile their mean TL increased by 1.1 cm (3.4%) andTW increased by 17.7 g (5.0%), these changes werenot significant (p > 0.05). Growth rates were highlyvariable among individuals. The EC females grewmore slowly than the IS fish when first introduced,but there was no difference among groups at the endof the experiment (p > 0.05). Growth rates of the ISfish peaked in October and November but slowedduring the winter spawning season, particularly inthe females (Fig. 1b).
Condition and plasma protein concentrations fol-lowed similar trends over time (r = 0.6), increa -sing until the start of the spawning season (Decem-ber) then falling until the end of the experiment(Fig. 1a,c). Both measures tended to be lower in theEC females, particularly during the spawning season(Fig. 1a,c). On termination of the experiment, condi-tion did not differ between groups (Table 2, p > 0.05),but plasma protein concentrations were significantlylower in the EC females than in the IS females (p <0.05, Tukey’s test). Plasma protein concentrationswere positively correlated with growth rate (r = 0.4)and GSI (r = 0.4), while water temperature was nega-tively correlated with condition (r = −0.5), TW (r =−0.4) and GSI (r = −0.3).
Environmental conditions
Water temperature varied seasonally (3.8 to 14.9°C,Fig. 2) and was typical of the range experienced bywild North Sea plaice (Hunter et al. 2004). Salinityranged from 30.1 to 33.3 and generally followed thesame trend as temperature but lagged by 1 to 2 mo(Fig. 2).
Seawater elemental concentrations generally fol-lowed similar trends to salinity, reaching a minimumin early February (Fig. 3). Concentrations of the conservative elements (Li, Rb, K, Mg) and quasi- conservative elements (Ca, Sr; Steele et al. 2009) var-ied with salinity, fluctuating in a sinusoidal manner
250
Origin Sex n TL (cm) TW (g) Overall GR (mm d−1) Condition GSI (%) Age (yr)
IS M 10 27.22 ± 2.38 208.6 ± 51.01 0.075 ± 0.041 1.02 ± 0.08 na 5.4 ± 2.5IS F 8 30.84 ± 2.01 293.3 ± 67.84 0.069 ± 0.049 0.98 ± 0.05 3.18 ± 2.12 5.0 ± 0.76EC F 7 33.54 ± 1.75 370.7 ± 95.00 0.052 ± 0.064 0.97 ± 0.13 2.76 ± 4.06 3.4 ± 0.79
Table 2. Average (±SD) total length (TL), total weight (TW), growth rate (GR), Fulton’s condition factor (Condition), gonadoso-matic index (GSI) and age of selected subject animals at the end of the experiment (28 May 2010). EC = English Channel, IS =
Irish Sea, na = not available

Sturrock et al.: Controls on fish blood plasma microchemistry
and returning to almost exactly the same concentra-tion as they were 1 yr earlier. There was little tempo-ral variation in their El/Ca ratios. BaW, CuW, ZnW, SeW
and PbW exhibited similar patterns over time but overproportionally greater amplitudes than the conserva-tive elements, resulting in greater seasonal variabil-ity in their El/Ca ratios (Fig. 3). MnW, a scavengedelement (Steele et al. 2009), was more difficult tointerpret because of a lower signal-to-noise ratio butcertainly differed from the other elements, remaininglow until late December then increasing towards theend of the experiment.
Variations in blood plasma elemental concentrations
Blood plasma elemental concentrations (ElB) variedover time and between groups (males, females, ISand EC fish) despite exposure to identical ambientconcentrations, temperatures and diets (Fig. 4,Table 3). Note that seawater temperature and ele-mental concentrations (ElW) often covaried and ex -hibited near-bimodal distributions; in these cases, itwas impossible to fully separate their effects. Unlessotherwise stated, the same terms were incorporatedinto the ‘full’ and ‘female-only’ models.
251
Fulto
n's
cond
ition
fact
or
Gro
wth
rat
e (m
m d
–1)
J J A S O N D J F M A M
Tota
l pro
tein
(g
dl–1
)
Month of expt
a b
c d
Month of expt
J J A S O N D J F M A M
GS
I (%
)
IS fEC fIS m
1.2
1.1
1.0
0.9
0.8
0.25
0.20
0.15
0.10
0.05
0.00
20
15
10
5
0
5.0
4.5
4.0
3.5
3.0
2.5
Fig. 1. Monthly mean (±SE)(a) condition, (b) growthrate, (c) blood plasma pro-tein concentrations and (d)female gonadosomatic in-dex (GSI) of 25 plaice fromthe Irish Sea (IS) and Eng-lish Channel (EC) seriallysampled for 7 to 12 mo.Note that sampling was car-ried out twice in February,and mean daily growth ratewas calculated as TLmonth2 −TLmonth1, so no values areassigned to the first sam-pling month in each group.Shading: peak spaw ningperiod. TL = total length,
f = female, m = male
Tem
per
atur
e (°
C)
Month of exptJ J A S O N D J F M A M
●●
●
●
●
●
●●
●
●
●
●●
●●
●
●●●
●
●
●
●●
●
●
●
●
●
●
●
●●
●
●
●
●
●
●●
●●
●●
●
●●
●●
●
●
●●
●●
●
●
●
●
●●
●
●
●
●●
●●
●
●●●
●
●
●
●●
●
●
●
●
●
●
●
●●
●
●
●
●
●
●●
●●
●●
●
●●
●●
●
●
●●
Sal
inity
16
14
12
10
8
6
4
33
32
31
30
Fig. 2. Water temperature (m) and salinity (s) during the experiment. Shading: peak spawning period

Mar Ecol Prog Ser 500: 245–264, 2014
Lithium
LiB did not exhibit clear temporal trends, but con-centrations were generally lower in early spring(Fig. 4a). LiB values were higher in females than inmales (p < 0.001) and positively correlated with tem-
perature and salinity, although at the highest temper-atures, LiB values were weakly negatively correlatedwith salinity. Both the full and female-only modelsexhibited a weak to moderate fit (r2 > 0.25), with littlevariation explained by the random effect, implyingsimilar responses among fish.
252
●
●●●●
●●●
●●
●●●
●●
●●
●●●
●●
●
●
●
●●
●
●
●
●
●
●
●
●
●●
●
●
●
●●
●
●
●
●
Li (µ
g g−
1 )
●●●
●●
●
●
●●
●
●
●●
●●
●● ●●●
●●●
●
●●
●●
●●
●
●
●●
●●
●●
●
●●
●
●
●
●
●
●●●
●●
●
●
●●
●
●
●●
●●
●● ●●●
●●●
●
●●
●●
●●
●
●
●●
●●
●●
●
●●
●
●
●
●
●
Li/C
a (m
mol
mol
−1 )
●
●
●
●
●
●
●
●
●
●●
●
●
●
●●●
●●●
●
●
●
●●
●
●
●
●
●
●
●
●
●
●
●
●
●
●
●
●
●
●
●
●
●
K (µ
g g−
1 )
●●
●
●
●●●●●●●●●
●●
●
●
●●●
●●●●
●
●●
●
●●●●
●
●●●
●●●
●●
●
●
●
●●
●●
●
●
●●●●●●●●●
●●
●
●
●●●
●●●●
●
●●
●
●●●●
●
●●●
●●●
●●
●
●
●
●●
K/C
a (m
mol
mol
−1 )
●
●●
●
●●
●●
●●●●● ●
● ●●
●
●●●
●
●●
●
●●
●
●
●
●
●
●
●
●
●●
●
●
●
●
●
●
●
●●
Rb
(µg
g−1 )
●●●
●●
●
●
●●
●●
●●
●●
●●
●
●●
●
●●
●●●●●●●●●●
●●●
●
●●
●●
●
●
●
●
●●●●
●●
●
●
●●
●●
●●
●●
●●
●
●●
●
●●
●●●●●●●●●●
●●●
●
●●
●●
●
●
●
●
●
Rb
/Ca
(mm
ol m
ol−
1 )
●
●
●
●
●
●
●
●●
●●
●
●
●
● ●●
●●●
●
●
●
●●
●
●
●
●
●
●
●
●
●
●
●
●
●
●
●
●
●
●
●
●
●
Mg
(µg
g−1 )
●●
●
●
●●●●
●●●●●
●●
●
●
●●●
●●
●●
●
●
●
●
●●●●●
●
●●
●●● ●
●
●
●●
●●
●●
●
●
●●●●
●●●●●
●●
●
●
●●●
●●
●●
●
●
●
●
●●●●●
●
●●
●●● ●
●
●
●●
●●
Mg/
Ca
(mm
ol m
ol−
1 )
●
●●
●
●
●
●
●
●
●●
●
●
●
●
●●
●●●
●
●
●
●●
●
●
●
●
●
●
●
●
●
●
●
●
●
●
●
●
●
●
●
●
●
Ca
(µg
g−1 )
●
●
●
●
●
●
●
●
●
●●
●
●
●
● ●
● ●●●
●
●
●
●●
●
●
●
●
●
●
●
●
●
●
●
●
●
●
●
●●
●
●
●
●
Sr
(µg
g−1 )
●●
●●●●
●●●●●●
●
●●
●
●●●●
●●●●
●●●
●●●●
●●●
●●
●●●
●●
●
●●
●●
●●
●●●●
●●●●●●
●
●●
●
●●●●
●●●●
●●●
●●●●
●●●
●●
●●●
●●
●
●●
●●
Sr/
Ca
(mm
ol m
ol−
1 )
●
●●
●
●
●
●●
●
●●●● ●
●●● ●
●
●●●
●
●
●
●
●
●
●
●
●
●
●
●
●
●●
●
●
●
●
●
●
●
●
●
Ba
(µg
g−1 )
●
●
●
●●●
●●
●
●●
●
●
●
●●
●●
●
●
●
●
●●
●
●
●
●
●●●
●
●●
●●
●●
●
●
●
●
●
●●
●
●
●
●
●●●
●●
●
●●
●
●
●
●●
●●
●
●
●
●
●●
●
●
●
●
●●●
●
●●
●●
●●
●
●
●
●
●
●●
●
Ba/
Ca
(mm
ol m
ol−
1 )
●
●
●
●
●
●
●
●
●
●
●
●
● ●
● ●● ●
●
●
●
●●
●●
●
●●●
●
●
●
●
●
●
●
●
●
●
●
●
●
●
●
Mn
(ng
g−1 )
●
●
●
●
●
●
●
●
●
●
●
●
● ●
● ●● ●
●
●
●
●●
●●
●
●●●
●
●
●
●
●●
●
●
●
●
●
●
●
●
●
●
●
●
●
●
●
●
●
●
●
●
●
● ●
● ●● ●
●
●
●
●●
●●
●
●●●
●
●
●
●
●●
●
●
●
●
●
●
●
●
●
Mn/
Ca
(µm
ol m
ol−
1 )
●
●
●
●
●
●
●
●●●
●●●
●
● ●
●
●●●
●●●
●●
●
●●●
●
●
●
●
●●
●●
●
●
●
●
●
●
●
●●Cu
(µg
g−1 )
●
●
●●
●
●
●
●●
●
●
●●
●●
●
●●●
●●●
●
●●●
●
●
●
●●●
●●
●
●
●●● ●●
●
●
●
●
●
●
●●
●
●
●
●●
●
●
●●
●●
●
●●●
●●●
●
●●●
●
●
●
●●●
●●
●
●
●●● ●●
●
●
●
●
Cu/
Ca
(mm
ol m
ol−
1 )
●
●
●
●
●
●●
●
●
●
●
●
●
●
●
●●
●
●
●
●
●●
●
●●
●
●
●
●
●●●
●●● ●
●
●
●●
Zn
(µg
g−1 )
J J A S O N D J F M A M
●
●
●
●
●
●●
●
●
●
●
●
●
●
●
●●
●
●
●
●
●●
●
●
●
●
●
●
●
●●●
●
●●
●●
●
●●●
●
●
●
●
●●
●
●
●
●
●
●
●
●
●●
●
●
●
●
●●
●
●
●
●
●
●
●
●●●
●
●●
●●
●
●●
Zn/
Ca
(mm
ol m
ol−
1 )
●
●
●●●●
●
●
●
●
●
●
●
●
●
●●
●
●
●
●
●
●
●
●
●
●●
●
●
●
●
●
●
●
●
●
●
●
●●
●
●●
●
●
Se
(ng
g−1 )
Month of expt
a b c
d e f
j k l
g h i
J J A S O N D J F M A M
●
●
●●●
●
●
●
●
●
●
●
●
●
●
●●
●
●
●
●
●
●
●●
●
●
●
●
●
●●
●
●
●
●
●
●
●
●
●●
●
●
●
●
●
●
●●●
●
●
●
●
●
●
●
●
●
●
●●
●
●
●
●
●
●
●●
●
●
●
●
●
●●
●
●
●
●
●
●
●
●
●●
●
●
●
●
Se/
Ca
(µm
ol m
ol−
1 )
●
●
●
●●
●●●
●●
●
●●
●●
●
●●●
●
●
●●●●●
●●
●
●●●●●
●
●
●
●●
●
●
●
●
●●
Pb
(ng
g−1 )
J J A S O N D J F M A M
●
●
●●●
●●●
●●
●
●
●
●●
●
●●●
●
●
●●●●
●
●●
●
●●
●
●●
●
●
●●
●
●
●
●
●
●
●●
●
●●●
●●●
●●
●
●
●
●●
●
●●●
●
●
●●●●
●
●●
●
●●
●
●●
●
●
●●
●
●
●
●
●
●
●
Pb
/Ca
(µm
ol m
ol−
1 )
0.18
0.16
0.14
0.12
0.10
380
360
340
320
300
280
260
2.5
2.0
1.5
1.0
0.5
0.0
0.12
0.11
0.10
0.09
0.08
0.07
0.09
0.08
0.07
0.06
0.05
0.04
0.03
400
350
300
3.0
2.8
2.6
2.4
2.2
2.0
1.8
1100
1000
900
800
0.16
0.12
0.08
0.04
5
4
3
2
1
0
0.18
0.16
0.14
0.12
0.10
0.08
10.0
9.5
9.0
8.5
8.0
7.5
7.0
6.5
0.016
0.012
0.008
0.004
0.20
0.15
0.10
0.05
0.012
0.008
0.004
0.000
0.009
0.007
0.005
0.003
0.35
0.25
0.15
0.05
0.020
0.018
0.016
0.014
0.012
0.010
1300
1200
1100
1000
900
7.5
7.0
6.5
6.0
5.5
5.0
6000
5500
5000
4500
0.016
0.014
0.012
0.010
0.020
0.015
0.010
0.005
0.000
Fig. 3. Water element concentrations (s, µg g−1 or ng g−1) and El/Ca ratios (d, mmol mol−1 or µmol mol−1) during the experi-ment. The elements are ordered by mass and broad elemental groupings: Group I, Group II, then ‘soft’ (Sturrock et al. 2012) elements. Local polynomial regression fitting (LOESS) smoothers (displayed) were used to predict concentrations and El/Ca
ratios for specific blood sampling days. Shading: peak spawning period

Sturrock et al.: Controls on fish blood plasma microchemistry 253
J J A S O N D J F M A M
Li (
µg g
−1 )
J J A S O N D J F M A M
K (µ
g g−
1 )J J A S O N D J F M A M
Rb
(µg
g−1 )
J J A S O N D J F M A M
Mg
(µg
g−1 )
J J A S O N D J F M A M
Ca
(µg
g−1 )
J J A S O N D J F M A M
Sr
(µg
g−1 )
J J A S O N D J F M A M
Ba
(µg
g−1 )
J J A S O N D J F M A M
Mn
(ng
g−1 )
J J A S O N D J F M A M
Cu
(µg
g−1 )
J J A S O N D J F M A M
Zn
(µg
g−1 )
Month of expt
a b c
d e f
g h i
j k l
J J A S O N D J F M A M
Se
(ng
g−1 )
J J A S O N D J F M A M
Pb
(ng
g−1 )
IS fEC fIS m0.075
0.070
0.065
0.060
0.055
0.050
100
80
60
40
20
0
0.015
0.010
0.005
0.000
1.4
1.2
1.0
0.8
0.6
1.0
0.8
0.6
0.4
1.2
1.0
0.8
0.6
0.4
0.2
0.0
200
180
160
140
120
100
50
40
30
20
10
500
400
300
200
100
0.025
0.020
0.015
0.010
0.005
0.000
16
14
12
10
8
6
40
35
30
25
20
Fig. 4. Monthly mean (±SE) blood plasma elemental concentrations (in µg g−1 or ng g−1) in 25 plaice from the Irish Sea (IS) andEnglish Channel (EC) serially sampled for 7 to 12 mo. Note that sampling was carried out twice in February. Shading: peak
spawning period. f = female, m = male

Mar Ecol Prog Ser 500: 245–264, 2014
Potassium and rubidium
KB and RbB values displayed similar behavioursover time (Fig. 4b,c). Unlike most other elements, ini-tial and terminal KB and RbB values were different
be cause of an overall decline, and they were best ex -plained by sampling date (p < 0.001). There was nooverall difference in KB and RbB values between thesexes, although there was a dip in KB around Novem-ber in the IS females and a dip in KB and RbB in Jan-
254
Table 3. Outputs of linear mixed-effects models predicting blood plasma elemental concentrations (ElB) in 25 plaice sampled for7 to 12 mo (n = 282). Analysis of deviance p-value and Nagelkerke pseudo-r2 values (full model and fixed effects only) are dis-played. Fixed effects include plasma protein concentrations (Protein), salinity (Sal) and temperature (Temp), among others. Go-nadosomatic index (GSI) is displayed when included in the female-only model, alongside the model fit (shaded). EC = English
Channel, F = female, IS = Irish Sea, M = male, ns = not significant, +ve = positive, -ve = negative, ↑ = higher, ↓ = lower
Response Fixed effect Directionality of effect χ2 p Model fit (pseudo-r2)statistic Full model Fixed effects
LiB Sex F > M 11.59 0.0007 0.26 0.24Temp 0.821 ns
Salinity +ve 16.53 <0.0001Temp × Sal -ve/ns at ↓Sal, +ve at ↑Sal 11.49 0.0007
KB Day -ve 48.47 <0.0001 0.21 0.18Protein -ve 13.78 0.0002Temp +ve 5.22 0.0223
RbB Day -ve 62.98 <0.0001 0.23 0.21Protein -ve 8.58 0.0034
MgB Protein +ve 15.29 <0.0001 0.17 0.15Salinity +ve 33.95 <0.0001
Treatment Treated > untreated 4.62 0.0316CaB Temp -ve 14.28 0.0002 0.62 0.50
Sex F > M 47.35 <0.0001Protein +ve 291.4 <0.0001
Sex × Protein F more +ve 56.10 <0.0001SrB Sex 0.079 ns 0.51 0.23
Growth rate -ve (not in F-only model) 19.17 <0.0001Protein +ve 49.21 <0.0001
Sex × Protein +ve F, -ve M 66.38 <0.0001GSI (F only) +ve 25.85 <0.0001 0.66 0.40
BaB Ba/CaW 0.363 ns 0.18 0.18Temp 0.475 ns
Ba/CaW × Temp ns at ↓Temp, +ve at ↑Temp 21.95 <0.0001
MnB Sex F > M 10.35 0.0010 0.43 0.20Growth rate +ve 8.93 0.0030Condition +ve 27.55 <0.0001
CuB Protein +ve 56.83 <0.0001 0.61 0.42Condition +ve 21.88 <0.0001
Temp +ve 25.92 <0.0001Sex M > F 7.40 0.0065
Temp × Sex +ve F, −ve M 30.02 <0.0001GSI (F only) -ve 16.54 <0.0001 0.60 0.47
ZnB Temp +ve 67.93 <0.0001 0.76 0.63Protein +ve 47.34 <0.0001
Condition -ve 15.82 <0.0001GSI (F only) -ve 9.45 <0.0001 0.74 0.66
SeB Origin IS > EC 33.48 <0.0001 0.71 0.42Sex M > F 11.58 0.0007
Protein +ve 62.97 <0.0001SeW +ve 59.38 <0.0001
GSI (F only) -ve 15.27 <0.0001 0.71 0.44PbB Condition (not in F-only model) 0.507 ns 0.34 0.23
Sex F > M 7.93 0.0049Growth rate +ve 7.73 0.0054
Protein +ve 11.32 0.0008Condition × Sex +ve F, -ve M 44.85 <0.0001
GSI (F only) -ve 9.84 0.0017 0.40 0.26

Sturrock et al.: Controls on fish blood plasma microchemistry
uary in the males. Negative relationships between KB
and RbB values and plasma protein concentrationswere observed (p < 0.01), and KB values were alsopartly explained by a negative effect of temperature(p = 0.02). Similar to LiB, there was a positive relation-ship between KB and RbB values and salinity, but itwas not significant. Model fits were weak to moder-ate (r2 > 0.20), with little variation explained by therandom effect.
Magnesium
MgB values varied in a roughly sinusoidal manner,peaking from September to January and falling inthe winter spawning season (Fig. 4d). Concentrationswere primarily explained by salinity (p < 0.001) andplasma protein concentrations (p < 0.001), but unlikethe monovalent ions discussed above, MgB valueswere positively associated with protein levels. Therewas also a weak effect of GnRH treatment (p = 0.03),with higher MgB values observed in treated fish,although it was not significant in the female-onlymodel. Model fits were relatively poor (r2 = 0.17 to0.21), with little variation explained by the randomeffect.
Calcium and strontium
CaB and SrB values exhibited similar trends overtime (Fig. 4e,f). Unlike the other Group II metals, CaB
and SrB values exhibited clear differences betweengroups of fish, although initial and terminal concen-trations were similar. CaB and SrB values peaked inthe IS females during winter; however, the timing ofthe peak was slightly asynchronous (December andFebruary, respectively). Accordingly, the CaB modelincluded a negative effect of temperature (p < 0.001),but the SrB model did not. Concentrations of both ele-ments were lar gely explained by an overall positiverelationship with plasma protein concentrations (p <0.001); however, the nature of this relationship dif-fered between the sexes. The slope of the relation-ship was steeper in the females, particularly for SrB,which was negatively correlated with plasma proteinconcentrations in the males (Fig. 5a,b). SrB valueswere negatively related to somatic growth rate (p <0.001) and positively related to GSI in the females (p< 0.001, Fig. 6a). Model fits were good for both ele-ments (r2 > 0.5) and better for the female-only mod-els. Approximately 10 and 30% of the variance wasex plained by the random effect for CaB and SrB,respectively, indicating some among-fish differences
255
1.7
1.9
2.1
2.3
2.5
1 2 3 4 5 6
Log
10(C
aB) (
µg g
–1)
2.6
2.8
3.0
3.2
3.4
1 2 3 4 5 60
1
2
3
4
5
0.6 0.8 1.0 1.2 1.4
0.2
0.5
0.8
1.1
1.4
1 2 3 4 5 6
SQ
RT
(Cu
B) (
ng g
–1)
Log
10(S
r B) (
ng g
–1)
Se B
(µg
g–1
)
Ln(M
n B) (
ng g
–1)
Ln(P
bB) (
ng g
–1)
Protein (g dl–1)
0
0.1
0.2
0.3
0.4
0.5
0.6
0.7
1 2 3 4 5 6
Protein (g dl–1)
–5
–4
–3
–2
–1
0
1
2
0.6 0.8 1.0 1.2 1.4
Condition
a
d f
fm
Fig. 5. Plots to show the strongest relationships explaining blood plasma elemental concentrations in 25 male (m) and female(f) plaice serially sampled for 7 to 12 mo (n = 282). Data were transformed where required to meet linear mixed-effects model
assumptions. SQRT = square root
Mar Ecol Prog Ser 500: 245–264, 2014
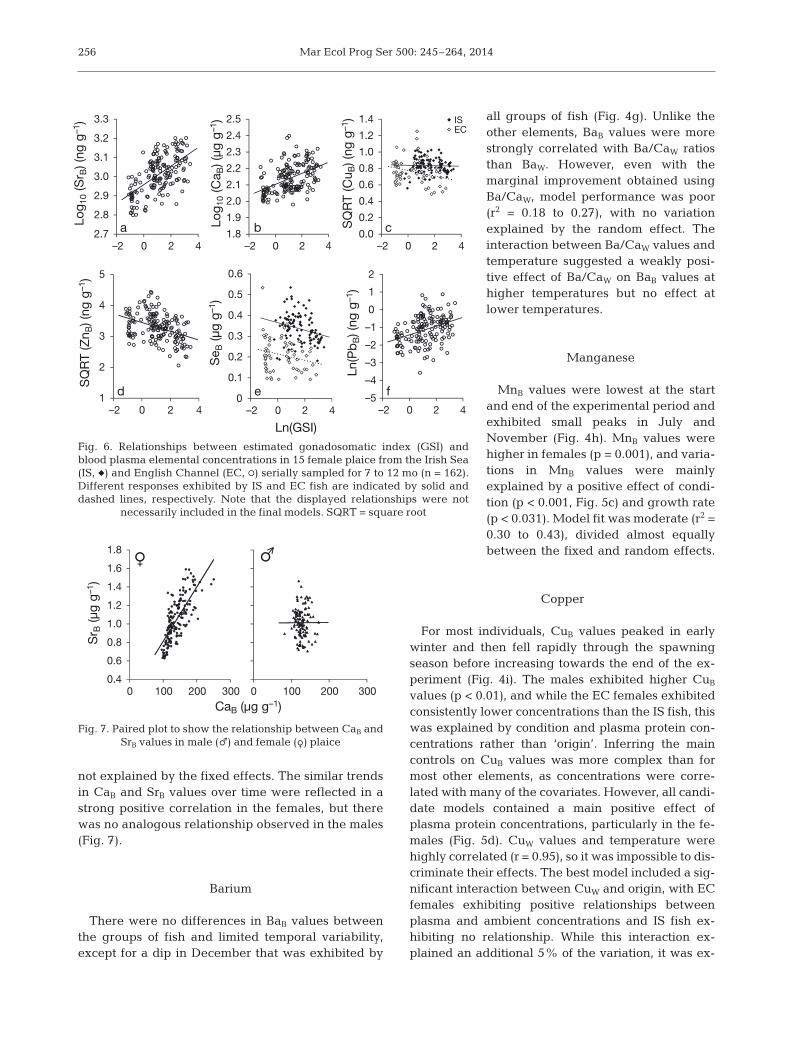
not explained by the fixed effects. The similar trendsin CaB and SrB values over time were reflected in astrong positive correlation in the females, but therewas no ana logous relationship observed in the males(Fig. 7).
Barium
There were no differences in BaB values betweenthe groups of fish and limited temporal variability,except for a dip in December that was exhibited by
all groups of fish (Fig. 4g). Unlike theother elements, BaB values were morestrongly correlated with Ba/CaW ratiosthan BaW. However, even with the marginal improvement obtained usingBa/CaW, mo del performance was poor(r2 = 0.18 to 0.27), with no variationexplained by the random effect. Theinteraction between Ba/CaW values andtemperature suggested a weakly posi-tive effect of Ba/CaW on BaB values athigher temperatures but no effect atlower temperatures.
Manganese
MnB values were lowest at the startand end of the experimental period andexhibited small peaks in July andNovember (Fig. 4h). MnB values werehigher in females (p = 0.001), and varia-tions in MnB values were mainlyexplained by a positive effect of condi-tion (p < 0.001, Fig. 5c) and growth rate(p < 0.031). Model fit was moderate (r2 =0.30 to 0.43), divided al most equallybetween the fixed and random effects.
Copper
For most individuals, CuB values peaked in earlywinter and then fell rapidly through the spawningseason before increasing towards the end of the ex -periment (Fig. 4i). The males exhibited higher CuB
values (p < 0.01), and while the EC females exhibitedconsistently lower concentrations than the IS fish, thiswas explained by condition and plasma protein con-centrations rather than ‘origin’. Inferring the maincontrols on CuB values was more complex than formost other elements, as concentrations were corre-lated with many of the covariates. However, all candi-date models contained a main positive effect ofplasma protein concentrations, particularly in the fe-males (Fig. 5d). CuW values and temperature werehighly correlated (r = 0.95), so it was impossible to dis-criminate their effects. The best model included a sig-nificant interaction between CuW and origin, with ECfemales exhibiting positive relationships betweenplasma and ambient concentrations and IS fish ex -hibiting no relationship. While this interaction ex -plained an additional 5% of the variation, it was ex-
256
2.7
2.8
2.9
3.0
3.1
3.2
3.3
–2 0 2 4
Log 1
0 (S
r B) (
ng g
–1)
1.8
1.9
2.0
2.1
2.2
2.3
2.4
2.5
–2 0 2 4
Log 1
0 (C
a B) (
µg g
–1)
0.0
0.2
0.4
0.6
0.8
1.0
1.2
1.4
–2 0 2 4
SQ
RT
(Cu B
) (ng
g–1
)
1
2
3
4
5
–2 0 2 4
SQ
RT
(Zn B
) (ng
g–1
)
0
0.1
0.2
0.3
0.4
0.5
0.6
–2 0 2 4
Se B
(µg
g–1)
Ln(GSI)
–5
–4
–3
–2
–1
0
1
2
–2 0 2 4
Ln(P
bB) (
ng g
–1)
ISEC
a b c
d e f
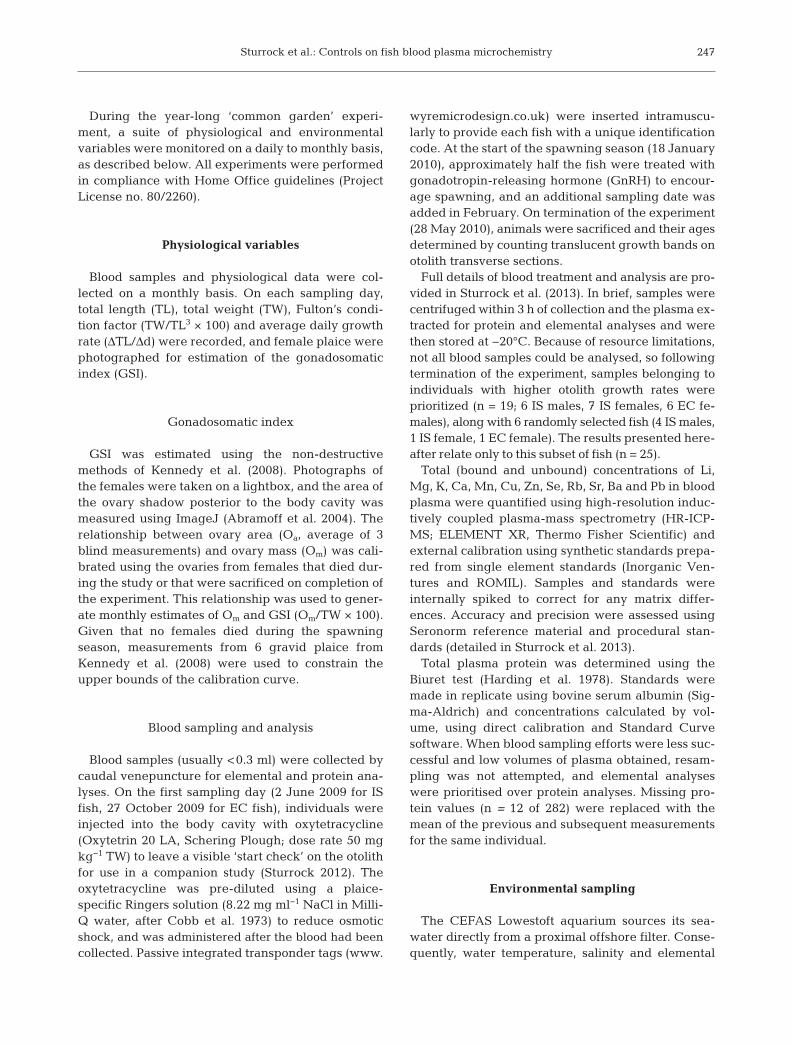
Fig. 6. Relationships between estimated gonadosomatic index (GSI) andblood plasma elemental concentrations in 15 female plaice from the Irish Sea(IS, r) and English Channel (EC, s) serially sampled for 7 to 12 mo (n = 162).Different responses exhibited by IS and EC fish are indicated by solid anddashed lines, respectively. Note that the displayed relationships were not
necessarily included in the final models. SQRT = square root
0.4
0.6
0.8
1.0
1.2
1.4
1.6
1.8
0 100 200 300
Sr B
(µg
g–1)
0 100 200 300
CaB (µg g–1)
f m
Fig. 7. Paired plot to show the relationship between CaB and SrB values in male (m) and female (f) plaice

Sturrock et al.: Controls on fish blood plasma microchemistry
cluded from the final model, given the lack of equiva-lent ‘high CuW values’ represented in the EC femalesbecause of their delayed introduction to the experi-ment. The final model included a significant inter -action between sex and temperature (p < 0.001) re-sulting from a positive relationship between CuB
values and temperature in the females and a weaklynegative relationship in the males. The female-onlymodel also included a negative effect of GSI that wasmost apparent in the EC females (Fig. 6c), but whilethe interaction between origin and GSI was significant(p = 0.02), it did not improve model fit (AIC or r2) andso was not included. Overall model fits were good(r2 > 0.6), with 13 to 19% of the variance explained bythe random effect.
Zinc
ZnB values decreased during the spawning seasonin all fish but had returned to initial levels by the endof the experiment (Fig. 4j). Concentrations were pri-marily explained by a positive relationship withambient concentrations or temperature. Inclusion ofeither term produced r2 values >0.7, with most of thevariance explained by the fixed effects. Model fitswere marginally higher (1 to 5%) using ZnW valuesover temperature; however, given lower confidencein ZnW measurements (see ‘Methods’), temperaturewas selected for the final model. In both models,plasma protein concentrations and condition alsocontributed significantly to the model fit, acting inopposite directions. During the spawning season,ZnB values were lower in the females, particularlythe IS females, and in the female-only model, the ne -gative effect of GSI was highly sig nificant (Fig. 6d).Model fits were good (r2 > 0.7), with only 8 to 13% ofthe variation explained by the random effect.
Selenium
SeB values exhibited a similar sinusoidal patternto CuB values, peaking just before the spawningseason, decreasing from January through Marchand then increasing towards the end of the experi-ment (Fig. 4k). Unlike most other elements, initialand terminal Se concentrations differed, with termi-nal concentrations higher in all groups of fish. Therewere clear differences in SeB values be tweengroups, with lower SeB values in the EC fish (p <0.001) and the fe males (p < 0.001). SeB values werelargely explained by plasma protein and ambient
water concentrations. Substituting temperature forSeW re duced model fit by ~10%. Similar to ZnB andCuB, a significant negative effect of GSI was foundin the female-only model (Fig. 6e). Overall modelfits were good (r2 > 0.7), with the random effectexplaining almost 30% of the variation.
Lead
While individual measurements were more vari-able, PbB behaved in a broadly similar manner to CaB
and SrB. Concentrations peaked in De cem ber in theIS females and, apart from a small peak in the ECfemales at the start of the spawning season, re -mained relatively constant in the males and ECfemales (Fig. 4l). The most important predictor of PbB
values was an interaction between condition and sex,with a positive relationship between condition andPbB values in the females but a negative relationshipin the males (Fig. 5f). Unlike SrB, PbB values werepositively correlated with growth rate. Similar to CaB
and SrB, PbB values were positively related to plasmaprotein concentrations (p < 0.01) and were higher inthe females (p = 0.005). The female-only model in -cluded GSI instead of condition (Fig. 6f) and exhib-ited a slightly better fit (r2 = 0.40 vs. 0.34).
Correlations with ambient concentrations
Pairwise correlations were carried out betweenblood plasma and water concentrations for each ele-ment (Table 4). The strongest positive relationshipswere observed for Zn, Se, Li, Rb and Mg, while Ca,Sr and Ba concentrations were either uncorrelatedor negatively correlated between blood plasma andwater. Two elements exhibited contradictory pat-terns among subject groups: CuW was positively cor-related with CuB in the EC females and negativelycorrelated in the males, while PbW was positively cor-related with PbB in the males and negatively corre-lated in the IS females.
Distribution coefficients
Blood plasma-to-water distribution coefficients (DEl (B/W)) of the 12 elements varied by more than 5orders of magnitude, ranging from 0.01 (DRb(B/W)) to>8500 (DSe(B/W)). Coefficients were >1 for all ‘soft’ ele-ments, indicating enrichment of the blood plasmarelative to ambient concentrations. For Group I and II
257

Mar Ecol Prog Ser 500: 245–264, 2014
elements, average DEl(B/W) values were consistently<1 (Table 4), but individual DBa(B/W) values wereoccasionally >1, particularly during winter. Therewere substantial differences between DEl (B/W) valuesfrom this study and those reported by Melancon et al.(2009) for 2 freshwater species (Table 4). Differenceswere expected for the conservative elements (e.g.DK(B/W) and DRb(B/W)) because of contrasting environ-mental concentrations, but differences among someof the other elements may have reflected variation inenvironmental or dietary concentrations, fluid type(whole blood vs. plasma) and/or sample treatment(Sturrock et al. 2013).
DISCUSSION
Fish blood plasma represents the major fluidmedium that ions pass through during their transportbetween the environment and the otolith. To under-stand element incorporation into the otolith, it istherefore important to appreciate transport and fractionation of elements between ambient waterand the blood. Clearly, blood plasma is highly regu-lated, and its elemental composition reflects envi -ronmental con ditions as well as the physiologicaland nutritional status of the fish. Most applicationsof otolith microchemistry assume that differencesin trace element concentrations between individuals
and within otoliths reflect exposureto differing ambient concentrations.Here, elemental concentrations wererarely correlated between the bloodplasma and ambient seawater, settinga first order limit on the sensitivityof otolith chemistry to environmen -tal fluctuations. Variations in plasmamicrochemistry over time and be -tween our 3 groups (IS males, ISfemales and EC females) demon-strated that physiological influencescould outweigh environmental signalsin a fully marine setting. These influ-ences were more pronounced for thesofter, thiophilic elements (Mn, Cu,Zn, Se and Pb) and the quasi-conserv-ative elements (Sr and Ca). Apart fromSr and Ca, the hard acid metal ions(Li+, Mg2+, K+, Rb+, Ba2+) were lessaffected by physiology, with reduced temporal variation and only minor dif-ferences in LiB observed between thesexes. Overall, plasma protein con-
centration had the strongest influence on ele mentalconcentrations and was included in nearly all of thepredictive models. Aside from LiB, BaB, KB and RbB,elemental concentrations were consistently posi-tively related to protein concentrations in the bloodplasma. These results emphasise the importance ofprotein-metal binding in the regulation of plasmaelemental concentrations, with many physiologicalvariables having the potential to influence bloodchemistry via modifications to protein compositionand abundance (Kalish 1991). Future work to charac-terise how ions occur in both water and bio logical flu-ids (free, ligand complexes, protein bound and/orassociated with particulates) will provide further in -sight into their availability to the various tissues.
In wild plaice, growth rate is usually negativelycorrelated with age (Fonds et al. 1992), yet theyounger EC females generally exhibited lower con-dition, growth rates and GSI (Fig. 1a,b,d), and lowerprotein, Cu and Se concentrations in the bloodplasma (Figs. 1c & 4j,k). Intrinsic differences wereconsidered unlikely, as the 2 stocks are geneticallyindistinct (Hoarau et al. 2004, Watts et al. 2004).However, the lagged introduction of the EC femalesdid coincide with falling water temperatures (Fig. 2),which may have increased stress in this group of fish.As plaice stop feeding in winter, even in the presenceof food (Rijnsdorp 1990), such elevated stress couldhave also triggered premature reduction in feeding
258
Table 4. Correlation coefficients (r) for the relationship between blood plasmavs. water elemental concentrations and average distribution coefficients (DEl (B/W)) from the current study and reported in Melancon et al. (2009) for2 freshwater fish species. Here, monthly blood samples were collected from25 fish from the Irish Sea (IS) and English Channel (EC) and related to waterconcentrations predicted for specific blood sampling days by local polynomialregression fitting (LOESS) smoothers (Fig. 3). Weaker correlations, (r-values
between −0.2 and 0.2) are shaded in grey. na = not available
r (ElB vs. ElW) DEl (B/W)
IS Males IS EC Present study Melancon et al. (2009)(n = 120) females females Pleuronectes Lota Salvelinus
(n = 102) (n = 60) platessa lota namaycush
Li 0.37 0.21 0.35 0.423 na naK 0.31 0.06 0.12 0.140 1560 1590Rb 0.40 0.23 0.12 0.061 2590 3190Mg 0.19 0.26 0.38 0.024 10.2 10.4Ca −0.05 −0.24 −0.06 0.391 3.03 3.85Sr 0.07 −0.32 −0.25 0.165 1.63 1.07Ba 0.08 −0.15 −0.25 0.684 20.0 13.7Mn −0.16 −0.03 −0.09 41.38 161 197Cu −0.25 −0.04 0.46 142.8 na naZn 0.32 0.57 0.44 3363 4790 7250Se 0.34 0.55 0.26 5214 na naPb 0.29 −0.21 −0.03 2.836 500 1490

Sturrock et al.: Controls on fish blood plasma microchemistry
activity. Stress can modify fish condition and bloodchemistry, and may have caused the elevated KB
values observed in all groups of fish during initialsampling months, with the gradual decrease repre-senting habituation over time (Waring et al. 1992,1996). While stress was not formally measured, it isreassuring that growth rates, condition and GSI ofthe subject animals were comparable to wild pop -ulations (Rijnsdorp 1989, Maddock & Burton 1998,Bromley 2000) and that plasma elemental concentra-tions were broadly similar to those reported in the literature, where available (Sturrock et al. 2013).
It is important to acknowledge the limitations of‘mensurative experiments’ (Hurlbert 1984) such asthese, where attempts to reproduce natural condi-tions yield inherent complexity. Formal hypothesistesting is compromised; however, even in controlledlaboratory settings, the separation of correlatedeffects such as growth rate and temperature can stillprove challenging (e.g. Walther et al. 2010). Here,many variables covaried on a seasonal basis, particu-larly salinity, water elemental concentrations andtemperature. Retaining a natural temperature cyclewas necessary to stimulate gonad development, andwhile maintenance of constant water chemistrywould have been preferable, the cost for such a long-term experiment would have been prohibitive. AIC-based model selection provided a means to non- subjectively reduce collinearity; however, thisinherent limitation, along with the potential for bio-logical lags (e.g. Macdonald & Crook 2010), meansthat further experimental work is advised to confirmthe importance of (and mechanisms governing) theselected model terms. Whatever the underlying pro-cesses, we have shown clear differences in plasmaelemental concentrations between individuals andgroups of fish living in common marine conditions.Here, we discuss the main results in the context of3 areas we believe have the greatest relevance in thefield of otolith microchemistry: (1) growth and condi-tion, (2) sex and reproduction, and (3) environmentaleffects.
Growth and condition
Plaice growth and condition vary as a function offeeding, temperature, photoperiod and age (Rijns-dorp 1990, Fonds et al. 1992, Bromley 2000). In ourexperiment, the plasma elemental concentrationsthat were significantly affected by growth rateand/or condition included Sr and most of the soft,thiophilic elements (Mn, Cu, Zn and Pb).
The concentration of Sr in blood plasma was nega-tively related to growth rate, consistent with field ob -servations relating otolith Sr/Ca ratios in marine fishwith seasonal and ontogenetic changes in growthrate, despite essentially uniform ambient concentra-tions (Kalish 1989, Sadovy & Severin 1994, Brown &Severin 2009). Growth rate was not included in thefemale-only model, however, and in other studies,relationships between growth rate and otolith Sr/Caratios are not always detected, implying sex-, spe-cies- and/or stage-specific processes (Walther et al.2010). Other studies have hypothesised that temper-ature is the primary driver of apparent growth rateeffects (e.g. Martin et al. 2004), but here, tempera-ture was uncorrelated with growth rate (r = −0.05).
Growth rate had a significant positive influence onMn and Pb concentrations in blood plasma. Based onprevious experimental work, it is likely that soft acidmetal ions such as Mn, Zn and Cu are largely proteinbound in the blood (e.g. Fletcher & Fletcher 1980),and a significant proportion may be sourced from thediet (e.g. Pentreath 1973, 1976, Ranaldi & Gagnon2008). Indeed, plasma concentrations of all soft ele-ments were enriched relative to ambient concentra-tions, exhibiting average distribution coefficients ashigh as 3363 (DZn(B/W)). Protein-metal binding in theblood influences the rate of elemental turnover andexerts a major influence on the proportion of dis-solved free ions and their ability to pass across mem-branes via passive or active mechanisms. While mostproteins are unlikely to move freely from blood toendolymph, some proteins and free amino acids formthe precursor molecules for the otolith organic matrix(Payan et al. 2004b). Thus, even predominantly‘bound’ ions may still enter the endolymph and be -come incorporated into the otolith crystal lattice ororganic matrix. If MnB and PbB are indeed primarilysourced from the diet, this could explain the positivegrowth rate effect on blood concentrations (Table 3),given that growth is primarily a function of foodration (Fonds et al. 1992) and concentrations of bothelements were orders of magnitude higher in the dietthan the ambient seawater (M. J. Cooper unpubl.).Such effects might be especially pronounced in ourstudy, given that most (75%) subject animals wereselected on the basis of greater otolith depositionduring the experimental period, which was generallyaccompanied by faster somatic growth rates. How-ever, MnB values remained enriched through thenon-feeding period (January through March), imply-ing additional waterborne sources or recycling viatissue breakdown or bone demineralisation (e.g.Kacem et al. 2000).
259
Mar Ecol Prog Ser 500: 245–264, 2014
Sex and reproduction
Sex and/or GSI significantly influenced bloodplasma concentrations of all elements except K, Rb,Mg and Ba. Overall, LiB, CaB, MnB and PbB valueswere higher in females, while CuB and SeB valueswere higher in males. For some elements (Cu, Pb, Caand Sr), sex interacted with other covariates, furthercomplicating relationships between tissue and ambi-ent concentrations. Excluding the quasi-conservativeelements (Sr and Ca), Li was the only hard element toexhibit sex-related differences in plasma concentra-tions; however, the difference was relatively small.Given that LiB values were similar in the mature andimmature females, this sex effect is unlikely to beexplained by ovary development but may reflect dif-ferences in size and growth typical of this sexuallydimorphic species (Rijnsdorp 1989).
Unlike the other elements that form hard acid ions,CaB and SrB values exhibited significant differencesbetween males and females during the reproductiveseason (Fig. 4e,f). In the females, almost 60% of thevariation in CaB was explained by plasma proteinconcentrations, while 40% of the variation in SrB wasexplained by protein concentrations and GSI. Theseobservations support previous findings that totalplasma Ca concentrations (and probably Ca homo-logues such as Sr) are divided approximately equallybetween bound and unbound fractions (Mugiya1966, Andreasen 1985). Relationships between bloodhypercalcaemia, hyperproteinaemia and reproduc-tive investment in oviparous fish are well recognised,with females mobilising large quantities of proteinand Ca2+ for egg production (Urist & Schjeide 1961).Spawning-related increases in CaB values have beenreported for a range of marine, euryhaline and fresh-water species (e.g. Woodhead 1968, Shearer 1984,Valtonen & Laitinen 1988). In North Sea plaice,ovaries begin to grow in mass from October (Rijns-dorp 1989), coinciding with the observed increase inCaB in the IS females. In plaice, female reproductiveinvestment is approximately twice that of males(Bromley 2000), and while hypercalcaemia was mostextreme in the mature females, it was also detectablein the immature females and males, an observationshared by some other studies (Kalish 1991, Folmar etal. 1992). The mechanisms governing these patternsremain unclear, but possible explanations includeincreased recovery of Ca2+ through the gut lining,increased residence time of protein-bound Ca com-pared to free Ca2+ (Williams 1971) and/or demineral-isation of bones and breakdown of soft tissues duringstarvation periods (Kacem et al. 2000).
The relationships between plasma protein concen-trations (or condition) and CaB, SrB and PbB differedmarkedly between the males and females, par -ticularly for SrB and PbB (Fig. 5a,b,f). These patternsappeared to be driven by increased plasma ele mentalconcentrations relating to ovary development, as indi -cated by positive correlations with GSI (Fig. 6a,b,f).Similar patterns were observed by Kalish (1991) andare corroborated by seasonal trends in ovary Ca andSr concentrations in rainbow trout (Shearer 1984). Inmature females, the period of hypercalcaemia isaccompanied by synthesis of proteins and steroidsspecific to oocyte production and maturation (Scott etal. 1998). Differences in their binding capacity andspecificity may explain the sex-specific interactionsobserved for SrB, CaB and PbB and may, in turn, affection availability to the otolith.
Shearer (1984) postulated that the positive correla-tion between GSI and ovary Sr concentrations indi-cated a functional requirement of SrB to transfer CaB
to the ovaries. However, Sr is otherwise considered tobe a ‘nonessential’ element (Underwood 1977), andPb is well documented for its toxicity in fish (e.g.Martinez et al. 2004). The concomitant increasesin CaB, SrB and PbB in maturing females may simplyreflect increased protein and Ca requirements foregg production (Urist & Schjeide 1961) and chemicalsimilarities between Sr2+, Pb2+ and Ca2+ ions. Thelagged peak in SrB and PbB compared to CaB mayreflect preferential removal of Ca2+ for egg produc-tion and/or changes in uptake mechanisms andsources during the spawning season. In maturefemale plaice, 64% of carcass lipids are broken downto meet the majority of metabolic energy require-ments during the starvation period, and 40% of carcass proteins are metabolised primarily for eggproduction (Dawson & Grimm 1980). Element-specificpartitioning among tissue types and sex-specific dif-ferences in tissue metabolism during the non-feedingperiod may explain the differences among the sexesand temporal asynchrony among the elements.
Unlike SrB and PbB, CuB, ZnB and SeB generallydecreased during the spawning season, particularlyin the mature IS females. Plasma concentrations werepartly explained by a negative relationship with GSI(Fig. 6c,d,e), presumably reflecting their re moval foregg production. Cu and Zn requirements in ovariandevelopment are well documented and appear broadlyconserved among vertebrates (Flet cher & Fletcher1980, Versieck & Cornelis 1989, Thompson et al.2002). ZnB was depleted in the mature IS femalesfrom October onwards, coincidental with the earlystages of oocyte production and likely caused by
260

Sturrock et al.: Controls on fish blood plasma microchemistry
upregulation of vitellogenin, a Zn-binding proteinthat transports Zn to the ovaries (Fletcher & Fletcher1980). This study represents the first time Se concen-trations have been measured in fish blood plasmaand the first time seasonal trends in Se have beenexamined in any fish biofluid. SeB behaved in a simi-lar manner to CuB, suggesting that it is primarily pro-tein bound in the blood and important for ovariandevelopment, a phenomenon that is already estab-lished in the human reproductive literature (Versieck& Cornelis 1989, Bedwal & Bahuguna 1994).
In summary, sex, maturity and reproductive condi-tion are clearly important, influencing the transport,demand and flux of trace and minor elements inblood plasma and, consequently, their concentrationsand availability for uptake into other tissues. Sepa-rating their influences from other intrinsic (e.g.growth) and extrinsic (e.g. temperature, salinity) factors could prove critical for the accurate inter -pretation of tissue element chemistry.
Environmental effects
For applications using otolith elemental concentra-tions as environmental proxies or geographic mark-ers, the relationship between otolith composition andambient physicochemical conditions must be wellunderstood. Given that marine fish continually drinkseawater to maintain ionic homeostasis, it is likelythat the majority of hard metal ions are sourced fromthe surrounding seawater (e.g. Walther & Thorrold2006). It is often assumed that ion uptake is propor-tional to ambient concentrations, but here, plasmaand seawater elemental concentrations were poorlycorrelated, and plasma microchemistry appearedto be driven primarily by physiological processes.These data emphasize the importance of the signal-to-noise ratio in the application of otolith microchem-istry. This is particularly important for fully marinespecies, which experience relatively minor environ-mental variations compared with their freshwaterand diadromous counterparts (reviewed in Walther &Limburg 2012). Here, for the majority of elements,variations in ambient concentrations were probablytoo small to produce measureable changes in theblood, with conservative and quasi-conservativeEl/Ca ratios effectively constant throughout (Fig. 2).Yet experimental conditions varied according tocoastal precipitation cycles, equating to salinity andtemperature variations of approximately 3 and 10°C,respectively, which would represent relatively largevariations in an open-ocean setting. Laboratory ex -
periments tend to manipulate ambient concentra-tions to ranges far greater than those experienced bymarine species, essentially mimicking gradients thatmay be experienced during diadromous migrations(e.g. Miller 2009, Hicks et al. 2010). Here, both LiBand MgB values were positively related to salinityand/or temperature, although LiB was explained bya significant interaction being unrelated (or evennegatively re lated) to temperature at low salinities.While our BaB measurements (Sturrock et al. 2013)and model fits (Table 3) were relatively poor, weobserved a significant interaction between Ba/CaW
values and temperature, where at low temperaturesthere was no relationship but at higher temperaturesthere was a positive relationship between Ba/CaW
and BaB values. Increasing numbers of studies arereporting interactions between otolith Ba/Ca ratios,temperature and salinity (e.g. Elsdon & Gillanders2002, de Vries et al. 2005, Miller 2011), adding fur-ther complexity to environmental reconstructions.Variations in MgB values were best explained bysalinity; however, the elevated MgB and protein concentrations during summer months and the re -quirement of Mg2+ in almost every major metabolicpathway (Kaim & Schwederski 1994) may also indi-cate higher uptake rates with increased metabolicactivity. However, of all the elements examined, LiB,MgB and BaB appeared to exhibit the least biologicalfractionation and, thus, the greatest potential sensi-tivity to environmental fluctuations.
Despite clear physiological influences on the softerelements, the strongest pairwise correlations be -tween plasma and water elemental concentrationswere for Zn and Se, and for Cu in the (mostly imma-ture) EC females. These correlations were largelydriven by their common decreases during the winterspawning period (Fig. 4i,j,k). While utilisation ofthese elements in oocyte development almost cer-tainly explains the more extreme response of themature IS females, the trend was also exhibited bythe males and immature EC females, implying addi-tional common factors such as ambient concentrationor temperature. The decrease in ZnB and CuB valuesmore closely coincided with cooling water tempera-tures, and a positive temperature effect was includedin both models; however, the mechanism remainsunresolved. While the elemental composition of thediet was not formally quantified, bulk concentrationsof the soft elements were typically orders of magni-tude higher than in seawater (M. J. Cooper unpubl.).Thus, seasonal shifts in feeding activity may havecontributed to the observed trends in plasma concen-trations. Without quantifying the elemental composi-
261

Mar Ecol Prog Ser 500: 245–264, 2014
tion of digested and excreted tissues, it would beimpossible to fully partition dietary vs. waterbornesources. However, the fact that blood plasma concen-trations of the soft elements did not fully covary sug-gests that the observed differences between thesexes were not simply an artefact of sex-specificfeeding behaviours. Experimental work has sug-gested that diet contributes the majority of tissue Mn,Cu and Zn (Pentreath 1973, 1976) and otolith Zn(Ranaldi & Gagnon 2008). Several field studies havefailed to find a relationship between otolith andwater Zn concentrations (Thorrold et al. 1997, Han-son & Zdanowicz 1999, Warner et al. 2005), while thehigh DZn (B/W) value further suggests a non-aqueoussource of Zn. As such, we postulate that the commondecrease in ZnB during winter resulted from reducedfeeding activity, although the earlier and more acutetrend in the mature females almost certainly re -flected active removal for vitellogenesis (Fletcher &Fletcher 1978). Unlike Zn, both experimental andfield studies have reported positive relationshipsbetween ambient and otolith Se concentrations (Lim-burg et al. 2010, Lochet et al. 2010), and the patternsin SeB observed here, while inferring additive effectsof ontogeny, support these findings. Correlations be -tween seawater and otolith Cu concentrations havebeen observed in juvenile fish in the laboratory (Mil-ton & Chenery 2001) but not in the field (Hanson &Zdanowicz 1999). Here, positive relationships be -tween CuW and CuB values were only observed in theimmature EC females, implying that reproductiveeffects dominate tissue concentrations of Cu follow-ing sexual maturity. Validation work including bothmature and immature subject animals will be criticalto understanding the underlying processes.
Studies using otolith microchemistry to infer geo-graphic distributions of fish often do so without priorvalidation and assume a level of environmental sensi-tivity (and variability) that may be grossly overesti-mated. For studies examining stock structure or groupcontributions during mixing events, it is not as criticalto understand the underlying mechanisms, so long asall potential groups have been representatively sam-pled and exhibit unique and reproducible chemi -cal ‘fingerprints’ (Campana 2005, Elsdon et al. 2008).However, to reconstruct lifetime movements fromotolith chemical profiles, several assumptions need tobe met, including the assumption that otolith chem-istry changes predictably with environmental para -meters and that ontogenetic effects on otolith chem-istry are known (Elsdon et al. 2008). If unaccountedfor, physiologically driven changes in blood andotolith chemistry and sex- and stage-specific differ-
ences in elemental processing mechanisms could undermine both assumptions. Populations exhibitingskewed or variable sex ratios or sex-related dispersalpatterns (e.g. Consuegra & García de Leániz 2007)could be vulnerable to mismanagement if their spatialdynamics are interpreted using physiologically sensi-tive markers. Ontogenetic effects on otolith Sr incor-poration have been observed in several species (DePontual et al. 2003, Brown & Severin 2009, Walther etal. 2010), but limited data are available for other ele-ments. In our eagerness to use otoliths as the ‘blackbox recorders’ they are so often compared to, there isa danger for elemental data to be misinterpreted,which could seriously impact management decisionsand progress within the field. While meeting the fullsuite of assumptions required for determining lifetimemovements and life history patterns is beyond thescope of most studies (Elsdon et al. 2008), it is criticalthat validation studies continue and sampling effortscontrol for sex and age wherever possible.
Acknowledgements. This research was funded by a Fish-eries Society of the British Isles PhD studentship to A.M.S.and Defra contract M1102 MEMFISH (macroecology of mar-ine finfish in UK waters). We are grateful to the manyCEFAS staff who aided in sample collection and animal hus-bandry, particularly C. Stewart, S. Hetherington, M. Eade,M. Smith, A. Pliru, J. Pettigrew, L. Privitera and S. Milligan.Constructive comments were provided by R. Johnson (Uni-versity of California, Santa Cruz) and 3 anonymous review-ers. We appreciate the statistical support provided by R.Inger (University of Exeter), P. Challenor (University ofSouthampton) and M. Buoro (University of California,Berkeley) and the advice and shared datasets provided byJ. Kennedy (Møreforsking Marin).
LITERATURE CITED
Abramoff MD, Magelhaes PJ, Ram SJ (2004) Image process-ing with ImageJ. Biophotonics Int 11: 36−42
Andreasen P (1985) Free and total calcium concentrationsin the blood of rainbow trout, Salmo gairdneri, during‘stress’ conditions. J Exp Biol 118: 111−120
Bath GE, Thorrold SR, Jones CM, Campana SE, MclarenJW, Lam JWH (2000) Strontium and barium uptake inaragonitic otoliths of marine fish. Geochim CosmochimActa 64: 1705−1714
Bedwal RS, Bahuguna A (1994) Zinc, copper and seleniumin reproduction. Cell Mol Life Sci 50: 626−640
Ben-Tzvi O, Abelson A, Gaines SD, Sheehy MS, Paradis GL,Kiflawi M (2007) The inclusion of sub-detection limit LA-ICPMS data, in the analysis of otolith microchemistry, byuse of a palindrome sequence analysis (PaSA). LimnolOceanogr Methods 5: 97−105
Bourne PK (1986) Changes in haematological parametersassociated with capture and captivity of the marine tele -ost, Pleuronectes platessa L. Comp Biochem Physiol A85: 435−443
Bromley PJ (2000) Growth, sexual maturation and spawning
262
Sturrock et al.: Controls on fish blood plasma microchemistry
in central North Sea plaice (Pleuronectes platessa L.),and the generation of maturity ogives from commercialcatch data. J Sea Res 44: 27−43
Brown RJ, Severin KP (2009) Otolith chemistry analysesindicate that water Sr: Ca is the primary factor influenc-ing otolith Sr: Ca for freshwater and diadromous fish butnot for marine fish. Can J Fish Aquat Sci 66: 1790−1808
Campana SE (1999) Chemistry and composition of fish oto -liths: pathways, mechanisms and applications. Mar EcolProg Ser 188: 263−297
Campana SE (2005) Otolith elemental composition as a nat-ural marker of fish stocks. In: Cadrin SX, Friedland KD,Waldman JR (eds) Stock identification methods: appli -cations in fishery science. Elsevier, Burlington, MA,p 227−245
Clarke LM, Thorrold SR, Conover DO (2011) Population differences in otolith chemistry have a genetic basis inMenidia menidia. Can J Fish Aquat Sci 68: 105−114
Cleveland WS, Grosse E, Shyu WM (1992) Local regressionmodels. In: Chambers JM, Hastie TJ (eds) Statisticalmodels in S. Chapman & Hall, New York, p 309−376
Cobb JLS, Fox NC, Santer RM (1973) A specific ringer solu-tion for the plaice (Pleuronectes platessa L.). J Fish Biol 5: 587−591
Consuegra S, García de Leániz C (2007) Fluctuating sexratios, but no sex-biased dispersal, in a promiscuous fish.Evol Ecol 21: 229−245
Crawley MJ (2007) The R book. John Wiley & Sons, Chich-ester
Dawson AS, Grimm AS (1980) Quantitative seasonal chan -ges in the protein, lipid and energy content of the car-cass, ovaries and liver of adult female plaice, Pleuro -nectes platessa L. J Fish Biol 16: 493−504
De Pontual H, Lagardère F, Amara R, Bohn M, Ogor A(2003) Influence of ontogenetic and environmentalchanges in the otolith microchemistry of juvenile sole(Solea solea). J Sea Res 50: 199−211
de Vries MC, Gillanders BM, Elsdon TS (2005) Facilitation ofbarium uptake into fish otoliths: influence of strontiumconcentration and salinity. Geochim Cosmochim Acta 69: 4061−4072
Elsdon TS, Gillanders BM (2002) Interactive effects of tem-perature and salinity on otolith chemistry: challenges fordetermining environmental histories of fish. Can J FishAquat Sci 59: 1796−1808
Elsdon TS, Wells BKC, Gillanders SE, Jones BM and others(2008) Otolith chemistry to describe movements and life-history parameters of fishes: hypotheses, assumptions,limitations, and inferences. Oceanogr Mar Biol Annu Rev46: 297−330
Evans DH (1993) The physiology of fishes. CRC Press, BocaRaton, FL
Fletcher PE, Fletcher GL (1978) The binding of zinc to theplasma of winter flounder (Pseudopleuronectes ameri-canus): affinity and specificity. Can J Zool 56: 114−120
Fletcher PE, Fletcher GL (1980) Zinc- and copper-bindingproteins in the plasma of winter flounder (Pseudopleu-ronectes americanus). Can J Zool 58: 609−613
Folmar LC, Moody T, Bonomelli S, Gibson J (1992) Annualcycle of blood chemistry parameters in striped mullet(Mugil cephalus L.) and pinfish (Lagodon rhomboides L.)from the Gulf of Mexico. J Fish Biol 41: 999−1011
Fonds M, Cronie R, Vethaak AD, Van Der Puyl P (1992)Metabolism, food consumption and growth of plaice(Pleuronectes platessa) and flounder (Platichthys flesus)in relation to fish size and temperature. Neth J Sea Res29: 127−143
Hanson PJ, Zdanowicz VS (1999) Elemental composition ofotoliths from Atlantic croaker along an estuarine pollu-tion gradient. J Fish Biol 54: 656−668
Harding D, Nichols JH, Tungate DS (1978) The spawning ofthe plaice (Pleuronectes platessa L.) in the southernNorth Sea and English Channel. Rapp P-V Reùn Cons IntExplor Mer 172: 102−113
Hicks AS, Closs GP, Swearer SE (2010) Otolith microchem-istry of two amphidromous galaxiids across an experi-mental salinity gradient: a multi-element approach fortracking diadromous migrations. J Exp Mar Biol Ecol394: 86−97
Hille S (1982) A literature review of the blood chemistryof rainbow trout, Salmo gairdneri Rich. J Fish Biol 20: 535−569
Hoarau G, Piquet AMT, Van Der Veer HW, Rijnsdorp AD,Stam WT, Olsen JL (2004) Population structure of plaice(Pleuronectes platessa L.) in northern Europe: a compar-ison of resolving power between microsatellites andmitochondrial DNA data. J Sea Res 51: 183−190
Horwood JW, Walker MG, Witthames P (1989) The effect offeeding levels on the fecundity of plaice (Pleuronectesplatessa). J Mar Biol Assoc UK 69: 81−92
Hunter E, Metcalfe JD, Arnold GP, Reynolds JD (2004)Impacts of migratory behaviour on population structurein North Sea plaice. J Anim Ecol 73: 377−385
Hurlbert SH (1984) Pseudoreplication and the design of eco-logical field experiments. Ecol Monogr 54: 187−211
Kacem A, Gustafsson S, Meunier FJ (2000) Demineralizationof the vertebral skeleton in Atlantic salmon Salmo salarL. during spawning migration. Comp Biochem Physiol A125: 479−484
Kaim W, Schwederski B (1994) Bioinorganic chemistry: inor-ganic elements in the chemistry of life. John Wiley &Sons, Chichester
Kalish JM (1989) Otolith microchemistry: validation of theeffects of physiology, age and environment on otolithcomposition. J Exp Mar Biol Ecol 132: 151−178
Kalish JM (1991) Determinants of otolith chemistry: seasonalvariation in the composition of blood plasma, endolymphand otoliths of bearded rock cod Pseudophysis barbatus.Mar Ecol Prog Ser 74: 137−159
Kennedy J, Witthames PR, Nash RDM, Fox CJ (2008) Isfecundity in plaice (Pleuronectes platessa L.) down- regulated in response to reduced food intake duringautumn? J Fish Biol 72: 78−92
Kremling K (1999) Determination of trace metals. In: Grasshoff K, Kremling K, Ehrhardt M (eds) Methods ofseawater analysis. Wiley-VCH, Weinheim, p 253−364
Limburg KE, Lochet A, Driscoll D, Dale DS, Huang R (2010)Selenium detected in fish otoliths: a novel tracer for apolluted lake? Environ Biol Fishes 89: 433−440
Lochet A, Limburg KE, Rudstam L, Montesdeoca M (2010)Selenium incorporation in fish otoliths: effects of sele-nium and mercury from the water. Can J Fish Aquat Sci67: 1388−1397
Macdonald JI, Crook DA (2010) Variability in Sr: Ca and Ba: Ca ratios in water and fish otoliths across an estuarinesalinity gradient. Mar Ecol Prog Ser 413: 147−161
Maddock DM, Burton MPM (1998) Gross and histologicalobservations of ovarian development and related condi-tion changes in American plaice. J Fish Biol 53: 928−944
Martin GB, Thorrold SR, Jones CM (2004) Temperature andsalinity effects on strontium incorporation in otoliths oflarval spot (Leiostomus xanthurus). Can J Fish Aquat Sci61: 34−42
Martinez CBR, Nagae NY, Zaia CTBV, Zaia DM (2004)
263

Mar Ecol Prog Ser 500: 245–264, 2014
Acute morphological and physiological effects of lead inthe neotropical fish Prochilodus lineatus. Braz J Biol 64: 797−807
Melancon S, Fryer BJ, Markham JL (2009) Chemical analy-sis of endolymph and the growing otolith: fractionation ofmetals in freshwater fish species. Environ Toxicol Chem28: 1279−1287
Miller JA (2009) The effects of temperature and water con-centration on the otolith incorporation of barium andmanganese in black rockfish Sebastes melanops. J FishBiol 75: 39−60
Miller JA (2011) Effects of water temperature and bariumconcentration on otolith composition along a salinity gra-dient: implications for migratory reconstructions. J ExpMar Biol Ecol 405: 42−52
Milton DA, Chenery SR (2001) Sources and uptake of tracemetals in otoliths of juvenile barramundi (Lates calcar-ifer). J Exp Mar Biol Ecol 264: 47−65
Mugiya Y (1966) Calcification in fish and shellfish. Seasonalchange in calcium and magnesium concentration of theotolith fluid in some fish with special reference to thezone formation of their otolith. Bull Jpn Soc Sci Fish 32: 549−557
Nagelkerke NJD (1991) A note on a general definition of thecoefficient of determination. Biometrika 78: 691−692
Payan P, Borelli G, Priouzeau F, De Pontual H, Bœuf G,Mayer-Gostan N (2002) Otolith growth in trout Onco-rhynchus mykiss: supply of Ca2+ and Sr2+ to the saccularendolymph. J Exp Biol 205: 2687−2695
Payan P, De Pontual H, Edeyer A, Borelli G, Bœuf G, Mayer-Gostan N (2004a) Effects of stress on plasma homeosta-sis, endolymph chemistry, and check formation duringotolith growth in rainbow trout (Oncorhynchus mykiss).Can J Fish Aquat Sci 61: 1247−1255
Payan P, De Pontual H, Bœuf G, Mayer-Gostan N (2004b)Endolymph chemistry and otolith growth in fish. C RPalevol 3: 535−547
Pentreath RJ (1973) The accumulation and retention of 65Znand 54Mn by the plaice, Pleuronectes platessa L. J ExpMar Biol Ecol 12: 1−18
Pentreath RJ (1976) Some further studies on the accumula-tion and retention of 65Zn and 54Mn by the plaice, Pleu-ronectes platessa L. J Exp Mar Biol Ecol 21: 179−189
Ranaldi MM, Gagnon MM (2008) Zinc incorporation in theotoliths of juvenile pink snapper (Pagrus auratus For -ster): the influence of dietary versus waterborne sources.J Exp Mar Biol Ecol 360: 56−62
Rijnsdorp AD (1989) Maturation of male and female NorthSea plaice (Pleuronectes platessa L.). J Cons 46: 35−51
Rijnsdorp AD (1990) The mechanism of energy allocationover reproduction and somatic growth in female NorthSea plaice, Pleuronectes platessa L. Neth J Sea Res 25: 279−290
Sadovy Y, Severin KP (1994) Elemental patterns in red hind(Epinephelus guttatus) otoliths from Bermuda andPuerto Rico reflect growth rate, not temperature. Can JFish Aquat Sci 51: 133−141
Scott P, Witthames PR, Turner RJ, Canario AVM (1998)Plasma concentrations of ovarian steroids in relation tooocyte final maturation and ovulation in female plaicesampled at sea. J Fish Biol 52: 128−145
Shearer KD (1984) Changes in elemental composition ofhatchery-reared rainbow trout, Salmo gairdneri, associ-ated with growth and reproduction. Can J Fish Aquat Sci41: 1592−1600
Steele JH, Thorpe SA, Turekian KK (eds) (2009) Marine
chemistry and geochemistry: a derivative of the encyclo-pedia of ocean sciences. Academic Press, Burlington,MA
Sturrock AM (2012) Environmental and physiological influ-ences on otolith chemistry in a marine fish. PhD disserta-tion, University of Southampton
Sturrock AM, Trueman CN, Darnaude AM, Hunter E (2012)Can otolith elemental chemistry retrospectively trackmigrations in fully marine fishes? J Fish Biol 81: 766−795
Sturrock AM, Hunter E, Milton JA, Trueman CN (2013)Analysis methods and reference concentrations of 12minor and trace elements in fish blood plasma. J TraceElem Med Biol 27: 273−285
Thompson ED, Mayer GD, Walsh PJ, Hogstrand C (2002)Sexual maturation and reproductive zinc physiology inthe female squirrelfish. J Exp Biol 205: 3367−3376
Thorrold SR, Jones CM, Campana SE (1997) Response ofotolith microchemistry to environmental variations expe-rienced by larval and juvenile Atlantic croaker (Microp-ogonias undulatus). Limnol Oceanogr 42: 102−111
Tohse H, Mugiya Y (2001) Effects of enzyme and aniontransport inhibitors on in vitro incorporation of inorganiccarbon and calcium into endolymph and otoliths insalmon Oncorhynchus masou. Comp Biochem Physiol A128: 177−184
Underwood EJ (1977) Trace elements in human and animalnutrition, 4th edn. Academic Press, New York
Urist MR, Schjeide AO (1961) The partition of calcium andprotein in the blood of oviparous vertebrates duringestrus. J Gen Physiol 44: 743−756
Valtonen T, Laitinen M (1988) Acid stress in respect to calcium and magnesium concentrations in the plasma ofperch during maturation and spawning. Environ BiolFishes 22: 147−154
Versieck J, Cornelis R (1989) Trace elements in humanplasma or serum. CRC Press, Boca Raton, FL
Walther BD, Limburg KE (2012) The use of otolith chemistryto characterize diadromous migrations. J Fish Biol 81: 796−825
Walther BD, Thorrold SR (2006) Water, not food, contri -butes the majority of strontium and barium deposited inthe otoliths of a marine fish. Mar Ecol Prog Ser 311: 125−130
Walther BD, Kingsford MJ, O’Callaghan MD, McCullochMD (2010) Interactive effects of ontogeny, food rationand temperature on elemental incorporation in otoliths ofa coral reef fish. Environ Biol Fishes 89: 441−451
Waring CP, Stagg RM, Poxton MG (1992) The effects of han-dling on flounder (Platichthys flesus L.) and Atlanticsalmon (Salmo salar L.). J Fish Biol 41: 131−144
Waring CP, Stagg RM, Poxton MG (1996) Physiological res -ponses to handling in the turbot. J Fish Biol 48: 161−173
Warner R, Swearer S, Caselle J, Sheehy M, Paradis G (2005)Natal trace-elemental signatures in the otoliths of anopen-coast fish. Limnol Oceanogr 50: 1529−1542
Watts PC, Nash RDM, Kemp SJ (2004) Genetic structure ofjuvenile plaice Pleuronectes platessa on nursery groundswithin the Irish Sea. J Sea Res 51: 191−197
Williams DR (1971) The metals of life. Van Nostrand Rein-hold, London
Woodhead PMJ (1968) Seasonal changes in the calcium con-tent of the blood of arctic cod. J Mar Biol Assoc UK 48: 81−91
Zuur AF, Ieno EN, Walker NJ, Saveliev AA, Smith GM(2009) Mixed effects models and extensions in ecologywith R. Springer, New York
264
Editorial responsibility: Stylianos Somarakis, Heraklion, Greece
Submitted: September 12, 2013; Accepted: December 13, 2013Proofs received from author(s): March 7, 2014