physiological mechanisms mediating the coupling between ...€¦ · silvani et al. posture-related...
TRANSCRIPT

ORIGINAL RESEARCHpublished: 27 March 2017
doi: 10.3389/fphys.2017.00163
Frontiers in Physiology | www.frontiersin.org 1 March 2017 | Volume 8 | Article 163
Edited by:
Eugene Nalivaiko,
University of Newcastle, Australia
Reviewed by:
Luca Carnevali,
University of Parma, Italy
Marli Cardoso Martins-Pinge,
Universidade Estadual de Londrina,
Brazil
*Correspondence:
Pietro Cortelli
Specialty section:
This article was submitted to
Integrative Physiology,
a section of the journal
Frontiers in Physiology
Received: 26 January 2017
Accepted: 03 March 2017
Published: 27 March 2017
Citation:
Silvani A, Calandra-Buonaura G,
Johnson BD, van Helmond N,
Barletta G, Cecere AG, Joyner MJ
and Cortelli P (2017) Physiological
Mechanisms Mediating the Coupling
between Heart Period and Arterial
Pressure in Response to Postural
Changes in Humans.
Front. Physiol. 8:163.
doi: 10.3389/fphys.2017.00163
Physiological Mechanisms Mediatingthe Coupling between Heart Periodand Arterial Pressure in Response toPostural Changes in Humans
Alessandro Silvani 1, Giovanna Calandra-Buonaura 1, 2, Blair D. Johnson 3,
Noud van Helmond 4, Giorgio Barletta 2, Anna G. Cecere 2, Michael J. Joyner 4 and
Pietro Cortelli 1, 2*
1Department of Biomedical and Neuromotor Sciences, University of Bologna, Bologna, Italy, 2 IRCCS Bologna Institute of
Neurological Sciences, Bologna, Italy, 3Center for Research and Education in Special Environments, Department of Exercise
and Nutrition Sciences, University at Buffalo, Buffalo, NY, USA, 4Department of Anesthesiology, Mayo Clinic, Rochester, MN,
USA
The upright posture strengthens the coupling between heart period (HP) and systolic
arterial pressure (SAP) consistently with a greater contribution of the arterial baroreflex
to cardiac control, while paradoxically decreasing cardiac baroreflex sensitivity (cBRS).
To investigate the physiological mechanisms that mediate the coupling between HP
and SAP in response to different postures, we analyzed the cross-correlation functions
between low-frequency HP and SAP fluctuations and estimated cBRSwith the sequence
technique in healthy male subjects during passive head-up tilt test (HUTT, n = 58),
during supine wakefulness, supine slow-wave sleep (SWS), and in the seated and
active standing positions (n = 8), and during progressive loss of 1 L blood (n = 8) to
decrease central venous pressure in the supine position. HUTT, SWS, the seated, and
the standing positions, but not blood loss, entailed significant increases in the positive
correlation between HP and the previous SAP values, which is the expected result of
arterial baroreflex control, compared with baseline recordings in the supine position
during wakefulness. These increases were mirrored by increases in the low-frequency
variability of SAP in each condition but SWS. cBRS decreased significantly during HUTT,
in the seated and standing positions, and after blood loss compared with baseline
during wakefulness. These decreases were mirrored by decreases in the RMSSD index,
which reflects cardiac vagal modulation. These results support the view that the cBRS
decrease associated with the upright posture is a byproduct of decreased cardiac
vagal modulation, triggered by the arterial baroreflex in response to central hypovolemia.
Conversely, the greater baroreflex contribution to cardiac control associated with upright
posture may be explained, at least in part, by enhanced fluctuations of SAP, which elicit
a more effective entrainment of HP fluctuations by the arterial baroreflex. These SAP
fluctuations may result from enhanced fluctuations of vascular resistance specific to the
upright posture, and not be driven by the accompanying central hypovolemia.
Keywords: baroreflex, heart, arterial blood pressure, central venous pressure, tilt table test, seated position,
standing position, hemorrhage

Silvani et al. Posture-Related Changes in Cardiovascular Coupling
INTRODUCTION
The upright posture challenges blood pressure and results inblood pooling and increased capillary ultrafiltration below theheart. The resultant decrease in central venous pressure (CVP)weakens cardiac contraction and leads to orthostatic hypotensionif not compensated by the autonomic and skeletal musclesystems (Freeman et al., 2011). The arterial baroreflex modulatesautonomic control of the heart and resistance vessels as afunction of arterial wall tension, sensed by baroreceptors in thewalls of the carotid sinuses and the aortic arch (Mancia andMark, 2011). The arterial baroreflex competes for autonomiccontrol of the heart and resistance vessels with other reflexes,such as the arterial chemoreflex, and with central autonomiccommands (Silvani et al., 2016). Standing upright produces anexaggerated fall of arterial pressure in patients with bilateralcarotid sinus denervation consequent to carotid body tumorresection, suggesting a key role of carotid baroreceptors in thehemodynamic compensation of upright posture (Smit et al.,2002). Accordingly, the analysis of spontaneous cardiovascularfluctuations, performed with a range of techniques designedto detect causality based on information theory, indicates thatthe upright posture increases the contribution of the arterialbaroreflex to cardiac control (Nollo et al., 2005; Porta et al., 2011,2014, 2015; Faes et al., 2013; Zamunér et al., 2015). Somewhatparadoxically, however, the cardiac baroreflex sensitivity (cBRS)estimated based on spontaneous fluctuations decreases in theupright position (Steptoe and Vögele, 1990; O’Leary et al., 2003;Nollo et al., 2005; Faes et al., 2013; Schwartz et al., 2013; Zamunéret al., 2015). The physiological mechanisms underlying theseposture-related changes in cardiovascular coupling still remainunclear.
Potential insights may come from a different line of research,which investigated sleep-related differences in cardiovascularcoupling with a simple linear technique, the cross-correlationfunction (CCF) between fluctuations of systolic arterial pressure(SAP) and heart period (HP). The CCF yields the linearcorrelation coefficient between HP and SAP as a function ofthe time shift between these variables. The sign of the timeshift indicates whether HP fluctuations precede (positive sign)or are preceded by (negative sign) those of SAP. Previousexperimental (Silvani et al., 2008, 2013) and theoretical (Silvaniet al., 2011) research on human subjects indicates that theCCF between the LF fluctuations of HP and SAP may showa positive peak at negative time shifts. This peak indicates apattern of positive correlation between the values of HP andthe previous values of SAP, which is consistent with arterialbaroreflex control of the heart (Silvani et al., 2011). TheCCF analysis uncovered differences in cardiovascular couplingbetween non-rapid-eye-movement sleep (slow-wave sleep, SWS)and wakefulness in the lying position, consistent with a greaterbaroreflex contribution to cardiac control during SWS both inhuman subjects (Silvani et al., 2008, 2013) and in animal models(Silvani et al., 2005, 2010, 2012). The interpretation of theseCCF patterns of cardiovascular coupling was supported andrefined with an in-silico study (Silvani et al., 2011) based onan extensively validated non-linear model of the cardiovascular
system (Ursino, 1998; Ursino and Magosso, 2000). This studysuggested that the CCF pattern of positive correlation betweenSAP and the previous HP values, which is consistent witharterial baroreflex control of HP: (a) ensues as a result ofbaroreflex buffering of SAP fluctuations generated by changesof vascular resistance of whichever cause; (b) is dampened bydecreases in the maximal sensitivity of the baroreflex, computedat the centering point of the baroreflex sigmoid function; (c)is dampened by central autonomic commands acting on theheart; and (d) is not explained by hypovolemia per se (Silvaniet al., 2011). Application of the CCF analysis in previous workdid not fully replicate the increased baroreflex contribution tocardiac control in the upright position, which was detectedbased on corrected conditional entropy, an information-domainanalysis technique (Faes et al., 2013). It is, therefore, presentlyunclear whether the interpretative framework of CCF patterns(Silvani et al., 2011) may be extrapolated to the posture-relatedchanges in cardiovascular coupling. If this were the case, sincethe CCF pattern of baroreflex cardiac control is dampened byreduced baroreflex sensitivity (Silvani et al., 2011), the increasedbaroreflex contribution to cardiac control in the upright positionwould appear at odds with the decrease in cBRS. However, thisparadox may be explained based on evidence that the cBRSdecrease in the upright position reflects reduced sensitivity atthe baroreflex operating point, whereas the sensitivity at thebaroreflex centering point does not change (Schwartz et al.,2013). These considerations raise the hypothesis that the cBRSdecrease in the upright position is a byproduct of a decrease inthe modulation of cardiac vagal activity, concomitant with thedecrease in the mean HP values.
In the present study, we tested the hypotheses that inthe upright position, the increased baroreflex contribution tocardiac control does not result from central hypovolemia, butrather reflects enhanced SAP fluctuations driven by vascularresistance, while the cBRS decrease reflects decreased cardiacvagal modulation. We went beyond the widely studied paradigmthat compares supine wakefulness with passive standing (head-up tilt test, HUTT), including subjects lying asleep (SWS),seating, actively standing, and lying awake supine after controlledblood loss to cause central hypovolemia. We re-assessed theissue of whether the CCF analysis, a simple and widely availablelinear technique, is suitable to detect the increased baroreflexcontribution to cardiac control in the upright position, which hasbeen reported using sophisticated analysis techniques designedto detect causality based on information theory. Finally, weanalyzed the links between the HP vs. SAP coupling, asassessed with the CCF analysis, and widely-applied indexes ofcardiovascular variability in the time and frequency domains,including estimates of cBRS with the sequence technique(Bertinieri et al., 1988), by applying a data-driven hierarchicalclustering approach.
MATERIALS AND METHODS
Ethical ApprovalThis study involved the analysis of data from 74 human subjects.All subjects provided written informed consent to their research
Frontiers in Physiology | www.frontiersin.org 2 March 2017 | Volume 8 | Article 163

Silvani et al. Posture-Related Changes in Cardiovascular Coupling
protocol, which conformed to the principles of the Declaration ofHelsinki and received prior approval by the institutional reviewboards of the University of Bologna (approval code 876/CE) andthe Mayo Clinic (approval code 11-3071).
Subjects and RecordingsExperiment 1: Cardiovascular Coupling during
Passive Upright TiltThe analysis was performed on data obtained from 58 malesubjects aged 38± 1 years (range 20–60 years), who were referredto the department of biomedical and neuromotor sciences(DIBINEM) and IRCCS Bologna institute of neurologicalsciences of the university of Bologna, Italy, for suspected neurallymediated syncope, but whose HUTT resulted negative. None ofthe subjects included in this experiment experienced symptomsof pre-syncope or syncope during the HUTT. The subjectsself-reported to abstain from drugs and medications. Cardiac,endocrine, metabolic, and renal diseases were excluded on thebasis of self-reported health history, physical examination, androutine laboratory tests. Before the beginning of the study, thesubjects were instructed to abstain from heavy physical activityfor 24 h and from alcohol and caffeinated beverages for 12 h.The subjects had a light breakfast before the recordings, whichwere performed in the morning. Values of RR interval (HP)and arterial pressure (FinometerMidi, FinapresMedical Systems,Amsterdam, The Netherlands) were recorded continuously witha polygraph amplifier (Model 15LT, Grass Technologies, Quincy,MA) that was connected to an analogic to digital converteroperated by custom software (SparkBio Srl, Bologna, Italy).Recordings were performed with the subjects at baseline, lyingawake in the supine position, then during HUTT at 65◦ for 10–30min.
Experiment 2: Cardiovascular Coupling during Active
Upright Standing, While Seated, and during
Slow-Wave SleepThe analysis was performed on data from 8 healthy male subjectsaged 39 ± 5 years, who were enrolled by the autonomic unitof the DIBINEM and IRCCS Bologna institute of neurologicalsciences of the university of Bologna, Italy, and were recordedwith the same setup as for Experiment 1. The subjects self-reported to abstain from drugs andmedications, had values of theapnea-hypopnea index < 10, and did not complain of daytimesleepiness. Cardiac, endocrine, metabolic, and renal diseases wereexcluded on the basis of self-reported health history, physicalexamination, and routine laboratory tests. Before the beginningof the study, the subjects were instructed to abstain from heavyphysical activity for 24 h and from alcohol and caffeinatedbeverages for 12 h. During the study, subjects lived in a roomwith a controlled temperature (24 ± 1◦C), humidity (40–50%)and light–dark schedule (light off from 23:00 h to 07:00 h).Subjects were required to lie in bed, except for eating (1,800 kcalper day divided into 3 meals and 3 snacks with a fixed timeschedule), and were allowed to read, watch television and sleepad libitum. Continuous non-invasive recordings of physiologicalvariables were performed for 48 h. Finger arterial pressure was
measured with the volume-clamp method (Portapres Model-2; Finapres Medical Systems, Amsterdam, the Netherlands).Electrocardiogram, electroencephalogram (C3-A2 and C4-A1leads), electrooculogram, electromyogram (submentalis muscle)and ventilation were recorded with a Colleague recorder(Albert Grass heritage, Model PSG16P-1; Astro-Med Inc., WestWarwick, RI). The present study included recordings obtainedin the morning while subjects were asked to lie awake in thesupine position, then to sit in a chair, and finally to stand activelyupright. None of the subjects experienced symptoms of pre-syncope or syncope during the protocol. This study also reportedthe analysis of recordings of these same subjects during nocturnalSWS (stages 3 and 4 of non-rapid-eye-movement sleep withRechtschaffen and Kales classification on 30 s epochs), to allowfor direct comparison with previous work (Silvani et al., 2013).
Experiment 3: Cardiovascular Coupling during
Progressive Blood LossWe also analyzed data from a previously published dataset(Johnson et al., 2014) of 8 healthy male subjects aged 32 ± 3years, who underwent stepwise reductions in circulating bloodvolume. Details of the experimental design and methods arereported elsewhere (Johnson et al., 2014). All subjects reportedbeing free of cardiovascular, respiratory, neurologic, or metabolicdiseases, were non-obese (body mass index <30) and non-smokers, and did not take any medications. At 07:00 h, followingan overnight fast, subjects consumed a small breakfast (240 kcal)and drank 250 ml of water before being instrumented in thesupine position in a temperature-controlled room (20–22◦C). A3-lead electrocardiogram was used to continuously record RRinterval (HP). Three vascular catheters were introduced usingaseptic techniques under local anesthesia (2% lidocaine) andultrasound guidance. A 16-gauge catheter was introduced intoan antecubital vein, connected to a high-resolution transducer(FloTrac; Edwards Lifesciences, Irvine, CA) and advanced untilan appropriate CVP waveform was obtained, then positionedat heart level for continuous CVP measurement. A 14-gaugecatheter was inserted in an antecubital vein to facilitateblood removal. A 20-gauge, 5-cm catheter was placed intoa brachial artery, connected to a high-resolution transducer(FloTrac; Edwards Lifesciences) and positioned at heart levelfor continuous arterial pressure measurement. Subjects wereinstructed not to cross their legs or contract any muscles in theirlower body throughout the protocol. At least 30 min followinginvasive instrumentation, recordings were performed during a 5min baseline period with the subjects lying awake in the supineposition. Then, 3 aliquots of 333 mL of blood were removed viagravity from an antecubital vein, and recordings were performedduring the 5 min periods separating each aliquot. None ofthe subjects experienced symptoms of pre-syncope or syncopeduring the protocol.
Data AnalysisData analysis was performed with routines written in Matlab(the Mathworks, Inc.) and with the same approach for allexperiments. The analysis was based on the whole available beat-to-beat time series of HP, of SAP, of diastolic arterial pressure
Frontiers in Physiology | www.frontiersin.org 3 March 2017 | Volume 8 | Article 163

Silvani et al. Posture-Related Changes in Cardiovascular Coupling
(DAP), and, in Experiment 3, also of CVP. The duration of thesetime series was 14 ± 1 and 17 ± 1 min in Experiment 1 withsubjects in the supine and HUTT conditions, respectively; 14 ±
2, 5, 5, and 148 ± 16 min in Experiment 2 with subjects in thesupine, seated, and active standing positions and during SWS,respectively; 5 min at baseline and after each step of blood lossin Experiment 3.
Artifacts due tomeasurement noise, e.g., because of occasionalsubject movements, or Finapres/Portapres calibrations, wereautomatically detected based on the magnitude of differencesin HP, SAP, or CVP-values between subsequent beats, and theaccuracy of determination was confirmed by visual check of thetime series. The total duration of beats with artifacts in at leastone signal, expressed as a percentage of the analyzed recordingtime, amounted to 4.5 ± 0.2 and 4.6 ± 0.2% in Experiment 1with subjects in the supine and HUTT conditions, respectively;to 8.4± 1.2, 6.7± 0.6, 6.1± 0.5, and 5.1± 0.3% in Experiment 2with subjects in the supine, seated, and active standing positionsand during SWS, respectively; and to 0.3 ± 0.2, 1.0 ± 0.4, 0.7 ±
0.4, and 1.7 ± 0.7% at baseline and after each progressive step ofblood loss in Experiment 3. The beats with artifacts were excludedfrom the computation of indexes based on beat-to-beat valuesin the time domain, whereas they were substituted by meansof piecewise cubic spline interpolation for the computation ofindexes based on the CCF analysis or on spectral analysis.
In particular, the following cardiovascular indexes werecomputed based on beat-to-beat values in the time domain: themean values of SAP, HP, and CVP, the square root of the meansquared differences of the successive values of HP (RMSSD),and the cBRS. RMSSD estimates the short-term variability of HPvalues between successive heart beats (Task force of the europeansociety of cardiology and the north american society of pacingand electrophysiology, 1996), reflecting the vagal modulationof HP (van den Berg et al., 1997). cBRS estimates the arterialbaroreflex change in HP caused by a unit change in SAP, andwas assessed with the sequence technique (Bertinieri et al., 1988)as previously described in detail (Silvani et al., 2008). Additionalcardiovascular indexes were computed based on spectral analysisor on CCF analysis after resampling the beat-to-beat timeseries at 4 Hz by linear interpolation, and were averaged overconsecutive data subsets of 5 min duration overlapped for 4 min(Silvani et al., 2008, 2013). Spectral analysis was performed withfast Fourier transforms on detrended and Hann-windowed datasubsets of HP and SAP. The spectral powers of HP and SAP inthe low-frequency (LF, 0.04-0.15 Hz; HP-LFSD and SAP-LFSD)and high-frequency (HF, 0.15-0.4 Hz; HP-HFSD and SAP-HFSD)bands were computed, square rooted, and scaled for expressionin units of standard deviation. The CCF between HP and SAPwas computed on detrended and low-pass filtered (<0.15 Hz,10-pole Butterworth filter; phase distortion avoided by forwardand reverse filtering) data subsets at time shifts between−25 and25 s, and normalized so that the autocorrelations at 0 time shiftwere identically 1 (Silvani et al., 2008, 2013). The CCF betweenthe LF fluctuations of HP and SAP in humans may show apositive peak at negative time shifts between 0 and−10 s (Silvaniet al., 2008, 2011, 2013). This peak indicates a pattern of positivecorrelation between the values of HP and the previous values of
SAP, which is consistent with arterial baroreflex control of theheart (Silvani et al., 2011). On this basis, the index pCC in thisstudy was computed as the maximum value of the CCF at timeshifts between−10 and 0 s.
Statistical AnalysisStatistical tests were performed with the SPSS software (SPSS,Inc.) by means of analysis of variance (ANOVA) or covariance(ANCOVA) with general linear model procedures and Huyn-Feldt correction for lack of the sphericity assumption, and of t-tests. In Experiment 1, the discrimination of the supine vs. HUTTcondition of individual subjects was assessed with a receiveroperating characteristic (ROC) function, which plotted detectionsensitivity vs. false positive rate (i.e., 1–specificity). In the sameexperiment, a data-driven, exploratory approach was appliedto map the links between the different cardiovascular indexescomputed, employing a hierarchical cluster analysis based onsquared Euclidean distances between z-scores within variables.The hypotheses generated by the cluster analysis (i.e., of linksbetween SAP-LFSD and pCC, and between RMSSD and cBRS)and were then evaluated by testing for significant Pearson’slinear correlation between changes in these indexes on passingfrom the supine position to HUTT. In these analyses, subjectswere classified as responders if pCC increased from the supineposition to HUTT, and as non-responders otherwise. Based onthe results of these analyses, and in order to limit the number ofstatistical comparisons performed, the analysis of Experiments 2and 3 focused on SAP-LFSD, pCC, RMSSD, and cBRS. Statisticalsignificance for all tests was set at P < 0.05. Data are reported asmean± SEM.
RESULTS
Experiment 1: Cardiovascular Couplingduring Passive Upright tiltHUTT caused significant increases of the mean value of DAPand SAP and of the variability of SAP in the LF (SAP-LFSD)and the HF (SAP-HFSD) ranges (Table 1) above the respectivebaseline values in the supine position. Conversely, HUTTentailed significant decreases in the mean value of HP, in thevariability of HP either between successive heart beats (RMSSDindex) or in the HF frequency range (HP-HFSD), and in cBRScompared to the supine position. The variability of HP in theLF range (HP-HFSD) did not change significantly during HUTTcompared to the supine position.
The values of HP fluctuated in parallel with the previousvalues of SAP to a greater extent during HUTT than in the supineposition (Figure 1A). The pattern of cardiovascular couplingthat prevailed during HUTT was thus such that HP tended toincrease following increases in SAP and to decrease followingdecreases in SAP, consistently with the arterial baroreflex controlof HP (Silvani et al., 2011). These observations were quantifiedby analyzing the CCF between the LF fluctuations of HP andthose of SAP. Only during HUTT did this CCF show a positivepeak at negative time shifts, i.e., for HP fluctuations that followedthose of SAP (Figure 1B). Accordingly, the value of pCC, whichquantify the height of the CCF peak at negative time shifts,
Frontiers in Physiology | www.frontiersin.org 4 March 2017 | Volume 8 | Article 163

Silvani et al. Posture-Related Changes in Cardiovascular Coupling
TABLE 1 | Mean values and variability of arterial pressure and heart period
during 65◦ head-up tilt test.
SUPINE HUTT
DAP (mm Hg) 62.2 ± 1.0 74.0 ± 1.2*
SAP (mm Hg) 116.1 ± 1.4 126.1 ± 1.5*
SAP-LFSD (mm Hg) 2.6 ± 0.1 4.1 ± 0.2*
SAP-HFSD (mm Hg) 0.9 ± 0.0 1.9 ± 0.1*
HP (ms) 954.0 ± 15.8 768.6 ± 12.6*
HP-LFSD (ms) 27.6 ± 1.6 27.4 ± 1.3
HP-HFSD (ms) 19.4 ± 1.3 10.6 ± 0.7*
RMSSD (ms) 39.6 ± 2.9 19.9 ± 1.1*
cBRS (ms mm Hg−1) 15.8 ± 0.9 6.4 ± 0.4*
HUTT, 65◦ head-up tilt test. SUPINE, supine position before HUTT. DAP and SAP, diastolic
and systolic arterial pressure, respectively. HP, heart period. SAP-LFSD, SAP-HFSD, HP-
LFSD, HP-HFSD: square root of the low-frequency (LF, 0.04–0.15 Hz) or high-frequency
(HF, 0.15–0.4 Hz) spectral powers of SAP or HP, respectively, scaled for expression in units
of standard deviation. RMSSD, root mean square of the differences between consecutive
values of HP. cBRS, spontaneous cardiac baroreflex sensitivity (sequence technique).
Data are shown as mean ± SEM in 58 healthy male controls. *P < 0.05 vs. SUPINE
(t-test).
were significantly higher during HUTT (0.39± 0.02) than in thesupine position (0.08± 0.02; P < 0.001, t-test).
The increase in pCC from the supine position to HUTT wassignificant (ANCOVA: P = 0.006) irrespective of the age ofthe subjects (ANCOVA: P = 0.914 for the interaction betweenage and body position), although the values of pCC in thesupine position as well as during HUTT were lower in oldersubjects (ANCOVA: P = 0.005 for the effect of age; Figure 2A).pCC increased from the supine position to HUTT in mostsubjects (91.4%, or 53 out of 58 subjects, hereafter defined as theresponders, in contrast with the remaining 5 subjects, defined asnon-responders; Figure 2B). The robustness of the changes inpCC associated with HUTT was supported by a ROC functionanalysis, which demonstrated that pCC significantly (P < 0.001)and effectively (AUC = 88.9 ± 3.1%) discriminated whetherrecordings were performed during HUTT or in the supineposition (Figure 2C).
A hierarchical cluster analysis of these results indicated thatpCC and cBRS belonged to two different clusters of variables,which were more closely related to the values of SAP and HP,respectively (Figure 2D). In particular, pCC was closely relatedto a sub-cluster of variables including SAP-LFSD and SAP-HFSD,whereas cBRSwas closely related to another sub-cluster includingRMSSD and HP-HFSD. To simplify interpretation of results,in follow-up analyses, we focused on SAP-LFSD, which wascomputed based on LF fluctuations as was pCC, as representativeof one sub-cluster, and on RMSSD, which was computed inthe time-domain as was cBRS, as representative of the othersub-cluster.
Supporting the heuristic value of this exploratory clusteranalysis, we found that the increase in pCC from the supineposition to HUTTwas positively and significantly correlated withthe increase in SAP-LFSD in responders (Pearson’s r = 0.44, P= 0.001, implicating r2 = 19% of shared variance; Figure 2E).The differences in pCC and SAP-LFSD between the supine
FIGURE 1 | Cardiovascular coupling during 65◦ head-up tilt test. HUTT,
65◦ head-up tilt test. SUPINE, supine position before HUTT. HP, heart period.
SAP, systolic arterial pressure. CCF, cross-correlation functions between
low-pass filtered (<0.15 Hz) spontaneous fluctuations of SAP and HP. (A)
Representative time series of HP and SAP. Thick lines indicate the result of
low-pass filtering <0.15 Hz. Values are in standardized units (S.U.). (B) CCF,
with negative time shifts indicating that HP followed SAP. Data are shown as
mean ± SEM in 58 male subjects.
position and HUTT were both significantly larger in responders(pCC: +0.34 ± 0.02; SAP-LFSD: +1.6 ± 0.1 mm Hg) than innon-responders (pCC: −0.15 ± 0.07, P < 0.001; SAP-LFSD:+0.6 ± 0.3 mm Hg, P = 0.025, t-test). On the other hand,neither the decrease in cBRS (P = 0.296, t-test) nor that inRMSSD (P = 0.331, t-test) from the supine position to HUTTdiffered significantly between non-responders and responders.In responders, the decrease in cBRS from the supine positionto HUTT was positively and significantly correlated with thedecrease in RMSSD (Pearson’s r = 0.79, P < 0.001, implicatingr2 = 63% of shared variance; Figure 2F).
Experiment 2: Cardiovascular Couplingduring Active Upright Standing, WhileSeated, and during Slow-Wave SleepIn line with the results of Experiment 1, HP fluctuations tended tobe parallel with the previous SAP fluctuations to a greater extentwhile the subjects were seated (Figure 3A) and, even more so,while they were actively standing upright (Figure 3B), than whilethey rested awake in the supine position. Accordingly, the CCFbetween the LF fluctuations of HP and SAP in subjects seatedor actively standing upright showed a clear-cut positive peak atnegative time shifts, i.e., reflecting HP fluctuations that followed
Frontiers in Physiology | www.frontiersin.org 5 March 2017 | Volume 8 | Article 163

Silvani et al. Posture-Related Changes in Cardiovascular Coupling
FIGURE 2 | Relationships between indexes of cardiovascular coupling and cardiovascular variability during 65◦ head-up tilt test. HUTT, 65◦ head-up tilt
test. SUPINE, supine position before HUTT. HP, heart period. SAP, systolic arterial pressure. CCF, cross-correlation functions between low-pass filtered (<0.15 Hz)
time series of HP and SAP. pCC, correlation coefficient at the CCF peak at time shifts between–10 and 0 s. SAP-LFSD, SAP-HFSD, HP-LFSD, HP-HFSD: square root
of the low-frequency (LF, 0.04–0.15 Hz) or high-frequency (HF, 0.15–0.4Hz) spectral powers of SAP or HP, respectively, scaled to units of standard deviation. RMSSD,
root mean square of differences between consecutive values of HP. cBRS, spontaneous cardiac baroreflex sensitivity (sequence technique). (A) Values of pCC as a
function of subject age. (B) Values of pCC in responder (R) or non-responder (NR) subjects, in whom pCC increased or did not increase from SUPINE to HUTT,
respectively. (C) Receiver-operating characteristic (ROC) curve of the discrimination between SUPINE and HUTT based on pCC. (D) Dendrogram of the hierarchical
cluster analysis of the variables listed in the y-axis, measured during SUPINE and HUTT, and scaled by the joining distances of the clusters. (E,F) Differences (1)
between HUTT and SUPINE in pCC and SAP-LFSD and in cBRS and RMSSD, respectively. In (A,B,E,F) each circle indicates values in a single subject. Data are
shown as mean ± SEM in 58 male subjects.
Frontiers in Physiology | www.frontiersin.org 6 March 2017 | Volume 8 | Article 163

Silvani et al. Posture-Related Changes in Cardiovascular Coupling
FIGURE 3 | Cardiovascular coupling during active upright standing, in
the seated position, and during slow-wave sleep. SEATED, seated
position in a chair; SUPINE, supine position during wakefulness before sitting;
STANDING, actively standing upright from the seated position; SWS,
slow-wave sleep during the night. HP, heart period. SAP, systolic arterial
pressure. CCF, cross-correlation functions between low-pass filtered (<0.15
Hz) spontaneous fluctuations of SAP and HP. (A,B) Representative time series
of HP and SAP. Thick lines indicate the result of low-pass filtering <0.15 Hz.
Values are in standardized units (S.U.). (C) CCF, with negative time shifts
indicating that HP followed SAP. Data are shown as mean ± SEM in 8 healthy
male subjects.
those of SAP. This pattern was similar to that occurring duringSWS in the same subjects (Figure 3C).
Again supporting the heuristic value of the cluster analysisin Experiment 1, the values of pCC and those of SAP-LFSD computed in Experiment 2 progressively and significantlyincreased from the condition of lying awake supine to theseated position, and even more so to the active standingposition (Figures 4A,B). Moreover, the values of cBRS andRMSSD (Figures 4C,D) progressively and significantly decreasedduring wakefulness from the supine to the seated and active
FIGURE 4 | Relationships between indexes of cardiovascular coupling
and cardiovascular variability during active upright standing, in the
seated position, and during slow-wave sleep. (A) pCC, correlation
coefficient at the peak of the cross-correlation functions between low-pass
filtered (<0.15 Hz) fluctuations of heart period (HP) and systolic arterial
pressure (SAP), at time shifts between −10 and 0 s. (B) SAP-LFSD, square
root of the low-frequency (LF, 0.04–0.15 Hz) spectral power of SAP, scaled for
expression in units of standard deviation. (C) cBRS, spontaneous cardiac
baroreflex sensitivity. (D) RMSSD, root mean square of differences between
consecutive values of HP. Data are shown as mean ± SEM in 8 healthy male
subjects. ANOVA: P < 0.001 for pCC, SAP-LFSD, and cBRS; P = 0.013 for
RMSSD. *, †, and ‡: P < 0.05 vs. SUPINE, vs. SEATED, and vs. STANDING,
respectively (t-test).
standing positions. The mean values of HP also decreased duringwakefulness from the supine to the seated and active standingpositions. The mean values of DAP showed opposing changes,increasing during wakefulness from the supine to the seated andactive standing positions, whereas themean values of SAP did notdiffer significantly among these conditions (Table 2).
During SWS, the values of pCC did not differ significantlyfrom those in the seated position, and were intermediate betweenthose in the supine position during wakefulness and those inthe active standing position (Figure 4A). The values of SAP-LFSD (Figure 4B) and the mean values of DAP and SAP
Frontiers in Physiology | www.frontiersin.org 7 March 2017 | Volume 8 | Article 163

Silvani et al. Posture-Related Changes in Cardiovascular Coupling
TABLE 2 | Mean values of arterial pressure and heart period during active
upright standing, while seated, and during slow-wave sleep.
SUPINE SEATED STANDING SWS
DAP (mm Hg) 70.8 ± 3.0 76.8 ± 2.8* 80.8 ± 3.1*† 59.9 ± 2.6*†‡
SAP (mm Hg) 134.5 ± 6.4 141.4 ± 5.0 142.7 ± 5.5 113.7 ± 5.8*†‡
HP (ms) 940.9 ± 51.6 847.4 ± 43.7* 745.2 ± 42.8*† 1068.5 ± 48.3*†‡
SEATED, seated position in a chair; SUPINE, lying supine awake before assuming the
seated position; STANDING, actively standing upright from the seated position; SWS,
slow-wave sleep during the night. HP, heart period. DAP and SAP, diastolic and systolic
arterial pressure, respectively. Data are shown as mean± SEM in 8 healthy male subjects.
ANOVA: P < 0.001 for DAP, SAP and HP. *,†, and
‡: P < 0.05 vs. SUPINE, vs. SEATED,
and vs. STANDING, respectively (t-test).
(Table 2) during SWS were significantly lower than in each othercondition during wakefulness. The mean value of HP duringSWSwas instead significantly higher than in each other condition(Table 2). The values of cBRS and RMSSD (Figures 4C,D) duringSWS did not differ significantly from those in subjects lyingawake supine, and were significantly higher than those in theseated and active standing positions, once again in line with theheuristic derived from cluster analysis in Experiment 1.
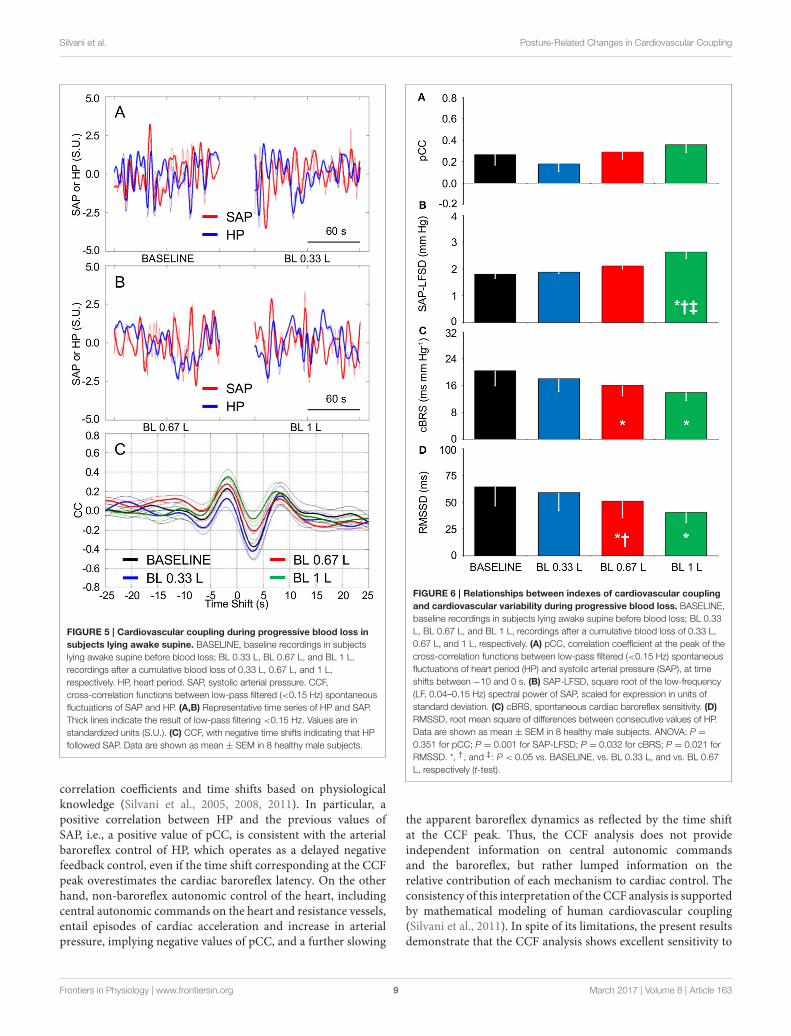
Experiment 3: Cardiovascular Couplingduring Progressive Blood LossIn comparison with baseline conditions of subjects lying awakesupine, the loss of 0.33 L blood significantly decreased the meanvalue of CVP without entailing significant changes in the meanvalues of SAP and HP (Table 3). Greater blood losses elicitedfurther reductions in the mean values of CVP, with concomitantreductions in the mean values of HP and SAP. The mean valuesof DAP did not vary with blood loss.
The tendency of HP fluctuations to be parallel with theprevious values of SAP, which was observed in Experiment 1during HUTT and in Experiment 2 in the seated and standingpositions and during SWS, did not appreciably vary afterprogressive blood loss in the supine position (Figures 5A,B).Accordingly, the CCF between the LF fluctuations of HP andSAP showed a positive peak at negative time shift, which didnot differ significantly in height after progressive blood loss(Figures 5C, 6A). The values of SAP-LFSD increased significantlyabove baseline conditions only after the loss of 1 L of blood(Figure 6B). This increase in SAP-LFSD was, however, quitelimited (+0.8 ± 0.2 mm Hg) and similar in magnitude tothe increase in SAP-LFSD during HUTT in the non-respondersubjects of Experiment 1 (+0.6 ± 0.3 mm Hg, cf. above). Thevalues of cBRS and RMSSD (Figures 6C,D) did not changesignificantly after a blood loss of 0.33 L, whereas they decreasedsignificantly below baseline values after greater blood losses.
DISCUSSION
Summary of the Main FindingsIn this study, we re-assessed the issue of whether the CCF analysisis suitable to detect the increased baroreflex contribution tocardiac control in the upright position. Our results supported
TABLE 3 | Mean values of arterial pressure, heart period, and central
venous pressure during progressive blood loss.
BASELINE BL 0.33 L BL 0.67 L BL 1 L
DAP (mm Hg) 70.1 ± 1.9 70.0 ± 1.6 70.5 ± 1.9 70.1 ± 1.8
SAP (mm Hg) 133.9 ± 5.0 132.4 ± 4.5 129.0 ± 5.4* 124.9 ± 5.6*
HP (ms) 1041.0 ± 61.4 1005.3 ± 46.8 962.5 ± 43.7*† 906.9 ± 45.1*†‡
CVP (mm Hg) 8.1 ± 0.8 5.6 ± 0.8* 3.9 ± 1.0*† 2.5 ± 1.1*†‡
BASELINE, baseline recordings in subjects lying awake supine before blood loss; BL 0.33
L, BL 0.67 L, and BL 1 L, recordings after a cumulative blood loss of 0.33 L, 0.67 L, and
1 L, respectively. HP, heart period. DAP and SAP, diastolic and systolic arterial pressure,
respectively. CVP, central venous pressure. Data are shown as mean ± SEM in 8 healthy
male subjects. ANOVA: P = 0.877 for DAP, P = 0.051 for SAP, P < 0.001 for HP and
CVP. *,†, and
‡: P < 0.05 vs. BASELINE, vs. BL 0.33 L, and vs. BL 0.67 L, respectively
(t-test).
this view: with the CCF analysis, a relatively simple time-domain technique, we found that a range of passive (HUTT) andactive (seated and standing positions) upright postures robustlyentailed a positive correlation between HP and the previousvalues of SAP, which is consistent with arterial baroreflex controlof HP, compared to the supine position. We then tested thehypotheses that in the upright position, the increased baroreflexcontribution to cardiac control does not result from centralhypovolemia, but rather reflects enhanced SAP fluctuationsdriven by fluctuations of vascular resistance, while the cBRSdecrease reflects decreased cardiac vagal modulation. Our resultsfully supported these hypotheses. Accordingly, reductions inCVP in the supine position elicited by progressive blood loss didnot significantly affect the positive correlation between HP andthe previous values of SAP. Increases in the positive correlationbetween HP and the previous values of SAP were associated withincreases in the LF variability of SAP during HUTT and in theseated and active standing positions, but not during SWS. Thevalues of cBRS decreased in parallel with values of the RMSSDindex during HUTT, in the seated and active standing positions,and after blood loss, compared to the supine position eitherduring wakefulness or during SWS.
The CCF Analysis Is Sensitive toPosture-Related Changes inCardiovascular CouplingA set of analysis techniques based on information theory (Nolloet al., 2005; Porta et al., 2011, 2014, 2015; Faes et al., 2013;Zamunér et al., 2015) has been applied to infer the directionand strength of causal links between the time series of SAPand HP. A rather straightforward interpretation of causalityis afforded by these techniques at the expense of significantcomputational and theoretical complexity. Different techniques,such as a linear model-based approach and non-linear model-free analyses of local predictability and conditional entropy, mayentail different levels of sensitivity and specificity to causal links(Faes et al., 2013; Porta et al., 2014). On the other hand, thecomputational and theoretical complexity of the CCF analysis ismuch more limited, and its similarity to the popular Pearson’scorrelation coefficient may make it widely accessible. However,the CCF analysis requires cautious inference of causality from
Frontiers in Physiology | www.frontiersin.org 8 March 2017 | Volume 8 | Article 163
Silvani et al. Posture-Related Changes in Cardiovascular Coupling
FIGURE 5 | Cardiovascular coupling during progressive blood loss in
subjects lying awake supine. BASELINE, baseline recordings in subjects
lying awake supine before blood loss; BL 0.33 L, BL 0.67 L, and BL 1 L,
recordings after a cumulative blood loss of 0.33 L, 0.67 L, and 1 L,
respectively. HP, heart period. SAP, systolic arterial pressure. CCF,
cross-correlation functions between low-pass filtered (<0.15 Hz) spontaneous
fluctuations of SAP and HP. (A,B) Representative time series of HP and SAP.
Thick lines indicate the result of low-pass filtering <0.15 Hz. Values are in
standardized units (S.U.). (C) CCF, with negative time shifts indicating that HP
followed SAP. Data are shown as mean ± SEM in 8 healthy male subjects.
correlation coefficients and time shifts based on physiologicalknowledge (Silvani et al., 2005, 2008, 2011). In particular, apositive correlation between HP and the previous values ofSAP, i.e., a positive value of pCC, is consistent with the arterialbaroreflex control of HP, which operates as a delayed negativefeedback control, even if the time shift corresponding at the CCFpeak overestimates the cardiac baroreflex latency. On the otherhand, non-baroreflex autonomic control of the heart, includingcentral autonomic commands on the heart and resistance vessels,entail episodes of cardiac acceleration and increase in arterialpressure, implying negative values of pCC, and a further slowing
FIGURE 6 | Relationships between indexes of cardiovascular coupling
and cardiovascular variability during progressive blood loss. BASELINE,
baseline recordings in subjects lying awake supine before blood loss; BL 0.33
L, BL 0.67 L, and BL 1 L, recordings after a cumulative blood loss of 0.33 L,
0.67 L, and 1 L, respectively. (A) pCC, correlation coefficient at the peak of the
cross-correlation functions between low-pass filtered (<0.15 Hz) spontaneous
fluctuations of heart period (HP) and systolic arterial pressure (SAP), at time
shifts between −10 and 0 s. (B) SAP-LFSD, square root of the low-frequency
(LF, 0.04–0.15 Hz) spectral power of SAP, scaled for expression in units of
standard deviation. (C) cBRS, spontaneous cardiac baroreflex sensitivity. (D)
RMSSD, root mean square of differences between consecutive values of HP.
Data are shown as mean ± SEM in 8 healthy male subjects. ANOVA: P =
0.351 for pCC; P = 0.001 for SAP-LFSD; P = 0.032 for cBRS; P = 0.021 for
RMSSD. *, †, and ‡: P < 0.05 vs. BASELINE, vs. BL 0.33 L, and vs. BL 0.67
L, respectively (t-test).
the apparent baroreflex dynamics as reflected by the time shiftat the CCF peak. Thus, the CCF analysis does not provideindependent information on central autonomic commandsand the baroreflex, but rather lumped information on therelative contribution of each mechanism to cardiac control. Theconsistency of this interpretation of the CCF analysis is supportedby mathematical modeling of human cardiovascular coupling(Silvani et al., 2011). In spite of its limitations, the present resultsdemonstrate that the CCF analysis shows excellent sensitivity to
Frontiers in Physiology | www.frontiersin.org 9 March 2017 | Volume 8 | Article 163

Silvani et al. Posture-Related Changes in Cardiovascular Coupling
the posture-related increase in the contribution of the arterialbaroreflex to cardiac control: this increase was detected in 91.4%of subjects during HUTT, significantly discriminated HUTTfrom the lying supine position (Figure 2), and occurred in agraded fashion from the lying supine position to the seatedand active standing positions (Figure 4), which are knownto elicit different cardiovascular responses (Eckberg, 1980).Thus, our results indicate that the CCF analysis may representa sensitive and widely-available complement to information-domain techniques in the assessment of posture-related changesin cardiovascular coupling.
In previous work, the enhancement of the baroreflexcontribution to the coupling between HP and SAP during earlyHUTT could be detected both in control subjects and in subjectswith neurally mediated syncope by employing the conditionalentropy analysis, an information-domain analysis of causality,but only in control subjects by employing the CCF analysis (Faeset al., 2013). Taken together, our results and those of previouswork (Faes et al., 2013) thus raise the hypothesis that the CCFanalysis during HUTT may discriminate patients with neurallymediated syncope from control subjects. However, in a minorityof subjects (5/58, the non-responders), we found that pCC didnot increase during HUTT, yet no symptom of pre-syncope orsyncope was experienced (Figure 2B). Since the subjects includedin Experiment 1 were referred for evaluation because of suspectedneurally mediated syncope (cf. Methods), we cannot excludethat at least some of them had a non-physiological response toupright posture. Moreover, our subdivision in responders andnon-responders should be taken cautiously, as it was based onrelatively minor changes of a single index (pCC). With thesecaveats in mind, our results suggest that the enhancement of thearterial baroreflex control of HP during HUTT is physiological,but is not necessary for orthostatic tolerance. Accordingly, thereis evidence of individual variability in the recruitment of differentand partially redundant baroreflex responses, such as increasesof heart rate and burst incidence of muscle sympathetic nerveactivity during upright standing (Burke et al., 1977). Moreover,neither fixed-rate cardiac pacing (Taylor and Eckberg, 1996)nor pharmacological cardiac vagal blockade (Ogoh et al., 2006)abolishes arterial pressure regulation during HUTT in healthyhuman subjects.
Analysis of information-domain causality has yieldedcontrasting results on the effects of subject age on the baroreflexcontribution to cardiac control, which depended on the bodyposition and the specific analysis technique employed (Portaet al., 2014). In particular, a linear model-based approachand a model-free analysis of conditional entropy did notdetect significant age-related changes in the causality fromSAP to HP, which is attributable to the arterial baroreflex, insubjects either lying supine or actively standing. Conversely, amodel-free analysis of local predictability indicated a decreasein the causality from SAP to HP with age during activestanding but not during supine rest (Porta et al., 2014). Theenhancement of cardiac baroreflex control during HUTTdetected by the CCF analysis was also robust to differencesin subject age in our sample of subjects aged 20–60 years(Figure 2A). Nonetheless, we found that pCC decreased
with subject age both in the supine position and duringHUTT. With the caution that is mandatory in interpretingcross-sectional data, these results suggest that the control ofHP in awake subjects lying supine shifts from a prevalenceof the arterial baroreflex (positive pCC) to a prevalence ofcentral autonomic commands (negative pCC) with increasingage.
cBRS May Decrease in the UprightPosition as a Byproduct of DecreasedModulation of Cardiac Vagal ActivityTriggered by Arterial Baroreflex ActivationOur finding that cBRS decreased with active and passive standingpostures compared to the lying position (Table 1, Figure 4C)agrees with previous work (Steptoe and Vögele, 1990; O’Learyet al., 2003; Nollo et al., 2005; Faes et al., 2013; Schwartzet al., 2013; Zamunér et al., 2015). Moreover, our finding thatcBRS in the supine position significantly decreased after theloss of more than 0.33 L of blood is in line with previousreports (Hughson et al., 1994; Saitoh et al., 2008) obtainedusing lower-body negative pressure, which also decreases CVPin the supine position. Previous work has shown that thecardiac baroreflex control during HUTT is reset toward highervalues of arterial pressure and lower values of HP, but that itsmaximal sensitivity, corresponding to the centering point of thebaroreflex sigmoid function, does not change (Schwartz et al.,2013). However, cardiac baroreflex sensitivity at the baroreflexoperating point decreases during HUTT, and is accuratelytracked by estimates of spontaneous cBRS (Schwartz et al.,2013). This raises the hypothesis that the cBRS decrease duringHUTT may be a byproduct of a decrease in the modulationof cardiac vagal activity, concomitant with the decrease inthe mean HP values. Our findings that decreases in cBRSduring HUTT (Table 1, Figures 2D–F), in the seated and activestanding positions (Figures 4C,D), and during progressive bloodloss in the supine position (Figures 6C,D) were accompaniedby corresponding decreases in RMSSD, which reflects themodulation of cardiac vagal activity (van den Berg et al., 1997),support this hypothesis.
The Upright Posture Specifically EnhancesSAP FluctuationsTheoretical (deBoer et al., 1987) and experimental (Bertram et al.,1998) evidence indicates that the LF fluctuations of vascularresistance are paradoxically enhanced by the arterial baroreflexcontrol of sympathetic nerve activity to blood vessels, whichresonates in the LF range due to delays in its effector response.We found that SAP-LFSD significantly increased during HUTT(Table 1, Figure 2E) and also in the seated and active standingpositions (Figure 4B) compared to baseline recordings in thesupine position, in line with a previous reports (Veermanet al., 1994; Barnett et al., 1999; Cooke et al., 1999; Marchiet al., 2016). On the other hand, we found that SAP-LFSDincreased more modestly if at all in the supine position afterblood loss (Figure 6B). These data may reflect a type II errordue to sample size (n = 8), which was relatively small, albeit
Frontiers in Physiology | www.frontiersin.org 10 March 2017 | Volume 8 | Article 163

Silvani et al. Posture-Related Changes in Cardiovascular Coupling
considerable in absolute terms with respect to the demandingexperimental protocol of Experiment 3. Nonetheless, our dataare in line with previous data that employed lower-body negativepressure to decrease CVP in the supine position (Kiviniemi et al.,2011; Aletti et al., 2012). Activation of the cardiopulmonarybaroreflex may enhance the arterial baroreflex control of vascularresistance in human subjects (Victor and Mark, 1985). Thisis of relevance because the decrease in mean HP and meanSAP elicited by the loss of 0.67 L or 1 L blood in this study(Table 3) suggest activation of the arterial baroreflex in additionto cardiopulmonary reflex receptors (Mark and Mancia, 2011).Milder hypovolemia may also unload arterial baroreceptors,causing transient decreases in SAP that are rapidly buffered by thearterial baroreflex (Fu et al., 2009). We cannot directly comparethe degree of central hypovolemia caused by progressive bloodloss with that caused by HUTT, seating, and active standingupright because we did not measure CVP in Experiments 1and 2. However, we have shown in previous work that thedecrease of CVP caused by the loss of 1 L of blood is similarto that caused by a lower body negative pressure of 30 mmHg (Johnson et al., 2014). Other workers have reported that60◦ HUTT causes a degree of central hypovolemia, indexed bythe decrease in left ventricular end-diastolic volume, that liesbetween those caused by lower body negative pressures of 20 and40 mm Hg (Kitano et al., 2005). Taken together, these two piecesof evidence suggest that the loss of 1 L of blood in the supineposition in Experiment 3 caused a degree of central hypovolemiacomparable to that caused by 65◦ HUTT in Experiment 1.We cannot exclude that further blood loss in excess of 1 Lwould have increased SAP-LFSD to the levels observed during65◦ HUTT. Nonetheless, arterial baroreflex resonance appearsinsufficient to explain the whole of our findings on SAP-LFSD. Inaddition to the cardiopulmonary and arterial baroreflexes, andat variance with blood loss or lower body negative pressure inthe supine position, the upright posture entails the stimulationof different proprioceptive and vestibular receptors. At leastthe activation of vestibular receptors may contribute to thehemodynamic compensation of the upright posture, becausevestibular receptors modulate sympathetic activity (Yates et al.,2014), and may interact additively with the arterial baroreflex(Ray, 2000). It is thus conceivable that the increase of SAP-LFSD in the upright position results, in part, from the vestibularmodulation of sympathetic activity. Interestingly, the increasein vascular resistance caused by central hypovolemia is greaterin the lower than in the upper limbs during HUTT, whereasit does not differ between limbs during lower body negativepressure in the supine position (Kitano et al., 2005). Theseresults suggest that the control of limb vascular resistanceexerted by the cardiopulmonary and arterial baroreflexes ismodulated by local mechanisms induced by gravitational effects(Kitano et al., 2005). Local vascular factors in skeletal musclesmay also impact on SAP-LFSD, because spontaneous arteriolarvasomotion occurs in the LF range (Bertuglia et al., 1996)and is affected by perfusion pressure (Meyer et al., 1988) andtissue metabolism (Pradhan and Chakravarthy, 2011), both ofwhich may change in the leg skeletal muscles in the uprightposition.
The Enhanced Arterial Baroreflex Controlof HP in the Upright Position May ReflectBuffering of Enhanced Fluctuations ofVascular ResistanceOur results support a direct link between the SAP variabilityin the LF range and the prevalence of cardiac baroreflexcontrol during wakefulness, as indexed by SAP-LFSD and pCC,respectively, both in the responder subjects of Experiment 1during HUTT (Figures 2D,E) and in the subjects of Experiment2 in the seated and standing positions (Figures 4A,B). Instark contrast, the increase in pCC during SWS comparedto wakefulness in the supine position was accompanied by asignificant decrease in SAP-LFSD (Figures 4A,B). These findingscan be interpreted in the light of the emergent propertiesof a mathematical model of human cardiovascular coupling(Silvani et al., 2011): the arterial baroreflex coupling betweenHP and SAP fluctuations is enhanced by arterial baroreflexbuffering of the SAP changes elicited by vascular resistancefluctuations, and is opposed by central autonomic commandsacting on the heart. In this light, the enhancement of the arterialbaroreflex coupling between HP and SAP, which we inferredin the responder subjects of Experiment 1 during HUTT andin the subjects of Experiment 2 in the seated and standingpositions, may have resulted, at least in part, from an increasedvariability of vascular resistance. Specularly, the lack of increaseof pCC in the non-responder subjects of Experiment 1 duringHUTT and in the subjects of Experiment 3 after blood loss mayhave been, at least in part, because SAP-LFSD did not increaseenough. On the other hand, the increase in pCC in subjectslying supine during SWS compared to wakefulness may haveoccurred despite a decrease in vascular resistance fluctuationsbecause of weaker central autonomic commands to the heartassociated with the lack of active engagement with the externalenvironment.
CONCLUSIONS
Our data indicate that upright posture strengthens the couplingbetween HP and SAP consistently with a greater contributionof the arterial baroreflex to cardiac control. This strengtheningcan be readily assessed with the CCF analysis, a relatively simpletime-domain technique, and occurs in the face of a reducedcBRS. Our results further suggest that the enhanced arterialbaroreflex coupling between HP and SAP in the upright positionis not triggered by decreased CVP, but rather reflects bufferingof enhanced fluctuations of vascular resistance, whereas thedecreased cBRS represents a byproduct of decreased modulationof cardiac vagal activity triggered by arterial baroreflexactivation.
AUTHOR CONTRIBUTIONS
AS, BJ, MJ, and PC conceived and designed research;GC, BJ, NvH, GB, AC, MJ, and PC performedexperiments and recordings; AS analyzed data, interpretedresults of experiments, prepared figures, and drafted
Frontiers in Physiology | www.frontiersin.org 11 March 2017 | Volume 8 | Article 163

Silvani et al. Posture-Related Changes in Cardiovascular Coupling
manuscript; GC, BJ, NvH, MJ, and PC edited andrevised manuscript; all authors approved final version ofthe manuscript.
FUNDING
Support for this study was provided by U.S. ArmyMRMC Combat Casualty Care Research Program Grant
W81XWH-11–1-0823 and American Heart Association MidwestAffiliate Grant 13POST-14380027 to BJ.
ACKNOWLEDGMENTS
We thank the subjects for participating in the study. We alsothank Margaret McGill-Zimny and David Warren for theirassistance with the blood loss protocol.
REFERENCES
Aletti, F., Ferrario, M., Xu, D., Greaves, D. K., Shoemaker, J. K., Arbeille, P.,
et al. (2012). Short-term variability of blood pressure: effects of lower body
negative pressure and long-duration bed rest. Am. J. Physiol. Regul. Integr.
Comp. Physiol. 303, R77–R85. doi: 10.1152/ajpregu.00050.2012
Barnett, S. R., Morin, R. J., Kiely, D. K., Gagnon, M., Azhar, G., Knight, E.
L., et al. (1999). Effects of age and gender on autonomic control of blood
pressure dynamics. Hypertension 33, 1195–1200. doi: 10.1161/01.HYP.33.
5.1195
Bertinieri, G., Di Rienzo, M., Cavallazzi, A., Ferrari, A. U., Pedotti, A., andMancia,
G. (1988). Evaluation of baroreceptor reflex by blood pressure monitoring in
unanesthetized cats. Am. J. Physiol. Heart Circ. Physiol. 254, H377–H383.
Bertram, D., Barres, C., Cuisinaud, G., and Julien, C. (1998). The
arterial baroreceptor reflex of the rat exhibits positive feedback
properties at the frequency of Mayer waves. J. Physiol. 513, 251–261.
doi: 10.1111/j.1469-7793.1998.251by.x
Bertuglia, S., Colantuoni, A., Arnold, M., andWitte, H. (1996). Dynamic coherence
analysis of vasomotion and flow motion in skeletal muscle microcirculation.
Microvasc. Res. 52, 235–244. doi: 10.1006/mvre.1996.0061
Burke, D., Sundlöf, G., and Wallin, G. (1977). Postural effects on
muscle nerve sympathetic activity in man. J. Physiol. 272, 399–414.
doi: 10.1113/jphysiol.1977.sp012051
Cooke, W. H., Hoag, J. B., Crossman, A. A., Kuusela, T. A., Tahvanainen,
K. U., and Eckberg, D. L. (1999). Human responses to upright tilt:
a window on central autonomic integration. J. Physiol. 517, 617–628.
doi: 10.1111/j.1469-7793.1999.0617t.x
deBoer, R. W., Karemaker, J. M., and Strackee, J. (1987). Hemodynamic
fluctuations and baroreflex sensitivity in humans: a beat-to-beat model. Am.
J. Physiol. Heart Circ. Physiol. 253, H680–H689.
Eckberg, D. L. (1980). Parasympathetic cardiovascular control in human disease: a
critical review of methods and results. Am. J. Physiol. Heart Circ. Physiol. 239,
H581–H593.
Faes, L., Nollo, G., and Porta, A. (2013). Mechanisms of causal interaction
between short-term RR interval and systolic arterial pressure oscillations
during orthostatic challenge. J. Appl. Physiol. 114, 1657–1667.
doi: 10.1152/japplphysiol.01172.2012
Freeman, R.,Wieling,W., Axelrod, F. B., Benditt, D. G., Benarroch, E., Biaggioni, I.,
et al. (2011). Consensus statement on the definition of orthostatic hypotension,
neurally mediated syncope and the postural tachycardia syndrome. Auton.
Neurosci. 161, 46–48. doi: 10.1016/j.autneu.2011.02.004
Fu, Q., Shibata, S., Hastings, J. L., Prasad, A., Palmer, M. D., and Levine, B. D.
(2009). Evidence for unloading arterial baroreceptors during low levels of lower
body negative pressure in humans. Am. J. Physiol. Heart Circ. Physiol. 296,
H480–H488. doi: 10.1152/ajpheart.00184.2008
Hughson, R. L., Maillet, A., Gharib, C., Fortrat, J. O., Yamamoto, Y., Pavy-LeTraon,
A., et al. (1994). Reduced spontaneous baroreflex response slope during lower
body negative pressure after 28 days of head-down bed rest. J. Appl. Physiol. 77,
69–77.
Johnson, B. D., van Helmond, N., Curry, T. B., van Buskirk, C. M., Convertino,
V. A., and Joyner, M. J. (2014). Reductions in central venous pressure by lower
body negative pressure or blood loss elicit similar hemodynamic responses. J.
Appl. Physiol. 117, 131–141. doi: 10.1152/japplphysiol.00070.2014
Kitano, A., Shoemaker, J. K., Ichinose, M., Wada, H., and Nishiyasu,
T. (2005). Comparison of cardiovascular responses between lower body
negative pressure and head-up tilt. J. Appl. Physiol. 98, 2081–2086.
doi: 10.1152/japplphysiol.00563.2004
Kiviniemi, A. M., Frances, M. F., Tiinanen, S., Craen, R., Rachinsky, M., Petrella,
R. J., et al. (2011). α-Adrenergic effects on low-frequency oscillations in blood
pressure and R-R intervals during sympathetic activation. Exp. Physiol. 96,
718–735. doi: 10.1113/expphysiol.2011.058768
Mancia, G., and Mark, A. L. (2011). Arterial baroreflexes in humans. Compr.
Physiol. (Supplement 8: Handbook of Physiology, The cardiovascular
system, peripheral circulation and organ blood flow), 755–793.
doi: 10.1002/cphy.cp020320
Marchi, A., Bari, V., DeMaria, B., Esler, M., Lambert, E., Baumert, M., et al. (2016).
Calibrated variability of muscle sympathetic nerve activity during graded head-
up tilt in humans and its link with noradrenaline data and cardiovascular
rhythms. Am. J. Physiol. Regul. Integr. Comp. Physiol. 310, R1134–R1143.
doi: 10.1152/ajpregu.00541.2015
Mark, A. L., and Mancia, G. (2011). Cardiopulmonary baroreflexes in
humans. Compr. Physiol. (Supplement 8: Handbook of Physiology, The
cardiovascular system, peripheral circulation and organ blood flow), 795–813.
doi: 10.1002/cphy.cp020321
Meyer, J. U., Borgström, P., Lindbom, L., and Intaglietta, M. (1988). Vasomotion
patterns in skeletal muscle arterioles during changes in arterial pressure.
Microvasc. Res. 35, 193–203. doi: 10.1016/0026-2862(88)90062-3
Nollo, G., Faes, L., Porta, A., Antolini, R., and Ravelli, F. (2005). Exploring
directionality in spontaneous heart period and systolic pressure
variability interactions in humans: implications in the evaluation of
baroreflex gain. Am. J. Physiol. Heart Circ. Physiol. 288, H1777–H1785.
doi: 10.1152/ajpheart.00594.2004
Ogoh, S., Yoshiga, C. C., Secher, N. H., and Raven, P. B. (2006). Carotid-
cardiac baroreflex function does not influence blood pressure regulation during
head-up tilt in humans. J. Physiol. Sci. 56, 227–233. doi: 10.2170/physiolsci.
RP001306
O’Leary, D. D., Kimmerly, D. S., Cechetto, A. D., and Shoemaker, J. K. (2003).
Differential effect of head-up tilt on cardiovagal and sympathetic baroreflex
sensitivity in humans. Exp. Physiol. 88, 769–774. doi: 10.1113/eph8802632
Porta, A., Catai, A. M., Takahashi, A. C., Magagnin, V., Bassani, T., Tobaldini,
E., et al. (2011). Causal relationships between heart period and systolic arterial
pressure during graded head-up tilt.Am. J. Physiol. Regul. Integr. Comp. Physiol.
300, R378–R386. doi: 10.1152/ajpregu.00553.2010
Porta, A., Faes, L., Bari, V., Marchi, A., Bassani, T., Nollo, G., et al. (2014).
Effect of age on complexity and causality of the cardiovascular control:
comparison between model-based and model-free approaches. PLoS ONE
9:e89463. doi: 10.1371/journal.pone.0089463
Porta, A., Faes, L., Nollo, G., Bari, V., Marchi, A., De Maria, B., et al. (2015).
Conditional self-entropy and conditional joint transfer entropy in heart
period variability during graded postural challenge. PLoS ONE 10:e0132851.
doi: 10.1371/journal.pone.0132851
Pradhan, R. K., and Chakravarthy, V. S. (2011). Informational dynamics of
vasomotion in microvascular networks: a review. Acta Physiol. 201, 193–218.
doi: 10.1111/j.1748-1716.2010.02198.x
Ray, C. A. (2000). Interaction of the vestibular system and baroreflexes on
sympathetic nerve activity in humans. Am. J. Physiol. Heart Circ. Physiol. 279,
H2399–H2404.
Saitoh, T., Ogawa, Y., Aoki, K., Shibata, S., Otsubo, A., Kato, J., et al. (2008). Bell-
shaped relationship between central blood volume and spontaneous baroreflex
function. Auton. Neurosci. 143, 46–52. doi: 10.1016/j.autneu.2008.07.011
Frontiers in Physiology | www.frontiersin.org 12 March 2017 | Volume 8 | Article 163

Silvani et al. Posture-Related Changes in Cardiovascular Coupling
Schwartz, C. E., Medow, M. S., Messer, Z., and Stewart, J. M. (2013).
Spontaneous fluctuation indices of the cardiovagal baroreflex accurately
measure the baroreflex sensitivity at the operating point during upright
tilt. Am. J. Physiol. Regul. Integr. Comp. Physiol. 304, R1107–R1113.
doi: 10.1152/ajpregu.00559.2012
Silvani, A., Asti, V., Bojic, T., Ferrari, V., Franzini, C., Lenzi, P., et al.
(2005). Sleep-dependent changes in the coupling between heart period
and arterial pressure in newborn lambs. Pediatr. Res. 57, 108–114.
doi: 10.1203/01.PDR.0000148065.32413.B0
Silvani, A., Bastianini, S., Berteotti, C., Franzini, C., Lenzi, P., Lo Martire, V., et al.
(2010). Central and baroreflex control of heart period during the wake-sleep
cycle in consomic rats with different genetic susceptibility to hypertension.Clin.
Exp. Pharmacol. Physiol. 37, 322–327. doi: 10.1111/j.1440-1681.2009.05293.x
Silvani, A., Bastianini, S., Berteotti, C., Lo Martire, V., and Zoccoli, G. (2012).
Control of cardiovascular variability during undisturbed wake-sleep behavior
in hypocretin-deficient mice. Am. J. Physiol. Regul. Integr. Comp. Physiol. 302,
R958–R964. doi: 10.1152/ajpregu.00668.2011
Silvani, A., Calandra-Buonaura, G., Dampney, R. A., and Cortelli, P. (2016). Brain-
heart interactions: physiology and clinical implications. Philos. Trans. A Math.
Phys. Eng. Sci. 374:20150181. doi: 10.1098/rsta.2015.0181
Silvani, A., Grimaldi, D., Barletta, G., Bastianini, S., Vandi, S., Pierangeli, G., et al.
(2013). Cardiovascular variability as a function of sleep-wake behaviour in
narcolepsy with cataplexy. J. Sleep Res. 22, 178–184. doi: 10.1111/jsr.12007
Silvani, A., Grimaldi, D., Vandi, S., Barletta, G., Vetrugno, R., Provini, F., et al.
(2008). Sleep-dependent changes in the coupling between heart period and
blood pressure in human subjects. Am. J. Physiol. Regul. Integr. Comp. Physiol.
294, R1686–R1692. doi: 10.1152/ajpregu.00756.2007
Silvani, A., Magosso, E., Bastianini, S., Lenzi, P., and Ursino, M. (2011).
Mathematical modeling of cardiovascular coupling: central autonomic
commands and baroreflex control. Auton. Neurosci. 162, 66–71.
doi: 10.1016/j.autneu.2011.04.003
Smit, A. A., Timmers, H. J., Wieling, W., Wagenaar, M., Marres, H. A., Lenders,
J. W., et al. (2002). Long-term effects of carotid sinus denervation on arterial
blood pressure in humans. Circulation 105, 1329–1335. doi: 10.1161/hc1102.
105744
Steptoe, A., and Vögele, C. (1990). Cardiac baroreflex function during postural
change assessed using non-invasive spontaneous sequence analysis in young
men. Cardiovasc. Res. 24, 627–632. doi: 10.1093/cvr/24.8.627
Task force of the european society of cardiology and the north american society
of pacing and electrophysiology. (1996). Heart rate variability. standards of
measurement, physiological interpretation, and clinical use. Eur. Heart J. 17,
354–381. doi: 10.1093/oxfordjournals.eurheartj.a014868
Taylor, J. A., and Eckberg, D. L. (1996). Fundamental relations between short-
term RR interval and arterial pressure oscillations in humans. Circulation 93,
1527–1532. doi: 10.1161/01.CIR.93.8.1527
Ursino, M. (1998). Interaction between carotid baroregulation and the pulsating
heart: a mathematical model. Am. J. Physiol. Heart Circ. Physiol. 275,
H1733–H1747.
Ursino, M., and Magosso, E. (2000). Acute cardiovascular response to isocapnic
hypoxia. I. A mathematical model. Am. J. Physiol. Heart Circ. Physiol. 279,
H149–H165.
van den Berg, M. P., Haaksma, J., Brouwer, J., Tieleman, R. G., Mulder, G., and
Crijns, H. J. (1997). Heart rate variability in patients with atrial fibrillation
is related to vagal tone. Circulation 96, 1209–1216. doi: 10.1161/01.CIR.96.
4.1209
Veerman, D. P., Imholz, B. P., Wieling, W., Karemaker, J. M., and van Montfrans,
G. A. (1994). Effects of aging on blood pressure variability in resting conditions.
Hypertension 24, 120–130. doi: 10.1161/01.HYP.24.1.120
Victor, R. G., and Mark, A. L. (1985). Interaction of cardiopulmonary and
carotid baroreflex control of vascular resistance in humans. J. Clin. Invest. 76,
1592–1598. doi: 10.1172/JCI112142
Yates, B. J., Bolton, P. S., and Macefield, V. G. (2014). Vestibulo-sympathetic
responses. Compr. Physiol. 4, 851–887. doi: 10.1002/cphy.c130041
Zamunér, A. R., Porta, A., Andrade, C. P., Marchi, A., Forti, M., Furlan, R.,
et al. (2015). Cardiovascular control in women with fibromyalgia syndrome:
do causal methods provide nonredundant information compared with more
traditional approaches? Am. J. Physiol. Regul. Integr. Comp. Physiol. 309,
R79–R84. doi: 10.1152/ajpregu.00012.2015
Conflict of Interest Statement: The authors declare that the research was
conducted in the absence of any commercial or financial relationships that could
be construed as a potential conflict of interest.
Copyright © 2017 Silvani, Calandra-Buonaura, Johnson, van Helmond, Barletta,
Cecere, Joyner and Cortelli. This is an open-access article distributed under the terms
of the Creative Commons Attribution License (CC BY). The use, distribution or
reproduction in other forums is permitted, provided the original author(s) or licensor
are credited and that the original publication in this journal is cited, in accordance
with accepted academic practice. No use, distribution or reproduction is permitted
which does not comply with these terms.
Frontiers in Physiology | www.frontiersin.org 13 March 2017 | Volume 8 | Article 163