physiological traits and quantitative trait loci
TRANSCRIPT

Physiological Traits and Quantitative Trait Loci Associated with
Nitrogen Use Efficiency in Soft Red Winter Wheat
Kyle Geoffrey Brasier
Dissertation submitted to the faculty of the Virginia Polytechnic Institute and State
University in partial fulfillment of the requirements for the degree of
Doctor of Philosophy
In
Crop and Soil Environmental Sciences
Carl A. Griffey
Wade E. Thomason
Jason A. Holliday
Takeshi Fukao
March 15, 2019
Blacksburg, Virginia
Keywords: Triticum aestivum, wheat, nitrogen, nitrogen use efficiency,
quantitative trait loci, linkage mapping, marker-assisted selection

Physiological Traits and Quantitative Trait Loci Associated with
Nitrogen Use Efficiency in Soft Red Winter Wheat
Kyle G. Brasier
ACADEMIC ABSTRACT
Development of winter wheat (Triticum aestivum L.) cultivars capable of more efficient
uptake and utilization of applied nitrogen (N) has the potential to increase grower profitability
and reduce negative environmental consequences associated with N lost from the plant-soil
system. The first study sought to evaluate genotypic variation for N use efficiency (NUE) and
identify lines consistently expressing high or low NUE under two or more N rates in a total of 51
N-environments. The results indicated that significant genotype by N rate interactions were
frequently observed when trials utilized at least three N rates and identified wheat lines with high
and stable yield potential that varied in performance under low N conditions. In addition, NUE
was associated with above-ground biomass at physiological maturity were found to be both
highly heritable across multiple N supplies. In the second study, two bi-parental mapping
populations having a common low (‘Yorktown’) and two high (VA05W-151 and VA09W-52)
NUE parents were characterized to dissect the genetics underlying N response. The populations
were evaluated in eight N-environments and genotyped using single-nucleotide polymorphism
data derived from a genotyping-by-sequencing protocol to identify quantitative trait loci (QTL)
associated with high NUE. Six QTL for NUE were identified on chromosomes 1D, 2D, 4A, 6A,
7A, and 7D that were associated with N use efficiency. The QTL on 2D and 4A co-localized
with known loci governing photoperiod sensitivity and resistance to Fusarium head blight
(caused by the fungal pathogen Fusarium graminearum Schwabe), respectively. Three of the
identified QTL (6A, 7A, and 7D) were associated with NUE in previous investigations, while the
QTL on 1D was novel. The final experiment employed a small panel of soft red winter wheat
lines to study the effects of photoperiod alleles on chromosome 1D (Ppd-D1) on yield-related
traits under three or five N rates that were variably split over two growth stages in eight
environments. The results validated the effect of a photoperiod sensitive allele (Ppd-D1b) that
was associated with increased grain yield across N rates in half of the Virginia testing
environments and under low N rates in all Ohio testing sites at the expense of grain N content.
Yield advantages conferred by the Ppd-D1b allele were attributable to increased floret fertility
and kernel number per spike. The findings from these studies have direct application for winter
wheat breeding programs targeting NUE improvements.
Physiological Traits and Quantitative Trait Loci Associated with
Nitrogen Use Efficiency in Soft Red Winter Wheat
Kyle G. Brasier
GENERAL AUDIENCE ABSTRACT
Wheat (Triticum aestivum L.) products account for a significant percentage of the total
dietary calories and protein consumed globally. To meet production demands, wheat requires
efficient nitrogen (N) management to ensure continued grower profitability and to reduce
negative environmental impacts of N lost from agricultural systems. This dissertation sought to
evaluate variation among wheat lines for N use efficiency (NUE), assess the performance of
wheat lines under multiple N supplies, validate traits that are associated with NUE, investigate
the role of photoperiod sensitivity genes on N response, and identify regions of the wheat
genome associated with high N use efficiency. These studies were conducted using panels of
winter wheat lines grown under two or more N conditions over a combined 32 location-years.
Results of Chapter I identified variation in cultivar response to N rates was more
frequently observed when a greater number of N rates were used in trials of wheat N response.
The first chapter also identified variation among wheat lines for NUE and identified lines that
consistently produce high grain yields over N-location-years. In addition, above-ground biomass
at physiological maturity was found to be strongly associated with grain yield under all N rates
and was highly heritable in both studies. Chapter II utilized a combination of genetic and
observable trait data to perform genetic analysis in two bi-parental populations grown in eight N-
location-years. The study identified reproducible and significant genetic markers associated with
NUE for application in wheat breeding programs. Upon analysis of photoperiod sensitive versus
insensitive wheat lines in Chapter III, photoperiod sensitive wheat lines had a significant yield
advantage under N-limited conditions in Ohio and across N treatments in half of the Virginia
testing location-years. This resulted from an increased number of kernels per spike and fertile
florets in photoperiod sensitive wheat lines. Results from this dissertation suggest that active
breeding and selection for N response may be achieved through the employment of high NUE
genes and the continued identification of adapted high NUE wheat parental lines.

iv
DEDICATION
This dissertation is dedicated to those that have supported me through my graduate education,
especially Brian, Rhena, Alyson, Sam, and Duke. None of this would be possible without your
kindness and support.
v
ACKNOWLEDGEMENTS
The results presented in this dissertation are the product of many amazing people. I am grateful
for the contributions of many individuals and it has been my most sincere privilege to work with
all of you on the nitrogen use efficiency projects.
First, I am indebted to my advisor, Dr. Carl Griffey, who provided an amazing opportunity to
tackle the challenge of nitrogen use efficiency. Dr. Griffey taught me what it means to be an
impactful breeder and mentor through his leadership and actions. Finally, Dr. Griffey allowed
me to develop studies that were too big for a single graduate student to complete but provided
the incredible amount of assistance required to complete the project.
I would also like to thank the members of the Virginia Tech Small Grains Breeding Group,
including Wynse Brooks, Limei Liu, Subas Malla, Josh Fitzgerald, Luciana Rosso, Anthony
Christopher, John Seago, Jon Light, Brian Ward, Neal Carpenter, Jordan Ulrich, Nick Meier,
Camron Clark, William Myers, Sam Lawton, Inam Jameel, and Bradley Cole. These individuals
were instrumental to the completion of this dissertation. I will never forget our unique
experiences traveling across the state each summer.
Furthermore, this dissertation would be incomplete without the assistance of the incredible staff
at the Agricultural Research and Extension Centers including Bob Pitman, Joseph Oakes, Mark
Vaughn, Scooter Dunaway, Lin Barrack, Mary Beahm, Robin Markham, Michelle Lee, Maria
Balota, and the countless others that made the spring and summer months an adventure to
remember. I would also like to thank the technical staff in Blacksburg that kept this dissertation
moving along, including Liz Rucker, Steve Nagle, Harry Behl, and Mike Brosius.
I would also like to thank the friends that helped me maintain some degree of sanity throughout
my time in Blacksburg, including Sam Winter, Alexis Eliot, Brian Ward, Neal Carpenter, Jordan
Ulrich, Nick Meier, Bee Chim, Luke Boyd, Bishal Tamang, Jasper Alpuerto, Suman
Lamichhane, and the many others that made Blacksburg an amazing place.
Finally, I would like to thank my graduate committee; Dr. Wade Thomason, Dr. Takeshi Fukao,
and Dr. Jason Holliday. Their contributions to my dissertation and experience at Virginia Tech
have helped me grow as a crop scientist and a plant breeder.

vi
ATTRIBUTIONS
The guidance and assistance of many colleagues and collaborators aided in the design of
experiments, data collection, analysis, and interpretation of findings included in this dissertation.
Their contributions are described by chapter.
Chapter I: Photoperiod Response Gene Ppd-D1 Affects Nitrogen Use Efficiency in Soft Red
Winter Wheat
Bishal Tamang, PhD is a postdoctoral research scholar at the University of Minnesota in
Minneapolis, MN. Dr. Tamang measured chlorophyll content and gas exchange on a subset of
the plots in the Warsaw, VA environments.
Neal Carpenter, PhD is a postdoctoral research scholar at Purdue University in West Lafayette,
IN. Dr. Carpenter assisted in plant biomass sampling in many of the testing environments in the
USDA-NIFA Triticeae Coordinated Agricultural Project (TCAP) Nitrogen Use Efficiency
Validation study.
Takeshi Fukao, PhD is an assistant professor at Virginia Tech. Dr. Fukao measured chlorophyll
content and gas exchange on a subset of the plots in the Warsaw, VA, provided guidance on data
analysis, and offered editorial comments.
Mark Reiter, PhD is an associate professor at Virginia Tech and is stationed at the Eastern Shore
Agricultural Research and Extension Center (AREC) in Painter, VA. Dr. Reiter managed all
trials conducted in the Painter testing environments and provided technical assistance.
Robert Pitman, MS is a retired superintendent of the Eastern Virginia AREC in Warsaw, VA.
Mr. Pitman was an excellent source of agricultural management knowledge and provided
amazing management of all trials conducted in the Warsaw testing environment.
Clay Sneller, PhD is a professor at the Ohio State University in Wooster, OH. Dr. Sneller was a
co-PI on the TCAP studies and assisted in the development of the experimental design for the
TCAP Nitrogen Use Efficiency Validation study and managed the trials conducted in Ohio.
Wade Thomason, PhD is a professor at Virginia Tech. Dr. Thomason was a co-PI on the TCAP
studies, assisted in the development of the experimental design for the TCAP Nitrogen Use
Efficiency Validation study, provided invaluable assistance on the data analysis in this study, and
offered editorial comments.
Carl Griffey, PhD is the W.G. Wysor professor of crop breeding and genetics at Virginia Tech.
Dr. Griffey was a co-PI on the TCAP studies and a PI on the checkoff board grants that
supported this project. He provided assistance on the execution, analysis, and interpretation of
findings for the TCAP Nitrogen Use Efficiency Validation study in addition to providing
editorial comments on the manuscript.

vii
Chapter II: Multi-Environment Assessment of Genotypic Variation and Stability for Nitrogen
Use Efficiency in Winter Wheat
Joseph Oakes, PhD is the superintendent of the Eastern Virginia AREC in Warsaw, VA. Dr.
Oakes managed trials conducted in Suffolk, VA, assisted with data collection in Warsaw and
Suffolk, and offered editorial comments.
Maria Balota, PhD is an associate professor at Virginia Tech and is stationed at the Tidewater
AREC in Suffolk, VA. Dr. Balota assisted with the management of the trials in Suffolk and the
experimental design of the study.
Mark Reiter, PhD is an associate professor at Virginia Tech and is stationed at the Eastern Shore
AREC in Painter, VA. Dr. Reiter managed all trials conducted in the Painter testing
environments and provided technical assistance.
Ned Jones is the farm manager at the Southern Piedmont AREC in Blackstone, VA. Mr. Jones
managed the trials conducted in Blackstone.
Robert Pitman, MS is a retired superintendent of the Eastern Virginia AREC in Warsaw, VA.
Mr. Pitman was an excellent source of agricultural management knowledge and provided
amazing management of all trials conducted in the Warsaw testing environment.
Clay Sneller, PhD is a professor at the Ohio State University in Wooster, OH. Dr. Sneller was a
co-PI on the TCAP studies and assisted in the development of the experimental design for the
nitrogen use efficiency studies and managed the trials conducted in Ohio.
Wade Thomason, PhD is a professor at Virginia Tech. Dr. Thomason was a co-PI on the TCAP
studies, assisted in the development of the experimental design for the nitrogen use efficiency
studies, provided invaluable assistance on the data analysis in this study, and offered editorial
comments.
Carl Griffey, PhD is the W.G. Wysor professor of crop breeding and genetics at Virginia Tech.
Dr. Griffey was a co-PI on the TCAP studies and a PI on the checkoff board grants that
supported this project. He provided assistance on the design, execution, analysis, and
interpretation of findings for the nitrogen use efficiency studies in addition to providing editorial
comments on the manuscript.
Chapter III: Identification of Quantitative Trait Loci for Nitrogen Use Efficiency in Soft Red
Winter Wheat
Brian Ward, PhD is a postdoctoral research scholar at North Carolina State University in
Raleigh, NC. Dr. Ward provided technical expertise on genomic data generated via genotyping-
by-sequencing in addition to providing editorial comments on the study.

viii
Joseph Oakes, PhD is the superintendent of the Eastern Virginia AREC in Warsaw, VA. Dr.
Oakes managed trials conducted in Warsaw and Suffolk, VA, assisted with data collection in
both locations, and offered editorial comments.
Maria Balota, PhD is an associate professor at Virginia Tech and is stationed at the Tidewater
AREC in Suffolk, VA. Dr. Balota assisted with the management of the trial in Suffolk.
Paul Davis, MS is an incredible grower of agronomic agricultural and horticultural crops in New
Kent, VA. Mr. Davis managed the trial in New Kent and provided valuable insights into
practical research applications.
Myron Fountain, PhD is a breeder and geneticist at the United States Department of Agriculture
(USDA) Agricultural Research Service in Raleigh, NC. Dr. Fountain managed the trial
conducted in Kinston, NC.
Gina Brown-Guedira, PhD is a professor at North Carolina State University in Raleigh, NC,
director of the USDA Eastern Regional Small Grains Genotyping Lab. Dr. Brown-Guedira’s lab
generated the genotyping-by-sequencing data used in this study.
Clay Sneller, PhD is a professor at the Ohio State University in Wooster, OH. Dr. Sneller
managed the trials conducted in Ohio and assisted with data collection.
Wade Thomason, PhD is a professor at Virginia Tech. Dr. Thomason assisted in the
development of the experimental design for the genetic mapping study, provided invaluable
assistance on the data analysis in this study, and offered editorial comments.
Carl Griffey, PhD is the W.G. Wysor professor of crop breeding and genetics at Virginia Tech.
Dr. Griffey was a PI on the checkoff board grants that supported this project. He provided
assistance on the design, execution, analysis, and interpretation of findings for the mapping study
in addition to providing editorial comments on the manuscript.

ix
TABLE OF CONTENTS
ACADEMIC ABSTRACT ............................................................................................................. ii
GENERAL AUDIENCE ABSTRACT .......................................................................................... iii
DEDICATION ............................................................................................................................... iv
ACKNOWLEDGEMENTS ............................................................................................................ v
ATTRIBUTIONS .......................................................................................................................... vi
CHAPTER I: Genotypic Variation and Stability for Nitrogen Use Efficiency in Winter Wheat . 1
Abstract ....................................................................................................................................... 2
Introduction ................................................................................................................................. 3
Materials and Methods ................................................................................................................ 6
Results ....................................................................................................................................... 11
Discussion ................................................................................................................................. 16
References ................................................................................................................................. 20
CHAPTER II: Identification of Quantitative Trait Loci for Nitrogen Use Efficiency in Soft Red
Winter Wheat ................................................................................................................................ 62
Abstract ..................................................................................................................................... 63
Introduction ............................................................................................................................... 64
Materials and Methods .............................................................................................................. 67
Results ....................................................................................................................................... 71
Discussion ................................................................................................................................. 76
References ................................................................................................................................. 81
CHAPTER III: Photoperiod Response Gene Ppd-D1 Affects Nitrogen Use Efficiency in Soft
Red Winter Wheat ....................................................................................................................... 115
Abstract ................................................................................................................................... 116
Introduction ............................................................................................................................. 117
Materials and Methods ............................................................................................................ 120
Results ..................................................................................................................................... 124
Discussion ............................................................................................................................... 128
References ............................................................................................................................... 134
CHAPTER IV: Conclusions and Future Directions ................................................................... 161
Conclusions ............................................................................................................................. 161

x
Future Directions ..................................................................................................................... 163
APPENDIX A: GGE biplot for Study II NUpE in Chapter I ..................................................... 168
APPENDIX B: GGE biplot for Study II NUtE in Chapter I ...................................................... 169
APPENDIX C: GGE biplot for Study III NUpE in Chapter I .................................................... 170
APPENDIX D: GGE biplot for Study III NUtE in Chapter I ..................................................... 171
APPENDIX E: Study I grain yields in Chapter I ........................................................................ 172
APPENDIX F: Study II grain yields in Chapter I....................................................................... 173
APPENDIX G: Study III grain yields in Chapter I..................................................................... 174
APPENDIX H: Environment codes for GGE biplots in Chapter I ............................................. 175
APPENDIX I: Study II stability parameters in Chapter I ........................................................... 177
APPENDIX J: Study III stability parameters in Chapter I ......................................................... 178
APPENDIX K: ANOVA and F-values for heading date and plant height in Chapter III ......... 179
APPENDIX L: Heading date and plant height for Ppd-D1 alleles in Chapter III ...................... 180
APPENDIX M: Plant height by treatment in Chapter III ........................................................... 181

1
CHAPTER I:
GENOTYPIC VARIATION AND STABILITY
FOR NITROGEN USE EFFICIENCY IN WINTER WHEAT
Kyle Brasier, Joseph Oakes, Maria Balota, Mark Reiter, Ned Jones, Robert Pitman, Clay Sneller,
Wade Thomason, and Carl Griffey
K.G. Brasier, M. Balota, M.S. Reiter, R.M. Pitman, W.E. Thomason, and C.A. Griffey, School
of Plant and Environmental Sciences, Virginia Tech, Blacksburg, VA 24061; J.C. Oakes, Eastern
Virginia Agricultural Research and Extension Center, Virginia Tech, Warsaw, VA 22572; N.
Jones, Southern Piedmont Agricultural Research and Extension Center, Virginia Tech,
Blackstone, VA 23824; C.H. Sneller, Dep. of Horticulture and Crop Science, The Ohio State
Univ., Wooster, OH 44691. Received 24 Mar. 2018. Accepted 1 Aug. 2018.
Abbreviation: BB, Blacksburg, VA, location; BS, Blackstone, VA, location; CS, Custar, OH,
location; FR, Fremont, OH, location; G, genotype; GDD, growing degree days; GS92,
physiological maturity; N, nitrogen; NUE, nitrogen use efficiency; NUpE, nitrogen uptake
efficiency; NUtE, nitrogen utilization efficiency; PT, Painter, VA, location; WR, Warsaw, VA,
location; WS, Wooster, OH, location.
2
Abstract
Wheat (Triticum aestivum L.) products account for roughly 20 % of the total dietary
calories and protein consumed globally, thus requiring efficient nitrogen (N) management
systems for optimal grower profitability and to reduce negative environmental impacts of non-
target fertilization. This investigation sought to evaluate genotypic variation for N use efficiency
(NUE), assess yield stability, and validate proxy traits for indirect improvement of crop
performance over N rates using three separate studies that varied in the number of N rates a
nd testing environments. Studies I, II, and III were conducted using small panels of winter wheat
lines grown under five N rates over three site-seasons, three N rates over six site-seasons, and
two N rates over nine site-seasons, respectively. Grain yield was assessed in all studies while
above-ground biomass, harvest index, grain N content, NUE, N uptake efficiency, and N
utilization efficiency were evaluated in studies II and III. Genotype by N rate interactions were
more frequently identified for grain yield when three or more N rates were used in the
experimental design. The three studies identified significant genotypic variation for NUE and
identified wheat lines that consistently expressed high grain yields over N-environments.
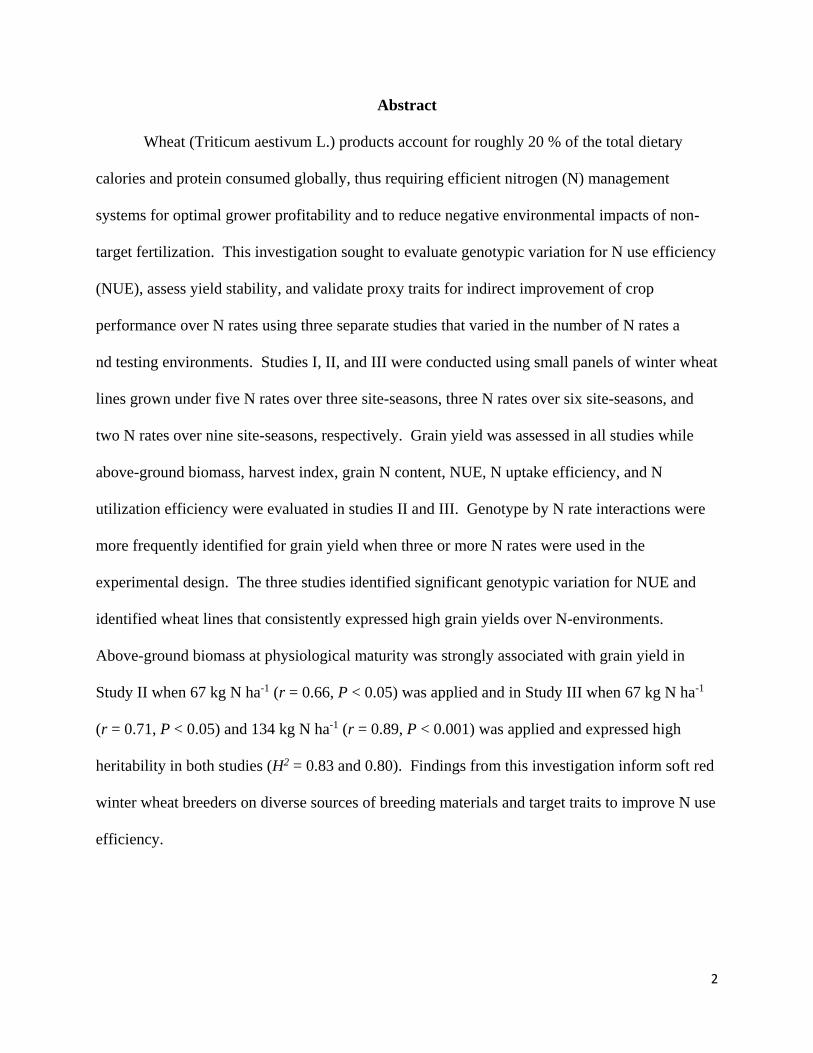
Above-ground biomass at physiological maturity was strongly associated with grain yield in
Study II when 67 kg N ha-1 (r = 0.66, P < 0.05) was applied and in Study III when 67 kg N ha-1
(r = 0.71, P < 0.05) and 134 kg N ha-1 (r = 0.89, P < 0.001) was applied and expressed high
heritability in both studies (H2 = 0.83 and 0.80). Findings from this investigation inform soft red
winter wheat breeders on diverse sources of breeding materials and target traits to improve N use
efficiency.

3
Introduction
Wheat (Triticum aestivum L.) is among the most important food crops with production
exceeding 700 million t yr-1, accounting for roughly 20 % of the total dietary calories and protein
consumed globally (Shiferaw et al., 2013). Demand for wheat products is expected to increase
collinearly with world population, requiring a combination of increased genetic gains, land
availability, and agricultural efficiency to sustainably meet production needs. Global cereal
yields have increased by 230 % since the 2nd half of the 20th century, while nitrogen (N) use
efficiency (NUE), defined as the ratio of grain produced per unit N applied (Moll et al., 1982),
has consequently decreased by a similar percentage during the same period of time (Tilman et
al., 2002). The reduction in NUE has resulted in greater total N losses from the plant-soil
system, which may reduce grower profit potential and have negative environmental
consequences. This unutilized N can return to the atmosphere as unreactive N or nitrous oxides
through denitrification (Galloway et al., 2004) or become subject to runoff and leaching,
contributing to the degradation of aquatic and terrestrial ecosystems (Hamilton et al., 2016;
Sinha et al., 2017). Thus, the efficient use of N is critical to promote grower profitability and
ensure environmentally sustainable increases in grain production.
The effects of locations, growing seasons, and agronomic management practices are
frequently reported to have greater effects on quantitative traits such as N use efficiency than the
cultivar being grown (Bhatta et al., 2017; Krupnik et al., 2015; Rozbicki et al., 2015). These
results imply that grower level improvements in NUE are most readily achieved through the
adoption of more efficient nutrient management practices (Zhang et al., 2015), management of
abiotic and biotic stresses (Carretero et al., 2011; Zhou et al., 2011), and improvements in soil
health (Brennan et al., 2014; Tilak et al., 2005). However, significant genotypic effects on yield

4
and N-traits were also reported in the aforementioned studies, indicating the potential to select
cultivars with improved N use efficiency under a range of N conditions.
Breeding progress for grain yield in wheat between the onset of the Green Revolution
(1950) and 1985 was estimated at 1.1 % yr-1 under low and standard N conditions and 1.9 % yr-1
under high N rates (Ortiz-Monasterio R. et al., 1997). The authors attributed the higher rates of
yield gains under high N supplies to improved lodging resistance conferred through the
introduction of alleles conferring reduced plant height into modern germplasm. However, these
gains have since slowed to approximately 0.37 % yr-1 and 0.30 % yr-1 under low and standard N
rates, respectively (Cormier et al., 2013). In an effort to further increase rates of genetic gains,
Cormier et al. (2016) hypothesized that selecting wheat lines under multiple N rates may
increase yearly improvements, particularly in trials conducted under conditions of moderate N
stress. However, recent investigations of N response in wheat have not led to a consensus
regarding the occurrence of significant genotype by N rate interactions for NUE and N-traits in
elite wheat germplasm (Bhatta et al., 2017; Büchi et al., 2016; Kubota et al., 2018; Russell et al.,
2017). The contrasting results have prompted some researchers to explore exotic germplasm for
sources of genetic variation and led others to doubt the merits of conducting trials under multiple
N rates all together (Hawkesford, 2017; Van Deynze et al., 2018). It is therefore crucial to
establish optimized testing conditions to identify consistent variation in yield response under
multiple N supplies.
To better understand variation underlying NUE, Moll et al. (1982) decomposed the trait
into two components: N-uptake efficiency (the ratio of aboveground N at harvest per unit of N
applied, NUpE) and N-utilization efficiency (the amount of grain produced per total
aboveground N in the plant at harvest, NUtE). Previous investigations of winter wheat generally

5
attribute a greater proportion of the variation in NUE to greater NUpE under low N supplies and
NUtE under high N rates (Latshaw et al., 2016; Le Gouis et al., 2000). In contrast, other studies
have attributed gains in NUE to the maintenance of high NUpE (Dhugga and Waines, 1989; Hitz
et al., 2017) or high NUtE (Barraclough et al., 2010; Brasier et al., 2018; Cormier et al., 2013)
across N rates. The conflicting findings reported in these studies are likely attributable to
differences in testing environments, genetic material, wheat class, and management practices
beyond that of total N applied.
Continuing the theme of trait dissection, breeders can also apply elements of physiology
theory to increase genetic gains by selecting on physiological traits associated with NUE under
multiple N rates as opposed to exclusively selecting on yield per se (Brancourt-Hulmel et al.,
2005; Donald, 1968). For instance, traits such as increased biomass production and N
accumulation tend to be frequently discussed as targets for NUE improvements under multiple N
conditions (Gaju et al., 2014; Hitz et al., 2017; Tamang et al., 2017), while other traits including
senescence dynamics often vary geographically (Alhabbar et al., 2018; Gaju et al., 2011; Górny
et al., 2006). Differing wheat classes, end uses, and growing regions targeted by each breeding
program will likely require independent validation of target traits to be used for indirect
improvements of N use efficiency.
Despite the many previous investigations of NUE in winter wheat, availability of
genotypic variation and breeding schemes required for selection of NUE are relatively
unestablished in the Eastern United States. Therefore, the objectives of the present study are to:
(i) explore genotypic variation for NUE and N-related traits under three selection schemes, (ii)
assess yield stability over multiple N-environments, and (iii) to validate target traits for indirect
improvements of NUE under varying N conditions.

6
Materials and Methods
Three similar studies (I, II, and III) were conducted under rainfed conditions in the Eastern
United States (Figure 1.1) to address the stated objectives. Each study differed in the number of
testing environments (defined as a site-season) and N rates but maintained a similar number of
winter wheat lines, N-environments, and experimental plots (Table 1.1). Seeds were treated with
Raxil MD (triazole, Bayer Crop Science) and Gaucho XT (imidacloprid, Bayer Crop Science) in
all studies to control diseases and insects, respectively. Foliar pesticides and herbicides were
applied as necessary throughout the growing seasons in all environments to further mitigate plant
pests and diseases (Supplemental Table 1.1). All studies utilized a randomized complete block
design with sowing dates occurring under optimal environmental conditions at a seeding density
of 520 seeds m-2 (Alley et al., 1996). Specific experimental methods for studies I, II, and III are
detailed in sections 2.1. and 2.2. below.
Total precipitation and cumulative growing degree days (GDD) were determined for each
testing environment from planting to harvest. Growing degree days were calculated as:
𝐺𝐷𝐷 = (𝑇𝑚𝑎𝑥 + 𝑇𝑚𝑖𝑛
2) − 𝑇𝑚𝑖𝑛
Where 𝑇𝑚𝑎𝑥 and 𝑇𝑚𝑖𝑛 are the daily maximum and minimum temperatures, respectively. A
floor of 0 °C for 𝑇𝑚𝑖𝑛 and a ceiling of 25 °C for 𝑇𝑚𝑎𝑥 was used in each environment (McMaster
and Wilhelm, 1997).
Testing Environments and Experimental Design
Study I was conducted at the Northwest Agricultural Research Center near Custar, OH in
2013-2014 and 2014-2015 (CS; 41°21' N, 83°76' W) and the Ohio Agriculture Research and

7
Development Center near Wooster, OH in 2014-2015 (WS; 40°77' N, 81°90' W). Experimental
units, seven-row yield plots that measured 2.74 × 1.78 m, were replicated four times in each
environment. Five spring N rates, ranging from 45 to 134 kg N ha-1, were applied to 12 winter
wheat lines resulting in 60 plots per replication (Table 1.1). Total precipitation ranged from 655
to 1,757 mm in 15CS (where “15” refers to the season 2015-2016) and 15WS, respectively,
while cumulative GDD was similar in all three environments (Figure 1.1).
Study II was conducted at the Eastern Shore Agricultural Research and Extension Center
(AREC) near Painter, VA in 2013-2014 and 2014-2015 (PT; 37°58' N, 75°82' W), the Eastern
Virginia AREC near Warsaw, VA in 2013-2014, 2014-2015, and 2015-2016 (WR; 37°99' N,
76°78' W), and Kentland Farm near Blacksburg, VA in 2015-2016 (BB; 37°11' N, 80°34' W).
Experimental units consisted of seven-row yield plots that measured 2.74 × 1.78 m in PT and
2.74 × 1.52 m in BB and WR. Each experimental unit was replicated three times in all
environments except 16WR, which consisted of two replicates. Three spring N rates, ranging
from 67 to 134 kg N ha-1, were applied to 12 wheat lines resulting in 36 plots per replication
(Table 1.1). Total precipitation and GDDs were similar over growing seasons at each site
(Figure 1.1).
Study III was conducted at the Eastern Virginia AREC near WR in 2015-2016 and 2016-
17, Kentland Farm near BB in 2015-2016 and 2016-2017, the North Central Agricultural
Research Center near Fremont, OH in 2015-2016 (FR; 41°31' N, 83°17' W), the Northwest
Agricultural Research Center near CS in 2015-2016, the Ohio Agriculture Research and
Development Center near WS in 2015-2016, and the Southern Piedmont AREC near Blackstone,
VA in 2015-2016 and 2016-2017 (BS; 37°09' N, 77°97' W). Experimental units were seven-row
yield plots that measured 2.74 × 1.78 m in the CS, FR, PT, and WS locations and 2.74 × 1.52 m

8
in the BB and WR locations. Four replications were used in 16CS, 16FR, and 16WS, while three
replications were used in all remaining environments except for 16WR, which consisted of two
replicates. Two spring N rates, 67 and 134 kg N ha-1, were applied to 11 wheat lines in Study III,
resulting in 22 plots per replication (Table 1.1). Total precipitation ranged from 665 to 1,284
mm in 16WR and 16BS, respectively (Figure 1.1). Cumulative GDD was highest at 17BS
(3,301 °C) while GDD in the remaining environments ranged from 2,439 to 2,905 °C in 17BB
and 16WR, respectively.
Plant Materials
Plant materials used in Study I and II (Table 1.2) consisted of 12 regionally diverse soft
red winter wheat lines derived from the Triticeae Coordinated Agricultural Project’s
(http://www.triticeaecap.org/) Eastern Elite Mapping Panel of 280 genotypes from six public
breeding programs (The Ohio State University, University of Illinois, University of Kentucky,
University of Maryland, University of Missouri, and Virginia Tech). Study III shares six
common wheat lines with Study I and II, while line numbers 1-6 were replaced with five
Virginia adapted cultivars (lines 13-17).
Physiological and N Traits
In Study II and III, a 1.0 m above-ground biomass sample was cut from the center row of
each plot at physiological maturity (GS92) in all Virginia testing environments (Supplemental
Table 1.2). Biomass samples were oven dried at 60 C for 72 hours, and weighed to determine
above-ground biomass yield for each experimental unit. Samples were then threshed to separate
grain from straw tissue, and their respective weights were recorded to estimate harvest index.

9
Grain and straw tissues were then ground and homogenized to estimate tissue-specific N
contents via combustion analysis using a Vario Max CNS macro elemental analyzer (Elementar
Analysensysteme). Results of the combustion analysis were used to estimate NUE, NUpE, and
NUtE, and grain N content. Plots were combine harvested in all studies at harvest maturity
(grain moisture content ≤ 160 g kg-1) and adjusted to 0 g moisture kg-1 to determine grain yield.
Statistical Analysis
Analysis of variance (ANOVA) was first performed over environments using the lme4
package (Bates et al., 2015) in the R statistical computing environment (Team, 2015):
𝑌𝑖𝑗𝑘𝑙 = 𝜇 + 𝐺𝑖 + 𝑁𝑗 + 𝐸𝑘 + 𝑅𝑙(𝐸𝑘) + 𝐺𝑁𝑖𝑗 + 𝐺𝐸𝑖𝑘 + 𝑁𝐸𝑗𝑘 + 𝐺𝑁𝐸𝑖𝑗𝑘 + 휀𝑖𝑗𝑘𝑙
Where the trait response (Yijkl) is a function of the overall mean (µ), the fixed effect of the ith
wheat line (Gi), the fixed effect of the jth N rate (Nj), the random effect of the lth replication (Rl)
nested within the kth environment (Ek), the interactions of the ith wheat line with the jth N rate
and the kth environment (GNij and GEik), the interaction of the jth N rate and the kth environment
NEjk), their 3-way interaction (GNEijk), and the residual error (εijkl). As interactions with 𝐸𝑘 were
significant for most traits, a second ANOVA model was then used within testing environments to
determine significant effects (P < 0.05) of wheat lines (G), N rates (N), and G × N interactions
within each environment. Means comparisons were conducted using least significant differences
for wheat lines, N rates, and their interactions.
Yield stability was assessed in each study using a principal component analysis method
(Laffont et al., 2013) and the regression method described by Eberhart and Russell (1966) to
estimate two stability parameters: the regression slope (𝛽𝑖) which measures the response of the
ith line to varying growing conditions and the sum of absolute deviations regression (𝛿𝑑2) for the

10
dth wheat line in each N-environments. Wheat lines with wide adaptability have a 𝛽𝑖 = 1.0 while
those above and below this threshold express specific adaptability to favorable and unfavorable
environments, respectively. A stable wheat line is defined as having a near zero 𝛿𝑑2 value. A
bivariate correlation analysis was conducted using wheat line means under each N rate in Study
II and III to calculate Pearson’s Correlations using the cor function in the R statistical computing
environment (Team, 2015). Broad-sense heritability (H2) was calculated with two approaches
using the variance component method where all components were treated as random effects
(Falconer, 1960):
𝐻2 =𝜎𝐺2
[𝜎𝐺2 + (
𝜎𝐺×𝐸2
𝑛 ) + (𝜎𝐺×𝑁2
𝑒 ) + (𝜎𝜀2
𝑛𝑒𝑟)]
and
𝐻2 =𝜎𝐺2
[𝜎𝐺2 + (
𝜎𝐺×𝑁𝐸2
𝑠 ) + (𝜎𝜀2
𝑠𝑟)]
Where 𝜎𝐺2 is the genotypic variance, 𝜎𝐺×𝐸
2 is the genotype by environment variance, 𝜎𝐺×𝑁2 is the
genotype by N rate variance, 𝜎𝐺×𝑁𝐸2 is the genotype by N-environment (environments and N
rates) variance, 𝜎𝜀2 is the error variance, n is the number of N rates, e is the number of
environments, s is the number of N-environments, and r is the number of replications.
Contributions of variation in NUE component traits NUpE and NUtE to variation in
product trait NUE were calculated according to the method described by Moll et al. (1982),
where the component and product traits are log transformed and the fraction of the hybrid sum of
squared is calculated for each component trait:
1.0 = (∑ 𝑦𝑘𝑥𝑘𝑘
∑ 𝑦𝑘2
𝑘
) + (∑ 𝑦𝑘𝑥′𝑘𝑘
∑ 𝑦𝑘2
𝑘
)

11
Where the relative contribution of each component trait (𝑥𝑘) is calculated by dividing the sums
of the cross products of each term by the sum of squares for the product trait (𝑦𝑘) for kth
experimental unit.
Results
The combined ANOVA identified significant interactions between genotype and N rate
in Study I and significant environmental interactions for grain yield in all studies except the
three-way interaction in Study III (Table 1.3). Thus, the ANOVA for grain yield was broken
down by testing environment within each study to assess the effects of genotype, N rate, and
their interactions.
Genotypic Variation and Stability for Grain Yield
Mean grain yield, range, and standard deviation was calculated for wheat lines
under each of the five N rates for each Study I environment in Table 1.4. Significant G × N rate
interactions (P < 0.05) were observed in 14CS and 15CS. In the 14CS environment,
MD03W485-10-10 yielded roughly 5,000 g ha-1 across N rates, while MO080864 had
significantly lower yields than MD03W485-10-10 at lower N rates but similar yields at the two
highest N rates (Supplemental Table 1.3). OH08-161-78 and KY06C-1003-139-8-3 were among
the highest yielding lines in the 15CS environment under 45 kg N ha-1, producing 3,983 and
4,097 kg ha-1, respectively. However, KY06C-1003-139-8-3 was able to maintain similarly high
yields (roughly 4,000 kg ha-1) with incremental additions of N applications, while OH08-161-78
yielded roughly 3,550 kg ha-1 at N rates greater than 45 kg N ha-1. Significant N rate effects

12
(P < 0.05) occurred in 14CS and 15WS where high N rates increased and decreased grain yields,
respectively. The grain yield decrease in 15WS is attributable to lodging (data not shown), and
the mean grain yield reduction between the standard (134 kg N ha-1) and half (67 kg N ha-1) N
rates were 0.1 % in Study I. Significant effects of genotype (P < 0.05) on grain yield were
observed in all three testing environments.
In Study II, mean grain yields for each N rate are presented with range and standard
deviation for wheat lines within N rate in Table 1.5. Significant G × N rate interactions
(P < 0.05) were observed in two of the six testing environments (14PT and 14WR), while two
additional environments (15PT and 16BB) were significant at P ≤ 0.1 level. In the two testing
environments exhibiting significant G × N interactions (P < 0.05), VA08MAS-369 had the
highest grain yield under 134 kg N ha-1 and among the lowest when 67 kg N ha-1 was applied
(Supplemental Table 1.4). Within the 14PT and 14WR environments, OH08-172-42 was among
the highest yielding lines under the lowest N rate (67 kg N ha-1) and had yields similar to
VA08MAS-369 under the highest N rate (134 kg N ha-1). Grain yields were directly related to N
rate in all six testing environments, while N application rates of 101 and 134 kg N ha-1 were not
significantly different (P < 0.05) in the 15PT and 16BB environments. Over the six Study II
testing environments, grain yield reductions averaged 17.4 % between the standard and 50 % N
rates. Similar to the findings of Study I, genotypic variation for grain yield was observed in all
Study II testing environments.
Mean, range, and standard deviation for grain yields are presented for wheat lines within
each N rate at each Study III environment in Table 1.6. Unlike the results of Study I and II, no
significant G × N rate interactions (P < 0.05) were observed in Study III. However, G × N
interactions were significant in 16FR and 17WR at the P ≤ 0.1 level. The limited number of

13
significant interactions may be due to fewer N rates tested or the differing panels of wheat lines
tested. Significant effects due to N rate (P < 0.05) were observed in seven of the nine
environments where 134 kg N ha-1 produced higher grain yields than the half N rate (67 kg N ha-
1), while mean yield reduction between the standard and half N rates was 10.0 % in Study
III. Consistent with Study I and II, significant genotypic variation for grain yield (P < 0.05) was
observed in every testing environment.
Despite the availability of genotypic variation for grain yield, and thus NUE, it is crucial
for breeders to identify lines with consistently high yields across N conditions and environments
to produce improvements at the grower level. Yield stability was assessed using two stability
indices (𝛽𝑖 and 𝛿𝑑2) over 15 (Study I) or 18 (Study II and III) N-environments (Figure
1.2). Study I and II had the highest and lowest mean 𝛿𝑑2, respectively. OH08-172-42 (line 10),
MD03W485-10-10 (line 8), and KY06C-1003-139-8-3 (line 3) were among the highest yielding
and most stable lines over N-environments in Study I. However, line performance and stability
changed for two of the top three wheat lines between Study I and II where OH08-172-42 (line
10), VA08MAS-369 (line 12), and OH08-161-78 (line 9) maintained the highest yields and
stability across N-environments. Genotypic variation for stability parameter 𝛿𝑑2 in Study III was
similar to that of Study I. The stability analysis identified two wheat lines: VA08MAS-369 (line
12) and VA09W-73 (line 16) in Study III as consistently maintaining high grain yields.
Variation in N Traits and Identification of Proxy Traits for Indirect Selection
Significant G × N × E effects (P < 0.05) were observed in Study II for harvest index and
NUtE, and in Study III for NUE in the over-environment ANOVA for physiological and N traits
(Table 1.7). Genotype and N rate interactions with environment were significant for several of
14
the traits in Study II and III, while G × N interactions were not significant for any trait in the
combined analysis. However, significant G × N interactions (P < 0.05) were identified when the
ANOVA was conducted with each environment (Supplemental Tables 1.7 – 1.21) in Study II
(harvest index in 15PT, NUtE in 15PT, above-ground biomass in 16BB, harvest index in 16BB,
NUE in 16BB, and NUtE in 16BB) and in Study III (grain N content in 16BB, NUpE in 16BB,
NUtE in 16BB, harvest index in 17WR, and NUE in 17WR). Significant single effects
(genotype, N rate, and environment) were observed in the combined analysis for all traits except
genotype effects on NUpE in both studies.
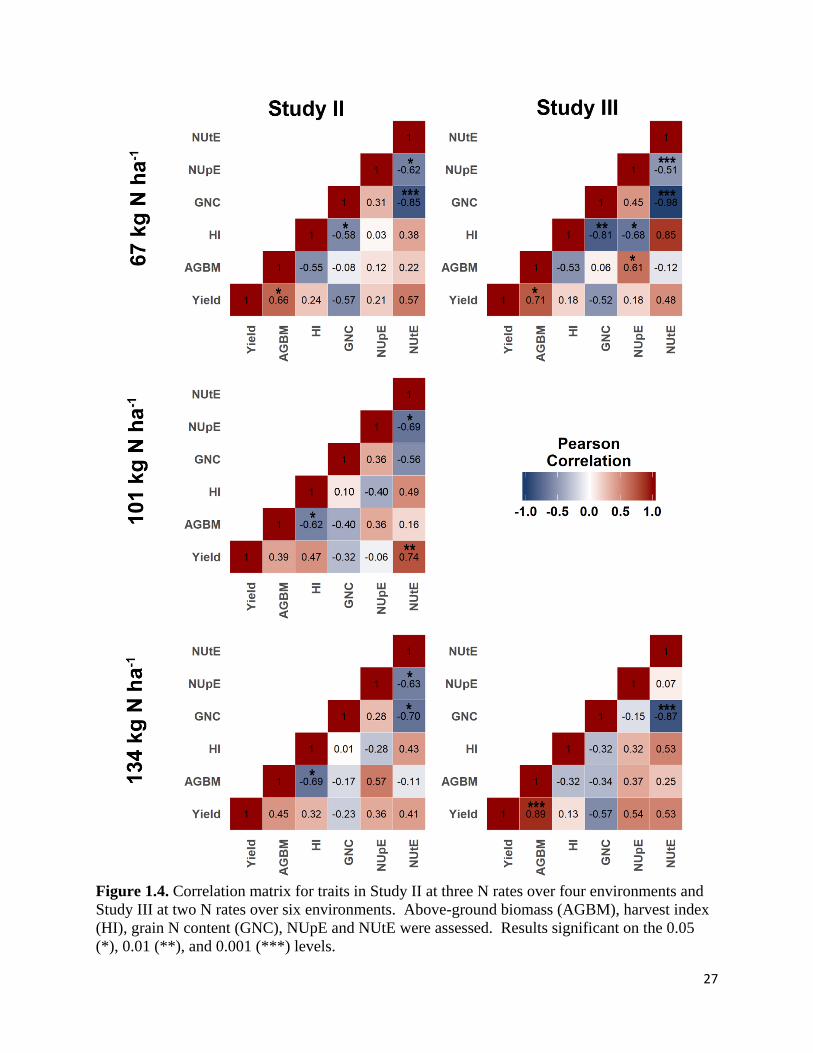
A correlation analysis was conducted over environments for each N rate in Study II and
III (Figure 1.3). Significant positive associations between above-ground biomass and grain yield
were observed under 67 kg N ha-1 in Study II (r = 0.66, P < 0.05) and under both 67 kg N ha-1
(r = 0.71, P < 0.05) and 134 kg N ha-1 (r = 0.89, P < 0.001) in Study III. Harvest index was
significantly and negatively associated with grain N content when 67 kg N ha-1 was applied in
Study II (r = -0.58, P < 0.05) and Study III (r = -0.81, P < 0.05). Similarly, significant negative
correlations (r = -0.70 to -0.98) were observed between NUtE and grain N content under all N
rates except 101 kg N ha-1 in Study II. Significant negative correlations (r = -0.51 to -0.69) were
also observed between NUpE and NUtE in both studies at all N rates except for 134 kg N ha-1 in
Study III.
Trait Heritability and Variance Components
Genotype was a major contributor to variability in all traits evaluated in the three studies
except for grain yield in Study I and NUpE in Study II (Table 1.8). Genotype by N rate effects
were observed in Study II for harvest index, NUpE, and NUtE in addition to grain yield in both

15
studies. The percent contribution of genotype by environment interaction ranged from 9 to 61 %
over all traits in studies II and III with the exception of NUpE (0%) in both studies and GNC in
Study II (0 %). The lowest broad sense heritability was observed for NUpE in Study II (0.00)
and III (0.05), while grain N content was the most heritable trait in Study II (0.90) and III (0.86).
However, single effects of N rate, environment, and error variances were generally greater than
that of the wheat lines themselves (Supplemental Table 1.5).
Upon analysis by N-environment, genotypic variance was observed for all traits in
Studies I, II, and III (Supplemental Table 1.6). Variance due to G × N-environment was
observed for all traits except grain N content in both studies and NUtE in Study III. Similar to
the results in Table 1.8, heritability was lowest for NUpE in Study II (0.28) and III (0.22) and
highest for grain N content (0.91 in both studies) when analyzed for variance due to N-
environments.
Contributions of NUpE and NUtE to Variation in NUE
The component trait analysis described by Moll et al. (1982) revealed genotypic variation
in the contribution of NUpE and NUtE to NUE in Study II and III (Figure 1.4). Across N rates,
VA08MAS-369 (line 12) and Bess (line 8) were consistently among the highest and lowest NUE
lines, respectively. There were no clear trends emphasizing a greater importance of NUpE or
NUtE to the variation in NUE among the highest and lowest performing lines. However, the
mean contribution of NUpE to NUE was higher under 67 kg N ha-1 (66.4 and 83.8 % in studies II
and III, respectively) than 134 kg N ha-1 (34.3 and 73.0 % in studies II and III, respectively).

16
Discussion
Results are based on performance data of winter wheat lines evaluated in a combined 51
N-environments over three studies for N use efficiency. Grain yield and NUE were then
decomposed into components traits to assess physiological contributors underlying the two traits.
The results therefore provide winter wheat breeders with information on genotypic variation in
elite germplasm, yield stability over N-environments, heritability of N traits, and target traits for
indirect selection of N use efficiency.
Breeding Schemes for NUE in Elite Germplasm
Plant breeders targeting improvements in NUE must first identify sources of genotypic
variation for N response in available germplasm through the detection of genotype by N rate
interactions. In the present studies, G × N rate interactions for grain yield were most commonly
observed when lines were tested under three or five N rates. While exceptions exist (Kubota et
al., 2018; Russell et al., 2017), recent investigations of NUE in wheat generally follow a similar
trend where significant interactions between wheat line and N rate for grain yield were more
frequently reported when more than two N rates were utilized (Barraclough et al., 2010; Büchi et
al., 2016; Gaju et al., 2011; Guttieri et al., 2017; Latshaw et al., 2016; Mahjourimajd et al., 2016;
Ul-Allah et al., 2018). The G × N interactions observed in these investigations may be
attributable to a combination of increased lodging resistance for some wheat lines under high N
supplies (Ortiz-Monasterio R. et al., 1997) and a moderate mean grain yield reduction (roughly
20 %) between N rates (Presterl et al., 2003). These findings have led many breeders to advocate
for direct selection of NUE under reduced N systems in locations that are exclusively subjected
to N stress each growing season (Brancourt-Hulmel et al., 2005; Cormier et al., 2013; Muellner

17
et al., 2014; Ranjitha et al., 2018). However, Büchi et al. (2016) and Hasegawa (2003) argued
that crop varieties selected under reduced N rates are not necessarily better adapted to low input
conditions and that breeders should instead devote a majority of their resources to multi-
environment testing. This observation may eventually prove that direct selection under low N
supplies is too hindered by the stability of crop performance. Overall, it is agreed that trials
conducted over multiple sites may incidentally incorporate multiple N stress conditions and thus
continue to result in genetic gains over diverse environments and sources of plant stress.
However, the identification of significant G × N interactions for grain yield in the present
investigation may still justify testing of advanced wheat lines under multiple N rates in locations
that are routinely limited by N availability.
Stability of N Response
A stability analysis was conducted over N-environments in the present investigation to
identify wheat lines that consistently produced high grain yields regardless of environment and N
availability. Interestingly, wheat lines that expressed the highest mean grain yields were also
among the most stable within each of the three studies. Similar findings were reported in a panel
of 25 spring barley (Hordeum vulgare L.) varieties by Anbessa et al. (2009) and eight wheat
lines by Mahjourimajd et al. (2016) who reported that the most stable lines generally experienced
lower grain yield reduction between high and low N conditions than did the least stable lines.
The present investigation also reported significant variation in the adaptability of wheat lines
over the tested N-environments, indicating the existence of genotypic variation in broad vs.
specific adaptability to favorable and unfavorable environments.

18
Previous assessments of NUE stability in spring barley (Anbessa et al., 2009), dry bean
(Phaseolus vulgaris L.)(Farid et al., 2016), and winter wheat (Büchi et al., 2016) advocated for a
greater emphasis on testing environments than N management schemes as the authors note that
yield gains across N rates occur regardless of testing conditions. This recommendation has some
merit following the biplot analysis for grain yield in the current investigation often placed greater
emphasis on testing environment than N rate (Supplemental Figures 2.1 – 2.3). However, the
biplots also illustrate variation in genotypic performance due to N rates within environments.
Stagnari et al. (2013) reported similar results in a study of durum (Triticum durum L.) cultivars
grown under two N rates where the variation in stability under each N rate and the detection of N
rate by environment interactions justified the establishment of breeding efforts in N-deficient
conditions. Building on these interactions, Elía et al. (2018) reported significant interactions
between temperature and N rate on grain yields in adapted wheat cultivars. The authors further
explained that grain yield penalties under warmer post-anthesis temperatures were increased
under higher N supplies, warranting the need to develop wheat varieties with reduced N
requirements as climates continue to become warmer or more variable.
Similar to the results of the present investigation, Hitz et al. (2017) identified the wheat
line KY06C-1003-139-8-3 as consistently expressing high grain yields across N rates and
locations in the Eastern United States. Another recent assessment of genotypic variation in soft
red winter wheat lines for NUE was conducted under greenhouse conditions in Virginia using
three equivalent N rates and four common genotypes (line numbers 2, 4, 6, and 11) included in
Study II of the current investigation (Tamang et al., 2017). The authors identified ‘Sisson’ (line
11) as expressing the highest grain yields and protein content under the three N rates in this panel
and consequently suggested its use as a parent in breeding for N use efficiency. However, Sisson

19
did not perform as well relative to the testing panels in the present studies. Within the Eastern
United States, two previously mentioned lines (KY06C-1003-139-8-3 and Sisson) in addition to
those identified in the present study (VA08MAS-369, VA09W-73, OH08-161-78, and OH08-
172-42) may serve as good parents or check varieties for NUE breeding efforts.
Traits Underlying Variation in NUE
Selection based on physiological traits associated with N response may increase genetic
gains through more targeted breeding (Gaju et al., 2011). Building on this application of
physiology theory, recent investigations of NUE in winter wheat have identified significant trait
associations with NUE across N rates including NUtE (Cormier et al., 2013) and total biomass at
physiological maturity (Hitz et al., 2017). Similar findings were observed in the present study
where above-ground biomass at maturity was significantly associated with grain yield when 67
kg N ha-1 was applied in Study II and both N rates in Study III. Unlike the findings in Hitz et al.
(2017), this trait appeared to be highly heritable in Study II (0.83) and Study III (0.80) indicating
that above-ground biomass with maintained harvest index may serve as a useful trait for indirect
selection of grain yield, and thus N use efficiency. Active selection on increased NUtE to realize
gains in NUE, as suggested by Cormier et al. (2013) and Gaju et al. (2011), will likely have
pleiotropic effects. For instance, higher NUtE came at the expense of reduced grain N content
under most N rates in the present investigation. Interestingly, many breeding programs have
reported yield gains at the cost of grain protein content (a trait that is strongly associated with
grain N content) over the past three decades (Laidig et al., 2017). The authors are also quick to
point out that despite these reductions in grain protein content, the baking quality was actually
improved over this period. Going forward, breeders and physiologists will need to identify

20
additional traits for continued NUE gains without sacrificing quality or drastically changing plant
morpho-physiology traits.
Acknowledgments
Funding for this project was provided by the USDA National Institute of Food and Agriculture
Triticeae Coordinated Agricultural Project no. 2011-68002-30029 and the Virginia Small Grains
Board. The authors would also like to thank Neal Carpenter, John Seago, Anthony Christopher,
Jon Light, Sam Lawton, Brian Ward, Michelle Lee, and William Myers for assistance collecting
field data and Steve Nagle for providing technical assistance in the analysis of tissue N content.
References
Alhabbar, Z., R. Yang, A. Juhasz, H. Xin, M. She, M. Anwar, et al. 2018. NAM gene allelic
composition and its relation to grain-filling duration and nitrogen utilisation efficiency of
Australian wheat. PLOS ONE 13: e0205448. doi:10.1371/journal.pone.0205448.
Alley, M.M., P. Scharf, D.E. Brann, W.E. Baethgen and J.L. Hammons. 1996. Nitrogen
management for winter wheat: Principles and recommendations. Publ. 424-206 Virginia
Coop. Ext., Virginia Polytechnic Inst. State Univ., Blacksburg.
Anbessa, Y., P. Juskiw, A. Good, J. Nyachiro and J. Helm. 2009. Genetic variability in nitrogen
use efficiency of spring barley. Crop Sci. 49: 1259-1269.
doi:10.2135/cropsci2008.09.0566.
Barraclough, P.B., J.R. Howarth, J. Jones, R. Lopez-Bellido, S. Parmar, C.E. Shepherd, et al.
2010. Nitrogen efficiency of wheat: Genotypic and environmental variation and prospects
for improvement. Eur. J. Agron. 33: 1-11. doi:https://doi.org/10.1016/j.eja.2010.01.005.
Bates, D., M. Mächler, B. Bolker and S. Walker. 2015. Fitting linear mixed-effects models using
lme4. J. Stat. Softw. doi:10.18637/jss.v067.i01
Bhatta, M., K.M. Eskridge, D.J. Rose, D.K. Santra, P.S. Baenziger and T. Regassa. 2017.
Seeding rate, genotype, and topdressed nitrogen effects on yield and agronomic
characteristics of winter wheat. Crop Sci. 57: 951-963. doi:10.2135/cropsci2016.02.0103.
Brancourt-Hulmel, M., E. Heumez, P. Pluchard, D. Beghin, C. Depatureaux, A. Giraud, et al.
2005. Indirect versus direct selection of winter wheat for low-input or high-input Llevels.
Crop Sci. 45: 1427-1431. doi:10.2135/cropsci2003.0343.

21
Brasier, K.G., B.G. Tamang, N.R. Carpenter, T. Fukao, M.S. Reiter, R.M. Pitman, et al. 2018.
Photoperiod response gene Ppd-D1 affects nitrogen use efficiency in soft red winter
wheat. Crop Sci. 58: 2593-2606. doi:10.2135/cropsci2018.03.0207.
Brennan, J., R. Hackett, T. McCabe, J. Grant, R.A. Fortune and P.D. Forristal. 2014. The effect
of tillage system and residue management on grain yield and nitrogen use efficiency in
winter wheat in a cool Atlantic climate. Eur. J. Agron. 54: 61-69.
doi:https://doi.org/10.1016/j.eja.2013.11.009.
Büchi, L., R. Charles, D. Schneider, S. Sinaj, A. Maltas, D. Fossati, et al. 2016. Performance of
eleven winter wheat varieties in a long term experiment on mineral nitrogen and organic
fertilisation. Field Crops Res. 191: 111-122.
doi:https://doi.org/10.1016/j.fcr.2016.02.022.
Carretero, R., M.O. Bancal and D.J. Miralles. 2011. Effect of leaf rust (Puccinia triticina) on
photosynthesis and related processes of leaves in wheat crops grown at two contrasting
sites and with different nitrogen levels. Eur. J. Agron. 35: 237-246.
doi:https://doi.org/10.1016/j.eja.2011.06.007.
Cormier, F., S. Faure, P. Dubreuil, E. Heumez, K. Beauchêne, S. Lafarge, et al. 2013. A multi-
environmental study of recent breeding progress on nitrogen use efficiency in wheat
(Triticum aestivum L.). Theor. Appl. Genet. 126: 3035-3048. doi:10.1007/s00122-013-
2191-9.
Cormier, F., J. Foulkes, B. Hirel, D. Gouache, Y. Moënne-Loccoz and J. Le Gouis. 2016.
Breeding for increased nitrogen-use efficiency: a review for wheat (T. aestivum L.). Plant
Breed. 135: 255-278. doi:doi:10.1111/pbr.12371.
Dhugga, K.S. and J.G. Waines. 1989. Analysis of nitrogen accumulation and use in bread and
durum wheat. Crop Sci. 29: 1232-1239.
doi:10.2135/cropsci1989.0011183X002900050029x.
Donald, C.M. 1968. The breeding of crop ideotypes. Euphytica 17: 385-403.
doi:10.1007/bf00056241.
Eberhart, S.A. and W.A. Russell. 1966. Stability parameters for comparing varieties. Crop Sci. 6:
36-40. doi:10.2135/cropsci1966.0011183X000600010011x.
Elía, M., G.A. Slafer and R. Savin. 2018. Yield and grain weight responses to post-anthesis
increases in maximum temperature under field grown wheat as modified by nitrogen
supply. Field Crops Res. 221: 228-237. doi:https://doi.org/10.1016/j.fcr.2018.02.030.
Falconer, D.S. 1960. Introduction to quantitative geneticsOliver And Boyd; Edinburgh; London.
Farid, M., H.J. Earl and A. Navabi. 2016. Yield stability of dry bean genotypes across nitrogen-
fixation-dependent and fertilizer-dependent management systems. Crop Sci. 56: 173-182.
doi:10.2135/cropsci2015.06.0343.
Gaju, O., V. Allard, P. Martre, J. Le Gouis, D. Moreau, M. Bogard, et al. 2014. Nitrogen
partitioning and remobilization in relation to leaf senescence, grain yield and grain
nitrogen concentration in wheat cultivars. Field Crops Res. 155: 213-223.
doi:https://doi.org/10.1016/j.fcr.2013.09.003.
Gaju, O., V. Allard, P. Martre, J.W. Snape, E. Heumez, J. LeGouis, et al. 2011. Identification of
traits to improve the nitrogen-use efficiency of wheat genotypes. Field Crops Res. 123:
139-152. doi:https://doi.org/10.1016/j.fcr.2011.05.010.
Galloway, J.N., F.J. Dentener, D.G. Capone, E.W. Boyer, R.W. Howarth, S.P. Seitzinger, et al.
2004. Nitrogen cycles: Past, present, and future. Biogeochemistry 70: 153-226.
doi:10.1007/s10533-004-0370-0.

22
Górny, A.G., S. Garczyński, Z. Banaszak and B. Ługowska. 2006. Genetic variation in the
efficiency of nitrogen utilization and photosynthetic activity of flag leaves among the old
and modern germplasm of winter wheat. J. Appl. Genet. 47: 231-237.
doi:10.1007/bf03194628.
Griffey, C., W. Rohrer, T. Pridgen, W. Brooks, M. Vaughn, W. Sisson, et al. 2003. Registration
of 'Sisson' wheat. Crop Sci. 43: 1134-1136.
Guttieri, M.J., K. Frels, T. Regassa, B.M. Waters and P.S. Baenziger. 2017. Variation for
nitrogen use efficiency traits in current and historical great plains hard winter wheat.
Euphytica 213: 87. doi:10.1007/s10681-017-1869-5.
Hamilton, D.P., N. Salmaso and H.W. Paerl. 2016. Mitigating harmful cyanobacterial blooms:
strategies for control of nitrogen and phosphorus loads. Aquat. Ecol. 50: 351-366.
doi:10.1007/s10452-016-9594-z.
Hasegawa, H. 2003. High-yielding rice cultivars perform best even at reduced nitrogen fertilizer
rate. Crop Sci. 43: 921-926. doi:10.2135/cropsci2003.9210.
Hawkesford, M.J. 2017. Genetic variation in traits for nitrogen use efficiency in wheat. J. Exp.
Bot. 68: 2627-2632. doi:10.1093/jxb/erx079.
Hitz, K., A.J. Clark and D.A. Van Sanford. 2017. Identifying nitrogen-use efficient soft red
winter wheat lines in high and low nitrogen environments. Field Crops Res. 200: 1-9.
doi:https://doi.org/10.1016/j.fcr.2016.10.001.
Krupnik, T.J., Z.U. Ahmed, J. Timsina, M. Shahjahan, A.S.M.A. Kurishi, A.A. Miah, et al. 2015.
Forgoing the fallow in Bangladesh's stress-prone coastal deltaic environments: Effect of
sowing date, nitrogen, and genotype on wheat yield in farmers’ fields. Field Crops Res.
170: 7-20. doi:https://doi.org/10.1016/j.fcr.2014.09.019.
Kubota, H., M. Iqbal, M. Dyck, S. Quideau, R.-C. Yang and D. Spaner. 2018. Investigating
genetic progress and variation for nitrogen use efficiency in spring wheat. Crop Sci. 58:
1542-1557. doi:10.2135/cropsci2017.10.0598.
Laffont, J.-L., K. Wright and M. Hanafi. 2013. Genotype plus genotype × block of environments
biplots. Crop Sci. 53: 2332-2341. doi:10.2135/cropsci2013.03.0178.
Laidig, F., H.-P. Piepho, D. Rentel, T. Drobek, U. Meyer and A. Huesken. 2017. Breeding
progress, environmental variation and correlation of winter wheat yield and quality traits
in German official variety trials and on-farm during 1983–2014. Theor. and Appl. Genet.
130: 223-245. doi:10.1007/s00122-016-2810-3.
Latshaw, S.P., M.F. Vigil and S.D. Haley. 2016. Genotypic differences for nitrogen use
efficiency and grain protein deviation in hard winter wheat. Agronomy J. 108: 2201-
2213. doi:10.2134/agronj2016.02.0070.
Le Gouis, J., D. Béghin, E. Heumez and P. Pluchard. 2000. Genetic differences for nitrogen
uptake and nitrogen utilisation efficiencies in winter wheat. Eur. J. Agron. 12: 163-173.
doi:https://doi.org/10.1016/S1161-0301(00)00045-9.
Mahjourimajd, S., H. Kuchel, P. Langridge and M. Okamoto. 2016. Evaluation of Australian
wheat genotypes for response to variable nitrogen application. Plant Soil 399: 247-255.
doi:10.1007/s11104-015-2694-z.
McKendry, A., D. Tague, R. Wright and J. Tremain. 2007. Registration of ‘Bess’ wheat. J. Plant
Reg. 1: 21-23.
McMaster, G.S. and W.W. Wilhelm. 1997. Growing degree-days: one equation, two
interpretations. Agric. For. Meteorol. 87: 291-300. doi:https://doi.org/10.1016/S0168-
1923(97)00027-0.
23
Moll, R.H., E.J. Kamprath and W.A. Jackson. 1982. Analysis and interpretation of factors which
contribute to efficiency of nitrogen utilization. Agron. J. 74: 562-564.
doi:10.2134/agronj1982.00021962007400030037x.
Muellner, A.E., F. Mascher, D. Schneider, G. Ittu, I. Toncea, B. Rolland, et al. 2014. Refining
breeding methods for organic and low-input agriculture: analysis of an international
winter wheat ring test. Euphytica 199: 81-95. doi:10.1007/s10681-014-1169-2.
Ortiz-Monasterio R., J.I., K.D. Sayre, S. Rajaram and M. McMahon. 1997. Genetic progress in
wheat yield and nitrogen use efficiency under four nitrogen rates. Crop Sci. 37: 898-904.
doi:10.2135/cropsci1997.0011183X003700030033x.
Presterl, T., G. Seitz, M. Landbeck, E.M. Thiemt, W. Schmidt and H.H. Geiger. 2003. Improving
nitrogen-use efficiency in European maize. Crop Sci. 43: 1259-1265.
doi:10.2135/cropsci2003.1259.
Ranjitha, K., S.S. Biradar, S. Desai, V.R. Naik, S. Singh, T. Satisha, et al. 2018. Combining
ability of six wheat genotypes and their F1 diallel crosses for nitrogen use efficiency
(NUE) and related traits under 50 per cent nitrogen condition. Int. J. Curr. Microbiol.
App. Sci 7: 1237-1243.
Rozbicki, J., A. Ceglińska, D. Gozdowski, M. Jakubczak, G. Cacak-Pietrzak, W. Mądry, et al.
2015. Influence of the cultivar, environment and management on the grain yield and
bread-making quality in winter wheat. J. Cereal Sci. 61: 126-132.
doi:https://doi.org/10.1016/j.jcs.2014.11.001.
Russell, K., C. Lee and D. Van Sanford. 2017. Interaction of genetics, environment, and
management in determining soft red winter wheat yields. Agron. J. 109: 2463-2473.
doi:10.2134/agronj2017.02.0126.
Shiferaw, B., M. Smale, H.-J. Braun, E. Duveiller, M. Reynolds and G. Muricho. 2013. Crops
that feed the world 10. Past successes and future challenges to the role played by wheat in
global food security. Food Secur. 5: 291-317. doi:10.1007/s12571-013-0263-y.
Sinha, E., A.M. Michalak and V. Balaji. 2017. Eutrophication will increase during the 21st
century as a result of precipitation changes. Sci. 357: 405-408.
doi:10.1126/science.aan2409.
Stagnari, F., A. Onofri, P. Codianni and M. Pisante. 2013. Durum wheat varieties in N-deficient
environments and organic farming: a comparison of yield, quality and stability
performances. Plant Breed. 132: 266-275. doi:doi:10.1111/pbr.12044.
Tamang, B.G., K.G. Brasier, W.E. Thomason, C.A. Griffey and T. Fukao. 2017. Differential
responses of grain yield, grain protein, and their associated traits to nitrogen supply in
soft red winter wheat. J. Plant Nutr. Soil Sci. 180: 316-325.
doi:doi:10.1002/jpln.201600312.
Team, R.C. 2015. R: A language and environment for statistical computing. R Foundation for
Statistical Computing, Vienna, Austria. doi:Available: http://www.R-project.org/.
Tilak, K.V.B.R., N. Ranganayaki, K.K. Pal, R. De, A.K. Saxena, C.S. Nautiyal, et al. 2005.
Diversity of plant growth and soil health supporting bacteria. Curr. Sci. 89: 136-150.
Tilman, D., K.G. Cassman, P.A. Matson, R. Naylor and S. Polasky. 2002. Agricultural
sustainability and intensive production practices. Nature 418: 671.
doi:10.1038/nature01014.

24
Ul-Allah, S., M. Iqbal, S. Maqsood, M. Naeem, M. Ijaz, W. Ashfaq, et al. 2018. Improving the
performance of bread wheat genotypes by managing irrigation and nitrogen under semi-
arid conditions. Arch. Agron. Soil Sci. 64: 1678-1689.
doi:10.1080/03650340.2018.1450974.
Van Deynze, A., P. Zamora, P.-M. Delaux, C. Heitmann, D. Jayaraman, S. Rajasekar, et al.
2018. Nitrogen fixation in a landrace of maize is supported by a mucilage-associated
diazotrophic microbiota. PLOS Bio. 16: e2006352. doi:10.1371/journal.pbio.2006352.
Zhang, X., E.A. Davidson, D.L. Mauzerall, T.D. Searchinger, P. Dumas and Y. Shen. 2015.
Managing nitrogen for sustainable development. Nature 528: 51.
doi:10.1038/nature15743.
Zhou, J.-b., C.-y. Wang, H. Zhang, F. Dong, X.-f. Zheng, W. Gale, et al. 2011. Effect of water
saving management practices and nitrogen fertilizer rate on crop yield and water use e
efficiency in a winter wheat–summer maize cropping system. Field Crops Res. 122: 157-
163. doi:https://doi.org/10.1016/j.fcr.2011.03.009.
25
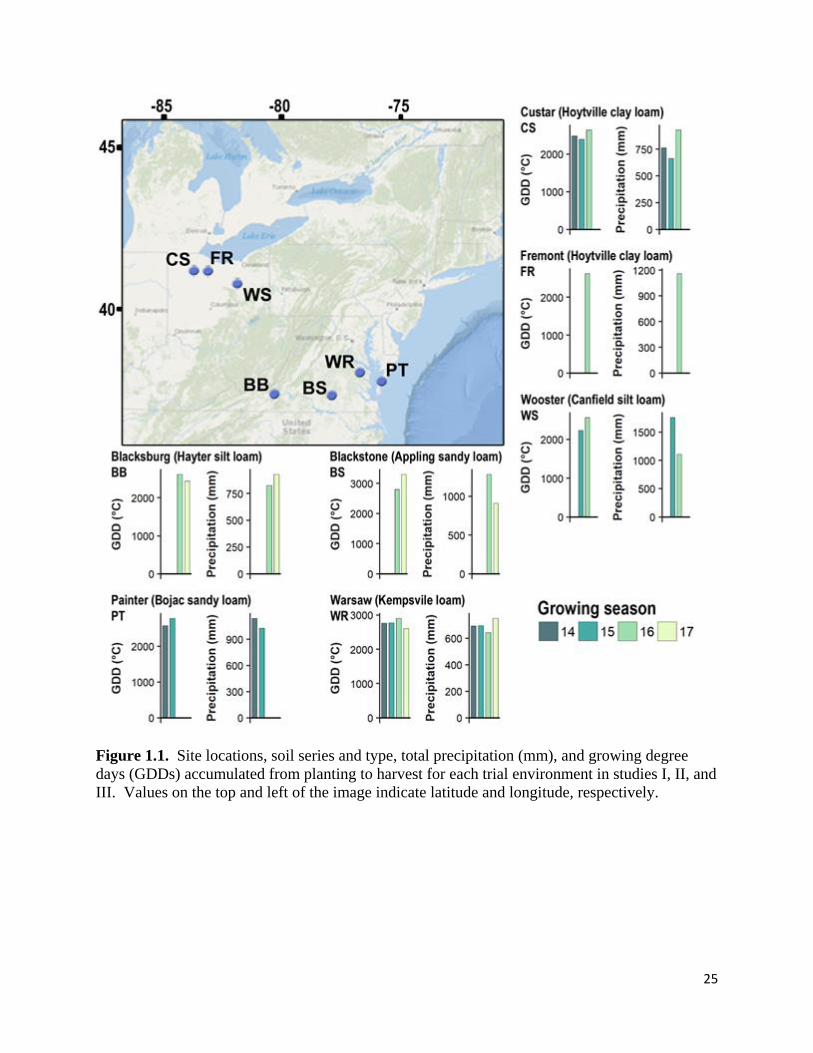
Figure 1.1. Site locations, soil series and type, total precipitation (mm), and growing degree
days (GDDs) accumulated from planting to harvest for each trial environment in studies I, II, and
III. Values on the top and left of the image indicate latitude and longitude, respectively.

26
Figure 1.2. Yield stability parameters slope (βi) and deviation from regression (δ2
d) against
grain yield over N-environments for wheat lines within each study. Points with corresponding
line numbers represent each genotype tested while dashed and solid lines represent means of the
two stability parameters and yields in each study, respectively.
27
Figure 1.4. Correlation matrix for traits in Study II at three N rates over four environments and
Study III at two N rates over six environments. Above-ground biomass (AGBM), harvest index
(HI), grain N content (GNC), NUpE and NUtE were assessed. Results significant on the 0.05
(*), 0.01 (**), and 0.001 (***) levels.

28
Figure 1.4. Contribution of NUpE and NUtE to the variation in NUE by wheat line and N rate
in a) Study II and b) Study III. Line numbers listed on the left of each set of bars correspond
with those provided in Table 1.2.

29
Table 1.1. Description of number of lines evaluated, N-environments (N-Env.), experimental
units (Exp. units), replications, and N rates used in each study.
Study Wheat
lines N-Env.
Exp.
units Replications GS25 Na GS30 N
Total spring
N
kg N ha-1
Ib 12 15 720 4
22 22 45
33 33 67
45 45 90
56 56 112
67 67 134
II 12 18 612 2 - 3
33 33 67
33 67 101
33 101 134
III 11 18 704 2 - 4 33 33 67
67 67 134 a Nitrogen split applied at Zadoks growth stage 25 (GS25) and 30 (GS30). b Study I, II, and III represent three separate studies of N response grown under the conditions
described.

30
Table 1.2. Description of plant materials and their respective pedigrees used in each study. Line
No. Linea
Study Pedigree
I II III
1 IL02-19483B ✔ ✔ Patton/Cardinal//IL96-2550
2 IL07-4415 ✔ ✔ P96169RE2-3-6-4/IL01-34159
3 KY06C-1003-139-8-3 ✔ ✔ Truman/McCormick//25R37
4 MD05W10208-11-8 ✔ ✔ Tribute/25R42//Chesapeake
5 MO080864 ✔ ✔ 981020//P92201D5-2/98072
6 OH06-150-57 ✔ ✔ P.92201D5-2-29/OH708
7 Bess ✔ ✔ ✔ MO11769/Madison
8 MD03W485-10-10 ✔ ✔ ✔ USG3209/Tribute//USG3342"S"
9 OH08-161-78 ✔ ✔ ✔ OH751/OH738
10 OH08-172-42 ✔ ✔ ✔ Douglas/Jekyl
11 Sisson ✔ ✔ ✔ Coker9803/Freedom
12 VA08MAS-369 ✔ ✔ ✔ McCormick/GA881130LE5
13 SS520 ✔ FFR555W/GA-Gore
14 VA05W-151 ✔ Pioneer26R24/McCormick
15 VA07W-415 ✔ VA98W-895/GA881130LE5//VA98W-627RS
16 VA09W-73 ✔ SS520/VA99W-188//Tribute
17 Yorktown ✔ SS520/VA99W-188//Tribute a Plant introduction number for Bess is PI 642794 (McKendry et al., 2007), Sisson is PI 617053
(Griffey et al., 2003), SS520 (‘38158’) is PI 619052, VA05W-151 (‘5187J’) is PI 665039,
VA07W-415 (‘72014415’) is PI 669571, VA09W-73 (‘Featherstone 73’) is PI 669572, and
Yorktown is PI 667643 (Griffey et al., 2012).

31
Table 1.3. Analysis of variance with F-values for grain yield in each study.
Effect Study I Study II Study III
df F-value df F-value df F-value
Ga 11 12.87 *** 11 15.60 *** 10 26.25 ***
N 4 6.81 *** 2 243.08 *** 1 217.95 ***
E 2 1,111.77 *** 5 655.13 *** 9 1,056.75 ***
G × N 44 2.38 *** 22 1.33 nsb 10 1.47 ns
G × E 22 24.72 *** 55 4.11 *** 90 5.37 ***
N × E 8 15.76 *** 10 10.50 *** 9 15.32 ***
G × N × E 88 2.68 *** 110 1.32 * 90 0.84 ns a Effects of genotype (G), N rate (N), testing environment (E), and their interactions.
* Significant at the 0.05 probability level.
** Significant at the 0.01 probability level.
*** Significant at the 0.001 probability level. b ns, not significant.
32
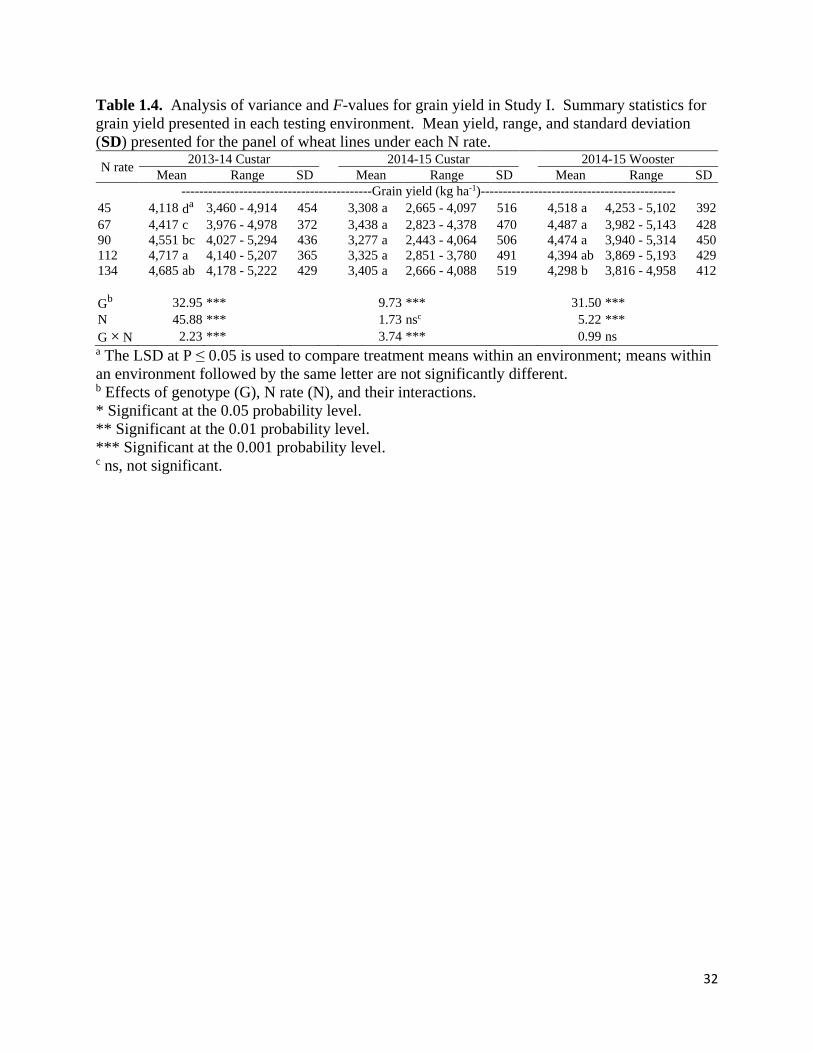
Table 1.4. Analysis of variance and F-values for grain yield in Study I. Summary statistics for
grain yield presented in each testing environment. Mean yield, range, and standard deviation
(SD) presented for the panel of wheat lines under each N rate.
N rate 2013-14 Custar 2014-15 Custar 2014-15 Wooster
Mean Range SD Mean Range SD Mean Range SD
-------------------------------------------Grain yield (kg ha-1)--------------------------------------------
45 4,118 da 3,460 - 4,914 454 3,308 a 2,665 - 4,097 516 4,518 a 4,253 - 5,102 392
67 4,417 c 3,976 - 4,978 372 3,438 a 2,823 - 4,378 470 4,487 a 3,982 - 5,143 428
90 4,551 bc 4,027 - 5,294 436 3,277 a 2,443 - 4,064 506 4,474 a 3,940 - 5,314 450
112 4,717 a 4,140 - 5,207 365 3,325 a 2,851 - 3,780 491 4,394 ab 3,869 - 5,193 429
134 4,685 ab 4,178 - 5,222 429 3,405 a 2,666 - 4,088 519 4,298 b 3,816 - 4,958 412
Gb 32.95 *** 9.73 *** 31.50 ***
N 45.88 *** 1.73 nsc 5.22 ***
G × N 2.23 *** 3.74 *** 0.99 ns a The LSD at P ≤ 0.05 is used to compare treatment means within an environment; means within
an environment followed by the same letter are not significantly different. b Effects of genotype (G), N rate (N), and their interactions.
* Significant at the 0.05 probability level.
** Significant at the 0.01 probability level.
*** Significant at the 0.001 probability level. c ns, not significant.

33
Table 1.5. Analysis of variance and F-values for grain yield in Study II. Summary statistics for
grain yield presented in each testing environment. Mean yield, range, and standard deviation
(SD) presented for the panel of wheat lines under each N rate.
N rate 2013-14 Painter 2013-14 Warsaw 2014-15 Painter
Mean Range SD Mean Range SD Mean Range SD
-------------------------------------------Grain yield (kg ha-1)--------------------------------------------
67 2,609 ca 2,423 - 2,791 288 4,573 c 4,055 - 5,333 473 3,224 b 2,729 - 3,652 522
101 3,211 b 1,800 - 3,601 579 5,247 b 4,604 - 5,828 417 3,457 a 2,864 - 4,053 477
134 3,656 a 3,006 - 4,137 452 5,789 a 5,024 - 6,423 525 3,595 a 3,204 - 3,997 445
Gb 3.80 *** 14.32 *** 3.12 **
N 74.69 *** 170.56 *** 8.54 ***
G × N 2.19 *** 2.02 * 1.53 c
N rate 2014-15 Warsaw 2015-16 Blacksburg 2015-16 Warsaw
Mean Range SD Mean Range SD Mean Range SD
-------------------------------------------Grain yield (kg ha-1)--------------------------------------------
67 4,246 c 3,362 - 4,789 532 4,367 b 3,715 - 4,955 392 2,994 c 2,523 - 3,305 265
101 4,878 b 4,355 - 5,466 427 4,575 a 3,897 - 4,941 375 3,339 b 2,864 - 3,765 349
134 5,163 a 4,467 - 5,596 490 4,681 a 4,074 - 5,117 392 3,661 a 3,301 - 4,092 306
G 7.70 *** 20.00 *** 4.43 ***
N 58.10 *** 19.00 *** 45.79 ***
G × N 0.90 nsd 1.54 c 1.14 ns
a The LSD at P ≤ 0.05 is used to compare treatment means within an environment; means within
an environment followed by the same letter are not significantly different. b Effects of genotype (G), N rate (N), and their interactions.
* Significant at the 0.05 probability level.
** Significant at the 0.01 probability level.
*** Significant at the 0.001 probability level. c Significant at the 0.1 probability level. d ns, not significant.

34
Table 1.6. Analysis of variance and F-values for grain yield in Study III. Summary statistics for
grain yield presented in each testing environment. Mean yield, range, and standard deviation
(SD) presented for the panel of wheat lines under each N rate. 2015-16 Custar 2015-16 Fremont 2015-16 Wooster
N rate Mean Range SD Mean Range SD Mean Range SD
-------------------------------------------Grain yield (kg ha-1)--------------------------------------------
67 4,828 ba 4,365 - 5,831 536 5,648 b 5,078 - 6,468 475 5,887 b 5,015 - 7,203 743
134 5,262 a 4,463 - 5,715 476 5,926 a 5,528 - 6,370 438 6,502 a 5,354 - 7,455 806
Gb 6.12 *** 4.50 *** 22.28 ***
N 26.67 *** 12.97 *** 53.61 ***
G × N 1.34 nsc 1.97 nsd 1.24 ns
2015-16 Blacksburg 2015-16 Blackstone 2015-16 Warsaw
N rate Mean Range SD Mean Range SD Mean Range SD
-------------------------------------------Grain yield (kg ha-1)--------------------------------------------
67 4,530 a 3,972 - 5,180 552 1,879 b 1,437 - 2,268 532 3,273 b 3,049 - 3,561 259
134 4,536 a 3,858 - 5,295 557 2,391 a 1,826 - 3,017 484 4,311 a 3,895 - 4,738 308
G 7.08 *** 4.06 *** 4.52 **
N 0.00 ns 38.83 *** 252.15 ***
G × N 0.67 ns 1.06 ns 0.55 ns
2016-17 Blacksburg 2016-17 Blackstone 2016-17 Warsaw
N rate Mean Range SD Mean Range SD Mean Range SD
-------------------------------------------Grain yield (kg ha-1)--------------------------------------------
67 5,838 b 4,837 - 6,697 670 2,394 a 1,976 - 2,855 404 4,433 b 3,918 - 4,807 442
134 6,036 a 4,527 - 7,112 814 2,397 a 1,653 - 3,026 491 5,436 a 4,813 - 6,086 420
G 22.2 *** 5.88 *** 6.74 ***
N 5.53 * 0.00 ns 178.14 ***
G × N 0.97 ns 0.38 ns 1.92 nsd a The LSD at P ≤ 0.05 is used to compare treatment means within an environment; means within
an environment followed by the same letter are not significantly different. b Effects of genotype (G), N rate (N), and their interactions.
* Significant at the 0.05 probability level.
** Significant at the 0.01 probability level.
*** Significant at the 0.001 probability level. c ns, not significant. d Significant at the 0.1 probability level.

35
Table 1.7. Analysis of variance and F-values for physiological and N traits in Study II and III.
Effect df Above-ground
biomass Harvest index Grain N content NUEa NUpE NUtE
Study II
Gb 11 7.25 *** 7.30 *** 11.16 *** 3.73 *** 1.38 ns 4.48 ***
N 2 55.52 *** 10.33 *** 60.94 *** 428.37 *** 112.85 *** 52.78 ***
E 5 139.44 *** 101.51 *** 96.09 *** 139.01 *** 132.12 *** 154.58 ***
G × N 22 0.81 nsc 1.28 ns 0.83 ns 0.60 ns 1.55 ns 1.28 ns
G × E 55 1.29 ns 2.16 *** 1.02 ns 1.75 ** 1.01 ns 1.91 **
N × E 10 4.62 *** 2.86 ** 4.01 *** 7.33 *** 7.52 *** 2.75 *
G × N × E 110 1.14 ns 1.41 ** 0.99 ns 1.03 ns 1.09 ns 1.46 *
Study III
G 10 6.86 *** 6.56 *** 8.99 *** 5.16 *** 1.10 ns 7.10 ***
N 1 24.17 *** 13.92 *** 138.54 *** 811.43 *** 282.67 *** 102.57 ***
E 5 196.27 *** 323.37 *** 50.52 *** 233.13 *** 117.88 *** 50.62 ***
G × N 10 0.56 ns 0.68 ns 0.51 ns 0.63 ns 0.89 ns 1.02 ns
G × E 50 1.38 ns 1.96 *** 1.40 ns 2.60 *** 1.10 ns 1.56 *
N × E 5 8.83 *** 3.81 ** 0.94 ns 31.20 *** 12.78 *** 0.90 ns
G × N × E 50 0.69 ns 0.67 ns 0.77 ns 1.44 * 1.01 ns 0.84 ns a NUE, NUpE, and NUtE were collected in four of the six Study II environments. b Effects of genotype (G), N rate (N), testing environment (E), and their interactions.
* Significant at the 0.05 probability level.
** Significant at the 0.01 probability level.
*** Significant at the 0.001 probability level. c ns, not significant.

36
Table 1.8. Percent contribution of variance components to grain yield, above-ground biomass
(AGBM), harvest index (HI), grain N content (GNC), N-uptake efficiency (NUpE), and N-
utilization efficiency (NUtE) with heritabilities for wheat lines grown in Study II and III.
Trait Variance components
H2b G (%)a G × N (%) G × E (%)
Study I
Grain yield 0 7 93 0.00
Study II
Grain yield 41 1 58 0.74
AGBM 86 0 14 0.83
HI 43 5 52 0.68
GNC 100 0 0 0.90
NUpE 0 100 0 0.00
NUtE 40 14 46 0.54
Study III
Grain yield 37 2 61 0.79
AGBM 73 0 27 0.80
HI 44 0 56 0.69
GNC 91 0 9 0.86
NUpE 100 0 0 0.05
NUtE 67 0 33 0.80 a G (%) is the percent genotypic variance; G × N (%) is the percent genotype × nitrogen variance; G × E
(%) is the percent genotype × environment variance; H2 is the broad sense heritability. b Number of testing environments used for each trait in studies II and III shown in Supplemental
Table 1.2.

37
Supplemental Figure 1.1. GGE biplot for grain yield in Study I with line numbers (green color)
and N-environments (brown color). The line designations are given in Table 1.2 and N-
environment descriptions are in Appendix Table 1.4.

38
Supplemental Figure 1.2. GGE biplot for grain yield in Study II with line numbers (green
color) and N-environments (brown color). The line designations are given in Table 1.2 and N-
environment descriptions are in Appendix Table 1.4.

39
Supplemental Figure 1.3. GGE biplot for grain yield in Study III with line numbers (green
color) and N-environments (brown color). The line designations are given in Table 1.2 and N-
environment descriptions are in Appendix Table 1.4.

40
Supplemental Table 1.1. Management practices in each Virginia testing environment including
product, application rate of fertilizer, active ingredient (A.I.), and application date. Season Location Product Application rate Application date
2013-14 Painter Pre-plant fertilizer 34-0-0-0a 10/23/2013
Planting 520 seeds m-2 10/24/2013
GS25 UAN Variable‡ 03/10/2014
Harmony Extra SG® 0.02 kg A.I. ha-1 03/12/2014
G30 UAN Variable 04/03/2014
Harvest NA 06/16/2014
Warsaw Pre-plant fertilizer 34-67-67-2 10/18/2013
Planting 520 seeds m-2 10/22/2013
GS25 UAN Variable 03/01/2014
Harmony Extra SG® 0.02 kg A.I. ha-1 03/01/2014
Starane™ 0.21 kg A.I. ha-1 03/11/2014
GS30 UAN Variable 04/04/2014
Palisade EC 0.08 kg A.I. ha-1 04/04/2014
Tilt 0.07 kg A.I. ha-1 04/10/2014
Prosaro 0.14 kg A.I. ha-1 05/08/2014
Tilt 007 kg A.I. ha-1 05/08/2014
Harvest NA 06/24/2014
2014-15 Painter Pre-plant fertilizer 34-0-0-0 10/20/2014
Planting 520 seeds m-2 10/23/2014
GS25 UAN Variable 03/17/2015
Harmony Extra SG® 0.02 kg A.I. ha-1 03/25/2015
GS30 UAN Variable 04/30/2015
Harvest NA 06/22/2015
Warsaw Pre-plant fertilizer 34-67-67-5 10/06/2014
Planting 520 seeds m-2 10/21/2014
GS25 UAN Variable 03/19/2015
Harmony Extra SG® 0.02 kg A.I. ha-1 03/24/2015
Starane™ 0.21 kg A.I. ha-1 03/24/2015
GS30 UAN Variable 04/01/2015
Palisade EC 0.08 kg A.I. ha-1 04/06/2015
Tilt 0.07 kg A.I. ha-1 04/10/2015
Prosaro 0.14 kg A.I. ha-1 05/14/2015
Tilt 007 kg A.I. ha-1 05/14/2015
Harvest NA 06/22/2015
2015-16 Blacksburg Pre-plant fertilizer 34-67-67-5 10/16/2015
Planting 520 seeds m-2 10/16/2015
Harmony Extra SG® 0.02 kg A.I. ha-1 11/16/2015
GS25 UAN Variable 03/08/2016
Harmony Extra SG® 0.02 kg A.I. ha-1 03/23/2016
GS30 UAN Variable 03/23/2016
Palisade EC 0.08 kg A.I. ha-1 03/31/2016
Tilt 0.04 kg A.I. ha-1 03/31/2016
Prosaro 0.14 kg A.I. ha-1 05/12/2016
Tilt 0.10 kg A.I. ha-1 05/26/2016
Harvest NA 06/27/2016
Blackstone Planting 520 seeds m-2 10/20/2015
GS25 UAN Variable 02/10/2016

41
Season Location Product Application rate Application date
Harmony Extra SG® 0.02 kg A.I. ha-1 02/10/2016
GS30 UAN Variable 03/09/2016
Prosaro 0.07 kg A.I. ha-1 04/11/2016
Mustang® Maxx 0.03 kg A.I. ha-1 04/25/2016
Prosaro 0.07 kg A.I. ha-1 04/29/2016
Harvest NA 06/15/2016
Warsaw Lime 2242 kg ha-1 09/24/2015
Pre-plant fertilizer 34-67-67-5 10/14/2015
Planting 520 seeds m-2 10/21/2015
Starane™ 0.21 kg A.I. ha-1 12/06/2015
GS25 UAN Variable 02/19/2016
Harmony Extra SG® 0.02 kg A.I. ha-1 03/08/2016
Starane™ 0.15 kg A.I. ha-1 03/08/2016
GS30 UAN Variable 03/12/2016
Palisade EC 0.06 kg A.I. ha-1 03/30/2016
Fitness 0.12 kg A.I. ha-1 03/30/2016
Fitness 0.12 kg A.I. ha-1 04/19/2016
Prosaro 0.14 kg A.I. ha-1 05/20/2016
Harvest NA 06/22/2016
2016-17 Blacksburg Lime 3363 kg ha-1 09/28/2016
Pre-plant fertilizer 15-40-60-8-3B 10/10/2016
Planting 520 seeds m-2 10/12/2016
Harmony Extra SG® 0.02 kg A.I. ha-1 11/15/2016
GS25 UAN Variable 02/17/2017
Harmony Extra SG® 0.02 kg A.I. ha-1 03/24/2017
GS30UAN Variable 03/24/2017
Palisade EC 0.08 kg A.I. ha-1 03/27/2017
Prosaro 0.14 kg A.I. ha-1 05/08/2017
Tilt 0.10 kg A.I. ha-1 05/30/2017
Harvest NA 06/22/2017
Blackstone Pre-plant fertilizer 34-34-34-0 10/16/2016
Planting 520 seeds m-2 10/08/2016
GS25 UAN Variable 02/02/2017
Harmony Extra SG® 0.02 kg A.I. ha-1 02/02/2017
GS30 UAN Variable 03/01/2017
Mustang® Maxx 0.03 kg A.I. ha-1 03/01/2017
Harvest NA 06/15/2017
Warsaw Pre-plant fertilizer 30-70-60-5 10/17/2016
Planting 520 seeds m-2 10/18/2016
Quelex® 0.01 kg A.I. ha-1 12/04/2016
GS25 UAN Variable 02/06/2017
Tilt 0.07 kg A.I. ha-1 03/09/2017
Tombstone 0.03 kg A.I. ha-1 03/09/2017
GS30 UAN Variable 03/13/2017
Palisade EC 0.08 kg A.I. ha-1 03/17/2017
Tilt 0.07 kg A.I. ha-1 04/05/2017
Prosaro 0.14 kg A.I. ha-1 04/20/2017
Tombstone 0.03 kg A.I. ha-1 04/28/2017
Harvest NA 06/12/2017 aNitrogen, phosphorous, potassium, and sulfur pre-plant fertilizer applied, respectively.
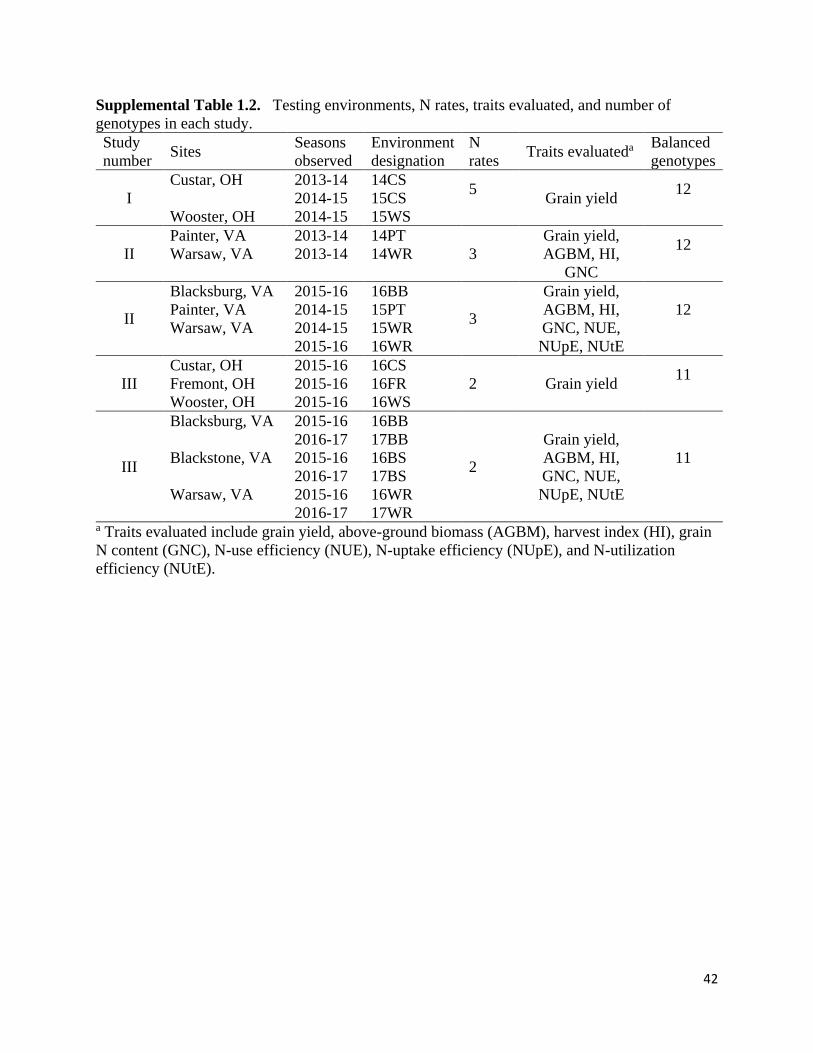
42
Supplemental Table 1.2. Testing environments, N rates, traits evaluated, and number of
genotypes in each study.
Study
number Sites
Seasons
observed
Environment
designation
N
rates Traits evaluateda
Balanced
genotypes
I
Custar, OH 2013-14 14CS 5
Grain yield
12
2014-15 15CS
Wooster, OH 2014-15 15WS
II
Painter, VA 2013-14 14PT
3
Grain yield,
AGBM, HI,
GNC
12
Warsaw, VA 2013-14 14WR
II
Blacksburg, VA 2015-16 16BB
3
Grain yield,
AGBM, HI,
GNC, NUE,
NUpE, NUtE
12
Painter, VA 2014-15 15PT
Warsaw, VA 2014-15 15WR
2015-16 16WR
III
Custar, OH 2015-16 16CS
2 Grain yield 11
Fremont, OH 2015-16 16FR
Wooster, OH 2015-16 16WS
III
Blacksburg, VA 2015-16 16BB
2
Grain yield,
AGBM, HI,
GNC, NUE,
NUpE, NUtE
11
2016-17 17BB
Blackstone, VA 2015-16 16BS
2016-17 17BS
Warsaw, VA 2015-16 16WR
2016-17 17WR a Traits evaluated include grain yield, above-ground biomass (AGBM), harvest index (HI), grain
N content (GNC), N-use efficiency (NUE), N-uptake efficiency (NUpE), and N-utilization
efficiency (NUtE).
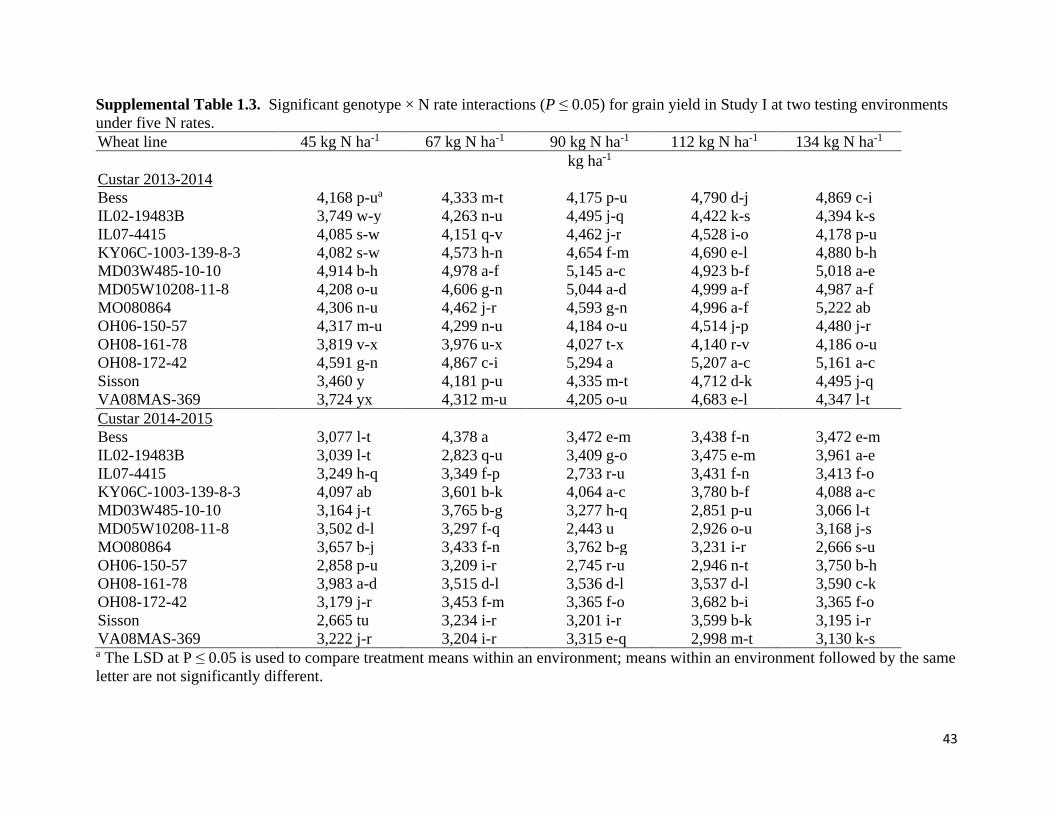
43
Supplemental Table 1.3. Significant genotype × N rate interactions (P ≤ 0.05) for grain yield in Study I at two testing environments
under five N rates.
Wheat line 45 kg N ha-1 67 kg N ha-1 90 kg N ha-1 112 kg N ha-1 134 kg N ha-1
kg ha-1
Custar 2013-2014
Bess 4,168 p-ua 4,333 m-t 4,175 p-u 4,790 d-j 4,869 c-i
IL02-19483B 3,749 w-y 4,263 n-u 4,495 j-q 4,422 k-s 4,394 k-s
IL07-4415 4,085 s-w 4,151 q-v 4,462 j-r 4,528 i-o 4,178 p-u
KY06C-1003-139-8-3 4,082 s-w 4,573 h-n 4,654 f-m 4,690 e-l 4,880 b-h
MD03W485-10-10 4,914 b-h 4,978 a-f 5,145 a-c 4,923 b-f 5,018 a-e
MD05W10208-11-8 4,208 o-u 4,606 g-n 5,044 a-d 4,999 a-f 4,987 a-f
MO080864 4,306 n-u 4,462 j-r 4,593 g-n 4,996 a-f 5,222 ab
OH06-150-57 4,317 m-u 4,299 n-u 4,184 o-u 4,514 j-p 4,480 j-r
OH08-161-78 3,819 v-x 3,976 u-x 4,027 t-x 4,140 r-v 4,186 o-u
OH08-172-42 4,591 g-n 4,867 c-i 5,294 a 5,207 a-c 5,161 a-c
Sisson 3,460 y 4,181 p-u 4,335 m-t 4,712 d-k 4,495 j-q
VA08MAS-369 3,724 yx 4,312 m-u 4,205 o-u 4,683 e-l 4,347 l-t
Custar 2014-2015
Bess 3,077 l-t 4,378 a 3,472 e-m 3,438 f-n 3,472 e-m
IL02-19483B 3,039 l-t 2,823 q-u 3,409 g-o 3,475 e-m 3,961 a-e
IL07-4415 3,249 h-q 3,349 f-p 2,733 r-u 3,431 f-n 3,413 f-o
KY06C-1003-139-8-3 4,097 ab 3,601 b-k 4,064 a-c 3,780 b-f 4,088 a-c
MD03W485-10-10 3,164 j-t 3,765 b-g 3,277 h-q 2,851 p-u 3,066 l-t
MD05W10208-11-8 3,502 d-l 3,297 f-q 2,443 u 2,926 o-u 3,168 j-s
MO080864 3,657 b-j 3,433 f-n 3,762 b-g 3,231 i-r 2,666 s-u
OH06-150-57 2,858 p-u 3,209 i-r 2,745 r-u 2,946 n-t 3,750 b-h
OH08-161-78 3,983 a-d 3,515 d-l 3,536 d-l 3,537 d-l 3,590 c-k
OH08-172-42 3,179 j-r 3,453 f-m 3,365 f-o 3,682 b-i 3,365 f-o
Sisson 2,665 tu 3,234 i-r 3,201 i-r 3,599 b-k 3,195 i-r
VA08MAS-369 3,222 j-r 3,204 i-r 3,315 e-q 2,998 m-t 3,130 k-s a The LSD at P ≤ 0.05 is used to compare treatment means within an environment; means within an environment followed by the same
letter are not significantly different.

44
Supplemental Table 1.4. Significant genotype × N rate interactions (P ≤ 0.05) for grain yield in Study II at two testing environments
under three N rates.
Line 2013-2014 Painter 2013-2014 Warsaw
67 kg N ha-1 101 kg N ha-1 134 kg N ha-1 67 kg N ha-1 101 kg N ha-1 134 kg N ha-1
kg ha-1 kg ha-1
Bess 2,528 ka 1,800 l 3,006 e-k 4,562 n-q 4,925 i-n 5,669 c-e
IL02-19483B 2,677 i-k 3,231 d-i 3,629 a-d 4,055 r 5,089 g-l 5,276 e-j
IL07-4415 2,608 jk 3,197 d-j 3,697 a-d 5,333 e-i 5,287 e-j 6,151 ab
KY06C-1003-139-8-3 2,677 i-k 3,601 a-d 3,312 c-h 4,755 k-p 5,552 d-f 6,157 ab
MD03W485-10-10 2,542 k 3,494 b-f 3,863 a-c 4,342 p-r 4,604 m-p 5,024 h-m
MD05W10208-11-8 2,791 g-k 3,173 d-j 3,756 a-d 4,396 p-r 5,011 h-n 5,423 d-h
MO080864 2,507 k 3,530 b-e 3,827 a-c 4,699 l-p 5,198 f-j 6,091 a-c
OH06-150-57 2,617 jk 3,376 c-g 3,313 c-h 4,130 qr 4,867 j-n 5,415 d-h
OH08-161-78 2,423 k 3,559 a-e 3,464 b-f 4,572 m-p 5,382 d-h 5,442 d-h
OH08-172-42 2,768 h-k 3,489 b-f 3,870 a-c 5,008 h-n 5,828 b-d 6,358 a
Sisson 2,721 h-j 2,902 f-k 4,001 ab 4,603 m-p 5,512 d-g 6,036 a-c
VA08MAS-369 2,449 k 3,185 d-j 4,137 a 4,427 o-r 5,711 b-e 6,423 a a The LSD at P ≤ 0.05 is used to compare treatment means within an environment; means within an environment followed by the same
letter are not significantly different.

45
Supplemental Table 1.5. Variance components and heritability for grain yield, above-ground
biomass (AGBM), harvest index (HI), grain N content (GNC), N-uptake efficiency (NUpE), and
N-utilization efficiency (NUtE) for wheat lines grown in Study II and III.
Trait Variance components
H2b σ2 Ga σ2 N σ2 E σ2 (G × N) σ2 (G × E) σ2 ε
Study I
Grain yield 3.127e-10 2.778e+03 4.080e+05 6.917e+03 8.650e+04 1.280e+05 0.00
Study II
Grain yield 27,588 145,582 750,645 674 39,034 150,203 0.74
AGBM 2,585 5,624 26,048 0 435 22,458 0.83
HI 1.833e-04 8.291e-05 1.855e-03 2.151e-05 2.240e-04 2.061e-03 0.68
GNC 7.582e-03 1.208e-02 3.478e-02 0.000 0.000 4.232e-02 0.90
NUpE 0.000 5.457e-02 7.108e-02 2.691e-03 0.000 6.744e-02 0.00
NUtE 2.725 14.045 53.049 0.966 3.064 39.359 0.54
Study III
Grain yield 54,835 92,887 2,184,287 2,651 91,935 172,552 0.79
AGBM 5,872 3,733 102,483 0 2,153 36,412 0.80
HI 1.437e-04 7.219e-05 5.465e-03 0.000 1.850e-04 1.102e-03 0.69
GNC 8.327e-03 2.871e-02 2.565e-02 0.000 2.622e-03 3.019e-02 0.86
NUpE 2.038e-04 1.937e-01 2.647e-01 0.000 0.000 1.229e-01 0.05
NUtE 3.683 12.264 17.986 0.000 1.815 20.307 0.80 a σ2 G genotypic variance; σ2 N nitrogen variance; σ2 E environmental variance; σ2 (G × N) genotype ×
nitrogen variance; σ2 (G × E) genotype × environment variance; σ2 ε residual variance; H2 broad sense
heritability. b Number of testing environments used for each trait in studies II and III shown in Supplemental
Table 1.2.

46
Supplemental Table 1.6. Variance components and heritability for grain yield, above-ground
biomass, harvest index, grain N content, NUpE, and NUtE under each N-environment for wheat
lines grown in studies I, II, and III.
Trait Variance components
H2b σ2 Ga σ2 N-env σ2 (G × N-env) σ2 ε
Study I
Grain yield‡ 10,658 306,677 106,148 90,559 0.55
Study II
Grain yield 32,429 781,285 47,198 120,344 0.87
Above-ground biomass 2,610 28,022 1,064 20,639 0.86
Harvest index 2.096e-04 1.742e-03 4.112e-04 1.828e-03 0.80
Grain N content 7.649e-03 4.114e-02 0.000 4.036e-02 0.91
NUpE 7.443e-04 1.023e-01 3.209e-03 6.037e-02 0.28
NUtE 3.37 54.42 6.86 35.30 0.76
Study III
Grain yield 62,441 2,142,783 89,737 143,935 0.89
Above-ground biomass 6,300 99,638 700 33,733 0.86
Harvest index 1.617e-04 5.063e-03 8.970e-05 1.128e-03 0.81
Grain N content 8.745e-03 3.832e-02 0.000 3.229e-02 0.91
NUpE 8.319e-04 3.603e-01 1.337e-15 1.041e-01 0.22
NUtE 3.94 23.07 0.00 21.80 0.87 a σ2 G genotypic variance; σ2 E environmental variance; σ2 (G × N-env) genotype × N-environment
variance; σ2 ε residual variance; H2 broad sense heritability. b Number of testing environments used for each trait in studies I, II, and III shown in
Supplemental Table 1.2.

47
Supplemental Table 1.7. Trait means for wheat lines and N rates in Study II at Painter during
the 2013-14 growing season. Analysis of variance and F-values provided for each effect and
their interaction.
Wheat line AGBMa HI GNC NUE NUpE NUtE
g m-2 % g kg-1 kg kg-1 kg kg-1 kg kg-1
Bess 770 db 0.34 de 17.3 b - - -
IL02-19483B 827 b-d 0.38 a-c 18.0 ab - - -
IL07-4415 818 b-d 0.39 ab 16.1 c - - -
KY06C-1003-139-8-3 900 a-d 0.36 b-d 17.1 b - - -
MD03W485-10-10 943 ab 0.35 c-e 18.3 a - - -
MD05W10208-11-8 849 b-d 0.38 a-d 18.1 ab - - -
MO080864 908 a-c 0.36 b-d 16.0 c - - -
OH06-150-57 983 a 0.32 e 17.5 ab - - -
OH08-161-78 898 a-d 0.35 c-e 17.3 ab - - -
OH08-172-42 900 a-c 0.38 a-d 16.1 c - - -
Sisson 791 cd 0.40 a 17.2 b - - -
VA08MAS-369 831 b-d 0.39 ab 17.3 ab - - -
N rate
67 765 b 0.34 c 16.7 b - - -
101 897 a 0.37 b 17.5 a - - -
134 943 a 0.40 a 17.4 a - - -
Effect
G (df = 11) 1.91 nsc 3.25 ** 4.81 *** - - -
N (df = 2) 16.06 *** 11.03 *** 5.48 ** - - -
G × N (df = 22) 0.73 ns 0.55 ns 1.23 ns - - - a Trait abbreviations include above-ground biomass (AGBM), harvest index (HI), grain N
content (GNC), N-use efficiency (NUE), N-uptake efficiency (NUpE), and N-utilization
efficiency (NUtE). b The LSD at P ≤ 0.05 is used to compare genotype and treatment means; trait means followed
by the same letter are not significantly different.
* Significant at the 0.05 probability level.
** Significant at the 0.01 probability level.
*** Significant at the 0.001 probability level. c ns, not significant.

48
Supplemental Table 1.8. Trait means for wheat lines and N rates in Study II at Warsaw during
the 2013-14 growing season. Analysis of variance and F-values provided for each effect and
their interaction.
Wheat line AGBMa HI GNC NUE NUpE NUtE
g m-2 % g kg-1 kg kg-1 kg kg-1 kg kg-1
Bess 1288 deb 0.39 b 21.2 bc - - -
IL02-19483B 1298 de 0.37 cd 21.3 bc - - -
IL07-4415 1338 b-e 0.42 a 20.8 bc - - -
KY06C-1003-139-8-3 1430 ab 0.38 bc 22.0 b - - -
MD03W485-10-10 1345 b-d 0.35 e 22.1 b - - -
MD05W10208-11-8 1378 b-d 0.36 de 24.7 a - - -
MO080864 1518 a 0.35 de 19.8 c - - -
OH06-150-57 1387 b-d 0.35 e 20.7 bc - - -
OH08-161-78 1316 c-e 0.39 b 21.2 bc - - -
OH08-172-42 1334 b-e 0.43 a 21.0 bc - - -
Sisson 1240 e 0.43 a 20.4 bc - - -
VA08MAS-369 1402 bc 0.39 b 21.4 bc - - -
N rate
67 1235 c 0.37 c 2.03 b - - -
101 1369 b 0.38 b 2.10 b - - -
134 1465 a 0.40 a 2.28 a - - -
Effect
G (df = 11) 4.08 *** 27.20 *** 3.11 ** - - -
N (df = 2) 40.51 *** 19.69 *** 13.12 *** - - -
G × N (df = 22) 1.30 nsc 1.67 ns 0.68 ns - - -
a Trait abbreviations include above-ground biomass (AGBM), harvest index (HI), grain N
content (GNC), N-use efficiency (NUE), N-uptake efficiency (NUpE), and N-utilization
efficiency (NUtE). b The LSD at P ≤ 0.05 is used to compare genotype and treatment means; trait means followed
by the same letter are not significantly different.
* Significant at the 0.05 probability level.
** Significant at the 0.01 probability level.
*** Significant at the 0.001 probability level. c ns, not significant.

49
Supplemental Table 1.9. Trait means for wheat lines and N rates in Study II at Painter during
the 2014-15 growing season. Analysis of variance and F-values provided for each effect and
their interaction. Wheat line AGBMa HI GNC NUE NUpE NUtE
g m-2 % g kg-1 kg kg-1 kg kg-1 kg kg-1
Bess 998 db 0.32 a-d 16.5 bc 32.2 c 0.89 b 37.3 ab
IL02-19483B 1044 cd 0.33 a 18.3 a-c 35.0 bc 0.97 ab 36.2 ab
IL07-4415 1109 b-d 0.32 a-c 16.9 a-c 35.1 bc 0.95 ab 37.2 ab
KY06C-1003-139-8-3 1142 a-d 0.32 a-d 15.7 c 38.8 ab 1.01 ab 38.1 a
MD03W485-10-10 1238 ab 0.27 cd 19.4 a 35.1 bc 1.07 ab 32.6 b
MD05W10208-11-8 1146 a-d 0.31 a-d 18.9 ab 36.1 a-c 1.05 ab 35.2 ab
MO080864 1306 a 0.26 d 16.7 a-c 35.2 bc 1.02 ab 35.1 ab
OH06-150-57 1198 a-d 0.27 b-d 17.8 a-c 33.9 c 0.94 ab 36.3 ab
OH08-161-78 1242 ab 0.31 a-d 16.1 bc 39.2 ab 1.02 ab 38.2 a
OH08-172-42 1269 ab 0.31 a-d 16.6 bc 39.2 ab 1.06 ab 39.1 a
Sisson 1206 a-c 0.28 a-d 18.2 a-c 35.2 bc 1.09 a 32.0 b
VA08MAS-369 1185 a-d 0.33 ab 17.2 a-c 39.8 a 1.04 ab 39.2 a
N rate
67 1168 a 0.29 b 16.2 b 47.8 a 1.24 a 39.9 a
101 1128 a 0.32 a 16.3 b 34.2 b 0.92 b 38.1 a
134 1224 a 0.30 ab 19.6 a 26.7 c 0.88 b 31.1 b
Effect
G (df = 11) 1.68 nsc 1.44 ns 1.30 ns 2.39 * 0.85 ns 1.57 ns
N (df = 2) 1.95 ns 2.22 ns 14.49 *** 192.80 *** 37.60 *** 24.88 ***
G × N (df = 22) 1.14 ns 1.99 * 1.30 ns 1.52 ns 1.12 ns 1.82 * a Trait abbreviations include above-ground biomass (AGBM), harvest index (HI), grain N
content (GNC), N-use efficiency (NUE), N-uptake efficiency (NUpE), and N-utilization
efficiency (NUtE). b The LSD at P ≤ 0.05 is used to compare genotype and treatment means; trait means followed
by the same letter are not significantly different.
* Significant at the 0.05 probability level.
** Significant at the 0.01 probability level.
*** Significant at the 0.001 probability level. c ns, not significant.

50
Supplemental Table 1.10. Trait means for wheat lines and N rates in Study II at Warsaw during
the 2014-15 growing season. Analysis of variance and F-values provided for each effect and
their interaction.
Wheat line AGBMa HI GNC NUE NUpE NUtE
g m-2 % g kg-1 kg kg-1 kg kg-1 kg kg-1
Bess 1147 abcb 0.43 a 15.2 b-d 50.4 ab 0.98 bc 51.7 a
IL02-19483B 1055 c 0.44 a 18.1 a 48.8 ab 1.08 ab 44.7 c-e
IL07-4415 1180 abc 0.35 c 15.4 b-d 42.0 b 0.96 c 44.0 de
KY06C-1003-139-8-3 1254 a 0.39 abc 15.4 b-d 50.6 ab 1.02 a-c 49.4 a-c
MD03W485-10-10 1181 abc 0.37 bc 18.2 a 45.4 ab 1.12 a 40.8 e
MD05W10208-11-8 1108 bc 0.41 ab 17.5 a 45.9 ab 1.05 a-c 43.6 de
MO080864 1261 a 0.42 ab 14.3 d 46.6 ab 1.02 a-c 53.2 a
OH06-150-57 1197 ab 0.42 a 15.4 b-d 53.1 a 1.02 a-c 51.9 a
OH08-161-78 1188 ab 0.43 a 15.9 b 53.5 a 1.10 a 48.8 a-c
OH08-172-42 1208 ab 0.40 abc 14.5 cd 42.7 b 0.98 bc 50.5 ac
Sisson 1202 ab 0.40 abc 15.8 bc 49.7 ab 1.07 a-c 46.2 b-d
VA08MAS-369 1222 ab 0.43 a 15.4 b-d 54.8 a 1.11 a 48.9 a-c
N rate
67 1035 c 0.42 a 14.2 c 59.3 a 1.19 a 53.6 a
101 1208 b 0.41 a 16.2 b 48.4 b 1.05 b 46.9 b
134 1308 a 0.40 a 17.4 a 38.2 c 0.89 c 43.0 c
Effect
G (df = 11) 1.61 nsc 2.16 * 8.34 *** 1.54 ns 1.86 ns 5.69 ***
N (df = 2) 35.63 *** 1.16 ns 51.77 *** 38.35 *** 55.18 *** 41.44 ***
G × N (df = 22) 1.57 ns 1.09 ns 1.09 ns 0.91 ns 1.24 ns 1.10 ns a Trait abbreviations include above-ground biomass (AGBM), harvest index (HI), grain N
content (GNC), N-use efficiency (NUE), N-uptake efficiency (NUpE), and N-utilization
efficiency (NUtE). b The LSD at P ≤ 0.05 is used to compare genotype and treatment means; trait means followed
by the same letter are not significantly different.
* Significant at the 0.05 probability level.
** Significant at the 0.01 probability level.
*** Significant at the 0.001 probability level. c ns, not significant.

51
Supplemental Table 1.11. Trait means for wheat lines and N rates in Study II at Blacksburg
during the 2015-16 growing season. Analysis of variance and F-values provided for each effect
and their interaction.
Wheat line AGBMa HI GNC NUE NUpE NUtE
g m-2 % g kg-1 kg kg-1 kg kg-1 kg kg-1
Bess 972 gb 0.40 b-e 16.5 c 41.5 g 1.57 bc 27.5 cd
IL02-19483B 1162 b-e 0.42 a-c 17.0 bc 51.6 ab 1.70 a-c 32.2 a-c
IL07-4415 1144 c-e 0.43 a 15.6 d 52.6 a 1.43 c 37.5 a
KY06C-1003-139-8-3 1105 d-f 0.42 ab 16.4 cd 49.2 bc 1.51 bc 34.1 ab
MD03W485-10-10 1107 d-f 0.38 e-g 18.0 a 44.8 f 1.65 a-c 27.6 cd
MD05W10208-11-8 1092 ef 0.40 d-f 18.2 a 46.3 ef 1.44 c 32.0 a-c
MO080864 1195 a-c 0.37 g 16.4 cd 47.1 c-f 1.88 a 25.9 d
OH06-150-57 1185 a-d 0.38 e-g 16.1 cd 48.1 c-e 1.53 bc 31.9 bc
OH08-161-78 1239 ab 0.38 fg 17.4 ab 48.8 cd 1.53 bc 32.0 a-c
OH08-172-42 1261 a 0.40 c-f 16.7 bc 53.7 a 1.53 bc 36.5 ab
Sisson 1046 fg 0.42 a-d 17.6 ab 46.5 d-f 1.73 ab 27.0 cd
VA08MAS-369 1205 a-c 0.40 c-f 16.9 bc 51.4 ab 1.50 bc 34.4 ab
N rate
67 1121 b 0.39 b 1.62 c 65.2 a 2.00 a 34.5 a
101 1131 b 0.41 a 1.67 b 45.3 b 1.51 b 30.6 b
134 1176 a 0.40 ab 1.78 a 34.9 c 1.24 c 29.5 b
Effect
G (df = 11) 8.08 *** 6.41 *** 6.09 *** 16.91 *** 1.65 ns 3.75 ***
N (df = 2) 4.07 * 3.35 * 27.63 *** 1290.02 *** 56.44 *** 7.11 **
G × N (df = 22) 2.10 * 2.30 ** 1.42 nsc 1.89 * 1.62 ns 2.07 * a Trait abbreviations include above-ground biomass (AGBM), harvest index (HI), grain N
content (GNC), N-use efficiency (NUE), N-uptake efficiency (NUpE), and N-utilization
efficiency (NUtE). b The LSD at P ≤ 0.05 is used to compare genotype and treatment means; trait means followed
by the same letter are not significantly different.
* Significant at the 0.05 probability level.
** Significant at the 0.01 probability level.
*** Significant at the 0.001 probability level. c ns, not significant.
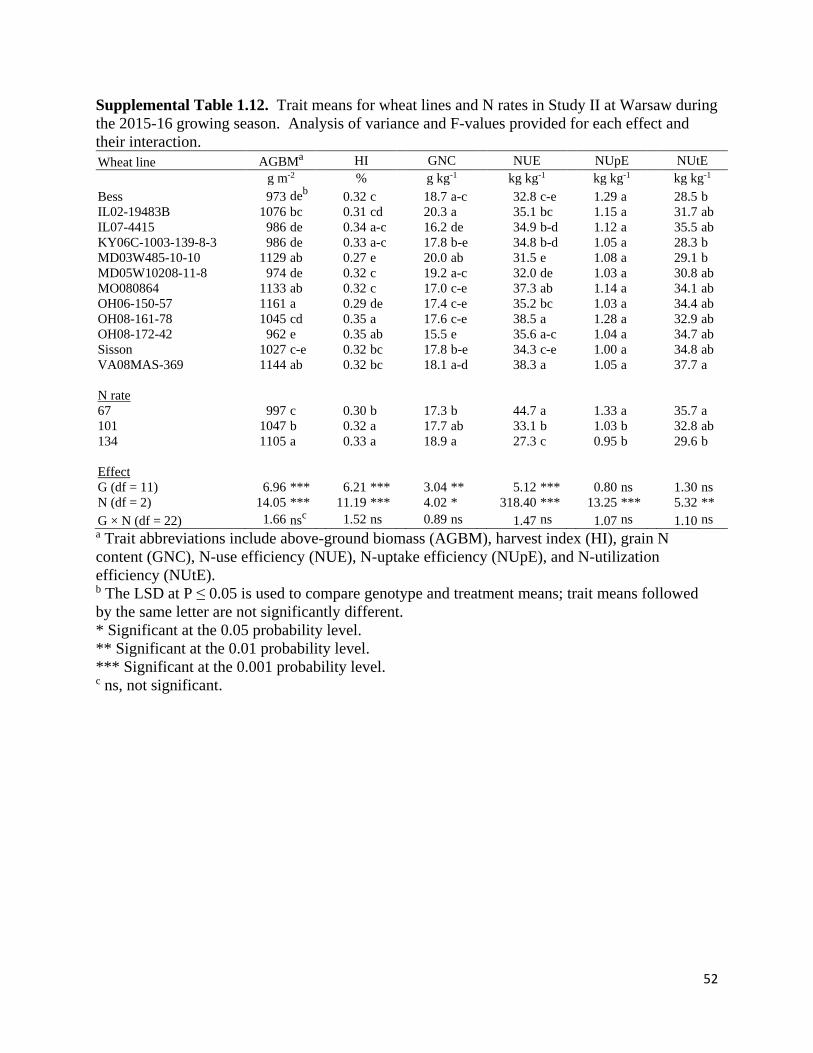
52
Supplemental Table 1.12. Trait means for wheat lines and N rates in Study II at Warsaw during
the 2015-16 growing season. Analysis of variance and F-values provided for each effect and
their interaction.
Wheat line AGBMa HI GNC NUE NUpE NUtE
g m-2 % g kg-1 kg kg-1 kg kg-1 kg kg-1
Bess 973 deb 0.32 c 18.7 a-c 32.8 c-e 1.29 a 28.5 b
IL02-19483B 1076 bc 0.31 cd 20.3 a 35.1 bc 1.15 a 31.7 ab
IL07-4415 986 de 0.34 a-c 16.2 de 34.9 b-d 1.12 a 35.5 ab
KY06C-1003-139-8-3 986 de 0.33 a-c 17.8 b-e 34.8 b-d 1.05 a 28.3 b
MD03W485-10-10 1129 ab 0.27 e 20.0 ab 31.5 e 1.08 a 29.1 b
MD05W10208-11-8 974 de 0.32 c 19.2 a-c 32.0 de 1.03 a 30.8 ab
MO080864 1133 ab 0.32 c 17.0 c-e 37.3 ab 1.14 a 34.1 ab
OH06-150-57 1161 a 0.29 de 17.4 c-e 35.2 bc 1.03 a 34.4 ab
OH08-161-78 1045 cd 0.35 a 17.6 c-e 38.5 a 1.28 a 32.9 ab
OH08-172-42 962 e 0.35 ab 15.5 e 35.6 a-c 1.04 a 34.7 ab
Sisson 1027 c-e 0.32 bc 17.8 b-e 34.3 c-e 1.00 a 34.8 ab
VA08MAS-369 1144 ab 0.32 bc 18.1 a-d 38.3 a 1.05 a 37.7 a
N rate
67 997 c 0.30 b 17.3 b 44.7 a 1.33 a 35.7 a
101 1047 b 0.32 a 17.7 ab 33.1 b 1.03 b 32.8 ab
134 1105 a 0.33 a 18.9 a 27.3 c 0.95 b 29.6 b
Effect
G (df = 11) 6.96 *** 6.21 *** 3.04 ** 5.12 *** 0.80 ns 1.30 ns
N (df = 2) 14.05 *** 11.19 *** 4.02 * 318.40 *** 13.25 *** 5.32 **
G × N (df = 22) 1.66 nsc 1.52 ns 0.89 ns 1.47 ns 1.07 ns 1.10 ns a Trait abbreviations include above-ground biomass (AGBM), harvest index (HI), grain N
content (GNC), N-use efficiency (NUE), N-uptake efficiency (NUpE), and N-utilization
efficiency (NUtE). b The LSD at P ≤ 0.05 is used to compare genotype and treatment means; trait means followed
by the same letter are not significantly different.
* Significant at the 0.05 probability level.
** Significant at the 0.01 probability level.
*** Significant at the 0.001 probability level. c ns, not significant.

53
Supplemental Table 1.13. Significant genotype by N rate interaction effects in Study II under
67, 101, and 134 kg N ha-1 in Painter (15PT) and Blacksburg (16BB) during the 2014-15 and
2015-16 growing seasons, respectively.
Wheat line Harvest index in 15PT N-utilization efficiency in 15PT
67 101 134 67 101 134
% kg kg-1
Bess 0.33 b-fa 0.34 a-f 0.30 c-f 32.6 b-f 29.1 c-f 23.9 f
IL02-19483B 0.25 f 0.42 ab 0.34 b-f 31.0 b-f 34.7 a-f 29.3 c-f
IL07-4415 0.44 a 0.27 d-f 0.26 d-f 36.2 a-f 29.3 c-f 41.0 a-d
KY06C-1003-139-8-3 0.33 b-f 0.30 c-f 0.34 b-f 28.6 c-f 30.1 b-f 26.1 ef
MD03W485-10-10 0.26 d-f 0.28 d-f 0.26 d-f 31.4 b-f 27.8 d-f 28.0 d-f
MD05W10208-11-8 0.24 f 0.34 b-f 0.36 a-e 34.6 b-f 28.3 d-f 29.3 c-f
MO080864 0.25 ef 0.27 d-f 0.26 d-f 28.5 c-f 38.8 a-e 35.0 a-f
OH06-150-57 0.28 d-f 0.27 d-f 0.27 d-f 39.5 a-d 35.2 a-f 28.5 c-f
OH08-161-78 0.30 c-f 0.36 a-e 0.27 d-f 33.4 b-f 36.0 a-f 29.2 c-f
OH08-172-42 0.23 f 0.40 a-c 0.30 c-f 43.3 ab 30.5 b-f 30.2 b-f
Sisson 0.25 f 0.28 d-f 0.32 b-f 41.5 a-c 34.5 b-f 28.2 d-f
VA08MAS-369 0.30 c-f 0.33 b-f 0.36 a-d 47.9 a 39.0 a-e 26.3 ef
Wheat line Above-ground biomass in 16BB Harvest index in 16BB
67 101 134 67 101 134
g m-2 %
Bess 919 m 988 k-m 1010 j-m 0.40 c-j 0.40 f-l 0.40 c-j
IL02-19483B 1232 b-e 1098 e-l 1156 c-i 0.38 h-m 0.45 ab 0.44 a-e
IL07-4415 1211 b-e 1122 c-l 1099 e-k 0.40 f-l 0.43 a-f 0.46 a
KY06C-1003-139-8-3 1020 i-m 1072 g-l 1222 b-e 0.42 b-h 0.44 a-c 0.41 b-i
MD03W485-10-10 1144 c-j 1067 g-l 1111 d-l 0.36 lm 0.39 g-l 0.40 e-k
MD05W10208-11-8 1127 c-k 1032 h-m 1116 c-l 0.38 h-m 0.41 b-i 0.40 e-j
MO080864 1119 c-l 1240 b-e 1225 b-e 0.38 g-m 0.38 i-m 0.35 m
OH06-150-57 1222 b-e 1174 c-h 1159 c-i 0.36 lm 0.39 g-l 0.39 g-l
OH08-161-78 1156 c-i 1141 c-j 1420 a 0.38 h-m 0.39 g-l 0.36 k-m
OH08-172-42 1184 c-g 1345 ab 1256 bc 0.42 b-g 0.37 j-m 0.41 b-i
Sisson 980 lm 1052 g-m 1105 d-l 0.41 c-i 0.44 a-d 0.40 d-j
VA08MAS-369 1134 c-j 1247 b-d 1235 b-e 0.41 c-i 0.39 g-l 0.39 g-l
Wheat line N-use efficiency in 16BB N-utilization efficiency in 16BB
67 101 134 67 101 134
kg kg-1 kg kg-1
Bess 55.5 g 38.6 l-n 30.4 r 26.7 g-j 28.2 e-j 27.5 f-j
IL02-19483B 68.5 b-d 48.7 h 37.6 m-o 29.5 c-j 35.0 b-g 32.2 b-i
IL07-4415 71.8 ab 48.0 hi 37.9 l-n 53.0 a 30.0 b-j 29.5 c-j
KY06C-1003-139-8-3 63.6 ef 47.0 hi 37.2 m-p 31.8 b-i 33.2 b-h 37.3 b-e
MD03W485-10-10 60.7 f 40.7 k-m 32.9 qr 29.6 c-j 23.3 ij 30.0 b-j
MD05W10208-11-8 63.6 ef 41.9 j-l 33.4 p-r 37.9 b-d 31.5 b-i 26.7 f-j
MO080864 63.9 ef 45.8 h-j 31.6 r 24.8 h-j 31.2 b-j 21.7 j
OH06-150-57 65.1 de 45.6 h-k 33.4 o-r 38.3 bc 28.8 c-j 28.5 d-j
OH08-161-78 65.4 c-e 43.9 i-k 37.2 m-p 36.4 b-f 29.3 c-j 30.3 b-j
OH08-172-42 74.0 a 48.9 h 38.2 l-n 38.3 bc 39.4 b 31.9 b-i
Sisson 60.6 f 45.9 h-j 33.2 p-r 29.7 c-j 26.5 g-j 25.0 h-j
VA08MAS-369 69.5 bc 48.5 h 36.3 n-q 38.3 bc 30.9 b-j 34.0 b-h a The LSD at P ≤ 0.05 is used to compare genotype and treatment means; trait means followed by
the same letter are not significantly different.

54
Supplemental Table 1.14. Trait means for wheat lines and N rates in Study III at Blacksburg
during the 2015-16 growing season. Analysis of variance and F-values provided for each effect
and their interaction. Wheat line AGBMa HI GNC NUE NUpE NUtE
g m-2 % g kg-1 kg kg-1 kg kg-1 kg kg-1
Bess 1309 db 0.31 cd 19.9 a-c 70.5 de 2.04 a-c 34.2 d
MD03W485-10-10 1448 bc 0.32 a-d 20.5 ab 76.2 c-e 2.12 a-c 36.2 cd
OH08-161-78 1532 ab 0.31 cd 21.0 a 83.6 a-d 2.32 ab 35.6 cd
OH08-172-42 1463 b 0.32 a-c 17.0 d 82.7 a-d 1.78 c 45.5 a
Sisson 1355 cd 0.33 ab 20.3 a-c 93.1 a 2.52 a 36.7 cd
SS520 1297 d 0.30 d 19.7 a-c 63.6 e 1.88 bc 34.9 cd
VA05W-151 1440 bc 0.33 ab 18.6 b-d 87.8 a-c 2.09 a-c 41.5 ab
VA07W-415 1260 d 0.32 b-d 19.1 a-d 75.8 c-e 1.92 bc 38.8 bc
VA08MAS-369 1572 a 0.33 a 17.3 d 91.0 ab 2.19 a-c 42.6 ab
VA09W-73 1516 ab 0.31 cd 18.6 b-d 75.4 c-e 2.06 a-c 36.4 cd
Yorktown 1496 ab 0.32 b-d 18.4 cd 90.9 ab 2.31 a-c 39.3 bc
N rate
67 1431 a 0.32 a 18.2 b 103.9 a 2.59 a 40.8 a
134 1421 a 0.32 a 20.1 a 58.0 b 1.64 b 35.9 b
Effect
G (df = 10) 8.05 *** 2.68 * 3.43 ** 3.51 ** 1.41 ns 5.48 ***
N (df = 1) 0.19 nsc 0.72 ns 21.35 *** 227.08 *** 75.17 *** 29.12 ***
G × N (df = 10) 1.12 ns 0.59 ns 2.97 * 2.27 ns 2.49 * 4.03 ** a Trait abbreviations include above-ground biomass (AGBM), harvest index (HI), grain N
content (GNC), N-use efficiency (NUE), N-uptake efficiency (NUpE), and N-utilization
efficiency (NUtE). b The LSD at P ≤ 0.05 is used to compare genotype and treatment means; trait means followed
by the same letter are not significantly different.
* Significant at the 0.05 probability level.
** Significant at the 0.01 probability level.
*** Significant at the 0.001 probability level. c ns, not significant.
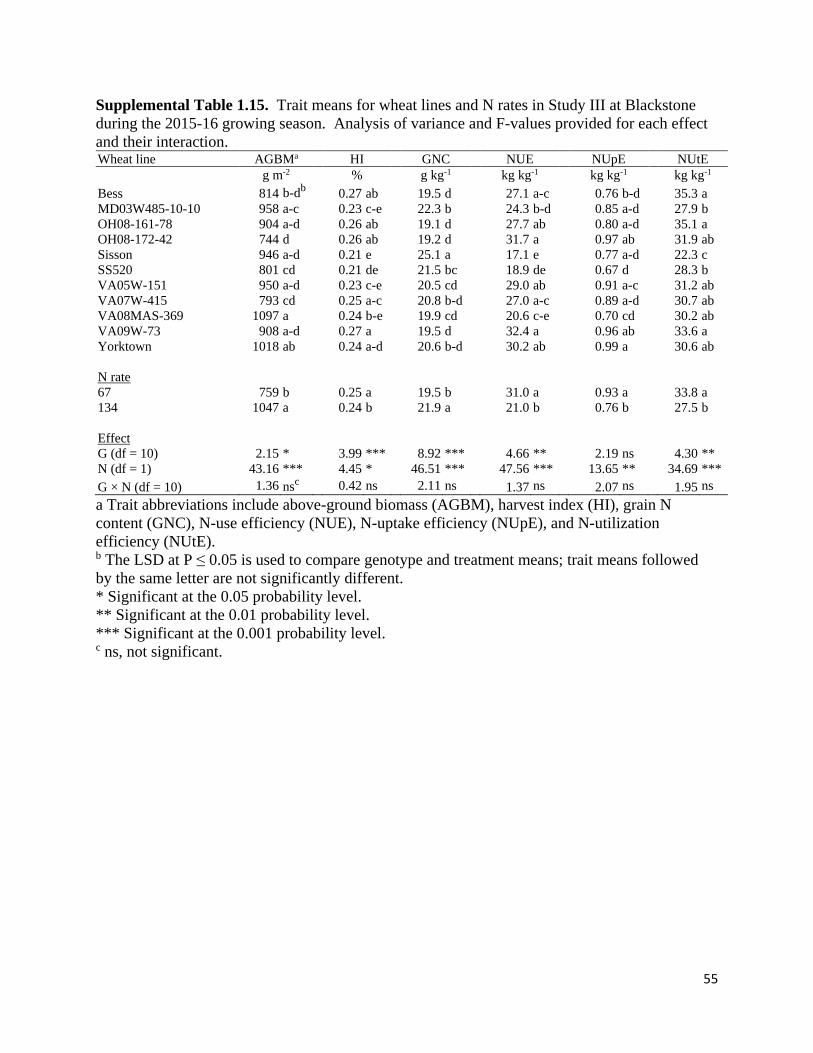
55
Supplemental Table 1.15. Trait means for wheat lines and N rates in Study III at Blackstone
during the 2015-16 growing season. Analysis of variance and F-values provided for each effect
and their interaction. Wheat line AGBMa HI GNC NUE NUpE NUtE
g m-2 % g kg-1 kg kg-1 kg kg-1 kg kg-1
Bess 814 b-db 0.27 ab 19.5 d 27.1 a-c 0.76 b-d 35.3 a
MD03W485-10-10 958 a-c 0.23 c-e 22.3 b 24.3 b-d 0.85 a-d 27.9 b
OH08-161-78 904 a-d 0.26 ab 19.1 d 27.7 ab 0.80 a-d 35.1 a
OH08-172-42 744 d 0.26 ab 19.2 d 31.7 a 0.97 ab 31.9 ab
Sisson 946 a-d 0.21 e 25.1 a 17.1 e 0.77 a-d 22.3 c
SS520 801 cd 0.21 de 21.5 bc 18.9 de 0.67 d 28.3 b
VA05W-151 950 a-d 0.23 c-e 20.5 cd 29.0 ab 0.91 a-c 31.2 ab
VA07W-415 793 cd 0.25 a-c 20.8 b-d 27.0 a-c 0.89 a-d 30.7 ab
VA08MAS-369 1097 a 0.24 b-e 19.9 cd 20.6 c-e 0.70 cd 30.2 ab
VA09W-73 908 a-d 0.27 a 19.5 d 32.4 a 0.96 ab 33.6 a
Yorktown 1018 ab 0.24 a-d 20.6 b-d 30.2 ab 0.99 a 30.6 ab
N rate
67 759 b 0.25 a 19.5 b 31.0 a 0.93 a 33.8 a
134 1047 a 0.24 b 21.9 a 21.0 b 0.76 b 27.5 b
Effect
G (df = 10) 2.15 * 3.99 *** 8.92 *** 4.66 ** 2.19 ns 4.30 **
N (df = 1) 43.16 *** 4.45 * 46.51 *** 47.56 *** 13.65 ** 34.69 ***
G × N (df = 10) 1.36 nsc 0.42 ns 2.11 ns 1.37 ns 2.07 ns 1.95 ns
a Trait abbreviations include above-ground biomass (AGBM), harvest index (HI), grain N
content (GNC), N-use efficiency (NUE), N-uptake efficiency (NUpE), and N-utilization
efficiency (NUtE). b The LSD at P ≤ 0.05 is used to compare genotype and treatment means; trait means followed
by the same letter are not significantly different.
* Significant at the 0.05 probability level.
** Significant at the 0.01 probability level.
*** Significant at the 0.001 probability level. c ns, not significant.

56
Supplemental Table 1.16. Trait means for wheat lines and N rates in Study III at Warsaw
during the 2015-16 growing season. Analysis of variance and F-values provided for each effect
and their interaction. Wheat line AGBMa HI GNC NUE NUpE NUtE
g m-2 % g kg-1 kg kg-1 kg kg-1 kg kg-1
Bess 939 a-cb 0.41 a-d 17.7 c 48.2 ab 1.18 a-d 40.6 bc
MD03W485-10-10 1028 ab 0.34 f 19.0 ab 41.6 b-d 1.20 a-c 34.6 f
OH08-161-78 928 bc 0.42 ab 16.3 d 51.7 a 1.16 a-d 44.3 a
OH08-172-42 807 d 0.44 a 16.3 d 48.2 ab 1.10 b-d 43.5 ab
Sisson 880 cd 0.41 a-d 18.6 a-c 45.7 a-c 1.23 a-c 37.3 d-f
SS520 910 b-d 0.39 b-d 18.6 a-c 39.4 cd 1.08 cd 36.3 ef
VA05W-151 1001 ab 0.38 cd 19.2 a 41.6 b-d 1.17 a-d 35.6 f
VA07W-415 999 ab 0.41 a-c 18.0 a-c 51.0 a 1.29 ab 39.4 c-e
VA08MAS-369 1048 a 0.38 de 18.5 a-c 42.3 b-d 1.14 b-d 37.2 d-f
VA09W-73 1003 ab 0.41 a-d 17.9 bc 53.7 a 1.33 a 40.0 dc
Yorktown 1058 a 0.35 ef 18.0 a-c 37.0 d 0.99 d 36.9 d-f
N rate
67 859 b 0.38 b 17.2 b 53.5 a 1.32 a 40.5 a
134 1068 a 0.41 a 18.8 a 37.5 b 1.02 b 36.9 b
Effect
G (df = 10) 3.71 ** 7.59 *** 4.76 ** 3.68 ** 2.14 ns 7.68 ***
N (df = 1) 74.15 *** 10.13 ** 36.21 *** 85.44 *** 59.79 *** 26.59 ***
G × N (df = 10) 0.63 nsc 1.91 ns 0.32 ns 0.98 ns 0.53 ns 0.98 ns a Trait abbreviations include above-ground biomass (AGBM), harvest index (HI), grain N
content (GNC), N-use efficiency (NUE), N-uptake efficiency (NUpE), and N-utilization
efficiency (NUtE). b The LSD at P ≤ 0.05 is used to compare genotype and treatment means; trait means followed
by the same letter are not significantly different.
* Significant at the 0.05 probability level.
** Significant at the 0.01 probability level.
*** Significant at the 0.001 probability level. c ns, not significant.

57
Supplemental Table 1.17. Trait means for wheat lines and N rates in Study III at Blacksburg
during the 2016-17 growing season. Analysis of variance and F-values provided for each effect
and their interaction. Wheat line AGBMa HI GNC NUE NUpE NUtE
g m-2 % g kg-1 kg kg-1 kg kg-1 kg kg-1
Bess 1326 bcb 0.47 a 20.3 cd 77.0 ab 2.02 a-c 38.0 ab
MD03W485-10-10 1214 c 0.40 bc 24.3 a 58.4 d 2.05 a-c 28.3 d
OH08-161-78 1535 a-c 0.41 bc 20.6 cd 76.4 ab 2.11 a-c 35.6 a-c
OH08-172-42 1434 bc 0.43 ab 19.5 d 86.0 a 2.25 ab 38.5 ab
Sisson 1205 c 0.41 a-c 22.3 b 63.8 cd 1.98 bc 31.6 cd
SS520 1307 bc 0.43 ab 20.7 b-d 75.0 a-c 2.11 a-c 34.8 a-c
VA05W-151 1397 bc 0.42 ab 21.4 bc 76.0 a-c 2.30 a 32.7 cd
VA07W-415 1609 ab 0.44 ab 19.3 d 76.6 ab 1.91 c 39.7 a
VA08MAS-369 1563 ab 0.40 bc 21.5 bc 76.2 ab 2.26 ab 33.8 bc
VA09W-73 1784 a 0.38 bc 20.5 cd 72.9 bc 2.08 a-c 34.9 a-c
Yorktown 1786 a 0.35 c 21.2 bc 58.1 d 1.82 c 32.0 cd
N rate
67 1490 a 0.40 a 19.8 b 93.9 a 2.53 a 37.7 a
134 1449 a 0.42 a 22.4 a 50.9 b 1.63 b 31.4 b
Effect
G (df = 10) 3.11 ** 2.09 * 5.70 *** 4.05 *** 2.06 ns 3.60 **
N (df = 1) 0.34 nsc 2.49 ns 55.97 *** 275.31 *** 204.83 *** 34.58 ***
G × N (df = 10) 0.82 ns 0.70 ns 0.47 ns 0.87 ns 0.69 ns 0.49 ns a Trait abbreviations include above-ground biomass (AGBM), harvest index (HI), grain N
content (GNC), N-use efficiency (NUE), N-uptake efficiency (NUpE), and N-utilization
efficiency (NUtE). b The LSD at P ≤ 0.05 is used to compare genotype and treatment means; trait means followed
by the same letter are not significantly different.
* Significant at the 0.05 probability level.
** Significant at the 0.01 probability level.
*** Significant at the 0.001 probability level. c ns, not significant.

58
Supplemental Table 1.18. Trait means for wheat lines and N rates in Study III at Blackstone
during the 2016-17 growing season. Analysis of variance and F-values provided for each effect
and their interaction. Wheat line AGBMa HI GNC NUE NUpE NUtE
g m-2 % g kg-1 kg kg-1 kg kg-1 kg kg-1
Bess 525 db 0.41 a 18.4 d-f 53.4 a-c 1.66 b 31.8 ab
MD03W485-10-10 677 a-c 0.37 b-d 21.5 ab 53.4 a-c 1.98 ab 27.3 cd
OH08-161-78 747 ab 0.37 a-d 18.0 ef 60.0 ab 1.78 ab 32.9 a
OH08-172-42 531 d 0.40 ab 17.7 f 51.1 bc 1.73 b 30.1 a-c
Sisson 547 cd 0.40 ab 19.9 b-d 52.7 a-c 1.81 ab 29.0 a-c
SS520 544 cd 0.34 d 22.3 a 43.4 c 1.87 ab 22.7 e
VA05W-151 658 a-d 0.36 cd 21.2 ab 52.5 a-c 2.18 a 24.4 de
VA07W-415 642 a-d 0.40 ab 18.9 c-f 57.4 ab 1.83 ab 30.5 a-c
VA08MAS-369 768 a 0.38 a-d 19.4 c-f 61.6 a 2.04 ab 30.1 a-c
VA09W-73 630 b-d 0.40 a-c 19.5 c-e 53.4 a-c 1.95 ab 28.0 b-d
Yorktown 698 ab 0.38 a-d 20.2 bc 54.6 ab 1.95 ab 28.7 a-d
N rate
67 645 a 0.37 a 18.5 b 68.6 a 2.28 a 30.8 a
134 622 a 0.39 a 21.0 a 39.3 b 1.50 b 26.6 b
Effect
G (df = 10) 3.34 ** 2.08 * 5.94 *** 1.76 ns 1.05 ns 3.87 ***
N (df = 1) 0.65 nsc 3.03 ns 46.79 *** 179.24 *** 80.51 *** 20.55 ***
G × N (df = 10) 0.40 ns 0.46 ns 0.84 ns 0.72 ns 0.31 ns 0.39 ns a Trait abbreviations include above-ground biomass (AGBM), harvest index (HI), grain N
content (GNC), N-use efficiency (NUE), N-uptake efficiency (NUpE), and N-utilization
efficiency (NUtE). b The LSD at P ≤ 0.05 is used to compare genotype and treatment means; trait means followed
by the same letter are not significantly different.
* Significant at the 0.05 probability level.
** Significant at the 0.01 probability level.
*** Significant at the 0.001 probability level. c ns, not significant.

59
Supplemental Table 1.19. Trait means for wheat lines and N rates in Study III at Warsaw
during the 2016-17 growing season. Analysis of variance and F-values provided for each effect
and their interaction. Wheat line AGBMa HI GNC NUE NUpE NUtE
g m-2 % g kg-1 kg kg-1 kg kg-1 kg kg-1
Bess 1028 db 0.45 bc 17.2 b 64.9 c-e 1.69 a-d 38.3 bc
MD03W485-10-10 1020 d 0.43 de 18.4 a 61.8 c-f 1.78 a-c 34.8 d
OH08-161-78 1056 d 0.44 c-e 16.4 b 54.6 f 1.47 d 37.7 b-d
OH08-172-42 1064 cd 0.46 bc 15.1 c 77.2 a 1.89 ab 40.4 ab
Sisson 1056 d 0.46 ab 17.1 b 61.3 c-f 1.62 b-d 37.6 b-d
SS520 1120 b-d 0.43 e 16.7 b 56.7 ef 1.52 cd 37.1 cd
VA05W-151 1167 a-c 0.45 bc 16.6 b 57.8 d-f 1.52 cd 38.6 a-c
VA07W-415 1058 d 0.48 a 16.4 b 67.7 a-d 1.63 a-d 41.8 a
VA08MAS-369 1231 a 0.44 c-e 16.9 b 68.3 a-c 1.85 ab 36.9 cd
VA09W-73 1185 ab 0.45 b-d 17.0 b 74.1 ab 1.93 a 38.2 bc
Yorktown 1163 a-c 0.42 e 17.1 b 64.0 c-f 1.75 a-d 36.8 cd
N rate
67 1030 b 0.43 b 15.4 b 77.7 a 1.94 a 40.3 a
134 1179 a 0.46 a 18.3 a 51.1 b 1.45 b 35.8 b
Effect
G (df = 10) 3.81 *** 6.47 *** 4.62 *** 3.98 *** 2.23 * 2.57 *
N (df = 1) 44.73 *** 62.08 *** 171.64 *** 154.29 *** 61.97 *** 41.5 ***
G × N (df = 10) 1.53 nsc 2.10 * 1.62 ns 2.21 * 1.74 ns 1.62 ns a Trait abbreviations include above-ground biomass (AGBM), harvest index (HI), grain N
content (GNC), N-use efficiency (NUE), N-uptake efficiency (NUpE), and N-utilization
efficiency (NUtE). b The LSD at P ≤ 0.05 is used to compare genotype and treatment means; trait means followed
by the same letter are not significantly different.
* Significant at the 0.05 probability level.
** Significant at the 0.01 probability level.
*** Significant at the 0.001 probability level. c ns, not significant.

60
Supplemental Table 1.20. Significant genotype by N rate interaction effects in Study III under
67 and 134 kg N ha-1 in Blacksburg during the 2015-16 growing season.
Wheat line Grain N content N-uptake efficiency N-utilization efficiency
67 134 67 134 67 134
g kg-1 kg kg-1 kg kg-1
Bess 18.3 d-ga 21.5 a-c 2.49 b-d 1.59 e-g 35.94 e-j 32.42 h-j
MD03W485-10-10 20.1 a-e 21.0 a-d 2.64 a-d 1.59 e-g 37.39 d-i 35.03 f-j
OH08-161-78 19.6 a-f 22.4 a 2.58 b-d 2.07 d-f 39.03 c-g 32.12 ij
OH08-172-42 14.6 h 19.5 b-f 2.07 d-f 1.49 fg 51.61 a 39.43 c-g
Sisson 19.0 b-g 21.7 ab 3.14 ab 1.90 d-g 39.16 c-g 34.32 g-j
SS520 21.1 a-d 18.4 d-g 2.56 b-d 1.20 g 32.30 ij 37.59 d-i
VA05W-151 16.9 f-h 20.4 a-e 2.26 c-e 1.93 d-g 48.09 ab 34.96 f-j
VA07W-415 17.7 e-g 20.5 a-e 2.39 b-d 1.45 fg 41.94 b-e 35.65 e-j
VA08MAS-369 17.7 e-g 16.9 f-h 2.87 a-c 1.50 fg 41.03 c-f 44.08 bc
VA09W-73 16.3 gh 20.9 a-d 2.09 d-f 2.03 d-f 42.75 b-d 30.12 j
Yorktown 18.7 c-g 18.2 d-g 3.36 a 1.25 g 39.87 c-g 38.73 c-h a The LSD at P ≤ 0.05 is used to compare genotype and treatment means; trait means followed by
the same letter are not significantly different.
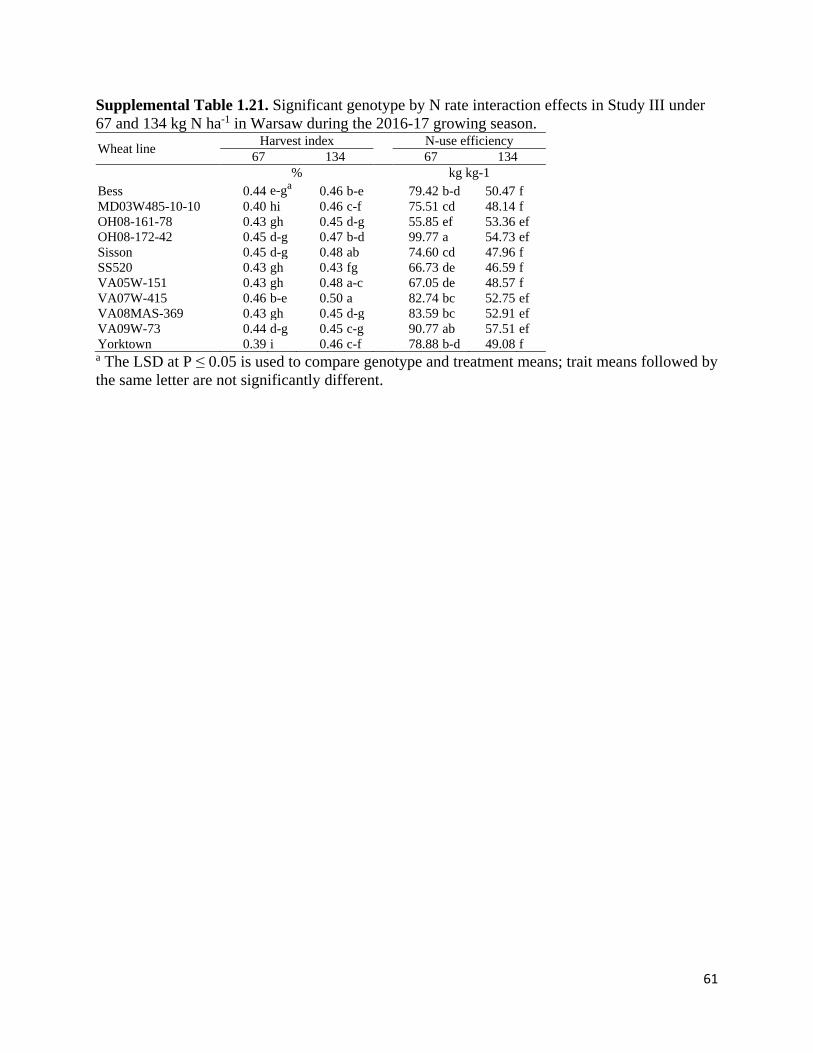
61
Supplemental Table 1.21. Significant genotype by N rate interaction effects in Study III under
67 and 134 kg N ha-1 in Warsaw during the 2016-17 growing season.
Wheat line Harvest index N-use efficiency
67 134 67 134
% kg kg-1
Bess 0.44 e-ga 0.46 b-e 79.42 b-d 50.47 f
MD03W485-10-10 0.40 hi 0.46 c-f 75.51 cd 48.14 f
OH08-161-78 0.43 gh 0.45 d-g 55.85 ef 53.36 ef
OH08-172-42 0.45 d-g 0.47 b-d 99.77 a 54.73 ef
Sisson 0.45 d-g 0.48 ab 74.60 cd 47.96 f
SS520 0.43 gh 0.43 fg 66.73 de 46.59 f
VA05W-151 0.43 gh 0.48 a-c 67.05 de 48.57 f
VA07W-415 0.46 b-e 0.50 a 82.74 bc 52.75 ef
VA08MAS-369 0.43 gh 0.45 d-g 83.59 bc 52.91 ef
VA09W-73 0.44 d-g 0.45 c-g 90.77 ab 57.51 ef
Yorktown 0.39 i 0.46 c-f 78.88 b-d 49.08 f a The LSD at P ≤ 0.05 is used to compare genotype and treatment means; trait means followed by
the same letter are not significantly different.

62
CHAPTER II:
IDENTIFICATION OF QUANTITATIVE TRAIT LOCI FOR
NITROGEN USE EFFICIENCY IN SOFT RED WINTER WHEAT
Kyle Brasier, Brian Ward, Joseph Oakes, Maria Balota, Paul Davis, Myron Fountain, Gina
Brown-Guedira, Clay Sneller, Wade Thomason, and Carl Griffey
K.G. Brasier, M. Balota, W.E. Thomason, and C.A. Griffey, School of Plant and Environmental
Sciences, Virginia Tech, Blacksburg, VA 24061; B.P. Ward, M. Fountain, and G. Brown-
Guedira, United States Department of Agriculture – Agricultural Research Service, North
Carolina State University, Raleigh, North Carolina 27695; J.C. Oakes, Eastern Virginia
Agricultural Research and Extension Center, Virginia Tech, Warsaw, VA 22572; P. Davis, Davis
Produce, New Kent, VA 22572; C.H. Sneller, Department of Horticulture and Crop Science, The
Ohio State University, Wooster, OH 44691.
Abbreviation: AGBM, above-ground biomass; DH, doubled haploid; FHB, Fusarium head
blight; G, genotype; GBS, genotyping-by-sequencing; GWAS, genome-wide association study;
HN, high nitrogen rate; LN, low nitrogen rate; LOD, logarithm of odds; N, nitrogen; NK, New
Kent, VA location; NUE, nitrogen use efficiency; NUpE, nitrogen uptake efficiency; NUte,
nitrogen utilization efficiency; QTL, quantitative trait loci; RIL, recombinant inbred line; SNP,
single nucleotide polymorphism; SSR, simple sequence repeat; WR, Warsaw, VA location.
63
Abstract
Maintaining winter wheat (Triticum aestivum L.) productivity with fewer or more
efficient nitrogen (N) inputs will enable growers to increase profitability and reduce the negative
environmental impacts associated with intensive agriculture. However, yield trials conducted
under multiple N conditions are expensive and not feasible for wheat breeders, who would
benefit greatly from the identification and application of genetic markers associated with
nitrogen use efficiency (NUE). To investigate the genetic regulation of N response, two bi-
parental mapping populations were developed and grown in four site-seasons under low and high
N rates. Both populations utilized a high NUE parent (VA05W-151 and VA09W-52) and shared
a common low NUE parent, ‘Yorktown.’ The two populations comprised of 136 RILs
(Yorktown × VA05W-151) and 138 DHs (Yorktown × VA09W-52). Phenotypic data was
collected on parental lines and their progeny for 11 N-related traits and genotypes were
characterized using a genotyping-by-sequencing platform to detect more than 2,400 high quality
single nucleotide polymorphisms in each population. A total of 130 quantitative trait loci (QTL)
were detected on 20 chromosomes six of which were associated with NUE in multiple testing
environments. Three of the six QTL for NUE were associated with known photoperiod and
disease resistance genes, two did not co-localize with known disease or morphological genes and
were reported in previous investigations, and one QTL, QNue.151-1D, appeared novel. The
reproducible NUE QTL on 1D, 6A, 7A, and 7D had LOD scores ranging from 2.63 to 8.33 and
explained 0.97 to 18.1 % of the phenotypic variation. The QTL identified in this study have
potential for marker-assisted breeding for NUE in soft red winter wheat.

64
Introduction
Wheat (Triticum aestivum L.) is among the most widely grown crops in the world and
accounts for roughly 20 % of the total dietary calories and protein consumed per annum
(Shiferaw et al., 2013). It is therefore crucial to continue improvement of wheat productivity and
quality to meet grain demands in an era of increasing human population. Since the onset of the
Green Revolution in the mid-20th century, wheat yield gains in the Eastern United States’ soft
red winter wheat growing region have been largely attributed to active selection for performance
under intensified nitrogen (N) management conditions (Tilman et al., 2002). However, a
majority of the N applied to agricultural crops in this region is not harvested and thus subject to
loss from the plant-soil system (Swaney et al., 2018). The non-harvested N can be associated
with emissions of nitrous oxides (Galloway et al., 2004), runoff and leaching of nitrate (Liu et
al., 2019), and the degradation of aquatic and terrestrial ecosystems (Hamilton et al., 2016; Sinha
et al., 2017). Therefore, the development of wheat cultivars that more efficiently take up and
utilize applied N provides a means of promoting grower profitability and ensuring
environmentally sustainable increases in wheat production.
Genetic improvement of N use efficiency (NUE), defined as the ratio of harvested grain
per unit N applied (Moll et al., 1982), in wheat has been previously reported under a range of N
conditions in European (Cormier et al., 2013), Central American (Ortiz-Monasterio R. et al.,
1997), and the United States (Guttieri et al., 2017). While the extent of genetic improvement
under each N condition varied by study, the authors tend to agree that direct selection under
multiple N rates will accelerate gains in NUE. This hypothesis was further validated by the
detection of significant genotype (G) × N rate interactions for grain yield and N traits in recent
studies of genotypic variation in wheat ( Cormier et al., 2013; Büchi et al., 2016; Kubota et al.,

65
2018). However, the authors also note that direct selection under multiple N rates may be cost-
prohibitive for wheat breeders. In response to this dilemma, Cormier et al. (2016) proposed
identifying genomic regions associated with N response, known as quantitative trait loci (QTL),
to enable more efficient cultivar selection. Through this approach, breeders can quickly screen
germplasm for genetic markers associated with N response to assist in the development of high
NUE cultivars.
Previous studies of cereal crops have searched for novel NUE traits and alleles in adapted
breeding materials (Fontaine et al., 2009), closely related species (Hu et al., 2015), and landraces
(Pozzo et al., 2018; Van Deynze et al., 2018). While these authors have successfully identified
QTL, genes, and genotypes conferring high NUE, it stands to reason that additional sources of
genetic variation exist within currently unexplored germplasm. This hypothesis has withstood
testing in European (Bogard et al., 2013; Laperche et al., 2006; Monostori et al., 2017; Zheng et
al., 2010) and Chinese (An et al., 2006; Cui et al., 2014; Li et al., 2011; Sun et al., 2013) wheat
leading to the successful identification of several QTL associated with N response. However,
identification of novel alleles in North American winter wheat remains relatively unexplored
despite known post-domestication selection amongst geographic regions, classes of wheat, and
growth habit (Cavanagh et al., 2013; Chao et al., 2010; Chao et al., 2007). Guttieri et al. (2017)
and Hitz et al. (2017) began the process of dissecting the genetic variation underlying NUE in
United States wheat germplasm by conducting genome-wide association studies (GWAS) for N
traits in the central and eastern Unites States, respectively. It is therefore crucial to follow up
these investigations using bi-parental mapping populations to enrich potentially rare NUE alleles
for subsequent QTL analysis and to validate the findings from the aforementioned GWAS
investigations.

66
Successful QTL mapping for complex traits including NUE is dependent on the selection
of suitable parents, appropriate population size, multi-environment testing, and the development
of high-density genetic maps (Han et al., 2015). Utilization of genotyping-by-sequencing
(Elshire et al., 2011)(GBS) derived single nucleotide polymorphisms (SNP) markers aligned to
the recently published wheat reference genome (International Wheat Genome Sequencing
Consortium, 2018) has the potential to increase marker density and may thus improve the
quantity and accuracy of QTL identified for N-related traits. Recently, GBS derived SNPs have
been used to detect QTL underlying qualitative and quantitative traits such as flag leaf
architecture (Hussain et al., 2017), disease resistance (Kariyawasam et al., 2018), and yield
components (Würschum et al., 2018) in winter wheat – resulting in the identification of novel
QTL and improved marker quality.
The present study sought to: i) construct a high density genetic map using GBS derived
markers; and ii) identify and validate QTL associated with N-related traits under normal and
reduced N conditions. Phenotypic data was collected on recombinant inbred lines (RILs) and
doubled haploids (DHs), and genotypes were sequenced via GBS to produce high-resolution
genetic maps for two soft red winter wheat populations. This study aims to detect stable and
impactful marker-trait-associations for NUE and N-related traits with direct application for
marker-assisted breeding programs.
67
Materials and Methods
Plant Materials
The present study employed a population of 136 RILs, derived from a cross between
‘Yorktown’ and VA05W-151 (herein known as “YT×151”), and a population of 138 DHs,
derived from a cross between parental lines Yorktown and VA09W-52 (herein known as
“YT×52”). VA05W-151 (PI 665039), a high NUE parent, was derived from the cross Pioneer
brand ’26R24’ (PI 614110) / ‘McCormick’ (PI 632691). The other high NUE parent, VA09W-
52, is a breeding line derived from a three-way cross, GF921221E16 / McCormick // VA99W-
200. Parentage of GF921221E16 is GA83519 / GA85240 // GA861278. Both mapping
populations shared a common low NUE parent, Yorktown (PI 667643), which is a product of the
three-way cross ‘38158’ (PI 619052) / VA99W-188 // ‘Tribute’ (PI 632689). Parentage of sib
lines VA99W-188 and VA99W-200 is VA91-54-343 (IN71761A4-31-5-48 // VA71-54-147
(CItr 17449) / ‘McNair 1813’ (CItr 15289) / VA91-54-222 (sib of ‘Roane’, PI612958). VA91-
54-343 is a sib of VA 92-51-39, which is one of the parents of sibs McCormick and Tribute. The
parents used in this study were developed at Virginia Tech for high yield potential under
intensive management systems and were assessed for N response in previous investigations of
soft red winter wheat (Huang et al., 2016; Pavuluri et al., 2015).
Experimental Design
Both populations were grown under rainfed conditions in four Eastern Virginia testing
environments (defined as a “site-season”) that are described in Table 2.1. Testing sites included
the Eastern Virginia Agricultural Research and Extension Center near Warsaw, VA in 2015-
2016, 2016-2017, and 2017-2018 (WR; 37°99' N, 76°78' W) and a commercial field near New
68
Kent, VA in 2017-2018 (NK; 37°54' N, 76°89' W). Seeds were treated with Raxil MD (triazole,
Bayer Crop Science) and Gaucho XT (imidacloprid, Bayer Crop Science) in all testing
environments to control diseases and insects, respectively. Foliar pesticides and herbicides were
applied throughout the growing season in all environments to further mitigate pest pressure
(Supplemental Table 2.1). Experimental units, seven-row yield plots that measured 2.74 × 1.52
m in WR and 4.88 × 1.78 m in NK, were sown under optimal environmental conditions at a
seeding rate of 480 seeds m-2 to ensure normal stand establishment.
The two populations utilized a non-replicated type-2 modified augmented design (Lin
and Poushinsky, 1985; You et al., 2016) in all environments due to limited seed and land
availability. The design was comprised of 12 statistical blocks with each block consisting of 30
plots (three rows and 10 columns per block) to facilitate spatial adjustments. Each block
consisted of a centered primary check line (OH08-161-78), two randomized secondary check
lines (OH08-172-42 and ‘Sisson’, PI 617053 (Griffey et al., 2003)), and 12 randomized
experimental lines with each check and experimental line being grown under two N rates in
adjacent plots. Parental lines were replicated three times per population under each N rate per
environment. Wheat lines in each block were grown under high (134 kg N ha-1; HN) and
reduced (67 kg N ha-1; LN) spring N supplies that were foliar applied as liquid urea ammonium
nitrate split over Zadoks (Zadoks et al., 1974) growth stages 25 and 30. Phosphorous, potassium,
and sulfur were applied according to soil test results at planting (Supplemental Table 2.1).
Phenotypic Measurements
In the WR location, anthesis date was recorded when half of the anthers had emerged
from the florets. Maturity date was recorded in 17WR (where “17” refers to the growing season)

69
and 18WR when 75 % of the peduncles turned yellow. Before harvest in all testing
environments, plant height was measured from two random locations within the center rows of
each yield plot.
A 1.0 m above-ground biomass (AGBM) sample was cut from the center row of each
plot at harvest maturity (grain moisture content ≤ 160 g kg-1) in all Virginia testing
environments. Biomass samples were oven dried at 60 C for 72 hours, and weighed to estimate
AGBM yield for all experimental line and check plots. Samples were then threshed to estimate
harvest index (calculated as the ratio of grain biomass per unit of total AGBM) by separating
grain from straw tissue and recording their respective weights. Grain and straw tissues were
ground and homogenized to estimate tissue N content via combustion analysis using a Vario
Max Cube elemental analyzer (Elementar Analysensysteme). Results of the combustion analysis
enabled calculations of grain N content, NUE, N uptake efficiency (NUpE), and N utilization
efficiency (NUtE). Moll et al. (1982) defined the terms NUpE and NUtE as quotients of NUE
where NUpE is calculated as the ratio of aboveground N at harvest per unit of N applied and
NUtE as the amount of grain produced per total aboveground N in the plant at harvest. Plots
were combine harvested in all testing environments at harvest maturity and adjusted to 0 g
moisture kg-1 to determine grain yield.
Statistical Analysis
An analysis of variance (ANOVA) was performed for the replicated alleles and parents in
each testing environment using the lme4 package (Bates et al., 2015) in the R statistical
computing environment (R Core Team, 2015):
𝑌𝑖𝑗𝑘𝑙 = 𝜇 + 𝐺𝑖 + 𝑁𝑗 + 𝐸𝑘 + 𝑅𝑙(𝐸𝑘) + 𝐺𝑁𝑖𝑗 + 𝐺𝐸𝑖𝑘 + 𝑁𝐸𝑗𝑘 + 𝐺𝑁𝐸𝑖𝑗𝑘 + 휀𝑖𝑗𝑘𝑙
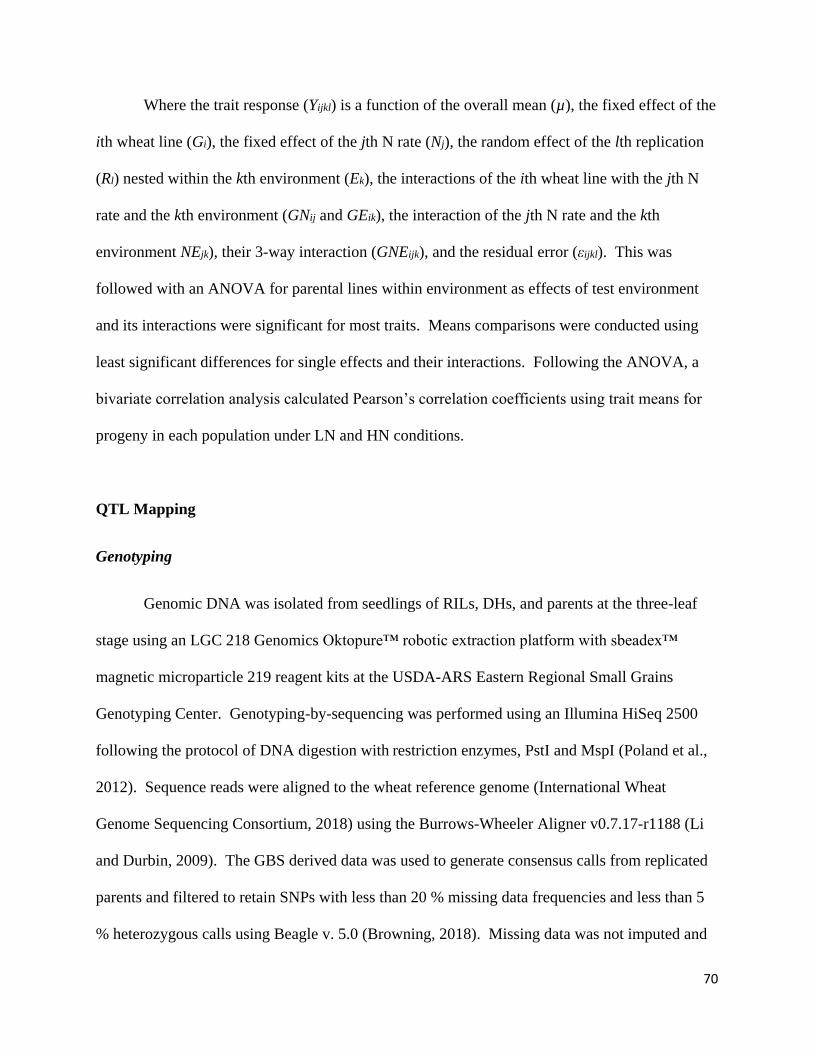
70
Where the trait response (Yijkl) is a function of the overall mean (µ), the fixed effect of the
ith wheat line (Gi), the fixed effect of the jth N rate (Nj), the random effect of the lth replication
(Rl) nested within the kth environment (Ek), the interactions of the ith wheat line with the jth N
rate and the kth environment (GNij and GEik), the interaction of the jth N rate and the kth
environment NEjk), their 3-way interaction (GNEijk), and the residual error (εijkl). This was
followed with an ANOVA for parental lines within environment as effects of test environment
and its interactions were significant for most traits. Means comparisons were conducted using
least significant differences for single effects and their interactions. Following the ANOVA, a
bivariate correlation analysis calculated Pearson’s correlation coefficients using trait means for
progeny in each population under LN and HN conditions.
QTL Mapping
Genotyping
Genomic DNA was isolated from seedlings of RILs, DHs, and parents at the three-leaf
stage using an LGC 218 Genomics Oktopure™ robotic extraction platform with sbeadex™
magnetic microparticle 219 reagent kits at the USDA-ARS Eastern Regional Small Grains
Genotyping Center. Genotyping-by-sequencing was performed using an Illumina HiSeq 2500
following the protocol of DNA digestion with restriction enzymes, PstI and MspI (Poland et al.,
2012). Sequence reads were aligned to the wheat reference genome (International Wheat
Genome Sequencing Consortium, 2018) using the Burrows-Wheeler Aligner v0.7.17-r1188 (Li
and Durbin, 2009). The GBS derived data was used to generate consensus calls from replicated
parents and filtered to retain SNPs with less than 20 % missing data frequencies and less than 5
% heterozygous calls using Beagle v. 5.0 (Browning, 2018). Missing data was not imputed and

71
only SNPs with differing parental homozygous calls were retained. The remaining genomic
DNA was used to identify polymorphic markers from a set of 116 SNP and simple sequence
repeat (SSR) markers used in routine screening of the uniform and regional breeding nurseries
(Supplemental Table 2.2).
Construction of Genetic Maps and Detection of QTL
Polymorphic markers were used to construct high-density linkage maps for the YT×151
and YT×52 populations. The SNP calls were converted to an ABH parent-based format for the
construction of linkage maps in JoinMap v. 4.0 (Van Ooijen, 2006). Within JoinMap, map
distance was determined using the Kosambi mapping function (Kosambi, 2016) and linkage
groups were constructed based on a minimum logarithm of odds (LOD) threshold value of 3.0.
Linkage maps retained all markers to better facilitate future validation studies and meta-analysis.
IciMapping v. 4.1.0 (Meng et al., 2015) was used to identify QTL in both populations using
composite interval mapping for traits under LN and HN conditions at each environment. The
critical threshold to declare a QTL significant (P < 0.05) was based on 1000 permutations
(Doerge and Churchill, 1996) with a LOD value of 2.5 for traits within each N-environment.
Linkage maps were drawn using MapChart v. 2.2.3 (Voorrips, 2002).
Results
Phenotypic Variation and Trait Correlations
ANOVAs for the replicated parental lines, N rates, and their interactions within each
environment are described in Supplemental Tables 2.3 and 2.4. Variance of parents and

72
progeny for all traits at each N-environment for the YT×151 and YT×52 populations are reported
in Supplemental Tables 2.5 and 2.6, respectively. Phenotypic variation was observed in the
two populations under each N rate for a majority of the yield and N-related. The parents in both
populations expressed similar plant heights, anthesis dates, and maturity dates within each testing
environment despite variation at the Ppd-D1 loci in the YT×52 population (Supplemental Table
2.2). Parents of the YT×151 population differed significantly in NUE under LN supplies in all
testing environments, while their NUE was not statistically different under the HN rate (Figure
2.1). The YT×52 population expressed a similar trend but the parents only differed significantly
under the LN supply in the 18NK environment. All progeny reached anthesis over a seven and
10 day period in the YT×151 and YT×52 populations, respectively (Supplemental Tables 2.5
and 2.6).
In both populations, NUE was strongly and positively associated with AGBM, harvest
index, and N uptake efficiency under LN and HN rates (Tables 2.2 and 2.3). Within the YT×52
population, NUE was significantly correlated with grain N content (LN: r = -0.32, P < 0.001;
HN: r = -0.32, P < 0.001) and NUtE (LN: r = -0.31, P < 0.001; HN: r = -0.38, P < 0.001). Under
HN rates, lodging was associated with grain yield (r = -0.40, P < 0.001), grain N content (r =
0.24, P < 0.01), harvest index (r = -0.37, P < 0.001), NUtE (r = -0.21, P < 0.05), and plant height
(r = 0.23, P < 0.01) in the YT×151 population, while the trait was only associated with plant
height (r = 0.44, P < 0.001) in the YT×52 population. Nitrogen uptake efficiency was negatively
correlated with NUtE under LN and HN rates in both populations. However, this association
was greater for RILs in the YT×151 population under LN (r = -0.78, P < 0.001) and HN (r = -
0.82, P < 0.001) rates compared to DHs in the YT×52 population under LN (r = -0.52, P <
0.001) and HN (r = -0.47, P < 0.001) conditions.

73
QTL Analysis
Linkage Map Construction
After filtering for low-quality markers, linkage maps comprised of 3,918 markers
spanning 2,962.8 cM and 3,147 markers spanning 2,491.7 cM in the YT×151 and YT×52
populations, respectively (Table 2.4). Within the YT×151 population, chromosome 6B had the
lowest coverage (7.8 cM) despite being comprised of 92 genetic markers, while 7A had the
greatest coverage (238.6 cM) and consisted of 366 markers. The YT×52 population’s shortest
linkage map on chromosome 4D consisted of 12 markers spanning 17.0 cM and its longest was
on chromosome 5A having 249 markers that spanned 227.4 cM. Marker densities ranged from
4.18 (3D) to 0.08 (6B) cM per marker for the YT×151 and from 2.69 (3D) to 0.32 (1A) cM per
marker for the YT×52 population. The YT×151 linkage map had gaps greater than 30.0 cM on
3B, 3D, and 4A, while the longest gap in the YT×52 population was on 5D (28.0 cM). In both
populations, the A, B, and D genomes had good marker density and high coverage.
QTL in the YT×151 Population
The YT×151 linkage map was employed to detect QTL with a LOD score greater than
2.5 for 11 traits. A total of 54 QTL were identified for traits in one N-environment
(Supplemental Table 2.7) and 12 QTL that were reproducible in two or more N-environments
(Table 2.5). The combined 66 QTL mapped to the A (24), B (17), and D (25) genomes.
Reproducible QTL mapped to chromosomes 1D, 2B, 3B, 4A, 5A, 6A, and 7D individually
explained 4.7 to 27.5 % of the phenotypic variation. The LOD values among reproducible QTL
ranged from 2.61 to 21.85 for QAgbm.151-2B in 17WR-LN and 18WR-HN, respectively. The

74
QTL on 3B (QHi.151-3B) was located within 11 cM of the SNP, IWA4755, conferring
resistance to Fusarium head blight (FHB, caused by the fungal pathogen Fusarium
graminearum) that was identified in the wheat cultivar ‘Bess,’ PI 642794 (McKendry et al.,
2007). The reproducible QTL including QAgbm.151-2B, QNue.151-1D, QNue.151-7D, and
QMd.151-5A were not located near any of the 116 haplotype markers with known trait
associations.
Figure 2.2 illustrates partial linkage maps of the QTL on 4A and 6A. The reproducible
QTL including QNupe.151-4A and QNute.151-4A clustered around the FHB 4A locus identified
in ‘NC-Neuse,’ PI 633037 (Murphy et al., 2004; Petersen et al., 2016). QNue.151-4A and
QHi.151-4A mapped to a position more than 15 cM away from the FHB 4A locus. The other
QTL cluster centralized around the marker IWA4036 which is known to associate with FHB 6A
locus, identified in NC-Neuse (Petersen et al., 2016). QAgbm.151-6A, QNue.151-6A, and
QMd.151-6A were within 18 cM of the QTL for FHB resistance on 6A. Additionally, the QTL
on 4A and 6A were associated with non-reproducible trait QTL (Supplemental Table 2.7). The
remaining two reproducible NUE QTL (QNue.151-1D and QNue.151-7D) are illustrated in
Figure 2.3. The reproducible NUE QTL on 1D colocalized with the non-reproducible QTL,
QAgbm.151-1D, in the 17WR-LN environment and the reproducible NUE QTL on 7D
colocalized with non-reproducible QTL, QHgt.151-7D and QHi.151-7D, in the 17WR-LN and
18WR-LN environments, respectively (Supplemental Table 2.7).
QTL in the YT×52 Population
The YT×52 population linkage maps were employed to detect QTL in the same eight N-
environments as the YT×151 population. Within this population, 64 QTL were identified with a

75
LOD score greater than 2.5 (Table 2.6 and Supplemental Table 2.8) and mapped to the A (25),
B (19), and D (20) genomes. However, only eight of these QTL were reproducible in two or
more N-environments and were located on chromosomes 1A, 2D, 4A, and 7A (Table 2.6). The
reproducible QTL individually explained 4.9 to 52.1 % of the phenotypic variation, while LOD
values ranged from 2.57 for QHgt.52-2D in 18NK-LN to 26.50 for QAd.52-2D in 17WR-HN.
QNue.52-7A and QHgt.51-1A were not located near any of the 116 tested SNP and SSR markers
with known trait associations and explained 4.9 to 7.7 % and 10.7 to 13.2 % of the phenotypic
variation, respectively.
Figure 2.4 illustrates the reproducible QTL clusters on chromosomes 2D and 4A. The
first cluster was found within 14 cM of the photoperiod response locus, Ppd-D1 (Beales et al.,
2007), and was comprised of QAgbm.vt-2D, QNue.vt-2D, QAd.vt-2D, QHgt.vt-2D. Similar to
the results of the YT×151 population, a second QTL cluster was within 10 cM of the FHB 4A
locus. The 4A cluster consisted of QAgbm.vt-4A, QNue.vt-4A, and QNute.vt-4A. Additionally,
both QTL clusters in the YT×52 population were linked to trait QTL significant in only one
testing environment. A third reproducible NUE QTL, QNue.52-7A, was identified in the YT×52
population (Figure 2.5). However, this QTL did not colocalize with any non-reproducible QTL
observed in this population (Supplemental Table 2.8).
Effects of QTL Combinations on NUE
Reproducible QTL and their combinations were assessed for NUE under LN and HN
conditions. Within the YT×151 population, the presence of QNue.151-1D and QNue.151-6A
significantly increased NUE over testing environments under LN by 1.8 and 1.7 kg kg-1,
respectively (Table 2.7). However, the QTL on 7D, QNue.151-7D, produced a significant

76
increase in NUE under both LN (1.8 kg kg-1) and HN (1.2 kg kg-1) supplies. Nitrogen use
efficiency further increased with two or three combined QTL from the YT×151 population. The
YT×52 QTL, QNue.52-2D, mapped near Ppd-D1 did not improve NUE under either N rate -
indicating a significant influence due to testing environment (Table 2.8). The second positive
QTL, QNue.52-7A, significantly increased NUE under the reduced N rate and resulted in higher
NUE than its combination with QNue.52-2D. Finally, the FHB resistance QTL on 4A was
associated with decreased NUE in both populations and, therefore, this repulsion linkage will
have a negative effect on improving NUE in the presence of the FHB-4A QTL. (Table 2.7 and
Table 2.8).
Discussion
Trait Variation and Associations in the Mapping Populations
Transgressive segregates were identified for all traits evaluated in both mapping
populations. Furthermore, trait means within N-environment were frequently intermediate of the
parents, thus suggesting polygenic inheritance of a majority of the studied yield and N traits.
Habash et al. (2007) and Fontaine et al. (2009) also noted non-Mendelian inheritance for NUE
traits in bi-parental wheat populations grown under similar N conditions. It therefore stands to
reason that the parents of the YT×151 and the YT×52 populations possess both favorable and
unfavorable alleles for yield and N traits. Additional sources of beneficial NUE alleles likely
exist within the eastern United States’ soft red winter wheat germplasm as genotypic variation
from unrelated lineages has been reported in recent field (Hitz et al., 2017) and greenhouse

77
(Tamang et al., 2017) studies of N response. Wheat lines from these panels may thus serve as a
basis for future NUE mapping studies.
The present investigation also decomposed grain yield into harvest index and AGBM and
thereby identified a strong association between AGBM and NUE under LN and HN conditions in
both populations. A similar finding was reported by Reynolds et al. (2012) who suggested that
improving source capacity will be required to continue yield improvement as breeders approach
the theoretical maximum harvest index. In a previous investigation of 225 European wheat lines,
AGBM was further shown to be highly heritable (h2 = 0.79) over environments (Cormier et al.,
2013), but traditional phenotyping proved to be exceptionally laborious. Frels et al. (2018)
sought to overcome this constraint by identifying high-throughput vegetative indices that were
predictive of AGBM, enabling more efficient phenotyping. While future work is required to
improve the predictive ability of current AGBM models, the trait appears to be a suitable target
for NUE breeding in winter wheat.
The present study also identified a strong relationship between NUE and its component
trait, NUpE, under LN and HN rates in both populations, while the other component trait, NUtE,
was only associated with NUE in the YT×52 population. Several investigations of wheat
(Barraclough et al., 2010; Dhugga and Waines, 1989; Latshaw et al., 2016; Le Gouis et al., 2000)
previously weighed the contribution of each component trait to the variation in NUE and
generally concluded that: 1) improvements in both traits are necessary to improve NUE; and 2)
the influence of each trait is dependent on the environment, management practices, and genetic
material being tested. It is therefore up to wheat breeders within specific regions to identify
traits that most limit NUE and those for which phenotypic assessment is feasible.

78
Identification of QTL for NUE Traits
As expected, the GBS genotyping platform increased the number of polymorphic SNPs
available in the present study compared to previous investigations that utilized the 90K-SNP
array for soft red winter wheat (Carpenter et al., 2017; Kolmer et al., 2018). The use of GBS
increases marker density through a whole genome scan approach as opposed to screening a select
number of potential polymorphisms. The present study detected similar numbers of SNPs,
chromosome coverage, and marker densities as a previous bi-parental population of winter wheat
that utilized GBS (Hussain et al., 2017). However, map length was exceptionally low on
chromosome 6B in the YT×151 population, thus indicating reduced allelic diversity on 6B
between the two parents.
Previous wheat NUE mapping studies have identified QTL on every chromosome for N
traits (Cormier et al., 2014; Laperche et al., 2007; Mahjourimajd et al., 2016; Sun et al., 2013;
Zheng et al., 2010). It therefore becomes challenging to identify which of these QTL have
potential implication for marker-assisted breeding. In response to this challenge, Quraishi et al.
(2011) conducted a meta-analysis of QTL for NUE to identify 11 major chromosomal regions
linked to N response. QNue.151-6A identified in the present study was located near the QTL on
6A described in the aforementioned study. Additional QTL on 6A were reported to be associated
with NUtE and kernel weight per spike (Xu et al., 2014) and kernel weight (Cui et al., 2016) in
previous studies of N response. The authors further linked this QTL on 6A to TaGW2, which
influences grain size and weight (Simmonds et al., 2016; Su et al., 2011). The IWA4036 marker
located near the reproducible QTL for NUE on chromosome 6A flanks a known FHB resistance
locus (Petersen et al., 2016). However, the other flanking marker, IWA3483, was not
segregating in the population and may therefore indicate that the genetic regions on 6A

79
governing FHB resistance and improved NUE and N traits are different in the YT×151
population (Supplemental Table 2.2).
The QTL, QNue.151-1D, inherited from Yorktown was shown to have a strong effect on
increasing NUE in multiple N-environments and AGBM in one N-environment within the
VA05W-151 background. Bordes et al. (2013) identified a QTL with close proximity to
QNue.151-1D in bread wheat. The high-molecular-weight glutenin subunit gene, Glu-D1, was
located more than 25 cM from this QTL and, therefore, is not likely the candidate gene (D'ovidio
et al., 1995). Sun et al. (2013) also reported a QTL on 1D associated with root and shoot weight
in wheat seedlings grown in hydroponic culture at a similar mapping interval as the QNue.151-
1D and, therefore, may indicate a role in seedling vigor. QNue.52-7A was found within the same
mapping interval as QTL previously linked to grain yield and spikes per m-2 (Monostori et al.,
2017) and a QTL associated with NUtE and spikes per m-2 (Xu et al., 2014). A majority of the
QTL identified in the present study validated findings from previous studies, yet QNue.151-7D
was not commonly observed in recent investigations of N response and may represent a novel
QTL. While previous mapping studies have identified QTL within proximity to QNue.151-7D,
they are primarily associated with a vernalization allele located more than 50 million nucleotides
from the presently identified QTL (Bogard et al., 2011).
QTL Co-Segregating with Known Genes
In addition to evaluation for parental variation in N response, the parents shared similar
alleles for vernalization (Vrn-A1, Vrn-B1, and Vrn-D1), photoperiod (Ppd-A1, Ppd-B1, and Ppd-
D1), and plant height (Rht-B1 and Rht-D1). However, the Vrn-A1 and Ppd-D1 loci differed
between Yorktown and VA09W-52 and the resulting allelic variation on 2D resulted in a strong

80
effect QTL that explained relatively large percentages of the variation for NUE, grain yield, plant
height, and anthesis date in multiple environments and N supplies. Indeed, this result is
consistent with previous findings of wheat grown in the Eastern (Brasier et al., 2018) and Central
(Guttieri et al., 2017) United States, Northwestern Mexico (García-Suárez et al., 2010), and
Western Europe (Bogard et al., 2011). It is postulated that the presence of the Ppd-D1 sensitivity
allele confers reduced frost damage (Foulkes et al., 2004) and maintains radiation use efficiency
during grain filling (Shearman et al., 2005). Worland et al. (1998) further observed strong
interactions between testing environment and the Ppd-D1 locus where near-isogenic lines (D1a
and D1b) had increased or reduced grain yields (-16.0 to 28.4 %) over a 10-year period.
Similarly, the over environment effects of the Ppd-D1 allele in the present study were not
significant under LN or HN conditions despite the identification of strong effect QTL in 16WR
and 17WR.
The negative effects on NUE conferred by the QTL identified near FHB 4A was much
higher than expected upon development of the mapping populations. Indeed, associations
between FHB resistance and yield per se is not uncommon as previous investigations found a
small negative impact on grain yield (Salameh et al., 2011) and grain quality (McCartney et al.,
2007) conferred through a FHB resistance locus on chromosome 5A. The known yield penalties
associated with FHB resistance have discouraged some winter wheat breeders from utilizing
exotic sources of resistance including that of spring wheat variety ‘Sumai-3’ (Balut et al., 2013;
Steiner et al., 2017; Wilde et al., 2007). However, the mechanisms governing a reduction in
NUE by the QTL linked to FHB 4A in the present study requires further investigation to
determine if this linkage can be broken.

81
Implications for Breeding
The QTL identified in this study that were not linked to the FHB 4A or Ppd-D1 may
merit use in marker-assisted-breeding programs as they were not associated with major
physiological traits or known sources of disease resistance. Genetic markers for high NUE were
previously reported near QNue.151-1D, QNue.151-6A, and QNue.52-7A and, therefore, offer the
most potential for immediate marker deployment. The other QTL, QNue.151-7D, requires
further investigation to determine its value in breeding for N response, which will require
screening in unrelated populations. All QTL identified in this study will also benefit from
introgression into diverse backgrounds to gauge their overall breeding value.
Acknowledgments
Funding for this project was provided by the Virginia Small Grains Board. The authors
would like to thank John Seago, Anthony Christopher, Jon Light, Michelle Lee, and William
Myers for assistance collecting field data and Steve Nagle for providing technical assistance in
the analysis of tissue N content.
References
An, D., J. Su, Q. Liu, Y. Zhu, Y. Tong, J. Li, et al. 2006. Mapping QTLs for nitrogen uptake in
relation to the early growth of wheat (Triticum aestivum L.). Plant Soil 284: 73-84.
Balut, A.L., A.J. Clark, G. Brown-Guedira, E. Souza and D.A. Van Sanford. 2013. Validation of
Fhb1 and QFhs. nau-2DL in several soft red winter wheat populations. Crop Sci. 53: 934-
945.
Barraclough, P.B., J.R. Howarth, J. Jones, R. Lopez-Bellido, S. Parmar, C.E. Shepherd, et al.
2010. Nitrogen efficiency of wheat: Genotypic and environmental variation and prospects
for improvement. Eur. J. Agron. 33: 1-11. doi:https://doi.org/10.1016/j.eja.2010.01.005.

82
Bates, D., M. Mächler, B. Bolker and S. Walker. 2015. Fitting linear mixed-effects models using
lme4. J Stat Softw. doi:10.18637/jss.v067.i01
Beales, J., A. Turner, S. Griffiths, J.W. Snape and D.A. Laurie. 2007. A pseudo-response
regulator is misexpressed in the photoperiod insensitive Ppd-D1a mutant of wheat
(Triticum aestivum L.). Theor. Appl. Genet. 115: 721-733.
Bogard, M., V. Allard, P. Martre, E. Heumez, J.W. Snape, S. Orford, et al. 2013. Identifying
wheat genomic regions for improving grain protein concentration independently of grain
yield using multiple inter-related populations. Mol. Breed. 31: 587-599.
Bogard, M., M. Jourdan, V. Allard, P. Martre, M.R. Perretant, C. Ravel, et al. 2011. Anthesis
date mainly explained correlations between post-anthesis leaf senescence, grain yield,
and grain protein concentration in a winter wheat population segregating for flowering
time QTLs. J. Exp. Bot. 62: 3621-3636.
Bordes, J., C. Ravel, J. Jaubertie, B. Duperrier, O. Gardet, E. Heumez, et al. 2013. Genomic
regions associated with the nitrogen limitation response revealed in a global wheat core
collection. Theor. Appl. Genet. 126: 805-822.
Brasier, K.G., B.G. Tamang, N.R. Carpenter, T. Fukao, M.S. Reiter, R.M. Pitman, et al. 2018.
Photoperiod response gene Ppd-D1 affects nitrogen use efficiency in soft red winter
wheat. Crop Sci. 58: 2593-2606. doi:10.2135/cropsci2018.03.0207.
Browning, B.L. 2018. Beagle 5.0.
Büchi, L., R. Charles, D. Schneider, S. Sinaj, A. Maltas, D. Fossati, et al. 2016. Performance of
eleven winter wheat varieties in a long term experiment on mineral nitrogen and organic
fertilisation. Field Crops Research 191: 111-122.
doi:https://doi.org/10.1016/j.fcr.2016.02.022.
Carpenter, N.R., C.A. Griffey, S. Malla, M. Barnett, D. Marshall, M.O. Fountain, et al. 2017.
Identification of quantitative resistance to puccinia striiformis and puccina triticinia in the
soft red winter wheat cultivar ‘Jamestown’. Crop Sci. 57: 2991-3001.
Cavanagh, C.R., S. Chao, S. Wang, B.E. Huang, S. Stephen, S. Kiani, et al. 2013. Genome-wide
comparative diversity uncovers multiple targets of selection for improvement in
hexaploid wheat landraces and cultivars. Proc. Natl. Acad. Sci. 110: 8057-8062.
Chao, S., J. Dubcovsky, J. Dvorak, M.-C. Luo, S.P. Baenziger, R. Matnyazov, et al. 2010.
Population-and genome-specific patterns of linkage disequilibrium and SNP variation in
spring and winter wheat (Triticum aestivum L.). BMC Genomics 11: 727.
Chao, S., W. Zhang, J. Dubcovsky and M. Sorrells. 2007. Evaluation of genetic diversity and
genome-wide linkage disequilibrium among US wheat (Triticum aestivum L.) germplasm
representing different market classes. Crop Sci. 47: 1018-1030.
Cormier, F., S. Faure, P. Dubreuil, E. Heumez, K. Beauchêne, S. Lafarge, et al. 2013. A multi-
environmental study of recent breeding progress on nitrogen use efficiency in wheat
(Triticum aestivum L.). Theoretical and Applied Genetics 126: 3035-3048.
doi:10.1007/s00122-013-2191-9.
Cormier, F., J. Foulkes, B. Hirel, D. Gouache, Y. Moënne-Loccoz and J. Le Gouis. 2016.
Breeding for increased nitrogen-use efficiency: a review for wheat (T. aestivum L.). Plant
Breeding 135: 255-278. doi:doi:10.1111/pbr.12371.
Cormier, F., J. Le Gouis, P. Dubreuil, S. Lafarge and S. Praud. 2014. A genome-wide
identification of chromosomal regions determining nitrogen use efficiency components in
wheat (Triticum aestivum L.). Theor. Appl. Genet. 127: 2679-2693.

83
Cui, F., X. Fan, M. Chen, N. Zhang, C. Zhao, W. Zhang, et al. 2016. QTL detection for wheat
kernel size and quality and the responses of these traits to low nitrogen stress. Theor.
Appl. Genet. 129: 469-484.
Cui, F., X. Fan, C. Zhao, W. Zhang, M. Chen, J. Ji, et al. 2014. A novel genetic map of wheat:
utility for mapping QTL for yield under different nitrogen treatments. BMC Genet. 15:
57.
D'ovidio, R., S. Masci and E. Porceddu. 1995. Development of a set of oligonucleotide primers
specific for genes at the Glu-1 complex loci of wheat. Theor. Appl. Genet. 91: 189-194.
Dhugga, K.S. and J.G. Waines. 1989. Analysis of nitrogen accumulation and use in bread and
durum wheat. Crop Sci. 29: 1232-1239.
doi:10.2135/cropsci1989.0011183X002900050029x.
Doerge, R.W. and G.A. Churchill. 1996. Permutation tests for multiple loci affecting a
quantitative character. Genetics 142: 285-294.
Elshire, R.J., J.C. Glaubitz, Q. Sun, J.A. Poland, K. Kawamoto, E.S. Buckler, et al. 2011. A
robust, simple genotyping-by-sequencing (GBS) approach for high diversity species.
PloS One 6: e19379.
Fontaine, J.-X., C. Ravel, K. Pageau, E. Heumez, F. Dubois, B. Hirel, et al. 2009. A quantitative
genetic study for elucidating the contribution of glutamine synthetase, glutamate
dehydrogenase and other nitrogen-related physiological traits to the agronomic
performance of common wheat. Theor. Appl. Genet. 119: 645-662.
Foulkes, M., R. Sylvester-Bradley, A. Worland and J. Snape. 2004. Effects of a photoperiod-
response gene Ppd-D1 on yield potential and drought resistance in UK winter wheat.
Euphytica 135: 63-73.
Frels, K., M. Guttieri, B. Joyce, B. Leavitt and P.S. Baenziger. 2018. Evaluating canopy spectral
reflectance vegetation indices to estimate nitrogen use traits in hard winter wheat. Field
Crops Res. 217: 82-92.
Galloway, J.N., F.J. Dentener, D.G. Capone, E.W. Boyer, R.W. Howarth, S.P. Seitzinger, et al.
2004. Nitrogen Cycles: Past, Present, and Future. Biogeochemistry 70: 153-226.
doi:10.1007/s10533-004-0370-0.
García-Suárez, J., M. Röder and J. Díaz de León. 2010. Identification of QTLs and associated
molecular markers of agronomic traits in wheat (Triticum aestivum L.) under two
conditions of nitrogen fertilization. Cereal Res. Commun. 38: 459-470.
Guttieri, M.J., K. Frels, T. Regassa, B.M. Waters and P.S. Baenziger. 2017. Variation for
nitrogen use efficiency traits in current and historical great plains hard winter wheat.
Euphytica 213: 87. doi:10.1007/s10681-017-1869-5.
Habash, D.Z., S. Bernard, J. Schondelmaier, J. Weyen and S.A. Quarrie. 2007. The genetics of
nitrogen use in hexaploid wheat: N utilisation, development and yield. Theor. Appl.
Genet. 114: 403-419.
Hamilton, D.P., N. Salmaso and H.W. Paerl. 2016. Mitigating harmful cyanobacterial blooms:
strategies for control of nitrogen and phosphorus loads. Aquatic Ecology 50: 351-366.
doi:10.1007/s10452-016-9594-z.
Han, M., M. Okamoto, P. Beatty, S. Rothstein and A. Good. 2015. The genetics of nitrogen use
efficiency in crop plants. Annu. Rev. Genet. 49: 269-289. doi:10.1146/annurev-genet-
112414-055037.

84
Hitz, K., A.J. Clark and D.A. Van Sanford. 2017. Identifying nitrogen-use efficient soft red
winter wheat lines in high and low nitrogen environments. Field Crops Research 200: 1-
9. doi:https://doi.org/10.1016/j.fcr.2016.10.001.
Hofer, S. 2001. Ammonia (Salicylate) in 2M KCl soil extracts. Lachat QuikChem Method 12-
107-06-2-A. Lachat Instruments Inc., Milwaukee, WI, USA.
Hu, B., W. Wang, S. Ou, J. Tang, H. Li, R. Che, et al. 2015. Variation in NRT1.1B contributes to
nitrate-use divergence between rice subspecies. Nat. Genet. 47: 834.
Huang, M., A. Cabrera, A. Hoffstetter, C. Griffey, D. Van Sanford, J. Costa, et al. 2016.
Genomic selection for wheat traits and trait stability. Theor. Appl. Genet. 129: 1697-
1710.
Hussain, W., P.S. Baenziger, V. Belamkar, M.J. Guttieri, J.P. Venegas, A. Easterly, et al. 2017.
Genotyping-by-sequencing derived high-density linkage map and its application to QTL
mapping of flag leaf traits in bread wheat. Sci. Rep. 7: 16394.
International Wheat Genome Sequencing Consortium. 2018. Shifting the limits in wheat research
and breeding using a fully annotated reference genome. Science 361: eaar7191.
doi:10.1126/science.aar7191.
Kariyawasam, G.K., W. Hussain, A. Easterly, M. Guttieri, V. Belamkar, J. Poland, et al. 2018.
Identification of quantitative trait loci conferring resistance to tan spot in a biparental
population derived from two Nebraska hard red winter wheat cultivars. Mol. Breed. 38:
140.
Knepel, K. and K. Bogren. 2001. Determination of orthophosphate by flow injection analysis.
QuikChem Method. In: Saline Methods of Analysis. Lachat Instruments, Milwaukee, WI:
31-115.
Kolmer, J.A., Z. Su, A. Bernardo, G. Bai and S. Chao. 2018. Mapping and characterization of the
new adult plant leaf rust resistance gene Lr77 derived from Santa Fe winter wheat. Theor.
Appl. Genet. 131: 1553-1560.
Kosambi, D.D. 2016. The estimation of map distances from recombination values. DD
Kosambi. Springer. p. 125-130.
Kubota, H., M. Iqbal, M. Dyck, S. Quideau, R.-C. Yang and D. Spaner. 2018. Investigating
Genetic Progress and Variation for Nitrogen Use Efficiency in Spring Wheat. Crop
Science 58: 1542-1557. doi:10.2135/cropsci2017.10.0598.
Laperche, A., M. Brancourt-Hulmel, E. Heumez, O. Gardet, E. Hanocq, F. Devienne-Barret, et
al. 2007. Using genotype× nitrogen interaction variables to evaluate the QTL involved in
wheat tolerance to nitrogen constraints. Theor. Appl. Genet. 115: 399-415.
Laperche, A., F. Devienne-Barret, O. Maury, J. Le Gouis and B. Ney. 2006. A simplified
conceptual model of carbon/nitrogen functioning for QTL analysis of winter wheat
adaptation to nitrogen deficiency. Theor. Appl. Genet. 113: 1131-1146.
Latshaw, S.P., M.F. Vigil and S.D. Haley. 2016. Genotypic differences for nitrogen use
efficiency and grain protein deviation in hard winter wheat. Agron. J. 108: 2201-2213.
doi:10.2134/agronj2016.02.0070.
Le Gouis, J., D. Béghin, E. Heumez and P. Pluchard. 2000. Genetic differences for nitrogen
uptake and nitrogen utilisation efficiencies in winter wheat. Eur. J. Agron. 12: 163-173.
doi:https://doi.org/10.1016/S1161-0301(00)00045-9.
Li, H. and R. Durbin. 2009. Fast and accurate short read alignment with Burrows–Wheeler
transform. Bioinformatics 25: 1754-1760.

85
Li, X.P., X.Q. Zhao, X. He, G.Y. Zhao, B. Li, D.C. Liu, et al. 2011. Haplotype analysis of the
genes encoding glutamine synthetase plastic isoforms and their association with nitrogen‐
use‐and yield‐related traits in bread wheat. New Phytol. 189: 449-458.
Lin, C.-S. and G. Poushinsky. 1985. A modified augmented design (type 2) for rectangular plots.
Can. J. Plant Sci. 65: 743-749.
Liu, S., Z. Xie, Y. Zeng, B. Liu, R. Li, Y. Wang, et al. 2019. Effects of anthropogenic nitrogen
discharge on dissolved inorganic nitrogen transport in global rivers. Global Change Biol.
Mahjourimajd, S., H. Kuchel, P. Langridge and M. Okamoto. 2016. Evaluation of Australian
wheat genotypes for response to variable nitrogen application. Plant Soil 399: 247-255.
doi:10.1007/s11104-015-2694-z.
McCartney, C., D. Somers, G. Fedak, R. DePauw, J. Thomas, S. Fox, et al. 2007. The evaluation
of FHB resistance QTLs introgressed into elite Canadian spring wheat germplasm. Mol.
Breed. 20: 209-221.
McKendry, A., D. Tague, R. Wright and J. Tremain. 2007. Registration of ‘Bess’ wheat. J. Plant
Reg. 1: 21-23.
Meng, L., H. Li, L. Zhang and J. Wang. 2015. QTL IciMapping: Integrated software for genetic
linkage map construction and quantitative trait locus mapping in biparental populations.
Crop J. 3: 269-283.
Moll, R.H., E.J. Kamprath and W.A. Jackson. 1982. Analysis and Interpretation of Factors
Which Contribute to Efficiency of Nitrogen Utilization1. Agronomy Journal 74: 562-564.
doi:10.2134/agronj1982.00021962007400030037x.
Monostori, I., F. Szira, A. Tondelli, T. Árendás, K. Gierczik, L. Cattivelli, et al. 2017. Genome-
wide association study and genetic diversity analysis on nitrogen use efficiency in a
Central European winter wheat (Triticum aestivum L.) collection. PloS One 12:
e0189265.
Murphy, J., R. Navarro, S. Leath, D. Bowman, P. Weisz, L. Ambrose, et al. 2004. Registration of
'NC-Neuse' wheat. Crop Sci. 44: 1479-1481.
Ortiz-Monasterio R., J.I., K.D. Sayre, S. Rajaram and M. McMahon. 1997. Genetic Progress in
Wheat Yield and Nitrogen Use Efficiency under Four Nitrogen Rates. Crop Science 37:
898-904. doi:10.2135/cropsci1997.0011183X003700030033x.
Pavuluri, K., B. Chim, C. Griffey, M. Reiter, M. Balota and W. Thomason. 2015. Canopy
spectral reflectance can predict grain nitrogen use efficiency in soft red winter wheat.
Precis. Agric. 16: 405-424.
Petersen, S., J.H. Lyerly, P.V. Maloney, G. Brown-Guedira, C. Cowger, J.M. Costa, et al. 2016.
Mapping of Fusarium head blight resistance quantitative trait loci in winter wheat cultivar
NC-Neuse. Crop Sci. 56: 1473-1483.
Poland, J.A., P.J. Brown, M.E. Sorrells and J.-L. Jannink. 2012. Development of high-density
genetic maps for barley and wheat using a novel two-enzyme genotyping-by-sequencing
approach. PLoS One 7: e32253.
Pozzo, T., S.M. Higdon, S. Pattathil, M.G. Hahn and A.B. Bennett. 2018. Characterization of
novel glycosyl hydrolases discovered by cell wall glycan directed monoclonal antibody
screening and metagenome analysis of maize aerial root mucilage. PloS One 13:
e0204525.
Quraishi, U.M., M. Abrouk, F. Murat, C. Pont, S. Foucrier, G. Desmaizieres, et al. 2011. Cross‐
genome map based dissection of a nitrogen use efficiency ortho‐metaQTL in bread wheat
unravels concerted cereal genome evolution. Plant J. 65: 745-756.

86
R Core Team. 2015. R: A Language and Environment for Statistical Computing. R Foundation
for Statistical Computing, Vienna, Austria. doi:Available: http://www.R-project.org/.
Reynolds, M., J. Foulkes, R. Furbank, S. Griffiths, J. King, E. Murchie, et al. 2012. Achieving
yield gains in wheat. Plant Cell Environ. 35: 1799-1823.
Salameh, A., M. Buerstmayr, B. Steiner, A. Neumayer, M. Lemmens and H. Buerstmayr. 2011.
Effects of introgression of two QTL for fusarium head blight resistance from Asian
spring wheat by marker-assisted backcrossing into European winter wheat on fusarium
head blight resistance, yield and quality traits. Mol. Breed. 28: 485-494.
Shearman, V., R. Sylvester-Bradley, R. Scott and M. Foulkes. 2005. Physiological processes
associated with wheat yield progress in the UK. Crop Sci. 45: 175-185.
Shiferaw, B., M. Smale, H.-J. Braun, E. Duveiller, M. Reynolds and G. Muricho. 2013. Crops
that feed the world 10. Past successes and future challenges to the role played by wheat in
global food security. Food Security 5: 291-317. doi:10.1007/s12571-013-0263-y.
Simmonds, J., P. Scott, J. Brinton, T.C. Mestre, M. Bush, A. Del Blanco, et al. 2016. A splice
acceptor site mutation in TaGW2-A1 increases thousand grain weight in tetraploid and
hexaploid wheat through wider and longer grains. Theor. Appl. Genet. 129: 1099-1112.
Sinha, E., A.M. Michalak and V. Balaji. 2017. Eutrophication will increase during the 21st
century as a result of precipitation changes. Science 357: 405-408.
doi:10.1126/science.aan2409.
Steiner, B., M. Buerstmayr, S. Michel, W. Schweiger, M. Lemmens and H. Buerstmayr. 2017.
Breeding strategies and advances in line selection for Fusarium head blight resistance in
wheat. Trop. Plant Pathol. 42: 165-174.
Su, Z., C. Hao, L. Wang, Y. Dong and X. Zhang. 2011. Identification and development of a
functional marker of TaGW2 associated with grain weight in bread wheat (Triticum
aestivum L.). Theor. Appl. Genet. 122: 211-223.
Sun, J.-j., Y. Guo, G.-z. Zhang, M.-g. Gao, G.-h. Zhang, F.-m. Kong, et al. 2013. QTL mapping
for seedling traits under different nitrogen forms in wheat. Euphytica 191: 317-331.
Swaney, D.P., R.W. Howarth and B. Hong. 2018. Nitrogen use efficiency and crop production:
Patterns of regional variation in the United States, 1987–2012. Sci. Total Environ. 635:
498-511.
Tamang, B.G., K.G. Brasier, W.E. Thomason, C.A. Griffey and T. Fukao. 2017. Differential
responses of grain yield, grain protein, and their associated traits to nitrogen supply in
soft red winter wheat. J. Plant Nutr. Soil Sci. 180: 316-325.
doi:doi:10.1002/jpln.201600312.
Tilman, D., K.G. Cassman, P.A. Matson, R. Naylor and S. Polasky. 2002. Agricultural
sustainability and intensive production practices. Nature 418: 671.
doi:10.1038/nature01014.
Van Deynze, A., P. Zamora, P.-M. Delaux, C. Heitmann, D. Jayaraman, S. Rajasekar, et al.
2018. Nitrogen fixation in a landrace of maize is supported by a mucilage-associated
diazotrophic microbiota. PLoS Biol. 16: e2006352.
Van Ooijen, J. 2006. JoinMap® 4, Software for the calculation of genetic linkage maps in
experimental populations. Kyazma BV, Wageningen 33.
Voorrips, R. 2002. MapChart: software for the graphical presentation of linkage maps and QTLs.
J. Heredity 93: 77-78.

87
Wilde, F., V. Korzun, E. Ebmeyer, H. Geiger and T. Miedaner. 2007. Comparison of phenotypic
and marker-based selection for Fusarium head blight resistance and DON content in
spring wheat. Mol. Breed. 19: 357-370.
Worland, A., V. Korzun, M. Röder, M. Ganal and C. Law. 1998. Genetic analysis of the
dwarfing gene Rht8 in wheat. Part II. The distribution and adaptive significance of allelic
variants at the Rht8 locus of wheat as revealed by microsatellite screening. Theor. Appl.
Genet. 96: 1110-1120.
Würschum, T., W.L. Leiser, S.M. Langer, M.R. Tucker and C.F.H. Longin. 2018. Phenotypic
and genetic analysis of spike and kernel characteristics in wheat reveals long-term genetic
trends of grain yield components. Theor. Appl. Genet. 131: 2071-2084.
Xu, Y., R. Wang, Y. Tong, H. Zhao, Q. Xie, D. Liu, et al. 2014. Mapping QTLs for yield and
nitrogen-related traits in wheat: influence of nitrogen and phosphorus fertilization on
QTL expression. Theor. Appl. Genet. 127: 59-72.
You, F.M., Q. Song, G. Jia, Y. Cheng, S. Duguid, H. Booker, et al. 2016. Estimation of genetic
parameters and their sampling variances for quantitative traits in the type 2 modified
augmented design. Crop J. 4: 107-118.
Zadoks, J.C., T.T. Chang and C.F. Konzak. 1974. A decimal code for the growth stages of
cereals. Weed Res. 14: 415-421.
Zheng, B.S., J. Le Gouis, M. Leflon, W.Y. Rong, A. Laperche and M. Brancourt-Hulmel. 2010.
Using probe genotypes to dissect QTL× environment interactions for grain yield
components in winter wheat. Theor. Appl. Genet. 121: 1501-1517.

88
Figure 2.1. Nitrogen use efficiency histograms of wheat parents and progeny from the Yorktown
× VA05W-151 (top) and Yorktown × VA09W-52 (bottom) populations grown under low (LN)
and high (HN) N rates in each testing environment. Parent means at each N rate are shown for
Yorktown (YT), VA05W-151 (151), and VA09W-52 (52). Detailed statistical analysis of
parents and progeny in Supplemental Tables 2.5 and 2.6.

89
Figure 2.2. Partial linkage maps of QTL clusters on chromosomes 4A and 6A in the Yorktown ×
VA05W-151 wheat population. Blocks represent trait confidence intervals.

90
Figure 2.3. Partial linkage maps of reproducible QTL clusters on chromosomes 1D and 7D in the
Yorktown × VA05W-151 wheat population. Blocks represent trait confidence intervals.
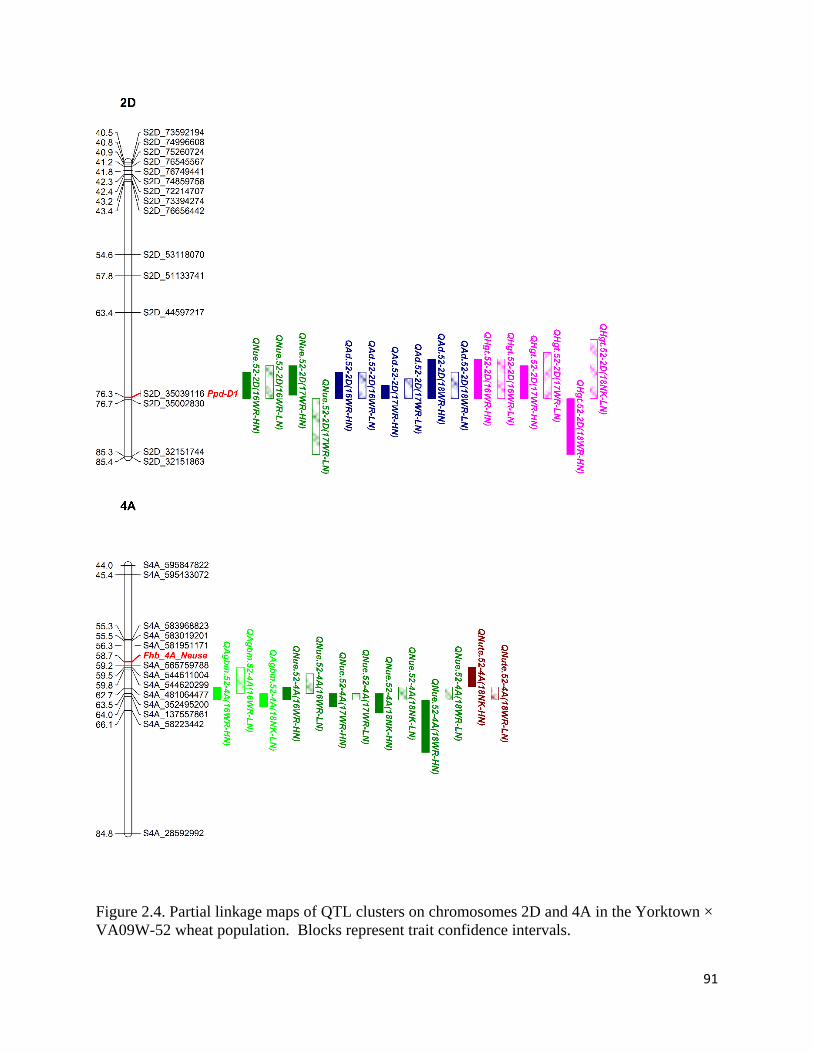
91
Figure 2.4. Partial linkage maps of QTL clusters on chromosomes 2D and 4A in the Yorktown ×
VA09W-52 wheat population. Blocks represent trait confidence intervals.
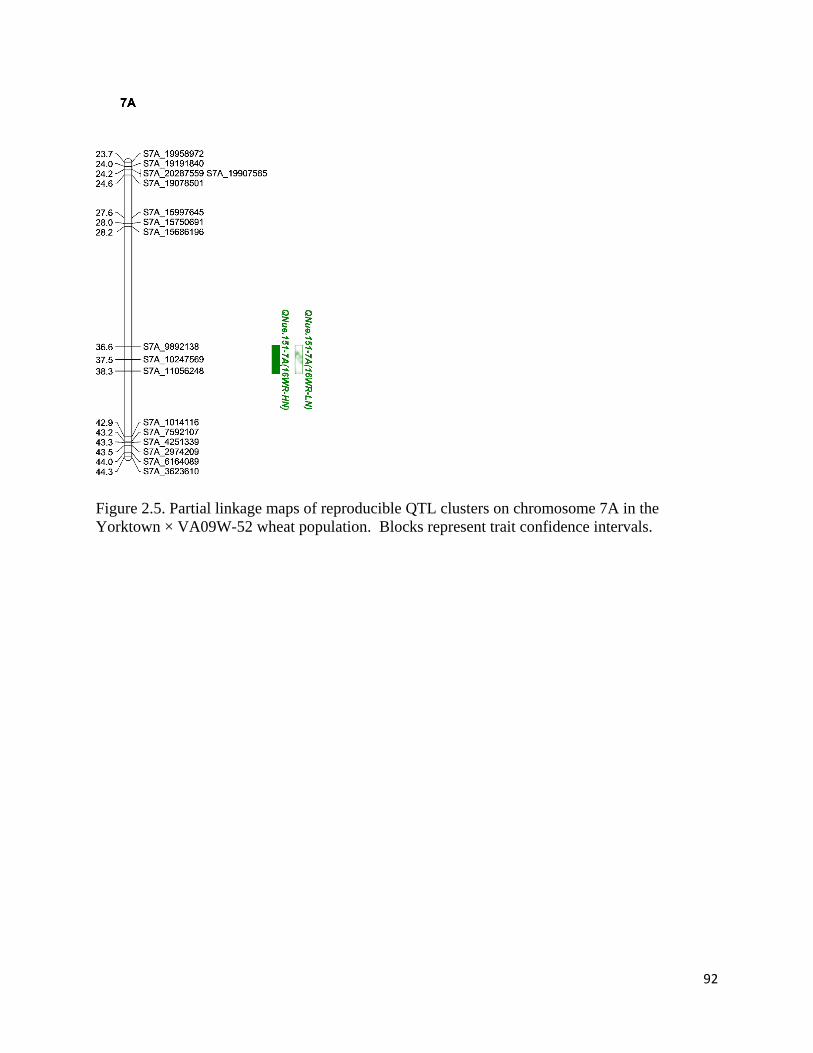
92
Figure 2.5. Partial linkage maps of reproducible QTL clusters on chromosome 7A in the
Yorktown × VA09W-52 wheat population. Blocks represent trait confidence intervals.

93
Table 2.1. Description of environments (Env.) used to test mapping populations.
Location Season Env. Soil series Soil type Cumm.
Precip.†
Cumm.
GDD†
NO3−
N‡
NH4+
N‡
Total
N§
Total
C§
mm °C mg kg-1 mg g-1
Warsaw 15-16 16WR Kempsville Loam 645 2,905 5.9 1.1 0.5 4.1
16-17 17WR Kempsville Loam 752 2,603 3.9 1.6 0.6 4.4
17-18 18WR Kempsville Loam 1,002 3,379 7.1 1.6 0.5 5.7
New Kent 17-18 18NK Altavista Sandy loam 938 3,199 22.0 6.6 1.0 11.2
† Cumulative precipitation and growing degree days (GDD) from planting to harvest.
‡ Soil nitrate (NO3−) and ammonium (NH4
+) were determined by analysis of KCl filtrates on a
Lachat 8500 Flow Injection Analyzer (Knepel, 2001; Hofer, 2001).
§ Total N and organic C determined by combustion analysis.
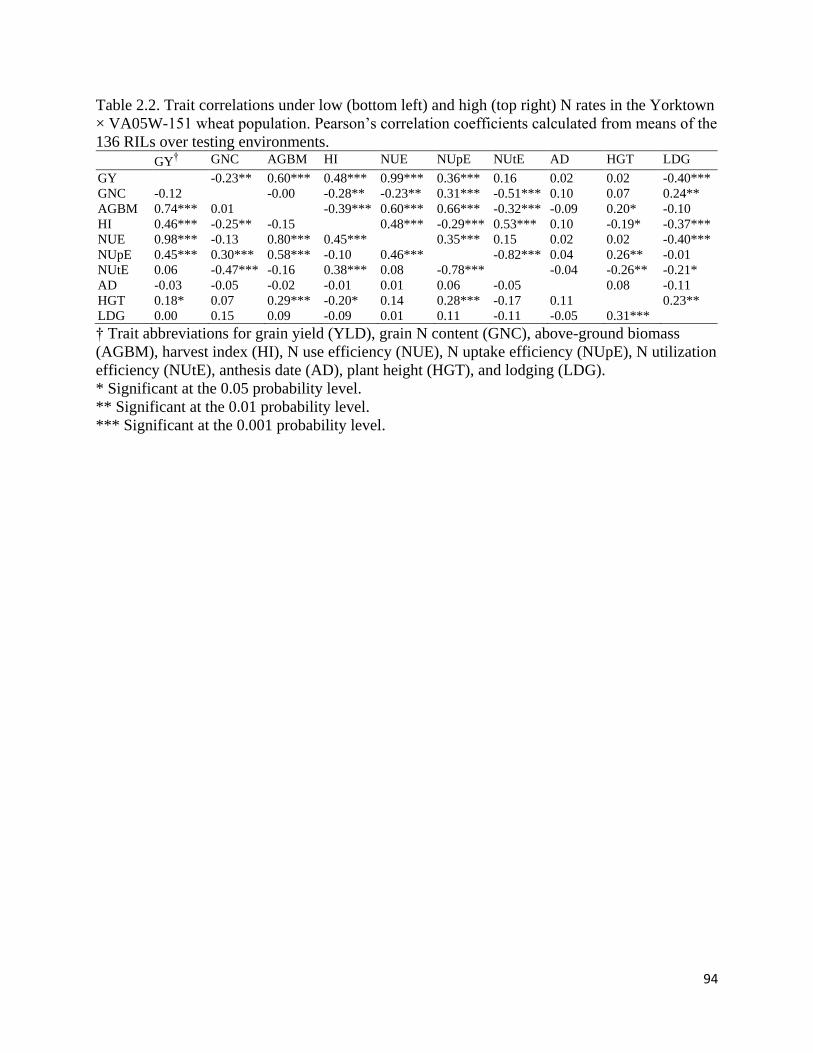
94
Table 2.2. Trait correlations under low (bottom left) and high (top right) N rates in the Yorktown
× VA05W-151 wheat population. Pearson’s correlation coefficients calculated from means of the
136 RILs over testing environments. GY† GNC AGBM HI NUE NUpE NUtE AD HGT LDG
GY -0.23** 0.60*** 0.48*** 0.99*** 0.36*** 0.16 0.02 0.02 -0.40***
GNC -0.12 -0.00 -0.28** -0.23** 0.31*** -0.51*** 0.10 0.07 0.24**
AGBM 0.74*** 0.01 -0.39*** 0.60*** 0.66*** -0.32*** -0.09 0.20* -0.10
HI 0.46*** -0.25** -0.15 0.48*** -0.29*** 0.53*** 0.10 -0.19* -0.37***
NUE 0.98*** -0.13 0.80*** 0.45*** 0.35*** 0.15 0.02 0.02 -0.40***
NUpE 0.45*** 0.30*** 0.58*** -0.10 0.46*** -0.82*** 0.04 0.26** -0.01
NUtE 0.06 -0.47*** -0.16 0.38*** 0.08 -0.78*** -0.04 -0.26** -0.21*
AD -0.03 -0.05 -0.02 -0.01 0.01 0.06 -0.05 0.08 -0.11
HGT 0.18* 0.07 0.29*** -0.20* 0.14 0.28*** -0.17 0.11 0.23**
LDG 0.00 0.15 0.09 -0.09 0.01 0.11 -0.11 -0.05 0.31***
† Trait abbreviations for grain yield (YLD), grain N content (GNC), above-ground biomass
(AGBM), harvest index (HI), N use efficiency (NUE), N uptake efficiency (NUpE), N utilization
efficiency (NUtE), anthesis date (AD), plant height (HGT), and lodging (LDG).
* Significant at the 0.05 probability level.
** Significant at the 0.01 probability level.
*** Significant at the 0.001 probability level.

95
Table 2.3. Trait correlations under low (bottom left) and high (top right) N rates in the Yorktown
× VA09W-52 wheat population. Pearson’s correlation coefficients calculated from means of the
138 DHs over testing environments. GY† GNC AGBM HI NUE NUpE NUtE AD HGT LDG
GY -0.33*** 0.49*** 0.34*** 0.99*** 0.46*** 0.36*** 0.11 0.09 -0.01
GNC -0.32*** -0.10 -0.16 -0.32*** 0.21* -0.47*** -0.19* -0.28*** 0.04
AGBM 0.70*** -0.12 -0.24** 0.49*** 0.71*** -0.01 0.05 0.06 0.01
HI 0.50*** -0.31*** -0.24** 0.34*** -0.16 0.42*** -0.18* -0.12 -0.07
NUE 0.99*** -0.32*** 0.70*** 0.50*** 0.46*** 0.38*** 0.09 0.08 -0.02
NUpE 0.48*** 0.36*** 0.50*** 0.03 0.48*** -0.47*** -0.03 -0.10 -0.01
NUtE 0.30*** -0.45*** 0.12 0.29*** 0.31*** -0.52*** 0.08 0.18* -0.04
AD 0.03 -0.11 0.13 -0.14 0.02 -0.07 0.07 0.42*** 0.04
HGT 0.21* -0.10 0.29*** -0.06 0.21* 0.05 0.10 0.39*** 0.44***
LDG 0.13 0.05 0.09 0.04 0.12 0.12 -0.05 0.05 0.30***
† Trait abbreviations for grain yield (YLD), grain N content (GNC), above-ground biomass
(AGBM), harvest index (HI), N use efficiency (NUE), N uptake efficiency (NUpE), N utilization
efficiency (NUtE), anthesis date (AD), plant height (HGT), and lodging (LDG).
* Significant at the 0.05 probability level.
** Significant at the 0.01 probability level.
*** Significant at the 0.001 probability level.

96
Table 2.4. Description of the novel genetic linkage maps for the Yorktown × VA05W-151 and
Yorktown × VA09W-52 wheat populations.
Chromosome
Yorktown × VA05W-151 Yorktown × VA09W-52
No. of
markers Coverage
Average
Spacing
No. of
linkage
groups
No. of
markers Coverage
Average
Spacing
No. of
linkage
groups
cM cM
1A 67 68.0 1.01 3 202 65.3 0.32 1
1B 264 132.6 0.50 2 152 107.6 0.71 3
1D 111 126.1 1.14 2 74 91.2 1.23 2
2A 367 218.3 0.59 3 255 117.3 0.46 3
2B 134 38.0 0.28 2 281 145.8 0.52 2
2D 138 160.6 1.16 1 61 97.3 1.60 2
3A 216 175.2 0.81 3 240 184.3 0.77 1
3B 300 218.0 0.73 2 299 161.3 0.54 2
3D 48 200.4 4.18 4 30 80.8 2.69 2
4A 268 188.9 0.70 3 65 128.6 1.98 2
4B 159 110.4 0.69 2 108 92.5 0.86 1
4D 30 100.5 3.35 2 12 17.0 1.42 1
5A 180 128.1 0.71 3 249 227.4 0.91 1
5B 273 166.1 0.61 1 245 154.8 0.63 2
5D 70 146.3 2.09 3 56 150.7 2.69 2
6A 325 175.3 0.54 1 183 93.7 0.51 2
6B 92 7.8 0.08 2 65 59.4 0.91 2
6D 28 60.6 2.16 2 70 78.8 1.13 2
7A 366 238.6 0.65 3 241 173.6 0.72 3
7B 372 204.6 0.55 3 187 129.3 0.69 2
7D 110 98.4 0.89 3 72 135.0 1.88 2
A genome 1,789 1,192.4 0.72 19 1,435 990.2 0.81 13
B genome 1,594 877.5 0.49 14 1,337 850.7 0.69 14
D genome 535 892.9 2.14 17 375 650.8 1.81 13
Total 3,918 2,962.8 1.12 50 3,147 2,491.7 1.10 40
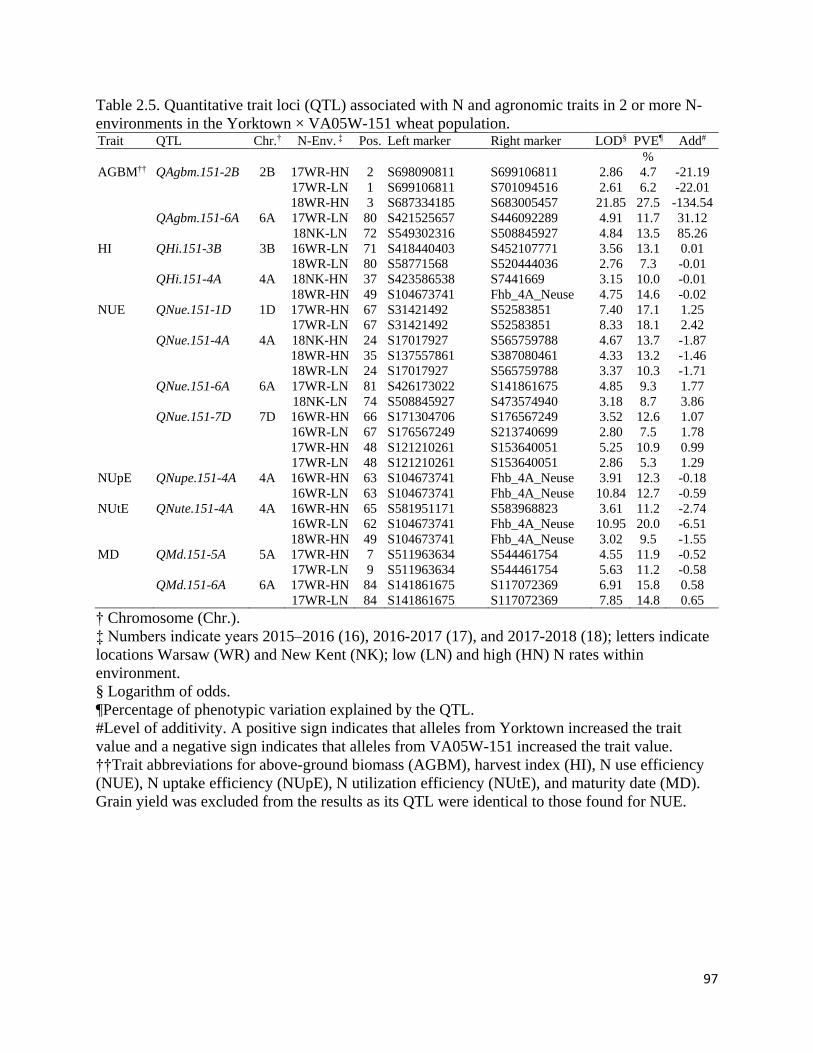
97
Table 2.5. Quantitative trait loci (QTL) associated with N and agronomic traits in 2 or more N-
environments in the Yorktown × VA05W-151 wheat population. Trait QTL Chr.† N-Env. ‡ Pos. Left marker Right marker LOD§ PVE¶ Add#
%
AGBM†† QAgbm.151-2B 2B 17WR-HN 2 S698090811 S699106811 2.86 4.7 -21.19
17WR-LN 1 S699106811 S701094516 2.61 6.2 -22.01
18WR-HN 3 S687334185 S683005457 21.85 27.5 -134.54
QAgbm.151-6A 6A 17WR-LN 80 S421525657 S446092289 4.91 11.7 31.12
18NK-LN 72 S549302316 S508845927 4.84 13.5 85.26
HI QHi.151-3B 3B 16WR-LN 71 S418440403 S452107771 3.56 13.1 0.01
18WR-LN 80 S58771568 S520444036 2.76 7.3 -0.01
QHi.151-4A 4A 18NK-HN 37 S423586538 S7441669 3.15 10.0 -0.01
18WR-HN 49 S104673741 Fhb_4A_Neuse 4.75 14.6 -0.02
NUE QNue.151-1D 1D 17WR-HN 67 S31421492 S52583851 7.40 17.1 1.25
17WR-LN 67 S31421492 S52583851 8.33 18.1 2.42
QNue.151-4A 4A 18NK-HN 24 S17017927 S565759788 4.67 13.7 -1.87
18WR-HN 35 S137557861 S387080461 4.33 13.2 -1.46
18WR-LN 24 S17017927 S565759788 3.37 10.3 -1.71
QNue.151-6A 6A 17WR-LN 81 S426173022 S141861675 4.85 9.3 1.77
18NK-LN 74 S508845927 S473574940 3.18 8.7 3.86
QNue.151-7D 7D 16WR-HN 66 S171304706 S176567249 3.52 12.6 1.07
16WR-LN 67 S176567249 S213740699 2.80 7.5 1.78
17WR-HN 48 S121210261 S153640051 5.25 10.9 0.99
17WR-LN 48 S121210261 S153640051 2.86 5.3 1.29
NUpE QNupe.151-4A 4A 16WR-HN 63 S104673741 Fhb_4A_Neuse 3.91 12.3 -0.18
16WR-LN 63 S104673741 Fhb_4A_Neuse 10.84 12.7 -0.59
NUtE QNute.151-4A 4A 16WR-HN 65 S581951171 S583968823 3.61 11.2 -2.74
16WR-LN 62 S104673741 Fhb_4A_Neuse 10.95 20.0 -6.51
18WR-HN 49 S104673741 Fhb_4A_Neuse 3.02 9.5 -1.55
MD QMd.151-5A 5A 17WR-HN 7 S511963634 S544461754 4.55 11.9 -0.52
17WR-LN 9 S511963634 S544461754 5.63 11.2 -0.58
QMd.151-6A 6A 17WR-HN 84 S141861675 S117072369 6.91 15.8 0.58
17WR-LN 84 S141861675 S117072369 7.85 14.8 0.65
† Chromosome (Chr.).
‡ Numbers indicate years 2015–2016 (16), 2016-2017 (17), and 2017-2018 (18); letters indicate
locations Warsaw (WR) and New Kent (NK); low (LN) and high (HN) N rates within
environment.
§ Logarithm of odds.
¶Percentage of phenotypic variation explained by the QTL.
#Level of additivity. A positive sign indicates that alleles from Yorktown increased the trait
value and a negative sign indicates that alleles from VA05W-151 increased the trait value.
††Trait abbreviations for above-ground biomass (AGBM), harvest index (HI), N use efficiency
(NUE), N uptake efficiency (NUpE), N utilization efficiency (NUtE), and maturity date (MD).
Grain yield was excluded from the results as its QTL were identical to those found for NUE.

98
Table 2.6. Quantitative trait loci (QTL) associated with N and agronomic traits in two or more N-
environments in the Yorktown × VA09W-52 wheat population. Trait QTL Chr.† N-Env. ‡ Pos. Left marker Right marker LOD§ PVE¶ Add#
%
AGBM†† QAgbm.52-4A 4A 16WR-HN 64 S352495200 S137557861 4.70 14.7 -73.15
16WR-LN 62 S544620299 S481064477 4.40 10.0 -45.95
18NK-LN 64 S352495200 S137557861 3.67 11.6 -57.96
NUE QNue.52-2D 2D 16WR-HN 76 S44597217 S35039116 6.75 13.6 1.64
16WR-LN 76 S44597217 S35039116 3.86 8.6 2.49
17WR-HN 76 S44597217 S35039116 3.60 9.5 1.17
17WR-LN 82 S35002830 S32151744 3.22 8.1 2.03
QNue.52-4A 4A 16WR-HN 63 S481064477 S352495200 12.09 26.2 -2.29
16WR-LN 63 S481064477 S352495200 8.35 20.0 -3.82
17WR-HN 64 S352495200 S137557861 6.79 18.6 -1.64
17WR-LN 64 S352495200 S137557861 6.55 15.7 -2.83
18NK-HN 65 S137557861 S58223442 4.33 11.6 -1.86
18NK-LN 64 S352495200 S137557861 8.01 23.9 -4.79
18WR-HN 67 S58223442 S28592992 9.44 19.0 -1.74
18WR-LN 63 S481064477 S352495200 10.75 24.0 -2.83
QNue.52-7A 7A 16WR-HN 38 S10247569 S11056248 2.63 4.9 0.97
16WR-LN 38 S10247569 S11056248 3.43 7.7 2.31
NUtE QNute.52-4A 4A 18NK-HN 60 S544620299 S481064477 2.83 9.1 -0.94
18WR-LN 63 S481064477 S352495200 2.68 6.6 -1.01
AD QAd.52-2D 2D 16WR-HN 76 S44597217 S35039116 25.15 52.1 1.61
16WR-LN 76 S44597217 S35039116 20.09 49.2 1.42
17WR-HN 76 S44597217 S35039116 26.50 50.8 1.40
17WR-LN 76 S44597217 S35039116 19.55 46.2 1.23
18WR-HN 76 S44597217 S35039116 7.33 21.2 0.64
18WR-LN 76 S44597217 S5039116 16.90 37.8 0.98
HGT QHgt.52-1A 1A 18NK-HN 63 S367438005 S261248932 4.96 13.2 -2.62
18NK-LN 63 S367438005 S261248932 3.91 10.7 -2.16
QHgt.52-2D 2D 16WR-HN 75 S44597217 S35039116 8.83 18.4 3.24
16WR-LN 76 S44597217 S35039116 7.89 19.8 3.28
17WR-HN 76 S44597217 S35039116 13.85 25.1 2.68
17WR-LN 76 S44597217 S35039116 5.18 12.8 2.31
18NK-LN 83 S35002830 S32151744 2.57 7.6 1.83
18WR-HN 76 S44597217 S35039116 5.27 14.9 1.87
† Chromosome (Chr.).
‡ Numbers indicate years 2015–2016 (16), 2016-2017 (17), and 2017-2018 (18); letters indicate
locations Warsaw (WR) and New Kent (NK); low (LN) and high (HN) N rates within
environment.
§ Logarithm of odds.
¶Percentage of phenotypic variation explained by the QTL.
#Level of additivity. A positive sign indicates that alleles from Yorktown increased the trait
value and a negative sign indicates that alleles from VA09W-52 increased the trait value.
††Trait abbreviations for above-ground biomass (AGBM), N use efficiency (NUE), N utilization
efficiency (NUtE), anthesis date (AD), and plant height (HGT). Grain yield was excluded from
the results as its QTL were identical to those found for NUE.

99
Table 2.7. Single and combination QTL effects on NUE (kg grain kg N-1) for RILs in the
Yorktown ×VA05W-151 wheat population over four testing environments.
Single Loci Low N P.I.† High N P.I. Combinations Low N P.I. High N P.I.
kg kg N-1 % kg kg N-1 % kg kg N-1 % kg kg N-1 %
QNue.151-1D 1D + 6A
a (75)‡ 64.8 a§ 2.9
36.5 a 2.2
aa (46) 65.5 a 4.1
36.5 a 2.5
b (52) 63.0 b 35.7 a bb (23) 62.9 b 35.6 a
QNue.151-4A 1D + 7D
a (91) 63.5 b -3.3
35.7 b -4.2
aa (34) 65.7 a 5.9
37.1 a 5.7
b (36) 65.6 a 37.2 a bb (22) 62.0 b 35.1 b
QNue.151-6A 6A + 7D
a (78) 64.7 a 2.7
36.2 a 0.8
aa (32) 66.2 a 5.6
36.7 a 4.6
b (48) 63.0 b 35.9 a bb (19) 62.7 b 35.1 b
QNue.151-7D 1D + 6A + 7D
a (64) 65.1 a 2.8
36.8 a 3.3
aaa (19) 66.6 a 5.0
36.9 a 4.2
b (59) 63.3 b 35.6 b bbb (9) 63.4 b 35.4 b
† Percent increase (P.I.) conferred through the ‘a’ allele.
‡ The ‘a’ and ‘b’ alleles are inherited from Yorktown and VA05W-151, respectively. Number of
individuals per allele provided in parentheses.
§ The LSD at P 0.05 is used to compare allele groupings within N rates over four testing
environments; means within a single or combination of QTL followed by the same letter are not
significantly different.

100
Table 2.8. Single and combination QTL effects on NUE (kg grain kg N-1) for DHs in the
Yorktown × VA09W-52 population over four testing environments.
Single Loci Low N P.I.† High N P.I.
QNue.52-2D kg kg N-1 % kg kg N-1 %
a (83) ‡ 63.5 a§ 1.0
35.2 a 2.0
b (53) 62.9 a 34.5 a
QNue.52-4A
a (56) 59.6 b -10.2
33.0 b -9.7
b (82) 65.7 a 36.2 a
QNue.52-7A
a (61) 64.3 a 3.0
35.5 a 3.2
b (63) 62.4 b 34.4 b
Combination Low N P.I. High N P.I.
2D + 7A kg kg N-1 % kg kg N-1 %
aa (38) 64.1 a 4.7
35.5 a 5.3
bb (22) 61.2 b 33.7 b
† Percent increase (P.I.) conferred through the ‘a’ allele.
‡ The ‘a’ and ‘b’ alleles are inherited from Yorktown and VA09W-52, respectively. Number of
individuals per allele provided in parentheses.
§ The LSD at P 0.05 is used to compare allele groupings within N rates over four testing
environments; means within a single or combination of QTL followed by the same letter are not
significantly different.

101
Supplemental Table 2.1. Management practices in each testing environment including product
name, application of fertilizer or active ingredient (A.I.), and date of application. Environment Product Application rate Application date
16WR Lime 2242 kg ha-1 09/24/2015
Pre-plant fertilizer 34-67-67-5S† 10/14/2015
Planting 480 seeds m-2 10/21/2015
Starane™ 0.21 kg A.I. ha-1 12/06/2015
GS25 UAN Variable‡ 02/19/2016
Harmony Extra SG® 0.02 kg A.I. ha-1 03/08/2016
Starane™ 0.15 kg A.I. ha-1 03/08/2016
GS30 UAN Variable‡ 03/12/2016
Palisade EC 0.06 kg A.I. ha-1 03/30/2016
Fitness 0.12 kg A.I. ha-1 03/30/2016
Fitness 0.12 kg A.I. ha-1 04/19/2016
Prosaro 0.14 kg A.I. ha-1 05/20/2016
Harvest - 06/22/2016
17WR Pre-plant fertilizer 30-70-60-5S† 10/17/2016
Planting 480 seeds m-2 10/18/2016
Quelex® 0.01 kg A.I. ha-1 12/04/2016
GS25 UAN Variable‡ 02/06/2017
Tilt 0.07 kg A.I. ha-1 03/09/2017
Tombstone 0.03 kg A.I. ha-1 03/09/2017
GS30 UAN Variable‡ 03/13/2017
Palisade EC 0.08 kg A.I. ha-1 03/17/2017
Tilt 0.07 kg A.I. ha-1 04/05/2017
Prosaro 0.14 kg A.I. ha-1 04/20/2017
Tombstone 0.03 kg A.I. ha-1 04/28/2017
Harvest - 06/12/2017
18WR Lime 2242 kg ha-1 10/04/2017
Pre-plant fertilizer 30-80-80-5S† 10/19/2017
Planting 480 seeds m-2 10/19/2017
Harmony Extra SG® 0.02 kg A.I. ha-1 11/30/2017
Winter fertilizer 33 kg N ha-1 12/07/2017
GS25 UAN Variable‡ 02/09/2018
GS30 UAN Variable‡ 03/10/2018
Palisade EC 0.08 kg A.I. ha-1 03/17/2018
Tilt 0.07 kg A.I. ha-1 03/17/2018
Boron fertilizer 0.01% (w/v) B as Na2B4O7 - H2O 03/27/2018
Fitness 0.12 kg A.I. ha-1 04/11/2018
Prosaro 0.14 kg A.I. ha-1 05/01/2018
Harvest - 06/17/2018
18NK Pre-plant fertilizer 30-50-60† 09/26/2017
Paraquat 0.4 kg A.I. ha-1 10/15/2017
Planting 480 seeds m-2 10/22/2017
Quelex® 0.01 kg A.I. ha-1 12/04/2017
Winter fertilizer 22 kg N ha-1 12/08/2017
Axial XL 0.06 kg A.I. ha-1 12/18/2017
GS25 UAN Variable‡ 01/21/2018
GS30 UAN Variable‡ 02/14/2018
Palisade EC 0.08 kg A.I. ha-1 03/28/2018

102
Environment Product Application rate Application date
Prosaro 0.14 kg A.I. ha-1 05/05/2018
Harvest - 06/21/2018
† Nitrogen (UAN), phosphorous, potassium, and sulfur re-plant fertilizer applied, respectively.
‡ Spring N application rates split applied as 67 or 134 kg N ha-1.

103
Supplemental Table 2.2. Marker report from the Eastern Regional Small Grains Genotyping
Center’s suite of 116 haplotyping markers that were screened in both wheat populations.
Marker name Parent genotype
Marker name Parent genotype
YT† 52 151 YT 52 151
KASP_cim_RhtB1_SNP X:X X:X X:X KASP_IWA886 Y:Y Y:Y Y:Y
KASP_RhtD1 Y:Y Y:Y Y:Y KASP_IWA3805 X:X Y:Y X:X
Rht-B1 B1a B1a B1a Fhb_1A_Neuse no 1A no
Rht-D1 D1b D1b D1b KASP_IWA2793 Y:Y Y:Y Y:Y
KASP_Ppd-A1prodel Y:Y Y:Y Y:Y KASP_IWA2900 Y:Y X:X Y:Y
Ppd-A1 insens insens insens KASP_IWA402 Y:Y Y:Y Y:Y
KASP_TaPpdBJ001 X:X X:X X:X KASP_IWA482 Y:Y X:X X:X
KASP_TaPpdBJ003 no call no call no call Fhb_4A_Neuse 4A no no
Ppd-B1 ** ** ** KASP_IWA3483 X:X X:X X:X
KASP_TaPpdDD001 X:X Y:Y X:X KASP_IWA4036 X:X X:X Y:Y
Ppd-D1 ** insens ** Fhb_6A_Neuse no no no
KASP_vrn-A1_exon4 Y:Y X:X Y:Y KASP_IWA4606 X:X Y:Y X:X
KASP_vrn-A1_exon7 Y:Y X:X Y:Y KASP_IWA5830 X:X X:X X:X
vrn-A1 A1 short A1 Fhb_2B_Bess no no no
vrn-A1_copy_number A1 copy A1 KASP_IWA4755 X:X Y:Y Y:Y
KASP_5A-585397830 Y:Y Y:Y Y:Y KASP_IWA6381 X:X X:X X:X
vrn-A1_MTA short short short KASP_IWB65344 X:X X:X X:X
KASP_vrn-B1_AGS2K X:X X:X X:X Fhb_3B_Bess no no no
vrn-B1 B1 B1 B1 KASP_Lr34 X:X X:X X:X
KASP_Vrn-A1_9K001 X:X X:X X:X KASP_Lr34jagger X:X X:X X:X
KASP_Vrn-A1b-Marq X:X X:X X:X Lr34/Yr18 no no no
Vrn-A1 A1 A1 A1 KASP_Lr37_A X:X X:X X:X
KASP_Vrn-B1_D-I X:X X:X X:X Yr17/Lr37/Sr38 no no no
KASP_Vrn-B1_B X:X X:X X:X KASP_Lr9_A Y:Y no call no call
KASP_Vrn-B1_C no call no call no call Lr9 Lr9 no no
Vrn-B1 B1 B1 B1 GbFd ** ** **
KASP_Vrn-D1-D1a no call no call no call Lr19/Sr25 no no no
Vrn-D1 D1 D1 D1 KASP_Sr24 no call no call Y:Y
KASP_Fhb1 Y:Y Y:Y Y:Y Sr24/Lr24 no no 24
KASP_snp3BS-8 X:X X:X X:X KASP_Sr2_ger9_3p X:X X:X X:X
Fhb1 no no no Sr2 no no no
KASP_Fhb3Bc_6105 X:X X:X X:X KASP_Sr36_8085 X:X X:X X:X
KASP_Fhb3Bc_8137 X:X X:X X:X wmc477Fd 159 163 159
Fhb_3B_Massey no no no Sr36/Pm6 no no no
gwm304Fd 198 198 198 KASP_1RS_6110 X:X X:X X:X
wmc705Pd 160 160 162 KASP_1RS_8035 Y:Y X:X Y:Y
Fhb_5A_Ernie no no no KASP_IWA5194 Y:Y Y:Y Y:Y
Fhb_5A_Ning7840 no no no 1RS 1RS no 1RS
cfd233Fd 274 282 274 KASP_UN_95397731 X:X X:X X:X
gwm539Hd 137 135 133 H13 no no no
Fhb_2DL_Wuhan1/W14 no no no cfa2153Fd ** 203 **
KASP_IWB43992 Y:Y Y:Y X:X H9 no no no
KASP_IWA6259 Y:Y Y:Y X:X Bdv3Fd 184 184 184
KASP_IWA7594 X:X X:X X:X Bdv2/3 no no no
Fhb_1B_Jamestown no no no KASP_wsnp198467 Y:Y X:X X:X
KASP_IWA1587 Y:Y Y:Y Y:Y Sbm1 no Sbm1 Sbm1
KASP_Tsn1_A no call no call no call Pinb-D1 soft soft soft
Tsn1 no no no grain texture soft soft soft
bx7oeFd 400 400 400 KASP_TaSus2-2B X:X X:X X:X
Glu-B1 no no no sucrose synthase no no no
umn19Fd 341 359 341 KASP_Tamyb10-A1_H X:X Y:Y X:X

104
Marker name Parent genotype
Marker name Parent genotype
YT 52 151 YT 52 151
Glu-A1 Ax2* Ax1 Ax2* KASP_Tamyb10_Nor17 X:X X:X X:X
KASP_Glu-D1d_SNP X:X X:X X:X Tamyb10-A1 R-A1 white R-A1
umn25Nd 296 296 296 KASP_Tamyb10-B1 Y:Y Y:Y Y:Y
Glu-D1 2+12 2+12 2+12 Tamyb10-B1 white white white
KASP_pina-D1a X:X X:X X:X KASP_Tamyb10-D1 Y:Y Y:Y Y:Y
Pina-D1 soft soft soft Tamyb10-D1 R-D1 R-D1 R-D1
KASP_pinb-wild X:X X:X X:X combined kernel color RrR rrR RrR
†Genotypic data for Yorktown (YT), VA09W-52 (52), and VA05W-151 (151).

105
Supplemental Table 2.3. ANOVA for agronomic and N traits of wheat parent lines Yorktown
and VA05W-151 within each testing environment. Env. Effect YLD† GNC AGBM HI AD MD HGT LDG NUE NUpE NUtE
16WR‡ G§ * ns ns ns *** - ns ns * ns ns
N ** ns ns ns ns - ns ns *** * ns
G × N ns¶ ns ns ns ns - ns ns ns ns ns
17WR G * ns ns ** ns ns ns ns * ns ns
N *** * * * ns ns ns ns *** ** *
G × N ns ns ns ns ns ns ns ns ns ns ns
18WR G ** ns ** ns ns ns ns ns *** ns ns
N ns ns ** * ns * ns *** *** ** **
G × N * ns ns * ns ns ns ns ** ns ns
18NK G * ns ns ns - - ns ns ns ns *
N * ** ns ns - - ns ns *** ** *
G × N ns ns ns ns - - ns ns ns ns ns
† Trait abbreviations for grain yield (YLD), grain N content (GNC), above-ground biomass
(AGBM), harvest index (HI), anthesis date (AD), maturity date (MD), plant height (HGT),
lodging (LDG), N use efficiency (NUE), N uptake efficiency (NUpE), and N utilization
efficiency (NUtE).
* Significant at the 0.05 probability level.
** Significant at the 0.01 probability level.
*** Significant at the 0.001 probability level.
‡ Numbers indicate years 2015–2016 (16), 2016-2017 (17), and 2017-2018 (18); letters indicate
locations Warsaw (WR) and New Kent (NK).
§ G, parent genotype; N, N rate.
¶ ns, not significant.

106
Supplemental Table 2.4. ANOVA for agronomic and N traits of wheat parent lines Yorktown
and VA09W-52 within each testing environment. Env. Effect YLD† GNC AGBM HI AD MD HGT LDG NUE NUpE NUtE
16WR‡ G§ ns¶ ns ns * * - ns ns ns * *
N * *** ns ns ns - ns ns ** ns ns
G × N ns ** ns ns ns - ns ns ns ns ns
17WR G ns ns ns ns ns ns ns ns ns ns ns
N *** ** * ns ns ns ns ns *** *** ***
G × N ns ns ns ns ns ns * ns ns ns ns
18WR G ns ns ns ns ns ns ** ns ns ns ns
N ns ns ns ns ns ns ** ns *** *** ns
G × N ns ns ns ns ns ns ns ns ns ns ns
18NK G ** * ns ns - - ns ns * ns ns
N ns ns ns ns - - ns ns *** *** ns
G × N ns ns ns ns - - ns ns ns ns ns
† Trait abbreviations for grain yield (YLD), grain N content (GNC), above-ground biomass
(AGBM), harvest index (HI), anthesis date (AD), maturity date (MD), plant height (HGT),
lodging (LDG), N use efficiency (NUE), N uptake efficiency (NUpE), and N utilization
efficiency (NUtE).
* Significant at the 0.05 probability level.
** Significant at the 0.01 probability level.
*** Significant at the 0.001 probability level.
‡ Numbers indicate years 2015–2016 (16), 2016-2017 (17), and 2017-2018 (18); letters indicate
locations Warsaw (WR) and New Kent (NK).
§ G, parent genotype; N, N rate.
¶ ns, not significant.
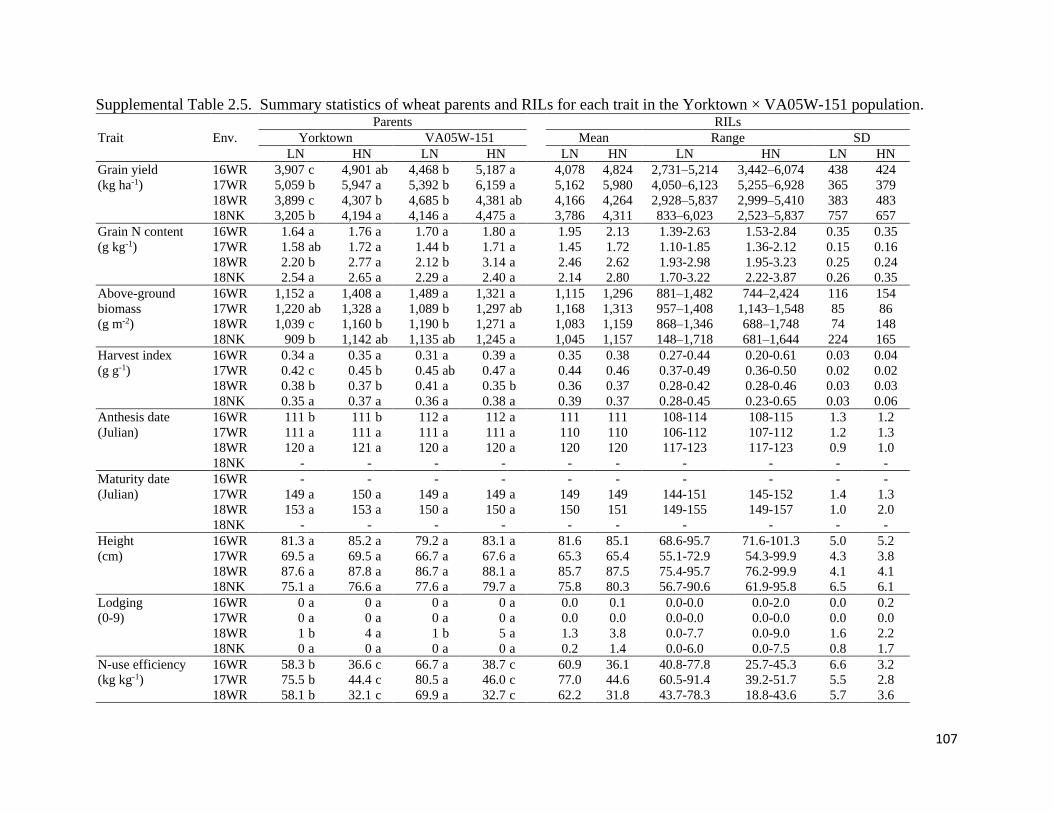
107
Supplemental Table 2.5. Summary statistics of wheat parents and RILs for each trait in the Yorktown × VA05W-151 population.
Trait Env.
Parents RILs
Yorktown VA05W-151 Mean Range SD
LN HN LN HN LN HN LN HN LN HN
Grain yield
(kg ha-1)
16WR 3,907 c 4,901 ab 4,468 b 5,187 a 4,078 4,824 2,731–5,214 3,442–6,074 438 424
17WR 5,059 b 5,947 a 5,392 b 6,159 a 5,162 5,980 4,050–6,123 5,255–6,928 365 379
18WR 3,899 c 4,307 b 4,685 b 4,381 ab 4,166 4,264 2,928–5,837 2,999–5,410 383 483
18NK 3,205 b 4,194 a 4,146 a 4,475 a 3,786 4,311 833–6,023 2,523–5,837 757 657
Grain N content
(g kg-1)
16WR 1.64 a 1.76 a 1.70 a 1.80 a 1.95 2.13 1.39-2.63 1.53-2.84 0.35 0.35
17WR 1.58 ab 1.72 a 1.44 b 1.71 a 1.45 1.72 1.10-1.85 1.36-2.12 0.15 0.16
18WR 2.20 b 2.77 a 2.12 b 3.14 a 2.46 2.62 1.93-2.98 1.95-3.23 0.25 0.24
18NK 2.54 a 2.65 a 2.29 a 2.40 a 2.14 2.80 1.70-3.22 2.22-3.87 0.26 0.35
Above-ground
biomass
(g m-2)
16WR 1,152 a 1,408 a 1,489 a 1,321 a 1,115 1,296 881–1,482 744–2,424 116 154
17WR 1,220 ab 1,328 a 1,089 b 1,297 ab 1,168 1,313 957–1,408 1,143–1,548 85 86
18WR 1,039 c 1,160 b 1,190 b 1,271 a 1,083 1,159 868–1,346 688–1,748 74 148
18NK 909 b 1,142 ab 1,135 ab 1,245 a 1,045 1,157 148–1,718 681–1,644 224 165
Harvest index
(g g-1)
16WR 0.34 a 0.35 a 0.31 a 0.39 a 0.35 0.38 0.27-0.44 0.20-0.61 0.03 0.04
17WR 0.42 c 0.45 b 0.45 ab 0.47 a 0.44 0.46 0.37-0.49 0.36-0.50 0.02 0.02
18WR 0.38 b 0.37 b 0.41 a 0.35 b 0.36 0.37 0.28-0.42 0.28-0.46 0.03 0.03
18NK 0.35 a 0.37 a 0.36 a 0.38 a 0.39 0.37 0.28-0.45 0.23-0.65 0.03 0.06
Anthesis date
(Julian)
16WR 111 b 111 b 112 a 112 a 111 111 108-114 108-115 1.3 1.2
17WR 111 a 111 a 111 a 111 a 110 110 106-112 107-112 1.2 1.3
18WR 120 a 121 a 120 a 120 a 120 120 117-123 117-123 0.9 1.0
18NK - - - - - - - - - -
Maturity date
(Julian)
16WR - - - - - - - - - -
17WR 149 a 150 a 149 a 149 a 149 149 144-151 145-152 1.4 1.3
18WR 153 a 153 a 150 a 150 a 150 151 149-155 149-157 1.0 2.0
18NK - - - - - - - - - -
Height
(cm)
16WR 81.3 a 85.2 a 79.2 a 83.1 a 81.6 85.1 68.6-95.7 71.6-101.3 5.0 5.2
17WR 69.5 a 69.5 a 66.7 a 67.6 a 65.3 65.4 55.1-72.9 54.3-99.9 4.3 3.8
18WR 87.6 a 87.8 a 86.7 a 88.1 a 85.7 87.5 75.4-95.7 76.2-99.9 4.1 4.1
18NK 75.1 a 76.6 a 77.6 a 79.7 a 75.8 80.3 56.7-90.6 61.9-95.8 6.5 6.1
Lodging
(0-9)
16WR 0 a 0 a 0 a 0 a 0.0 0.1 0.0-0.0 0.0-2.0 0.0 0.2
17WR 0 a 0 a 0 a 0 a 0.0 0.0 0.0-0.0 0.0-0.0 0.0 0.0
18WR 1 b 4 a 1 b 5 a 1.3 3.8 0.0-7.7 0.0-9.0 1.6 2.2
18NK 0 a 0 a 0 a 0 a 0.2 1.4 0.0-6.0 0.0-7.5 0.8 1.7
N-use efficiency
(kg kg-1)
16WR 58.3 b 36.6 c 66.7 a 38.7 c 60.9 36.1 40.8-77.8 25.7-45.3 6.6 3.2
17WR 75.5 b 44.4 c 80.5 a 46.0 c 77.0 44.6 60.5-91.4 39.2-51.7 5.5 2.8
18WR 58.1 b 32.1 c 69.9 a 32.7 c 62.2 31.8 43.7-78.3 18.8-43.6 5.7 3.6

108
Parents RILs
Trait Env. Yorktown VA05W-151 Mean Range SD
LN HN LN HN LN HN LN HN LN HN
18NK 47.8 b 31.3 c 61.9 a 33.4 c 56.0 32.2 7.70-89.9 22.4-40.4 11.9 4.9
N-uptake efficiency
(kg kg-1)
16WR 2.84 ab 1.58 b 4.10 a 1.98 b 2.27 1.51 1.03-5.09 0.77-3.37 0.95 0.54
17WR 1.74 a 1.07 b 1.58 a 1.12 b 1.66 1.16 1.08-3.21 0.84-1.79 0.37 0.21
18WR 1.92 ab 1.38 c 2.12 a 1.59 bc 1.95 1.35 1.45-3.03 0.91-2.41 0.29 0.27
18NK 1.89 ab 1.30 b 2.09 a 1.31 b 2.12 1.32 0.29-3.54 0.68-1.83 0.47 0.21
N-utilization
efficiency
(kg kg-1)
16WR 22.4 a 27.9 a 17.2 a 19.5 a 30.7 26.6 12.1-55.6 11.0-45.5 10.7 8.4
17WR 44.9 ab 42.0 b 51.2 a 41.2 b 48.2 39.5 27.0-71.7 23.4-54.9 8.4 6.2
18WR 30.4 a 23.3 b 33.4 a 21.1 b 32.3 24.4 17.8-39.9 17.4-30.7 4.1 4.7
18NK 25.9 b 24.0 b 29.9 a 25.6 b 26.5 24.6 20.7-34.0 12.8-34.2 2.5 2.5
† The LSD at P 0.05 is used to compare parental lines across N rates within an environment; means within an environment followed
by the same letter are not significantly different.
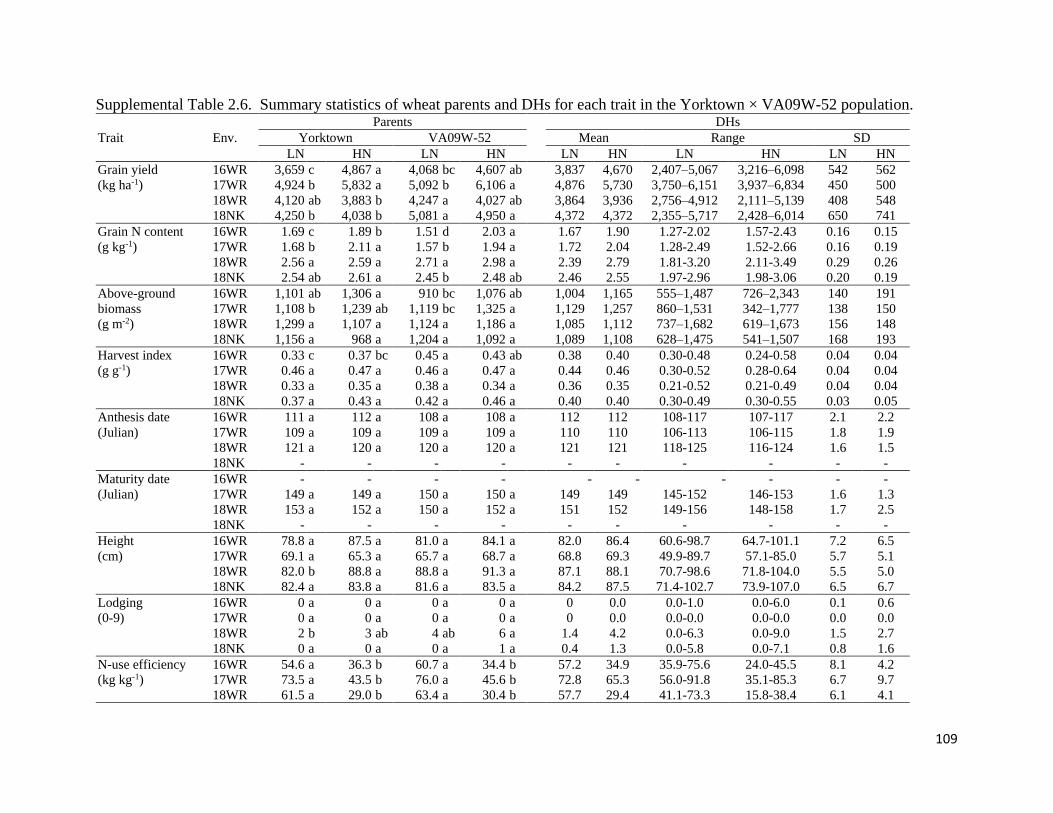
109
Supplemental Table 2.6. Summary statistics of wheat parents and DHs for each trait in the Yorktown × VA09W-52 population.
Trait Env.
Parents DHs
Yorktown VA09W-52 Mean Range SD
LN HN LN HN LN HN LN HN LN HN
Grain yield
(kg ha-1)
16WR 3,659 c 4,867 a 4,068 bc 4,607 ab 3,837 4,670 2,407–5,067 3,216–6,098 542 562
17WR 4,924 b 5,832 a 5,092 b 6,106 a 4,876 5,730 3,750–6,151 3,937–6,834 450 500
18WR 4,120 ab 3,883 b 4,247 a 4,027 ab 3,864 3,936 2,756–4,912 2,111–5,139 408 548
18NK 4,250 b 4,038 b 5,081 a 4,950 a 4,372 4,372 2,355–5,717 2,428–6,014 650 741
Grain N content
(g kg-1)
16WR 1.69 c 1.89 b 1.51 d 2.03 a 1.67 1.90 1.27-2.02 1.57-2.43 0.16 0.15
17WR 1.68 b 2.11 a 1.57 b 1.94 a 1.72 2.04 1.28-2.49 1.52-2.66 0.16 0.19
18WR 2.56 a 2.59 a 2.71 a 2.98 a 2.39 2.79 1.81-3.20 2.11-3.49 0.29 0.26
18NK 2.54 ab 2.61 a 2.45 b 2.48 ab 2.46 2.55 1.97-2.96 1.98-3.06 0.20 0.19
Above-ground
biomass
(g m-2)
16WR 1,101 ab 1,306 a 910 bc 1,076 ab 1,004 1,165 555–1,487 726–2,343 140 191
17WR 1,108 b 1,239 ab 1,119 bc 1,325 a 1,129 1,257 860–1,531 342–1,777 138 150
18WR 1,299 a 1,107 a 1,124 a 1,186 a 1,085 1,112 737–1,682 619–1,673 156 148
18NK 1,156 a 968 a 1,204 a 1,092 a 1,089 1,108 628–1,475 541–1,507 168 193
Harvest index
(g g-1)
16WR 0.33 c 0.37 bc 0.45 a 0.43 ab 0.38 0.40 0.30-0.48 0.24-0.58 0.04 0.04
17WR 0.46 a 0.47 a 0.46 a 0.47 a 0.44 0.46 0.30-0.52 0.28-0.64 0.04 0.04
18WR 0.33 a 0.35 a 0.38 a 0.34 a 0.36 0.35 0.21-0.52 0.21-0.49 0.04 0.04
18NK 0.37 a 0.43 a 0.42 a 0.46 a 0.40 0.40 0.30-0.49 0.30-0.55 0.03 0.05
Anthesis date
(Julian)
16WR 111 a 112 a 108 a 108 a 112 112 108-117 107-117 2.1 2.2
17WR 109 a 109 a 109 a 109 a 110 110 106-113 106-115 1.8 1.9
18WR 121 a 120 a 120 a 120 a 121 121 118-125 116-124 1.6 1.5
18NK - - - - - - - - - -
Maturity date
(Julian)
16WR - - - - - - - - - -
17WR 149 a 149 a 150 a 150 a 149 149 145-152 146-153 1.6 1.3
18WR 153 a 152 a 150 a 152 a 151 152 149-156 148-158 1.7 2.5
18NK - - - - - - - - - -
Height
(cm)
16WR 78.8 a 87.5 a 81.0 a 84.1 a 82.0 86.4 60.6-98.7 64.7-101.1 7.2 6.5
17WR 69.1 a 65.3 a 65.7 a 68.7 a 68.8 69.3 49.9-89.7 57.1-85.0 5.7 5.1
18WR 82.0 b 88.8 a 88.8 a 91.3 a 87.1 88.1 70.7-98.6 71.8-104.0 5.5 5.0
18NK 82.4 a 83.8 a 81.6 a 83.5 a 84.2 87.5 71.4-102.7 73.9-107.0 6.5 6.7
Lodging
(0-9)
16WR 0 a 0 a 0 a 0 a 0 0.0 0.0-1.0 0.0-6.0 0.1 0.6
17WR 0 a 0 a 0 a 0 a 0 0.0 0.0-0.0 0.0-0.0 0.0 0.0
18WR 2 b 3 ab 4 ab 6 a 1.4 4.2 0.0-6.3 0.0-9.0 1.5 2.7
18NK 0 a 0 a 0 a 1 a 0.4 1.3 0.0-5.8 0.0-7.1 0.8 1.6
N-use efficiency
(kg kg-1)
16WR 54.6 a 36.3 b 60.7 a 34.4 b 57.2 34.9 35.9-75.6 24.0-45.5 8.1 4.2
17WR 73.5 a 43.5 b 76.0 a 45.6 b 72.8 65.3 56.0-91.8 35.1-85.3 6.7 9.7
18WR 61.5 a 29.0 b 63.4 a 30.4 b 57.7 29.4 41.1-73.3 15.8-38.4 6.1 4.1

110
Trait Env.
Parents DHs
Yorktown VA09W-52 Mean Range SD
LN HN LN HN LN HN LN HN LN HN
18NK 63.4 b 30.1 c 74.5 a 36.9 c 65.3 32.6 35.1-85.3 18.1-44.9 9.7 5.3
N-uptake efficiency
(kg kg-1)
16WR 2.66 a 1.44 b 1.27 b 1.01 b 1.66 1.12 0.98-3.80 0.67-2.23 0.62 0.31
17WR 1.63 a 1.21 b 1.56 a 1.23 b 1.68 2.42 1.26-2.63 1.50-3.73 0.20 0.41
18WR 2.77 a 1.25 b 2.60 a 1.53 b 2.11 1.38 1.40-3.54 0.85-4.64 0.33 0.36
18NK 2.62 a 1.22 b 2.69 a 1.30 b 2.42 1.31 1.50-3.73 0.71-1.73 0.41 0.21
N-utilization
efficiency
(kg kg-1)
16WR 21.7 b 27.8 b 48.0 a 34.2 ab 38.5 32.9 16.7-59.0 17.3-47.6 10.1 7.2
17WR 45.1 a 36.0 b 48.7 a 37.3 b 42.8 27.2 29.4-51.0 20.6-35.7 3.7 2.9
18WR 22.3 a 23.7 a 25.6 a 20.0 a 27.8 22.0 17.5-39.3 7.1-33.4 4.1 3.7
18NK 24.3 a 25.2 a 27.7 a 28.5 a 27.2 25.1 20.6-35.7 18.7-33.3 2.9 3.1
† The LSD at P 0.05 is used to compare parental lines across N rates within an environment; means within an environment followed
by the same letter are not significantly different.

111
Supplemental Table 2.7. Quantitative trait loci (QTL) associated with N and agronomic traits in
one N-environments in the Yorktown × VA05W-151 wheat population. Trait Chr.† N-Env. ‡ Pos. Left marker Right marker LOD§ PVE¶ Add#
%
AD†† 1D 16WR-HN 99 S331192008 S96704215 2.51 9.35 0.39
4A 16WR-HN 37 S423586538 S7441669 3.33 9.65 -0.40
5B 16WR-LN 165 S706353953 S685218875 4.19 10.08 0.46
7A 16WR-LN 39 S101469749 S89976042 5.43 13.72 -0.54
7A 17WR-HN 85 S700115395 S710197438 2.58 8.49 -0.38
7B 16WR-HN 53 S739405563 S730299386 2.52 6.53 -0.34
AGBM 1D 17WR-HN 105 S331192008 S96704215 8.90 17.70 42.85
1D 17WR-LN 67 S31421492 S52583851 5.14 12.82 31.78
2B 18WR-HN 1 S44752993 S44754542 2.60 2.27 -38.31
2D 17WR-HN 16 S19051559 S18166508 2.57 4.31 -20.32
7B 17WR-HN 131 S10160986 S5980505 4.19 7.33 -26.37
GNC 1A 18WR-LN 44 S536172066 S536294689 2.66 7.73 -0.07
2D 16WR-LN 117 S406151907 S459517523 3.40 9.58 -0.12
5D 16WR-LN 33 S396986910 S405321115 3.12 7.69 -0.11
5D 17WR-HN 0 S540196427 S546020057 2.85 9.37 0.05
5D 18WR-LN 0 S254497728 S143735165 2.98 8.70 0.08
HGT 1B 16WR-HN 7 S25475412 S26433743 4.19 13.09 2.00
3B 18WR-LN 91 S598995503 S236353481 3.66 12.04 1.84
7A 16WR-HN 31 S660537877 S661534491 2.52 7.28 1.38
7D 17WR-LN 72 S220991869 S201977415 2.99 10.2 -1.31
HI 3D 18NK-HN 28 S430360367 S442814795 2.54 7.31 -0.01
4A 18WR-LN 0 S40243263 S40252565 6.46 17.00 0.01
5B 17WR-LN 165 S706353953 S685218875 3.07 11.22 0.01
5D 17WR-HN 42 S556723663 S562030409 3.73 8.16 0.01
6A 18NK-LN 54 S617207033 S556967794 5.40 16.26 -0.01
7A 17WR-HN 14 S621213341 S639296223 5.18 11.74 -0.01
7A 17WR-HN 13 S30064864 S23108024 2.55 5.42 -0.01
7D 18WR-LN 71 S176567249 S213740699 3.60 9.11 0.01
LDG 4D 18NK-HN 53 S480514255 S482954488 2.68 9.00 -0.51
MD 1A 18WR-LN 7 S532668674 S536067277 3.09 7.82 -0.49
1B 17WR-LN 4 S22056647 S17836570 4.25 7.46 -0.48
2B 18WR-HN 11 S41442050 S37359247 4.38 14.26 0.74
NUE 2B 17WR-HN 20 S27008007 S28419889 2.91 6.11 0.74
2B 17WR-LN 1 S699106811 S701094516 2.51 4.71 1.23
2D 17WR-HN 15 S19847217 S19051559 2.56 5.10 -0.68
3B 18WR-LN 95 S269253850 S621935545 2.67 9.66 -1.71
3D 18WR-LN 44 S595066861 S594754857 4.09 12.01 1.86
4D 16WR-LN 0 S509798252 S499573720 3.45 8.98 1.97
4D 18WR-HN 17 S389572522 S28548806 3.00 8.22 -1.14
5D 18NK-HN 31 S556844077 S556723663 2.64 7.06 -1.34
7A 17WR-LN 23 S115834359 S112241400 3.69 6.91 -1.48
7B 16WR-LN 5 S682597816 S693793240 4.25 12.35 2.32
NUpE 2A 18NK-LN 73 S678190504 S637991282 3.86 11.16 0.15
2D 16WR-HN 4 S21934481 S21785248 2.76 8.56 0.14
3B 16WR-HN 82 S779966541 S788042552 4.40 13.81 0.18
6A 18NK-LN 73 S508845927 S473574940 4.40 13.11 0.17
NUtE 1B 18NK-HN 21 S648133593 S653887678 2.90 7.40 0.72
2D 16WR-HN 4 S21934481 S21785248 2.76 8.22 -2.17
2D 16WR-LN 15 S19847217 S19051559 3.91 5.82 -3.25
4A 18NK-HN 25 S583019201 S552215864 5.93 15.63 -1.05
4A 18WR-LN 0 S40243263 S40252565 3.46 11.48 -1.39
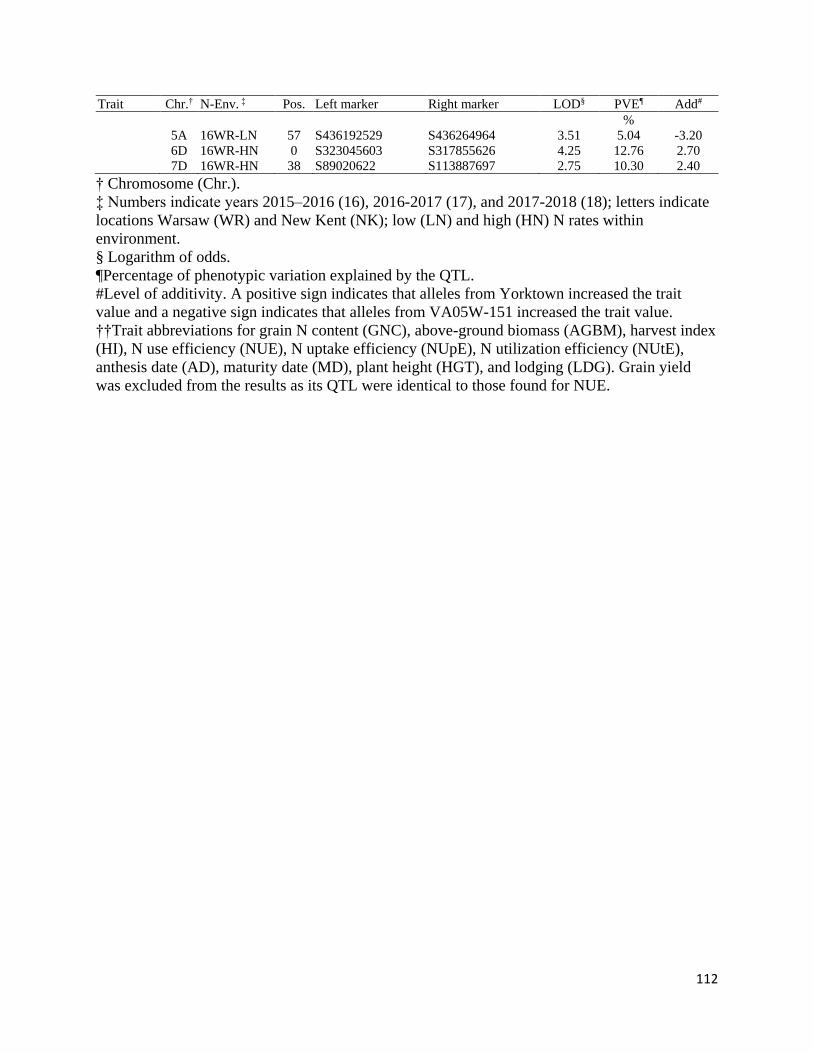
112
Trait Chr.† N-Env. ‡ Pos. Left marker Right marker LOD§ PVE¶ Add#
%
5A 16WR-LN 57 S436192529 S436264964 3.51 5.04 -3.20
6D 16WR-HN 0 S323045603 S317855626 4.25 12.76 2.70
7D 16WR-HN 38 S89020622 S113887697 2.75 10.30 2.40
† Chromosome (Chr.).
‡ Numbers indicate years 2015–2016 (16), 2016-2017 (17), and 2017-2018 (18); letters indicate
locations Warsaw (WR) and New Kent (NK); low (LN) and high (HN) N rates within
environment.
§ Logarithm of odds.
¶Percentage of phenotypic variation explained by the QTL.
#Level of additivity. A positive sign indicates that alleles from Yorktown increased the trait
value and a negative sign indicates that alleles from VA05W-151 increased the trait value. ††Trait abbreviations for grain N content (GNC), above-ground biomass (AGBM), harvest index
(HI), N use efficiency (NUE), N uptake efficiency (NUpE), N utilization efficiency (NUtE),
anthesis date (AD), maturity date (MD), plant height (HGT), and lodging (LDG). Grain yield
was excluded from the results as its QTL were identical to those found for NUE.
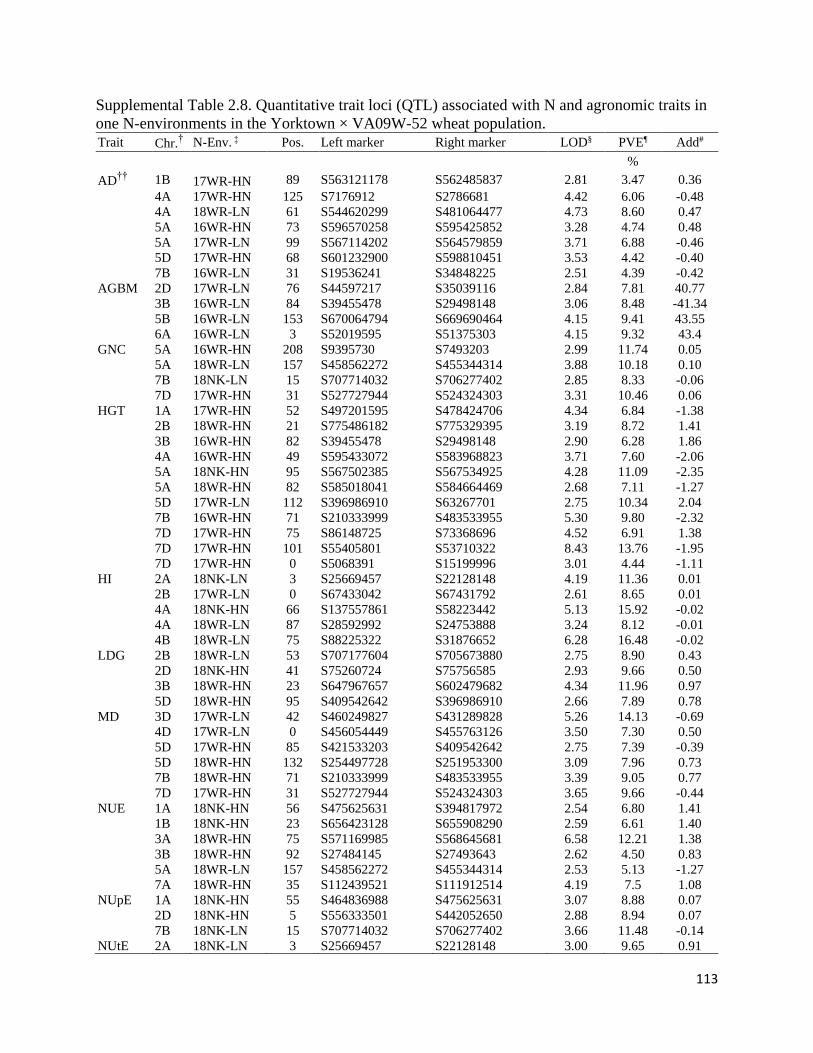
113
Supplemental Table 2.8. Quantitative trait loci (QTL) associated with N and agronomic traits in
one N-environments in the Yorktown × VA09W-52 wheat population. Trait Chr.† N-Env. ‡ Pos. Left marker Right marker LOD§ PVE¶ Add#
%
AD†† 1B 17WR-HN 89 S563121178 S562485837 2.81 3.47 0.36
4A 17WR-HN 125 S7176912 S2786681 4.42 6.06 -0.48
4A 18WR-LN 61 S544620299 S481064477 4.73 8.60 0.47
5A 16WR-HN 73 S596570258 S595425852 3.28 4.74 0.48
5A 17WR-LN 99 S567114202 S564579859 3.71 6.88 -0.46
5D 17WR-HN 68 S601232900 S598810451 3.53 4.42 -0.40
7B 16WR-LN 31 S19536241 S34848225 2.51 4.39 -0.42
AGBM 2D 17WR-LN 76 S44597217 S35039116 2.84 7.81 40.77
3B 16WR-LN 84 S39455478 S29498148 3.06 8.48 -41.34
5B 16WR-LN 153 S670064794 S669690464 4.15 9.41 43.55
6A 16WR-LN 3 S52019595 S51375303 4.15 9.32 43.4
GNC 5A 16WR-HN 208 S9395730 S7493203 2.99 11.74 0.05
5A 18WR-LN 157 S458562272 S455344314 3.88 10.18 0.10
7B 18NK-LN 15 S707714032 S706277402 2.85 8.33 -0.06
7D 17WR-HN 31 S527727944 S524324303 3.31 10.46 0.06
HGT 1A 17WR-HN 52 S497201595 S478424706 4.34 6.84 -1.38
2B 18WR-HN 21 S775486182 S775329395 3.19 8.72 1.41
3B 16WR-HN 82 S39455478 S29498148 2.90 6.28 1.86
4A 16WR-HN 49 S595433072 S583968823 3.71 7.60 -2.06
5A 18NK-HN 95 S567502385 S567534925 4.28 11.09 -2.35
5A 18WR-HN 82 S585018041 S584664469 2.68 7.11 -1.27
5D 17WR-LN 112 S396986910 S63267701 2.75 10.34 2.04
7B 16WR-HN 71 S210333999 S483533955 5.30 9.80 -2.32
7D 17WR-HN 75 S86148725 S73368696 4.52 6.91 1.38
7D 17WR-HN 101 S55405801 S53710322 8.43 13.76 -1.95
7D 17WR-HN 0 S5068391 S15199996 3.01 4.44 -1.11
HI 2A 18NK-LN 3 S25669457 S22128148 4.19 11.36 0.01
2B 17WR-LN 0 S67433042 S67431792 2.61 8.65 0.01
4A 18NK-HN 66 S137557861 S58223442 5.13 15.92 -0.02
4A 18WR-LN 87 S28592992 S24753888 3.24 8.12 -0.01
4B 18WR-LN 75 S88225322 S31876652 6.28 16.48 -0.02
LDG 2B 18WR-LN 53 S707177604 S705673880 2.75 8.90 0.43
2D 18NK-HN 41 S75260724 S75756585 2.93 9.66 0.50
3B 18WR-HN 23 S647967657 S602479682 4.34 11.96 0.97
5D 18WR-HN 95 S409542642 S396986910 2.66 7.89 0.78
MD 3D 17WR-LN 42 S460249827 S431289828 5.26 14.13 -0.69
4D 17WR-LN 0 S456054449 S455763126 3.50 7.30 0.50
5D 17WR-HN 85 S421533203 S409542642 2.75 7.39 -0.39
5D 18WR-HN 132 S254497728 S251953300 3.09 7.96 0.73
7B 18WR-HN 71 S210333999 S483533955 3.39 9.05 0.77
7D 17WR-HN 31 S527727944 S524324303 3.65 9.66 -0.44
NUE 1A 18NK-HN 56 S475625631 S394817972 2.54 6.80 1.41
1B 18NK-HN 23 S656423128 S655908290 2.59 6.61 1.40
3A 18WR-HN 75 S571169985 S568645681 6.58 12.21 1.38
3B 18WR-HN 92 S27484145 S27493643 2.62 4.50 0.83
5A 18WR-LN 157 S458562272 S455344314 2.53 5.13 -1.27
7A 18WR-HN 35 S112439521 S111912514 4.19 7.5 1.08
NUpE 1A 18NK-HN 55 S464836988 S475625631 3.07 8.88 0.07
2D 18NK-HN 5 S556333501 S442052650 2.88 8.94 0.07
7B 18NK-LN 15 S707714032 S706277402 3.66 11.48 -0.14
NUtE 2A 18NK-LN 3 S25669457 S22128148 3.00 9.65 0.91

114
Trait Chr.† N-Env. ‡ Pos. Left marker Right marker LOD§ PVE¶ Add#
%
3B 16WR-LN 65 S45271380 S44274197 2.53 8.08 -2.84
3B 18WR-LN 30 S586509678 S523569541 2.78 6.90 -1.01
3B 18WR-LN 42 S762639074 S760963490 2.73 6.81 -1.00
5A 18WR-LN 157 S458562272 S455344314 3.96 10.37 -1.23
7D 17WR-HN 32 S529393082 S529349312 4.37 13.80 -1.70
7D 18WR-LN 85 S86148725 S73368696 3.26 8.17 -1.10
† Chromosome (Chr.).
‡ Numbers indicate years 2015–2016 (16), 2016-2017 (17), and 2017-2018 (18); letters indicate
locations Warsaw (WR) and New Kent (NK); low (LN) and high (HN) N rates within
environment.
§ Logarithm of odds.
¶Percentage of phenotypic variation explained by the QTL.
#Level of additivity. A positive sign indicates that alleles from Yorktown increased the trait
value and a negative sign indicates that alleles from VA09W-52 increased the trait value.
††Trait abbreviations for grain N content (GNC), above-ground biomass (AGBM), harvest index
(HI), N use efficiency (NUE), N uptake efficiency (NUpE), N utilization efficiency (NUtE),
anthesis date (AD), maturity date (MD), plant height (HGT), and lodging (LDG). Grain yield
was excluded from the results as its QTL were identical to those found for NUE.

115
CHAPTER III:
PHOTOPERIOD RESPONSE GENE PPD-D1 AFFECTS NITROGEN USE
EFFICIENCY IN SOFT RED WINTER WHEAT
Kyle G. Brasier,* Bishal G. Tamang, Neal R. Carpenter, Takeshi Fukao, Mark S. Reiter, Robert
M. Pitman, Clay H. Sneller, Wade E. Thomason, and Carl A. Griffey
K.G. Brasier, T. Fukao, W.E. Thomason, and C.A. Griffey, Dep. of Crop and Soil Environmental
Sciences, Virginia Tech, Blacksburg, VA 24061; B.G. Tamang, Dep. of Agronomy and Plant
Genetics, Univ. of Minnesota, Saint Paul, MN 55108; N.R. Carpenter, Dep. of Agronomy,
Purdue Univ., West Layfette, IN 47907; T. Fukao, Fralin Life Science Institute, Virginia Tech,
Blacksburg, VA 24061; M.S. Reiter, Eastern Shore Agricultural Research and Extension Center,
Virginia Tech, Painter, VA 23420; R.M. Pitman, Eastern Virginia Agricultural Research and
Extension Center, Virginia Tech, Warsaw, VA 22572; C.H. Sneller, Dep. of Horticulture and
Crop Science, The Ohio State Univ., Wooster, OH 44691. Received 24 Mar. 2018. Accepted 1
Aug. 2018.
*Corresponding author ([email protected]). Assigned to Associate Editor Jessica Torrion.
Abbreviation: BVA, Blacksburg, VA, location; COH, Custar, OH, location; GS, growth stage;
NUE, nitrogen use efficiency; NUpE, nitrogen uptake efficiency; NUtE, nitrogen utilization
efficiency; PVA, Painter, VA, location; WVA, Warsaw, VA, location.
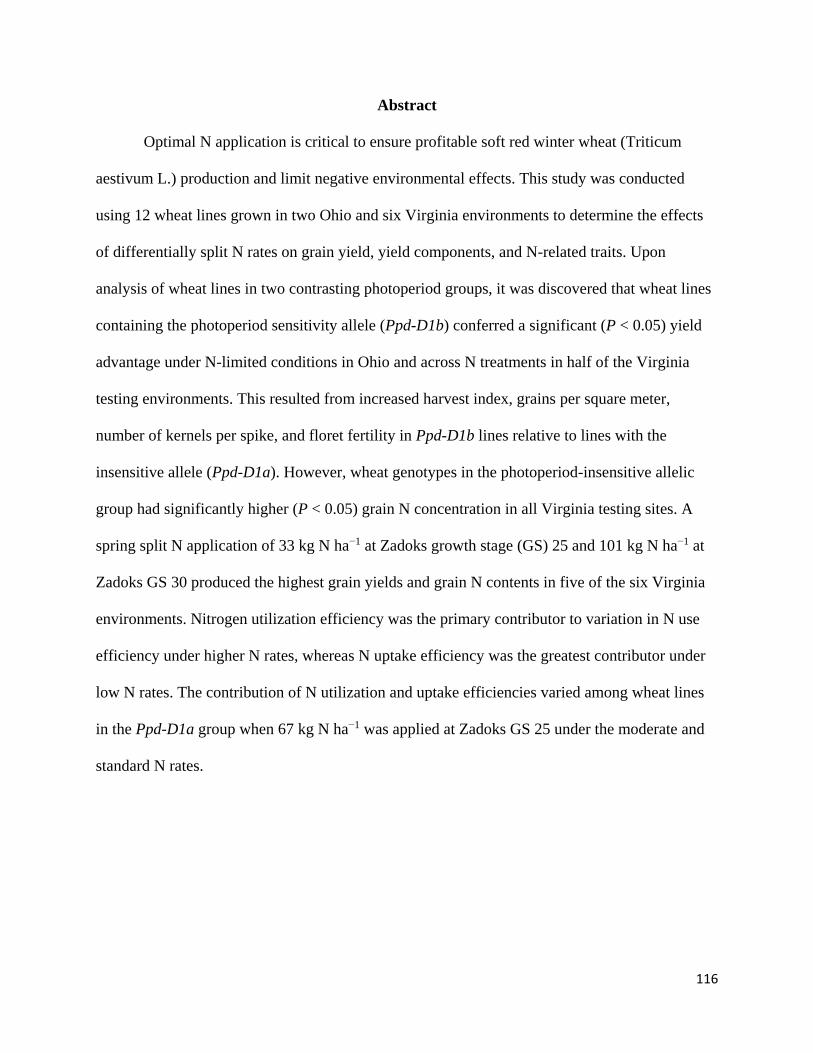
116
Abstract
Optimal N application is critical to ensure profitable soft red winter wheat (Triticum
aestivum L.) production and limit negative environmental effects. This study was conducted
using 12 wheat lines grown in two Ohio and six Virginia environments to determine the effects
of differentially split N rates on grain yield, yield components, and N-related traits. Upon
analysis of wheat lines in two contrasting photoperiod groups, it was discovered that wheat lines
containing the photoperiod sensitivity allele (Ppd-D1b) conferred a significant (P < 0.05) yield
advantage under N-limited conditions in Ohio and across N treatments in half of the Virginia
testing environments. This resulted from increased harvest index, grains per square meter,
number of kernels per spike, and floret fertility in Ppd-D1b lines relative to lines with the
insensitive allele (Ppd-D1a). However, wheat genotypes in the photoperiod-insensitive allelic
group had significantly higher (P < 0.05) grain N concentration in all Virginia testing sites. A
spring split N application of 33 kg N ha−1 at Zadoks growth stage (GS) 25 and 101 kg N ha−1 at
Zadoks GS 30 produced the highest grain yields and grain N contents in five of the six Virginia
environments. Nitrogen utilization efficiency was the primary contributor to variation in N use
efficiency under higher N rates, whereas N uptake efficiency was the greatest contributor under
low N rates. The contribution of N utilization and uptake efficiencies varied among wheat lines
in the Ppd-D1a group when 67 kg N ha−1 was applied at Zadoks GS 25 under the moderate and
standard N rates.

117
Introduction
Wheat (Triticum aestivum L.) yield improvement during the second half of the 20th
century is largely attributed to a combination of intensified N management and the introduction
of semidwarf cultivars expressing a positive response to added N (Evenson and Gollin, 2003).
However, yield gains derived exclusively from greater rates of N fertilization may reduce grower
profits and contribute to eutrophication, the release of greenhouse gasses, and degradation of
aquatic and terrestrial ecosystems (Heisler et al., 2008; Howarth, 2008). It has been estimated
that 50 to 70% of applied N is not taken up by plants and is lost from agricultural production
systems (Good et al., 2004). In addition, over one-third of the annual N load going into estuaries
within the Northeast and Mid-Atlantic regions of the United States is derived from agricultural
sources (Moore et al., 2011). Plant breeders, agronomists, and growers are thus faced with the
challenge of developing highly N-efficient cultivars and production systems to feed growing
populations while also fostering the principles of environmental stewardship.
Improvements in nitrogen use efficiency (NUE) are most readily achieved at the on-farm
level through the adoption of more efficient nutrient management practices (e.g., N rate, source,
timing, and placement) (Zhang et al., 2015). In Virginia, spring-applied N is typically split over
two development stages to increase NUE by meeting plant demands during periods of high N
uptake. The first application of spring N in Virginia generally occurs when winter wheat breaks
dormancy in late February, demanding N fertilizer for tiller production (Alley et al., 1996). The
stem elongation phase begins ~30 d after breaking dormancy, requiring a second application of
N for vegetative growth and grain fill. Yield advantages from splitting N applications over
multiple developmental stages were also reported in winter wheat grown in the South Central
region of the United States (Raun et al., 2002) and Iran (Abedi et al., 2011). However,

118
management guidelines are dependent on the class of wheat, end uses, and growing environment.
For instance, in an investigation of hard red spring wheat in the Northern Great Plains of the
United States, N applied before the five-leaf stage resulted in greater tiller production than an
equally split N application of the same rate at preplant, the five-leaf stage, and postanthesis, but
the increased tiller number did not translate into a significant increase in grain yield (Otteson et
al., 2007). The authors further reported that the wheat lines themselves were the most significant
factor in grain yield determination; however, the genetics and physiology underlying the
observed genotypic variation was not investigated further.
Genes governing photoperiod response have been shown to provide adaptability to
challenging environments by regulating flowering date and offering avoidance to abiotic stresses.
A photoperiod gene, Ppd-D1, on wheat chromosome 2D has been shown to act pleiotropically to
affect a number of traits including flowering date, spikelet number, and floret fertility (González
et al., 2005). In a study of near-isogenic wheat lines in the United Kingdom, the photoperiod
insensitivity allele (Ppd-D1a) functioned by reducing the duration of preanthesis developmental
stages and consequently time to flowering (Foulkes et al., 2004). The authors also reported
higher grain yields and greater preanthesis water uptake in photoperiod-sensitive (Ppd-D1b)
lines under both irrigated and nonirrigated conditions, associating photoperiod response with
abiotic stress adaptation. Furthermore, genetic markers associated with NUE and N-related traits
have been identified near the Ppd-D1 locus in several genetic mapping studies (Laperche et al.,
2007; Bogard et al., 2013; Cormier et al., 2014; Mahjourimajd et al., 2016), suggesting a link
between photoperiod sensitivity and NUE.
Contributions of yield building components to crop productivity have been a prevalent
topic of investigation in recent years, which have resulted in a better understanding of

119
morphophysiological stress responses and facilitated breeding directions. In a study of wheat
response to N stress, a direct relationship between grain number per spike and grain yield was
reported under both optimal and reduced N conditions (Lu et al., 2015). Similar findings were
also reported for durum wheat (Triticum durum Desf.) grown in a Mediterranean climate
(Ferrante et al., 2010) and soft red winter wheat grown in the eastern United States (Tamang et
al., 2017). In contrast, Albrizio et al. (2010) found that grain number per square meter, as
influenced by N availability, accounted for much of the observed variation in grain yield.
However, a combination of modifications in spike morphology, aboveground structure, and
nutrient partitioning is required for robust genetic gains in grain yield across varying levels of N
fertility (Foulkes et al., 2009; Barraclough et al., 2014; Gaju et al., 2014). Identification of N-
responsive morphological traits may enable wheat breeders to more effectively develop broadly
adapted N-efficient cultivars.
Nitrogen use efficiency, classically defined as the amount of grain yield produced per
unit of N applied, is the product of two component traits: N uptake (NUpE) and N utilization
(NUtE) efficiencies (Moll et al., 1982). Nitrogen uptake efficiency is calculated as the
aboveground N at harvest per unit of N applied, whereas NUtE is the amount of grain produced
per total aboveground N in the plant at harvest. To date, several studies have investigated
variation in the relative contribution of NUpE and NUtE to NUE for wheat lines under a range of
N regimes and growing environments (Le Gouis et al., 2000; Barraclough et al., 2010; Gaju et
al., 2011; Latshaw et al., 2016; Hitz et al., 2017). Although these investigations report significant
genotypic variation and differences by N rate, the effects of photoperiod sensitivity under
differentially split N to the percentage contribution of each component trait to NUE has not yet
been reported.

120
Despite extensive research and improvements in NUE, investigations into the effects of N
rates and spring splitting ratios on NUE in diverse breeding stocks and photoperiod groups are
extremely limited. The objectives of this study were (i) to validate traits associated with NUE,
and (ii) to evaluate the effects of differentially split spring N rates and subsequently photoperiod
alleles on grain yield, yield components, and N-related traits.
Materials and Methods
Testing Environments and Experimental Design
Field experiments were performed under rainfed conditions at one Ohio and three
Virginia locations (Supplemental Table S1.1.). These included the Northwest Agricultural
Research Center near Custar, OH, in 2013–2014 and 2014– 2015 (COH; 4117 N, 8307 W),
Kentland Farm near Blacksburg, VA in 2015–2016 (BVA; 3711N, 8034 W), the Eastern
Shore Agricultural Research and Extension Center near Painter, VA, in 2013–2014 and 2014–
2015 (PVA; 3735 N, 7549 W), and the Eastern Virginia Agricultural Research and Extension
Center near Warsaw, VA in 2013–2014, 2014–2015, and 2015–2016 (WVA; 3759 N, 7646
W). Seeds were treated with Raxil MD (triazole, Bayer Crop Science) and Gaucho XT
(imidacloprid, Bayer Crop Science) to control diseases and insects, respectively. Planting dates
were dependent on optimal environmental conditions at each site, ranging from 2 to 29 October
(Supplemental Table S1.1.), and plots were sown at a seeding density of 520 seeds m−2 on the
basis of kernel weight. A randomized complete block design was used for all testing
environments in which five N treatments were applied to 12 winter wheat genotypes, totaling 60
plots per replication. Each experimental unit, a seven-row yield plot measuring 2.74 1.52 m at

121
Blacksburg and Warsaw or 2.74 1.78 m at Custar and Painter, was replicated four times in
Ohio and three times in the Virginia testing sites. Preplant fertilizer was applied at a rate of 33 kg
N ha−1 in all testing environments, and spring split N treatments were foliar applied as liquid
urea ammonium nitrate at Zadoks (Zadoks et al., 1974) growth stages 25 (GS 25) and 30 (GS 30)
centered on established Ohio and Virginia winter wheat management recommendations (134 kg
N ha−1, Figure 3.1.). Herbicides and foliar pesticides were applied throughout the growing season
as necessary to mitigate weed and disease pressure (Supplemental Table S1.2.).
Weather Conditions
Cumulative growing degree days and daily precipitation for each testing environment are
compared with the 10-yr average in Supplemental Figure S1.1. Total rainfall was similar to the
10-yr average throughout the growing season in 14COH, 14PVA, and 14WVA (where “14”
refers to the year 2013–2014). The spring in 15COH was drier than normal, accumulating only
34 mm between Days 110 and 145, prior to a series of major rain events that occurred around
Day 150. However, heavy spring rainfall in 15PVA, totaling 200 mm, occurred between Days 99
and 116 and delayed the Zadoks GS 30 N application. Furthermore, 35 mm of rainfall
unexpectedly occurred in 15PVA shortly after the Zadoks GS 30 N application. In the 16BVA
environment, precipitation events remained normal throughout the season. Finally, 16WVA had
a few heavy late winter and early spring precipitation events until Day 123, which accumulated
59 mm of rainfall.
Plant Materials
The plant materials used in this study (Table 3.1.) were a subset of 12 regionally diverse
wheat lines from the Triticeae Coordinated Agricultural Project’s (http://www.triticeaecap.org/)

122
Eastern Elite Mapping Panel of 280 genotypes from six regional wheat breeding programs (The
Ohio State University, University of Illinois, University of Kentucky, University of Maryland,
University of Missouri, and Virginia Tech). The lines were selected to encompass a broad range
of breeding programs and are known to have alleles on chromosome 2D conferring photoperiod
insensitivity (Ppd-D1a) or sensitivity (Ppd-D1b). Diagnostic DNA markers were used to validate
the Ppd-D1 photoperiod (Beales et al., 2007) and reduced height alleles (Rht-B1 and Rht-D1)
(Ellis et al., 2002).
Phenotypic Measurements and Plant Sampling
Heading date and plant height data were collected in all Warsaw and Blacksburg testing
environments. Heading date was recorded as the day of year (Julian) when 50% of the heads
fully emerged from the boot. Plant height was measured prior to harvest from two random
locations within the center rows of each plot.
Grain yield data were collected in all Virginia and Ohio sites and adjusted to 0%
moisture. In the six Virginia environments, a 1.0-m aerial biomass sample was cut at ground
level from one of the center rows at physiological maturity, dried at 60C for 72 h, and weighed.
Spikes were removed from the biomass samples, counted, threshed, and weighed to determine
spikes per square meter, grains per square meter, kernel weight, and harvest index (calculated as
the proportion of grain yield to the total above-ground biomass). Ten representative spikes were
retained from each plot before threshing to determine floret fertility and number of seeds per
spike.
Cut and dried straw samples and grain harvested at physiological maturity were ground to
estimate their respective N contents via combustion analysis using a Vario Max CNS macro

123
elemental analyzer (Elementar Analysensysteme). However, in the 14PVA and 14WVA
environments, straw samples were lost due to processing errors and N content was not analyzed.
Results from combustion analysis were used to determine grain N content, NUE, NUpE, NUtE,
and N harvest index (grain N yield per unit of aboveground N yield).
Due to time constraints, chlorophyll content and gas exchange were observed on a
randomly selected subset of six wheat lines under low (Treatment 1) and standard (Treatment 5)
N rates using 20 flag leaves per plot at anthesis in the 14WVA and 15WVA testing
environments. Traits were measured using a handheld chlorophyll meter (CCM-300, Opti-
Sciences) and a portable photosynthesis analysis system (LI-6400XT, LI-COR). The rates of
photosynthesis (based on CO2 assimilation), stomatal conductance, and transpiration were
assessed at 400 mol CO2 mol−1 under 1000 mol m−2 s−1 irradiation at 23C with relative
humidity maintained to 50%. After photosynthetic measurements, leaf area was recorded and
used for standardization.
Statistical Analysis
Analysis of variance and F values were produced using the GLIMMIX procedure in SAS
9.4 (SAS Institute, 2013) with replication treated as a random effect to determine significant (P <
0.05) effects of photoperiod group (Ppd), N treatment, and Ppd N treatment interactions for
each site-season. Results are presented by testing environment, as its interaction effects were
highly significant for most traits. Comparison of means within site-season was conducted by
calculating least squares means for treatments and genotypes. Phenotypic trait correlations were
calculated using the CORR procedure in SAS 9.4. Contributions of variation in component traits
(NUpE and NUtE) to variation in the resultant trait (NUE) were calculated according to the

124
method described by Moll et al. (1982), where the resultant trait and its component traits are log
transformed with the fraction of the hybrid sum of squares calculated for each component trait.
Results
Grain Yield and Grain Nitrogen Content
The ANOVA did not identify significant Ppd N treatment interactions for grain yield or
grain N content within any of the six Virginia testing environments, although significant effects
(P < 0.05) due to Ppd alleles were detected for grain yield in three environments and grain N
content in all testing environments (Table 3.2.). The Ppd-D1b allele group produced significantly
higher grain yields in 14WVA, 15WVA, and 16WVA than the Ppd-D1a group, providing a yield
advantage of 377, 148, and 199 kg ha−1, respectively (Figure 3.2.). In contrast, the Ppd-D1a
genotypes had higher grain N contents than the Ppd-D1b lines in all environments, ranging from
an increase of 0.080% in 16BVA (P < 0.05) to 0.142% grain N content in 15WVA (P 0.001).
Grain yields were directly related to total spring N rate in the 14PVA, 15WVA, and
16BVA environments (Figure 3.3.), whereas splitting spring N produced significantly higher
grain yields when 33 kg N ha−1 was applied at Zadoks GS 25 under the moderate N rates
(Treatments 2 and 3) in 14WVA and under the standard N rates (Treatments 4 and 5) in the
16WVA environment. In contrast, significantly higher grain yields were observed in the 15PVA
environment when 67 kg N ha−1 was applied at Zadoks GS 25 under both the moderate and
standard N rates. As was the case for grain yield, N rates by application splitting effects were
observed in 14WVA, 15PVA, and 16WVA, whereas increases in grain N content were directly
related to total spring N rates in the remaining environments. In the 14WVA and 15PVA

125
environments, the highest grain N contents were reported when 33 kg N ha−1 was applied at
Zadoks GS 25 under the standard N rates, whereas genotypes in the 16WVA environment
produced higher grain N content when 67 kg N ha−1 was applied at Zadoks GS 25 under the
moderate and standard N rates.
To evaluate yield response of the Ppd allele groups to a greater number of N rates, the
same 12 winter wheat lines were evaluated over two growing seasons in Custar under five N
rates, ranging from 45 to 134 kg N ha−1 (Figure 3.1.). The results indicate that the Ppd-D1a allele
group produced significantly lower grain yields than the Ppd-D1b group under the lowest N rate
(45 kg N ha−1, Figure 3.4.), while yields became statistically similar as N rate increased.
Grain yield was positively associated with heading date in the Ppd-D1a lines under the
low N rate in Virginia (Treatment 1, Supplemental Figure S 1.2.a) and negatively associated with
heading date in Ppd-D1b lines when 67 kg N ha−1 was applied at Zadoks GS 25 under moderate
and standard N rates (Treatments 2 and 4, Supplemental Figure S1.2.b). Likewise, a positive
association between grain yield and plant height was observed for the Ppd-D1a allelic class
under low N rates (Supplemental Figure S1.3.a) and negatively correlated for the Ppd-D1b lines
under Treatments 2 and 4 (Supplemental Figure S1.3.b).
Harvest Index, Biomass, and Yield Components
Harvest index in 16BVA was the only yield-related trait to exhibit a significant Ppd N
interaction effect (P < 0.05, Table 3.2.), where N treatment means ranged from 36.9 to 40.5%
and 37.8 to 38.8% for Ppd-D1a and Ppd-D1b groups, respectively (Table 3.3.). In considering
main effects, the photoperiod-sensitive group of wheat lines had significantly higher harvest
index and grains per square meter than the photoperiod-insensitive group and significantly lower

126
kernel weight and spikes per square meter in two of the six testing environments (Table 3.4.).
The number of kernels per spike was significantly higher for the Ppd-D1b than the Ppd-D1a
group in 15PVA, 15WVA, and 16BVA where five additional kernels per spike were produced in
15PVA and 15WVA, whereas three additional kernels per spike were produced in 16BVA in the
Ppd-D1b group. Among yield components, floret fertility was most consistently affected by the
photoperiod alleles, with Ppd-D1b having a significantly (P 0.001) higher percentage of fertile
florets than the Ppd-D1a group in all 2014–2015 and 2015–2016 testing environments.
Aerial biomass was directly related to total spring N rate in 14PVA, 14WVA, 15WVA,
and 16WVA, whereas splitting effects were observed in 15PVA (Table 3.5.). Similar to the N
treatment effects on grain yield in 15PVA, aerial biomass benefited from higher rates of N
application at Zadoks GS 25 under both moderate and standard N rates. Generally, grains per
square meter and spikes per square meter were directly related to the total spring N rate in
significant environments. Under the standard N rate in 16WVA, grains per square meter
increased by 2171 and an additional 53 spikes m−2 were produced when 33 kg N ha−1 was
applied at Zadoks GS 25, resulting in higher grain yields due to splitting ratios. In 14WVA under
the standard N rate and 16BVA under the moderate N rate, floret fertility was greater when
higher N rates were applied at Zadoks GS 25 than at GS 30. In the other significant environments
(15WVA and 16WVA), floret fertility increased in response to higher N rates.
Nitrogen Use Efficiency and Nitrogen-Related Traits
Significant Ppd N interaction effects were observed for NUE in 16WVA (P < 0.01) and
NUtE in 15PVA (P < 0.05, Table 3.6.). The Ppd-D1b group had significantly higher NUE than
the Ppd-D1a group in 16WVA by 4.8 and 4.2 kg kg−1 under Treatments 1 and 2, respectively

127
(Table 3.7.). An increase in NUtE of 6.0 kg kg−1 for the Ppd-D1b wheat lines over those in the
Ppd-D1a group occurred at the lowest N rate (Treatment 1).
During the 2015–2016 growing season, the Ppd-D1b group had significantly higher NUE
(1.3 kg kg−1 in 16BVA [P < 0.05] and 2.3 kg kg−1 in 16WVA [P 0.001]) than the Ppd-D1a
group (Table 3.8.). Nitrogen utilization efficiency was significantly higher in 15PVA (2.0 kg
kg−1, P < 0.05) and 15WVA (3.2 kg kg−1, P 0.001) in wheat lines with the Ppd-D1b than in
those with the Ppd-D1a allele. In general, increases in total spring N rate were accompanied by
significant decreases in NUE, NUpE, and NUtE in all testing environments except for 16WVA
(Table 3.9.), where NUtE was 5.2 kg kg−1 higher when 67 kg N ha−1 was applied at GS 25 under
moderate spring N rates.
A strong positive relationship between grain yield and NUtE was observed in the Ppd-
D1a (r = 0.83, P < 0.05) and Ppd-D1b (r = 0.80, P < 0.10) groups (Table 3.10.). In the Ppd-D1a
group of lines, a strong association was observed between grain yield and harvest index (r =
0.79, P < 0.10). Furthermore, NUtE had a significant negative correlation with grain N content (r
= −0.83, P < 0.05) and NUpE (r = −0.82, P < 0.05) in photoperiod-insensitive (Ppd-D1a) lines
while being insignificant in the Ppd-D1b lines. Aerial biomass was positively associated with N
harvest index (r = 0.80, P < 0.10) in the Ppd-D1b group and negatively associated with grain N
content (r = −0.79, P < 0.10) in the Ppd-D1a group of wheat lines.
Among the two photoperiod allelic groups, the contribution to variation in NUE and its
components within the Ppd-D1a and Ppd-D1b groups was similar across testing environments
when 33 kg N ha−1 was applied at Zadoks GS 25 (Figure 3.5.). However, variation in NUtE for
the Ppd-D1a allele group was 19.8% higher than the Ppd-D1b allele group under Treatment 2,
but was 23.2% lower under Treatment 4. The contribution of NUpE to NUE ranged from 69.3%
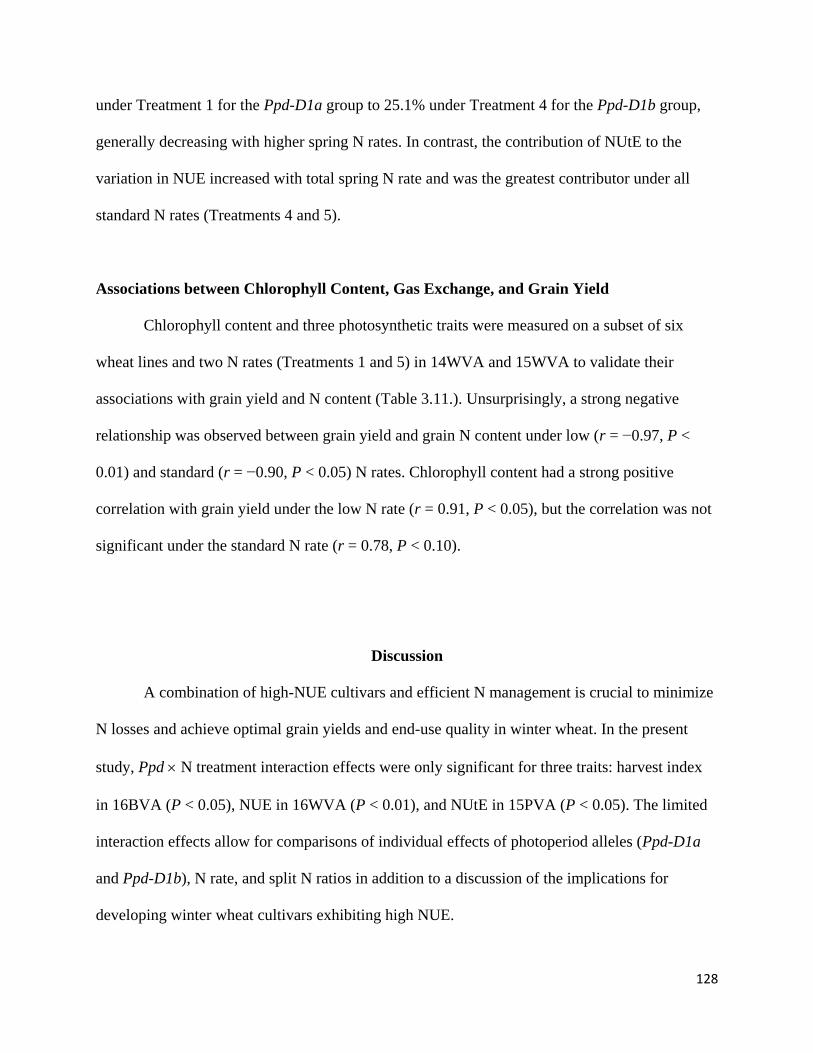
128
under Treatment 1 for the Ppd-D1a group to 25.1% under Treatment 4 for the Ppd-D1b group,
generally decreasing with higher spring N rates. In contrast, the contribution of NUtE to the
variation in NUE increased with total spring N rate and was the greatest contributor under all
standard N rates (Treatments 4 and 5).
Associations between Chlorophyll Content, Gas Exchange, and Grain Yield
Chlorophyll content and three photosynthetic traits were measured on a subset of six
wheat lines and two N rates (Treatments 1 and 5) in 14WVA and 15WVA to validate their
associations with grain yield and N content (Table 3.11.). Unsurprisingly, a strong negative
relationship was observed between grain yield and grain N content under low (r = −0.97, P <
0.01) and standard (r = −0.90, P < 0.05) N rates. Chlorophyll content had a strong positive
correlation with grain yield under the low N rate (r = 0.91, P < 0.05), but the correlation was not
significant under the standard N rate (r = 0.78, P < 0.10).
Discussion
A combination of high-NUE cultivars and efficient N management is crucial to minimize
N losses and achieve optimal grain yields and end-use quality in winter wheat. In the present
study, Ppd N treatment interaction effects were only significant for three traits: harvest index
in 16BVA (P < 0.05), NUE in 16WVA (P < 0.01), and NUtE in 15PVA (P < 0.05). The limited
interaction effects allow for comparisons of individual effects of photoperiod alleles (Ppd-D1a
and Ppd-D1b), N rate, and split N ratios in addition to a discussion of the implications for
developing winter wheat cultivars exhibiting high NUE.

129
Morphophysiological Effects of the Ppd-D1 Allele on Nitrogen Use Efficiency
The effects of the Ppd-D1b allele on grain yield in the present study were dependent on
environment, ranging from a loss of 0.1% in 14PVA to an increase of 7.5% in 14WVA.
Similarly, Worland et al. (1998) reported variability in grain yield over a span of 10 growing
seasons for wheat carrying Ppd-D1 alleles in Germany (−13.5 to +28.4%) and the United
Kingdom (−16.0 to +9.0%). The variable effects of the Ppd-D1 alleles on grain yield are often
dependent on geographic areas and are attributed to a number of environmentally influenced
traits governed by photoperiod response, including crop adaptation and optimal timing of stem
elongation, heading, and maturity. Significant grain yield advantages, conferred by the Ppd-D1b
allele vs. the Ppd-D1a allele were observed in half of the testing environments in Virginia,
consistent with findings by Gaju et al. (2011), who attributed these effects to increased aerial
biomass at maturity. In the present study, a stronger yet nonsignificant association between grain
yield and biomass was observed for lines containing Ppd-D1b vs. Ppd-D1a. In all Virginia
environments, the Ppd-D1b allele group had significantly lower grain N content than the Ppd-
D1a allele group, ranging from a reduction of 4.9% in 16BVA to 8.7% in 15WVA. Similarly, the
Ppd-D1a locus was previously shown to be positively associated with grain protein and
negatively associated with flour extraction n in a study of milling and end-use quality in
Australian wheat (Maphosa et al., 2013). These findings suggest that differences in milling and
baking quality of soft red winter wheat may be associated with specific alleles at the Ppd-D1
locus, as well as environmental effects.
Historically, negative associations between grain yield and protein content have been
reported in investigations of winter wheat genotypes grown under a range of N rates in field

130
(Terman et al., 1969) and greenhouse (Tamang et al., 2017) conditions. Interestingly, the
negative correlation between grain yield and grain N content in the present study was much
higher for wheat lines containing Ppd-D1a (r = −0.71) than Ppd-D1b (r = −0.09). This finding
may be due to the earlier maturation associated with the Ppd-D1a allele, more strongly affecting
source/sink dynamics. A greater antagonistic relationship between grain yield and grain protein
in wheat lines with the Ppd-D1a allele was also reported by Bogard et al. (2013), which they
attributed to reduced senescence durations. These findings may be explained by the observation
that earlier senescing lines are associated with reduced C assimilation, and higher N
remobilization thereby producing grains with higher protein contents that are less “diluted” by
carbohydrates (Gregersen et al., 2008).
Averaged over environments, lines in the photoperiod-sensitive (Ppd-D1b) group were
later maturing and taller than those with the photoperiod-insensitive (Ppd-D1a) allele, despite
linkage between Ppd-D1 and a minor effect dwarfing gene Rht8c in some genetic backgrounds
(Chebotar et al., 2013). Furthermore, the Ppd-D1b group was primarily composed of wheat lines
containing Rht-D1a, which may account for the small effect on plant height in the Ppd-D1
groups (Butler et al., 2005). Under the low N rate, positive associations between grain yield with
heading date and plant height were observed for lines containing the Ppd-D1a allele. Similarly,
Foulkes et al. (2007) reported a significant association under drought stress between grain yield
and delayed flowering in a doubled-haploid population differing in Ppd-D1 alleles, which they
attributed to larger root systems that were derived from longer developmental periods. However,
an inverse relationship was observed in the Ppd-D1b allelic group where taller and later heading
lines produced lower grain yields when 67 kg N ha−1 was applied at Zadoks GS 25. This may be
a result of greater tiller production due to the Ppd-D1b allele itself (Li et al., 2002) and higher

131
GS 25 N rates (Weisz et al., 2001), making the plant weaker and more prone to lodging. Upon
decomposition of grain yield components, floret fertility was significantly higher in the Ppd-D1b
group of lines in four of the six Virginia environments (P 0.001), validating the findings of
previous studies in wheat (Worland et al., 1998; Börner et al., 1993; González et al., 2005).
However, differences between photoperiod allele groups for the remaining yield components
were only significant in a limited number of test environments.
Increased NUE and NUtE in the Ppd-D1b allele group in the present study were
consistent with a previous study of winter wheat under low and high N rates (Gaju et al., 2011).
Grain yield, and thus NUE, was derived from a strong relationship with NUtE in the
photoperiod-sensitive (r = 0.80, P < 0.10) and -insensitive (r = 0.83, P < 0.05) groups, reflecting
similar trends reported in winter wheat (Barraclough et al., 2010; Gaju et al., 2011). Furthermore,
the contribution of NUpE to NUE declined with increasing N rates, consistent with results from
previous investigations of spring (Ortiz-Monasterio R. et al., 1997) and winter (Le Gouis et al.,
2000) wheat. These observations may reflect the suppression of N absorption under high N
availability, whereas N assimilation is still maintained. Interestingly, the contributions of NUpE
and NUtE to total NUE between Ppd-D1 allelic groups differed when 67 kg N ha−1 was applied
at Zadoks GS 25 (Treatments 2 and 4). The decreased contribution from NUpE in the Ppd-D1a
group under Treatments 2 and 4 may have resulted from reduced absorption of N when excess N
was supplied at the five-leaf stage as compared with the Ppd-D1b group.
Efficient Nitrogen Management for Wheat Production
Grain yields were highest when a greater proportion of the spring split N rate was applied
at Zadoks GS 30 under the standard N rate (134 kg N ha−1) in all environments except 15PVA.

132
The conflicting findings in 15PVA were likely due to a large rainfall event that occurred shortly
after the GS 30 N application and likely resulted in a decrease in the amount of available N as
the season progressed. Similar yield advantages from unequal N splits at Zadoks GS 25 and 30
were reported in Virginia winter barley (Hordeum vulgare L.), which matched N supply with
crop demand to minimize fertilizer loss (Thomason et al., 2012). In the current study, 101 kg N
ha−1 applied at Zadoks GS 30 also resulted in the highest grain N contents in all environments
under the standard spring N rates. These effects are in agreement with previous studies of hard
red winter wheat in Nebraska (Bhatta et al., 2017) and Virginia (Thomason et al., 2007), which
reported improved end-use qualities with higher N application rates later in plant development.
However, higher grain N, in the form of increased protein content, either has a negative or
neutral effect on end-use quality in soft red winter wheat, which is largely dependent on protein
quality and environment.
Upon dissection of yield components, harvest index, aerial biomass, grains per square
meter, spikes per square meter, kernels per spike, and floret fertility were associated with total
spring N rate in most test environments, whereas consistent effects were not observed due to
different N splitting ratios. Kernel weight was the only yield component that was not
significantly affected by N treatment in any Virginia environment, likely due to high heritability
of kernel weight in wheat (Sadras and Slafer, 2012). Nitrogen use efficiency, NUpE, and NUtE
were significantly affected by total spring N rate in a majority of the test environments.
However, different N splitting ratios did not have a consistent effect on the two components of
NUE in the present study, unlike the findings of other wheat (Haile et al., 2012) and maize (Zea
mays L.) N rate timing studies (Abbasi et al., 2012). The limited N splitting effects in the
present study are likely a result of high N demands at these two stages.

133
Breeding for Increased Nitrogen Use Efficiency in Soft Red Winter Wheat
Recent breeding progress has increased winter wheat grain yields (+0.45% yr−1)
relatively equally under high and low N conditions (Cormier et al., 2013) but requires further
improvements in traits such as sink and source relationships, senescence dynamics, and root
architecture to reach the estimated +2.50% yr−1 yield increase needed to meet global food
demands by 2050. In the present study, a strong positive correlation between flag leaf
chlorophyll content at heading and grain yield under low (r = 0.91, P < 0.05) and standard (r =
0.78, P < 0.10) N rates offers a potential avenue for crop improvement. The association and
diminishing advantage of greater chlorophyll content under higher rates of N are well studied in
durum (Debaeke et al., 2006), winter wheat (Bavec and Bavec, 2001), and maize (Abdel-Ghani
et al., 2013). Identification of additional proxy traits and alleles associated with NUE is
necessary to further improve genetic gains under both N stress and normal growing conditions.
However, it is important to ensure that large changes to crop physiology comply with regional
agronomic production systems. For instance, preference for early-maturing soft red winter wheat
cultivars to optimize the wheat–soybean [Glycine max (L.) Merr.] double cropping system may
explain the somewhat limited introgression of the photoperiod-sensitive allele Ppd-D1b in the
Mid-Atlantic (45.9%) relative to the Northeastern (54.3%) region (Benson et al., 2012).
Similarly, the prevalence of Ppd-D1b within the US Great Plains is higher in northern (90%)
than southern (56%) germplasm, suggesting a role in latitudinal adaptation and temperature
stress avoidance (Grogan et al., 2016). Further genetic improvements in NUE must consider
effects on the entire cropping system and regional adaptation for profitable grain production.
In conclusion, cultivars with the photoperiod sensitive allele (Ppd-D1b) used N fertilizer
to produce higher grain dry matter rather than increasing grain N concentrations, across

134
treatments, compared with cultivars with the insensitive allele (Ppd-D1a). Furthermore, when 67
kg N ha−1 was applied at Zadoks GS 25, variation in NUtE was the greatest contributor to
variation in NUE under moderate N (Treatment 2), whereas NUtE and NUpE contributed equally
under standard N (Treatment 4) in the Ppd-D1a allele group. Under the same split N ratios and
rates, the contribution of NUpE and NUtE in the Ppd-D1b allele group was more similar to both
allelic groups when 33 kg N ha−1 was applied at Zadoks GS 25 (Treatments 3 and 5). The
differences in contributions of component traits, NUpE and NUtE, to variation in NUE in the
Ppd-D1a group may be a result of reduced N absorption under conditions when excess N was
supplied compared with the Ppd-D1b group.
Acknowledgments
Funding for this project was provided by the USDA National Institute of Food and
Agriculture Triticeae Coordinated Agricultural Project no. 2011-68002-30029 and the Virginia
Small Grains Board. We’d also like to thank Sam Lawton, Brian Ward, Mark Vaughn, John
Seago, and Anthony Christopher for assistance collecting field data.
References
Abbasi, M.K., M.M. Tahir, A. Sadiq, M. Iqbal, and M. Zafar. 2012. Yield and nitrogen use
efficiency of rainfed maize response to splitting and nitrogen rates in Kashmir, Pakistan.
Agron. J. 104:448–457. doi:10.2134/agronj2011.0267
Abdel-Ghani, A.H., B. Kumar, J. Reyes-Matamoros, P.J. Gonzalez-Portilla, C. Jansen, J.P.S.
Martin, et al. 2013. Genotypic variation and relationships between seedling and adult
plant traits in maize (Zea mays L.) inbred lines grown under contrasting nitrogen levels.
Euphytica 189:123–133. doi:10.1007/s10681-012-0759-0

135
Abedi, T., A. Alemzadeh, and S.A. Kazemeini. 2011. Wheat yield and grain protein response to
nitrogen amount and timing. Aust. J. Crop Sci. 5:330–336.
Albrizio, R., M. Todorovic, T. Matic, and A.M. Stellacci. 2010. Comparing the interactive
effects of water and nitrogen on durum wheat and barley grown in a Mediterranean
environment. Field Crops Res. 115:179–190. doi:10.1016/j.fcr.2009.11.003
Alley, M.M., P. Scharf, D.E. Brann, W.E. Baethgen, and J.L. Hammons. 1996. Nitrogen
management for winter wheat: Principles and recommendations. Publ. 424-206 Virginia
Coop. Ext., Virginia Polytechnic Inst. State Univ., Blacksburg.
Barraclough, P.B., J.R. Howarth, J. Jones, R. Lopez-Bellido, S. Parmar, C.E. Shepherd, et al.
2010. Nitrogen efficiency of wheat: Genotypic and environmental variation and prospects
for improvement. Eur. J. Agron. 33:1–11. doi:10.1016/j.eja.2010.01.005
Barraclough, P.B., R. Lopez-Bellido, and M.J. Hawkesford. 2014. Genotypic variation in the
uptake, partitioning and remobilisation of nitrogen during grain-filling in wheat. Field
Crops Res. 156:242–248. doi:10.1016/j.fcr.2013.10.004
Bavec, F., and M. Bavec. 2001. Chlorophyll meter readings of winter wheat cultivars and grain
yield prediction. Commun. Soil Sci. Plant Anal. 32:2709–2719. doi:10.1081/CSS-
120000956
Beales, J., A. Turner, S. Griffiths, J.W. Snape, and D.A. Laurie. 2007. A Pseudo-Response
Regulator is misexpressed in the photoperiod insensitive Ppd-D1a mutant of wheat
(Triticum aestivum L.). Theor. Appl. Genet. 115:721–733. doi:10.1007/s00122-007-
0603-4
Benson, J., G. Brown-Guedira, J. Paul Murphy, and C. Sneller. 2012. Population structure,
linkage disequilibrium, and genetic diversity in soft winter wheat enriched for fusarium
head blight resistance. Plant Genome 5:71–80. doi:10.3835/plantgenome2011.11.0027
Bhatta, M., K.M. Eskridge, D.J. Rose, D.K. Santra, P.S. Baenziger, and T. Regassa. 2017.
Seeding rate, genotype, and topdressed nitrogen effects on yield and agronomic
characteristics of winter wheat. Crop Sci. 57:951–963. doi:10.2135/cropsci2016.02.0103
Bogard, M., V. Allard, P. Martre, E. Heumez, J.W. Snape, S. Orford, et al. 2013. Identifying
wheat genomic regions for improving grain protein concentration independently of grain
yield using multiple inter-related populations. Mol. Breed. 31:587–599.
doi:10.1007/s11032-012-9817-5
Börner, A., A.J. Worland, J. Plaschke, E. Schumann, and C.N. Law. 1993. Pleiotropic effects of
genes for reduced height (Rht) and day-length insensitivity (Ppd) on yield and its
components for wheat grown in Middle Europe. Plant Breed. 111:204–216.
doi:10.1111/j.1439-0523.1993.tb00631.x
Butler J.D., P.F. Byrne, V. Mohammadi, P.L. Chapman, and S.D. Haley. 2005. Agronomic
performance of Rht alleles in a spring wheat population across a range of moisture levels.
Crop Sci 45:939–947.
Chebotar, G.O., S.V. Chebotar, I.I. Motsnyy, and Y.M. Sivolap. 2013. Clarification of the Rht8-
Ppd-D1 gene linkage on the 2D chromosome of winter bread wheat. Cytol. Genet. 47:70–
74. doi:10.3103/S0095452713020047
Cormier, F., S. Faure, P. Dubreuil, E. Heumez, K. Beauchêne, S. Lafarge, et al. 2013. A multi-
environmental study of recent breeding progress on nitrogen use efficiency in wheat
(Triticum aestivum L.). Theor. Appl. Genet. 126:3035–3048. doi:10.1007/s00122-013-
2191-9

136
Cormier, F., J. Le Gouis, P. Dubreuil, S. Lafarge, and S. Praud. 2014. A genome-wide
identification of chromosomal regions determining nitrogen use efficiency components in
wheat (Triticum aestivum L.). Theor. Appl. Genet. 127:2679–2693. doi:10.1007/s00122-
014-2407-7
Debaeke, P., P. Rouet, and E. Justes. 2006. Relationship between the normalized SPAD index
and the nitrogen nutrition index: Application to durum wheat. J. Plant Nutr. 29:75–92.
doi:10.1080/01904160500416471
Ellis, M., W. Spielmeyer, K. Gale, G. Rebetzke, and R. Richards. 2002. “Perfect” markers for
the Rht-B1b and Rht-D1b dwarfing genes in wheat. Theor. Appl. Genet. 105:1038–1042.
doi:10.1007/s00122-002-1048-4
Evenson, R.E., and D. Gollin. 2003. Assessing the impact of the green revolution, 1960 to 2000.
Science 300:758–762. doi:10.1126/science.1078710
Ferrante, A., R. Savin, and G.A. Slafer. 2010. Floret development of durum wheat in response to
nitrogen availability. J. Exp. Bot. 61:4351–4359. doi:10.1093/jxb/erq236
Foulkes, M.J., M.J. Hawkesford, P.B. Barraclough, M.J. Holdsworth, S. Kerr, S. Kightley, et al.
2009. Identifying traits to improve the nitrogen economy of wheat: Recent advances and
future prospects. Field Crops Res. 114:329–342. doi:10.1016/j.fcr.2009.09.005
Foulkes, M.J., R. Sylvester-Bradley, R. Weightman, and J.W. Snape. 2007. Identifying
physiological traits associated with improved drought resistance in winter wheat. Field
Crops Res. 103:11–24. doi:10.1016/j.fcr.2007.04.007
Foulkes, M.J., R. Sylvester-Bradley, A.J. Worland, and J.W. Snape. 2004. Effects of a
photoperiod-response gene Ppd-D1 on yield potential and drought resistance in UK
winter wheat. Euphytica 135:63–73. doi:10.1023/B:EUPH.0000009542.06773.13
Gaju, O., V. Allard, P. Martre, J. Le Gouis, D. Moreau, M. Bogard, et al. 2014. Nitrogen
partitioning and remobilization in relation to leaf senescence, grain yield and grain
nitrogen concentration in wheat cultivars. Field Crops Res. 155:213–223.
doi:10.1016/j.fcr.2013.09.003
Gaju, O., V. Allard, P. Martre, J.W. Snape, E. Heumez, J. LeGouis, et al. 2011. Identification of
traits to improve the nitrogen-use efficiency of wheat genotypes. Field Crops Res.
123:139–152. doi:10.1016/j.fcr.2011.05.010
González, F.G., G.A. Slafer, and D.J. Miralles. 2005. Preanthesis development and number of
fertile florets in wheat as affected by photoperiod sensitivity genes Ppd-D1 and Ppd-B1.
Euphytica 146:253–269. doi:10.1007/s10681-005-9021-3
Good, A.G., A.K. Shrawat, and D.G. Muench. 2004. Can less yield more? Is reducing nutrient
input into the environment compatible with maintaining crop production? Trends Plant
Sci. 9:597–605. doi:10.1016/j.tplants.2004.10.008
Gregersen, P.L., P.B. Holm, and K. Krupinska. 2008. Leaf senescence and nutrient
remobilisation in barley and wheat. Plant Biol. 10:37–49. doi:10.1111/j.1438-
8677.2008.00114.x
Griffey, C.A., W.L. Rohrer, T.H. Pridgen, W.S. Brooks, M.E. Vaughn, W.L. Sisson, A.M. Price,
D.E. Brann, and A.E. Smid. 2003. Registration of 'Sisson' wheat. Crop Sci. 43:1134-
1135.
Grogan, S.M., G. Brown-Guedira, S.D. Haley, G.S. McMaster, S.D. Reid, J. Smith, et al. 2016.
Allelic variation in developmental genes and effects on winter wheat heading date in the
U.S. Great Plains. PLoS One 11:e0152852. doi:10.1371/journal.pone.0152852

137
Haile, D., D. Nigussie, and A. Ayana. 2012. Nitrogen use efficiency of bread wheat: Effects of
nitrogen rate and time of application. J. Soil Sci. Plant Nutr. 12:389–410.
Heisler, J., P.M. Glibert, J.M. Burkholder, D.M. Anderson, W. Cochlan, W.C. Dennison, et al.
2008. Eutrophication and harmful algal blooms: A scientific consensus. Harmful Algae
8:3–13. doi:10.1016/j.hal.2008.08.006
Hitz, K., A.J. Clark, and D.A. Van Sanford. 2017. Identifying nitrogen-use efficient soft red
winter wheat lines in high and low nitrogen environments. Field Crops Res. 200:1–9.
doi:10.1016/j.fcr.2016.10.001
Howarth, R.W. 2008. Coastal nitrogen pollution: A review of sources and trends globally and
regionally. Harmful Algae 8:14–20. doi:10.1016/j.hal.2008.08.015
Laperche, A., M. Brancourt-Hulmel, E. Heumez, O. Gardet, E. Hanocq, F. Devienne-Barret, et
al. 2007. Using genotype nitrogen interaction variables to evaluate the QTL involved
in wheat tolerance to nitrogen constraints. Theor. Appl. Genet. 115:399–415.
doi:10.1007/s00122-007-0575-4
Latshaw, S.P., M.F. Vigil, and S.D. Haley. 2016. Genotypic differences for nitrogen use
efficiency and grain protein deviation in hard winter wheat. Agron. J. 108:2201–2213.
doi:10.2134/agronj2016.02.0070
Le Gouis, J., D. Béghin, E. Heumez, and P. Pluchard. 2000. Genetic differences for nitrogen
uptake and nitrogen utilisation efficiencies in winter wheat. Eur. J. Agron. 12:163–173.
doi:10.1016/S1161-0301(00)00045-9
Li, W.L., J.C. Nelson, C.Y. Chu, L.H. Shi, S.H. Huang, and D.J. Liu. 2002. Chromosomal
locations and genetic relationships of tiller and spike characters in wheat. Euphytica
125:357–366. doi:10.1023/A:1016069809977
Lu, D., F. Lu, J. Pan, Z. Cui, C. Zou, X. Chen, et al. 2015. The effects of cultivar and nitrogen
management on wheat yield and nitrogen use efficiency in the North China Plain. Field
Crops Res. 171:157–164. doi:10.1016/j.fcr.2014.10.012
Mahjourimajd, S., J. Taylor, Z. Rengel, H. Khabaz-Saberi, H. Kuchel, M. Okamoto, et al. 2016.
The genetic control of grain protein content under variable nitrogen supply in an
Australian wheat mapping population. PLoS One 11:e0159371.
doi:10.1371/journal.pone.0159371
Maphosa, L., P. Langridge, H. Taylor, K.J. Chalmers, D. Bennett, H. Kuchel, et al. 2013.
Genetic control of processing quality in a bread wheat mapping population grown in
water-limited environments. J. Cereal Sci 57:304–311. doi:10.1016/j.jcs.2012.11.011
McKendry, A.L., D.N. Tague, R.L. Wright, and J.A. Tremain. 2007. Registration of ‘Bess’
wheat. J. Plant Reg. 1:21-23. doi:10.3198/jpr2006.06.0405crc
Moll, R.H., E.J. Kamprath, and W.A. Jackson. 1982. Analysis and interpretation of factors which
contribute to efficiency of nitrogen utilization. Agron. J. 74:562–564.
doi:10.2134/agronj1982.00021962007400030037x
Moore, R.B., C.M. Johnston, R.A. Smith, and B. Milstead. 2011. Source and delivery of
nutrients to receiving waters in the Northeastern and Mid-Atlantic regions of the United
States. J. Am. Water Resour. Assoc. 47:965–990. doi:10.1111/j.1752-1688.2011.00582.x
Ortiz-Monasterio R., J.I., K.D. Sayre, S. Rajaram and M. McMahon. 1997. Genetic progress in
wheat yield and nitrogen use efficiency under four nitrogen rates. Crop Sci. 37:898–904.
doi:10.2135/cropsci1997.0011183X003700030033x

138
Otteson, B.N., M. Mergoum, and J.K. Ransom. 2007. Seeding rate and nitrogen management
effects on spring wheat yield and yield components. Agron. J. 99:1615–1621.
doi:10.2134/agronj2007.0002
Raun, W.R., J.B. Solie, G.V. Johnson, M.L. Stone, R.W. Mullen, K.W. Freeman, et al. 2002.
Improving nitrogen use efficiency in cereal grain production with optical sensing and
variable rate application. Agron. J. 94:815–820. doi:10.2134/agronj2002.8150
Sadras V.O. and G.A. Slafer. 2012. Environmental modulation of yield components in cereals:
Heritabilities reveal a hierarchy of phenotypic plasticities. Field Crops Res. 127:215-224.
doi:10.1016/j.fcr.2011.11.014
SAS Institute. 2013. The SAS system for Windows. Release 9.3. SAS Inst., Cary, NC.
Tamang, B.G., K.G. Brasier, W.E. Thomason, C.A. Griffey, and T. Fukao. 2017. Differential
responses of grain yield, grain protein, and their associated traits to nitrogen supply in
soft red winter wheat. J. Plant Nutr. Soil Sci. 180:316–325. doi:10.1002/jpln.201600312
Terman, G.L., R.E. Ramig, A.F. Dreier, and R.A. Olson. 1969. Yield-protein relationships in
wheat grain, as affected by nitrogen and water. Agron. J. 61:755–759.
doi:10.2134/agronj1969.00021962006100050031x
Thomason, W.E., S.B. Phillips, T.H. Pridgen, J.C. Kenner, C.A. Griffey, B.R. Beahm, et al.
2007. Managing nitrogen and sulfur fertilization for improved bread wheat quality in
humid environments. Cereal Chem. 84:450–462. doi:10.1094/CCHEM-84-5-0450
Thomason, W.E., S.B. Phillips, J.A. Warren, and M.M. Alley. 2012. Winter hulless barley
response to nitrogen rate and timing and foliar phosphorus. J. Plant Nutr. 35:225–234.
doi:10.1080/01904167.2012.636125
Weisz, R., C.R. Crozier, and R.W. Heiniger. 2001. Optimizing nitrogen application timing in no-
till soft red winter wheat. Agron. J. 93:435–442. doi:10.2134/agronj2001.932435x
Worland, A.J., A. Börner, V. Korzun, W.M. Li, S. Petrovíc, and E.J. Sayers. 1998. The influence
of photoperiod genes on the adaptability of European winter wheats. Euphytica 100:385–
394. doi:10.1023/A:1018327700985
Zadoks, J.C., T.T. Chang, and C.F. Konzak. 1974. A decimal code for the growth stages of
cereals. Weed Res. 14:415–421. doi:10.1111/j.1365-3180.1974.tb01084.x
Zhang, X., E.A. Davidson, D.L. Mauzerall, T.D. Searchinger, P. Dumas, and Y. Shen. 2015.
Managing nitrogen for sustainable development. Nature 528:51–59.
doi:10.1038/nature15743

139
Figure 3.1. Nitrogen treatment structure for (a) Virginia used low (Treatment 1), moderate
(Treatments 2 and 3), and standard (Treatments 4 and 5) spring N rates split applied at Zadoks
growth stages (GS) 25 and 30 to wheat plots, whereas (b) Ohio treatments were centered on total
spring N rates.

140
Figure 3.2. Grain yield (top) and grain N content (bottom) for groups of wheat lines with
photoperiod sensitivity (Ppd-D1b) and insensitivity (Ppd-D1a) alleles in six Virginia
environments (Painter [PVA], Warsaw [WVA], and Blacksburg [BVA]; 14, 15, and 16 indicate
years 2014, 2015, and 2016, respectively). The LSD at P 0.05 is used to compare treatment
means within an environment; means within an environment followed by the same letter are not
significantly different.

141
Figure 3.3. Grain yield (top) and grain N content (bottom) of wheat lines under five spring-split
N (kg N ha−1) Treatments 1 (33 + 33 kg N ha−1), 2 (67 + 33 kg N ha−1), 3 (33 + 67 kg N ha−1), 4
(67 + 67 kg N ha−1), and 5 (33 + 101 kg N ha−1) in six Virginia environments (Painter [PVA],
Warsaw [WVA], and Blacksburg [BVA]; 14, 15, and 16 indicate years 2014, 2015, and 2016,
respectively). The LSD at P 0.05 is used to compare treatment means within an environment;
means within an environment followed by the same letter are not significantly different.

142
Figure 3.4. Regression of grain yield on five spring N fertilizer rates for photoperiod-sensitive (y
= −0.0259x2 + 6.6974x + 3550.4, R2 = 0.80, Ppd-D1b) and -insensitive (y = −0.0402x2 +
12.3970x + 3111.5, R2 = 0.91, Ppd-D1a) groups of wheat lines over two growing seasons in
Custar, OH.

143
Figure 3.5. Contribution of variation in N uptake (lower percentage, NUpE) and utilization
(upper percentage, NUtE) efficiency to variation in N use efficiency for each photoperiod allele
group of wheat lines (Ppd-D1a and Ppd-D1b) at five N treatments across four Virginia testing
environments. Percentages below and above boxes represent the contributions of NUpE and
NUtE, respectively.

144
Table 3.1. Wheat lines grouped by photoperiod insensitivity (Ppd-D1a) and sensitivity (Ppd-
D1b) and for reduced plant height alleles (Rht-B1b and Rht-D1b), field heading dates and plant
heights, and pedigrees for the 12 soft red winter wheat lines. Plant heights and heading dates
represent means across treatments in four Virginia environments (Warsaw in 2013–2014, 2014–
2015, and 2015–2016 and Blacksburg in 2015–2016).
Ppd allele groups Rht-B1 Rht-D1 Heading
date
Plant
height Pedigree
Julian d cm
Ppd-D1a
IL02-19483B Rht-B1b Rht-D1a 121 82 Patton/Cardinal//IL96–2550
KY06C-1003-139-8-3 Rht-B1b Rht-D1a 123 80 Truman/McCormick//25R37
MD03W485-10-10 Rht-B1a Rht-D1b 122 77 USG3209/Tribute//USG3342”S”
MD05W10208-11-8 Rht-B1a Rht-D1b 123 77 Tribute/25R42//Chesapeake
OH06-150-57 Rht-B1b Rht-D1a 124 88 P.92201D5–2-29/OH708
Sisson† Rht-B1a Rht-D1b 122 77 Coker9803/Freedom
Ppd-D1b
Bess† Rht-B1b Rht-D1a 124 83 MO11769/Madison
IL07-4415 Rht-B1b Rht-D1a 121 81 P96169RE2–3-6–4/IL01–34159
MO080864 Rht-B1b Rht-D1a 127 90 981020//P92201D5–2/98072
OH08-161-78 Rht-B1a Rht-D1a 124 89 OH751/OH738
OH08-172-42 Rht-B1b Rht-D1a 125 85 Douglas/Jekyl
VA08MAS-369 Rht-B1a Rht-D1b 122 78 McCormick/GA881130LE5
† The plant introduction number for Bess is PI 642794 (McKendry et al., 2007) and for Sisson is
PI 617053 (Griffey et al., 2003).

145
Table 3.2. Analysis of variance and F values for photoperiod group, treatment, and interaction effect on grain yield, grain N content,
and yield components for soft red winter wheat lines grown in six Virginia environments.
Environment† Effect‡ df Grain yield Grain N
content
Harvest
index
Aerial
biomass
Kernel
weight Grains m−2 Spikes m−2
Kernels
spike−1
Floret
fertility
14PVA Ppd‡ 1 0.20ns§ 34.99*** 2.68ns 0.43ns 0.31ns 1.86ns 0.51ns 0.90ns 0.60ns N 4 33.83*** 2.24ns 6.64*** 60.23*** 2.11ns 0.78ns 0.39ns 1.12ns 1.89ns Ppd N 4 0.54ns 0.59ns 0.78ns 0.31ns 0.72ns 0.93ns 0.42ns 0.60ns 1.34ns
14WVA Ppd 1 36.93*** 10.31** 28.28*** 0.51ns 0.85ns 1.37ns 1.70ns 0.00ns 0.21ns N 4 53.39*** 6.00*** 3.47** 15.88*** 0.48ns 0.37ns 0.57ns 0.88ns 2.58* Ppd N 4 0.27ns 0.63ns 0.28ns 0.97ns 0.51ns 0.56ns 1.04ns 1.34ns 1.21ns
15PVA Ppd 1 0.69ns 6.52* 0.41ns 0.24ns 9.32** 1.97ns 13.65*** 34.82*** 30.84*** N 4 14.48*** 9.58*** 1.90ns 10.67*** 0.45ns 3.82** 6.78*** 1.36ns 0.66ns Ppd N 4 0.40ns 1.07ns 1.38ns 0.85ns 0.82ns 1.85ns 0.66ns 1.28ns 1.14ns
15WVA Ppd 1 4.56* 30.90*** 1.11ns 0.34ns 4.85* 5.21* 22.35*** 63.33*** 60.18*** N 4 22.15*** 26.45*** 2.09ns 24.21*** 0.51ns 10.94*** 7.72*** 4.27** 5.58*** Ppd N 4 0.13ns 0.68ns 1.00ns 1.20ns 0.82ns 0.60ns 0.39ns 0.07ns 0.96ns
16BVA Ppd 1 3.75ns 20.74*** 0.46ns 3.23ns 2.56ns 6.85** 0.04ns 16.49*** 12.62*** N 4 3.32* 13.97*** 1.22ns 2.39ns 0.09ns 2.63* 2.82* 4.32** 3.60** Ppd N 4 0.37ns 1.47ns 3.14* 1.57ns 0.72ns 0.47ns 1.69ns 0.31ns 0.12ns
16WVA Ppd 1 14.14*** 10.46** 11.95*** 1.16ns 0.04ns 3.27ns 0.01ns 3.41ns 17.51*** N 4 18.19*** 5.18*** 4.83** 6.13*** 0.78ns 4.60** 2.73* 2.52* 4.50** Ppd N 4 2.44ns 1.57ns 0.65ns 1.05ns 0.19ns 0.56ns 0.26ns 0.69ns 0.84ns
* Significant at the 0.05 probability level.
** Significant at the 0.01 probability level.
*** Significant at the 0.001 probability level.
† Numbers indicate years 2013–2014 (14), 2014–2015 (15), and 2015–2016 (16); PVA, Painter, VA; WVA, Warsaw, VA; BVA,
Blacksburg, VA.
‡ Ppd, photoperiod allele grouping; N, N rate.
§ ns, not significant.

146
Table 3.3. Least square means of wheat harvest index interaction effects in the 2015–2016
Blacksburg, VA, testing environment. Harvest index
N treatment Ppd-D1a Ppd-D1b
kg N ha−1 —————————— % ———————————
1 (33 + 33)† 36.9c‡ 38.4bc
2 (67 + 33) 37.3bc 38.8abc
3 (33 + 67) 40.5a 37.8bc
4 (67 + 67) 39.0ab 38.2bc
5 (33 + 101) 39.1ab 38.1bc
† Nitrogen treatments (kg N ha−1) were split applied at Zadoks growth stages 25 and 30.
‡ The LSD at P 0.05 is used to compare treatment means within an environment; means within
an environment followed by the same letter are not significantly different.

147
Table 3.4. Least squares means of yield component traits for groups of wheat lines having either
photoperiod-insensitive (Ppd-D1a) or -sensitive (Ppd-D1b) alleles in significant Virginia testing
environments. Values represent means for two photoperiod groups within testing environments. Photoperiod group
Trait and environment† Ppd-D1a Ppd-D1b
Harvest index (%)
14WVA 37.1b‡ 39.6a
16WVA 30.3b 32.3a
Kernel weight (mg)
15PVA 34.3a 32.7b
15WVA 35.6a 34.6b
Grains m−2
15WVA 18,472b 19,930a
16BVA 26,062b 28,131a
Spikes m−2
15PVA 625a 569b
15WVA 698a 618b
Kernels spike−1
15PVA 33b 38a
15WVA 27b 32a
16BVA 32b 35a
Floret fertility (%)
15PVA 84.3b 87.4a
15WVA 81.6b 85.8a
16BVA 84.2b 86.4a
16WVA 77.9b 81.3a
† In environment names, numbers indicate years 2013–2014 (14), 2014–2015 (15), and 2015–
2016 (16); WVA, Warsaw, VA; PVA, Painter, VA; BVA, Blacksburg, VA.
‡ The LSD at P 0.05 is used to compare treatment means within an environment; means within
an environment followed by the same letter are not significantly different.

148
Table 3.5. Least squares means of wheat yield component traits for five spring split N
Treatments 1 (33 + 33 kg N ha−1), 2 (67 + 33 kg N ha−1), 3 (33 + 67 kg N ha−1), 4 (67 + 67 kg N
ha−1), and 5 (33 + 101 kg N ha−1) in significant Virginia testing environments. Values represent
means over treatment.
Nitrogen treatment‡
Trait and environment† 1 2 3 4 5
Harvest index (%)
14PVA 34.4c§ 36.3b 36.6b 37.9ab 38.9a
14WVA 37.1c 37.7bc 38.4abc 38.6ab 39.7a
16WVA 30.3bc 29.7c 32.0ab 31.3bc 33.3a
Aerial biomass (g m−2)
14PVA 1,127c 1,442b 1,442b 1,658a 1,614a
14WVA 1,255c 1,353b 1,444b 1,561a 1,552a
15PVA 1,168c 1,301b 1,133c 1,426a 1,224bc
15WVA 1,117c 1,315b 1,287b 1,447a 1,388a
16WVA 907c 1,133ab 1,083b 1,115ab 1,173a
Grains m−2
15PVA 18,986c 20,944abc 20,535bc 23,060a 22,039ab
15WVA 15,642d 18,580c 19,159bc 21,627a 20,994ab
16BVA 25,453b 26,903ab 26,154b 29,091a 27,881ab
16WVA 14,026c 16,100b 16,490cb 16,248b 18,419a
Spikes m−2
15PVA 548b 572b 576b 638a 648a
15WVA 589d 630cd 650bc 719a 701ab
16BVA 741b 766ab 805a 807a 761ab
16WVA 566c 619ab 591abc 585bc 638a
Kernels spike−1
15WVA 27b 30a 29a 30a 30a
16BVA 33bc 34ab 31c 35ab 35a
16WVA 25c 26bc 28ab 27ab 28a
Floret fertility (%)
14WVA 81.4ab 82.7a 82.1ab 83.6a 80.2b
15WVA 81.3b 83.6a 83.9a 84.5a 85.2a
16BVA 84.7bc 85.7ab 83.5c 85.7ab 86.9a
16WVA 77.9b 77.6b 80.5a 79.9ab 82.1a
† In environment names, numbers indicate years 2013–2014 (14), 2014–2015 (15), and 2015–
2016 (16); WVA, PVA, Painter, VA; Warsaw, VA; BVA, Blacksburg, VA.
‡ Treatments were split applied at Zadoks growth stages 25 and 30.
§ The LSD at P 0.05 is used to compare treatment means within an environment; means within
an environment followed by the same letter are not significantly different.

149
Table 3.6. Analysis of variance and F values for Ppd group, treatment, and interaction effect on
N use efficiency (NUE), N uptake efficiency (NUpE), N utilization efficiency (NUtE), and N
harvest index for soft red winter wheat lines grown in six Virginia environments. Environment† Effect‡ df NUE NUpE NUtE N harvest index
15PVA Ppd 1 1.14ns§ 0.64ns 4.96* 2.49ns
N 4 98.68*** 21.88*** 15.51*** 2.11ns
Ppd N 4 0.61ns 0.88ns 2.49* 0.87ns
15WVA Ppd 1 2.50ns 6.03* 15.05*** 0.42ns
N 4 134.12*** 35.91*** 25.26*** 0.46ns
Ppd N 4 0.17ns 0.52ns 0.48ns 1.63ns
16BVA Ppd 1 4.46* 0.01ns 1.00ns 2.44ns
N 4 329.24*** 40.24*** 5.04*** 0.67ns
Ppd N 4 0.73ns 0.57ns 0.85ns 2.19ns
16WVA Ppd 1 19.35*** 0.19ns 3.16ns 0.40ns
N 4 172.29*** 10.51*** 5.77*** 3.45*
Ppd N 4 3.78** 0.13ns 0.44ns 1.14ns
* Significant at the 0.05 probability level.
** Significant at the 0.01 probability level.
*** Significant at the 0.001 probability level.
† In environment names, numbers indicate years 2014–2015 (15), and 2015–2016 (16); PVA,
Painter, VA; WVA, Warsaw, VA; BVA, Blacksburg, VA.
‡ Ppd, photoperiod allele grouping; N, N rate.
§ ns, not significant.

150
Table 3.7. Least squares means of wheat N use efficiency interaction effects in Warsaw, VA, in
2015–2016 and N utilization efficiency interaction effects in Painter, VA, in 2014–2015. N use efficiency N utilization efficiency
Treatment† Ppd-D1a Ppd-D1b Ppd-D1a Ppd-D1b
kg N ha−1 ——————— kg kg−1 ———————
1 (33 + 33) 43.6b‡ 48.4a 39.9cd 45.9a
2 (67 + 33) 31.0d 35.2c 40.6bcd 43.7ab
3 (33 + 67) 33.8c 34.9c 39.8cd 42.5abc
4 (67 + 67) 27.3ef 27.0f 37.3de 35.9e
5 (33 + 101) 27.9ef 29.3de 34.6e 33.7e
† Treatments were split applied at Zadoks growth stages 25 and 30.
‡ The LSD at P 0.05 is used to compare treatment means within an environment; means for a
trait followed by the same letter are not significantly different.

151
Table 3.8. Least squares means of N-related traits for groups of wheat lines having a
photoperiod allele (Ppd-D1) in significant Virginia testing environments. Values represent
means for two photoperiod groups within testing environments. Photoperiod group
Trait and environment† Ppd-D1a Ppd-D1b
———— kg kg−1 ————
N use efficiency
16BVA 44.4b‡ 45.7a
16WVA 32.7b 35.0a
N uptake efficiency
15WVA 1.14a 1.09b
N utilization efficiency
15PVA 38.4b 40.4a
15WVA 42.0b 45.2a
† In environment names, numbers indicate years 2014–2015 (15), and 2015–2016 (16); BVA, Blacksburg, VA;
WVA, Warsaw, VA; PVA, Painter, VA.
‡ The LSD at P 0.05 is used to compare treatment means within an environment; means within an environment
followed by the same letter are not significantly different.

152
Table 3.9. Least squares means of wheat N use efficiency traits for spring split N Treatments 1
(33 + 33 kg N ha−1), 2 (67 + 33 kg N ha−1), 3 (33 + 67 kg N ha−1), 4 (67 + 67 kg N ha−1), and 5
(33 + 101 kg N ha−1) in significant Virginia testing environments. Values represent means over
treatment. Nitrogen treatment‡
Trait and environment† 1 2 3 4 5
N use efficiency (kg kg−1)
15PVA 47.8a§ 36.4b 34.3b 29.7c 26.7c
15WVA 64.1a 49.1b 49.4b 38.9c 39.4c
16BVA 65.2a 45.2b 45.3b 34.7c 34.9c
16WVA 46.0a 33.1b 34.4b 27.2c 28.6c
N uptake efficiency (kg kg−1)
15PVA 1.19a 0.90b 0.87b 0.85b 0.83b
15WVA 1.29a 1.11b 1.14b 1.02c 0.99c
16BVA 2.13a 1.64b 1.64b 1.39c 1.36c
16WVA 1.25a 1.14a 0.96b 0.84b 0.88b
N utilization efficiency (kg kg−1)
15PVA 42.9a 42.2a 41.2a 36.6b 34.1b
15WVA 50.3a 45.2b 43.9b 38.3c 40.1c
16BVA 32.8a 28.7b 28.8b 26.2b 27.8b
16WVA 39.1a 31.1c 36.2ab 32.7bc 33.0bc
N harvest index (%)
16WVA 59.4ab 56.9b 60.8a 56.9b 59.7a
† In environment names, numbers indicate years 2014–2015 (15), and 2015–2016 (16); PVA, Painter, VA; WVA,
Warsaw, VA; BVA, Blacksburg, VA.
‡ Treatments were split applied at Zadoks growth stages 25 and 30.
§ The LSD at P 0.05 is used to compare treatment means within an environment; means within an environment
followed by the same letter are not significantly different.

153
Table 3.10. Pearson correlation coefficients between traits amongst photoperiod-sensitive (Ppd-
D1b) and -insensitive (Ppd-D1a) wheat groups (above and below the diagonal, respectively).
Means are over four testing environments (Painter in 2014–2015, Warsaw in 2014–2015 and
2015–2016, and Blacksburg in 2015–2016) and five N treatments.
Trait† Grain yield Grain N
content
Harvest
index
Aerial
biomass
N harvest
index NUpE NUtE
Grain yield −0.09 0.32 0.41 0.65 0.41 0.80‡
Grain N content −0.71 0.66 −0.45 0.61 0.37 −0.44
Harvest index 0.79‡ −0.22 −0.63 −0.05 0.66 0.10
Aerial biomass 0.15 −0.79‡ −0.39 0.80‡ −0.08 0.27
N harvest index 0.42 0.22 −0.65 0.62 0.49 0.29
NUpE −0.39 0.57 −0.46 0.13 −0.17 −0.21
NUtE 0.83* −0.83* 0.46 0.37 0.29 −0.82*
* Significant at the 0.05 probability level.
† NUpE, N uptake efficiency; NUtE, N utilization efficiency.
‡ Significant at the 0.10 probability level.

154
Table 3.11. Pearson correlation coefficients for photosynthetic traits under low (67 kg N ha−1)
and standard (134 kg N ha−1) N rates (above and below the diagonal, respectively). Treatments
were split applied at Zadoks growth stages 25 and 30 1:1 under the low rate (Treatment 1) and
1:3 under the standard rate (Treatment 5). Means are over two testing environments (Warsaw,
VA, in 2013–2014 and 2015–2016) and six wheat lines (IL07-4415, MD03W485-10-10,
MD05W10208-11-8, MO080864, OH06150-57, and Sisson).
Trait Grain
yield
Grain N
content
Photosynthetic
rate
Stomatal
conductance
Transpiration
rate
Chlorophyll
content
Grain yield −0.97** −0.45 −0.59 −0.56 0.91*
Grain N content −0.90* 0.47 0.53 0.40 −0.85*
Photosynthetic rate 0.20 −0.02 0.39 0.67 −0.67
Stomatal conductance 0.25 −0.13 0.89* 0.68 −0.73
Transpiration rate 0.01 0.23 0.94** 0.83* −0.81†
Chlorophyll content 0.78† −0.72 −0.38 −0.35 −0.52
* Significant at the 0.05 probability level.
** Significant at the 0.01 probability level.
† Significant at the 0.10 probability level.

155
Supplementary Figure 3.1. Daily precipitation (bars) and cumulative growing degree days
(lines; GDD) at Blacksburg, Custar, Painter, and Warsaw during the 2013-14 (dark grey bars and
green dot-dashed lines), 2014-15 (grey bars and orange dashed lines), and 2015-16 (light grey
bars and purple dotted lines) growing seasons and 10 year averages (blue bars and black solid
lines) from 2006 to 2016. January 1st represents the first day of year with weather data collected
from sowing to harvest for each testing environment.

156
Supplementary Figure 3.2. Grain yield by heading date for wheat lines within each photoperiod
group under five spring-split nitrogen treatments over four testing environments (14WVA,
15WVA, 16BVA, and 16WVA). Regressions of photoperiod (a) insensitive (Ppd-D1a) under
treatments 1 (y = 57.641x – 3,153.5; R2 = 0.19), 2 (y = -35.248x + 8,572.1; R2 = 0.06), 3 (y =
49.243x – 1,590.8; R2 = 0.06), 4 (y = 67.094x – 3,570.6; R2 = 0.12), and 5 (y = 31.734x +
815.51; R2 = 0.04) and (b) sensitive (Ppd-D1b) under treatments 1 (y = 11.417x + 2,718.9; R2 =
0.01), 2 (y = -44.037x + 9,966.5; R2 = 0.22), 3 (y = 17.443x + 2,420.7; R2 = 0.02), 4 (y = -
66.511x + 12,632; R2 = 0.30), and 5 (y = -8.5072x + 5,998.7; R2 = 0.01).

157
Supplementary Figure 3.3. Grain yield by plant height for wheat lines within each photoperiod
group under five spring-split nitrogen treatments over four testing environments (14WVA,
15WVA, 16BVA, and 16WVA). Regressions of photoperiod (a) insensitive (Ppd-D1a) under
treatments 1 (y = 25.361x + 1,939.4; R2 = 0.44), 3 (y = 10.777x + 3,566.2; R2 = 0.05), 5 (y =
4.5735x + 4,333.9; R2 = 0.02), 2 (y = 3.3444x + 3,981.2; R2 = 0.00), and 4 (y = 13.335x +
3,574.8; R2 = 0.08 and (b) sensitive (Ppd-D1b) under treatments 1 (y = -0.257x + 4,194.2; R2 =
0.00), 2 (y = -22.272x + 6,407.4; R2 = 0.28), 3 (y = 1.8001x + 4,433.9; R2 = 0.01), 4 (y = -
32.452x + 7,541.7; R2 = 0.37), and 5 (y = -1.4302x + 5,067.4; R2 = 0.00).

158
Supplementary Table 3.1. Experimental summary of wheat NUE study grown in six Virginia
(VA) and two Ohio (OH) environments.
Season Testing site Environment
designation Soil series Soil texture
Planting
date
Harvest
date
2013-14 Custar, OH 14COH Hoytville Clay loam 02 - Oct. 15 - July
Painter, VA 14PVA Bojac Sandy loam 24 - Oct. 16 - June
Warsaw, VA 14WVA Kempsville Loam 22 - Oct. 24 - June
2014-15 Custar, OH 15COH Hoytville Clay loam 29 - Sept. 06 - July
Painter, VA 15PVA Bojac Sandy loam 23 - Oct. 22 - June
Warsaw, VA 15WVA Kempsville Loam 21 - Oct. 22 - June
2015-16 Blacksburg, VA 16BVA Hayter Silt loam 16 - Oct. 27 - June
Warsaw, VA 16WVA Kempsville Loam 21 - Oct. 22 - June

159
Supplementary Table 3.2. Management practices in each Virginia testing environment
including product name, application rate of fertilizer or active ingredient (A.I.), and date of
application. Experiments were grown during the 2013-14 season at Painter (14PVA) and
Warsaw (14WVA), the 2014-15 season at Painter (15PVA) and Warsaw (15WVA), and during
the 2015-16 season at Blacksburg (16BVA) and Warsaw (16WVA).
Environment Product Application rate Application date
14PVA Pre-plant fertilizer 34-0-0-0 kg nutrient ha-1† 10/23/2013
GS25 UAN Variable‡ 03/10/2014
Harmony Extra SG® 0.02 kg A.I. ha-1 03/12/2014
G30 UAN Variable 04/03/2014
14WVA Pre-plant fertilizer 34-67-67-2 kg nutrient ha-1 10/18/2013
GS25 UAN Variable 03/01/2014
Harmony Extra SG® 0.02 kg A.I. ha-1 03/11/2014
Starane™ 0.21 kg A.I. ha-1 03/11/2014
GS30 UAN Variable 04/04/2014
Palisade EC 0.08 kg A.I. ha-1 04/04/2014
Tilt 0.07 kg A.I. ha-1 04/10/2014
Prosaro 0.14 kg A.I. ha-1 05/08/2014
Tilt 007 kg A.I. ha-1 05/08/2014
15PVA Pre-plant fertilizer 34-0-0-0 kg nutrient ha-1 10/20/2014
GS25 UAN Variable 03/17/2015
Harmony Extra SG® 0.02 kg A.I. ha-1 03/25/2015
GS30 UAN Variable 04/30/2015
15WVA Pre-plant fertilizer 34-67-67-5 kg nutrient ha-1 10/06/2014
GS25 UAN Variable 03/19/2015
Harmony Extra SG® 0.02 kg A.I. ha-1 03/24/2015
Starane™ 0.21 kg A.I. ha-1 03/24/2015
GS30 UAN Variable 04/01/2015
Palisade EC 0.08 kg A.I. ha-1 04/06/2015
Tilt 0.07 kg A.I. ha-1 04/10/2015
Prosaro 0.14 kg A.I. ha-1 05/14/2015
Tilt 007 kg A.I. ha-1 05/14/2015
16BVA Pre-plant fertilizer 34-67-67-5 kg nutrient ha-1 10/16/2015
Harmony Extra SG® 0.02 kg A.I. ha-1 11/16/2015
GS25 UAN Variable 03/08/2016
Harmony Extra SG® 0.02 kg A.I. ha-1 03/23/2016
GS30 UAN Variable 03/23/2016
Palisade EC 0.08 kg A.I. ha-1 03/31/2016
Tilt 0.04 kg A.I. ha-1 03/31/2016
Prosaro 0.14 kg A.I. ha-1 05/12/2016
Tilt 0.10 kg A.I. ha-1 05/26/2016

160
Environment Product Application rate Application date
16WVA Pre-plant fertilizer 34-67-67-5 kg nutrient ha-1 10/14/2015
Starane™ 0.21 kg A.I. ha-1 12/06/2015
GS25 UAN Variable 02/19/2016
Harmony Extra SG® 0.02 kg A.I. ha-1 03/08/2016
Starane™ 0.15 kg A.I. ha-1 03/08/2016
GS30 UAN Variable 03/12/2016
Palisade EC 0.06 kg A.I. ha-1 03/30/2016
Fitness 0.12 kg A.I. ha-1 03/30/2016
Fitness 0.12 kg A.I. ha-1 04/19/2016
Prosaro 0.14 kg A.I. ha-1 05/20/2016
†Nitrogen (UAN), phosphorous, potassium, and sulfur re-plant fertilizer applied, respectively.
‡Spring N application rates applied according to treatments in Figure 3.1.
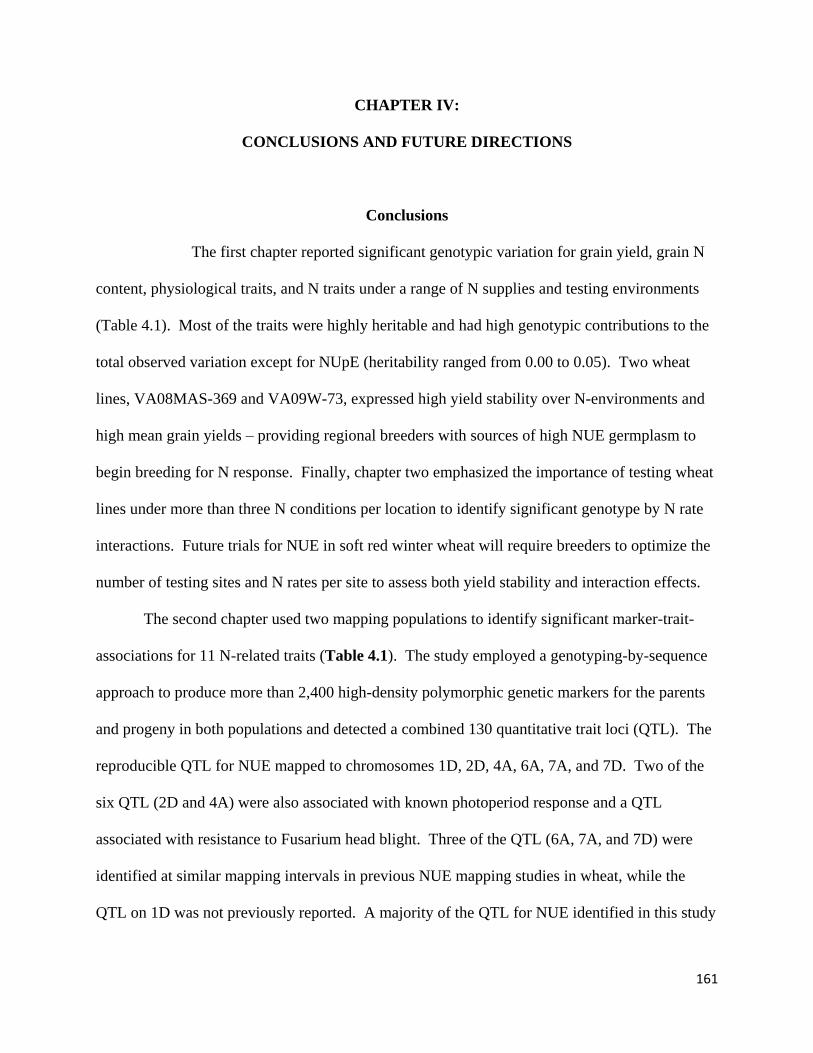
161
CHAPTER IV:
CONCLUSIONS AND FUTURE DIRECTIONS
Conclusions
The first chapter reported significant genotypic variation for grain yield, grain N
content, physiological traits, and N traits under a range of N supplies and testing environments
(Table 4.1). Most of the traits were highly heritable and had high genotypic contributions to the
total observed variation except for NUpE (heritability ranged from 0.00 to 0.05). Two wheat
lines, VA08MAS-369 and VA09W-73, expressed high yield stability over N-environments and
high mean grain yields – providing regional breeders with sources of high NUE germplasm to
begin breeding for N response. Finally, chapter two emphasized the importance of testing wheat
lines under more than three N conditions per location to identify significant genotype by N rate
interactions. Future trials for NUE in soft red winter wheat will require breeders to optimize the
number of testing sites and N rates per site to assess both yield stability and interaction effects.
The second chapter used two mapping populations to identify significant marker-trait-
associations for 11 N-related traits (Table 4.1). The study employed a genotyping-by-sequence
approach to produce more than 2,400 high-density polymorphic genetic markers for the parents
and progeny in both populations and detected a combined 130 quantitative trait loci (QTL). The
reproducible QTL for NUE mapped to chromosomes 1D, 2D, 4A, 6A, 7A, and 7D. Two of the
six QTL (2D and 4A) were also associated with known photoperiod response and a QTL
associated with resistance to Fusarium head blight. Three of the QTL (6A, 7A, and 7D) were
identified at similar mapping intervals in previous NUE mapping studies in wheat, while the
QTL on 1D was not previously reported. A majority of the QTL for NUE identified in this study

162
explained less than 20 % of the observed phenotypic variation. Upon further validation in
unrelated germplasm, these markers may be implementable in NUE marker-assisted breeding
programs. Breeders may benefit from including QNue.151-1D and QNue.151-7D into MAS
programs as they were reproducible over multiple site seasons, explained a large percentage of
the variation, and conferred an increase of 5.9 % and 5.7 % in NUE when combined. Continued
selection on Fhb_6A_Neuse will also enable genetic improvements for FHB resistance without
reducing NUE as was observed for the QTL, Fhb_4A-Neuse.
Chapter three of this dissertation emphasizes the importance of accounting for major
genes and effects of different alleles governing major morpho-physiological traits including
heading date and plant height when conducting nitrogen use efficiency (NUE) studies. Using the
methodology described in Table 4.1, it was observed that wheat (Triticum aestivum L.) lines with
the photoperiod sensitivity allele on chromosome 1D (Ppd-D1b) had higher grain yields, floret
fertility, and kernels per spike at the expense of grain nitrogen (N) content. The rate of N applied
at the five tiller and stem elongation stages also contributed to grain yield, several yield
components, grain N content, and N-traits such as NUE, N uptake efficiency (NUpE), and N
utilization efficiency (NUtE). The contribution of component traits (NUpE and NUtE) to NUE
was similar between photoperiod allele groups at a given N rate when 33 kg N ha-1 was applied
at the five tiller stage. However, a relative decrease in the contribution from NUpE in the Ppd-
D1a group was observed when 67 kg N ha-1 was applied. This may have resulted from reduced
absorption of N when excess N was supplied at the five tiller stage as compared with the Ppd-
D1b group. Finally, in the first chapter it also was observed that NUtE and flag leaf chlorophyll
content were significantly associated with grain yield across N supplies and may serve as target
traits for future NUE improvement.

163
Future Directions
The findings reported in this dissertation will enable breeders to develop diallel crosses
using several high and low NUE parental lines to determine the merits of actively breeding for N
response. Through this approach, breeding for improved N response may be of merit if the
progeny from high × high NUE crosses express higher grain yield and quality under a range of N
conditions than low × low NUE crosses. The current study determined that certain phenotypes
are strongly associated with NUE improvement under low N conditions and may benefit from
development of the “ideal phenotype” that combines desirable plant architecture, chlorophyll
content, senescence dynamics, and head morphology. The ideotype strategy would employ
optimized N acquisition, transportation, remobilization, and assimilation to produce crop
varieties with strong agronomic performance, disease resistance, and high NUE. Wheat breeding
for NUE within the Eastern United States may also benefit from the exploration of secondary
and tertiary germplasm to identify novel N response alleles. Previous investigations have
identified significant genetic variation amongst geographic regions, classes of wheat, wheat
growth habits, and related species that may confer significant genetic gains in N response with
introgression into adapted germplasm.
A less conventional direction would require breeders to dive further into the realm of
molecular biology by developing a nested-association mapping (NAM) panel of 20 to 30
populations to identify quantitative trait loci (QTL) that confer meaningful improvements in
NUE across genetic materials. The Virginia Tech Small Grains Breeding Program has already
begun development of such a panel that currently consists of five doubled haploid populations

164
that share a common low NUE parent, ‘38158’, PI 619052 (Table 4.2). An allele report for the
parents of these populations is provided in Table 4.3. However, the 38158 NAM panel will
likely require the addition of more populations to identify QTL with greater application to the
breeding program. Results of the mapping study mentioned in this dissertation combined with
those from the NAM panel may then be followed up with fine mapping and cloning of genes
conferring a positive N response.
Another approach to identify QTL was recently employed in rice (Oryza sativa L.) using
a genome wide scan of two subspecies to identify a major contributor to NUE that arose upon
divergence. Wheat breeders can similarly investigate the potential closely related species for
improved N response by conducting genome wide scans in its many wild relatives for eventual
gene identification. The cloned genes from such approaches may then be introduced into
adapted lines using conventional backcrossing or by implementing a CRISPR based strategy.
Breeders targeting improved NUE may also benefit from implementing genomic
prediction models into their programs. This will require the tactful development of a suitable
panel of lines that takes into account population structure and the addition of newer plant
material. The implementation of genomic selection may indeed prove to be more valuable than
QTL mapping alone as we expect that NUE, much like yield per se, is a complex quantitative
trait controlled by several to many genes. Wheat breeders have already begun to utilize genomic
selection for similarly complex traits including grain yield, disease resistance, and end use
quality.

165
Table 4.1. Summary of methodology and key findings in each study.
Chapter Analysis Study Traits Methods
I Allelic effects I 13 Two Ppd-D1 allele groups were grown under five N
rates (Ohio) or N rate by timing (Virginia) treatments in
a total of eight environments.
II 1
II Genotypic
variation
I 6 Two panels of wheat lines were tested under two, three,
or five N rates to detect G × N interactions in a
combined 51 N-environments.
II 6
III 1
III QTL mapping I 11 Two bi-parental mapping populations sharing a low
NUE parent (‘Yorktown’) were grown under two N
rates in four environments. II 11
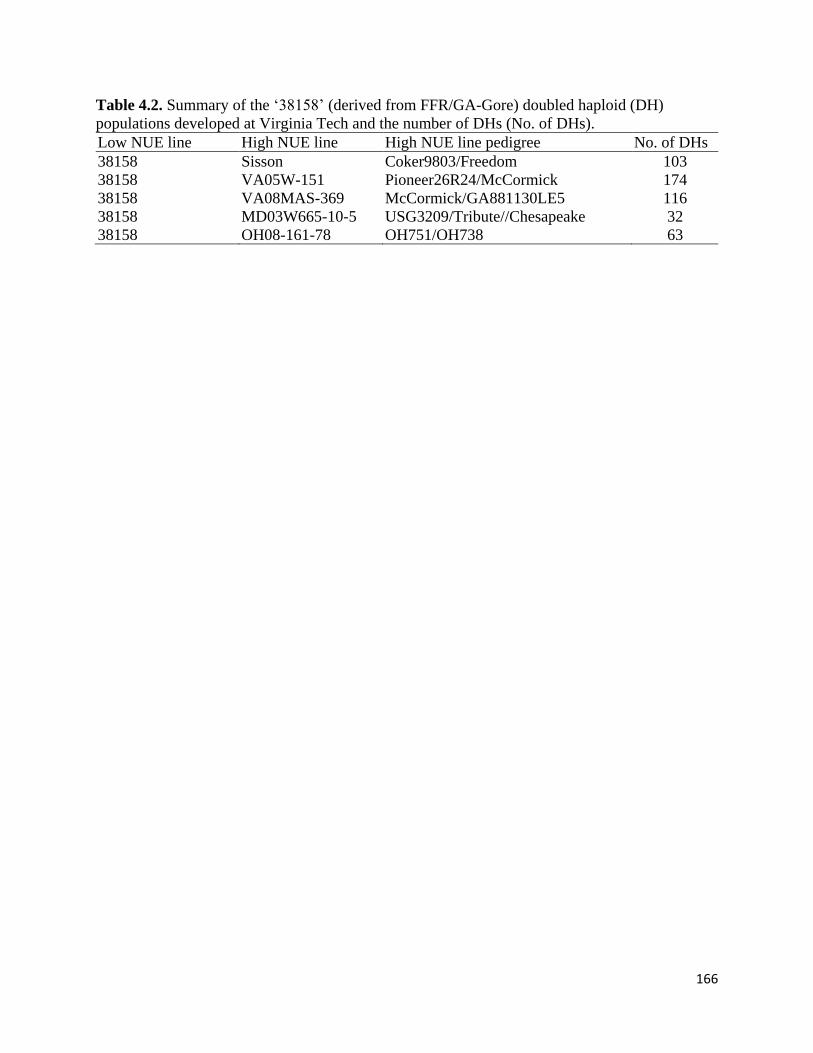
166
Table 4.2. Summary of the ‘38158’ (derived from FFR/GA-Gore) doubled haploid (DH)
populations developed at Virginia Tech and the number of DHs (No. of DHs).
Low NUE line High NUE line High NUE line pedigree No. of DHs
38158 Sisson Coker9803/Freedom 103
38158 VA05W-151 Pioneer26R24/McCormick 174
38158 VA08MAS-369 McCormick/GA881130LE5 116
38158 MD03W665-10-5 USG3209/Tribute//Chesapeake 32
38158 OH08-161-78 OH751/OH738 63

167
Table 4.3. Allele report for the 38158 NAM population parents from a suite of haplotyping markers. The 12 selected markers were
shown to confer major physiological effects in the present dissertation, Brian P. Ward’s dissertation, and many of the previous
investigations discussed in Chapters 1, 2, and 3.
Wheat line Rht-B1 Rht-D1 Vrn-A1 Vrn-B1 Vrn-D3 Ppd-A1 Ppd-B1 Ppd-D1 Fhb1 Sr36 TaSus2-2B 1RS¶
38158 a† b‡ b b b b b a a a a no
Sisson a b b b b a a b a b b 1BL
VA05W-151 a b b b b a b b a a a no
VA08MAS-369 a b a b a a b b a a a 1AL
MD03W665-10-5 a b b b b b NC§ a a b b 1BL
OH08-161-78 a a b b b b a b a b b no
† The ‘a’ allele represents the absence of a dwarfing allele (Rht-B1 and Rht-D1), short or early vernilization genes (Vrn-A1, Vrn-B1,
and Vrn-D3), photoperiod insensitivity (Ppd-A1, Ppd-B1, and Ppd-D1), the absence of resistance alleles at Fhb1 and Sr36, and the
absence of the sucrose synthase allele (TaSus2-2B).
‡ The ‘b’ allele represents the presence of a dwarfing allele (Rht-B1 and Rht-D1), long or late vernilization genes (Vrn-A1, Vrn-B1,
and Vrn-D3), photoperiod sensitivity (Ppd-A1, Ppd-B1, and Ppd-D1), the presence of resistance alleles at Fhb1 and Sr36, and the
presence of the sucrose synthase allele (TaSus2-2B).
§ No call.
¶ Wheat-rye translocations on 1AL and 1BL.
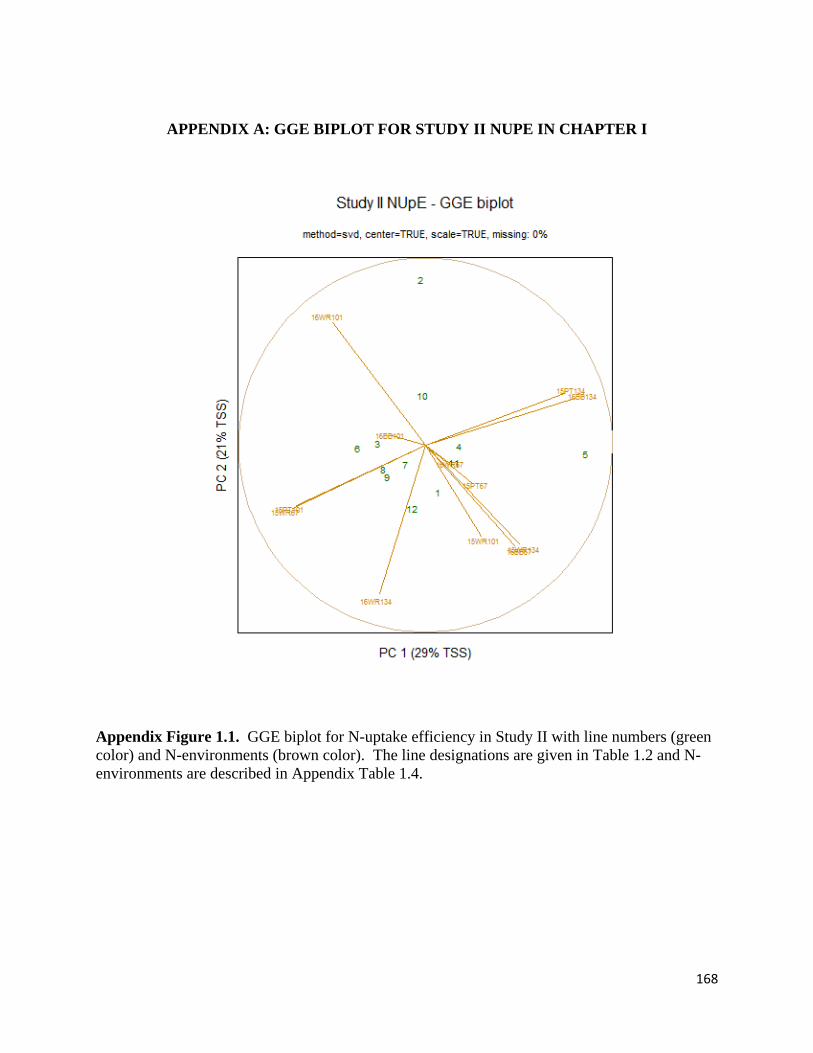
168
APPENDIX A: GGE BIPLOT FOR STUDY II NUPE IN CHAPTER I
Appendix Figure 1.1. GGE biplot for N-uptake efficiency in Study II with line numbers (green
color) and N-environments (brown color). The line designations are given in Table 1.2 and N-
environments are described in Appendix Table 1.4.

169
APPENDIX B: GGE BIPLOT FOR STUDY II NUTE IN CHAPTER I
Appendix Figure 1.2. GGE biplot for N-utilization efficiency in Study II with line numbers
(green color) and N-environments (brown color). The line designations are given in Table 1.2
and N-environments are described in Appendix Table 1.4.

170
APPENDIX C: GGE BIPLOT FOR STUDY III NUPE IN CHAPTER I
Appendix Figure 1.3. GGE biplot for N-uptake efficiency in Study III with line numbers (green
color) and N-environments (brown color). The line designations are given in Table 1.2 and N-
environments are described in Appendix Table 1.4.

171
APPENDIX D: GGE BIPLOT FOR STUDY III NUTE IN CHAPTER I
Appendix Figure 1.4. GGE biplot for N-utilization efficiency in Study III with line numbers
(green color) and N-environments (brown color). The line designations are given in Table 1.2
and N-environments are described in Appendix Table 1.4.

172
APPENDIX E: STUDY I GRAIN YIELDS IN CHAPTER I
Appendix Table 1.1. Grain yields for wheat lines over five N rates in Study I at each testing
environment.
Wheat line 14CSa 15CS 15WS
---------------------Grain yield (kg ha-1)---------------------
Bess - - 4,799 bb
IL02-19483B - - 4,294 de
IL07-4415 - - 4,243 ef
KY06C-1003-139-8-3 - - 4,094 f
MD03W485-10-10 - - 4,412 cd
MD05W10208-11-8 - - 4,499 c
MO080864 - - 4,086 f
OH06-150-57 - - 4,936 b
OH08-161-78 - - 4,310 de
OH08-172-42 - - 4,311 de
Sisson - - 4,122 f
VA08MAS-369 - - 5,106 a a 2013-14 Custar (14CS), 2014-15 Custar (15CS), and 2014-15 Wooster (15WS) environments. b The LSD at P ≤ 0.05 is used to compare treatment means within an environment; means within
an environment followed by the same letter are not significantly different.

173
APPENDIX F: STUDY II GRAIN YIELDS IN CHAPTER I
Appendix Table 1.2. Grain yields for wheat lines over three N rates in Study II at each testing environment.
Wheat line 14PTa 14WR 15PT 15WR 16BB 16WR
-----------------------------------------------Grain yield (kg ha-1)-----------------------------------------------
Bess - - 3,070 eb 4,856 b-d 3,895 f 3,103 d-f
IL02-19483B - - 3,379 b-e 4,609 d-f 4,849 ab 3,353 cd
IL07-4415 - - 3,247 de 4,061 g 4,914 a 3,331 c-e
KY06C-1003-139-8-3 - - 3,618 a-c 4,876 b-d 4,661 bc 3,274 d-f
MD03W485-10-10 - - 3,262 c-e 4,361 fg 4,197 e 3,034 f
MD05W10208-11-8 - - 3,486 a-d 4,451 ef 4,322 de 3,061 ef
MO080864 - - 3,306 c-e 5,105 ab 4,380 de 3,569 a-c
OH06-150-57 - - 3,231 de 5,013 a-c 4,483 cd 3,357 b-d
OH08-161-78 - - 3,668 ab 5,068 a-c 4,600 c 3,651 a
OH08-172-42 - - 3,759 a 4,753 c-e 5,004 a 3,311 c-f
Sisson - - 3,329 b-e 4,767 b-d 4,379 de 3,296 c-f
VA08MAS-369 - - 3,750 a 5,229 a 4,806 ab 3,637 ab a 2013-14 Painter (14PT), 2014-15 Warsaw, (14WR), 2014-15 Painter (15PT), 2014-15 Warsaw (15WR), 2015-16 Blacksburg
(16BB), and 2015-16 Warsaw (16WR) environments. b The LSD at P ≤ 0.05 is used to compare treatment means within an environment; means within an environment followed by the same
letter are not significantly different.

174
APPENDIX G: STUDY III GRAIN YIELDS IN CHAPTER I
Appendix Table 1.3. Grain yields for wheat lines over two N rates in Study III at each testing
environment. Wheat line 16CSa 16FR 16WS
--------------------------Grain yield (kg ha-1)--------------------------
Bess 5,292 bb 5,953 bc 6,734 b
MD03W485-10-10 4,795 de 5,691 b-d 5,988 c
OH08-161-78 4,795 de 5,618 cd 6,410 b
OH08-172-42 5,766 a 5,766 bc 7,329 a
Sisson 5,192 bc 5,629 b-d 5,429 de
SS520 4,414 e 5,377 d 5,223 e
VA05W-151 5,060 b-d 5,731 b-d 5,572 de
VA07W-415 5,043 b-d 5,612 cd 5,714 cd
VA08MAS-369 5,223 bc 5,980 b 6,665 b
VA09W-73 4,865 cd 6,419 a 6,688 b
Yorktown 5,051 b-d 5,880 bc 6,386 b
16BB 16BS 16WR
--------------------------Grain yield (kg ha-1)--------------------------
Bess 4,056 cd 2,152 a-c 3,827 a-d
MD03W485-10-10 4,605 b 2,168 a-c 3,494 e
OH08-161-78 4,719 b 2,347 ab 3,938 ab
OH08-172-42 4,698 b 1,946 cd 3,533 de
Sisson 4,455 bc 1,900 cd 3,610 c-e
SS520 3,931 d 1,632 d 3,575 c-e
VA05W-151 4,744 b 2,079 bc 3,871 a-c
VA07W-415 3,986 d 1,901 cd 4,138 a
VA08MAS-369 5,238 a 2,496 a 3,939 ab
VA09W-73 4,697 b 2,439 ab 4,122 a
Yorktown 4,735 b 2,423 ab 3,666 b-e
17BB 17BS 17WR
--------------------------Grain yield (kg ha-1)--------------------------
Bess 6,084 cd 2,145 c-e 4,623 cd
MD03W485-10-10 4,724 f 2,448 b-d 4,377 d
OH08-161-78 6,226 c 2,713 ab 4,650 cd
OH08-172-42 6,199 cd 2,129 de 4,872 bc
Sisson 4,927 f 2,183 c-e 4,908 bc
SS520 5,654 e 1,814 e 4,796 bc
VA05W-151 5,813 de 2,338 b-d 5,303 a
VA07W-415 6,864 a 2,584 ab 5,094 ab
VA08MAS-369 6,304 bc 2,940 a 5,423 a
VA09W-73 6,684 ab 2,507 bc 5,300 a
Yorktown 5,826 de 2,640 ab 4,937 bc a 2015-16 Custar (16CS), 2015-16 Fremont, (16FR), 2015-16 Wooster (16WS), 2015-16, 2015-
16 Blacksburg (16BB), 2015-16 Blackstone (16BS), 2015-16 Warsaw (16WR), 2016-17
Blacksburg (17BB), 2016-17 Blackstone (17BS), and 2016-17 Warsaw (17WR) environments. b The LSD at P ≤ 0.05 is used to compare treatment means within an environment; means within
an environment followed by the same letter are not significantly different.

175
APPENDIX H: ENVIRONMENT CODES FOR GGE BIPLOTS IN CHAPTER I
Appendix Table 1.4. Environment codes for N-environments in each study for GGE biplots†.
Study Environment
abbreviation Season Location Replications N rate
I 14CS45 2013-14 Custar, OH 4 45
I 14CS67 2013-14 Custar, OH 4 67
I 14CS90 2013-14 Custar, OH 4 90
I 14CS112 2013-14 Custar, OH 4 112
I 14CS134 2013-14 Custar, OH 4 134
I 15CS45 2014-15 Custar, OH 4 45
I 15CS67 2014-15 Custar, OH 4 67
I 15CS90 2014-15 Custar, OH 4 90
I 15CS112 2014-15 Custar, OH 4 112
I 15CS134 2014-15 Custar, OH 4 134
I 15WS45 2014-15 Wooster, OH 4 45
I 15WS67 2014-15 Wooster, OH 4 67
I 15WS90 2014-15 Wooster, OH 4 90
I 15WS112 2014-15 Wooster, OH 4 112
I 15WS134 2014-15 Wooster, OH 4 134
II 14PT67 2013-14 Painter, VA 3 67
II 14PT101 2013-14 Painter, VA 3 101
II 14PT134 2013-14 Painter, VA 3 134
II 14WR67 2013-14 Warsaw, VA 3 67
II 14WR101 2013-14 Warsaw, VA 3 101
II 14WR134 2013-14 Warsaw, VA 3 134
II 15PT67 2014-15 Painter, VA 3 67
II 15PT101 2014-15 Painter, VA 3 101
II 15PT134 2014-15 Painter, VA 3 134
II 15WR67 2014-15 Warsaw, VA 3 67
II 15WR101 2014-15 Warsaw, VA 3 101
II 15WR134 2014-15 Warsaw, VA 3 134
II 16BB67 2015-16 Blacksburg, VA 3 67
II 16BB101 2015-16 Blacksburg, VA 3 101
II 16BB134 2015-16 Blacksburg, VA 3 134
II 16WR67 2015-16 Warsaw, VA 2 67
II 16WR101 2015-16 Warsaw, VA 2 101
II 16WR134 2015-16 Warsaw, VA 2 134
III 16CS67 2015-16 Custar, OH 4 67
III 16CS134 2015-16 Custar, OH 4 134
III 16FR67 2015-16 Fremont, OH 4 67
III 16FR134 2015-16 Fremont, OH 4 134
III 16WS67 2015-16 Wooster, OH 4 67
III 16WS134 2015-16 Wooster, OH 4 134
III 16BB67 2015-16 Blacksburg, VA 3 67
III 16BB134 2015-16 Blacksburg, VA 3 134
III 16BS67 2015-16 Blackstone, VA 3 67
III 16BS134 2015-16 Blackstone, VA 3 134
III 16WR67 2015-16 Warsaw, VA 2 67
III 16WR134 2015-16 Warsaw, VA 2 134
III 17BB67 2016-17 Blacksburg, VA 3 67
III 17BB134 2016-17 Blacksburg, VA 3 134
III 17BS67 2016-17 Blackstone, VA 3 67
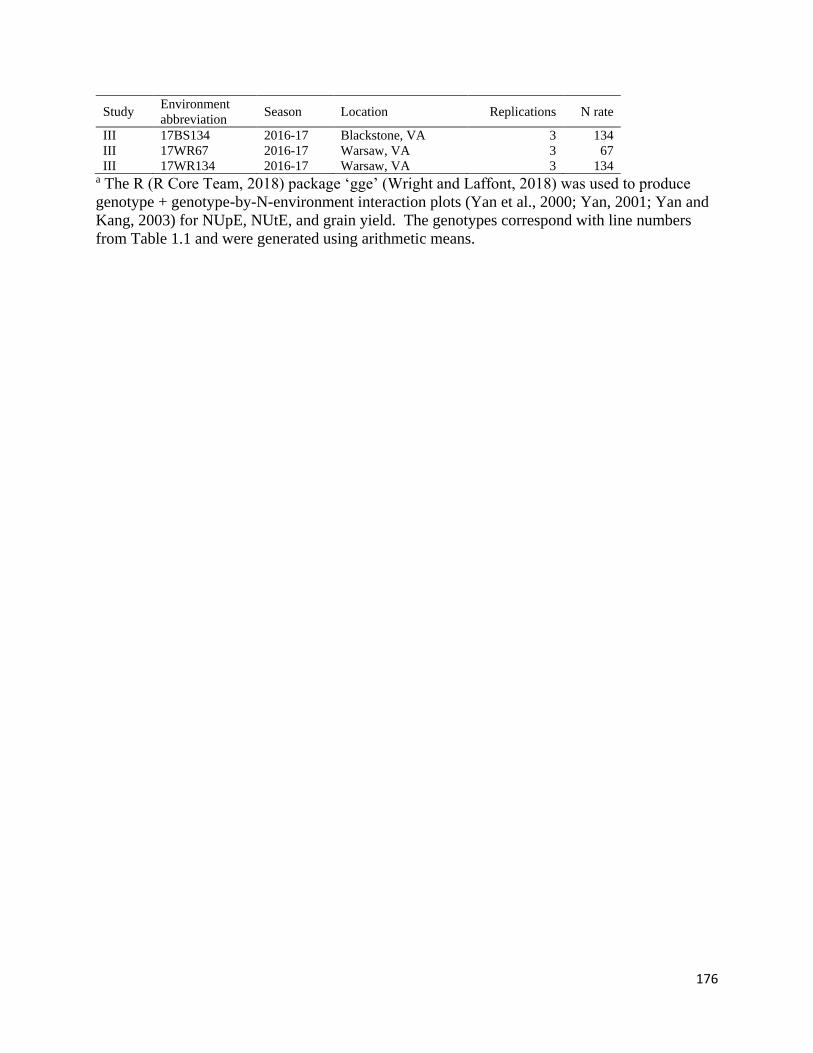
176
Study Environment
abbreviation Season Location Replications N rate
III 17BS134 2016-17 Blackstone, VA 3 134
III 17WR67 2016-17 Warsaw, VA 3 67
III 17WR134 2016-17 Warsaw, VA 3 134 a The R (R Core Team, 2018) package ‘gge’ (Wright and Laffont, 2018) was used to produce
genotype + genotype-by-N-environment interaction plots (Yan et al., 2000; Yan, 2001; Yan and
Kang, 2003) for NUpE, NUtE, and grain yield. The genotypes correspond with line numbers
from Table 1.1 and were generated using arithmetic means.

177
APPENDIX I: STUDY II STABILITY PARAMETERS IN CHAPTER I
Appendix Table 1.5. Mean N-uptake (NUpE) and N-utilization (NUtE) efficiencies with
stability parameters slope (βi) and deviation from regression (δ2d) over N-environments for
wheat lines in Study II.
Wheat line Trait Mean βi δ2d
Bess
NUpE
1.15 2.02 0.06
IL02-19483B 1.22 1.76 0.04
IL07-4415 1.10 0.69 0.08
KY06C-1003-139-8-3 1.21 0.97 0.06
MD03W485-10-10 1.23 1.01 0.03
MD05W10208-11-8 1.14 -0.16 0.03
MO080864 1.27 0.78 0.11
OH06-150-57 1.13 1.37 0.04
OH08-161-78 1.23 1.12 0.06
OH08-172-42 1.15 0.62 0.04
Sisson 1.22 1.15 0.04
VA08MAS-369 1.17 0.67 0.04
Bess
NUtE
36.17 1.50 19.88
IL02-19483B 36.21 1.27 25.91
IL07-4415 38.53 1.92 169.07
KY06C-1003-139-8-3 37.49 1.02 38.49
MD03W485-10-10 32.52 0.32 11.51
MD05W10208-11-8 35.39 -0.28 31.72
MO080864 37.05 0.35 87.13
OH06-150-57 38.62 1.79 19.57
OH08-161-78 37.99 0.96 24.69
OH08-172-42 40.23 1.60 44.31
Sisson 35.03 0.76 26.44
VA08MAS-369 40.07 0.80 30.92

178
APPENDIX J: STUDY III STABILITY PARAMETERS IN CHAPTER I
Appendix Table 1.6. Mean N-uptake (NUpE) and N-utilization (NUtE) efficiencies with
stability parameters slope (βi) and deviation from regression (δ2d) over N-environments for
wheat lines in Study III.
Wheat line Trait Mean βi δ2d
Bess
NUpE
1.56 0.85 0.02
MD03W485-10-10 1.66 1.48 0.03
OH08-161-78 1.61 0.83 0.12
OH08-172-42 1.62 1.00 0.13
Sisson 1.66 0.68 0.10
SS520 1.52 0.80 0.07
VA05W-151 1.70 1.39 0.13
VA07W-415 1.58 0.91 0.02
VA08MAS-369 1.70 1.12 0.04
VA09W-73 1.72 0.73 0.11
Yorktown 1.63 1.20 0.21
Bess
NUtE
36.37 1.13 19.70
MD03W485-10-10 31.52 0.70 7.51
OH08-161-78 36.87 0.68 21.11
OH08-172-42 38.33 1.06 10.56
Sisson 32.42 0.77 26.42
SS520 32.37 0.72 28.50
VA05W-151 34.01 0.67 31.15
VA07W-415 36.82 1.00 12.50
VA08MAS-369 35.15 1.10 20.50
VA09W-73 35.20 1.36 17.99
Yorktown 34.05 1.83 19.51

179
APPENDIX K:
ANOVA AND F-VALUES FOR HEADING DATE AND
PLANT HEIGHT IN CHAPTER III
Appendix Table 3.1. Analysis of variance and F-values for photoperiod group, treatment, and
interaction effects on heading date and height at physiological maturity for soft red winter wheat
lines grown in four Virginia environments in Chapter I.
df
Heading
date Plant height
14
WV
A
Ppd‡ 1 9.25 ** 36.06 ***
N 4 0.43 ns† 23.97 ***
Ppd × N 4 0.26 ns 0.11 ns
15
WV
A
Ppd 1 52.26 *** 19.70 ***
N 4 0.19 ns 4.18 **
Ppd × N 4 0.23 ns 0.15 ns
16
BV
A
Ppd 1 14.92 *** 37.86 ***
N 4 0.22 ns 0.43 ns
Ppd × N 4 0.34 ns 0.31 ns
16
WV
A
Ppd 1 14.46 *** 7.42 ***
N 4 0.36 ns 1.00 ns
Ppd × N 4 0.30 ns 1.20 ns
†ns, not significant.
* Significant at the 0.05 probability level.
** Significant at the 0.01 probability level.
*** Significant at the 0.001 probability level.
‡Ppd, photoperiod allele grouping; N, nitrogen rate.
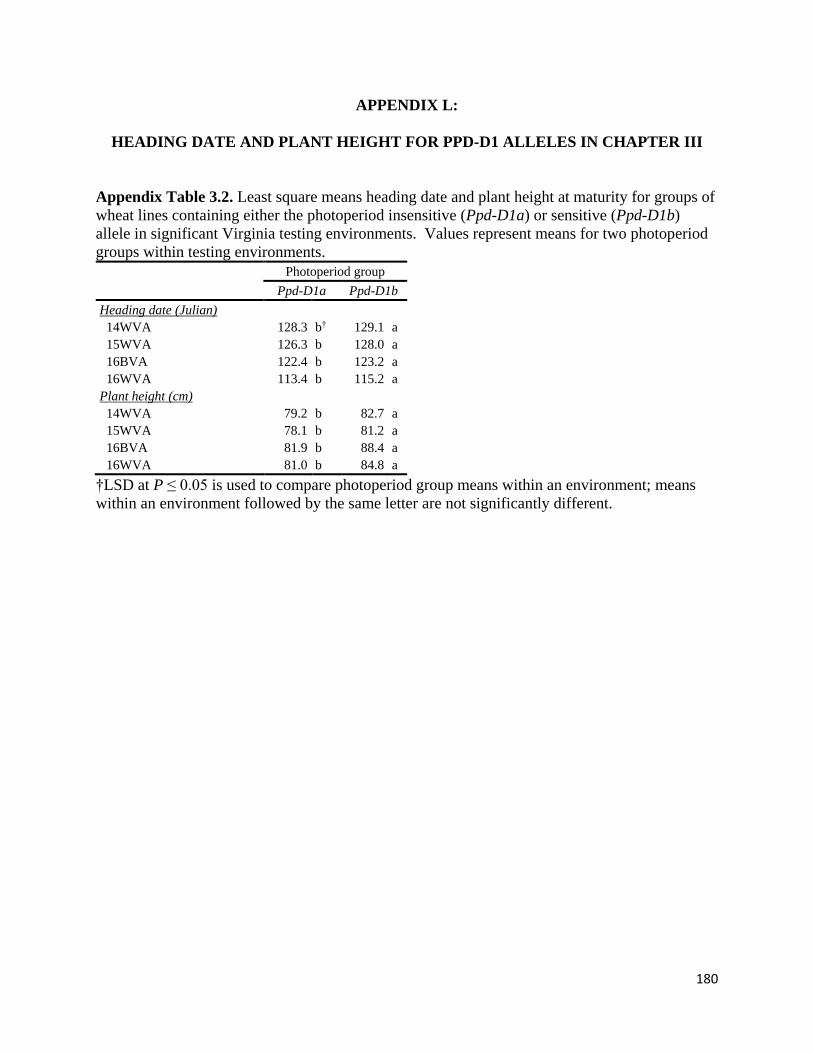
180
APPENDIX L:
HEADING DATE AND PLANT HEIGHT FOR PPD-D1 ALLELES IN CHAPTER III
Appendix Table 3.2. Least square means heading date and plant height at maturity for groups of
wheat lines containing either the photoperiod insensitive (Ppd-D1a) or sensitive (Ppd-D1b)
allele in significant Virginia testing environments. Values represent means for two photoperiod
groups within testing environments.
Photoperiod group
Ppd-D1a Ppd-D1b
Heading date (Julian)
14WVA 128.3 b† 129.1 a
15WVA 126.3 b 128.0 a
16BVA 122.4 b 123.2 a
16WVA 113.4 b 115.2 a
Plant height (cm)
14WVA 79.2 b 82.7 a
15WVA 78.1 b 81.2 a
16BVA 81.9 b 88.4 a
16WVA 81.0 b 84.8 a
†LSD at P ≤ 0.05 is used to compare photoperiod group means within an environment; means
within an environment followed by the same letter are not significantly different.

181
APPENDIX M: PLANT HEIGHT BY TREATMENT IN CHAPTER III
Appendix Table 3.3. Least square means of heading date and plant height at maturity for five
spring-split nitrogen treatments, 1 (33+33), 2 (67+33), 3 (33+67), 4 (67+67), and 5 (33+101), in
significant Virginia testing environments. Values represent means over treatment. Nitrogen treatment (kg N ha-1)
1 (33+33)† 2 (67+33) 3 (33+67) 4 (67+67) 5 (33+101)
Plant height (cm)
14WVA 76.6 d‡ 78.9 c 82.0 b 83.0 ab 84.8 a
15WVA 76.9 b 80.3 a 79.9 a 81.1 a 80.1 a
†Treatments were split applied at Zadoks growth stages 25 and 30.
‡LSD at P ≤ 0.05 is used to compare treatment means within an environment; means within an
environment followed by the same letter are not significantly different.