phytoremediation of soil containing mixed …...phytoremediation of soil containing mixed...
TRANSCRIPT

Phytoremediation of Soil containing
Mixed Contaminants
Ramin Memarian
A Thesis
in
The Department of Building, Civil and Environmental Engineering
Presented in Partial Fulfillment of the Requirements for the Degree of
Doctor of
Philosophy (Civil Engineering)
Concordia University
Montreal, Quebec, Canada
March 2012
© Ramin Memarian, 2012


iii
ABSTRACT
Phytoremediation of Soil containing Mixed Contaminants
Ramin Memarian, Ph.D.
Concordia University, 2012
This study investigated the application of surfactants and chelates to enhance the removal
of mixed contaminants [Cd (II), Pb (II) and used engine oil] from a sandy soil cultivated
with Indian mustard plants. For chelate additives, EDTA (Ethylenediamine tetraacetic
acid) was found to be more efficient than EDDS (Ethylenediamine disuccinic acid) in
increasing the accumulation of metal contaminants Pb (II) in the plants. EDTA was also
more capable of removing the used engine oil through rhizodegradation than EDDS.
EDTA caused a sharper decrease in basal soil respiration (BSR) than EDDS, indicating
that the former was much more toxic to the microbes.
For surfactant additives, the results showed that Triton X-100 and Tween 80 at
concentrations higher than their critical micellar concentration enhanced
phytostabilization of Pb (II). The application of Tween 80 resulted in an increase in
phytoremediation of Pb (II). At the same concentrations, Tween 80 was more effective
than Triton X-100 in facilitating rhizodegradation of the used engine oil. Soil basal
microbiological respiration tests showed that the application of Tween 80 resulted in an
increase in BSR. These tests indicated that the lower concentration of Triton X-100 had a
slightly positive effect on BSR, whereas at higher concentrations, it was inhibitory to the
microbes.
Empirical phytoremediation models linked to the removal of the heavy metals from the
soil were formulated in the study. The two first order kinetic models were able to
describe the leaching process for both Cd (II) and Pb (II). The models also revealed that

iv
the uptake of Pb (II) and Cd (II) were well described by the Freundlich type model, in the
presence of surfactants. On the other hand, in the presence of chelates the uptake of Pb
(II) and Cd (II) was found to follow the Langmuir type model. According to the
leachability index (LI) determined in the tests, all surfactants tested can be considered
as safe additives for enhancing phytoremediation. Compared to Triton X-100, Tween 80
resulted in lower diffusivity of metals tested and higher values of LI indicating that this
surfactant was also safer from the point of view of reducing ground water pollution.
Compared to EDTA, EDDS resulted in higher values of LI, which is desirable.

v
Acknowledgements
I am indebted to the Department of Building, Civil & Environmental Engineering, and
Concordia University for the help I received during my doctoral studies. I wish to thank
Dr. Ramamurthy for suggesting the research topic and his guidance. I also want to
thank to Dr. Li and Dr. Chen for their valuable assistance and encouragement.
I thank Dr. Alimahmoodi for the help received with regards to instrumentation.
I would like to express my appreciation to my parents who have continuously supported
my endeavors to realize my research goals. Last but not the least, my special thanks to
my wife for her love, patience, and understanding during this period.
vi
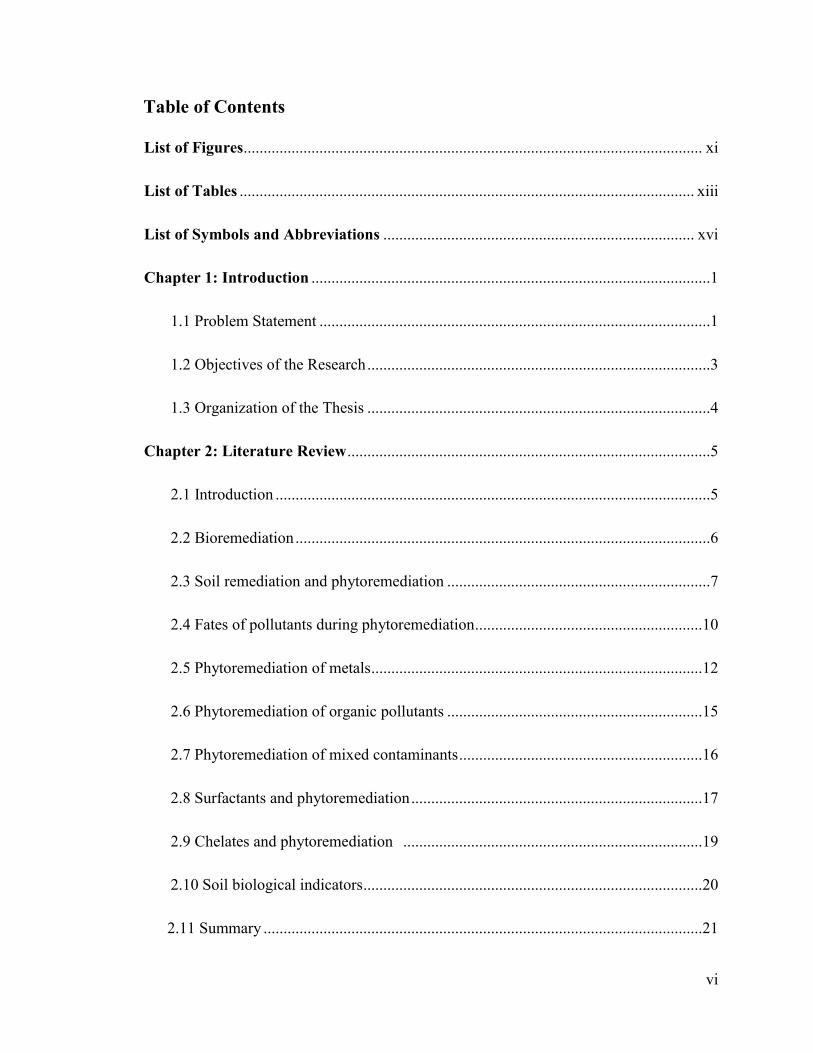
Table of Contents
List of Figures ................................................................................................................... xi
List of Tables .................................................................................................................. xiii
List of Symbols and Abbreviations .............................................................................. xvi
Chapter 1: Introduction ....................................................................................................1
1.1 Problem Statement ..................................................................................................1
1.2 Objectives of the Research ......................................................................................3
1.3 Organization of the Thesis ......................................................................................4
Chapter 2: Literature Review ...........................................................................................5
2.1 Introduction .............................................................................................................5
2.2 Bioremediation ........................................................................................................6
2.3 Soil remediation and phytoremediation ..................................................................7
2.4 Fates of pollutants during phytoremediation .........................................................10
2.5 Phytoremediation of metals ...................................................................................12
2.6 Phytoremediation of organic pollutants ................................................................15
2.7 Phytoremediation of mixed contaminants .............................................................16
2.8 Surfactants and phytoremediation .........................................................................17
2.9 Chelates and phytoremediation ...........................................................................19
2.10 Soil biological indicators .....................................................................................20
2.11 Summary ..............................................................................................................21

vii
Chapter 3: Materials and Methods ................................................................................22
3.1 Introduction ........................................................................................................22
3.2 Materials ................................................................................................................22
3.2.1 Heavy metals .................................................................................................22
3.2.2 Used engine oil as an organic pollutant .......................................................23
3.2.3 Soil .................................................................................................................25
3.2.4 Soil spiking procedures ................................................................................26
3.2.5 Homogeneity test .........................................................................................27
3.2.6 Plant ................................................................................................................27
3.2.7 Additives .............................................................................................................27
3.2.7.1 Surfactants ....................................................................................................27
3.2.7.2 Chelates .........................................................................................................28
3.3 Experiment methods .............................................................................................28
3.4 Samples analysis .....................................................................................................31
3.4.1 Soil organic matter determination ....................................................................31
3.4.2 Soil cation-exchange capacity (CEC) ...............................................................31
3.4.3 Soil hydraulic conductivity ...............................................................................32
3.4.4 Heavy metals concentration in samples............................................................33
3.4.5 Used engine oil content in the soil....................................................................33
3.4.6 Basal soil respiration (BSR) ..............................................................................34

viii
Chapter 4: The effect of chelates on phytoremediation ...............................................36
4.1 Introduction ..........................................................................................................36
4.2 Effect of chelates on plant growth ........................................................................36
4.3 Effect of chelates on phytoremediation of Cd (II) ...............................................37
4.4 Effect of chelates on phytoremediation of Pb (II) ................................................38
4.5 Effect of chelates on Cd (II) and Pb (II) leaching ................................................40
4.6 Cd (II) and Pb (II) mass balance for chelates application ....................................42
4.7 Effect of chelates on rhizodegradation of used engine oil ...................................44
4.8 Effect of chelates on basal soil respiration (BSR) ................................................45
4.9 Summary ..............................................................................................................46
Chapter 5: The effect of surfactants on phytoremediation ..........................................47
5.1 Introduction ..........................................................................................................47
5.2 Effect of surfactants on plant growth ...................................................................47
5.3 Effect of surfactants on phytoremediation of Cd (II) ...........................................48
5.4 Effect of surfactants on phytoremediation of Pb (II) ...........................................49
5.5 Effect of surfactants on Cd (II) and Pb (II) leaching ............................................50
5.6 Cd (II) and Pb (II) mass balance for surfactants application ................................52
5.7 Effect of surfactants on rhizodegradation of used engine oil ...............................53
5.8 Effect of surfactants on basal soil respiration (BSR) ............................................56
5.9 Summary ..............................................................................................................57

ix
Chapter 6: Heavy metals transfer from soil media to plants .......................................58
6.1 Introduction ..........................................................................................................58
6.2 Freundlich and Langmuir models .........................................................................58
6.3 Model evaluation ..................................................................................................60
6.4 Predicting chelates induced metal uptake by the plant .........................................60
6.5 Predicting surfactants induced metal uptake by the plant ....................................66
6.6 Summary ..............................................................................................................71
Chapter 7: Leaching study ..............................................................................................73
7.1 Introduction ..........................................................................................................73
7.2 Leachability index ................................................................................................73
7.3 Observed diffusivity .............................................................................................74
7.4 Study of kinetics ...................................................................................................74
7.5 Observed diffusivity and leachability index of Cd (II) and Pb (II)
for soil in the presence of chelate ...................................................................76
7.6 Observed diffusivity and leachability index of Cd (II) and Pb (II)
for soil in the presence of surfactant ......................................................................77
7.7 Leaching kinetics ..................................................................................................78
7.8 Summary ..............................................................................................................84
Chapter 8: Summary and conclusions , contributions .................................................86
8.1 Summary and conclusions ....................................................................................86
8.2 Contributions ........................................................................................................88

x
References .........................................................................................................................89
Appendix .........................................................................................................................99

xi
List of Figures
Fig 2.1 Possible fates of pollutants during phytoremediation .........................................11
Fig 2.2 Typical root depths of four plants commonly used in phytoremediation .............14
Fig 2.3 Surfactant formation ..............................................................................................17
Fig 3.1 Treatments after 30 days of growing the plants ....................................................30
Fig 3.2 The visuals symptoms (light patches) due to Triton X- 100 toxicity ....................30
Fig 4.1 Effect of chelates on Cd (II) leachate ................................................................40
Fig 4.2 Effect of chelates on Pb (II) leachate ....................................................................41
Fig 4.3 Effect of chelates on rhizodegradation of the oil ..................................................44
Fig 4.4 Influence of chelates on basal soil respiration ......................................................46
Fig 5.1 Effect of surfactants on root Pb (II) in plants .....................................................50
Fig 5.2 Effect of surfactants on Cd (II) leachate .............................................................51
Fig 5.3 Effect of surfactants on Pb (II) leachate ................................................................52
Fig 5.4 Effect of surfactants on rhizodegradation of oil in the soil .................................55
Fig 5.5 Influence of surfactants on basal soil respiration ..................................................56
Fig 6.1 Linear model (n=1) for chelate enhanced Cd (II) uptake ......................................63
Fig 6.2 Freundlich type and Langmuir type models for chelate
enhanced Cd (II) uptake ........................................................................................63
Fig 6.3 Linear model (n=1) for chelate enhanced Pb (II) uptake ...................................65
xii
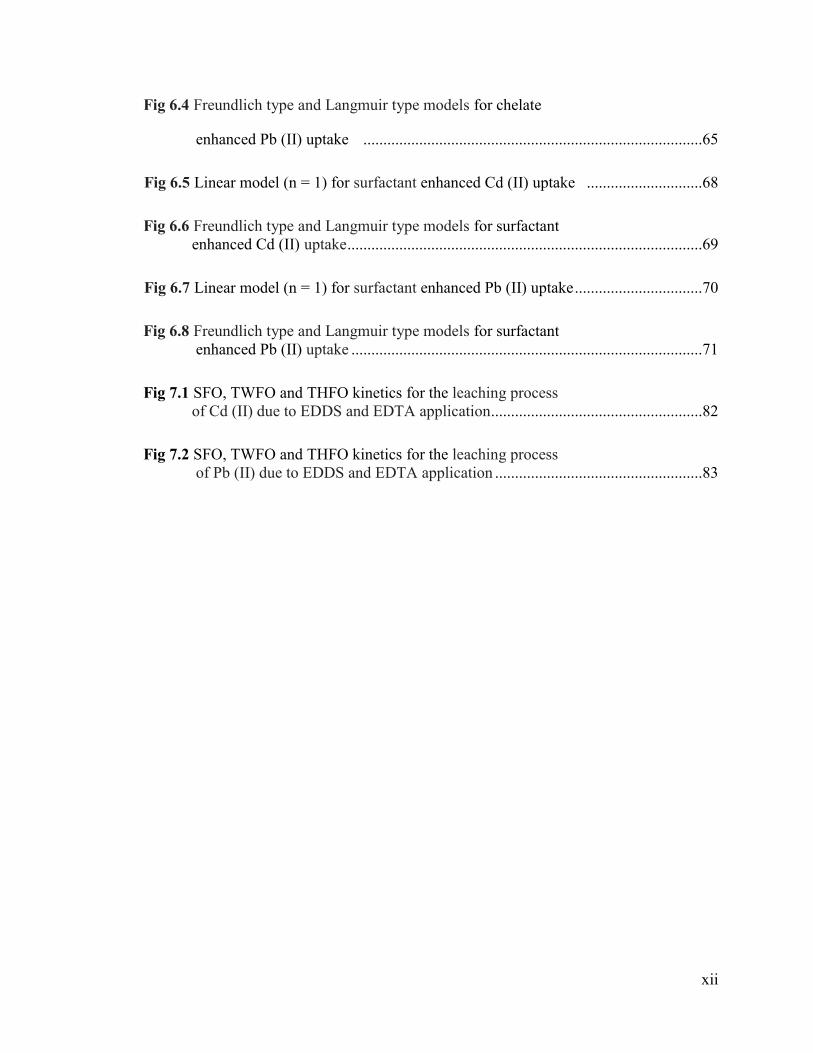
Fig 6.4 Freundlich type and Langmuir type models for chelate
enhanced Pb (II) uptake .....................................................................................65
Fig 6.5 Linear model (n = 1) for surfactant enhanced Cd (II) uptake .............................68
Fig 6.6 Freundlich type and Langmuir type models for surfactant
enhanced Cd (II) uptake .........................................................................................69
Fig 6.7 Linear model (n = 1) for surfactant enhanced Pb (II) uptake ................................70
Fig 6.8 Freundlich type and Langmuir type models for surfactant
enhanced Pb (II) uptake ........................................................................................71
Fig 7.1 SFO, TWFO and THFO kinetics for the leaching process
of Cd (II) due to EDDS and EDTA application .....................................................82
Fig 7.2 SFO, TWFO and THFO kinetics for the leaching process
of Pb (II) due to EDDS and EDTA application ....................................................83

xiii
List of Tables
Table 2.1 Criteria for soils: contamination level .................................................................6
Table 2.2 Estimated cost savings using phytoremediation vs.
conventional treatment .....................................................................................18
Table 2.3 Phytoremediation plants ....................................................................................13
Table 2.4 Approximate concentration of heavy metals
in leaf tissue for plants ......................................................................................15
Table 3.1 Chemical composition of car engine base oil ...................................................23
Table 3.2 Mean characteristics of used engine oil ............................................................25
Table 3.3 Physical - chemical characteristics of sand and clay ........................................25
Table 3.4 Physical - chemical characteristics of the soil ..................................................26
Table 3.5 Characteristics of Tween 80 and Triton X-100 .................................................28
Table 4.1 The influence of EDDS and EDTA on DM yield .............................................37
Table 4.2 Effect of EDDS and EDTA on Cd (II) uptake ..................................................38
Table 4.3 Effect of EDDS and EDTA on Pb (II) uptake .................................................39
Table 4.4 Cd (II) and Pb (II) mass balance for chelates application ...............................43
Table 5.1 The influence of Triton X-100 and Tween 80 on DM yield .............................48
Table 5.2 Effect of Triton X-100 and Tween 80 on Cd (II) uptake .................................49
Table 5.3 Mass balance for Pb (II) and Cd (II) for surfactants application ......................54
Table 6.1 Soluble Cd (II) and Pb (II) in the soil containing chelate ...............................61

xiv
Table 6.2 Solubilized form of Cd (II) and Pb (II) and their uptake in the
presence of chelate ..........................................................................................61
Table 6.3 Models for predicating chelate enhanced Cd (II) uptake ................................62
Table 6.4 Models for predicating chelate enhanced Pb (II) uptake ..................................64
Table 6.5 Soluble Cd (II) and Pb (II) in the soil containing surfactant .............................66
Table 6.6 Solubilized form of Cd (II) and Pb (II) and their uptake in the
presence of surfactant ...............................................................................67
Table 6.7 Models for predicating surfactant enhanced Cd (II) uptake .............................68
Table 6.8 Models for predicating surfactant enhanced Pb (II) uptake ..............................70
Table 7.1 Observed diffusivity and leachability index of Cd (II) and Pb (II)
due to the application of chelates .................................................................77
Table 7.2 Observed diffusivity and leachability index of Cd (II) and Pb (II)
due to the application of surfactants ..............................................................78
Table 7.3 Observed data of Cd (II) and Pb (II) leached (mg/kg) due to
to the application of chelates ............................................................................79
Table 7.4 Kinetics equations of the leaching process for
heavy metals in soil with EDDS .......................................................................80
Table 7.5 Kinetics equations of the leaching process for
heavy metals in soil with EDTA .......................................................................81
Table A.1 Effect of chelates on Cd (II) and Pb (II) leachate ..........................................99
Table A.2 Effect of chelates on rhizodegradation of the oil .............................................99
Table A.3 Influence of chelates on basal soil respiration ...............................................100
Table A.4 Effect of surfactants on root Pb (II) in plants .................................................100
Table A.5 Effect of surfactants on Cd (II) and Pb (II) leachate ......................................101

xv
Table A.6 Effect of surfactants on rhizodegradation of the oil .......................................101
Table A.7 Influence of surfactants on basal soil respiration ...........................................102

xvi
List of Symbols and Abbreviations
ANOVA Analysis of variance
ASTM American Society for Testing and Materials
BAF Bioaccumulation Factor
BSR Basal Soil Respiration
b Langmuir constant
C Final concentration of metal in the soluble form in soil
CAS Chemical Abstracts Service
CEC Cation Exchange Capacity
CMC Critical Micelle Concentration
Co Metal concentration in soil before adding additives
Ci Computed value
Cf Metal concentration in the soil applied to the fast leaching
compartment
CL Metal leached
Crf Metal concentration in the soil applied to the relatively fast leaching
compartment
Cs Metal concentration in the soil applied to the slow leaching
compartment
DM Dry Matter
Dobs Observed diffusivity
EDDHA 2-Hydroxyphenylacetic Acid
EDDS Ethylenediamine Disuccinic Acid
EDTA Ethylenediamine Tetraacetic Acid
FAAS Flame Atomic Adsorption Spectrometer
xvii
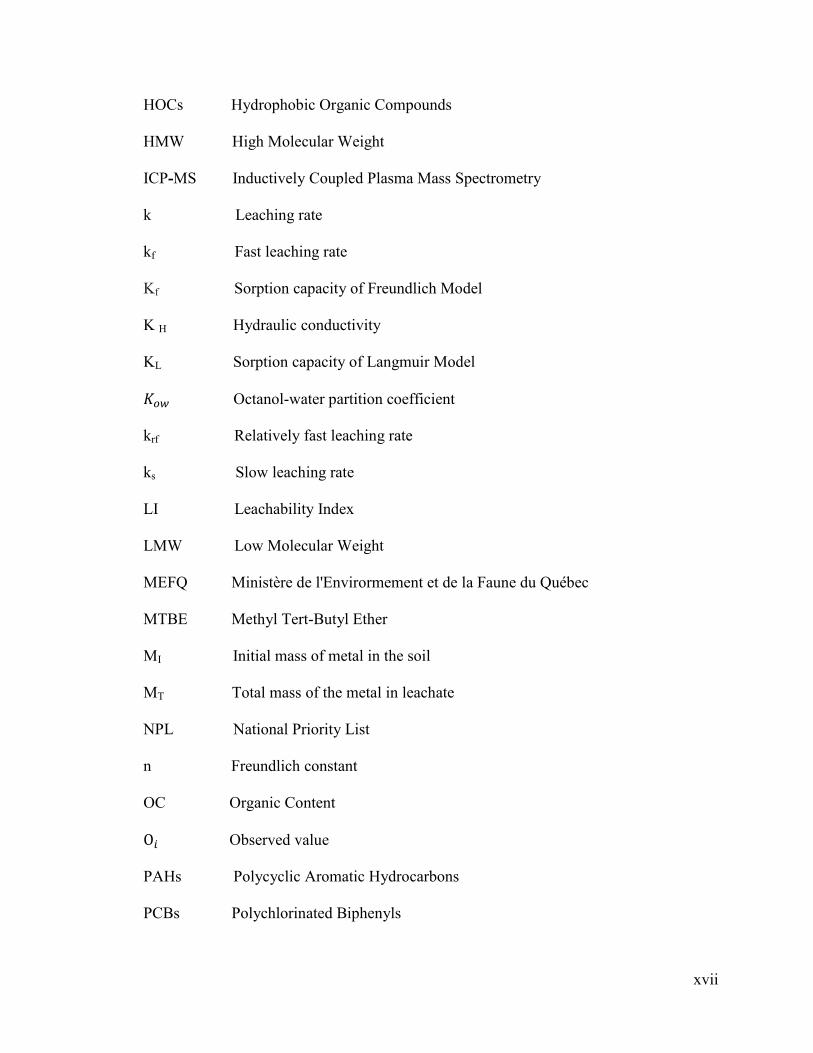
HOCs Hydrophobic Organic Compounds
HMW High Molecular Weight
ICP-MS Inductively Coupled Plasma Mass Spectrometry
k Leaching rate
kf Fast leaching rate
Kf Sorption capacity of Freundlich Model
K H Hydraulic conductivity
KL Sorption capacity of Langmuir Model
Octanol-water partition coefficient
krf Relatively fast leaching rate
ks Slow leaching rate
LI Leachability Index
LMW Low Molecular Weight
MEFQ Ministère de l'Envirormement et de la Faune du Québec
MTBE Methyl Tert-Butyl Ether
MI Initial mass of metal in the soil
MT Total mass of the metal in leachate
NPL National Priority List
n Freundlich constant
OC Organic Content
Observed value
PAHs Polycyclic Aromatic Hydrocarbons
PCBs Polychlorinated Biphenyls

xviii
q Metal concentration in the plant
TPH Total Petroleum Hydrocarbons
WB Weight of the burned soil
WD Weight of the dry Soil
WOM Weight of organic matter
U.S.EPA United States Environment Protection Agency
1
Chapter 1
Introduction
1.1 Problem Statement
Heavy metals and hydrophobic organic compounds (HOCs) such as used engine oil are
two important soil contaminants. About 9.6 % of the National Priority List (NPL) of sites
was contaminated with heavy metals alone, while as high as 67.7 % was polluted by
heavy metals and HOCs (U.S.EPA, 2003a). Roane et al. (2001) reported that
approximately 55% of all hazardous waste sites contained mixed contaminants formed by
heavy metals and HOCs. Soil, water and air contamination and exposure to heavy metals
such as arsenic, mercury, cadmium and lead are serious growing concerns throughout the
world. There are hundreds of sources of heavy metal pollution that include industries
linked to coal, natural gas, paper, and chlor-alkali compounds (Alloway, 1995). There are
more than 20 heavy metals, but four are of particular concern to health: As (II), Cd (II),
Hg (II) and Pb (II). They are four of the top six hazardous materials present in toxic waste
sites. These are highly toxic and can cause damaging effects even at very low
concentrations. Also, they tend to get transported into the food chain and hence can be
stored in tissues.
Soil contamination by Pb (II) and Cd (II) is of great concern because both of them are
toxic to humans (U.S.EPA, 1998). Lead and cadmium are used in many industrial, urban,
and agricultural applications. Pb (II) has low mobility in soil compared to Cd (II).
Polycyclic aromatic hydrocarbons (PAHs) are environmental contaminants that are found
in high concentration at sites linked to former manufactured gas plants and wood
treatment activity (Cornelia, 1992).

2
PAHs are divided into two categories: low molecular weight (LMW) and high molecular
weight (HMW). LMW PAHs are composed of fewer than four rings and HMW PAHs are
composed of at least four rings. Solubility and volatility of PAHs directly depend on the
number of rings. HMW PAHs are commonly distributed in the environment and because
of their persistence and carcinogenic potential are main pollutants in the soil water
system. HMW PAHs sorb to soils and sediments and will generally take weeks or months
to break down in the environment. Microorganisms in soils and sediments are the main
cause of this breakdown. These PAHs are carcinogenic to animals and humans. In the
United States, approximately 800 million gallons of used motor oil are recycled annually
(U.S. EPA, 2001). However, significant volumes of oil continue to be discharged
improperly into local lands.
Used engine oil is a common and toxic environmental contaminant, and successful
technologies for its remediation vary. Used engine oil is a petroleum hydrocarbon (PHC)
representing a complex mixture of individual chemical constituents. Used engine oil
contain hundreds to thousands of hydrocarbon compounds, including a substantial
fraction of nitrogen- and sulfur-containing compounds (Koma et al. 2001). The existence
of mixed contaminants (PAHs and heavy metals) in soils causes a great challenge for
remediation. Although most sites require remediation for both contaminant groups (U.S.
EPA, 2004), research has continued to focus on the remediation of either PAHs or heavy
metals from soil. Very few conventional techniques are found to address the remediation
of mixed contaminant sites (Sharma and Reddy, 2004). Effective remediation processes
for mixed contaminants is a present need. However, few techniques have been

3
investigated for remediation of these persistent contaminants in soils. In the next chapter
these factors are discussed in more detail.
1.2 Objectives of the Research
The main objective of this study was to investigate the effects of soil additives on
phytoremediation of soil polluted with mixed contaminants (heavy metals and organic
pollutants) which are at low level concentrations. The greenhouse tests were conducted in
two phases separately. In phase I, experiments were performed to assess the ability of
surfactants for the removal of contaminants by the phytoremediation system. In phase II,
similar to phase I, the tests were extended to study the ability of chelates for the removal
of contaminants by the phytoremediation system.
The research aims to realize the following goals:
1. Determine the ability of the Indian mustard (Brassica juncea) plant to remove the
mixed contaminant formed by Pb (II), Cd (II) and used engine oil present in a sandy soil
through phytoremediation.
2. Examine the effects of soil additives (surfactants and chelates) on the uptake of heavy
metals Pb (II), Cd (II) by the Indian mustard plant.
3. Investigate the effects of additives on rhizodegradation of used engine oil present in the
mixed contaminants.
4. Study the effects of additives on soil microbial basal respiration which is an indicator
of microbial activity.
5. Develop and assess the ability of a few empirical models to predict plant uptake of Cd
(II) and Pb (II) from the soil media.

4
6. Evaluate the effects of additives on the leaching of Pb (II) and Cd (II) during the
phytoremediation of soil containing mixed contaminants.
1.3 Organization of the Thesis
This thesis is composed of eight chapters.
Chapter 1 deals with the problem statement, research objectives and thesis organization.
Chapter 2 deals with literature review, including a discussion of phytoremediation
systems for contaminated soils. This chapter also deals briefly with relevant facts related
to phytoremediation systems.
Chapter 3 introduces the materials used and describes the experimental methods
employed, as well as the analytical methods applied.
Chapter 4 discusses the effectiveness of chelates in remediating the contaminated soil
through phytostabilization and phytoextraction of metals, as well as rhizodegradation of
used engine oil.
Chapter 5 focuses on the effects of different surfactants on the removal of Cd (II), Pb (II)
and used engine oil from the contaminated soil in which Indian mustard was grown.
Chapter 6 develops a few empirical models related to uptake of Cd (II) and Pb (II).
Chapter 7 assesses the leaching behavior of Cd (II) and Pb (II) in test pots.
Chapter 8 deals with conclusions and contributions.
In chapter 2, existing information related to phytoremediation are presented.
5
Chapter 2
Literature Review
2.1 Introduction
In Canada, the provinces and territories are responsible for developing site-specific clean
up approaches. In Quebec, the provincial government, through the Ministère de
l'Envirormement et de la Faune du Québec (MEFQ) has introduced guidelines for soil
rehabilitation. The MEFQ has established controls to preserve the health of humans and
protect the environment (MEFQ, 1999). Table 2.1 shows the level of generic criteria (A,
B and C) for soils given by the MEFQ. The maximum concentration for each type of land
used is indicated by these levels. The levels (A, B and C) may be defined as follows:
•Level A
At this level, the soil is slightly contaminated. There is no need to decontaminate the soil.
However, one should know the sources of contamination and verify if new sources of
contaminants exist. The soil can be used for residential purposes.
• Level B
This level defines the maximum acceptable levels for residential, recreational and
institutional sites (hospitals, schools and daycare centers), including commercial sites
located in residential districts.
• Level C
This level denotes the maximum acceptable limit for industrial sites and for commercial
sites not located in a residential area. At this level, it is necessary to take action to
decontaminate the soil.

6
Level higher than C
At this level, the soil is entirely contaminated and it will be necessary to carry out a
detailed study and restoration process, before allowing any use of the soil. This soil
cannot be used for any purpose.
Table 2.1 Criteria for soils: contamination level (mg/kg)
Element
A
B
C
Cadmium (Cd ) 1.5 5 20
Cobalt (Co) 15 50 300
Copper (Cu) 40 100 500
Manganese (Mn) 770 1000 2200
Mercury (Hg) 0.2 2 10
Molybdenum (Mo) 2 10 40
Nickel (Ni) 50 100 500
Lead (Pb) 50 500 1000
Selenium (Se) 1 3 10
Zinc (Zn) 110 500 1500
(MEFQ, 1999)
2.2 Bioremediation
Bioremediation is defined as any process that uses microorganisms, fungi, green plants or
their enzymes to return the natural environment altered by contaminants to its original
condition. Bioremediation allows natural processes to clean up harmful chemicals in the
environment. Microscopic “bugs” or microbes that live in soil and groundwater consume
certain harmful chemicals such as those found in gasoline and oil spills. Bioremediation
has been used to successfully clean many polluted sites and is being used at 50 superfund
sites across the United States of America. Superfund is related to the environmental

7
program established to address selected abandoned hazardous waste sites (U.S. EPA,
2001). Bioremediation processes can be broadly categorized into two groups: ex situ and
in situ. Ex situ bioremediation technologies contain bioreactors, biofilters, land farming
and some composting methods. In situ bioremediation technologies include bioventing,
biosparging. In situ treatments tend to be more attractive to vendors and responsible
parties because they require less equipment, generally have a lower cost and generate
fewer disturbances to the environment. However, the difficulties associated with
implementing in situ processes have limited their application in the field (U.S. EPA,
2001).
2.3 Soil remediation and phytoremediation
Soil has a critical role in sustaining human welfare and agricultural productivity as well
as environmental sustainability. Technologies to remediate contaminated soil can be
classified as follows (U.S. EPA, 1998).
I) In-situ which is always done on-site
II) Ex-situ which can be done on or off-site
In the ex-situ remediation, the contaminant soil is excavated, and this is followed by
treatment on-site or transported to a different location for treatment and disposal. The
main advantage of the in situ treatment is that it allows soil to be treated without being
excavated, transported. This results in significant cost savings (Table 2.2). In the in-situ
treatment, the site can be treated without removing soil from the ground. Containment
wells that create hydraulic barriers are shown to reduce the leakage of contaminants out
of the boundaries of a target site (Vo et al, 2008). Phytoremediation is a bioremediation
system in which use of green plants for in situ removal and degradation of contamination

8
from soil, sludge, sediments, and ground water. Growing and, in some cases, harvesting
plants on a contaminated site is a remediation method. It is effective to clean up sites with
shallow, low to moderate levels of contamination (U.S. EPA, 1998).
Table 2.2 Estimated cost savings using phytoremediation vs. conventional treatment
Contaminant &
matrix Application
Cost per acre
Conventional
treatment
Cost
(annual
running )
Projected
savings
Lead in soil
Planting,
irrigation
water
,harvesting &
disposal
$150-250k
Excavate &
landfill
$500k
50-65%
Solvents in
groundwater
Degradation
and hydraulic
control
installation &
maintenance
$100k
Pump & treat
(earlier method )
$350k
15%
TPH in soil
Degradation
$50-100k
Excavate &
landfill or
incinerate
$500k
80%
(U.S. EPA, 2003a)
These include removal of contaminants such as PCBs (Polychlorinated biphenyls) by
plants from soil and water, reduction of heavy metals like lead from brownfield sites and
the removal of uranium from water by rhizofiltration.
Phytoremediation in Etobioke (Ontario)
A pilot-scale field trial of phytoextraction of PCBs provides insight into the practical
application of phytoremediation, using pumpkin plant and sedge grass. The in situ
remediation was carried out in Etobioke (Ontario) in 2006. The soil was contaminated by
approximately 9000 tons of PCBs (<50 mg/kg).The site was cleaned and covered by an
asphalt cap. Results were expressed in terms of shoot bioaccumulation factors (BAF =
PCBs shoot / PCBs soil). BAF of 0.29 was achieved in sedge grass while pumpkin plants

9
produced shoot BAFs of only 0.15. All two plant species are viable for PCBs
phytoextraction (Melissa et al. 2007).
Phytoremediation in Careswell golf (Texas)
In 1996, the U.S. Air Force planted 662 eastern cottonwood trees to attenuate a TCE
(Trichloroethylene) plume in groundwater that was migrating beneath the Carswell Golf
(Texas). Results showed that the use of a phytoremediation system intercepted and
removed part of the TCE plume. The technology used both hydraulic influence and in-
situ biologically mediated reductive dechlorination. Hydraulic influence involves the
interception and usage of contaminated groundwater by the trees. Biologically-mediated
reductive dechlorination involved the generation of subsurface biodegradable organic
matter by the tree root systems. The observed reduction in the mass flux of TCE across
the down gradient end of the demonstration site was 11 percent (U.S. EPA, 2003a).
Phytoremediation in Trenton (New Jersey)
Successful reduction of lead contamination phytoextraction was demonstrated at a site in
Trenton (New Jersey) that had been used for the manufacture of lead acid batteries. In
1999, phytoextraction using Indian mustard (Brassica juncea) was able to reduce the
average surface lead concentration by 13 percent after six weeks of cultivation (U.S.
EPA, 2001).
Rhizofiltration in Ashtabula (Ohio)
Dushenkov et al. (1997) tested the ability of sunflower to remove uranium (U) from an
Ashtabula, Ohio, site with a U concentration of 56 mg / L. Sunflower removed more than

10
95% of the U from solution in 24 hours. Almost all of U removed from water in a
laboratory experiment was concentrated in the roots. The bioaccumulation factor (BAF)
based on the ratio of U concentration in the roots to U concentration in the water reached
30,000. Shoot U concentration was < 5mg /kg and root concentration was > 15,000 mg /
kg. The suitable pH for U removal using rhizofiltration was found to be 5.5.
2.4 Fates of pollutants during phytoremediation
Phytostabilization
Phytostabilization is the immobilization of a contaminant in soil through absorption and
accumulation by roots, adsorption onto roots, or precipitation within the root zone of
plants (Fig 2.1), and the use of plant roots to decrease contaminant migration through
leaching, and soil dispersion.
Phytostimulation
Plants can facilitate biodegradation of organic pollutants by microbes in their rhizosphere
(Fig 2.1). This is called phytostimulation or rhizodegradation (Pilon-Smits, 2005).
Phytostimulation works well for hydrophobic organics (PCBs, PAHs) that cannot be
taken up by plants.
Phytodegradation
Plants can degrade organic pollutants directly through their own enzymatic activities, a
process called phytodegradation (McCutcheon et al. 2003). Phytodegradation is used for
organics that are mobile in plants such as herbicides, TNT (Trinitrotoluene), MTBE
(Methyl tert-butyl ether) and TCE (Trichloroethylene). Phytodegradation of TCE by
poplar tree has been the most popular and efficient species so far to degrade these
pollutants.

11
Fig 2.1 Possible fates of pollutants during phytoremediation
(Pilon-Smits, 2005)
Phytoextraction
Phytoextraction, also called phytoaccumulation refers to the uptake by plant roots of
contaminants from the soil water system and translocation into plant parts, preferably
shoots of the plant. Phytoextraction is usually associated with metal contaminants. Plants
called hyper accumulators absorb large amounts of metals in comparison to other plants.
A single plant species or a combination of plant species is selected, based on the type of
metals present and/or other site conditions, and planted at the site. Plants for
phytoextraction metal removal from soil should have the following characteristics
(Garbisu, 2002).
I) Tolerance to high levels of contamination (metals and organics)
II) Ability to accumulate high levels of contaminants
III) Possess rapid growth rate
12
IV) Ability to produce high biomass though the development of profuse root system and
an accumulation of a large range of heavy metals in their above-ground parts.
Phytovolatilization
Phytovolatilization occurs as plants take up water containing organic contaminants and
release the contaminants into the air through their leaves. Plants can also break down
organic contaminants and release breakdown products into air through leaves.
Phytovolatilization generally is applied to groundwater but can also be applied to soluble
soil contaminants (U.S.EPA, 2006). Phytovolatilization has been applied to both organic
and inorganic contaminants (Table 2.3), but it must be reiterated that simply volatilizing a
contaminant may not be an acceptable alternative (U.S.EPA, 2006). It also indicates the
depth range in which each of the species is most effective.
2.5 Phytoremediation of metals
Phytoremediation of metals is a cost-effective green technology based on the use of
specially selected metal-accumulating plants to remove metals from soil and water. The
plants need not only macronutrients (N, P, K, S, Ca, and Mg), but also essential
micronutrients such as Fe, Zn, Mn, Ni, Cu, and Mo. Many metals such as Zn, Mn, Ni and
Cu are essential micronutrients. In common non accumulator plants, accumulation of
these micronutrients does not exceed their metabolic needs (<10ppm) (U.S.EPA, 2001).
Typical root depths of four plants commonly used in phytoremediation is shown in Fig
2.2. The figure illustrates the potential application of phytoremediation to generally
shallow soils (U.S.EPA, 2000).

13
Table 2.3 Phytoremediation plants
Application Media Typical contaminants Typical plants
Phytodegradation
Soil,
groundwater
landfill
leachate
Herbicides, TCE
Salix family, including
poplar, legumes
(clover,
alfalfa, cowpeas)
Phytostimulation
Soil,
sediments,
confined
disposal
facilities
Biodegradable
organics
(TPH, PAHs, PCBs
pesticides)
Grasses with fibrous
roots
(Bermuda, fescue, rye)
Phytostabilization Soil
Heavy metals,
hydrophobic organics
that are not
biodegradable
Phreatophytic trees for
hydraulic control;
grasses with fibrous
roots for erosion
control
Phytoextraction Soil and
sediments
Metals (Pb, Cd, Zn,
Ni, Cu)
Indian mustard
(Brassica juncea)&
sunflowers
(Helianthus spp.)
Phytovolatilization Soil and
sediments
Selenium, arsenic,
mercury & volatile
organic compounds
MTBE
Indian mustard & trees
for groundwater
capture
(Annette and Schnoo, 2001)
Hyper accumulator plants tolerate particularly high amounts of toxic substances, usually
a metal or metalloid in their shoots during normal growth (Reeves, 1992; Baker and
Whiting, 2002). The metal concentration that must be accumulated by the plant before it
is designated a “hyper accumulator” depends on the particular metal.

14
Fig 2.2 Typical root depths of four plants commonly used in
phytoremediation (U.S.EPA, 2000)
Brooks (1977) stated that nickel (Ni) hyper accumulators as those accumulating greater
than 1000 mg Ni kg-1
(0.1%) dry weight in their leaves. Baker and Whiting (2002)
defined threshold concentrations for other metals hyper accumulated in plants as 100 mg
kg-1
(0.01%) dry weight for Cd, 1,000 mg kg-1
(0.1%) dry weight for Ni, Cu, Co, Pb, and
10,000 mg kg-1
(1%) dry weight for Zn and Mn. Heavy metals themselves exhibit
varying affinities for soil surfaces. For example, Pb (II) and Cu (II) are strongly sorbed
to soil surfaces, while Cd (II) and Zn (II) generally have lower affinities for sorption.
There is the decreased sorption of Cd (II), Cu (II), Pb (II), and Zn (II) when these metals
are added together compared to when they are added alone to soils. Apparently due to
chemical characteristics, Pb (II) is sorbed in preference to Cd (II) or Ca (II) regardless of
the order in which it entered the soil systems (Kabata-Pendias, 2001).

15
Table 2.4 Approximate concentration of heavy metals in leaf tissue for
plants (mg/kg)
Metal Deficient Normal Toxic
Cd ---- 0.05 – 0.2 5 – 30
Cu 2-5 5 – 30 50 – 100
Ni ---- 0.1 – 5 10 – 100
Pb ---- 5 – 10 30 – 300
Zn 10 – 20 27 -100 150- 400
(Kabata-Pendias, 2001)
Kabata-Pendias (2001) quantified the concentration of heavy metals in leaf tissue for
plants (Table 2.4). The content of Cd (II) accumulated the fastest in plant tissues with
increased Cd (II) concentration in soil solution, compared to Zn (II) and Cu (II). Mobility
of metals in plant tissues and their total content in plants do not correspond to the metals
content in soil solution and their changes.
2.6 Phytoremediation of organic pollutants
Organic pollutants are usually anthropogenic. There are no transporters for these
compounds in plant membranes. Therefore organic pollutants tend to move into and
within plant tissues driven by simple diffusion, depending on their chemical properties.
Because the movement of organics into and through plants is a physical rather than a
biological process, it is fairly predictable across plant species and lends itself well to
modeling (Davis, 2003). The octanol-water partition coefficient is defined as the
ratio of the chemical concentration in the octanol phase to its concentration in the
aqueous phase. Chemicals that are quite water soluble (log < 1.0) are not sufficiently
sorbed to roots nor actively transported through plant membranes (Helmond, 1999).
Hydrophobic chemicals with log higher than 3.5 are bound strongly to the surface of
roots and soil. Hence, they cannot be translocated easily within the plant. As such,
hydrophobic chemicals with log > 3.5 are candidates for biodegradation in the root

16
zone of the plant. The success of phytoremediation of hydrocarbon-contaminated soil is
connected to plant capacity to enhance microbial activity in the rhizosphere. Plants
adapted to contamination provide favorable conditions (such as additional supply of
oxygen, nitrogen, and a carbon source through plant-root zone) for degradation by
microbes (Anderson et al. 1993; Günther et al. 1996). The intense microbial activity in
the rhizosphere has been utilized to biodegrade relatively recalcitrant compounds, such
poly-aromatic hydrocarbons. Degradation rates in the rhizosphere are often higher, and
acclimation periods are shorter in rhizosphere soil as compared to non rhizosphere soil
(Eweis et al. 1998). Based on laboratory and pot experiments, Joner et al. (2002) and
Chen et al. (2003) reported that plants enhance the dissipation of poly-aromatic
hydrocarbons (PAHs) such as used engine oil. Willow plant (Salix viminalis) has been
evaluated for the dissipation of mineral oil and PAHs in dredged sediment (Vervaeke et
al. 2003). Mineral oil concentration decreased 57% after 1.5 years in the willow-planted
treatment compared to 15% in unplanted controls. Dmitrieva et al. (2008) compared the
results of oil-sludge degradation in the root zone of alfalfa plant with rye plant. The
estimation of oil-sludge degradation in the root zone of the tested plants showed that rye
plant accelerated cleanup most effectively, degrading all of the main contaminant
fractions in the oil sludge by a total of 52%.
2.7 Phytoremediation of mixed contaminants
Only very limited studies linked to mixed contaminants (heavy metals and organic
pollutants) have been conducted in the area of phytoremediation. For instance, in earlier
study, a phytoremediation system composed of metal-tolerant plants inoculated with
hydrocarbon-degrading or plant growth promoting bacteria was suggested as a technique

17
for remediation of sites polluted by mixed contaminants such as hydrocarbons and heavy
metals (Duxbury et al. 2000; Duxbury, 2000). Roy (2005) studied phytoremediation by
willow plants grown in soil contaminated with 150 mg/kg of PAHs, 1760 mg/kg of Cu
(II) and 3560 of Zn (II) during 2 weeks. The plant was able to remove 80 % of PAHs, 10
% of Cu (II) and 12% of Zn (II). In a recent study related to phytoremediation of marine
sediments, Almeida et al. (2008) showed that PAHs can alter the Cu (II) sorption by
plants or modify the Cu (II) solubility.
2.8 Surfactants and phytoremediation
Surfactants are organic compounds that are amphiphilic, which have both hydrophobic
tail groups and hydrophilic head groups. They are soluble in organic solvents and water
(Myers, 2006). Surfactants reduce the surface tension of water by adsorbing at the liquid-
gas interface. They decrease the interfacial tension between oil and water by adsorbing at
the liquid-liquid interface. Critical micelle concentration (CMC) is defined as the
concentration of surfactant above which micelles are spontaneously formed. CMC is
different for each surfactant. The formation of surfactant micelles is affected by
temperature (Fig 2.3).
Fig 2.3 Surfactant formation (Myers, 2006)

18
The common classification of surfactant is based on the nature of the hydrophilic group.
The following is a summary of the characterization of surfactant -classification (Myers,
2006).
1) Anionic: The hydrophilic group carries a negative charge. Typically it contains one or
more of the following head groups: carboxylates, sulphates, suphonates, and phosphates.
2) Cationic: The hydrophilic has a positive charge. Cationic surfactant is used in fabric
softener and other household products. They are generally compatible with most
inorganic ions and hard water.
3) Nonionic: The hydrophilic group has no charge. It owes its water solubility to the
highly polar groups.
4) Amphoteric group has both negative positive charges on the principal chain.
The nonionic surfactants are better solubilizing agents than ionic surfactants in a dilute
solution because of lower CMC. In general, the order of solubilizing power of
hydrocarbons and polar compounds with the same hydrophobic chain length are:
nonionics>cationics>anionics. Santanu (2008) reported that surfactants retard the
degradation rate when the surfactants are toxic to the bacteria or referential utilization of
surfactants by hydrocarbon degraders as a nutrient.
Lipe et al. (1996) states that compared to cationic and nonionic surfactants, anionic
surfactants are usually chosen for soil flushing procedures because of their lower degree
of adsorption on soil particles. Also they are more easily recoverable after use.
Desorption of HOCs (Hydrophobic organic compounds) from soil using surfactants is
greatly influenced by the adsorption of surfactants on soil. Surfactants are more effective
in enhancing HOCs desorption from the contaminated soil with relatively lower clay

19
content and higher organic carbon content. The surfactants enhance the rate of
hydrocarbon biodegradation by either increasing solubilization in the aqueous phase or by
changing the cell affinity between the microbial cell and hydrocarbons by increasing cell
surface hydrophobicity. There is no general rule for the effect of surfactants on
hydrocarbon biodegradation. Almeida et al. (2008) have reported that the surfactant
Triton X-100 could enhance Cu (II) sorption by salt marsh plants. The level of Cu (II) in
the plant roots exposed to 0.25 mM added Triton X-100, in the soil was about two times
higher than those found in the absence of the surfactant.
2.9 Chelates and phytoremediation
Nowak (2002) stated that chemically enhanced phytoremediation with the addition of
some artificially produced chelates, such as EDTA and EDDHA (2-hydroxyphenylacetic
acid) have been suggested as efficient additives for the cleaning up of soils contaminated
with heavy metals. Metals such as Pb (II) are largely immobile in soil and their extraction
rate is limited by solubility and diffusion at the plant root surface. Chemically enhanced
phytoextraction can overcome these problems. Chelating agents are chemicals that form
soluble, complex molecules with certain metal ions inactivating the ions so that they
cannot normally react with other elements or ions to produce precipitates. They increase
solubility of heavy metals for plant uptake during phytoremediation. Epelde (2008)
reported that EDTA was much more efficient than EDDS for the enhancement of root Pb
(II) uptake and root-to-shoot Pb (II) translocation. Because of the toxic effects, it is
recommended that chelates be applied only after the plant has approached maturity.
Lestan et al. (2003) describe the influence of chelates which are biodegradable (EDDS)
and non-degradable (EDTA) on Pb (II) phytoextraction and leaching. They showed that

20
addition of EDDS improves soil biological and physicochemical properties. Andrade et
al. (2007) optimized the washing solution molarity and liquid to solid weight ratio
addition to use smaller amounts of highly soluble (NH4)2EDTA inputs to limit the
amount of leachate.
2.10 Soil biological indicators
The goal of any soil remediation process must not only be to remove the contaminant
from the polluted site but to restore soil quality. It is important that the soil continues to
perform according to its full potential (Hernández-Allica et al. 2006). Biological
indicators of soil quality are valuable monitoring tools (a) to assess the efficiency of a
phytoextraction process and (b) to determine additives induced toxic effects on the soil
microbial community. Biological traits are indicated by enzyme activities, microbial
biomass, respiration, mineralizable nitrogen. These indicators are increasingly used to
know the subtle changes in the soil as well as to their capacity to provide information that
integrates many environmental factors (Alkorta et al. 2003). Measurement of the soil
respiration rate is a widely used as biological activity indicator in environmental studies.
It can be performed either in situ measuring the cumulative contribution of all organisms
involved in the CO2 release. The soil respiration rate also called basal soil respiration
(BSR) gives an estimate of total microbial activity in the soil (Vanhala and Tamminen,
2005). Akerblom et al. (2007) observed a reduction in microbial activity in terms of soil
respiration in forest soils containing metals. Tween 80 is shown to be effective in the
rhizodegradation of oil under aerobic conditions and impart a positive effect on the soil
microbial population in terms of BSR (Memarian and Ramamurthy, 2012).

21
2.11 Summary
This chapter primarily focused on the several different types of phytoremediation
mechanisms with emphasis on the remediation target. However, a major drawback of
most previous studies is that only a few of the studies dealt with phytoremediation
efficiency in the sites contaminated with mixed contaminants, which are extremely
important and yet complex to understand. For sites with mixed contaminants, more than
one phytoremediation procedure may be required. No significant study has been
performed on the effects of soil additives such as surfactants or chelates on
phytoremediation of soils containing mixed contaminants. Since a majority of pervious
research has been primarily focused on the effects of chelates on phytoremediation of soil
containing metals, it is important to investigate the ability of plants to remove mixed
contaminant through enhanced phytoremediation using surfactants and chelates.
In the next section ( chapter 3), the materials used in the tests and test procedures are described.

22
Chapter 3
Materials and Methods
3.1 Introduction
To setup a phytoremediation experiment, understanding soil - plant - chemical
interactions is essential. These interactions generate mass fluxes between soil and plants
and affect both the plant morphology and the soil properties. It is important to stress the
complexity of these interactions in enhancing contaminant removal from soil. From an
environmental perspective, the soil chemical interaction is important as much as the plant
chemical interactions than effect on phytoremediation directly.
3.2 Materials
The main materials used in this study can be divided into heavy metals, used engine oil,
soil, plant, and additives (chelates and surfactants). All chemicals purchased were of
reagent grade.
3.2.1 Heavy metals
Soil contamination by Pb (II) and Cd (II) is of great concern because both these heavy
metals are toxic to humans (U.S.EPA, 1998). Lead and Cadmium are used in many
industrial, urban, and agricultural applications. Pb (II) has low mobility in soil compared
to Cd (II). In order to understand the efficiency of phytoremediation through uptake by
both high and low sorption metals, Pb (II) and Cd (II) were selected. Some metals such as
Cd, Pb have no known biological functions, while others such as Zn, Cu, Mn, and Ni are
micronutrients necessary for plant growth. PbCl2 and CdCl2 were purchased from Fisher
Scientific, Canada.

23
3.2.2 Used engine oil as an organic pollutant
Used engine oil applied in the experiments was supplied from the Petro Canada Refinery.
It is categorized under CAS (Chemical Abstracts Service ) number 8002-05-0. Used
engine oil is a common and toxic environmental contaminant, and successful
technologies for its remediation vary. Used engine oil is a petroleum hydrocarbon (PHC)
representing a complex mixture of individual chemical constituents (Table 3.1). The car-
based oils contain hundreds to thousands of hydrocarbon compounds, including a
substantial fraction of nitrogen- and sulfur-containing compounds.
Table 3.1 Chemical composition of car engine base oil
Component (%)
Saturated fraction 90.9
Normal Paraffin 15.5
Cyclic paraffin 75.4
Aromatic fraction 9.1
Naphthalene 1.7
Fluorene 1.2
Benzene 1.1
Dibenzofuran 1.0
Dinaphthenebenzene 0.8
Dibenzanthracene 0.6
Naphthobenzothiophene 0.3
Perylene 0.2
Benzothiophene 0.2
Chrysene 0.1
Unknown 1.9
(Koma et al. 2001)
The following procedure was to identify fractions of used engine oil:
1. Water content

24
The standard method D95 for determine water in Petroleum Products of the American
Society for Testing and Materials (ASTM), was used for finding the water content in used
engine oil (ASTM, 2005). The oil was heated with the solvent benzene. Condensed
solvent and water were separated in a trap, and water settled as the bottom layer. The
amount of water in the bottom layer was used for calculating the water content of the
sample.
2. Volatile hydrocarbon content
To determine the amount of volatile hydrocarbons of the oil, a sample of known oil mass
was placed in an oven at 105 °C for 24 h. The reduction in mass corresponded to the
moisture and volatile hydrocarbon content in the sample. As the water content was
measured previously, the volatile hydrocarbon content (in wt. %) was calculated as
follows:
Volatile hydrocarbon% = [(reduced mass in g)/ (mass of tested sample in g)] × 100% –
(water content in wt. %).
3. Solids content
The dried (105° C) oil sample was placed in a furnace at 550 °C for 30 min. The residue
showed the solids content of the sample as a weight fraction (%):
Solids = [(residue remaining after burning in g) / (mass of tested sample in g)] × 100%
4. Nonvolatile hydrocarbon content
The nonvolatile hydrocarbon content of the used engine oil was determined in weight
percent as follows:

25
Nonvolatile hydrocarbon = 100% – (volatile hydrocarbon in wt. % + solids in wt. % +
water content in wt. %)
Mean characteristics of used engine oil was shown in Table 3.2.
Table 3.2 Mean characteristics of used engine oil (weight fraction %)
Water
Volatile
hydrocarbon
Solid
Nonvolatile
hydrocarbon
1.4 0.3 1.2 97.1
3.2.3 Soil
The soil used in this study contained 94 % of Ottawa sand and 6% vermiculite clay by
weight. Sand was obtained from Geneq Inc., Canada and vermiculate clay was purchased
from Sigma Aldrich (Table 3.3 shows physical - chemical characteristics of sand and
clay). To 1 kg of the test soil, 50 g of peat was added and well mixed. The artificial soil
was used because controlled tests can be made with a soil that has limited number of
significant variables that affect phytoremediation. Natural soils contain a large number of
components that may interfere with the soil- chemical interactions. The soil properties
and initial concentration of contaminants are given in Table 3.4.
Table 3.3 Physical - chemical characteristics of sand and clay
a from Tarnawski et al.2009
b from Lee et al.2001
c,d from Maqueda,2001
Mineral
components
Cation exchange
capacity
( CEC)
(meq/100 g )
Particle size
( mm)
pH in water
Specific
surface area
( g)
Sand 0 0.33 a 7.6 0.007
b
Vermiculite clay 64c < 1 6.8 22-38
d

26
Table 3.4 Physical - chemical characteristics of the soil
Properties Contents
Particle distribution
Vermiculate clay (%)
6
Sand (%) 94
CEC (meq/100 g ) 22.6
Organic contents (g/kg) 50
Hydraulic conductivity (cm/s )
pH
2.7 × 10- 4
6.6
Metals concentration
Pb (mg/kg) 496.5
Cd (mg/kg) 49.7
Used engine oil (mg/kg) 495.1
Soil pH was measured using a soil to water ratio of 1:10.In this procedure about 20 g of
soil was placed in a 400 ml beaker and 200 ml of distilled water was added. The solution
was placed on an orbital shaker for 30 min and left for one hour to ensure equilibrium
was reached prior to measurements.
3.2.4 Soil spiking procedures
To begin with, 1 kg of soil was prepared by thoroughly mixing sand (94%), vermiculate
(6%). To this mixture, peat was added and well mixed as described in the last section.
300 mL of distilled water were added to 1 kg of soil mixture. This was contaminated with
finely powdered PbCl2 (500 mg) and CdCl2 (50 mg). The concentrations of Cd (II) and Pb
(II) were selected using the data of MEFQ contamination level as a guide (Table 2.1).
The spiked soil was dried (24°- 35°c) and allowed to age for 1 month in the greenhouse.
500 mg of used engine oil which was dissolved in 200 ml hexane was added to 1 kg of
dried soil and mixing thoroughly in large beaker. This procedure was repeated to form the
soil containing the mixed contaminants.

27
3.2.5 Homogeneity test
In the test for homogeneity of contaminant distribution in the soil, a statistical study was
performed using the analysis of variance (ANOVA) described by Berthouex (2002). It
showed that the deviation of the contaminants in the soil was generally limited to 3% in
the soil contained in the test pots. It showed that the soil was homogenous with 49.7 mg
kg -1
of Cd (II), 496.5 mg kg-1
of Pb (II) and 495.1 mg kg -1
of used engine oil.
3.2.6 Plant
The ideal plant species to remediate a contaminated site should provide a high yielding
crop that can both tolerate and accumulate the target contaminants. Indian mustard plant
was well-known as specie that can take up and accumulate metals in its root
(phytostabilization) and its shoot (phytoextraction) [Blaylock et al. 1997. Di Gregorio et
al. 2006; Haag-Kerwer et al. 1999; Hamlin and Barker, 2006. Kumar et al. 1995]. Also,
this plant has been shown to facilitate the degradation of organic pollutants in its
rhizosphere zone (Roy, 2005). The certificated seeds of Indian mustard were obtained
from S&S Seeds, Inc (California).
3.2.7 Additives
3.2.7.1 Surfactants
Successful implementation of surfactant-enhanced remediation requires careful
consideration of surfactant properties. For surfactant-enhanced phytoremediation, anionic
and cationic surfactants are not useful because of their phytotoxicity (Rosen, 1989; Lee et
al. 2001). As mentioned above, non-ionic surfactants Tween 80 and Triton X-100 were
selected for the present study. All additives were supplied by Fisher Scientific. The HLB

28
(hydrophilic-lipophilic balance) and CMC (critical micelle concentration) of two
nonionic surfactants used in this study are summarized in Table 3.5. HLB is a value
defining the affinity of a surfactant for water or oil.
Table 3.5 Characteristics of Tween 80 and Triton X-100
(Soon and Min, 2006)
3.2.7.2 Chelates
Application of Ethylenediamine tetra acetic acid (EDTA) to Pb (II) contaminated soils
has been shown to increase the uptake of Pb (II) by plants (Huang and Cunningham,
1996; Blaylock et al. 1997; Huang et al. 1997). Also, Ethylenediamine disuccinic acid
(EDDS) is effective in enhancing the phytoremediation of soils contaminated with Pb
(II), Zn (II), Cu (II) and Cd (II) (Tandy et al. 2006; Letsan, 2003).
3.3 Experiment methods
The experiments were carried out in the greenhouse facility (Hall building) of Concordia
University. Essential nutrients are needed for plant growth (Epestein, 1972). To meet this
requirement, for 1 kg of the soil, basal fertilizer (KH2PO4) was applied to provide 80 mg
of P and 100 mg of K. Further, ammonium nitrate (NH4NO3) was added to the soil (1 kg)
to provide 150 mg of N. 2 kg of the soil was placed in plastic pots and Indian mustard
seeds were directly planted in the pots. After seedling emerged, the pots were thinned to
one plant per test pot and grown in a greenhouse under natural light and temperature
Trade name Chemical Molecular weight
(g/mol) HLB
CMC
(mg/L)
Tween 80 Polyoxyethylene (20)
sorbitan monooleate 1309 15.0 35
Triton X-100 Polyoxyethylene (10)
isooctylphenyl ether 646 13.5 136

29
conditions (average day, 32OC; night, 21OC) for 50 days. After the initial 30 days (Fig
3.1), when the plants were mature (Safwan et al. 2008), Tween 80 and Triton X-100 at
different concentrations (0.5, 1 and 2 CMC) and [S,S] EDDS and Na2EDTA at three level
concentrations (0.5, 1 and 2 mmol/kg) were individually applied to the test pots.
Irrigation water was provided at 3-day intervals using distilled water. The total leachates,
after each irrigation event, were collected from each test pot during the tests and were
analyzed for Cd (II) and Pb (II).
Two control tests were conducted in this study. For control 1, the removal of used engine
oil from the soil system subject to natural attenuation was studied in the absence of
additives and plants. For control 2, soil with plants but without additives was used to
know the effects of roots on the removal of used engine oil from the system. The soil
solution pH values were not adjusted. They varied from 6.5 to 6.7, following the
application of additives at various concentrations. It was also noted that the addition of
additives did not change the soil pH. The plants were harvested 20 days after the
application of additives. Each treatment included three replications. The Student’s t-test
was used to compare two treatment means at the 0.05 significance level. Fig 3.2 shows
the visual symptom (light patches) toxicity in the plant leaves treated with Triton X- 100.

30
Fig 3.1 Treatments after 30 days of growing the plants
Fig 3.2 The visuals symptoms (light patches) due to Triton X- 100 toxicity

31
3.4 Samples analysis
3.4.1 Soil organic matter determination
This test was performed to determine the organic content (OC) of the soil (sand and
vermiculate clay) according to ASTM D 2974 (ASTM, 2006).
1. Weigh out the empty, clean, and dry porcelain dish (W1).
2. Place 40 g of the oven-dried soil in the porcelain dish and Weigh out the dish and soil
(W2).
3. Place the dish in a furnace. Gradually increase the temperature in the furnace to 440oC
and leave the soil in the furnace for 24hrs.
4. Remove the porcelain dish using the tongs and allow it to cool to room temperature.
Determine and record the mass of the burned soil (W3).
The weight of the dry soil WD = W2 –W1
The weight of the burned soil WB= W3–W1
The weight of organic matter WO = WD – WB
Percent of the organic contents (Eq. 2.1)
OC = WO / WD × 100 (2.1)
3.4.2 Soil cation-exchange capacity (CEC)
This test was performed to measure the cation-exchange capacity (CEC) of the soil
according to U.S. EPA method 9081.
1. Weigh out 4 g of the soil transfer the sample to a 50-mL centrifuge tube
2. Add 33 mL of 1.0 N NaOAc (Sodium acetate) solution, shake it in the shaker for 5
min, and centrifuge it until the supernatant liquid is clear.

32
3. Repeat the procedure described in paragraph 2 three more times.
4. Add 33 mL of 99% C3H8O (Isopropyl alcohol) than shake it in the shaker for 5 min,
and centrifuge it until the supernatant liquid is clear.
5. Repeat the procedure described in paragraph 4 two more times.
6. Add 33 mL of NH4OAc (Ammonium acetate) solution, shake it in a mechanical shaker
for 5 min, and centrifuge it until the supernatant liquid is clear. Transfer the washing into
the 100-mL volumetric flask.
7. Repeat the procedure described in paragraph 6 two more times.
8. Dilute the combined washing to the 100-mL with ammonium acetate solution and
determine the sodium concentration by flame atomic adsorption spectrometer (FAAS).
3.4.3 Soil hydraulic conductivity
Hydraulic conductivity (KH) defines the rate of movement of water through a soil. It is
the constant of proportionality in Darcy’s Law (Eq.2.2) and as such is defined as the flow
volume per unit cross-sectional area of porous medium under the influence of a unit
hydraulic gradient. It is measured by Darcy’s law.
Q = - KH A dh/dL (2.2)
Q = flow (cm3/s)
KH = hydraulic conductivity (cm/s)
A = cross-sectional area (cm2)
dh/dL = hydraulic gradient

33
3.4.4 Heavy metal concentration in samples
1. The concentrations of Cd (II) and Pb (II) in the soil and leachate samples were
determined by aqua regia digestion followed by analysis using FAAS and inductively
coupled plasma mass spectrometry (ICP-MS). The analyzer could detect metal
concentration to the nearest 0.1 mg/kg. At the end of the experiment, plants were
harvested by removing them from the soil. The plants were washed with deionized water
to remove the soil particles. To determine the amount of Pb (II) and Cd (II) in plant
tissues, the roots and shoots were further separated and dried in an oven at 70°C for 48 h
(McQuaker et al. 1979). Following this, the plant material was dissolved in 20 mL of 1 M
HCl and diluted to 50 mL with deionized water. The concentrations of Pb (II) and Cd (II)
in the extracts were determined by FAAS.
2. The concentrations of water-soluble Cd (II) and Pb (II) in the soil were determined by
equilibrating 5 g of soil with 25 mL of 0.01 M KNO3 for 2 h (Blaylock et al. 1997). The
suspensions were centrifuged, and the supernatant solution was analyzed for soluble Cd
(II) and Pb (II) by FAAS and ICP-MS.
3.4.5 Used engine oil content in the soil
The oil content in the soil of the test pots was determined by solvent extraction using n-
hexane (Duffield et al. 2003). For 5 g of soil sample, 10 mL of n-hexane was added and
shaken for 30 min. The extracted oil in n-hexane was collected in a standard volumetric
flask. To this, n-hexane was added to bring the solution volume to 50 mL. Following this,
the flask contents were transfer to a vial with little headspace. The vial was centrifuged
for 30 min at a speed of 3,000 rev/min. The concentration of used engine oil in the
supernatant was determined using an ultraviolet (UV) spectrophotometer.

34
3.4.6 Basal soil respiration (BSR)
Basal soil respiration (BSR) as an indicator of microbiological activity was determined
according to ISO 16072 (2002). For analysis of BSR, soils were sieved to < 2 mm and
stored fresh at 4º C until analysis.
1. 40 g of soil samples was placed in airtight jars and moistened to 60% WHC (water
holding capacity).
Calculate the WHC (Eq.2.3) using the following equation:
WHC = [(Ws - W t) / (Wt - Wb)] × 100 (2.3)
Ws = Weight of beaker containing water saturated soil (g)
Wt = Weight of beaker containing oven-dried soil (g)
Wb = Weight of beaker (g)
2. The soil was incubated for 2 days at laboratory temperature (25° to 28°C). The vial
containing 5 mL of 1M NaOH was placed on the soil sample to absorb the CO2 evolved
during the incubation period.
3. The CO2 was calculated by using the data related to titration of the unused NaOH (not
reacted with CO2) with 0.1 M HCl. BSR is measured by below equation (Eq. 2.4):
BSR = MWC × (B - V) × [M] × 1000 / (DW × T × 2) (2.4)
Here, BSR is the basal soil respiration (μg C g
−1 soil h
−1), MWC is the molecular weight
of C (12.01 g), B is the volume of HCl for blank titration, V is the volume of HCl for
sample titration, M is the concentration of HCl (0.1 M), DW is the dry weight of the soil

35
(40 g), T is the incubation time (48 h) and 2 is the factor that accounts for two OH are
consumed by one CO2.
In the next section (chapter 4), the effect of chelates (EDTA and EDDS ) on phytoremediation of
the soil polluted by mixed contaminates ( heavy metals and engine oil ) are described.

36
Chapter 4
The effect of chelates on phytoremediation
4.1 Introduction
In phytoremediation practice, several conditions must be met for successful
phytoremediation. The bioavailability of the contaminant in the soil is a main factor for
plant uptake. Usually, little Pb (II) is taken up by plants principally due to its high
sorption on the soil particles. The key to chelate-induced phytoremediation is to maintain
an increased bioavailability of the target metal long enough for plants to take it up
(Thayalakumaran et al. 2003). Previous research on the role of chelates such as EDDS
and EDTA on remediation had targeted heavy metals, with very little attention to mixed
contaminants. The aim of this part of the study focuses on the effect of the different low
concentrations of EDDS (Ethylenediaminedisuccinic acid) and EDTA
(Ethylenediaminetetraacetic acid) on the remediation of Cd (II) and Pb (II) and used
engine oil from the soil cultivated with Indian mustard plant.
4.2 Effect of chelates on plant growth
Both root and shoot DMs were lower for the treatment with chelates than for the control
tests (Table 4.1). The chelate effect was more pronounced on the shoot. The plant DM
decreased with increasing chelate concentration rates for both chelates. The application of
2 mmol/kg EDTA and EDDS considerably depressed the growth of plants and decreased
the plant DM. The maximum reduction in shoot DM observed was 8.3 g/plant for the
plant for which 2 mmol/kg EDDS was applied to the soil. The corresponding value for
EDTA was 8.4 g/plant. No significant difference was observed between influences of
EDTA and EDDS on the DM of the plant. Vassil et al. (1998) stated that exposure of

37
Indian mustard to high concentrations of Pb (II) and EDTA caused a reduction in both the
transpiration rate and the shoot water content and finally a reduction in plant DM.
Table 4.1 The influence of EDDS and EDTA on DM yield (g/plant)
Additive Root Shoot
Control (C 2 ) 5.1 ± 1.2 17.8 ± 2.8
EDDS
(mmol/kg)
0.5 3.4 ± 1.6 9.6 ± 2.5
1 3.4 ± 1.3 8.8 ± 2.2
2 3.1 ± 1.5 8.3 ± 1.3
EDTA
(mmol/kg)
0.5 3.6 ± 1.7 10.5 ± 2.5
1 3.5 ± 1.2 9.2 ± 4.2
2 3.3 ± 0.5 8.4 ± 2.7
4.3 Effect of chelates on phytoremediation of Cd (II)
An analysis of plant tissues for metals demonstrated that Cd (II) uptake was considerably
enhanced by both EDDS and EDTA (Table 4.2). Shoot Cd (II) concentration in the
control was 189 mg kg -1
. This increased to 363.5 and 400.6 mg kg -1
for treatments with
2mmol/kg of EDDS and EDTA respectively. Also, the application of chelates particularly
enhanced root Cd (II) concentration from 173.2 mg kg -1
in control to 352.4 and 392.7 mg
kg -1
for treatments with 2mmol/kg of EDDS and EDTA respectively. The difference in
enhanced uptake of Cd (II) by EDDS and EDTA can be traced to their respective

38
formation constants (log K) of the metal-chelate complex. The greater log K indicates
greater rate of metal chelate formation. Compared to Cd-EDDS (log K = 12.7), Cd-
EDTA (log K = 16.5) would be preferentially formed (Tandy et al. 2006). Even at the
small concentration of chelate (0.5 mmol/kg), a significant increase in Cd (II) uptake was
noted (Table 4.2).
Table 4.2 Effect of EDDS and EDTA on Cd (II) uptake (mg/kg)
Additive Root Shoot
Control (C 2) 173.2 ± 11.2 189.1 ± 12.4
EDDS
(mmol/kg)
0.5 294.1 ± 4.2 312.5 ± 14.7
1 335.3 ± 31.2 354.4 ± 36.5
2 352.4 ± 24.6 363 ± 22.8
EDTA
(mmol/kg)
0.5 322.2 ± 11.8 330.1 ± 41.6
1 357.1 ± 43.8 376.5 ± 11.8
2 392.7 ± 11.8 400.6 ± 11.8
4.4 Effect of chelates on phytoremediation of Pb (II)
Pb (II) concentration in the plant (root and shoot) was higher than Cd (II) concentration in
the plant (Table 4.2 and 4.3). The differences between plant uptake of Pb (II) and Cd (II)
are linked to their initial concentrations in the soil and also to their phytotoxicity. John et
al. (2009) reported that Cd (II) had a higher impact than Pb (II) in hampering Indian
mustard growth. Also, Grčman et al. (2001) studied the effect of EDTA on the

39
accumulation of Pb (II), Cd (II) and Zn (II) in the Brassica rapa plant. Compared to Cd
(II) and Zn (II), they found that the accumulation of Pb (II) in the plant was much more.
EDTA was more effective for the uptake of Pb (II) than EDDS. As stated earlier, the
difference in the uptake of Pb (II) by chelates can be attributed to their formation
constants (log K) of the Pb-chelate complexes. Pb-EDTA with log K= 18.0 is a stronger
complex compared to Pb-EDDS for which log K= 12.8 (Martell et al. 2004). Treatments
with 2 mmol/kg of EDDS and 2 mmol/kg of EDTA augmented the shoot Pb (II)
concentrations respectively to 14.96 and 15.73 (103mg/kg). Also, the Pb (II)
concentration in roots increased from 5.72 in control to 16.3 and 18.16 (103mg/kg)
respectively for treatments with 2 mmol/kg of EDDS and EDTA.
Table 4.3 Effect of EDDS and EDTA on Pb (II) uptake (103mg/kg)
Additive Root Shoot
Control (C2) 5.72 ± 1.2 5.41 ± 2.2
EDDS
(mmol/kg)
0.5 11.73 ± 3.6 10.25 ± 3.6
1 15.00 ± 2.8 13.74 ± 2.2
2 16.3 ± 2.4 14.96 ± 3.7
EDTA
(mmol/kg)
0.5 15.70 ± 4.4 14.10 ± 5.2
1 17.50 ± 4.2 15.33 ± 2.8
2 18.16 ± 3.5 15.73 ± 7.3

40
4.5 Effect of chelates on Cd (II) and Pb (II) leaching
In control tests without chelate application, the concentration of Cd (II) in the leachates
was 0.7 mg kg-1
. This is about 1.4 % of the initial Cd (II) concentration in the soil .The
concentration of Cd (II) in leachates increased with increasing concentration of chelates
(Fig 4.1). At the same concentration, EDDS mobilized a smaller proportion of Cd (II).
The difference in leaching of Cd (II) by EDDS and EDTA can be attributed to their
formation constants of the Cd-chelating agents and their biodegradability. Low
biodegradability of EDTA and high solubility of EDTA- metal complexes in soil water
system result in a risk of environmental impact due to metal mobilization and long
persistence (Alkorta et al. 2004). In this study, the rate of chelate degradation in the soil
was not determined. EDTA has been reported to degrade very slowly in the soil. Five
months after EDTA application, EDTA– metal complexes were still present in the soil
pore water (Lombi et al. 2001).
Fig 4.1 Effect of chelates on Cd (II) leachate
0
2
4
6
0.5 1 2 0.5 1 2
C 2 EDDS (mmol/kg) EDTA(mmol/kg)
Cd
(II
) le
ac
he
d (
mg
/kg
)
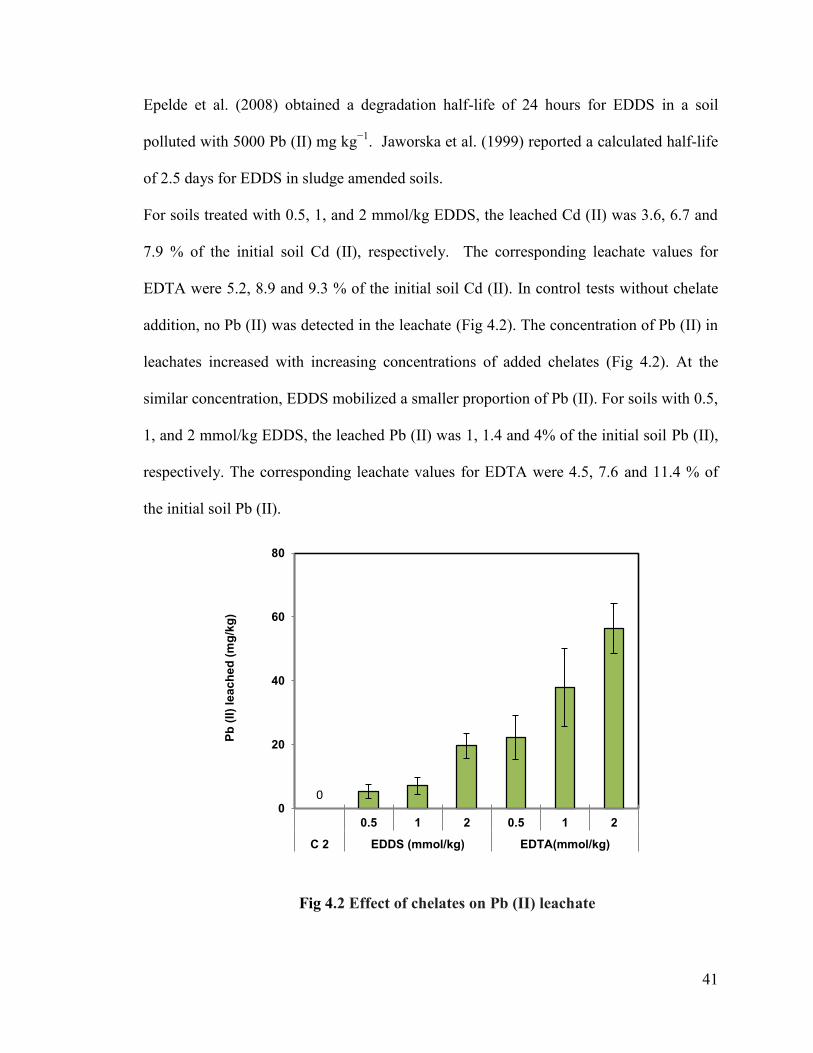
41
Epelde et al. (2008) obtained a degradation half-life of 24 hours for EDDS in a soil
polluted with 5000 Pb (II) mg kg−1
. Jaworska et al. (1999) reported a calculated half-life
of 2.5 days for EDDS in sludge amended soils.
For soils treated with 0.5, 1, and 2 mmol/kg EDDS, the leached Cd (II) was 3.6, 6.7 and
7.9 % of the initial soil Cd (II), respectively. The corresponding leachate values for
EDTA were 5.2, 8.9 and 9.3 % of the initial soil Cd (II). In control tests without chelate
addition, no Pb (II) was detected in the leachate (Fig 4.2). The concentration of Pb (II) in
leachates increased with increasing concentrations of added chelates (Fig 4.2). At the
similar concentration, EDDS mobilized a smaller proportion of Pb (II). For soils with 0.5,
1, and 2 mmol/kg EDDS, the leached Pb (II) was 1, 1.4 and 4% of the initial soil Pb (II),
respectively. The corresponding leachate values for EDTA were 4.5, 7.6 and 11.4 % of
the initial soil Pb (II).
Fig 4.2 Effect of chelates on Pb (II) leachate
0 0
20
40
60
80
0.5 1 2 0.5 1 2
C 2 EDDS (mmol/kg) EDTA(mmol/kg)
Pb
(II
) le
ac
he
d (
mg
/kg
)

42
Also, the difference in leaching of Pb (II) by EDDS and EDTA can be attributed to the
formation constants of the chelates and their biodegradability. The amount of leachates
was determined from each leaching event. The mass of leachates was 1992 ± 46 g.
4.6 Cd (II) and Pb (II) mass balance for chelates application
For all chelates additive, the mass balance approach yielded the amount of the final
values of Cd (II) and Pb (II) concentrations in the soil. For this, the amount of Pb (II) and
Cd (II) accumulated in shoots (phytoextraction) and roots (phytostabilization) of the
mustard plant and the quantity of Cd (II) and Pb (II) present in leachates were deducted
from their initial concentrations in the soil. With the application of chelates, no
significant change in the phytoremediation of Cd (II) was noted. However, using chelates
led to increased phytoextraction of Pb (II).

43
Table 4.4 Cd (II) and Pb (II) mass balance for chelates application
Compared to EDTA, EDDS was less effective on phytoremediation of Pb (II), but EDDS
caused a decrease in leaching of Pb (II) (Table 4.4). With the application of 2 mmol/kg
Ad
dit
ive
Hea
vy
met
al
Initial
Value
(mg)
Final value (mg)
Rec
ov
ery
(%
)
I
nit
ial
soil
hea
vy
met
al
Hea
vy
met
al
rem
ainin
g in
so
il
Ph
yto
extr
acti
on
Ph
yto
stab
iliz
atio
n
Ph
yto
rem
edia
tio
n
Lea
chat
e
To
tal
No chelate
(C 2)
Pb(II) 993 860.0 96.3 29.2 125.5 0 985.5 99
Cd(II) 99.4 91.9 3.4 0.9 4.3 1.4 97.6 98
EDDS
(0.5mmol/kg)
Pb(II) 993 839.7 98.4 39.9 138.3 10.4 988.4 99
Cd(II) 99.4 91.3 3 1 4 3.6 98.9 99
EDDS
(1mmol/kg)
Pb(II) 993 799.2 120.1 51 171.1 14.2 984.5 99
Cd(II) 99.4 85.6 3.1 1.14 4.24 6.6 96.4 97
EDDS
(2mmol/kg)
Pb(II) 993 761.8 124.2 50.5 174.7 39.4 975.9 98
Cd(II) 99.4 82.4 3 1.1 4.1 7.8 94.3 95
EDTA
(0.5mmol/kg)
Pb(II) 993 725.5 148 56.5 204.5 44.4 974.4 98
Cd(II) 99.4 84.5 3.46 1.16 5.62 5.2 95.3 96
EDTA
(1mmol/kg)
Pb(II) 993 679.4 141 61.2 202.2 75.8 957.4 96
Cd(II) 99.4 84.8 3.45 1.25 4.7 8.6 98.1 99
EDTA
(2mmol/kg)
Pb(II) 993 670.3 132 60 192 113 975.3 98
Cd(II) 99.4 83.2 3.4 1.3 4.7 9.2 97.1 98

44
EDTA, the maximum phytoextraction (132 mg) of Pb (II) occurred. On the other hand,
this additive resulted in a larger amount (113 mg) of Pb (II) in the leachate. For treatment
with 2 mmol/kg EDTA, phytostabilization of Pb (II) was 60 mg.
4.7 Effect of chelates on rhizodegradation of used engine oil
The effect of the presence of EDDS and EDTA on the rhizodegradation of the oil is
shown in Fig 4.3. Following the test period of 50 days, 38.3% of the oil in soil was
removed by control (with plant and without chelates). The addition of 0.5 mmol /kg of
EDTA increased the oil removal from 38.3 % to 47 % and the highest oil removal
efficiency of 70 % could be achieved by EDTA at 2 mmol/kg while the corresponding
value for EDDS was 54.2 %.
Fig 4.3 Effect of chelates on rhizodegradation of the oil
The results showed that EDTA was more effective than EDDS in increasing the
rhizodegradation of the oil. The increase of rhizodegradation of the oil in soil by EDDS
0
100
200
300
400
0.5 1 2 0.5 1 2
C 2 EDTA (mmol/kg) EDDS (mmol/kg)
Res
idu
al o
il i
n s
oil
(m
g /
kg
)

45
and EDTA can be attributed to their ability to remove Cd (II) and Pb (II) from the soil
water system. The reduction of Cd (II) and Pb (II) in the soil decreases the toxicity of the
metals to the microorganisms during rhizodegradation of the oil. Sandrin and Maier
(2003) reported that chelating agents can be applied to reduce metal toxicity to
microorganisms that degrade organics. In addition, EDTA amendments could also have a
positive impact on some microbial populations of the Indian mustard rhizosphere (Roy,
2005).
4.8 Effect of chelates on basal soil respiration (BSR)
The addition of EDTA and EDDS at the similar concentrations exposed major differences
in basal soil respiration. Regarding the initial and final values of basal soil respiration
(BSR), EDDS treatments had no significant negative effect on microbe population. The
application of EDTA in different concentrations caused a sharp decrease in BSR,
indicating that EDTA was much more toxic to the microbes. The highest value of BSR
(1.54 g C g -1
DW soil h -1
) was found for treatment with 0.5 mmol/kg of EDDS. The
addition of EDDS resulted in a slight decrease in BSR. However, an increase in EDTA
concentration resulted in a severely reduced activity of microbes in terms of BSR. The
maximum decrease of BSR, (0.39 g C g -1
DW soil h -1
) was observed at 2 mmol/kg of
EDTA (Fig 4.4).

46
Fig 4.4 Influence of chelates on basal soil respiration
4.9 Summary
The application of EDTA to the soil had a higher effect on increasing phytoextraction of
Cd (II) and Pb (II) than for the application of EDDS to the soil. This may be due to the
difference in the corresponding formation constants (log K) of EDTA and EDDS. EDDS
treatment resulted in a lower amount of Pb (II) in the leachate. The chelate effect on the
Pb (II) uptake was noticeably more than that on Cd (II) uptake. Further, the
rhizodegradation of the oil was increased with the increase of chelate concentration. It
seems that the rhizodegradation of oil was affected by the presence of heavy metals [Cd
(II) and Pb (II)]. The results suggested that enhanced phytoextraction of Cd (II) and Pb
(II) by chelates promote the rhizodegradation of the oil. Compared to EDTA, the addition
of EDDS caused a slight decrease in BSR. Also, an increase in EDTA concentration
resulted in a significant drop in BSR. The effect of surfactants (Triton X-100 and Tween
80) on phytoremediation is presented in the chapter 5.
0
1
2
3
0.5 1 2 0.5 1 2
Initial C 2 EDTA (mmol/kg) EDDS (mmol/kg)
value Final value
Ba
sa
l re
sp
ira
tio
n (
m g
C -
1 g
DW
so
il h
-1
)

47
Chapter 5
The effect of surfactants on phytoremediation
5.1 Introduction
In phytoremediation processes, the mobility and bioavailability of the contaminant in the
soil, particularly at the rhizosphere zone where root uptake is a critical factor affecting the
success of phytoremediation. Developing new methods to enhance phytoremediation, the
bioavailability of contaminants in the rhizosphere could significantly improve the
efficiency of remediation techniques. Surfactants are used to enhance biodegradation and
desorption of organic contaminants from the soil-water system (Wu et al. 2004). Besides
many earlier studies, a few recent studies have also reported that surfactants can improve
desorption of metals from soils (Almeida et al. 2009; Ramamurthy et al. 2008). The aim
of this part of the study was to focus on the effect of different nonionic surfactants
applied individually to remove Cd (II), Pb (II) and used engine oil from a soil containing
a mixed contaminant by phytoremediation using Indian mustard. This technique has been
adapted in this study as an engineering approach to solubilize contaminants from the soil
and increase their diffusion into the rhizosphere zone (Ramamurthy and Memarian,
2011).
5.2 Effect of surfactants on plant growth
The effects of surfactants on dry matter (DM) yield of plant shoots and roots are shown in
Table 5.1. Both root and shoot DM yields were lower for the treatment with Triton X-
100 than for Tween 80 treatment. One notes that this effect was more pronounced on the
shoots at the high surfactant concentrations. The results showed that the application of

48
2CMC Triton X- 100 severely depressed the growth of mustard plant and decreased the
plant DM yield, especially the shoot DM yield.
Table 5.1 The influence of Triton X-100 and Tween 80 on DM yield (g/plant)
Additive Root Shoot
Control (C 2) 5.1 ± 1.2 17.8 ± 2.8
Triton X-100
(CMC)
0.5 4.9 ± 1.4 17.4 ± 2.1
1 4.2 ± 1.5 15.7 ± 2.2
2 2.8 ± 1.5 6.8 ± 1.3
Tween 80
(CMC)
0.5 5.1 ± 1.2 17.8 ± 2.2
1 4.9 ± 1.2 17.4 ± 3.8
2 4.7 ± 2.1 17.2 ± 2.7
5.3 Effect of surfactants on phytoremediation of Cd (II)
Table 5.2 shows Cd (II) concentrations in shoots and roots of mustard plants in the test
soil that contained surfactants (0.5 to 2 CMC). Increased concentration of surfactants
appears to increase the uptake of Cd (II) at higher concentrations. Since for both the
surfactants, Cd (II) uptake is not significantly different at 1 and 2 CMCs, the use of 1
CMC for the surfactant additive of the soil is preferred. Uptake of Cd (II) was
significantly enhanced at 1 and 2 CMCs. This demonstrates that micelle formation is
probably responsible for the solubilization of Cd (II) and rendering it to be bioavailable to
the roots in the rhizosphere zone. Further, the application of surfactants significantly

49
increased Cd (II) concentration in the shoots for the control (no plant case) from 189.1
mg kg -1
to 327.3 and 269.4 mg kg -1
for 2 CMC Triton X-100 and 2 CMC Tween 80
respectively. At 2 CMC, the removal of Cd (II) by Triton X-100 is much more than that
due to Tween 80. This difference may be due to the larger solution concentration (136
mg/L) of Triton X-100 compared to the solution concentration (35 mg/L) of Tween 80
(Soon et al. 2006).
Table 5.2 Effect of Triton X-100 and Tween 80 on Cd (II) uptake (mg/kg)
Additive Root Shoot
Control (C 2) 173.2 ± 11.2 189.1 ± 12.4
Triton X-100
(CMC)
0.5 173.8 ± 15.4 189.7 ± 21.5
1 265.4 ± 19.5 309.8 ± 26.2
2 289.6 ± 24.5 327.3 ± 14.7
Tween 80
(CMC)
0.5 173.6 ± 10.4 189.4 ± 32.8
1 221.7 ± 31.4 255.1 ± 2.2
2 241.5 ± 11.6 269.4 ± 10.3
5.4 Effect of surfactants on phytoremediation of Pb (II)
In the control tests related to phytoextraction, the uptake of Pb (II) in the shoots was 5.41
(103mg/kg). No significant change in the shoots uptake of Pb (II) was observed with the
surfactant application. However, the root uptake of Pb (II) was enhanced through the
addition of the surfactant to the soil (Fig 5.1). Triton X-100 was more effective than

50
Tween 80 in enhancing uptake of Pb (II) from the soil and makes it more bioavailable for
accumulation in the roots.
Fig 5.1 Effect of surfactants on root Pb (II) in plants
5.5 Effect of surfactants on Cd (II) and Pb (II) leaching
After watering the plants, the leachates were collected and analyzed for Cd (II) and Pb
(II) concentration. In control tests without surfactant, the concentration of Cd (II) in the
leachates was 0.7 mg kg-1
. This is less than 2.0 % of the initial Cd (II) concentration in
the soil. The concentration of Cd (II) in lactates increased with increasing concentrations
of surfactant (Fig 5.2). At the same surfactant concentration, compared to Triton X-100,
Tween 80 mobilized a smaller proportion of Cd (II). For soils with the application of 0.5,
1, and 2 CMC Tween 80, the leached Cd (II) was 1.4, 1.8, and 2.2% of the initial soil Cd
(II), respectively. The corresponding leachate values for Triton X-100 were 1.6, 2.4, and
5.1 % of the initial soil Cd (II).
0
5
10
15
20
0.5 1 2 0.5 1 2
C 2 Triton X-100(CMC) Tween 80(CMC)
Pb
(II)
co
nc
en
tra
tio
n (
10
3m
g / k
g)

51
Fig 5.2 Effect of surfactants on Cd (II) leachate
In control test pots, without surfactant addition to the soil, no Pb (II) was detected in the
leachate (Fig 5.3). Also, in the leachates from the test pots with both surfactants, at 0.5
CMC no detectable amount of Pb (II) was found. The application of 1 CMC of Triton X-
100 and Tween 80 led to 5.4 and 3.8 mg kg-1
of Pb (II) in the leachate respectively. These
correspond to 1.1% and 0.76% of the initial Pb (II) concentration. When the amount of
Tween 80 was 2 CMC, the amounts of Pb (II) in the leachates increased to 5.1 mg kg-1
,
whereas the corresponding value for Triton X-100 was 12.75 mg kg-1
. The weight of
leachates was determined from each leaching event. They weighed 1992 ± 46 g.
0
1
2
3
0.5 1 2 0.5 1 2
Control Triton X-100 (CMC) Tween 80 (CMC)
Cd
(II
) le
ac
he
d (
mg
/kg
)
C 2

52
Fig 5.3 Effect of surfactants on Pb (II) leachate
5.6 Cd (II) and Pb (II) mass balance for surfactants application
For surfactants additive to the soil, the mass balance approach similar to the one
described in section 4.6, yielded the amount of final Cd (II) and Pb (II) concentrations
present in the soil. Phytoremediation is denoted in Table 5.3 as the sum of
phytostabilization and phytoextraction. When the concentration of surfactants were below
the CMC, enhanced phytoremediation (phytostabilization and phytoextraction) of Cd (II)
and also Pb (II) were not considerable (Table 5.3). No significant change in the
phytoextraction of Pb (II) was noted with surfactant application, except for
concentrations of 1 and 2 CMC Triton X-100. At these concentrations of Triton X-100,
plant growth appears to be inhibited due to toxicity which severely reduces the biomass
(Table 5.1). This in turn causes a large reduction in the phytoremediation of Pb (II)
compared to the control group. With the application of Tween 80 at 2 CMC, maximum
phytostabilization (52.2 mg) of Pb (II) was realised. Also, with the application of Triton
0 0 0 0
4
8
12
16
0.5 1 2 0.5 1 2
C 2 Triton X-100 (CMC) Tween 80 (CMC)
Pb
(II
) le
ac
he
d (m
g/k
g)

53
X-100 at 2 CMC, maximum phytostabilization of Pb (II) was 52.7 and the leachate
contained 25.5 mg of Pb (II). This amount corresponds to 2.6 % of initial concentration
of Pb (II).
As in the phytoremediation of Pb (II), the application of 2 CMC Triton X-100
significantly caused a decrease in the removal of Cd (II) and it also resulted in leaching a
considerable amount (4.4 mg) of Cd (II). The leached amount of Cd (II) corresponds to
4.5 % of its initial concentration. The increase in concentrations of Tween 80 enhanced
phytoextraction of Cd (II) slightly. For all surfactant additives, no significant change in
the phytostabilization of Cd (II) occurred (Table 5.3).
5.7 Effect of surfactants on rhizodegradation of used engine oil
Following the test period of 50 days, for control 2 (C2), it was noted that 38.3% of the
oil in soil was removed while 27.5% of the oil was removed due to natural attenuation
from the contaminated soil in the control 1 (C1) that did not have the plant. For Triton X-
100 at concentration of 0.5 CMC, rhizodegradation of the oil increased to 51% (Fig 5.4).
Even at 0.5 CMC, due to the reduction of interfacial tension, the surfactants increase the
mobility of the oil in soil leading to higher bioavailability through rhizodegradation of the
oil. These results also agree with previous studies which inferred that surfactants, even
below CMC can enhance the bioavailability of hydrophobic organic pollutants due to the
formation of hemimicelles (Klumpp et al. 1991 and Edwards et al. 1994).

54
Table 5.3 Mass balance for Pb (II) and Cd (II) for surfactants application
Ad
dit
ive
Hea
vy
met
al
Initial
Value
(mg)
Final value (mg)
Rec
ov
ery
(%
)
Soil
hea
vy m
etal
Hea
vy m
etal
re
mai
nin
g
in s
oil
Phy
toex
trac
tion
P
hyto
stab
iliz
atio
n
Phyto
rem
edia
tio
n
Lea
chat
e
To
tal
No
surfactant
(C 2)
Pb(II) 993 860.0 96.3 29.2 125.5 0 985.5 99
Cd(II) 99.4 91.9 3.4 0.9 4.3 1.4 97.6 98
TX-100
(0.5CMC)
Pb(II) 993 864.3 93.9 30.1 124.0 0 988.3 99
Cd(II) 99.4 93.3 3.3 0.9 4.2 1.6 99.1 100
T X-100
(1CMC)
Pb(II) 993 839.6 86.3 46.9 133.2 10.8 983.6 99
Cd(II) 99.4 88.8 4.9 1.1 6.0 2.4 97.2 98
T X-100
(2CMC)
Pb(II) 993 874.7 38.1 52.7 90.8 25.5 991 100
Cd(II) 99.4 90.5 2.2 0.8 3.0 4.9 96.2 99
Tw 80
(0.5CMC)
Pb(II) 993 852.5 99.6 30.1 129.7 0 982.2 99
Cd(II) 99.4 90.2 3.4 0.9 4.3 1.2 95.9 96
Tw 80
(1CMC)
Pb(II) 993 819.6 95.7 41.8 137.5 7.2 964.3 97
Cd(II) 99.4 88.8 4.4 1.1 5.5 2.2 96.2 100
Tw 80
(2CMC)
Pb(II) 993 825.8 93.0 52.2 145.2 10.2 981.2 99
Cd(II) 99.4 88.0 4.7 1.2 5.9 3.2 97.1 98

55
At concentrations higher than CMC of Triton X-100, rhizodegradation rate of the oil was
noted to be even lower than the value for control 2 tests which had plants in the soil
without surfactant (Fig 5.4). This may possibly be due to the damage to microorganism
cell membranes and enzymes caused directly by Triton X-100 or the toxic effects linked
to Cd (II) and Pb (II). Further, non-ionic surfactants can injure phospholipid membranes
of microbial cells at concentrations above CMC (Cserhati, 1995) and consequently
reduce rhizodegradation of the oil.
Fig 5.4 Effect of surfactants on rhizodegradation of oil in the soil
Non-ionic surfactant Tween 80 showed no apparent phytotoxicity for the plant growth
(Table 5.1). Rhizodegradation rates of the oil and surfactant concentrations are positively
correlated for all three concentrations of Tween 80 tested (Fig 5.4). Tween 80 increased
the mobility of the oil by decreasing the interfacial tension between the oil and the soil-
water phase. This leads to faster diffusion of oil from the soil particles and facilitates the
0
100
200
300
400
C1 C2 0.5 1 2 0.5 1 2
Control Triton X-100(CMC) Tween 80 (CMC)
Res
idu
al o
il i
n s
oil
(m
g/k
g)

56
utilization of oil by microorganisms. Gao et al. (2004) observed reduced residual of
pyrene in rhizosphere zone in the presence of Tween 80 and Brij35, in contaminated
soils. The maximum removal of 75.1% oil was observed in test pots remediated with 2
CMC of Tween 80. However, the removal of 51 % oil was noted at 0.5 CMC for Triton
X-100.
5.8 Effect of surfactants on basal soil respiration (BSR)
Regarding the initial and final values of basal soil respiration (BSR), considerable
improvements were observed in the soil with all surfactants except in the case of 2 CMC
Triton X-100 (Fig 5.5 ). At the end of the test, the highest value of BSR (2.47 g C g -1
DW soil h -1
) was found for 2 CMC of Tween 80 application.
Fig 5.5 Influence of surfactants on basal soil respiration
The addition of Tween 80 resulted in a slight increase of BSR. Conversely, an increase in
Triton X-100 concentration resulted in a severely reduced activity of microbe in terms of
0
1
2
3
4
0.5 1 2 0.5 1 2
Initial C 2 Tw 80 (CMC) Tx 100 (CMC)
value Final value
Ba
sa
l re
sp
ira
tio
n (
gC
-1 g
DW
so
il h
-1 )

57
BSR. The maximum decrease in the rate of BSR, (0.79 g C g -1
DW soil h -1
) was
observed for 2 CMC Triton X-100 application. This may be attributed to the high Pb (II)
remaining in soil. Pb (II) can inhibit the soil microbial activity. Further, the toxic effect of
Triton X-100 has been confirmed by the glucose mineralization tests done by Willumsen
et al. (1998). They reported that Triton X-100 was more inhibitory than Tween 80, for all
the bacteria tested.
5.9 Summary
Although simultaneous removal of mixed contaminants formed by heavy metals and used
engine oil from the soil is hard to achieve by phytoremediation, the application of non-
ionic surfactant Tween 80 to the soil promoted the removal of mixed contaminants by the
Indian mustard plant. Considering the leaching risk of Cd (II) and Pb (II) caused by the
surfactants, one seeks additives that avoid high levels of Cd (II) and Pb (II) in the
leachate. Basal soil respiration test showed that the application of Tween 80 resulted in an
increase in BSR. This test indicated that the lower concentration of Triton X-100 had a
slightly positive effect on BSR whereas at higher concentrations, it was inhibitory to the
microbes. Tween 80 at 2 CMC was effective for enhancing phytoremediation of Pb (II)
and Cd (II) from the soil containing the mixed contaminant. The results suggested that the
application of Tween 80 not only led to enhance the removal of oil, Pb (II) and Cd (II)
from the soil by Indian mustard but also resulted in an increase in BSR simultaneously
during phytoremediation.
In the next section (chapter 6), the transfer mechanism of heavy metals from soil media to
plants is described.

58
Chapter 6
Heavy metal transfer from soil media to plants
6.1 Introduction
The transport of heavy metals from the soil to the plant is affected by their
physicochemical properties of the soil and the plant. During phytoremediation, the soil
additive can influence concentration of heavy metals in the soil solution through sorption-
desorption reaction, and their transport through leaching. Although the uptake
relationship between soil and plants is possibly valid for narrow ranges of chemical
concentration in the moderately nontoxic range (Jiang and Singh, 1994), some evidence
demonstrates that plant uptake is dependent on metal concentration in the soil. Baes et al.
(1984) reported that the uptake factors for Cd (II) and Zn (II) were inversely correlated
with the soil concentration. The objective of the present study is to compare the empirical
model approaches used to establish the partitioning of the observed Cd (II) and Pb (II)
between the soil and the Indian mustard plant in chapters four and five.
6.2 Freundlich and Langmuir models
The transport of metals from soil to plant is a sorption process. Freundlich model is
considered to be suitable for describing both multilayer sorption and sorption on
heterogeneous surfaces (Ho et al. 2002). The Freundlich type function (Eq. 6.1) is defined
as follows:
q = K f C 1/n
(6.1)
q = Contaminant concentration in plant (mg/kg)
C = Final concentration of contaminant in the soluble form in soil (mg/kg)

59
In the Freundlich model, Kf is a measure of the sorption capacity (larger Kf indicates a
larger capacity), whereas the parameter 1/n is a measure of the strength of sorption
(Tsotsis et al. 2005). Here, larger value of n indicates a higher sorption affinity. The
Freundlich model is generally applied in an empirical way. It can be of theoretical interest
in terms of adsorption onto an energetically heterogeneous surface (Davis et al. 2003;
Adamson, 1990). The linear model is a special case of Freundlich model for n = 1. The
observed data may be represented by the Langmuir equation (Eq. 6.2):
q = KLbC/ (1+ bC ) (6.2)
Here, KL and b are Langmuir constants related to sorption capacity and energy of
sorption, respectively (Langmuir, 1918). The model assumes a monolayer adsorption
process on a homogeneous surface and would be most applicable in cases where all
binding sites exhibit uniform behavior towards the sorbate (Papageorgiou et al. 2006).
The linear form of the Langmuir equation (Eq. 6.3) model is usually described as (Weber
et al, 1990):
+
(6.3)
The transformed linear models have some advantages in that the linearized form can be
used to obtain starting values for iterative computation of the parameter estimates
(Gordon, 2002). Model parameters were determined from experimental data by a non-
linear regression algorithm (Newton method) using the Microsoft Excel solver. The least
squares regression seeks to find the parameter combination that minimizes the sum of
squares (Eq. 6.4). Each term in the summation is the difference between the observed

60
value and the computed value at the corresponding value of the independent
variable :
Min ∑
(6.4)
6.3 Model evaluation
According to Loague and Green (1990), Michel et al. (2007) and Wehrhan et al. (2007),
the modelling efficiency (EF) was used to test the fit between measured and modeled data
using the following equation (Eq. 6.5) and it is defined as:
EF = ∑ ̅ ∑
∑ ̅
(6.5)
Where and denote the measured and modeled values of the element , ̅ is the mean
of measured values and n is the number of values. If modeled values perfectly match the
measured ones then EF is equal to 1. Also, the student t-test with 95% confidence level
was used to compare whether a significant difference existed between two observed and
simulated values.
6.4 Predicting chelates induced metal uptake by the plant
At the end of the experiment, soil samples were analyzed to determine the soluble form
of Cd (II) and Pb (II) as described in section 3.4.4. Total Cd (II) and Pb (II) in the
solubilized form [column (1) of table 6.2] in the soil were calculated by adding their
concentration in plant tissues (both root and shoot), the soluble form in the soil-water
system and leachate. The effect of chelates on Cd (II) and Pb (II) in the soil is given in
Table 6.1. The solubilized form of Cd (II) and Pb (II) and their uptake in the presence of
chelate are shown in Table 6.2.

61
Table 6.1 Soluble Cd (II) and Pb (II) [mg/kg] in the soil containing chelate
Additive Cd(II) Pb(II)
EDDS
(mmol/kg)
0.5 6.4 42.2
1 8.5 59.7
2 9.9 66
EDTA
(mmol/kg)
0.5 7.2 53
1 10.3 77.8
2 11.5 105.5
Table 6.2 Solubilized form of Cd (II) and Pb (II) and their uptake in the
presence of chelate
Additive
Cd (II) Pb (II)
Solubilized
form
( mg/kg)
Plant
uptake
( mg/kg)
Solubilized
form
( mg/kg)
Plant
uptake
( mg/kg) (1) (2) (1) (2)
EDDS
(mmol/kg)
0.5 10.2 307.7 116.6 10639.6
1 13.9 349.1 152.3 14089.3
2 15.9 360.1 173.2 15327.4
EDTA
(mmol/kg)
0.5 12.1 328.1 177.4 14435.9
1 16.9 371.2 217 15827
2 18.4 398.4 258 16412.6
A positive relationship was found between the Cd (II) and Pb (II) concentrations in the
plant and the total soluble Cd (II) and Pb (II) concentrations in the soil (Table 6.2). These
results indicate that increased amounts of chelate resulted in increased levels of soluble
Cd (II) and Pb (II) in the soil solution. This in turn augments the uptake of Cd (II) and Pb

62
(II) by the plant. The t-test indicated that there were no significant differences between
observed and simulated values for the nonlinear models of Cd (II) uptake (Table 6.3).
They are much less than the critical value of 2.447 at the 95 % confidence level (Harris,
2003). This indicated that there was a significant difference between observed and
simulated values for the linear models of Cd (II) uptake. Also, the modeling efficiency
EF for the linear model of Cd (II) biosorption was considerably lower than the EF
obtained for the Langmuir type and the Freundlich type models (Table 6.3). Fig 6.1
shows that the linear model for chelate enhanced Cd (II) uptake. The Freundlich type and
the Langmuir type models for chelate enhanced Cd (II) uptake are shown in Fig 6.2.
Table 6.3 Models for predicating chelate enhanced Cd (II) uptake
Models
Parameters
Linear Freundlich Langmuir
t calculated 3.58 0.004 0.006
EF
- 0.88 0.96 0.98
Empirical
constants
K = 23.73
KF = 121
= 586.12
n = 2.47 b = 0.109
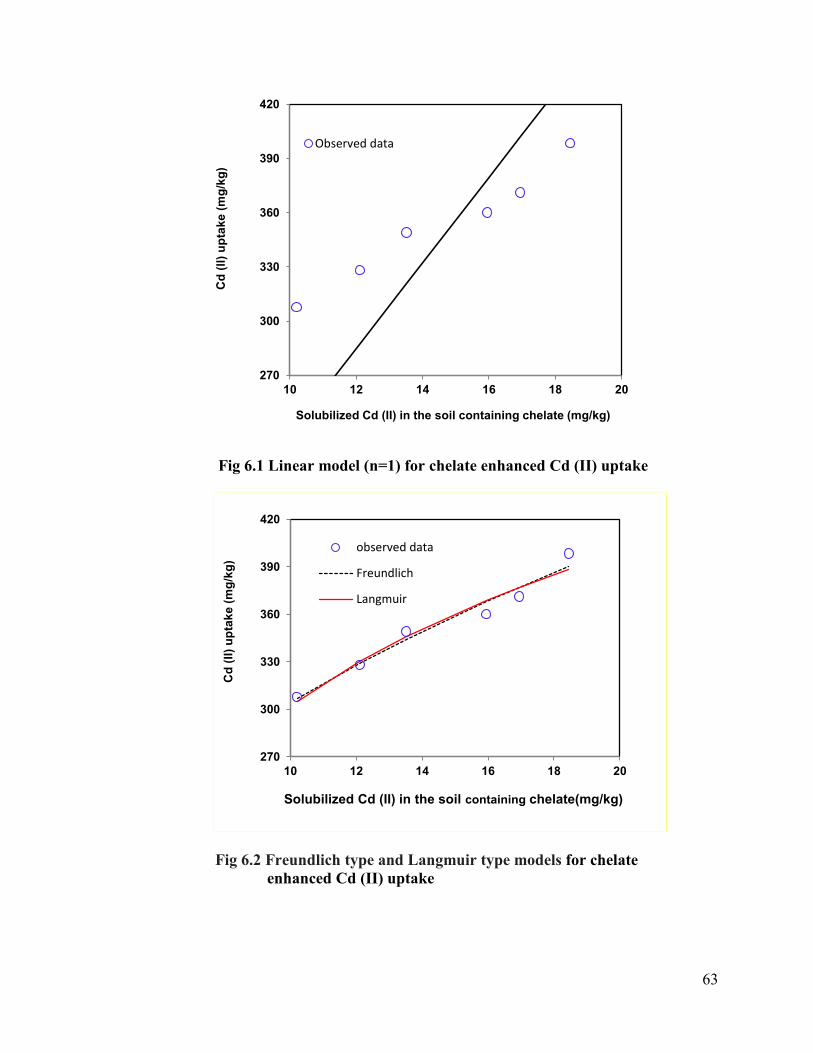
63
Fig 6.1 Linear model (n=1) for chelate enhanced Cd (II) uptake
Fig 6.2 Freundlich type and Langmuir type models for chelate
enhanced Cd (II) uptake
270
300
330
360
390
420
10 12 14 16 18 20
Cd
(II
) u
pta
ke
(m
g/k
g)
Solubilized Cd (II) in the soil containing chelate (mg/kg)
Observed data
270
300
330
360
390
420
10 12 14 16 18 20
Cd
(II
) u
pta
ke
(m
g/k
g)
Solubilized Cd (II) in the soil containing chelate(mg/kg)
observed data
Freundlich
Langmuir

64
Compared to the Freundlich model, the EF and t- test data indicated that predictions of
Cd (II) were slightly more consistent with simulation results using the Langmuir type
model (Fig 6.2) in the presence of chelate. The t-test indicated that there were no
significant differences between observed and simulated values for the nonlinear models
of Pb (II) uptake in the presence of chelate (Table 6.4). Compared to the Freundlich type
model, the Langmuir type model is slightly appropriate for transport of Pb (II). For Pb
(II) uptake, there was reasonable agreement between observed and simulated values for
the nonlinear models studied (Fig 6.4). Similar to the case of for Cd (II), the linear
model fails to describe the observed Pb (II) uptake (Fig 6.3).
Table 6.4 Models for predicating chelate enhanced Pb (II) uptake
Models
Parameters
Linear Freundlich Langmuir
t calculated 2.24 0.014 0.14
EF
0.2 0.81 0.85
Empirical
constants
K=76.95
KF = 1306.9
= 32259.6
n = 2.16
b = 0.0046

65
Fig 6.3 Linear model (n=1) for chelate enhanced Pb (II) uptake
Fig 6.4 Freundlich type and Langmuir type models for chelate
enhanced Pb (II) uptake
10
12
14
16
18
110 160 210 260
Pb
(II
) u
pta
ke
(1
00
0 m
g/k
g)
Solubilized Pb (II) in the soil containing chelate ( mg/kg)
observed data
10
12
14
16
18
110 160 210 260
Pb
(II
) u
pta
ke
(1
00
0 m
g/k
g)
Solubilized Pb (II) in the soil containing chelate (mg/kg)
observed data
Freundlich
Langmuir

66
6.5 Predicting surfactants induced metal uptake by the plant
Similar to section 6.4 the linear, the Freundlich type and the Langmuir type models were
used to describe the relation between the solubilized form of Cd (II) and Pb (II) and their
uptake in the presence of surfactant. Table 6.5 shows the effect of surfactant on soluble
Cd (II) and Pb (II) in the soil (section 3.4.4).
Table 6.5 Soluble Cd (II) and Pb (II) [mg/kg] in the soil containing surfactant
The solubilized form of Cd (II) and Pb (II) and their uptake in the presence of surfactant
are shown in Table 6.6. Similar to the effect observed for chelate in section 6.4, a positive
relationship was present between the Cd (II) and Pb (II) uptake and the total soluble Cd
(II) and Pb (II) concentrations in the presence of surfactant (Fig 6.5).
Additive Cd(II) Pb(II)
Triton
X-100
(CMC)
0.5 4.1 21.8
1 7.7 23.6
2 9.5 39.7
Tween 80
(CMC)
0.5 6.9 20.6
1 8.5 20.9
2 7.8 23.1

67
Table 6.6 Solubilized form of Cd (II) and Pb (II) and their uptake in the
presence of surfactant
Additive
Cd (II) Pb (II)
Solubilized
form
(mg/kg)
Plant
uptake
(mg/kg)
Solubilized
form
(mg/kg)
Plant
uptake
(mg/kg)
(1) (2) (1) (2)
Triton
X-100 (CMC)
0.5 7 186.2 83.7 5553.8
1 11.9 300.4 94.8 6615.7
2 13.5 316.2 78.2 5362.5
Tween
80
(CMC)
0.5 9.7 185.9 85.5 5666.8
1 12.2 247.7 93.4 6159.2
2 11.7 263.4 102.1 6717.7
For all Cd (II) models tested, the tcalculated values (Table 6.7) are much less than the
critical value of 2.447 at the 95 % confidence level. Compared to the Langmuir type
model, the Freundlich type model exhibits a slightly better fit for the Cd (II) uptake in the
presence of the surfactant (Fig 6.6).
Compared to Cd (II) uptake, a higher biosorption capacity (Kf) was found for Pb (II)
uptake (Tables 6.7 and 6.8). This may be linked to the relatively very high initial
concentration of Pb (II) in the soil. Initial soil concentration of Pb (II) was 10 times more
than that of Cd (II). The Freundlich type model indicates that Kf (biosorption capacity) of
Pb (II) was about 2.6 times more than Kf for Cd (II). This denotes a higher biosorption
of Pb (II) for the Indian mustard plant, in the presence of surfactant.

68
Table 6.7 Models for predicating surfactant enhanced Cd (II) uptake
Fig 6.5 Linear model (n = 1) for surfactant enhanced Cd (II) uptake
150
200
250
300
350
6 9 12 15
Cd
(II
) u
pta
ke
(m
g/k
g)
Solubilized Cd (II) in the soil containing surfactant (mg/kg)
Observed data
Models
Parameters
Linear Freundlich Langmuir
t calculated 0.11 0.02 0.03
EF
0.79 0.83 0.81
Empirical
constants
K=30
KF = 33.8
KL = 2629.8
n = 1.2 b = 0.0097

69
Fig 6.6 Freundlich type and Langmuir type models for surfactant
enhanced Cd (II) uptake
According to EF values (Table 6.8), the linear model proves to be less effective in
illustrating the biosorption process for Pb (II). In contrast, the Freundlich type and the
Langmuir type exhibited a good fit for and Pb (II) with higher EF values. In particular,
compared to the Langmuir type model, the Freundlich type model displays an excellent
fit for Pb (II) in the presence of surfactant (Fig 6.8).
150
200
250
300
350
6 9 12 15
Cd
(II
) u
pta
ke
(m
g/k
g)
Solubilized Cd (II) in the soil containing surfactant (mg/kg)
Observed data
Freundlich
Langmuir

70
Table 6.8 Models for predicating surfactant enhanced Pb (II) uptake
Models
Parameters Linear Freundlich Langmuir
t calculated 0.05 0.0002 0.02
EF
0.78 0.94 0.90
Empirical
constants
K= 67.08
KF = 87.44
= 105
n = 1.066
b = 7.143 10-4
Fig 6.7 Linear model (n = 1) for surfactant enhanced Pb (II) uptake
5
5.5
6
6.5
7
70 80 90 100 110
Pb
(II
) u
pta
ke
(1
00
0 m
g/k
g)
Solubilized Pb (II) in the soil containing surfactant (mg/kg)
Observed data

71
Fig 6.8 Freundlich type and Langmuir type models for surfactant
enhanced Pb (II) uptake
6.6 Summary
Both Cd (II) and Pb (II) uptake by plants were correlated with their concentrations in the
soil solution as a result of higher mobilization induced by soil additives. The Freundlich
type and the Langmuir type models were suitable to describe the transfer of Cd (II) and
Pb (II) to the plants from the soil in the presence of soil additives.
For chelate application, the uptake of both Cd (II) and Pb (II) were well described with
the Langmuir type model. Compared to Cd (II) uptake, the Langmuir model indicated
that the biosorption capacity of Pb (II) was about 5.5 times higher in the presence of
chelate. For surfactant application, the uptake of Pb (II) and Cd (II) was well described
by the Freundlich type and the Langmuir type models respectively. The Freundlich
5
5.5
6
6.5
7
70 80 90 100 110
Pb
(II
) u
pta
ke
( 1
00
0 m
g/k
g)
Solubilized Pb (II) in the soil containing surfactant (mg/kg)
Observed data
Freundlich
Langmuir
72
model indicated that the biosorption capacity for Pb (II) was about 2.6 times more than
that for Cd (II), in the presence of surfactant. For the range of metal concentrations
studied, the empirical models showed that the enhanced uptake of Cd (II) and Pb (II) in
the presence of chelate was greater than their uptake with the surfactant application.
In the next chapter, leaching study model is presented. It permits one to compute the
amount of Cd (II) and Pb (II) leachates during enhanced phytoremediation by chelates
and surfactants.
73
Chapter 7
Leaching study
7.1 Introduction
Leachate release from a contaminated soil is a challenging problem due to their toxic
impact. In general, leaching studies can be classified into the following categories
(Environment Canada, 1991): (a) contaminant release tests under a specific
environmental condition, (b) sequential chemical extraction tests, or (c) fundamental
leaching parameter tests. Many of these tests are related to the environmental conditions
under which leaching of the tested soil may actually occur. The aim of present leaching
study is to quantify the mobility of Cd (II) and Pb (II) from the soil water system to
leachates, during enhanced phytoremediation.
7.2 Leachability index
According to Environment Canada (1991), Leachability index (LI) value can be used as a
performance criterion for the utilization and disposal of stabilized/solidified (S/S)
contaminated soil. When LI values are higher than 9, a treatment process can be
considered effective and S/S contaminated soil could be used in “controlled utilization”.
When LI values are lower than 8, contaminated soil is not considered appropriate for
disposal. It must be treated until LI values are higher than 9. Although, this study is not
related to stabilized/solidified contaminated soil, LI is used as the criteria to evaluate the
risk of the leachate of Pb (II) and Cd (II) caused by the application of chelates and
surfactants for phytoremediation.

74
Leachability index (Eq. 7.1) is equal to the negative logarithm of the observed diffusivity
(D obs) as defined below (Kosson et al. 1993):
LI = - log (Dobs) (7.1)
7.3 Observed diffusivity
In a soil, the total Fickian transport coefficient of a contaminant is the sum of the
mechanical dispersion coefficient and the chemical effective diffusion coefficient.
Gillham and Cherry (1982) state that chemical effective diffusion is the dominant
transport in the soil and that the water velocity in the soil is less than about 1.6 X l0 -10
m/s. The observed diffusivity (Eq. 7.2) represents both chemical and physical aspects
of leaching and can be calculated by the following equation (Godbee et al. 1980):
Dobs = (/ 4t) (V/S) 2
(MT/ MI) 2
(7.2)
Here,
Dobs = Observed diffusivity ( cm2/s)
t = Leaching time period = 20 days
V and S are respectively soil volume (cm3) and surface area (cm
2) of soil in test pot.
MT = Total mass of metal in leachate (mg)
MI = Initial mass of metal in soil (mg)
7.4 Study of kinetics
For the single first-order (SFO) kinetics (Eq.7.3), the time for a decrease in the
concentration by a fixed percentage is constant. Thus,
CL = Co exp (–kt) (7.3)
Here,

75
CL = Metal leached at time t (mg/kg)
Co = Metal concentration in soil before adding additive (mg/kg)
k = Leaching rate (1/ day)
Sometimes, the leaching process cannot be modeled by the above SFO kinetics. A fast
initial decrease in a concentration is often followed by a slower reduction in
concentration. According to Pignatello (2000) the available fraction often decreases with
time due to slow diffusion processes. He also abbreviated the bi-exponential model (Eq.
7.4) as two-first-order (TWFO) kinetics. Metals are assumed to be sited into two
independent compartments the fast and the slow leaching compartment respectively (Eq.
7.5).
CL = Cf exp (–kf t) + Cs exp (–kst) (7.4)
Co = Cf + Cs (7.5)
Here,
Cf = Metal concentration in soil applied to the fast leaching compartment (mg/ kg)
Cs = Metal concentration in soil applied to the slow leaching compartment (mg/ kg)
kf = Fast leaching rate (1/ day)
ks= Slow leaching rate (1/ day)
In the present study, a three-exponential model (Eq. 7.6) is proposed and abbreviated as
the three-first-order (THFO) kinetics model. Here, the metals are assumed to be placed
in three independent compartments the fast, relatively fast and slow leaching
compartment respectively.
CL = Cf exp (–kf t) + Crf exp (–krf t) + Csexp (–kst) (7.6)
Here,

76
Cf, Crf and Cs are metal concentration in soil applied to the fast, relatively fast and slow
leaching compartments respectively. Also,kf, krf and ks are the rates for the fast, relatively
fast and slow leaching compartments respectively (Eq. 7.7).
Co = Cf + Crf + Cs (7.7)
7.5 Observed diffusivity and leachability index of Cd (II) and Pb (II) for
soil in the presence of chelate
The maximum leachability index for both metals was found for the application of EDDS
at 0.5 mmol/kg to the soil (Table 7.1). These index values indicate that this additive
generally caused the minimum amount of metal leaching (section 7.2). According to LI
values, 0.5 mmol/kg of EDDS can be considered as the safest additive among of all
chelates tested. Further, the LI values indicated that the chelates EDDS (2 mmol/kg),
EDTA (1 mmol/kg) and EDTA (2 mmol/kg) cannot be considered as safe additives.

77
Table 7.1 Observed diffusivity and leachability index of Cd (II) and Pb (II)
due to the application of chelates
Additive Metal
Total
leachate
(mg)
Observed
diffusivity
( cm2/s )
Leachability
index
Control Cd(II) 1.4 4.3E-10 9.4
Pb(II) - - -
EDDS
(0.5 mmol/kg)
Cd(II) 3.6 2.9E-09 8.5
Pb(II) 10.4 2.4E-10 9.6
EDDS
(1 mmol/kg)
Cd(II) 6.6 9.6E-09 8
Pb(II) 14.2 4.5E-10 9.3
EDDS
(2 mmol/kg)
Cd(II) 7.8 1.3E-08 7.9*
Pb(II) 39.4 3.4E-09 8.5
EDTA
(0.5 mmol/kg)
Cd(II) 5.2 6E-09 8.2
Pb(II) 44.4 4.4E-09 8.4
EDTA
(1 mmol/kg)
Cd(II) 8.6 1.6E-08 7.8*
Pb(II) 75.8 1.3E-08 7.9*
EDTA
(2 mmol/kg)
Cd(II) 9.2 1.9E-08 7.7*
Pb(II) 113 2.8E-08 7.5*
* Inappropriate additive
7.6 Observed diffusivity and leachability index of Cd (II) and Pb (II) for
soil in the presence of surfactant
The maximum leachability index for both metals was found in the soil with the
application of Tween 80 at 0.5 CMC. This indicates that this additive resulted in the
minimum amount of leaching of Cd (II) and Pb (II). According to LI values, all
surfactants tested can be considered as appropriate additives. Compared to Triton X-100,
Tween 80 lowered the diffusivity and resulted in a higher value of LI indicating that this
surfactant was safer (Table 7.2).

78
Table 7.2 Observed diffusivity and leachability index of Cd (II) and Pb (II)
due to the application of surfactants
Additive Metal
Total
leachate
(mg)
Observed
diffusivity
( cm2/s )
Leachability
index
Control Cd(II) 1.4 4.3 E -10 9.4
Pb(II) 0 - -
Triton X-100
(0.5 CMC)
Cd(II) 1.6 5.7 E -10 9.2
Pb(II) 0 - -
Triton X-100
(1 CMC)
Cd(II) 2.4 1.3 E -9 8.9
Pb(II) 10.8 2.6 E -10 9.6
Triton X-
100 (2
CMC)
Cd(II) 4.9 5.3 E -10 8.3
Pb(II) 25.5 1.4 E -9 8.8
Tween 80
(0.5 CMC)
Cd(II) 1.2 3.2 E -10 9.5
Pb(II) 0 - -
Tween 80
(1 CMC)
Cd(II) 2.2 1.1 E -9 9
Pb(II) 7.2 1.2E -9 9.9
Tween 80
(2 CMC)
Cd(II) 3.2 2.3 E -9 8.6
Pb(II) 10.2 2.3E -10 9.6
7.7 Leaching kinetics
Kinetics of the leaching process of Cd (II) and Pb (II) in the test pot soil with application
of chelates was studied as a function of their initial concentration in the soil before adding
chelates. In each leaching event, for both surfactants tested as well as the control
treatment, Cd (II) and Pb (II) concentrations were too small for measurement. As
described in chapter 3, after each irrigation event at 3-day intervals, the leachate collected
from each test pot soil subjected to chelate application contained measurable Cd (II) and
Pb (II). The observed data (Table 7.3) were fitted with the three models (SFO, TWFO
and THFO). The fitted equations and their modeling efficiency (EF) values are shown in

79
Table 7.4 and Table 7.5. Fig 7.1 shows the fitted kinetic curves for an experimental
result of Cd (II) leaching by EDDS and EDTA for the concentrations tested. Similar
results as those shown in Fig 7.2 were obtained for the data sets of Pb (II). The TWFO
model provided a good fit for the experimental data. However, the t-test indicated that
there were significant differences between observed and simulated values for the SFO
models of Pb (II) leaching in the presence of EDTA.
Table 7.3 Observed data of Cd (II) and Pb (II) leached (mg/kg) due to
application of chelates
Chelate Metal Leaching intervals (day)
30 33 36 39 42 45 48 50
EDDS
(0.5mmol/kg)
Cd (II) N.S. N.S. N.S. N.S. N.S. N.S. N.S. N.S.
Pb (II) 1.5 1.1 0.9 0.7 0.3 0.2 0.1 0.1
EDDS
(1mmol/kg)
Cd (II) 1 0.7 0.6 0.4 0.2 0.2 0.1 0.1
Pb (II) 2.2 1.4 1 0.8 0.5 0.4 0.4 0.4
EDDS
(2mmol/kg)
Cd (II) 1.2 0.9 0.5 0.4 0.4 0.2 0.2 1.2
Pb (II) 4.2 3.7 3.2 2.5 1.8 1.5 1.4 1.4
EDTA
(0.5mmol/kg)
Cd (II) N.S. N.S. N.S. N.S. N.S. N.S. N.S. N.S.
Pb (II) 3.6 3.2 3 2.9 2.6 2.5 2.2 2.2
EDTA
(1mmol/kg)
Cd (II) 1.2 0.9 0.6 0.5 0.3 0.3 0.2 0.2
Pb (II) 6.6 5.7 5.2 4.6 4.3 4 3.8 3.7
EDTA
(2mmol/kg)
Cd (II) 1.2 1 0.6 0.5 0.4 0.4 0.3 0.2
Pb (II) 12.3 9.6 7.7 6.5 5.5 5.2 5 4.7
N.S. = Not Significant

80
Table 7.4 Kinetics equations of the leaching process for heavy metals in soil with
EDDS
Ch
elat
e
Metal Kinetic Equation EF
ED
DS
(0
.5 m
mo
l/k
g)
Cd(II) --- ------------ ---
Pb(II)
SFO 446.4 exp (–0.184t) 0.82
TWFO 420 exp (–0.76 t) + 26.4exp (–0.1t) 0.96
THFO 397.7 exp (–0.63 t) + 25.3exp (–0.115t) + 23.4exp (–0.114t) 0.96
ED
DS
(1
mm
ol/
kg
)
Cd(II)
SFO 48.6 exp (–0.127t) 0.96
TWFO 20 exp (–0.67 t) + 28.6exp (–0.11t) 0.98
THFO ------------ ---
Pb(II)
SFO 446.4 exp (–0.174t) 0.83
TWFO 438.5 exp (–0.2 t) + 7.9 exp (–0.07t) 0.98
THFO 438.3exp (–0.19 t) + 7.15 exp (–0.16t) + 0.95exp (–0.022t) 0.98
ED
DS
(2
mm
ol/
kg
)
Cd(II)
SFO 48.6 exp (–0.1258t) 0.97
TWFO 48.47 exp (–0.125 t) + 0.13exp (–0.02t) 0.98
THFO 41.82exp (–0.125 t) + 6.7 exp (–0.125t) + 0.08exp (–0.012t) 0.98
Pb(II)
SFO 446.4 exp (–0.16t) 0.15
TWFO 417.7 exp (–0.55 t) + 28.7 exp (–0.063t) 0.97
THFO ------------------ ---

81
Table 7.5 Kinetics equations of the leaching process for heavy metals in soil with
EDTA
Ch
elat
e
Metal Kinetic Equation EF
ED
TA
(0.5
mm
ol/
kg)
Cd(II) ---- ------------------ ---
Pb(II)
SFO 446.4 exp (–0.147t) - 10.52
TWFO 439.6 exp (–0.27 t) + 6.8 exp (–0.023t) 0.98
THFO ------------------ ---
ED
TA
(1
mm
ol/
kg
)
Cd(II)
SFO 48.6 exp (–0.121t) 0.97
TWFO 48exp (–0.129 t) + 0.6exp (–0.034t) 0.99
THFO -------------- ---
Pb(II)
SFO 446.4 exp (–0.129t) - 4.6
TWFO 437.7 exp (–0.19 t) + 8.7 exp (–0.017t) 1
THFO 434.7 exp (–0.19 t) + 8.4 exp (–0.04t) + 3.3 exp (–0.006t) 1
ED
TA
(2
mm
ol/
kg
)
Cd(II)
SFO 48.6 exp (–0.12t) 0.91
TWFO 47.94exp (–0.13 t) + 0.66exp (–0.0264t) 0.98
THFO --------------------- ---
Pb(II)
SFO 446.4 exp (–0.114t) 0.26
TWFO 443.1 exp (–0.132 t) + 3.3 exp (–0.004t) 1
THFO 401.7 exp (–0.141 t) + 43.9 exp (–0.07t) + 0.8 exp (–0.03t)
1

82
Observed data, ------- SFO, TWFO, × THFO
Fig 7.1 SFO, TWFO and THFO kinetics for the leaching process of Cd (II) due to
EDDS and EDTA application
0
0.4
0.8
1.2
24 30 36 42 48 54
Cd
(II)
le
ac
he
d (m
g/k
g)
Time ( day )
(a) EDDS ( 1mmol/kg)
0
0.4
0.8
1.2
1.6
24 30 36 42 48 54
Cd
(II
) le
ac
he
d (m
g/k
g)
Time (day)
(b) EDTA ( 1mmol/kg)
0
0.4
0.8
1.2
1.6
24 30 36 42 48 54
Cd
(II
) le
ac
he
d (
mg
/kg
)
Time (day)
(c) EDDS ( 2mmol/kg)
0
0.4
0.8
1.2
1.6
24 30 36 42 48 54
Cd
(II
) le
ac
he
d (
mg
/kg
)
Time (day)
(d) EDTA (2 mmol/kg)

83
Observed data, ------- SFO , TWFO , × THFO
Fig 7.2 SFO, TWFO and THFO kinetics for the leaching process of Pb (II) due to
EDDS and EDTA application
0
1
2
24 30 36 42 48 54
Pb
(II
) le
ac
he
d (
mg
/kg
)
Time (day)
(a) EDDS ( 0.5 mmol/kg)
0
2
4
6
24 30 36 42 48 54
Pb
(II)
le
ac
he
d (
mg
/kg
)
Time (day)
(b) EDTA ( 0.5 mmol/kg)
0
1
2
3
24 30 36 42 48 54
Pb
(II
) le
ac
he
d (m
g/k
g)
Time (day)
(c) EDDS ( 1 mmol/kg)
0
2
4
6
8
10
24 30 36 42 48 54
Pb
(II
) le
ac
he
d (m
g/k
g)
Time (day)
(d) EDTA ( 1mmol/kg)

84
Observed data, ------- SFO, TWFO, × THFO
Fig 7.2 Continued
7.8 Summary
In order to assess the long-term leaching behavior of Cd (II) and Pb (II) in test pots
treated with additives, the leachability index (LI) of the leached samples was determined
based on the observed diffusivity. LI value revealed that 0.5 mmol/kg of EDDS can be
considered as the safest additive among all chelates tested. Surfactant additives were
very effective in reducing diffusivity of Cd (II) and Pb (II) than chelate additives.
According to LI values, all surfactants tested can be considered as safe additives.
Compared to Triton X-100, Tween 80 resulted in a lower diffusivity and a higher value of
LI. This indicates that this surfactant was safer from the point of view of reducing ground
water pollution.
The EF value for the SFO kinetic was considerably lower than the EF value obtained for
TWFO and THFO kinetics. The SFO kinetics proves to be unsuitable to define the
0
2
4
6
24 30 36 42 48 54
Pb
(II
) le
ac
he
d (
mg
/kg
)
Time (day)
(e) EDDS ( 2 mmol/kg)
0
4
8
12
16
24 30 36 42 48 54
Pb
(II
) le
ac
he
d
(mg
/kg
)
Time (day)
(f ) EDTA ( 2mmol/kg)

85
leaching process for Cd (II) and Pb (II). The EF indicated that there were no significant
differences between TWFO and THFO kinetics for the predictions of Cd (II) and Pb (II)
leaching. The TWFO kinetics exhibited an excellent fit for the metals leaching behavior.
The final section (chapter 8) deals with the conclusions and contributions related to the
study.

86
Chapter 8
Summary and conclusions, contributions
8.1 Summary and conclusions
The present study evaluated the potential of enhanced phytoremediation technique for
the remediation of soils contaminated with mixed contaminants composed of both heavy
metals and a hydrocarbon (used engine oil).
Indian mustard plant alone removed 7.5 % of Cd (II), 13.4 % of Pb (II) by uptake and 38
% of used engine oil through rhizodegradation from the soil without additives (no
surfactant or chelate). Compared to the plant uptake by the control (no soil additives), the
ratio of the increase of Pb (II) uptake by the plant due to chelate additives ranged from
1.7 to 5. The corresponding ratio of the increase of Cd (II) uptake by the plant due to
chelates as additives was in the range of 1.4 to 1.6. At same concentration, EDTA
resulted in more phytoremediation of Cd (II) and Pb (II) than EDDS. Further, EDTA was
also more effective in facilitating rhizodegradation of the used engine oil. On the other
hand, EDDS treatment led to a lower amount of Pb (II) in the leachate. However,
compared to EDTA, the addition of EDDS resulted in a slight decrease in BSR (basal soil
respiration). Further, an increase in EDTA concentration resulted in a significant drop in
BSR. Briefly, among the two chelates studied, EDDS proved to be the safer treatment
from the point of view of reducing groundwater contamination as well as restoring soil
quality in terms of BSR.
At the same concentration surfactants, treating the soil with Tween 80 enhanced
phytoremediation of Pb (II). Triton X-100 was more effective in terms of uptake of Cd (II)
and Pb (II). However, the plant biomass associated with Tween 80 additive was much

87
higher than the biomass associated with triton X-100. The tests showed that the
application of Tween 80 resulted in an increase in BSR. Briefly, the results indicated that
the lower concentration of TritonX-100 had a slightly positive effect on BSR, whereas it
was inhibitory to the microbes at higher concentrations.
Modeling studies indicated that the uptake of both Cd (II) and Pb (II) can be properly
represented by the Langmuir type model for chelate (EDDS and EDTA) additives.
Considering their initial soil concentrations [496.5 mg/kg of Pb (II) and 49.7 mg/kg of Cd
(II)], the Langmuir type model indicates that the uptake capacity of Pb (II) was about 5
times more than Cd (II) in the presence of chelates. For surfactants (Triton X-100 and
Tween 80) additives, the uptake of Pb (II) and Cd (II) was well described by the
Freundlich type model. The Freundlich type model indicated that the uptake capacity of
Pb (II) was about 2.6 times more than Cd (II) in the presence of surfactants. This signifies
that compare to the plant uptake of Cd (II), Indian mustard plant has higher uptake
capacity for Pb (II) in the presence of surfactants. The TWFO kinetic was able to
describe the leaching process for both Cd (II) and Pb (II).
Based on LI (leachability index) of the samples established on the observed diffusivity
model, leaching studies indicated that both surfactants tested are safe additives.
Compared to Triton X-100, Tween 80 resulted in a lower values of diffusivity and higher
values of LI, indicating that this surfactant was safer from the point of view of reduced
ground water pollution. LI values revealed that 0.5 mmol/kg of EDDS can be considered
as the safest additive among all chelates tested to limit ground water pollution.

88
8.2 Contributions
The present study indicates that chelates (EDDS and EDTA) and surfactant (Tween 80)
can enhance phytoremediation of soils polluted by mixed contaminants (heavy metals and
used engine oil). In particular, for phytoremediation using Indian mustard plant, chelate
EDDS is a safer soil additive from the point of view of ground water pollution.
The results suggested that the application of Tween 80 also resulted in an increase in BSR
during phytoremediation and this is desirable as it indicates improve soil quality.
The Freundlich type and the Langmuir type models are shown to describe the transfer of
Cd (II) and Pb (II) to the plants from the soil in the presence of soil additives.
The two single first order (TWFO) kinetic model provided an excellent fit for the metal
leaching behavior.

89
References
Adamson, A, W., 1990. Physical Chemistry of Surfaces, 5th
edition. John Wiley and
Sons, New York, NY.
Akerblom, S., Baath E. and Bringmark L., 2007. Experimentally induced effects of
heavy metal on microbial activity and community structure of forest soil. Biol. Fertil.
Soils. 44, 79–91.
Alkorta, I,. Aizpurua, A, and Riga, P., 2003. Soil enzyme activities as biological
indicators of soil health, Reviews on environmental health. 18, 65-73.
Alkorta, I., Hernández-Allica, J,. Becerril, J, M, and Amezaga, I., 2004. Chelate-
enhanced phytoremediation of soils polluted with heavy metals. Rev Environ Health. 3,
55–70.
Alloway, B, J., 1995. Heavy Metals in Soils 2nd
edition. Chapman and Hall. Glasgow,
UK.
Almeida, C., Claúdia Dias, A., Mucha, P., and Bordalo, A., 2009. Influence of surfactants
on the Cu phytoremediation potential of a salt marsh plant. Chemosphere, 75, 135–140.
Almeida. C., Mucha, P., Delgado, MF., Caçador, MI., Bordalo, A.and Vasconcelos, MT.,
2008. Can PAHs influence Cu accumulation by salt marsh plants? Marine Environmental
Research. 66,311-318.
Anderson. T., Guthrie, A. and Walton, B, T., 1993. Bioremediation in the rhizosphere.
Environ. Sci. Technol. 27, 2630–2636.
Andrade M.D, Prasher S.O and Hendershot.W.H., 2007. Optimizing the molarity of a
EDTA washing solution for saturated-soil remediation of trace metal contaminated soils
Environmental Pollution. 147, 781-790.
Annette, C, D. and Schnoo,L., 2001. Advances in Phytoremediation, Environ Health
Perspect. 109,163–168.
ASTM, 2006. ASTM Standards on Environmental Sampling.
90
ASTM, 2005. Standard Test Method for Water in Petroleum Products and Bituminous
Materials by Distillation.
Baes, C, F., Sharp, A. and Shor,R, W., 1984. A review and analysis of parameters for
assessing transport of environmentally released radionuclides through agriculture.
ORNL- 5786. U. S. Dept. of Energy.U.S.
Baker, AJM. and Whiting, S, N., 2002. In search of the Holy Grail- a further step in
understanding metal hyper accumulation? New Phytol.155, 1-4.
Berthouex, M., 2002. Statistics for Environmental Engineers. Second Edition.CRC Press.
Blaylock, M, J., Salt, D,E., Dushenkov, S. and Zakharova, O., 1997. Enhanced
accumulation of Pb (II) in Indian mustard by soil-applied chelating agents. Environ Sci.
Technol. 31, 860-865.
Brooks, R., Lee, J., Reeves, RD. and Jaffré, T., 1977. Detection of nickeliferous rocks by
analysis of herbarium specimens of indicator plants. J Geochem Explore. 7, 49-77.
Chen, Y C., Katherine Banks, M. and Paul Schwab A., 2003. Pyrene degradation in the
rhizosphere of Tall Fescue (Festuca arundinacea) and Switchgrass (Panicum virgatum L).
Environ. Sci. Technol. 37, 5778-5782.
Cornelia, C.E., 1992. Biodegradation of polycyclic aromatic hydrocarbons.
Biodegradation. 3,351-368.
Cserhati, T., 1995. Environmental Health issues. Environ. Health Perspect. 103, 358-364.
Davis, L., 2003. Modeling and design of phytoremediation. In Phytoremediation.
Transformation and Control of Contaminants, Wiley, New York, 24. 663-694.
Davis, T, A., Volesky, B., A, and Mucci., 2003. A review of the biochemistry of heavy
metal biosorption by brown algae, Water Res. 37, 4311–4330.
Di Gregorio, S., Barbafieri, M., Lampis, S., Sanangelantoni, A., Tassi,E. and Vallini, G.,
2006. Combined application of Triton X-100 and Sinorhizobium sp. Pb002 inoculum for
the improvement of lead phytoextraction by Brassica juncea in EDTA amended soil.
Chemosphere .63, 293–299.

91
Dmitrieva, T, V., Panchenko L, V. and Turkovskaya, O, V., 2008. Phytoremediation of
Oil-Sludge–Contaminated Soil. International Journal of Phytoremediation. 10,486–502.
Duffield, A. R., Ramamurthy, A. S. and Campanelli, J. R., 2003. Surfactant enhanced
mobilization of mineral oil within porous media. Water Air and Soil Poll. 143, 111–122.
Dushenkov, S., Vasudev, D., Kapulnik, Y., Gleba, D. and Fleisher D., 1997. Removal of
uranium from water using terrestrial plants. Environ. Sci. Technol. 31, 3468–3474.
Duxbury, P.H., S.D. Siciliano, S.O. Prasher, and Greer, C,W., 2000. The use of forage
grasses and bacterial inoculants as phytoremediation agents in soils contaminated with
heavy metals and aliphatic hydrocarbons. Proceedings of the 2nd Phytoremediation
Technical Seminar, June 12-13, 2000, Vancouver, B.C., pp 61-74.
Duxbury, P.H., 2000. Phytoremediation system for treatment of contaminant mixtures in
soil. Master thesis. Department of Bioresource Engineering. Mc Gill University.
Edwards, D.A., Luthy, R.G. and Liu, Z., 1994. Solubilization of polycyclic aromatic
hydrocarbons in micellar nonionic surfactant solutions. Environ. Sci. Technol. 25, 127–
133.
Environment Canada., 1991. Proposed evaluation protocol for cement based solidified
wastes, environmental protection series. Rep. No.EPS 3/HA/9.
Epelde, l,.2008. Effects of chelates on plants and soil microbial community: Comparison
of EDTA and EDDS for lead phytoextraction Science of The Total Environment. 401, 1-
3.
Epestein, E. 1972. Mineral nutrition of plants: Principles and perspectives. New York:
Wiley.
Eweis, J., Sarina, J., Ergas, D. and Schroeder, D., 1998. Bioremediation Principles, Mc
Graw-Hill.
Gao, Y. Z., Zhu, L. Z., Hu, C. J. and Chen, B., 2004. Effects of Tween 80 on plant uptake
of phenanthrene and pyrene from water. Acta Scientiae Circumstantiae (in Chinese). 24,
713–718.
Garbisu, C., 2002. Phytoremediation. A technology using green plants to remove
contaminants from polluted areas.

92
Gillham, W. and cherry, A., 1982. Predictability of solute transport in diffusion
controlled hydrogeologic regimes. Washington, DC. United States Nuclear Regulatory
Commission.
Godbee, H.W., E.L. Compere, D.S. Joy, A.H. Kibbey, J.G. Moore, C.W. Nestor, Jr., 0. U.
Anders and R.M. Nielson, Jr.,1980. "Application of Mass Transport Theory to the
Leaching of Radionuclides from Waste Solids," Nuclear and Chemical Waste
Management. Vol. 1, pp. 29-35.
Gordon, K., 2002. Nonlinear regression, Encyclopaedia of Environ metrics, John Wiley
& Sons, Ltd Press.
Grčman, H., Velikonja-Bolta, S., Vodnki, D. and Lestan, D., 2001. EDTA enhanced
heavy metal phytoextraction: Metal accumulation, leaching and toxicity. Plant Soil. 235,
105-114.
Günther, T., Dornberger, U. and Fritsche, W., 1996. Effects of ryegrass on
biodegradation of hydrocarbons in soil. Chemosphere. 33, 203–215.
Haag-Kerwer, A., Schafer, H., Heiss, S., Walter, C. and Rausch, T., 1999. Cadmium
exposure in Brassica juncea causes a decline in transpiration rate and leaf expansion
without effect on photosynthesis. J. Exp. Bot. 50, 1827–1835.
Hamlin, R. and Barker, A., 2006. Phytoextraction Potential of Indian mustard at Various
Levels of Zinc Exposure. Journal of Plant Nutrition. 29, 1257–1272.
Harris, D.C., 2003.Quantitative Chemical Analysis.W.H.Freeman and company.
Hemond, H., 1999. Chemical Fate and Transport in the Environment. Academic
publisher, San Diego, California.
Hernández-Allica, J., Becerril JM. and Zarate O., 2006. Assessment of the efficiency of a
metal phytoextraction process with biological indicators of soil health. Plant Soil,
281,147–58.

93
Ho, Y,S., Porter, J.F. and McKay, G., 2002. Equilibrium model studies for the sorption of
divalent metal ions onto peat: copper, nickel and lead single component systems. Water
Air Soil Pollut. 141, 1–33.
Huang, J, W., Chen, J. and Berti W,B., Cunningham, S,D., 1997. Phytoremediation of
lead-contaminated soils: role of synthetic chelates in lead phytoextraction. Environ Sci
Technol. 31, 800–805
Huang, J, W. and Cunningham, S, D., 1996. Lead phytoextraction: species variation in
lead uptake and translocation. New Phytologist. 145, 75–84.
ISO 16072. 2002. Soil Quality-Laboratory Methods for Determination of Microbial Soil
Respiration.
Jaworska, J, S., Schowanek, D. and Feijtel, T., 1999. Environmental risk assessment for
EDDS, a biodegradable chelate used in detergent applications. Chemosphere. 38, 3597–
3625.
Jiang, Q. and Singh,B., 1994. Effect of different forms and sources of arsenic on crop
yield and arsenic concentration. Water, Air, Soil Pollut. 74, 321-343.
John, R., Ahmad, P. and Gadgil, K., 2009. Heavy metal toxicity: Effect on plant growth,
biochemical parameters and metal accumulation by Brassica juncea L. International
Journal of Plant Production. 3, 65-76.
Joner, E, J., Corgie, S. and Amellal N., 2002, Nutritional contributions to degradation of
polycyclic aromatic hydrocarbons in a simulated rhizosphere. Soil Biol. Biochem. 34,
859-864.
Kabata-Pendias, A., 2001. Trace elements in soils and plants. Third Edition. CRC Press,
NY.
Klumpp, E., Heitman, H. and Schwuger, M, J., 1991. Interactions in surfactant/pollutant/-
soil mineral systems. Tenside Surfactants Deterg. 28,441–6.
Koma, D., Hasumi, F. and Yamamoto, A., 2001. Biodegradation of long chain n-paraffin
from waste oil of car engine by Acinetobacter sp. J. Biosci. Bioengin. 91, 94-96.

94
Kosson, D., Kosson, T. and Van, H.,1993 Evaluation of solidification/stabilization
treatment processes for municipal waste combustion residues. EPA/600/R-93/167, Risk.
Reduction Engineering Laboratory, US Environmental Protection Agency, Cincinnati,
OH.
Kumar, P., Dushenkov, S., Motto, H. and Raskin, I., 1995. Phytoextraction: The use of
plants to remove heavy metals from soil. Environ. Sci. Technol. 29, 1232–1238.
Langmuir, I., 1918. J. Am. Chem. Soc. 40, 1361.
Lee, D., Cody, R. and Hoyle, B., 2001. Comparison of six surfactants in removing
toluene and trichlorobenzene from a sandy soil under laboratory conditions. Can.
Geotech. Journal. 38, 1329-1334.
Lestan, D,.2003. Influence of a biodegradable (EDDS) and on degradable (EDTA)
chelate and hydrogel modified soil water sorption capacity on Pb (II) phytoextraction and
leaching Plant and Soil. 253, 403–411.
Lipe, k., Sabatini, D. and Hasegawa, M., 1996. Micellar-Enhanced ultra filtration and air
stripping for surfactant- contaminant separation and surfactant reuse, Ground Water
Monit. and Remediat. 16, 85-92.
Loague, K. and Green, R.E., 1990. Criteria for evaluating pesticide leaching models.
Journal of Contaminant Hydrology. 7, 51–73.
Lombi, E., Zhao, F, J., Dunham, S, J. and McGrath, S, P., 2001. Phytoremediation of
heavy-metal contaminated soils: natural hyper accumulation versus chemically enhanced
phytoextraction. J Environ Qual. 30, 1919–1926.
Maqueda, A., 2001. Preparation and characterization of micron vermiculate, Phys Chem
Minerals. 28, 61-66.
Martell, A. E., Smith, R. and Motekaitis, R. J., 2004. Critically Selected Stability
Constants of Metal complexes, V 8.0; National Institute of Standards and Technology,
U.S. Dept. of Commerce.
McCutcheon, S. and Schnoor, J, L., 2003. Overview of phytotransformation and control
of wastes. In Phytoremediation: Transformation and Control of Contaminants, pp. 3–58.
New York: Wiley.

95
McQuaker, N., Brown, D. and Kluckner, P., 1979. Digestion of environmental materials
for analysis by inductively coupled plasma–atomic emission spectroscopy. Analytical
Chemistry. 51, 1082–1084.
MEFQ (Ministère de l'Environnement et de la Faune du Québec). 1999. Politique de
protection des sols et de réhabilitation des terrains contaminés. Québec, Canada.
Melissa, L., Whitfield, A. and Barbara, A., 2007. In situ phytoextraction of
polychlorinated biphenyl (PCB) contaminated soil, Science of the Total Environment.
374, 1–12.
Memarian. R. and Ramamurthy.A.S, 2012. Effects of surfactants on rhizodegradation of
oil in a contaminated soil. Accepted, J. Environmental Science and Health, part A,
Toxic/Hazardous Substance & Environmental Engg.
Michel, K., Roose, M. and Ludwig B., 2007. Comparison of different approaches for
modelling heavy metal transport in acidic soils, Geoderma. 140, 207–214.
Myers, D., 2006. Surfaces science and technology, Third Edition, Wiley – Vch press.
Nowak, B., 2002. Environmental chemistry of aminopolycarboxylate chelating agents.
Environmental Science and Technology. 36, 4009-4016.
Papageorgiou, S., Katsaros, F. and Evangelos P., 2006.Heavy metal sorption by calcium
alginate beads from Laminaria digitata. Journal of Hazardous Materials B.137, 1765–
1772.
Pignatello, J.J., 2000. The measurement and interaction of sorption and sorption rates of
organic compounds in soil media. Advances in Agronomy. 69, 1-73.
Pilon-Smits, E., 2005. Phytoremediation. Plant Bio. 56, 15–39. Sandrin
Rammaurthy.A.S, and Memarian. R., 2011.Phytoremediation of Mixed Soil
Contaminants. Water Air Soil Pollut. Accepted, (printed as DOI 10.1007/s11270-011-
0878-6).
Ramamurthy, A., Vo, D., Li, X., and Qu, J.,2008. Surfactantenhanced removal of Cu (II)
and Zn (II) from a contaminated sandy soil. Water Air and Soil Poll. 190, 197–207.

96
Reeves, R.D., 1992. The Hyper accumulation of Ni by serpentine plants. , Hampshire,
UK, pp 253-277.
Roane, T, M., Josephson, K.L. and Pepper, I, L., 2001. Dual-Bioaugmentation Strategy to
Enhance Remediation of Co-contaminated Soil, Application Environment Microbiol.67,
3208-3215.
Rosen, M.J., 1989. Surfactants and interfacial phenomena. John Wiley & Sons, New
York, pp.125−431.
Roy, S., 2005. Phytoremediation of heavy metal and PAH-contaminated Brownfield
sites, Plant and Soil. 272, 277–290.
Safwan, S., Jian, C. and Fengxiang, X., 2008. Phytotoxicity of mercury in B. juncea
(Brassica juncea L.). Ecotoxicology and Environmental Safety.72, 619–625.
Sandrin, T. and Maier RM., 2003. Impact of Metals on the Biodegradation of Organic
Pollutants. Environmental Health Perspectives. 111, 1093 -1101.
Santanu, P., 2008. Surfactant-enhanced remediation of organic contaminated soil and
water. Advances in Colloid and Interface Science. 138, 24–58.
Sharma, H. and Reddy, K.R., 2004. Geoenvironmental Engineering: Site Remediation,
Waste Containment, and Emerging Waste Management Technologies. Wiley, Hoboken,
NJ.
Soon, A., Dae, S. and Min, W., 2006. Toxicity of phenanthrene dissolved in non-ionic
surfactant solutions to Pseudomonas putida P2. FEMS Microbiology Letters, 267, 194–
199.
Tandy, S., Schulin, R. and Nowack, B., 2006. The influence of EDDS on the uptake of
heavy metals in hydroponically grown sunflowers. Chemosphere. 62, 1454–1463.
Tarnawski, V.R., Momose, T., Leong W. H.,Bovesecchi, G. and Coppa, P.2009. Thermal
Conductivity of Standard Sands. Part I. Dry-State Conditions. Int J Thermophys .
30,949–968.
Thayalakumaran,T., Robinson, B,H.,Vogeler, I., Scotter, D.R. and Clothier, B., 2003.
Plant uptake and leaching of copper during EDTA-enhanced phytoremediation of
repacked and undisturbed soil, Plant and Soil. 254,415- 423.

97
Tsotsis, T., Yang, L., Shahrivari,Z. and Sahimi,M., 2005. Removal of Trace Levels of
Arsenic and Selenium from Aqueous Solutions by Calcined and Uncalcined Layered
Double Hydroxides (LDH). Ind. Eng. Chem. Res.44, 6804-6815.
U.S.EPA., 2006. In Situ Treatment Technologies for Contaminated Soil.
Phytotechnologies.
U.S. EPA., 2004. Cleaning up the nation's waste sites: Markets and technology trends.
Rep. 542-R-04-015. Available at www.clu-in.org/download/market/2004market.pdf.
Washington, DC.
U.S.EPA., 2003a. Comprehensive Environmental Response, Compensation, and liability
information System (CERCLIS), Office of Emergency and Remedial Response.
U.S. EPA., 2001, Introduction to used motor oil. 530-K-02-0251. Washington, DC.
U.S. EPA., 2000. Introduction to Phytoremediation (EPA/600/R-99/107). National Risk
Management Research Laboratory.
U.S. EPA., 1998.A Citizen’s Guide to Phytoremediation.
U.S. EPA., 1998. Method 6020a. Inductively coupled plasma – mass spectrometry.
United States Environmental Protection Agency. Washington, DC.
Vanhala, P.and Tamminen P., 2005, Relationship between Basal Soil Espiration Rate,
Tree Stand and Soil Characteristics in Boreal Forests, Environmental Monitoring and
Assessment. 101, 85–92.
Vassil, A.D., Kapulnik, Y., Raskin, I. and Salt, D., 1998. The Role of EDTA in Pb
Transport and Accumulation by Indian mustard. Plant Physiology. 117, 447- 453.
Vervaeke, P., Luyssaert, S. and Mertens, J., 2003. Phytoremediation prospects of willow
stands on contaminated sediment: a field trial. Environ Pollut. 126, 275-282.
Vo,D., Ramamurthy, A, S., Qu,J .and Zhao,X,P., 2008. Containment wells to form
hydraulic barriers along site boundaries. J. Hazardous Materials. 160, 240–243
Weber. W.J, McGinley.P. and Katz, L., 1990. Sorption processes and their effects on
contaminant fate and transport in subsurface systems, Distinguished Lecture Series,
Association of Environmental Engineering Professors.

98
Wehrhan, A., Kasteel, R., Jirka Simunek, J. and Groeneweg, J.,2007. Transport of
sulfadiazine in soil columns Experiments and modelling approaches, J. Contaminant
Hydrology. 89 , 107–135.
Willumsen, P., Karlson, U. and Pritchard, P., 1998. Response of fuoranthene-degrading
bacteria to surfactants. Apply Microbial Biotechnology. 50,475-483.
Wu, Y,M., Lu. X.R.. and Xing, P.,2004. EDTA-enhanced phytoremediation of heavy
metal contaminated soil with Indian mustard and associated potential leaching risk,
Agriculture, Ecosystems and Environment. 102, 307–318.

99
Appendix The following section included tabulated data related to the graphs in chapters 4 and 5.
Table A.1 Effect of chelates on Cd (II) and Pb (II) leachate (mg/kg)
Additives Cd (II) Pb (II)
Control ( C 2) 0.7 ± 0.03 0
EDDS (mmol/kg)
0.5 1.8 ± 0.1 5.2 ± 1.5
1 3.3 ± 0.4 7.1 ± 4.3
2 3.9 ± 1.1 19.7 ± 5.5
EDTA (mmol/kg)
0.5 2.6 ± 0.6 22.2 ± 3.6
1 4.3 ± 1.1 37.9 ± 5.3
2 4.6 ± 1.2 56.5 ± 8.6
Table A.2 Effect of chelates on rhizodegradation of the oil (mg/kg)
Additives Residual oil
in soil
Control ( C 2) 308.5 ± 16.5
EDDS (mmol/kg)
0.5 262.7 ± 16.6
1 238.3 ± 28.2
2 150.4 ± 12
EDTA (mmol/kg)
0.5 298.4 ± 44.3
1 254.6 ± 28.2
2 226.5 ± 39.5

100
Table A.3 Influence of chelates on basal soil respiration
(g C g -1
DW soil h -1
)
Additives BSR
Initial value 1.1 ± 0.14
Fin
al v
alue
Control ( C 2) 2.44 ± 0.25
EDDS (mmol/kg)
0.5 1.22 ± 0.24
1 0.66 ± 0.16
2 0.39 ± 12
EDTA (mmol/kg)
0.5 1.54 ± 0.3
1 1.12 ± 0.24
2 1.07 ± 0.32
Table A.4 Effect of surfactants on root Pb (II) in plants (103mg/kg)
Additives Pb (II) in root
Control ( C 2) 5.72 ± 1.2
Triton X-100
(CMC)
0.5 6.10 ± 2.2
1 11.16 ± 2.1
2 18.27 ± 1.5
Tween 80
(CMC)
0.5 5.90 ± 1.4
1 8.50 ± 2.4
2 11.2 ± 4.7

101
Table A.5 Effect of surfactants on Cd (II) and Pb (II) leachate (mg/kg)
Additives Cd (II) Pb (II)
Control ( C 2) 0.7 ± 0.03 0
Triton X-100
(CMC)
0.5 0.8 ± 0.4 0
1 1.2 ± 0.29 5.4 ± 1.1
2 2.5 ± 0.1 12.75 ± 2.1
Tween 80
(CMC)
0.5 0.6 ± 0.24 0
1 1.1 ± 0.68 3.8 ± 1.7
2 1.6 ± 0.24 5.1 ± 0.9
Table A.6 Effect of surfactants on rhizodegradation of the oil (mg/kg)
Additives Residual oil
in soil
Control ( C 1) 362.2 ± 17.6
Control ( C 2) 308.5 ± 16.5
Triton X-100
(CMC)
0.5 254.5 ± 23.2
1 295.2 ± 47.2
2 317.7 ± 24.2
Tween 80
(CMC)
0.5 287.3 ± 14.6
1 187.5 ± 18.5
2 124.6 ± 11.7

102
Table A.7 Influence of surfactants on basal soil respiration
(g C g -1
DW soil h -1
)
Additives BSR
Initial value 1.1 ± 0.14
Fin
al v
alue
Control ( C 2) 2.44 ± 0.25
Triton X-
100
(CMC)
0.5 2.29 ± 0.22
1 2.36 ± 0.66
2 2.86 ± 0.42
Tween 80
(CMC)
0.5 1.95 ± 0.23
1 1.07 ± 0.15
2 0.8 ± 0.12