pierce county community health assessment 2019
TRANSCRIPT

Pierce County Community Health Assessment 2019
i
Overview In 2018, Tacoma-Pierce County Health Department, MultiCare Health System, CHI Franciscan Health and Kaiser Permanente launched a comprehensive community health planning and assessment process. Undertaken in collaboration with a wide range of community partners, the overall aim of this work was to identify key areas where the community can act to improve community health and address health equity. The assessment also fulfills public health accreditation and healthcare regulatory requirements.
Building healthy and fair spaces and places for all.
We will lead the region in growing healthier spaces and places.
Our processes will be collaborative, communicative, data-driven and based on listening, engagement and observation.
CHI Franciscan Health: Laurie Brown and Doug Baxter.
Kaiser Permanente: Victoria Garcia.
MultiCare Health System: Lois Bernstein, Kristin Gilman and Dr. Jamilia Sherls.
Tacoma-Pierce County Health Department: Tommy George, Cindan Gizzi, Karen Meyer, Ingrid Payne and Emily Turk.
Pierce County Community Health Assessment 2019
ii
We thank the many community members who gave their time to complete surveys and participate in community workshops.
We acknowledge the following individuals and organizations who contributed to this report:
• Pierce County Accountable Communities of Health Community Voice Council. • Bates Technical College. • Black Infant Health Program (Tacoma-Pierce County Health Department). • City of Tacoma. • City of Lakewood. • City of Puyallup. • Community Health Care. • Eatonville Community Coalition. • Exceptional Families Network. • Foundation for Healthy Generations, Community Health Advocates. • Graham Community Coalition. • Key Peninsula Violence Prevention Coalition. • Korean Women’s Association. • Pacific Lutheran University. • Pierce College. • Pierce County. • Pierce County Cities and Towns Association. • Pierce County Human Services. • Pierce County Community Health Workers Collaborative. • Pierce County Library System. • Pierce Transit. • Prairie Ridge Coalition. • Rainbow Center. • Tacoma Pierce County League of Women Voters. • University of Puget Sound.
This list includes organizations who supported community workshops and/or promoted the 2018 Community Survey. We apologize if we unintentionally missed anyone.

Pierce County Community Health Assessment 2019
iii
Executive Summary Tacoma-Pierce County Health Department, in partnership with CHI Franciscan, MultiCare Health System, Kaiser Permanente and University of Washington – Tacoma conducted a Community Health Assessment to identify key health issues based on current data. This Community Health Assessment includes the results of a comprehensive review of key health indicator data and community input, to understand and address the needs of this specific community.
Within this report, the term “community” refers to residents who live, learn, work or play in Pierce County.
This report presents data on:
• Community demographics. • Life expectancy and leading causes of death. • Chronic illness, including behavioral health. • Injury and violence.
Additionally, the Community Health Assessment process included asking community members about the health of their community, what they need in their neighborhoods to be healthy and what they think could be improved. These community engagement activities included 10 community workshops with residents, 10 interviews with local organizational leaders and an online community survey. MultiCare Health System, CHI Franciscan and Tacoma-Pierce County Health Department pledge to engage community stakeholders throughout the Community Health Assessment process, not simply as sources of input, but as equal partners with shared accountability and investment in addressing health concerns.
Throughout the CHA process, social determinants of health provided the framework for both the community engagement process and to focus attention on the importance of neighborhood and community conditions. Income, education, housing and transportation create opportunities or barriers to health. Health should not be determined by zip code, income, race or any other factor. Healthy choices should be easy choices for everyone in Pierce County.

Pierce County Community Health Assessment 2019
iv
Contents Introduction .......................................................................................................................................................................... 1
Purpose ........................................................................................................................................................................................... 1
Methods .......................................................................................................................................................................................... 1
Limitations ...................................................................................................................................................................................... 2
Community Engagement ........................................................................................................................................................... 2
Community Workshops ............................................................................................................................................................. 3
Community Survey ...................................................................................................................................................................... 4
Description of Pierce County ............................................................................................................................................ 6
Demographic Characteristics ................................................................................................................................................... 6
Socioeconomic Characteristics ................................................................................................................................................ 7
Behavioral Health ...................................................................................................................................................................... 12
Substance Abuse and Dependency ..................................................................................................................................... 22
Life Expectancy........................................................................................................................................................................... 27
Chronic Disease .......................................................................................................................................................................... 31
Health Behaviors ........................................................................................................................................................................ 36
Social Connections .................................................................................................................................................................... 43
Access to Care and Use of Clinical Preventive Services ................................................................................................ 44
Injury and Violence Prevention .............................................................................................................................................. 47
Supplement ....................................................................................................................................................................... 54
Quantitative Data Sources ...................................................................................................................................................... 54
Quantitative Methods ............................................................................................................................................................... 56
Selection of Priority Health Needs ....................................................................................................................................... 58
Appendix 1—Community Workshop Summary ........................................................................................................ 59
Workshop Methods .................................................................................................................................................................. 59
Participant Selection Criteria .................................................................................................................................................. 59
What We Heard—Major Themes ......................................................................................................................................... 59
Appendix—2 Forces of Change .................................................................................................................................... 62
Overview ...................................................................................................................................................................................... 62
Appendix—3 Communities of Focus............................................................................................................................ 64
Health Equity in Action ............................................................................................................................................................ 64
Community Snapshots ............................................................................................................................................................. 64

Pierce County Community Health Assessment 2019
1
Introduction The Community Health Assessment (CHA) process included quantitative analysis and qualitative interviews and focus groups with community leaders and residents of Pierce County representing many sectors and population groups, including low-income residents and others affected by health disparities.
Purpose The purpose of this report is to share the emerging health needs of Pierce County, including:
• What residents have to say about health and community perceptions. • Health behaviors and health outcomes of residents. • This report contains information that can be used to respond to an evolving community and new
challenges.
Methods To develop this report, an array of data sources was analyzed to describe the health of the community. These included:
• Community workshops. • Community survey. • Forces of change assessment. • Selected health indicators.
The report summarizes:
• Community characteristics. • Life expectancy. • Leading causes of death. • Leading causes of hospitalizations. • Levels of chronic illness. • Access to healthcare and use of preventive services. • Maternal and child health. • Injury and violence prevention. • Behavioral health.
Details about the sources and methods used to develop this report can be found in the Supplement.
Pierce County Community Health Assessment 2019
2
Limitations For this report, we highlighted data from focus groups, interviews and surveys. While some survey results can be weighted to improve generalizability, focus group and interview results are not entirely generalizable and there are limitations to the strength of the conclusions. Survey data often have issues arising from how, where and from whom the data were collected. For example, stratifying estimates sometimes cannot be done due to small sample sizes.
Community Engagement We used 3 methods of community engagement to gather input from Pierce County residents about what makes their community healthy, what they need in their neighborhoods and what they think could be improved:
• Community workshops. • Forces of change assessment workshops. • Online surveys.
Activities included 10 community workshops with residents, 10 interviews with local organizational leaders and an online community survey. The online survey was available to residents in English, Spanish and Korean.
Top findings across the 3 community engagement activities included the following important issues.
• Community characteristics seen as vital to health: o Equitable access to community resources (information, services, activities, parks). o Diversity is celebrated. o People working together.
• What residents need in their neighborhood or community to be healthy: o Affordable housing. o Access to healthy food. o Transportation. o Access to healthcare (emphasizing behavioral health services).
Residents played an active role in community engagement activities, like reviewing questions used for workshops and community surveys and reviewing the summary of results from the interviews and workshops, they participated in. Professional translation services were used to provide the first survey drafts in Korean and Spanish. The drafts were then shared with community members who speak Korean and Spanish natively to confirm contextual accuracy.
Pierce County Community Health Assessment 2019
3
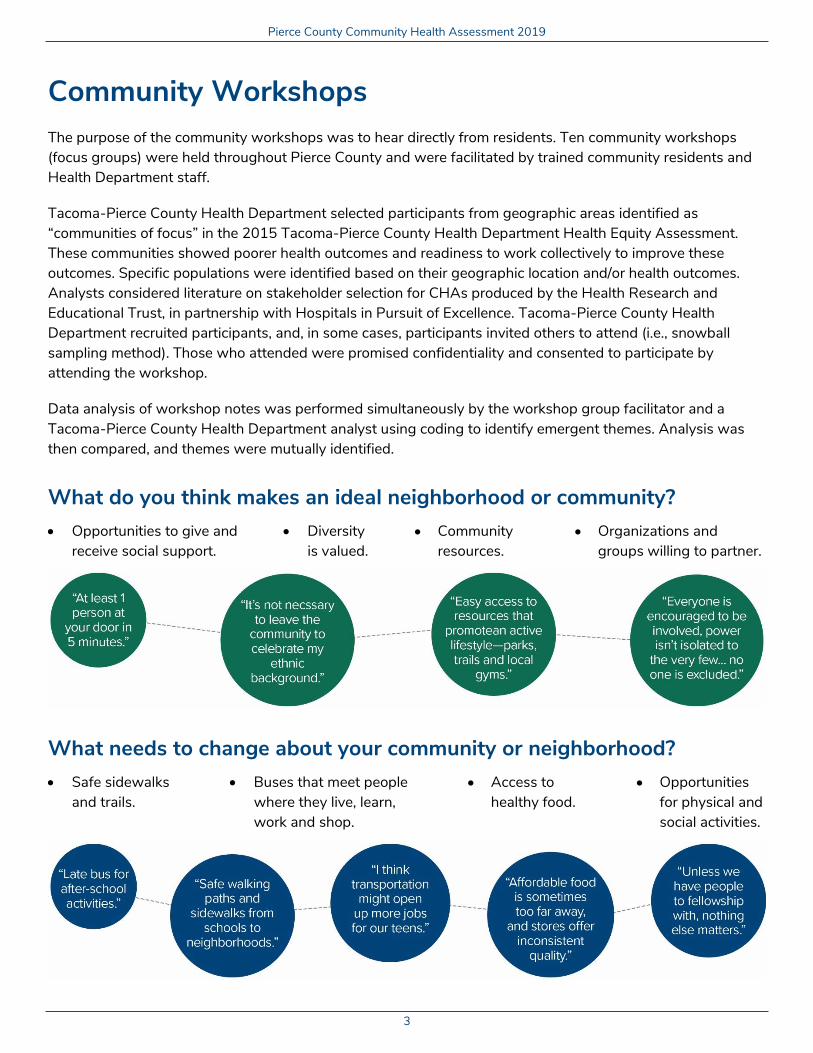
Community Workshops The purpose of the community workshops was to hear directly from residents. Ten community workshops (focus groups) were held throughout Pierce County and were facilitated by trained community residents and Health Department staff.
Tacoma-Pierce County Health Department selected participants from geographic areas identified as “communities of focus” in the 2015 Tacoma-Pierce County Health Department Health Equity Assessment. These communities showed poorer health outcomes and readiness to work collectively to improve these outcomes. Specific populations were identified based on their geographic location and/or health outcomes. Analysts considered literature on stakeholder selection for CHAs produced by the Health Research and Educational Trust, in partnership with Hospitals in Pursuit of Excellence. Tacoma-Pierce County Health Department recruited participants, and, in some cases, participants invited others to attend (i.e., snowball sampling method). Those who attended were promised confidentiality and consented to participate by attending the workshop.
Data analysis of workshop notes was performed simultaneously by the workshop group facilitator and a Tacoma-Pierce County Health Department analyst using coding to identify emergent themes. Analysis was then compared, and themes were mutually identified.
What do you think makes an ideal neighborhood or community? • Opportunities to give and
receive social support. • Diversity
is valued. • Community
resources. • Organizations and
groups willing to partner.
What needs to change about your community or neighborhood? • Safe sidewalks
and trails. • Buses that meet people
where they live, learn, work and shop.
• Access to healthy food.
• Opportunities for physical and social activities.

Pierce County Community Health Assessment 2019
4
Community Survey The purpose of the community survey is to hear directly from residents for the Pierce County Community Survey (see Methods section). The purpose of the survey was to better understand the community’s views on issues related to healthcare services, economic opportunity, health problems and concerns, and other issues that impact community health. When asked to rate the overall health of the community, 78% of survey participants rated it as healthy (ranging from somewhat healthy to very healthy). Perceptions of community health can be associated with many factors, like education, poverty, health systems, public and social services and other conditions.
1,620 Pierce County residents responded to the community survey.1
Nearly ⅔ of those who participated selected safe neighborhoods and affordable housing as their most important community needs, followed by access to healthcare services. When asked about resources available to meet these needs, residents identified parks and outdoor spaces, easily accessible grocery stores and markets as well as safety resources like street lighting and police presence. Survey participants were also asked what is lacking to meet identified needs. From the list provided, residents selected policies that address local needs, accessible public transit and community resources that contribute to safety like street lighting, police presence and neighborhood watches. Residents also indicated that policies to protect air and water quality are important and needed.
Residents reported that the top issues facing children and youth include exposure to crime and violence, poverty and lack of positive relationships.
Most Important Community Needs Community Perceptions
Question Responses
Very healthy
Healthy Somewhat
healthy Somewhat unhealthy
Very unhealthy
How would you rate your community’s overall health?
2.7% 27.0% 51.9% 17.1% 2.0%
Question Responses
Very satisfied
Somewhat satisfied
Neutral Somewhat unsatisfied
Very unsatisfied
How satisfied are you with your community?
28.8% 46.0% 11.8% 10.4% 3.0%
1 Community Survey respondents by language—English: 1,565; Korean: 41; Spanish: 14.

Pierce County Community Health Assessment 2019
5
Question Responses
Very connected
Somewhat connected Neutral
Somewhat unconnected
Very unconnected
How connected do you feel to your community?
22.5% 45.6% 16.0% 10.5% 5.4%
Who answered the survey? Respondents’ most common zip codes were:
• 98405 (Central Tacoma)— 6%. • 98406 (North Tacoma)—6%. • 98391 (Lake Tapps, Bonney Lake)—5%. • 98404 (East Tacoma)—5%. • 98407 (North Tacoma, Ruston)—5%.
Efforts were made to distribute the survey to a representative sample of Pierce County residents (by age, race, gender, ethnicity). However, survey participants were disproportionately female and 30 to 60 years old. The n value of demographics for survey respondents is 1,620.
Pierce County Community Health Assessment 2019
6
Description of Pierce County This section describes the entirety of Pierce County using demographic and socioeconomic characteristics. Residents are mostly white (67%), followed by Hispanic (10%), Asian (6%), black (6%) and multiracial (6%) with an increasing number of adults 55 to 74 years old. Immigrants in Pierce County originate from Asia, Latin America and Europe.
8% of Pierce County residents experience poverty versus 13% statewide with significant variations geographically.
Poverty is most prevalent among residents who are American Indian or Alaska Native (25%), Hispanic (24%), and among those who selected “other” for race/ethnicity (27%). These groups are twice as likely as white residents (11%) to experience poverty and reported having high housing costs (greater than 30% of household income) contributing to their poverty status. 43.3% of students last year were eligible for free or reduced-price lunch. This was just slightly higher the state average (42.3%).
The percent of community members living with a disability (13%) is also slightly higher than the state average (12%).
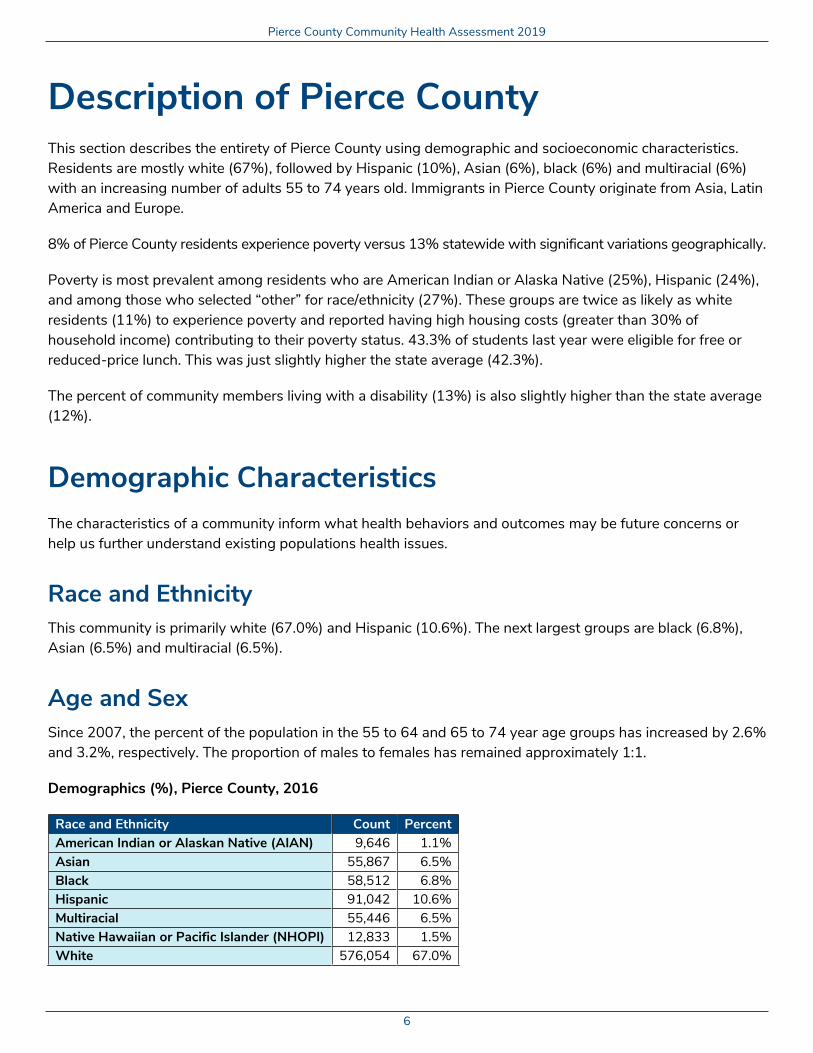
Demographic Characteristics The characteristics of a community inform what health behaviors and outcomes may be future concerns or help us further understand existing populations health issues.
Race and Ethnicity This community is primarily white (67.0%) and Hispanic (10.6%). The next largest groups are black (6.8%), Asian (6.5%) and multiracial (6.5%).
Age and Sex Since 2007, the percent of the population in the 55 to 64 and 65 to 74 year age groups has increased by 2.6% and 3.2%, respectively. The proportion of males to females has remained approximately 1:1.
Demographics (%), Pierce County, 2016
Race and Ethnicity Count Percent American Indian or Alaskan Native (AIAN) 9,646 1.1% Asian 55,867 6.5% Black 58,512 6.8% Hispanic 91,042 10.6% Multiracial 55,446 6.5% Native Hawaiian or Pacific Islander (NHOPI) 12,833 1.5% White 576,054 67.0%

Pierce County Community Health Assessment 2019
7
Sex Count Percent Female 435,513 50.7% Male 423,887 49.3%
Age (Years) Count Percent Under 1 11,995 1.4% 1-4 47,938 5.6% 5-14 115,754 13.5% 15-24 108,888 12.7% 25-34 117,140 13.6% 35-44 109,851 12.8% 45-54 114,446 13.3% 55-64 112,966 13.1% 65-74 74,921 8.7% 75-84 31,772 3.7% 85+ 13,730 1.6%
Source: Washington State Office of Fiscal Management, Forecasting Division.
Socioeconomic Characteristics The social and economic characteristics of a community help public health stakeholders understand available resources and improve community health. Poverty, homelessness and the cost of housing are some examples of important socioeconomic characteristics.
On-Time Graduation The graduation rate helps describe the educational wellbeing of a community. A higher educational level helps people take advantage of employment opportunities and earn higher incomes, which helps to diminish the burden of poverty on a community.
The 2017 4-year graduation rate, gathered from Office of Superintendent of Public Instruction (OSPI) data, in Pierce County was higher (82%) than Washington State (79%).
Poverty and Near Poverty Poverty—household income less than 100% of the federal poverty limit (FPL)—and near poverty—household income less than 200% of FPL—is a significant burden on households and communities, hindering access to resources promoting good health.
8% of Pierce County residents experienced poverty versus 13% statewide with significant variations geographically.

Pierce County Community Health Assessment 2019
8
Poverty by Zip Code, Pierce County, 2016
Source: United States Census Bureau, 2016 American Community Survey (ACS) 5-year estimates, S1701.
High Housing Costs Seattle was one of the fastest growing United States cities in 2018, driving up housing prices and displacing lower-income residents throughout the area, including Tacoma2 and Pierce County. A housing cost greater than 30% of household income can be a hardship on individuals and families, especially as persistent poverty continues amidst rising property costs. Housing costs are typically more burdensome among renters.
Poverty and Housing Costs (%), Pierce County, 2016
Income Level Count Percent Poverty (<100% PL) 103,562 13% Near Poverty (>200% FPL) 237,408 29%
2 www.census.gov/newsroom/press-releases/2018/estimates-cities.html.
Pierce County Community Health Assessment 2019
9
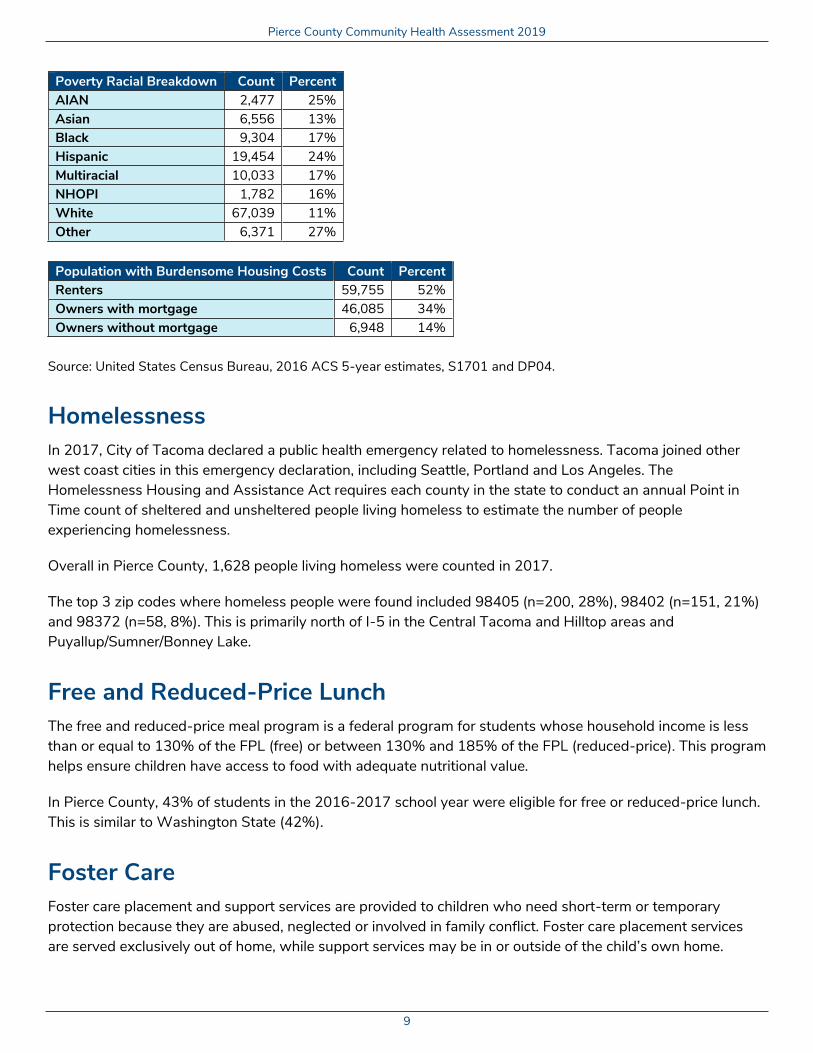
Poverty Racial Breakdown Count Percent AIAN 2,477 25% Asian 6,556 13% Black 9,304 17% Hispanic 19,454 24% Multiracial 10,033 17% NHOPI 1,782 16% White 67,039 11% Other 6,371 27%
Population with Burdensome Housing Costs Count Percent Renters 59,755 52% Owners with mortgage 46,085 34% Owners without mortgage 6,948 14%
Source: United States Census Bureau, 2016 ACS 5-year estimates, S1701 and DP04.
Homelessness In 2017, City of Tacoma declared a public health emergency related to homelessness. Tacoma joined other west coast cities in this emergency declaration, including Seattle, Portland and Los Angeles. The Homelessness Housing and Assistance Act requires each county in the state to conduct an annual Point in Time count of sheltered and unsheltered people living homeless to estimate the number of people experiencing homelessness.
Overall in Pierce County, 1,628 people living homeless were counted in 2017.
The top 3 zip codes where homeless people were found included 98405 (n=200, 28%), 98402 (n=151, 21%) and 98372 (n=58, 8%). This is primarily north of I-5 in the Central Tacoma and Hilltop areas and Puyallup/Sumner/Bonney Lake.
Free and Reduced-Price Lunch The free and reduced-price meal program is a federal program for students whose household income is less than or equal to 130% of the FPL (free) or between 130% and 185% of the FPL (reduced-price). This program helps ensure children have access to food with adequate nutritional value.
In Pierce County, 43% of students in the 2016-2017 school year were eligible for free or reduced-price lunch. This is similar to Washington State (42%).
Foster Care Foster care placement and support services are provided to children who need short-term or temporary protection because they are abused, neglected or involved in family conflict. Foster care placement services are served exclusively out of home, while support services may be in or outside of the child’s own home.

Pierce County Community Health Assessment 2019
10
Of the 6,200 children who entered out-of-home care in Washington state in 2017, 1,009 were in Pierce County, making it the county with the highest number of children entering care.
Within Pierce County, the rate of children living in out-of-home care was 7.4 per 1,000, which was 35% higher than the Washington State rate of 5.5 kids per 1,000.3
Immigrants (Foreign-Born) Immigrants are a sizable proportion of Washington’s population, contributing to diverse community demographics. Estimates of the number of immigrants currently in the United States vary widely depending on their immigration status. Data collected as part of the United States Census help estimate this number.
Foreign-Born Residents (%), Pierce County, 2012-2016
Region of Birth Count Estimate 95% Confidence Interval (CI) Asia 34,729 43.8% (42.7%-45.0%) Latin America 21,532 27.2% (25.8%-28.6%) Europe 15,527 19.6% (18.3%-20.9%) Africa 2,841 3.6% (2.9%-4.3%) North America 2,840 3.6% (3.1%-4.0%) Oceania 1,771 2.2% (1.8%-2.7%) Total* 79,240 9.2% n/a
*Percent of total population in Pierce County. Source: United States Census Bureau, 2016 ACS 5-year estimates, DP02 (foreign-born population, excluding born at sea).
Languages Spoken English continues to be the most common language spoken in the community, followed by Spanish.
Top 10 Languages Spoken (%), Pierce County, 2012-2016
Language Estimate 95% CI English 81.1% (81.0%-81.2%) Spanish 8.4% (8.3%-8.4%) Chinese 1.4% (1.3%-1.4%) Vietnamese 0.9% (0.9%-1.0%) Russian 0.9% (0.8%-0.9%) Tagalog 0.9% (0.8%-0.9%) Korean 0.7% (0.7%-0.8%) African Language 0.6% (0.6%-0.7%) German 0.5% (0.4%-0.5%) Other Pacific Island Language 0.5% (0.4%-0.5%)
Source: United States Census Bureau, 2016 ACS 5-year estimates, B16001.
3 Partners for our children. pocdata.org/content-data/data/county-reports/county_report_Pierce.pdf. Accessed Dec. 28, 2018.
Pierce County Community Health Assessment 2019
11
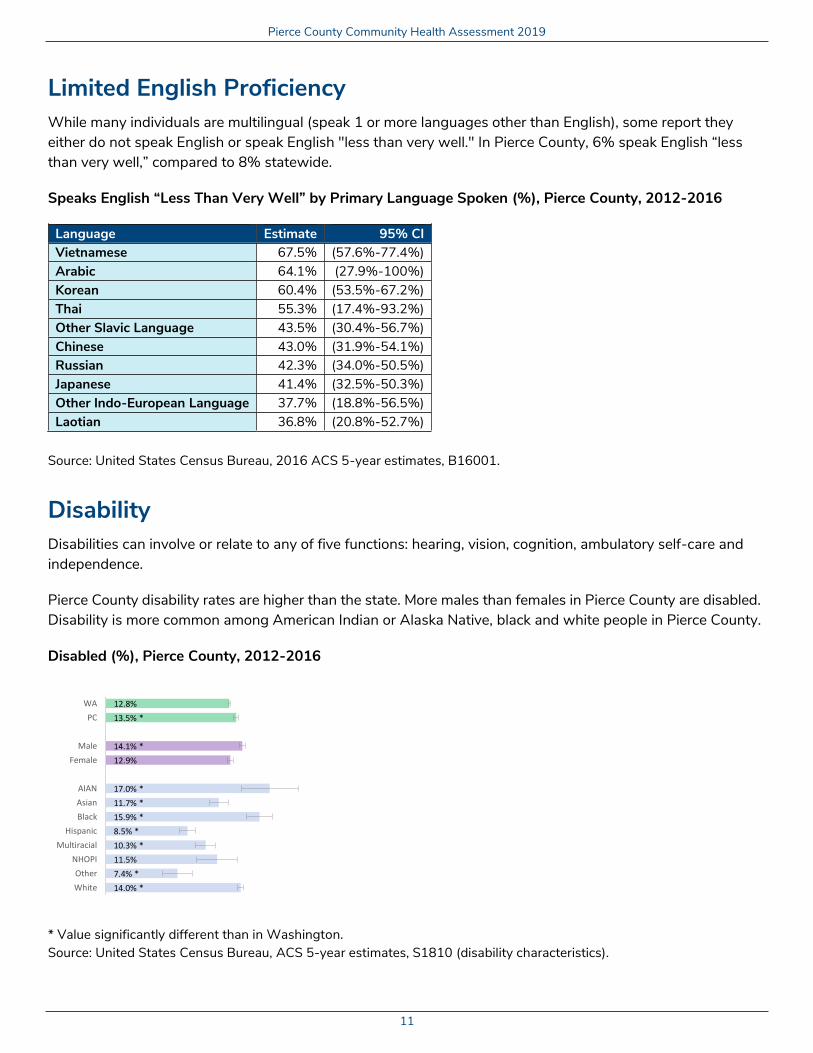
Limited English Proficiency While many individuals are multilingual (speak 1 or more languages other than English), some report they either do not speak English or speak English "less than very well." In Pierce County, 6% speak English “less than very well,” compared to 8% statewide.
Speaks English “Less Than Very Well” by Primary Language Spoken (%), Pierce County, 2012-2016
Language Estimate 95% CI Vietnamese 67.5% (57.6%-77.4%) Arabic 64.1% (27.9%-100%) Korean 60.4% (53.5%-67.2%) Thai 55.3% (17.4%-93.2%) Other Slavic Language 43.5% (30.4%-56.7%) Chinese 43.0% (31.9%-54.1%) Russian 42.3% (34.0%-50.5%) Japanese 41.4% (32.5%-50.3%) Other Indo-European Language 37.7% (18.8%-56.5%) Laotian 36.8% (20.8%-52.7%)
Source: United States Census Bureau, 2016 ACS 5-year estimates, B16001.
Disability Disabilities can involve or relate to any of five functions: hearing, vision, cognition, ambulatory self-care and independence.
Pierce County disability rates are higher than the state. More males than females in Pierce County are disabled. Disability is more common among American Indian or Alaska Native, black and white people in Pierce County.
Disabled (%), Pierce County, 2012-2016
* Value significantly different than in Washington. Source: United States Census Bureau, ACS 5-year estimates, S1810 (disability characteristics).
12.8%
13.5% *
14.1% *
12.9%
17.0% *
11.7% *
15.9% *
8.5% *
10.3% *
11.5%
7.4% *
14.0% *
WA
PC
Male
Female
AIAN
Asian
Black
Hispanic
Multiracial
NHOPI
Other
White
Pierce County Community Health Assessment 2019
12
Behavioral Health Mental health is essential to a person's wellbeing and ability to live a full and productive life. People of all ages, including children and adolescents, with untreated mental health disorders are at an elevated risk for co-occurring disorders, including substance abuse and dependency. Continuing to support systems and policies committed to addressing these concerns can help improve the lives of those who experience mental health issues and strengthen our community. As part of these efforts, Wellfound Behavioral Health Hospital was developed by partners MultiCare Health System and CHI Franciscan, in direct response to increasing rates of mental health and substance abuse disorders (including opiate abuse) among Pierce County residents.
In Pierce County, 5% of adults have experienced, or are experiencing, serious mental illness, which is higher than the Washington State average (3%).
Youth are experiencing depression at rates comparable to Washington State, while adults in Pierce County are experiencing depression at rates higher than the state average. Females are reporting depression at about twice the rate of males (among youth and adults).
Pierce County youth reported similar levels of suicidal ideation as the state average. Females are more likely than males to report suicidal ideation in the past year. Suicide ideation is more common among Multiracial youth, American Indian or Alaska Native and Native Hawaiian or Pacific Islander youth. Pierce County youth reported receiving less education about suicide than the state average. There is no difference in the percent of youth reporting suicide attempts in Pierce County than in Washington.
Youth bullying in Pierce County occurs at similar rates as the state. Female youth reported more frequently being a victim of bullying than male youth. American Indian or Alaska Native and multiracial youth reported being a victim of bullying most frequently.
It is important to note that the Wellfound Behavioral Health Hospital was cooperatively proposed and developed in direct response to increasing mental health and substance abuse disorder needs. Reported binge drinking occurred at higher rates by Hispanic and white adults, and among those 25 to 34 years old. Reported marijuana use is highest among adults 18 to 24 years old. Males, multiracial and Native Hawaiian or Pacific Islander adults are more likely to consume marijuana. Black youth are more likely to consume marijuana than their peers.
Serious Mental Illness The percent of adults with serious mental illness (SMI) is estimated based on a Kepler-6 (K-6) psychological distress scale score of 14 or higher.
SMI is more common in Pierce County than Washington. There are no significant differences by gender or race. Adults older than 65 years are less likely to report SMI than all other age groups.

Pierce County Community Health Assessment 2019
13
Serious Mental Illness—Adults (%), Pierce County, 2012-2016
* Value significantly different than in Washington. ! Relative standard error greater than 30%. Source: Behavioral Risk Factor Surveillance System (BHRFSS).
Depression—Youth Youth are considered to have been depressed when they reported feeling so sad or hopeless almost every day for 2 weeks in a row or more that they stopped doing some usual activities in the past 12 months.
The prevalence of reported youth depression is not significantly different between Pierce County and the state. Females are more likely than males to report depression. There is no significant difference between races.
Self-Reported Depression—Youth (%), Pierce County, 2016
* Value significantly different than in Washington. ! Relative standard error greater than 30%. Source: Healthy Youth Survey (HYS) (10th graders).
3.8%5.0% *
4.4%5.5% *
11.2% !6.0% !5.9% !5.0% !12.6% ! *19.3% !4.3%
7.6%4.7%6.2%4.2%6.4% *1.8% *
WAPC
MaleFemale
AIANAsianBlack
HispanicMultiracial
NHOPIWhite
18-2425-3435-4445-5455-64
65+
34.5%
36.9%
24.6% *
48.2% *
41.4%
38.8%
34.5%
39.8%
43.6% *
36.7%
34.7%
WA
PC
Male
Female
AIAN
Asian
Black
Hispanic
Multiracial
NHOPI
White

Pierce County Community Health Assessment 2019
14
Depression—Adults Depression diagnoses among adults are self-reported through the BHRFSS.
Adult depression is more common in Pierce County than in Washington. Females are more likely to report depression than males. There is no significant difference by race. Adults 65 years and older are less likely than all other age groups to have diagnosed depression.
Diagnosed Depression—Adults (%), Pierce County, 2012-2016
* Value significantly different than in Washington. ! Relative standard error greater than 30%. Source: BHRFSS.
Anxiety—Youth Anxiety among youth is measured as feeling nervous, anxious or on edge in the past 2 weeks using the HYS.
Youth anxiety prevalence is not significantly different in Pierce County than in the state. Females are more likely to report anxiety than males. Black and Hispanic youth are less likely than Asian and white youth to report anxiety.
22.0%23.9% *
16.9% *30.7% *
32.3%15.6%26.5%20.3%29.9%22.2% !24.4% *
22.3%23.6%25.3%25.2%28.4% *17.8% *
WAPC
MaleFemale
AIANAsianBlack
HispanicMultiracial
NHOPIWhite
18-2425-3435-4445-5455-64
65+
Pierce County Community Health Assessment 2019
15
Anxiety Some to All Days (%), Pierce County, 2012-2016
* Value significantly different than in Washington. Source: HYS (10th graders).
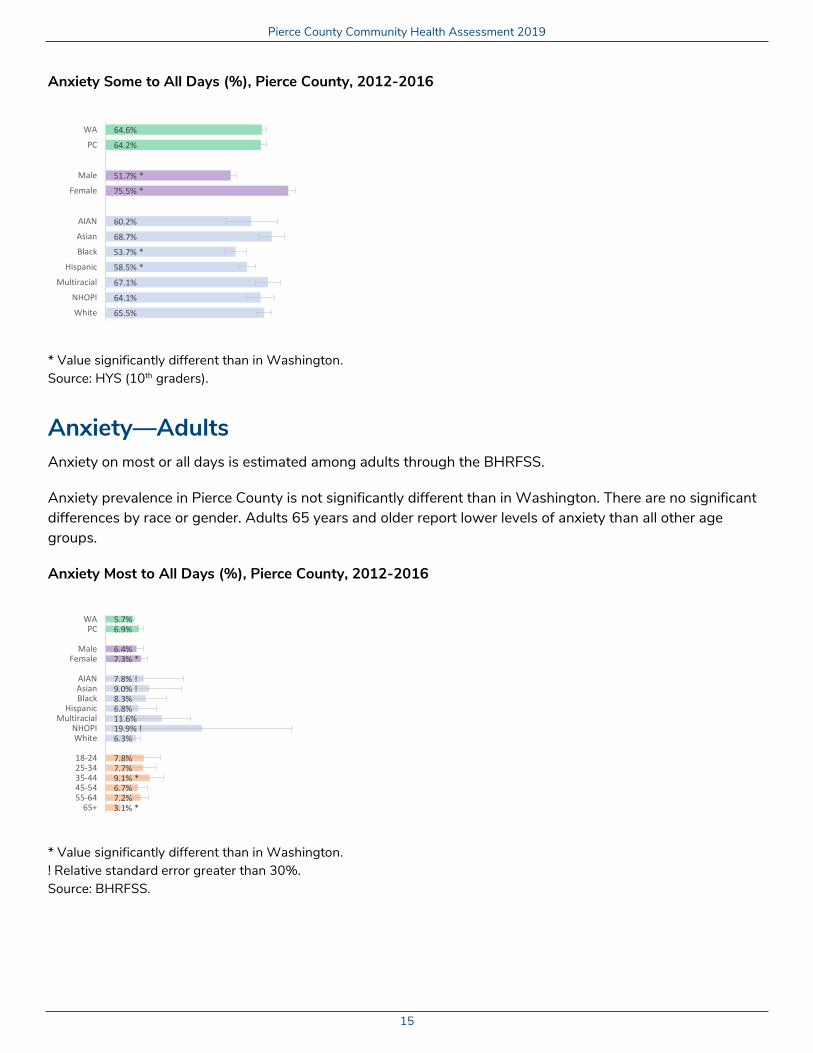
Anxiety—Adults Anxiety on most or all days is estimated among adults through the BHRFSS.
Anxiety prevalence in Pierce County is not significantly different than in Washington. There are no significant differences by race or gender. Adults 65 years and older report lower levels of anxiety than all other age groups.
Anxiety Most to All Days (%), Pierce County, 2012-2016
* Value significantly different than in Washington. ! Relative standard error greater than 30%. Source: BHRFSS.
64.6%
64.2%
51.7% *
75.5% *
60.2%
68.7%
53.7% *
58.5% *
67.1%
64.1%
65.5%
WA
PC
Male
Female
AIAN
Asian
Black
Hispanic
Multiracial
NHOPI
White
5.7%6.9%
6.4%7.3% *
7.8% !9.0% !8.3%6.8%11.6%19.9% !6.3%
7.8%7.7%9.1% *6.7%7.2%3.1% *
WAPC
MaleFemale
AIANAsianBlack
HispanicMultiracial
NHOPIWhite
18-2425-3435-4445-5455-64
65+
Pierce County Community Health Assessment 2019
16
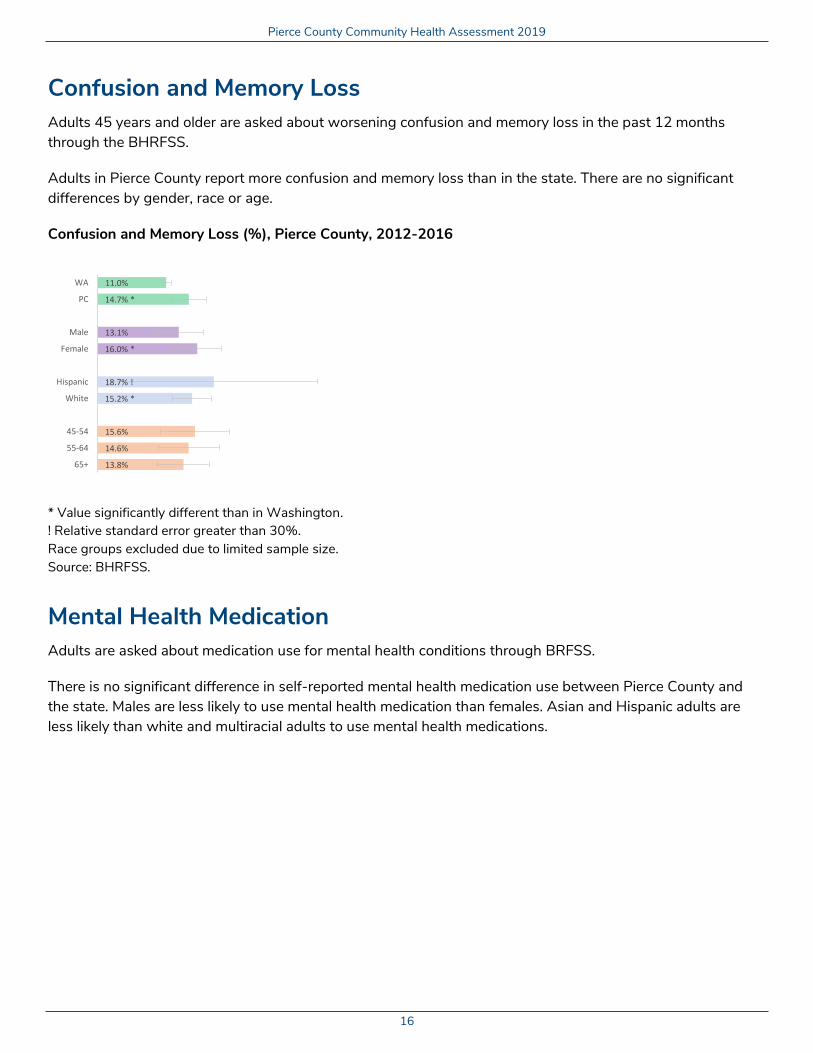
Confusion and Memory Loss Adults 45 years and older are asked about worsening confusion and memory loss in the past 12 months through the BHRFSS.
Adults in Pierce County report more confusion and memory loss than in the state. There are no significant differences by gender, race or age.
Confusion and Memory Loss (%), Pierce County, 2012-2016
* Value significantly different than in Washington. ! Relative standard error greater than 30%. Race groups excluded due to limited sample size. Source: BHRFSS.
Mental Health Medication Adults are asked about medication use for mental health conditions through BRFSS.
There is no significant difference in self-reported mental health medication use between Pierce County and the state. Males are less likely to use mental health medication than females. Asian and Hispanic adults are less likely than white and multiracial adults to use mental health medications.
11.0%
14.7% *
13.1%
16.0% *
18.7% !
15.2% *
15.6%
14.6%
13.8%
WA
PC
Male
Female
Hispanic
White
45-54
55-64
65+
Pierce County Community Health Assessment 2019
17
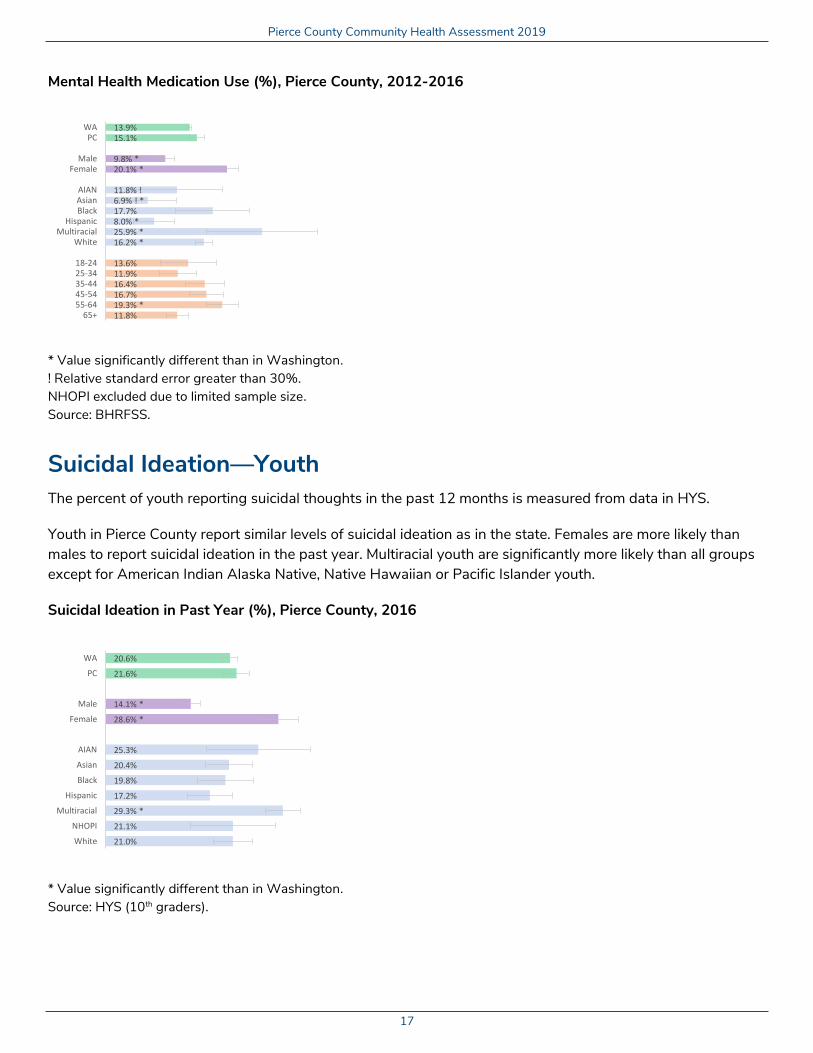
Mental Health Medication Use (%), Pierce County, 2012-2016
* Value significantly different than in Washington. ! Relative standard error greater than 30%. NHOPI excluded due to limited sample size. Source: BHRFSS.
Suicidal Ideation—Youth The percent of youth reporting suicidal thoughts in the past 12 months is measured from data in HYS.
Youth in Pierce County report similar levels of suicidal ideation as in the state. Females are more likely than males to report suicidal ideation in the past year. Multiracial youth are significantly more likely than all groups except for American Indian Alaska Native, Native Hawaiian or Pacific Islander youth.
Suicidal Ideation in Past Year (%), Pierce County, 2016
* Value significantly different than in Washington. Source: HYS (10th graders).
13.9%15.1%
9.8% *20.1% *
11.8% !6.9% ! *17.7%8.0% *25.9% *16.2% *
13.6%11.9%16.4%16.7%19.3% *11.8%
WAPC
MaleFemale
AIANAsianBlack
HispanicMultiracial
White
18-2425-3435-4445-5455-64
65+
20.6%
21.6%
14.1% *
28.6% *
25.3%
20.4%
19.8%
17.2%
29.3% *
21.1%
21.0%
WA
PC
Male
Female
AIAN
Asian
Black
Hispanic
Multiracial
NHOPI
White

Pierce County Community Health Assessment 2019
18
Suicide Education for Youth The percent of youth who have seen or heard information at school about the warning signs of suicide and how to get help for suicidal thoughts is estimated using the HYS.
Pierce County youth report receiving less education about suicide than the state. There are no significant differences by gender or race.
Suicide Education (%), Pierce County, 2016
* Value significantly different than in Washington. ! Relative standard error greater than 30%. Source: HYS (10th graders).
Suicide Attempts—Youth The percent of youth reporting suicide attempts in the past 12 months is measured using the HYS.
There is no difference in the percent of youth reporting suicide attempts between Pierce County and Washington. Females are more likely to attempt suicide than males. There are no significant differences by race.
54.3%
43.3% *
45.1%
41.9% *
40.4%
34.8% *
43.4%
44.7%
43.8%
39.2% *
45.2%
WA
PC
Male
Female
AIAN
Asian
Black
Hispanic
Multiracial
NHOPI
White

Pierce County Community Health Assessment 2019
19
Suicide Attempts in Past Year (%), Pierce County, 2016
* Value significantly different than in Washington. ! Relative standard error greater than 30%. Source: HYS (10th graders).
Social Support Adults were asked in BRFSS about how many people they could count on to come help them if they asked for practical help, like help grocery shopping or providing a family member with care.
There is no significant difference in the amount of reported social support between Pierce County and the state. There is no significant difference among Pierce County residents by gender.
No Social Support (%), Pierce County, 2016
! Relative standard error greater than 30%. Source: BHRFSS.
10.1%
10.8%
7.0% *
14.2% *
13.2% !
13.8%
8.5%
12.0%
12.5%
9.8%
9.7%
WA
PC
Male
Female
AIAN
Asian
Black
Hispanic
Multiracial
NHOPI
White
4.7%
5.6%
5.2%
2.8% !
WA
PC
Male
Female

Pierce County Community Health Assessment 2019
20
Verbally Abused Youth The percent of youth who were verbally abused by an adult (sworn at, insulted or put down verbally) sometimes, often or very often is estimated using the HYS.
There is no significant difference in the percent of youth who were verbally abused by adults between Pierce County and the state. Females are more likely than males to be verbally abused as youth. There is no significant difference by race.
Verbally Abused (%), Pierce County, 2011-2015
* Value significantly different than in Washington. Source: HYS (10th graders).
Social-Emotional Skills—Youth One measure for healthy social-emotional development includes how successfully individuals can understand how others feel and think. This is estimated in HYS.
There was no significant difference between Pierce County and the state. Females reported understanding how others feel and think more often than males. There was no significant difference by race.
37.8%
39.8%
34.7%
44.2% *
40.4%
40.7%
39.4%
34.5%
48.9% *
46.4%
37.1%
WA
PC
Male
Female
AIAN
Asian
Black
Hispanic
Multiracial
NHOPI
White

Pierce County Community Health Assessment 2019
21
Youth Agreed They Understand How Others Feel and Think (%), Pierce County, 2011-2015
* Value significantly different than in Washington. Source: HYS (10th graders).
Youth Bullying The percent of youth reporting being bullied in the past 12 months is measured using the HYS.
Youth bullying in Pierce County occurs at similar rates as the state. Female youth reported more frequently being a victim of bullying than male youth. American Indian or Alaska Native, Asian, multiracial and white youth report being a victim of bullying the most frequently.
Youth Bullied in Past Year (%), Pierce County, 2016
* Value significantly different than in Washington. Source: HYS (10th graders).
91.6%
89.6%
87.6% *
91.3%
80.8%
93.9%
83.0% *
89.8%
88.0%
89.5%
90.9%
WA
PC
Male
Female
AIAN
Asian
Black
Hispanic
Multiracial
NHOPI
White
20.7%
22.2%
17.8% *
26.2% *
30.4% *
23.6%
19.1%
17.7%
26.5% *
16.3% *
22.4%
WA
PC
Male
Female
AIAN
Asian
Black
Hispanic
Multiracial
NHOPI
White

Pierce County Community Health Assessment 2019
22
Substance Abuse and Dependency The inappropriate use of substances—legal and illegal—presents major challenges to a community. Alcohol and opioids are well-known contributors to substance abuse and dependency issues. Alcohol and marijuana use among youth, or driving while under the influence of either, are public health concerns. Ensuring an adequate system to assist individuals dealing with substance abuse and dependency issues is key.
Binge Drinking—Youth Binge drinking among youth is self-reported through HYS. Youth who reported consuming 5 or more drinks in a row in the past 2 weeks were considered to have engaged in binge drinking.
Youth binge drinking rates are not significantly different between Pierce County and Washington. There are no significant differences in binge drinking by gender or race among youth.
Binge Drinking Among Youth, Pierce County, 2016
* Value significantly different than in Washington. ! Relative standard error greater than 30%. Source: HYS (10th graders).
Binge Drinking—Adults Binge drinking among adults is self-reported through BRFSS.
There is no significant difference in binge drinking between Pierce County and the state. Males are more likely than females to binge drink. White and Hispanic adults are more likely to report binge drinking than Asian and black adults. Binge drinking is highest among adults 25 to 34 years old.
10.9%
10.3%
9.3%
11.2%
15.2% !
7.6%
11.9%
12.2%
8.3%
12.1%
9.8%
WA
PC
Male
Female
AIAN
Asian
Black
Hispanic
Multiracial
NHOPI
White

Pierce County Community Health Assessment 2019
23
Binge Drinking Among Adults, Pierce County, 2016
* Value significantly different than in Washington. ! Relative standard error greater than 30%. Source: BHRFSS.
DUI Alcohol—Youth Driving under the influence (DUI) of alcohol among youth is self-reported using the HYS.
Driving after drinking alcohol reported by Pierce County youth is not significantly different than in Washington. There are no significant differences by gender or race.
DUI Alcohol—Youth (%), Pierce County, 2016
* Value significantly different than in Washington. ! Relative standard error greater than 30%. Asian race excluded due to limited sample size. Source: HYS (10th graders).
16.6%16.0%
20.5% *11.6% *
14.8% !5.4% ! *8.0% *19.6%17.1%23.1% !17.0%
21.7% *26.3% *17.8%15.0%11.3% *4.3% *
WAPC
MaleFemale
AIANAsianBlack
HispanicMultiracial
NHOPIWhite
18-2425-3435-4445-5455-64
65+
5.4%
6.3%
7.0%
5.7%
11.4% !
12.6%
7.4% !
7.0%
10.6%
4.6%
WA
PC
Male
Female
AIAN
Black
Hispanic
Multiracial
NHOPI
White

Pierce County Community Health Assessment 2019
24
DUI Alcohol—Adults Driving under the influence of alcohol among adults is self-reported using BRFSS.
There was no significant difference in adults reporting driving after drinking alcohol between Pierce County and the state. There were no significant differences by gender or age. Race data were excluded due to small sample sizes.
DUI Alcohol—Adults (%), Pierce County, 2016
* Value significantly different than in Washington. ! Relative standard error greater than 30%. Race excluded due to limited sample size. Source: BRFSS.
Opiate Use—Youth Lifetime heroin use among youth is measured using the HYS.
Lifetime heroin among youth use is not significantly different between Pierce County and Washington. There are no significant differences by gender or race.
3.4%
3.2% !
4.2%
2.0% *
5.4% !
2.6% !
5.2%
2.8% !
2.1% !
1.4% ! *
WA
PC
Male
Female
18-24
25-34
35-44
45-54
55-64
65+
Pierce County Community Health Assessment 2019
25
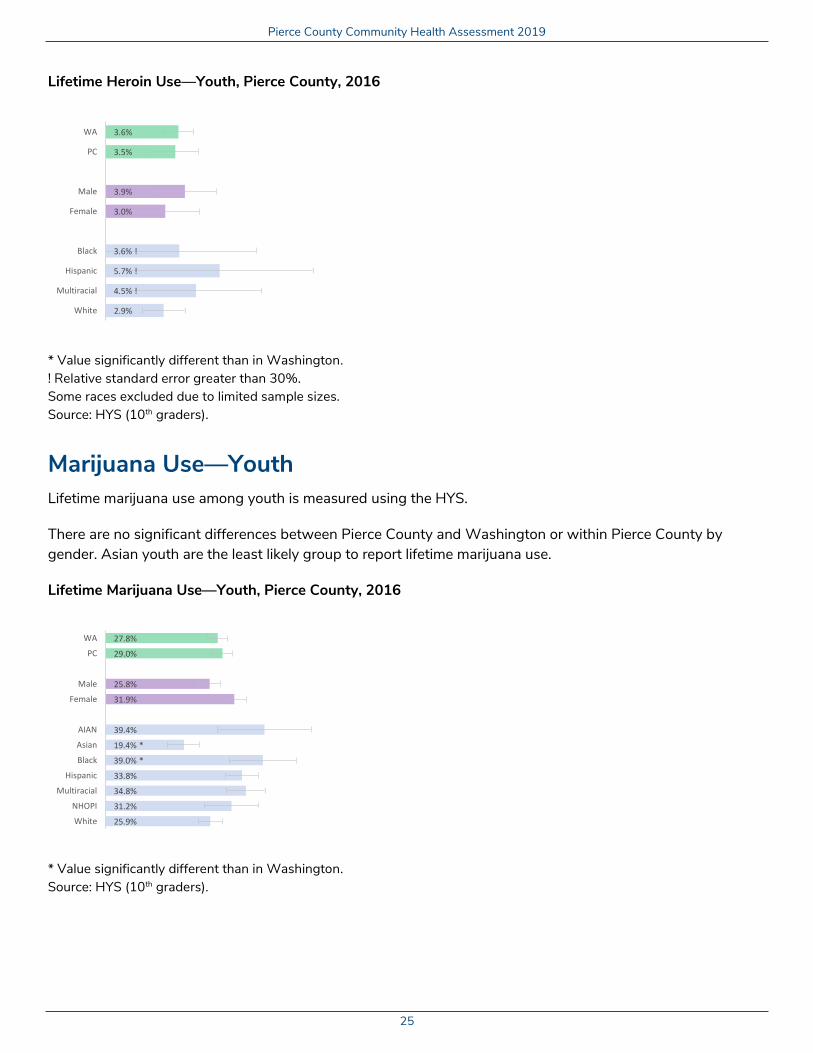
Lifetime Heroin Use—Youth, Pierce County, 2016
* Value significantly different than in Washington. ! Relative standard error greater than 30%. Some races excluded due to limited sample sizes. Source: HYS (10th graders).
Marijuana Use—Youth Lifetime marijuana use among youth is measured using the HYS.
There are no significant differences between Pierce County and Washington or within Pierce County by gender. Asian youth are the least likely group to report lifetime marijuana use.
Lifetime Marijuana Use—Youth, Pierce County, 2016
* Value significantly different than in Washington. Source: HYS (10th graders).
3.6%
3.5%
3.9%
3.0%
3.6% !
5.7% !
4.5% !
2.9%
WA
PC
Male
Female
Black
Hispanic
Multiracial
White
27.8%
29.0%
25.8%
31.9%
39.4%
19.4% *
39.0% *
33.8%
34.8%
31.2%
25.9%
WA
PC
Male
Female
AIAN
Asian
Black
Hispanic
Multiracial
NHOPI
White

Pierce County Community Health Assessment 2019
26
Marijuana Use—Adults Marijuana use in the past 30 days among adults is measured using BRFSS.
The percent of adults reporting current marijuana use in Pierce County is not significantly different than in Washington. Females are less likely to consume marijuana than males. Asian and white adults are less likely than multiracial adults to consume marijuana. The highest rate of marijuana use by age occurs among adults 18 to 24 years old.
Current Marijuana Use, Pierce County, 2016
* Value significantly different than in Washington. ! Relative standard error greater than 30%. Source: BHRFSS.
DUI Marijuana—Youth Driving under the influence of marijuana among youth is self-reported using the HYS.
There are no significant differences in the percent of youth who consume marijuana and drive when comparing Pierce County to Washington. Black and Hispanic youth are significantly more likely than Asian and white youth to report consuming marijuana and driving.
10.7%10.1%
12.2%8.0% *
15.9% !1.8% ! *14.4%12.1%23.8% *21.0% !9.1%
21.5% *14.9% *9.7%7.2% *9.4%2.5% *
WAPC
MaleFemale
AIANAsianBlack
HispanicMultiracial
NHOPIWhite
18-2425-3435-4445-5455-64
65+

Pierce County Community Health Assessment 2019
27
DUI Marijuana Prevalence (%), Pierce County, 2016
* Value significantly different than in Washington. Source: HYS (10th graders).
Life Expectancy Life expectancy—the average number of years a person at birth can expect to live, given current death rates—is a widely used measure of the overall health of a population.
Life expectancy in Pierce County is significantly lower than in Washington. Within Pierce County, females have a higher life expectancy than males. Black, American Indian or Alaska Native and Native Hawaiian or Pacific Islander life expectancies are lower than Asian, Hispanic and white life expectancies.
Life Expectancy by Demographics, Pierce County, 2012-2016
Source: Washington State Department of Health Center for Health Statistics (CHS), Death Certificate Data, 1990-2016, Community Health Assessment Tool (CHAT), October 2017.
9.3%
9.5%
10.0%
8.7%
13.3%
6.2%
16.9%
13.0%
10.5%
9.7% !
7.6%
WA
PC
Male
Female
AIAN
Asian
Black
Hispanic
Multiracial
NHOPI
White
80.3
79.0 *
76.6 *
81.5 *
73.8 *
83.8 *
75.2 *
82.9 *
86.1 *
70.7 *
79.0 *
WA
PC
Male
Female
AIAN
Asian
Black
Hispanic
Multiple
NHOPI
White
Pierce County Community Health Assessment 2019
28
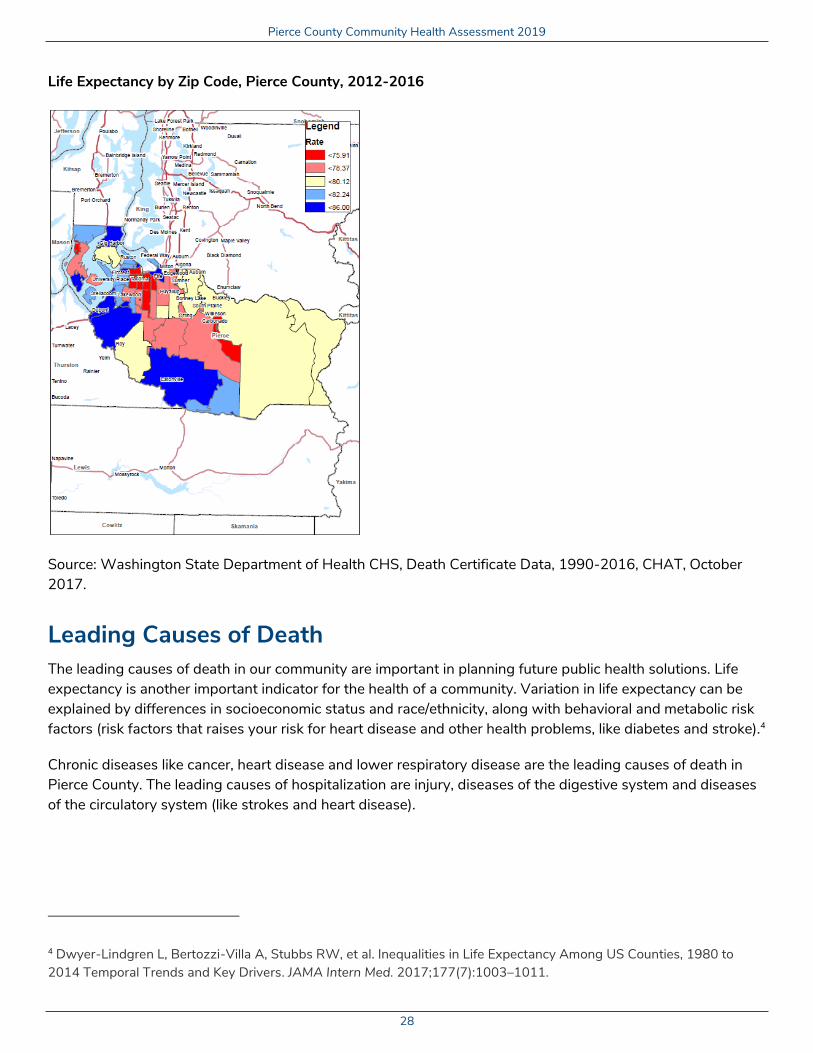
Life Expectancy by Zip Code, Pierce County, 2012-2016
Source: Washington State Department of Health CHS, Death Certificate Data, 1990-2016, CHAT, October 2017.
Leading Causes of Death The leading causes of death in our community are important in planning future public health solutions. Life expectancy is another important indicator for the health of a community. Variation in life expectancy can be explained by differences in socioeconomic status and race/ethnicity, along with behavioral and metabolic risk factors (risk factors that raises your risk for heart disease and other health problems, like diabetes and stroke).4
Chronic diseases like cancer, heart disease and lower respiratory disease are the leading causes of death in Pierce County. The leading causes of hospitalization are injury, diseases of the digestive system and diseases of the circulatory system (like strokes and heart disease).
4 Dwyer-Lindgren L, Bertozzi-Villa A, Stubbs RW, et al. Inequalities in Life Expectancy Among US Counties, 1980 to 2014 Temporal Trends and Key Drivers. JAMA Intern Med. 2017;177(7):1003–1011.
Pierce County Community Health Assessment 2019
29
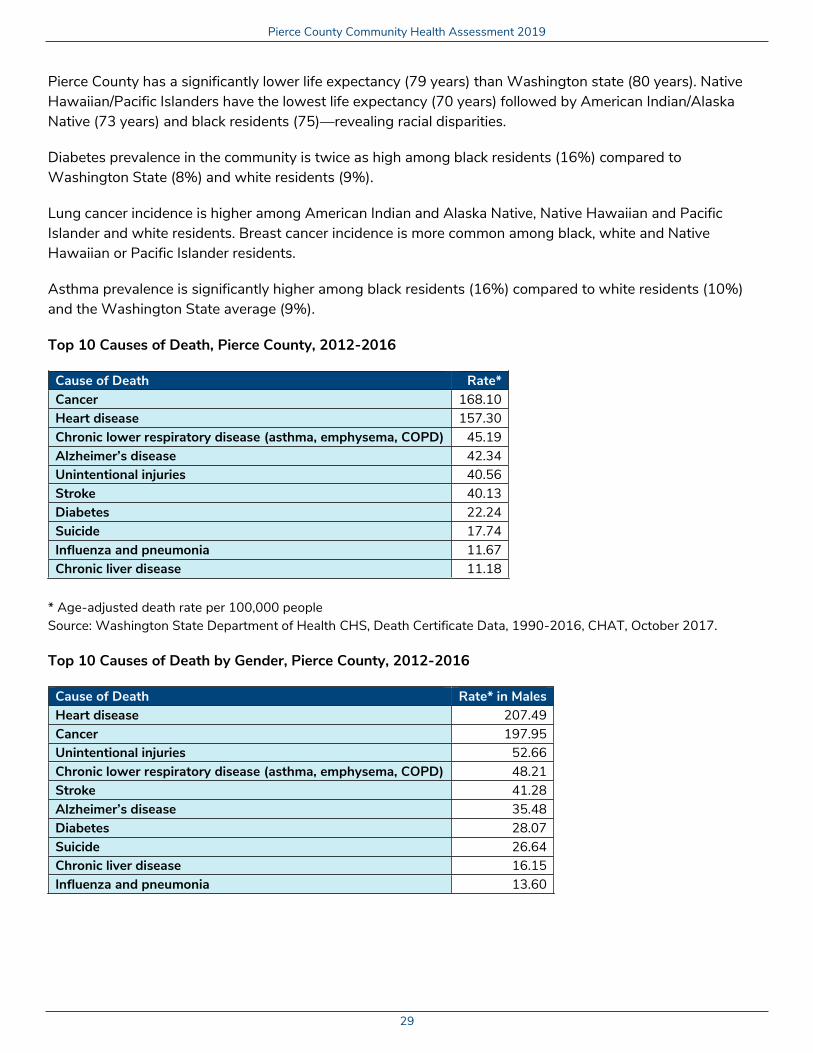
Pierce County has a significantly lower life expectancy (79 years) than Washington state (80 years). Native Hawaiian/Pacific Islanders have the lowest life expectancy (70 years) followed by American Indian/Alaska Native (73 years) and black residents (75)—revealing racial disparities.
Diabetes prevalence in the community is twice as high among black residents (16%) compared to Washington State (8%) and white residents (9%).
Lung cancer incidence is higher among American Indian and Alaska Native, Native Hawaiian and Pacific Islander and white residents. Breast cancer incidence is more common among black, white and Native Hawaiian or Pacific Islander residents.
Asthma prevalence is significantly higher among black residents (16%) compared to white residents (10%) and the Washington State average (9%).
Top 10 Causes of Death, Pierce County, 2012-2016
Cause of Death Rate* Cancer 168.10 Heart disease 157.30 Chronic lower respiratory disease (asthma, emphysema, COPD) 45.19 Alzheimer’s disease 42.34 Unintentional injuries 40.56 Stroke 40.13 Diabetes 22.24 Suicide 17.74 Influenza and pneumonia 11.67 Chronic liver disease 11.18
* Age-adjusted death rate per 100,000 people Source: Washington State Department of Health CHS, Death Certificate Data, 1990-2016, CHAT, October 2017.
Top 10 Causes of Death by Gender, Pierce County, 2012-2016
Cause of Death Rate* in Males Heart disease 207.49 Cancer 197.95 Unintentional injuries 52.66 Chronic lower respiratory disease (asthma, emphysema, COPD) 48.21 Stroke 41.28 Alzheimer’s disease 35.48 Diabetes 28.07 Suicide 26.64 Chronic liver disease 16.15 Influenza and pneumonia 13.60

Pierce County Community Health Assessment 2019
30
Cause of Death Rate* in Females Cancer 146.40 Heart disease 117.39 Alzheimer’s disease 46.16 Chronic lower respiratory disease (i.e. asthma, emphysema, COPD) 43.09 Stroke 38.66 Unintentional injuries 28.85 Diabetes 17.59 Influenza and pneumonia 10.08 Suicide 9.27 Hypertension 7.88
* Age-adjusted death rate per 100,000 people Source: Washington State Department of Health CHS, Death Certificate Data, 1990-2016, CHAT, October 2017.
Leading Causes of Hospitalizations Hospitalizations occur due to a wide array of health concerns. Understanding these hospitalizations is crucial to prioritizing how we allocate resources, what types of interventions are undertaken and where these interventions should be focused.
Males are more likely than females to be hospitalized due to injury and circulatory system diseases, like stroke and heart disease. The leading causes of hospitalizations for females, excluding pregnancy-related hospitalizations, are diseases of the circulatory and digestive systems.
Top 10 Leading Causes of Hospitalization by Gender, Pierce County, 2011-2015
Cause of Hospitalization Rate* in Males Diseases of the circulatory system 1614.34 Diseases of the digestive system 887.27 Injury and poisoning 806.38 Diseases of the respiratory system 756.32 Diseases of the musculoskeletal system and connective tissue 583.40 Infectious and parasitic diseases 555.76 Mental illness 426.18 Cancer 369.52 Diseases of the genitourinary system 346.57 Endocrine, nutritional, and metabolic diseases and immunity disorders 304.12

Pierce County Community Health Assessment 2019
31
Cause of Hospitalization Rate* in Females Diseases of the circulatory system 1211.98 Diseases of the digestive system 948.41 Injury and poisoning 763.46 Diseases of the respiratory system 751.62 Diseases of the musculoskeletal system and connective tissue 657.87 Infectious and parasitic diseases 501.43 Diseases of the genitourinary system 501.13 Mental illness 476.08 Cancer 389.25 Endocrine; nutritional; and metabolic diseases and immunity disorders 356.13
* Age-adjusted rate per 100,000 people Source: Washington Hospital Discharge Data, Comprehensive Hospitalization Abstract Reporting System (CHARS).
Chronic Disease Chronic diseases and conditions—like diabetes, cancer and heart disease—encompass many of the most common, costly and preventable health concerns in our communities.
Diabetes—Adults The prevalence of diabetes diagnoses among adults is self-reported as part of BRFSS.
Diabetes in Pierce County is not significantly different than in Washington. Black residents have a significantly higher rate than white residents.
Adults with Diabetes (%), Pierce County, 2012-2016
* Value significantly different than in Washington. ! Relative standard error greater than 30%. Groups excluded if cell size less than 10.
8.8%9.3%
9.2%9.3%
15.6% !7.2% !16.9% *7.7%10.6%11.8% !8.7%
1.6% ! *1.0% ! *5.4% *9.5%14.3% *22.6% *
WAPC
MaleFemale
AIANAsianBlack
HispanicMultiracial
NHOPIWhite
18-2425-3435-4445-5455-64
65+

Pierce County Community Health Assessment 2019
32
Lung Cancer The number of new cases, or incidence, of lung cancer is available through the Washington State Cancer Registry.
The incidence of lung cancer in Pierce County is significantly higher than in Washington. Lung cancer is more common among males compared to females. Asian residents have a significantly lower lung cancer incidence compared to white residents.
Lung Cancer Incidence, Pierce County, 2011-2015
* Value significantly different than in Washington. Rate: New cancer cases per 100,000 residents. Source: Washington State Cancer Registry.
Colorectal Cancer Cancer of the colon or rectum is a common cancer that, when detected early, can often be successfully treated.
Colorectal cancer incidence is similar in Pierce County and Washington. Males have a higher colorectal cancer incidence than females. There are no significant differences by race.
57.5
71.3 *
78.8 *
65.6 *
94.4 *
50.1
63.9
48.9
53.3
99.7
74.2 *
WA
PC
Male
Female
AIAN
Asian
Black
Hispanic
Multiracial
NHOPI
White

Pierce County Community Health Assessment 2019
33
Colorectal Cancer Incidence, Pierce County, 2011-2015
* Value significantly different than in Washington. Rate: New cancer cases per 100,000 residents. Source: Washington State Cancer Registry.
Breast Cancer
Cancer of the breast is a common cancer among females. Regular screening can detect this early and increase the chance of successful treatment.
Breast cancer is more common in Pierce County than in Washington. Breast cancer is more common among black and white adults compared to Asian adults.
Breast Cancer Incidence, Pierce County, 2011-2015
* Value significantly different than in Washington. Rate: New cancer cases per 100,000 residents. Source: Washington State Cancer Registry.
36.3
38.2
43.3 *
34.1
45.5
34.1
46.1
33.3
23.6
32.2
38.4
WA
PC
Male
Female
AIAN
Asian
Black
Hispanic
Multiracial
NHOPI
White
170.4
178.0 *
142.1
130.1 *
196.9
163.2
122.9 *
245.7
182.6 *
70.7 *
360.1 *
609.6 *
WA
PC
AIAN
Asian
Black
Hispanic
Multiracial
NHOPI
White
25-44
45-64
65+
Pierce County Community Health Assessment 2019
34
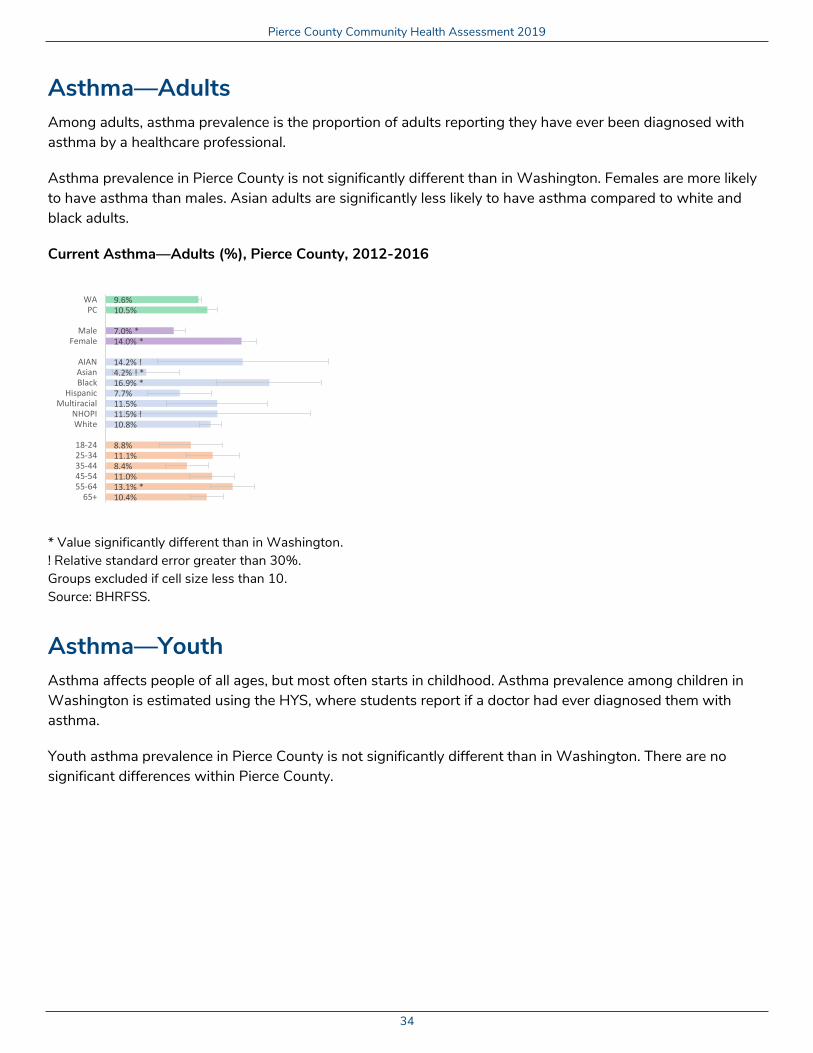
Asthma—Adults Among adults, asthma prevalence is the proportion of adults reporting they have ever been diagnosed with asthma by a healthcare professional.
Asthma prevalence in Pierce County is not significantly different than in Washington. Females are more likely to have asthma than males. Asian adults are significantly less likely to have asthma compared to white and black adults.
Current Asthma—Adults (%), Pierce County, 2012-2016
* Value significantly different than in Washington. ! Relative standard error greater than 30%. Groups excluded if cell size less than 10. Source: BHRFSS.
Asthma—Youth Asthma affects people of all ages, but most often starts in childhood. Asthma prevalence among children in Washington is estimated using the HYS, where students report if a doctor had ever diagnosed them with asthma.
Youth asthma prevalence in Pierce County is not significantly different than in Washington. There are no significant differences within Pierce County.
9.6%10.5%
7.0% *14.0% *
14.2% !4.2% ! *16.9% *7.7%11.5%11.5% !10.8%
8.8%11.1%8.4%11.0%13.1% *10.4%
WAPC
MaleFemale
AIANAsianBlack
HispanicMultiracial
NHOPIWhite
18-2425-3435-4445-5455-64
65+

Pierce County Community Health Assessment 2019
35
Current Asthma—Youth (%), Pierce County, 2016
* Value significantly different than in Washington. Source: HYS (10th graders).
Heart Disease Heart disease is one of the leading causes of hospitalizations and deaths in Pierce County. BRFSS provides estimates of heart disease diagnoses among adults 18 years and older.
Heart disease prevalence is not different in Pierce County than in Washington. Males are more likely to have heart disease than females.
Heart Disease Prevalence (%), Pierce County, 2016
* Value significantly different than in Washington. ! Relative standard error greater than 30%. Groups excluded if cell size less than 10. Source: BHRFSS.
21.1%
23.2%
24.3%
22.2%
30.2%
19.4%
28.7%
17.6%
28.1%
18.3%
22.1%
WA
PC
Male
Female
AIAN
Asian
Black
Hispanic
Multiracial
NHOPI
White
5.7%6.0%
7.1% *5.0%
7.8% !3.9% !8.0%5.1% !6.5% !1.1% ! *6.0%
0.9% ! *1.8% ! *2.5% ! *4.9%8.4% *17.2% *
WAPC
MaleFemale
AIANAsianBlack
HispanicMultiracial
NHOPIWhite
18-2425-3435-4445-5455-64
65+

Pierce County Community Health Assessment 2019
36
Health Behaviors A healthy and active lifestyle has been shown to have a profound impact on reducing the burden of chronic illness described in the previous section. A healthy diet and regular physical activity are protective factors promoting our health and wellbeing, while tobacco use, and a multitude of environmental exposures are some factors that may lead to negative health outcomes.
Across Pierce County, obesity among adults is significantly more prevalent than in Washington. Black adults are significantly more likely to be obese than white or Asian adults.
Obesity prevalence among Native Hawaiian or Pacific Islander youth is 3 times higher than among white youth. Obesity prevalence among multiracial youth is twice as high as white youth.
Females are more likely to avoid sugar-sweetened beverages than males. Black youth were the most likely to consume these beverages, while Asian youth were the least likely.
The percent of adults currently smoking is significantly higher in this area than in Washington. The percent of Alaska Native and American Indian adults who smoke cigarettes (42%) is significantly higher than that of white adults (18%) and the state (15%).
Obesity, Physical Activity and Nutrition Many chronic diseases discussed in the previous section share the same root causes, like high-calorie diets with low nutritional value and lack of physical activity. Negative behaviors (risk factors) balanced with positive behaviors (protective factors) across a person’s lifetime have a profound role in the development of chronic disease.
Overweight—Adults Body mass index (BMI) is a measure of body fat based on height and weight. It is associated with a wide array of poor health outcomes. Adults are overweight if their BMI is greater than or equal to 25 but less than 30. The percent of adults who are overweight is not significantly different in Pierce County than in Washington. Males are more likely to be overweight compared to females.
Pierce County Community Health Assessment 2019
37
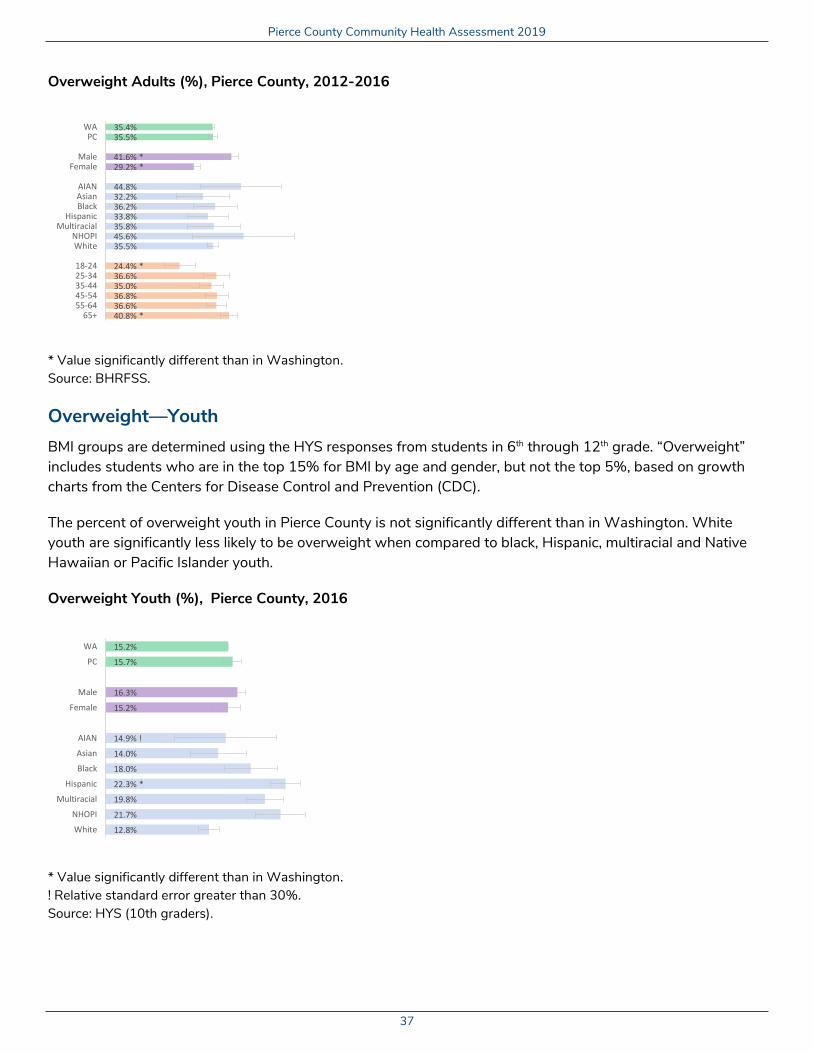
Overweight Adults (%), Pierce County, 2012-2016
* Value significantly different than in Washington. Source: BHRFSS.
Overweight—Youth BMI groups are determined using the HYS responses from students in 6th through 12th grade. “Overweight” includes students who are in the top 15% for BMI by age and gender, but not the top 5%, based on growth charts from the Centers for Disease Control and Prevention (CDC).
The percent of overweight youth in Pierce County is not significantly different than in Washington. White youth are significantly less likely to be overweight when compared to black, Hispanic, multiracial and Native Hawaiian or Pacific Islander youth.
Overweight Youth (%), Pierce County, 2016
* Value significantly different than in Washington. ! Relative standard error greater than 30%. Source: HYS (10th graders).
35.4%35.5%
41.6% *29.2% *
44.8%32.2%36.2%33.8%35.8%45.6%35.5%
24.4% *36.6%35.0%36.8%36.6%40.8% *
WAPC
MaleFemale
AIANAsianBlack
HispanicMultiracial
NHOPIWhite
18-2425-3435-4445-5455-64
65+
15.2%
15.7%
16.3%
15.2%
14.9% !
14.0%
18.0%
22.3% *
19.8%
21.7%
12.8%
WA
PC
Male
Female
AIAN
Asian
Black
Hispanic
Multiracial
NHOPI
White

Pierce County Community Health Assessment 2019
38
Obesity—Adults Adults are classified as obese when their BMI is greater than or equal to 30. People whose BMI is in this category are at a significantly greater risk for heart disease and a host of other chronic diseases.
Obesity is more common in Pierce County than in Washington. Black adults in Pierce County are significantly more likely than white and Asian adults to be obese.
Adult Obesity (%), Pierce County, 2012-2016
* Value significantly different than in Washington. Source: BHRFSS.
Obesity—Youth Youth are classified as obese when they are in the top 5% for BMI by age and gender based on growth charts developed by CDC. The percent of obese youth in Pierce County is not significantly different than in Washington.
Male youth are more likely than female youth to be obese. Asian and white youth are significantly less likely than Native Hawaiian or Pacific Islander youth to be obese.
27.3%29.8% *
29.7%29.6%
24.0%8.8% *43.0% *31.8%30.5%19.0% !30.5% *
16.5% *25.0%33.9% *33.4% *36.5% *29.2%
WAPC
MaleFemale
AIANAsianBlack
HispanicMultiracial
NHOPIWhite
18-2425-3435-4445-5455-64
65+

Pierce County Community Health Assessment 2019
39
Youth Obesity (%), Pierce County, 2016
* Value significantly different than in Washington. ! Relative standard error greater than 30%. Source: HYS (10th graders).
Physical Activity—Adults Meeting recommended physical activity guidelines for aerobic exercise and strength conditioning helps reduce the burden of chronic disease related to fitness.
The percent of adults meeting physical activity recommendations is not significantly different between Pierce County and Washington. There are no significant differences by gender, race or age.
Met Physical Activity Recommendations (%), Pierce County, 2011-2015 (odd years)
* Value significantly different than in Washington. ! Relative standard error greater than 30%. Source: BHRFSS.
11.6%
14.1%
17.7% *
10.8%
12.8% !
8.5%
19.3%
18.0%
21.4% *
30.2% *
9.7%
WA
PC
Male
Female
AIAN
Asian
Black
Hispanic
Multiracial
NHOPI
White
21.8%22.1%
23.7%20.6%
28.1% !27.6%23.9%23.9%22.4%39.3% !21.2%
27.4%28.1%17.7%21.0%18.8%20.4%
WAPC
MaleFemale
AIANAsianBlack
HispanicMultiracial
NHOPIWhite
18-2425-3435-4445-5455-64
65+

Pierce County Community Health Assessment 2019
40
Physical Activity—Youth Engaging in physical activity in youth is important for developing a healthy lifestyle as an adult. Physical activity reported among Pierce County youth is not significantly different than in Washington.
Males are more likely to be physically active compared to females. There are no significant differences in physical activity by race.
1 Hour of Physical Activity 5 Days a Week (%), Pierce County, 2016
* Value significantly different than in Washington. Source: HYS (10th graders).
Sugar-Sweetened Beverages The availability and consumption of sugar-sweetened beverages by youth can lead to the development of unhealthy behaviors and chronic disease later in life. Sugar-sweetened beverage consumption among Pierce County youth is not significantly different than in Washington.
Males are more likely to consume sugar-sweetened beverages compared to females. Asian youth are significantly less likely than black youth to consume sugar-sweetened beverages.
53.6%
48.3%
54.5%
42.6% *
60.4%
47.6%
48.4%
38.4% *
44.8%
49.1%
50.6%
WA
PC
Male
Female
AIAN
Asian
Black
Hispanic
Multiracial
NHOPI
White

Pierce County Community Health Assessment 2019
41
No Sugar-Sweetened Beverage Consumption (%), Pierce County, 2016
* Value significantly different than in Washington. Source: HYS (10th graders).
Tobacco Tobacco use remains one of the most prevalent risky behaviors in communities across the United States, despite a robust body of evidence that tobacco use increases the risk of heart disease, cancer and many other negative health outcomes. Despite a general trend of decreasing tobacco use nationwide, an increase in electronic cigarette availability, attempts to replace traditional cigarettes with electronic cigarettes and vaping product popularity among youth continue to be a concern.
Current Cigarette Use—Adults Current cigarette use among adults is estimated using responses from BRFSS. Current smoking is more common in Pierce County than in Washington.
Current cigarette use is more common among males compared to females. American Indian or Alaska Native adults are significantly more likely to currently use cigarettes than all other groups, except Native Hawaiian or Pacific Islander and multiracial adults.
76.5%
78.7%
82.3% *
75.6%
80.8%
76.9%
86.3% *
79.0%
78.6%
77.5%
78.1%
WA
PC
Male
Female
AIAN
Asian
Black
Hispanic
Multiracial
NHOPI
White

Pierce County Community Health Assessment 2019
42
Current Cigarette Use—Adults (%), Pierce County, 2012-2016
* Value significantly different than in Washington. ! Relative standard error greater than 30%. Source: BHRFSS.
Current Cigarette Use—Youth While the rate of tobacco use initiation is declining nationwide, tobacco use among youth remains a concern. Preventing youth from forming a smoking habit reduces the risk of smoking in adulthood.
Cigarette use among youth in Pierce County is not significantly different than in Washington. There are no significant differences by gender or race.
Cigarette Use in the Past 30 Days—Youth (%), Pierce County, 2016
* Value significantly different than in Washington. ! Relative standard error greater than 30%. Source: HYS (10th graders).
15.4%18.6% *
19.9% *17.4%
42.7% *15.6%15.9%16.5%25.0% *22.4% !18.4% *
18.3%23.6% *19.6% *23.5% *17.3%8.3% *
WAPC
MaleFemale
AIANAsianBlack
HispanicMultiracial
NHOPIWhite
18-2425-3435-4445-5455-64
65+
6.3%
6.2%
6.3%
5.9%
11.1%
3.6%
7.1%
5.3%
5.4%
6.7%
6.6%
WA
PC
Male
Female
AIAN
Asian
Black
Hispanic
Multiracial
NHOPI
White
Pierce County Community Health Assessment 2019
43
Social Connections One-third of the United States population reports they are socially isolated (have 2 or less people they can count on in times of need). 5 People with stronger social relationships had a reduced risk of dying (i.e., 50% increased likelihood of survival) than those with weaker social relationships.6
Neighborhoods with stronger belonging and trust have lower obesity, hypertension and diabetes rates.7 8 9
Pierce County residents reported having people they could count on, and connectedness with their community members at similar frequencies as the state.
Further qualitative research may provide more evidence of the types and number of connections people are experiencing, to supplement this data.
Social Support Adults were asked about how many people they could count on to come help them if they asked for practical help, like grocery shopping or caring for a family member.
The percent of adults in Pierce County who report no social support is not significantly different than in Washington. There is no significant difference by gender.
5 Perissinotto CM, Stijacic Cenzer I, Covinsky KE. Loneliness in older persons: a predictor of functional decline and death. Arch Intern Med. 2012;172(14):1078–1083. 6 Holt-Lunstad J, Smith TB, Layton JB. Social relationships and mortality risk: a meta-analytic review. PLoS Med. 2010;7(7):e1000316. Published July 27, 2010. 7 Chang VW, Hillier AE, Mehta NK. Neighborhood racial isolation, disorder and obesity. Soc Forces. 2009;87(4):2063-2092. 8 Kaiser, P., Diez Roux, A., Mujahid, M., Carnethon, M., Bertoni, A., Adar, S. et al. (2016). Neighborhood environments and incident hypertension in the multi-ethnic study of atherosclerosis. American Journal of Epidemiology, 183 (11) p. 988–997. 9 Liu L, Núñez AE. Multilevel and urban health modeling of risk factors for diabetes mellitus: a new insight into public health and preventive medicine. Adv Prev Med.

Pierce County Community Health Assessment 2019
44
No Social Support (%), Pierce County 2016
! Relative standard error greater than 30%. Source: BHRFSS.
Access to Care and Use of Clinical Preventive Services This section includes information about access to care, like percentages of residents who are have medical insurance, a usual primary care physician, and the general availability of physicians and healthcare workforce capacity in the geographic area. This section also includes statistics on oral healthcare and preventable care services, like vaccinations and cancer screening.
Pierce County residents generally have insurance coverage rates comparable to state rates—with people 25 to 34 years old being the least likely age group to be insured. Hispanic residents were insured at significantly lower rates than the state. The percent of people who did not see a doctor due to cost was higher (15%) than Washington (13%), with significantly higher percentages among Hispanic (23%) and black (20%) residents.
The percentages of residents reporting not having a usual primary care provider (“medical home”) were highest among Native Hawaiian and Pacific Islander residents (46%), followed by Hispanic residents (45%). These percentages were significantly higher than white residents (22%) and Washington (24%).
Pierce County has 5 health professional shortage areas (HPSAs): 3 primary care, 1 mental health and 1 oral health. All HPSAs are on Key Peninsula (see Workforce Capacity section).
The lack of healthcare access can be particularly burdensome for individuals who don’t have adequate health insurance. Following the implementation of the Patient Protection and Affordable Care Act, the proportion of residents reporting no insurance decreased significantly.
4.7%
5.6%
4.2%
5.0% !
3.5% !
WA
PC
AL
Male
Female

Pierce County Community Health Assessment 2019
45
Insurance Coverage The availability of insurance coverage can impact how likely somebody is to get important medical care. Insurance coverage also allows individuals to engage the healthcare system before conditions develop and reduce the cost of neglected health. Unfortunately, segments of our population continue to be uninsured and have trouble accessing care.
The percent of people with insurance coverage in Pierce County is not significantly different than in Washington. Females are significantly more likely to be insured compared to males. Hispanic are the least likely group to be insured.
Insurance Coverage (%), Pierce County, 2012-2016
* Value significantly different than in Washington. Source: United States Census, 2012-2016, ACS 5-year estimates, S2701.
Medical Home—Adults A medical home is defined in this report as having a primary care provider. The prevalence of individuals with a medical home is estimated as the percent of people with a usual primary care provider.
The percent of adults with no medical home is higher in Pierce County than in Washington. Males are more likely than females to not have a medical home. White and black adults are significantly more likely than Native Hawaiian or Pacific Islander adults to have a medical home.
90.2%90.2%
89.2% *91.2% *
76.7%88.8%90.7%78.7% *91.5%86.9%91.2% *
96.4% *95.0% *82.4% *81.1% *86.3% *88.6% *92.4% *99.4% *
WAPC
MaleFemale
AIANAsianBlack
HispanicMultiracial
NHOPIWhite
<66-17
18-2425-3435-4445-5455-64
65+

Pierce County Community Health Assessment 2019
46
No Usual Primary Care Provider—Adults (%), Pierce County, 2012-2016
* Value significantly different than in Washington. Source: BHRFSS.
Cost and Healthcare Access When an individual needs healthcare, cost can often be a factor in whether they obtain care. Adults are asked if they needed to see a doctor but could not because of cost.
The percent of adults who could not see a doctor due to cost was higher in Pierce County than in Washington. Females are more likely than males to report not being able to see a doctor due to cost. Hispanic residents are more likely than white residents to not be able to see a doctor due to cost.
Did Not See a Doctor Due to Cost (%), Pierce County, 2012-2016
* Value significantly different than in Washington. Source: BHRFSS.
24.5%25.8%
32.5% *19.2% *
24.8%29.9%27.5%45.8% *27.7%46.5% *22.9%
43.9% *43.0% *30.4% *21.1%13.1% *6.2% *
WAPC
MaleFemale
AIANAsianBlack
HispanicMultiracial
NHOPIWhite
18-2425-3435-4445-5455-64
65+
13.3%15.1% *
13.6%16.5% *
17.2% !12.3%20.6% *23.7% *13.2%21.2% !13.9%
13.1%19.5% *21.5% *16.6% *13.9%4.4% *
WAPC
MaleFemale
AIANAsianBlack
HispanicMultiracial
NHOPIWhite
18-2425-3435-4445-5455-64
65+

Pierce County Community Health Assessment 2019
47
Workforce Capacity Another important factor in preventing, treating and rehabilitating negative health outcomes is the workforce capacity of our medical community—including long-term, dental, mental and primary care providers. Ensuring an adequate workforce is available to serve the community is a crucial component of an effective public health system.
Health Professional Shortage Areas HPSAs are identified by the Health Resources and Services Administration for primary care, mental health and oral health. All Pierce County HPSAs are on Key Peninsula (Gig Harbor and Longbranch).
• 3 primary care HSPAs, all on Key Peninsula. • 1 mental health HSPA, on Key Peninsula. • 1 oral health HSPA, on Key Peninsula.
Injury and Violence Prevention Injuries and violence adversely affect everyone, regardless of background. Injuries and violence are leading causes of death and disability at all levels of our society but are preventable. Those who survive these traumatic experiences may face lifelong mental and physical problems.
This section includes information on intentional and unintentional injuries that have occurred in Pierce County.
Suicide rates are higher in Pierce County compared to Washington State, and more common among males, and American Indian or Alaska Native and White residents.
Homicide rates are also higher in Pierce County compared to Washington State averages. Males are more likely than females to die of homicide. Black residents are nearly 5 times as likely to die of homicide than white residents.
Accidental injuries are higher among males, people older than 65 years (most likely due to falls) and American Indian or Alaska Native residents. American Indian or Alaska Native die from accidental injuries (77%) at nearly the twice the rate of white residents (41%).
Accidental hospitalizations caused by unintentional injuries (motor vehicle accidents, falls or poisonings) are significantly higher than the Washington State average and are more common among men, increase with age and are significantly more common in people over age 65 years of age (most likely due to falls).
Intentional Injuries Injuries that are intentional, both fatal and non-fatal, are prevalent in Pierce County communities. Hospitalizations and deaths—suicide or homicide—are often preventable.
Intentional injuries are described as self-inflicted, assault and other.

Pierce County Community Health Assessment 2019
48
Physically Abused Youth The percent of youth who are physically abused by an adult is estimated using the HYS.
The percent of Pierce County youth reporting physical abuse was not significantly different than in Washington. Females are more likely than males to be physically abused. There is no significant difference in physical abuse rates by race.
Physically Abused Youth (%), Pierce County, 2011-2015
* Value significantly different than in Washington. Source: HYS (10th graders).
Sexually Abused Youth The percent of youth who were sexually abused is estimated using the HYS.
There is no significant difference between sexually abused youth in Pierce County than in Washington. Females are more likely to be sexually abused than males and white youth are more likely to be sexually abused than Asian youth.
22.6%
26.6%
22.5%
30.0% *
36.5% *
25.2%
26.2%
23.4%
31.9% *
20.4%
25.5%
WA
PC
Male
Female
AIAN
Asian
Black
Hispanic
Multiracial
NHOPI
White

Pierce County Community Health Assessment 2019
49
Sexually Abused Youth (%), Pierce County, 2011-2015
* Value significantly different than in Washington. Source: HYS (10th graders).
Witnessed Physical Violence—Youth The percent of youth who witnessed physical violence in the past 12 months is estimated using the HYS.
The percent of youth witnessing physical violence in Pierce County is not significantly different than in Washington. There are no significant differences by gender or race.
Witnessed Physical Violence—Youth (%), Pierce County, 2011-2015
* Value significantly different than in Washington. Source: HYS (10th graders).
17.5%
18.8%
11.2% *
25.5% *
30.3% !
10.3% *
19.7%
14.9%
20.7%
19.0%
19.7%
WA
PC
Male
Female
AIAN
Asian
Black
Hispanic
Multiracial
NHOPI
White
23.9%
25.8%
25.5%
26.0%
21.6%
23.7%
26.1%
26.8%
34.5% *
24.2%
23.3%
WA
PC
Male
Female
AIAN
Asian
Black
Hispanic
Multiracial
NHOPI
White
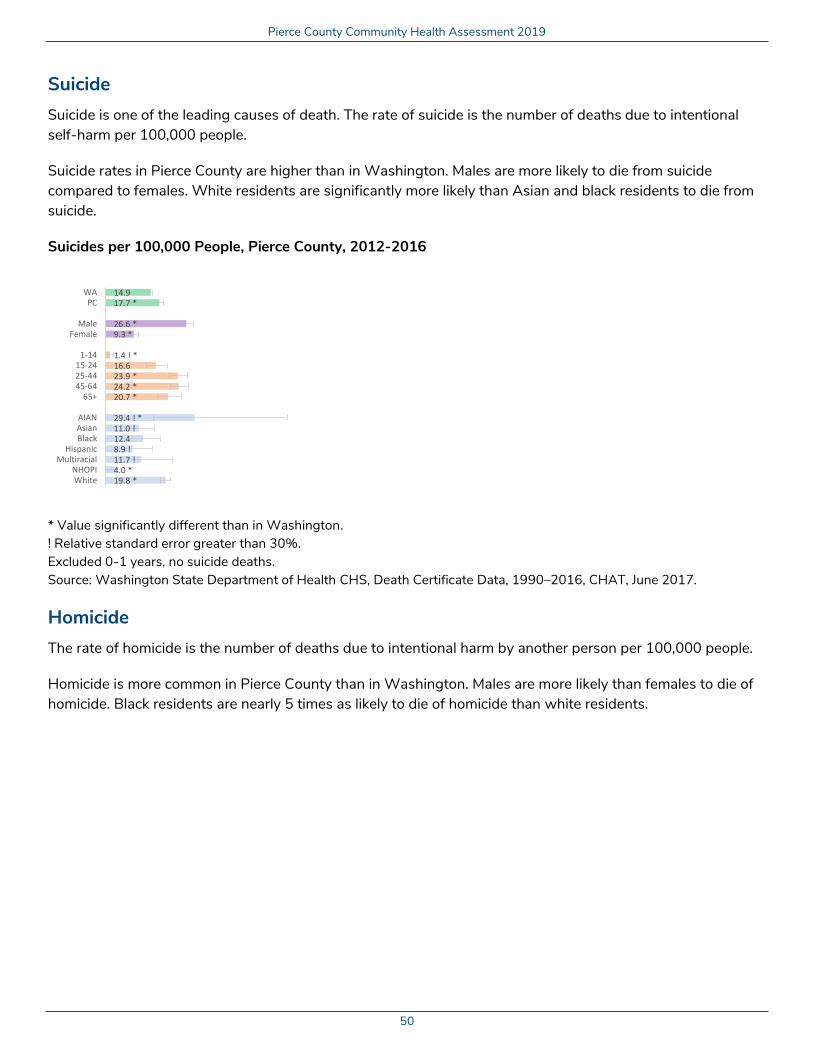
Pierce County Community Health Assessment 2019
50
Suicide Suicide is one of the leading causes of death. The rate of suicide is the number of deaths due to intentional self-harm per 100,000 people.
Suicide rates in Pierce County are higher than in Washington. Males are more likely to die from suicide compared to females. White residents are significantly more likely than Asian and black residents to die from suicide.
Suicides per 100,000 People, Pierce County, 2012-2016
* Value significantly different than in Washington. ! Relative standard error greater than 30%. Excluded 0-1 years, no suicide deaths. Source: Washington State Department of Health CHS, Death Certificate Data, 1990–2016, CHAT, June 2017.
Homicide The rate of homicide is the number of deaths due to intentional harm by another person per 100,000 people.
Homicide is more common in Pierce County than in Washington. Males are more likely than females to die of homicide. Black residents are nearly 5 times as likely to die of homicide than white residents.
14.917.7 *
26.6 *9.3 *
1.4 ! *16.623.9 *24.2 *20.7 *
29.4 ! *11.0 !12.48.9 !11.7 !4.0 *19.8 *
WAPC
MaleFemale
1-1415-2425-4445-64
65+
AIANAsianBlack
HispanicMultiracial
NHOPIWhite

Pierce County Community Health Assessment 2019
51
Homicides per 100,000 People, Pierce County, 2012-2016
* Value significantly different than in Washington. ! Relative standard error greater than 30%. Groups with cell size less than 10 excluded. Source: Washington State Department of Health CHS, Death Certificate Data, 1990–2016, CHAT, June 2017.
Hospitalizations Intentional injuries are primarily self-inflicted or assault but can also fall into an “other” category. Hospitalization rates due to intentional injuries are generated using the same 3 categories.
Pierce County residents are hospitalized due to self-harm at higher rates than the state. Females are more likely than males and people 15 to 44 years old are more likely than other ages to be hospitalized due to self-harm.
Intentional Injury Hospitalizations, Pierce County, 2011-2015
* Value significantly different than in Washington. Source: WA Hospital Discharge Data, CHARS 1987-2015. Washington State Department of Health CHS, CHAT, August 2016.
3.2
4.3 *
6.3 *
2.3
5.3 !
1.3 ! *
7.5 *
6.6 *
3.8
1.3 ! *
15.7 *
5.1 !
5.0 !
3.3
WA
PC
Male
Female
<1
1-14
15-24
25-44
45-64
65+
Black
Hispanic
Multiracial
White
71.8
97.8 *
93.1 *
102.8 *
80.6
14.0 *
138.6 *
153.6 *
103.6 *
37.9 *
WA
PC
Male
Female
<1
1-14
15-24
25-44
45-64
65+

Pierce County Community Health Assessment 2019
52
Unintentional Injuries Accidental injuries are 1 of the leading causes of hospitalization and death nationwide. Typically, unintentional injuries are due to poisonings, motor vehicle crashes and falls.
Accidental Deaths The rate of accidental deaths is the number of unintentional deaths per 100,000 people, which is measured using death certificate data.
Accidental deaths occur at similar rates in Pierce County and Washington. Males are more likely to die from unintentional injuries. American Indian and Alaska Native residents are more likely than all groups except Native Hawaiian or Pacific Islander residents to die from unintentional injuries.
Accidental Deaths per 100,000 People, Pierce County, 2012-2016
* Value significantly different than in Washington. ! Relative standard error greater than 30%. Source: Washington State Department of Health CHS, Death Certificate Data, 1990–2016, CHAT, June 2017.
Accidental Hospitalizations Hospitalizations caused by unintentional injuries are reported as a rate per 100,000 people from hospital discharge data.
Hospitalizations due to accidental injuries are more common in Pierce County than in Washington. Hospitalizations due to unintentional injuries are more common among males and with increasing age.
40.040.6
52.7 *28.9 *
50.8 !3.1 ! *23.5 *34.2 *47.8 *113.4 *
95.0 ! *24.4 *38.339.525.7 !49.9 !42.8
WAPC
MaleFemale
<11-14
15-2425-4445-64
65+
AIANAsianBlack
HispanicMultiracial
NHOPIWhite
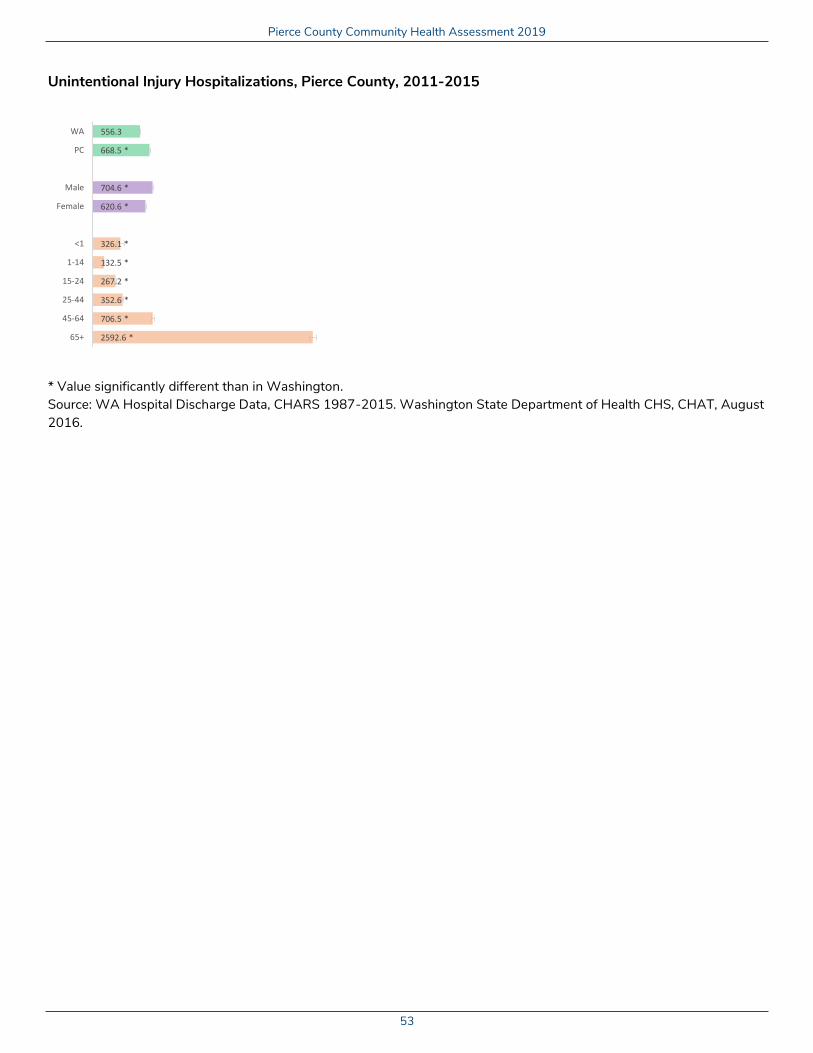
Pierce County Community Health Assessment 2019
53
Unintentional Injury Hospitalizations, Pierce County, 2011-2015
* Value significantly different than in Washington. Source: WA Hospital Discharge Data, CHARS 1987-2015. Washington State Department of Health CHS, CHAT, August 2016.
556.3
668.5 *
704.6 *
620.6 *
326.1 *
132.5 *
267.2 *
352.6 *
706.5 *
2592.6 *
WA
PC
Male
Female
<1
1-14
15-24
25-44
45-64
65+

Pierce County Community Health Assessment 2019
54
Supplement
Quantitative Data Sources The data sources included in the quantitative analysis range from those providing aggregate results for the populations of interest to those with raw data available for analysis where estimates were generated by Tacoma-Pierce County Health Department.
American Community Survey American Community Survey (ACS) is a mailed survey is an annual supplement to the 10-year census. The ACS location of residence is based on census tracts, which are converted to zip code tabulation area (ZCTA) for analysis.
Agency for Healthcare Research and Quality Prevention quality indicators (PQIs) are a set of measures generated using hospital discharge data (CHARS) based on guidance from the Agency for Healthcare Research and Quality (AHRQ).
Behavioral Risk Factor Surveillance System The Behavioral Risk Factor Surveillance System (BRFSS) is the largest, continuously conducted telephone health survey in the world. The survey collects information on a vast array of health conditions, health-related behaviors and risk and protective factor about individual adults. In 2011, a new data weighting approach was implemented, making data before 2011 unreliable for comparison to 2011 and later data.
Comprehensive Hospitalization Abstract Reporting System Comprehensive Hospitalization Abstract Reporting System (CHARS) houses hospital discharge data, including records on inpatient and observation patient hospital stays.
Community Health Assessment Tool Community Health Assessment Tool (CHAT) is a web application that allows authorized users to generate estimates for different geographies depending on the data source. Data from an array of data sources is used to generate estimates by zip code, county and state.
Washington State Department of Social and Human Services Foster care placement services, foster care support services and Child Protective Services aggregate estimates at the county level and school district level are available using the online reporting system available through Washington State Department of Social and Human Services (DSHS).

Pierce County Community Health Assessment 2019
55
Enhanced HIV/AIDS Reporting System The Enhanced HIV/AIDS Reporting System (eHARS) reporting system was developed by CDC and is managed by the Washington State Department of Health. It collects and stores HIV/AIDS case surveillance data. Reported case counts from these data are generated for Pierce County upon request.
Health Resources and Services Administration Health Professional Shortage Areas (HPSA) information was obtained through the Health Resources and Services Administration (HRSA) Data Warehouse and Map Tool available online, including shapefiles of polygon and point data for HPSAs in mental, dental and primary care.
Healthy Youth Survey The Healthy Youth Survey (HYS) is a school-based survey is administered in even-numbered years throughout Washington State to students in 6th, 8th, 10th and 12th grades. 10th grade data is used to approximate each indicator for all 8th through 12th grade youth.
Office of Superintendent of Public Instruction The Washington State Office of Superintendent of Public Instruction (OSPI) provides data on graduation and free or reduced-price meal data through the Comprehensive Education Data and Research System (CEDARS), an online system that captures information regarding student graduation, transfers and drop-outs. The adjusted cohort method follows a single cohort of students for 4 years based on when they first entered 9th grade. The cohort is adjusted by adding in students who transfer into the school and subtracting students who transfer out of the school.
Point-in-Time Count The Homeless Housing and Assistance Act (ESSHB 2163-2005) requires each county to conduct an annual point-in-time count (PIT) of sheltered and unsheltered homeless people (RCW 43.185C.030) in accordance with the requirement of the United States Department of Housing and Urban Development (HUD). Data was made available for this assessment by Pierce County; however, data for zip codes outside Pierce County were not available. Estimates were generated using data with a geographic identifier (city or zip code).
Birth Certificate Data The birth certificate record system contains records on all births occurring in the state and nearly all births to residents of Washington State. Information is gathered about the mother, father, pregnancy and child. The information is collected at hospitals and birth centers through forms completed by parents or medical staff, a review of medical charts or a combination of both. Midwives and family members who deliver the baby complete the birth certificate and collect the information from a parent or from their records. Data are compiled by the Washington State Department of Health Center for Health Statistics (CHS).

Pierce County Community Health Assessment 2019
56
Death Certificate Data Funeral directors collect information about the deceased person from an informant who is usually a family member or close friend of the deceased. A certifying physician, medical examiner or coroner generally provides cause of death information. Cause of death data is derived from underlying causes of death. For example, if a person dies of a complication or metastasis of breast cancer, breast cancer would be the underlying cause of death. Data are compiled by the Washington State Department of Health CHS
Washington State Cancer Registry Washington State Cancer Registry (WSCR) monitors the incidence of cancer in the state to better understand, control and reduce the occurrence of cancer. In 1995, WSCR received funding through CDC's National Program of Central Cancer Registries. This program is designed to standardize data collection and provide information for cancer prevention and control programs. Estimates based on this data were obtained through the Washington State Department of Health's CHAT.
Washington State Immunization Information System Washington State Immunization Information System (WSIIS) is a lifetime registry that keeps track of immunization records for people of all ages. Estimates were acquired from WSIIS. Immunization reports included data on children 19 to 35 months old, 13 to 17 years old and 15 to 17 years old.
Washington Tracking Network Washington Tracking Network (WTN) is a collection of environmental public health data. Estimates available through this resource are collected from an array of data sources and serve as a single location to see various measures affecting environmental public health.
Quantitative Methods Estimates are generated for Washington and Pierce County. In most cases we use SAS 9.4 software to analyze data. In some cases, estimates are provided from an external source. Estimates for sub-populations are also generated and maps are displayed when possible and appropriate. The following definitions help understand the contents of this report:
Rate A rate is a standardized proportion (or ratio) expressed as the number of events (e.g., live births per year) that have occurred with respect to a standard population, within a defined time period (usually 1 year). Rates help compare disease risk between groups while controlling for differences in population size. The size of the standard population used can vary depending on whether the events are common or rare. For example, since HIV is a rare condition in Washington, HIV incidence rates are expressed as new cases per 100,000. Crude rates are rates calculated for a total population, while age-specific rates are calculated for specific age groups.

Pierce County Community Health Assessment 2019
57
Age-Adjustment All age-adjusted mortality and disease rates in this report are adjusted to the 2000 United States population. The risk of death and disease is affected primarily by age. As a population ages, its collective risk of death and disease increases. As a result, a population with a higher proportion of older residents will have higher crude death and disease rates. To control for differences in the age compositions of the communities being compared, death and certain specific disease rates are age-adjusted. This aids in making comparisons across populations.
Averages Multiyear average estimates were used in order to increase sample sizes and to minimize widely fluctuating frequencies from year to year.
Confidence Intervals Pierce County comparisons to Washington State and comparisons among subpopulations were calculated using 95% confidence intervals (CIs). CIs (error bars on graphs) indicate the margin of error for the value estimated by describing an upper and lower limit of an estimate. Using CIs is an approach to determine if differences among groups are statistically significant. If the confidence interval of 2 different estimates do not overlap, we most often can conclude that the difference is statistically significant and not due to chance.
Standard Error Standard errors (SEs) are used to determine significance between groups in the analysis. Unless noted, these are based on 95% CIs, or an alpha of 0.05. Relative standard error (RSE) is used to determine what statistics are reported. If the RSE is greater than 30% and/or the sample size is too limited to have confidence in these estimates, then they are excluded. If the RSE is greater than 30%, but the estimates may still be reliable, then they are presented but with a “!” to draw attention to this concern.
Stratification Where possible (i.e., population size or counts were adequate to determine significance and protect anonymity), we analyzed the indicators by race/ethnicity or gender. We used the following terms to describe race/ethnicity:
• NH: Non-Hispanic. • Asian: Non-Hispanic Asian. • AIAN: Non-Hispanic American Indian/Alaska Native. • Black: Non-Hispanic black or African American. • Hispanic: Hispanic as a race. • Multiracial: More than 1 race. • NHOPI: Non-Hispanic Native Hawaiian or Pacific Islander. • White: Non-Hispanic white or Caucasian.
Pierce County Community Health Assessment 2019
58
For some indicators, these stratification levels may not have a sample size adequate to draw reliable conclusions about that population and are therefore excluded from this report. Groups are typically not combined due to concerns about over-generalizations made based on those results.
Selection of Priority Health Needs Key findings were identified as priority health needs using 4 criteria. A public health epidemiologist reviewed data from each CHA and applied the following criteria:
1. When compared to Washington State, Pierce County numbers are statistically significantly worse (1 point).
2. Existing estimates present a trend in the negative direction (1 point). 3. The measure is related to listed themes from community engagement activities (1 point). 4. There is an appearance of inequity by gender or by race (2 points).
All health indicators and themes are scored and ranked using the above criteria. Based on the results of the ranking, at least 3 and no more than 6 key findings are identified per CHA report.

Pierce County Community Health Assessment 2019
59
Appendix 1—Community Workshop Summary
Workshop Methods The purpose of the community workshops was to hear directly from residents. Ten community workshops (focus groups) were held throughout Pierce County. The same questions were used at all workshops. Four workshops were facilitated by trained community residents. The remainder were facilitated by Tacoma-Pierce County Health Department staff. Notes were handwritten on flip charts or typed on laptops. Participants were promised confidentiality and gave their consent to participate by attending the workshop.
Participant Selection Criteria Participants from 10 geographies and populations were identified based, in part, on priority communities identified in the 2015 Tacoma-Pierce County Health Department Health Equity Assessment. Specific populations were identified based their geographic location and health outcomes. We also referred to literature on stakeholder selection for Community Health Needs Assessments (CHNAs) produced by the Health Research and Educational Trust, in partnership with Hospitals in Pursuit of Excellence. Participants were recruited by facilitators or Tacoma-Pierce County Health Department staff and some workshops were held at scheduled activities (e.g., community dinner, support group). In some cases, participants invited others to attend (i.e., snowball sampling method).
What We Heard—Major Themes Question 1: What do you think makes an “ideal” community/neighborhood? What do you like about your community/neighborhood? What do you need?
• Opportunities to give and receive social support. o People know and care for each other. o Cultural knowledge and traditions are shared. o Residents care about issues and volunteer often.

Pierce County Community Health Assessment 2019
60
• Diversity is valued. o All people are accepted. o Ethnic and cultural diversity are celebrated. o Everyone is respected for the value they bring.
• Community resources.
o Reliable source of community information. o Parks and other opportunities for physical activities. o Unique physical setting of community. o Access to services. o Behavioral health services and support, including
opportunities for training.
• Organizations and groups willing to partner. o Groups, coalitions and others who provide active
leadership. o Questions are answered in layman’s terms. o Regular consensus-building feedback.
Question 2: What needs to change about your community/neighborhood? What is missing? What do you need?
• Safe sidewalks and trails. o Trails for biking and walking. o Americans with Disabilities Act- (ADA-) compliant sidewalks and trails. o Connections to schools and services.
• Buses that meet people where they live, learn, work and shop.
o More transit and public transportation. o Free bus passes for those who need it. o More bus stops.
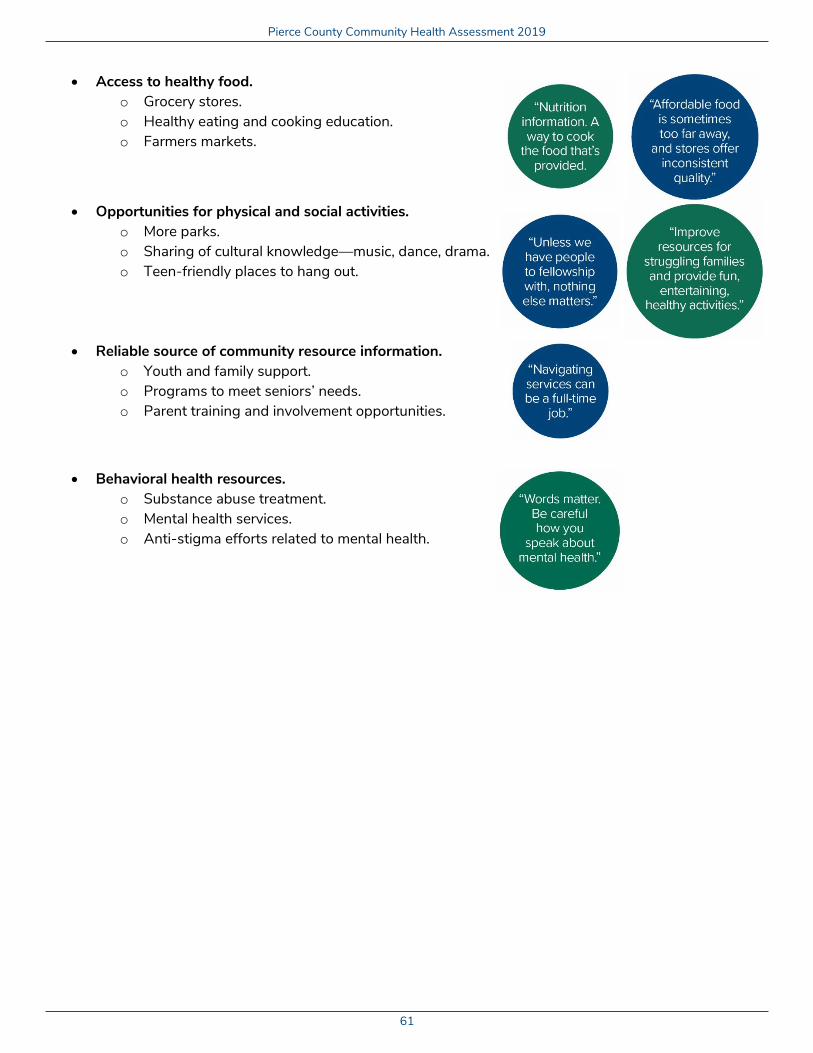
Pierce County Community Health Assessment 2019
61
• Access to healthy food. o Grocery stores. o Healthy eating and cooking education. o Farmers markets.
• Opportunities for physical and social activities. o More parks. o Sharing of cultural knowledge—music, dance, drama. o Teen-friendly places to hang out.
• Reliable source of community resource information. o Youth and family support. o Programs to meet seniors’ needs. o Parent training and involvement opportunities.
• Behavioral health resources. o Substance abuse treatment. o Mental health services. o Anti-stigma efforts related to mental health.
Pierce County Community Health Assessment 2019
62
Appendix—2 Forces of Change
Overview The Forces of Change Assessment is 1 of 4 assessments conducted as a part of the Community Health Assessment/Community Health Improvement Plan process. This assessment focuses on identifying factors that affect Pierce County residents’ health.
Four assessment workshops were held:
• Key Peninsula (rural community partners). • Tacoma-Pierce County Board of Health. • Tacoma (urban community partners). • Tacoma-Pierce County Health Department staff.
The workshops used 4 social determinants as a framework:
• Transportation. • Food. • Jobs. • Housing.
Participants were asked to consider the question: What happened in the past, is happening now or may happen in the future that can affect Pierce County residents’ quality of life?
• Trends—Patterns over time, like migration in and out of a community or a growing disillusionment with government.
• Factors—Discrete elements, like a community’s large ethnic population, an urban or rural setting or the community’s proximity to a major waterway.
• Events—One-time occurrences, like a business or hospital closing, a natural disaster or the passage of new legislation.
Transportation • + Link light rail expanding in Tacoma. • Lack of comprehensive transit options. • Roads are at or near capacity. • Lack of public transit options in many places. • Increased commute times contribute to CO2 emissions. • Lack of safe sidewalks and crosswalks in some neighborhoods.

Pierce County Community Health Assessment 2019
63
Food • + Food bank network. • + Trend toward community gardens as source of local fresh produce and community gathering. • Poverty is a driving force; unhealthy choices are cheaper. • Time pressures—i.e., families don’t have time to prepare healthy meals. • Disparities related to healthy food access between neighborhoods. Quality of choices vary by area. • Increase in obesity, diabetes and heart disease.
Jobs • + Innovative programs and partnerships—e.g., Tacoma Public Schools/MultiCare, Tacoma-Pierce
County Health Department/University of Washington—Tacoma. • + Community colleges offer trade skills and a pathway to 4-year degrees. • Lack of family-wage jobs. • Emphasis on 4-year degrees vs. trade schools/programs. This limits those entering the workforce and
creates a culture that isn’t an appropriate expectation or realistic for all students. • Cost of commuting. • Aging workforce.
Housing • + Trend toward walkable communities. • Homelessness. • Housing affordability. • Challenge for those wanting to own homes and build wealth. • Housing costs too great a percentage of income. • Gentrification in some communities. • Lack of rental options; cost of renting. • Pierce County residents work in King County (Tacoma and Pierce County as bedroom communities).
General comments • We are not giving opportunities for everyone to “get in the room at the same time” (to talk about needs
and issues). Need high-level, as well as the individual affected by it personally. • Immigrants moving into Pierce County and the result of the housing squeeze in King County are a
perceived driver in the housing market. • Displacement from King County (due to cost) is causing many issues. • Access to community resources—e.g., informational resources. Making sure community members
know who to talk to, and how to advocate for yourself to improve your conditions. And understand the legislative process.
Pierce County Community Health Assessment 2019
64
Appendix—3 Communities of Focus
Health Equity in Action In 2015, Tacoma-Pierce County Health Department looked at Pierce County data by zip codes to see if any patterns were identifiable. This Health Equity Assessment Report showed which zip codes had the worst health outcomes in the county.
Based on this assessment, Tacoma-Pierce County Health Department established Communities of Focus as an initiative to prioritize efforts in areas of the county with the worst health outcomes. The communities were selected based on health outcome data and if the community has established partnerships and current Health Department programs that could be built on.
In 2015, East Tacoma (98404) was established as the first Community of Focus. In 2017, Key Peninsula (98394 and surrounding areas) and Springbrook (98439) were added. In 2018, work was started in White River (98391 and surrounding areas), Parkland (98444) and South Tacoma (98409).
Communities of Focus is one of the ways Tacoma-Pierce County Health Department demonstrates health equity. Specifically, we direct investments to communities, coordinate Health Department programs to maximize effectiveness and collaborate with partners to improve equity outcomes. Community empowerment is central to Communities of Focus work. An example of this strategy is to empower communities by working directly with residents to help draw out and identify the issues of greatest importance and to facilitate action planning with community driven priorities.
Community Snapshots Assessments have been prepared for each community to understand key health data, existing partnerships and other important background information. These assessments, or “snapshots,” are intended to be iterative. Tacoma-Pierce County Health Department and each community can use them to mutually update and share important issues and actions:
• East Tacoma. • Key Peninsula. • Parkland. • South Tacoma. • Springbrook. • White River.
Each community is in a different phase of development (e.g., little community input received, community engagement in process, priorities established). Working with residents and local leaders to share information and determine important issues and needs will take different levels of effort and engagement within each community. These reports will be updated at regular intervals.