pike county joint vocational school district · pike county joint vocational school district ......
TRANSCRIPT


PIKE COUNTY JOINT VOCATIONAL SCHOOL DISTRICT PIKE COUNTY
TABLE OF CONTENTS
TITLE PAGE
Independent Auditor’s Report ..................................................................................... Under Separate Cover Comprehensive Annual Financial Report .................................................................. Under Separate Cover
Independent Auditor’s Report on Internal Control Over Financial Reporting and on Compliance and Other Matters Required by Government Auditing Standards ........................................................................................... 1 Schedule of Findings ..................................................................................................................................... 3

This page intentionally left blank.

1
INDEPENDENT AUDITOR’S REPORT ON INTERNAL CONTROL OVER FINANCIAL REPORTING AND ON COMPLIANCE AND OTHER MATTERS
REQUIRED BY GOVERNMENT AUDITING STANDARDS Pike County Joint Vocational School District Pike County 175 Beaver Creek Road Piketon, Ohio 45661 To the Board of Education: We have audited, in accordance with auditing standards generally accepted in the United States and the Comptroller General of the United States’ Government Auditing Standards, the financial statements of the governmental activities, each major fund, and the aggregate remaining fund information of the Pike County Joint Vocational School District, Pike County, (the District) as of and for the year ended June 30, 2017, and the related notes to the financial statements, which collectively comprise the District’s basic financial statements and have issued our report thereon dated December 20, 2017.
Internal Control Over Financial Reporting As part of our financial statement audit, we considered the District’s internal control over financial reporting (internal control) to determine the audit procedures appropriate in the circumstances to the extent necessary to support our opinions on the financial statements, but not to the extent necessary to opine on the effectiveness of the District’s internal control. Accordingly, we have not opined on it. A deficiency in internal control exists when the design or operation of a control does not allow management or employees, when performing their assigned functions, to prevent, or detect and timely correct misstatements. A material weakness is a deficiency, or combination of internal control deficiencies resulting in a reasonable possibility that internal control will not prevent or detect and timely correct a material misstatement of the District’s financial statements. A significant deficiency is a deficiency, or a combination of deficiencies, in internal control that is less severe than a material weakness, yet important enough to merit attention by those charged with governance. Our consideration of internal control was for the limited purpose described in the first paragraph of this section and was not designed to identify all internal control deficiencies that might be material weaknesses or significant deficiencies. Therefore, unidentified material weaknesses or significant deficiencies may exist. Given these limitations, we did not identify any deficiencies in internal control that we consider material weaknesses. We did identify a certain deficiency in internal control, described in the accompanying schedule of findings that we consider a significant deficiency. We consider finding 2017-001 to be a significant deficiency. Compliance and Other Matters
As part of reasonably assuring whether the District’s financial statements are free of material misstatement, we tested its compliance with certain provisions of laws, regulations, contracts, and grant agreements, noncompliance with which could directly and materially affect the determination of financial statement amounts. However, opining on compliance with those provisions was not an objective of our audit and accordingly, we do not express an opinion. The results of our tests disclosed no instances of noncompliance or other matters we must report under Government Auditing Standards.
CorporateCentreofBlueAsh,11117KenwoodRoad,BlueAsh,Ohio45242Phone:513‐361‐8550or800‐368‐7419Fax:513‐361‐8577
www.ohioauditor.gov

2
Pike County Joint Vocational School District Pike County Independent Auditor’s Report on Internal Control Over Financial Reporting and on Compliance and Other Matters Required by Government Auditing Standards Page 2 District’s Response to Finding
The District’s response to the finding identified in our audit is described in the accompanying schedule of findings. We did not audit the District’s response and, accordingly, we express no opinion on it. Purpose of this Report
This report only describes the scope of our internal control and compliance testing and our testing results, and does not opine on the effectiveness of the District’s internal control or on compliance. This report is an integral part of an audit performed under Government Auditing Standards in considering the District’s internal control and compliance. Accordingly, this report is not suitable for any other purpose. Dave Yost Auditor of State Columbus, Ohio December 20, 2017

3
PIKE COUNTY JOINT VOCATIONAL SCHOOL DISTRICT PIKE COUNTY
SCHEDULE OF FINDINGS
FOR YEAR ENDED JUNE 30, 2017
FINDINGS RELATED TO THE FINANCIAL STATEMENTS REQUIRED TO BE REPORTED IN ACCORDANCE WITH GAGAS
FINDING NUMBER 2017-001
Significant Deficiency Governments are required to maintain an accounting system and accounting records sufficient to identify, assemble, analyze, classify and report its transactions, maintain accountability for the related assets, document compliance with finance-related legal and contractual requirements and prepare financial statements. We noted the District had an unrecorded accounts payable liability at year-end of $28,800 in the Adult Education fund. This transaction was also not properly encumbered. The District corrected the financial statements and accounting records, where appropriate. Failure to accurately post and report transactions could result in material errors in the District's financial statements and reduces the District's ability to monitor financial activity and to make sound decisions which effect the overall available cash positions of the District. We recommend that the District accurately record financial transactions. Officials’ Response: The District will correct this error and will accurately record financial transactions in the future.

This page intentionally left blank.

Pike County Joint Vocational School District
Piketon, Ohio
Comprehensive Annual Financial Report
For the Fiscal Year Ended June 30, 2017

This Page Intentionally Left Blank

Pike County Joint Vocational School District
Piketon, Ohio
Comprehensive Annual Financial Report for
The fiscal year ended June 30, 2017
Issued by: Treasurer’s Office Tonya L. Cooper, Treasurer

This Page Intentionally Left Blank

Automotive 11 & 12 (ITIM)/(ITAP) Information
Technology/Interactive Media
Basic food service 12
Public Safety 12

This Page Intentionally Left Blank

i
Pike County Joint Vocational School DistrictComprehensive Annual Financial ReportFor The Fiscal Year Ended June 30, 2017
TABLE OF CONTENTS
INTRODUCTORY SECTION
Table of Contents............................................................................................................................. iLetter of Transmittal .......................................................................................................................vGFOA Certificate of Achievement ................................................................................................xiASBO Certificate of Excellence ...................................................................................................xiiList of Principal Officials ........................................................................................................... xiiiOrganizational Chart....................................................................................................................xiv
FINANCIAL SECTION
Independent Auditor’s Report ........................................................................................................1
Management’s Discussion and Analysis ........................................................................................4
Basic Financial Statements:
Government-wide Financial Statements:
Statement of Net Position.......................................................................................................12
Statement of Activities...........................................................................................................13
Fund Financial Statements:
Balance Sheet – Governmental Funds ...................................................................................14
Reconciliation of Total Governmental Fund Balances toNet Position of Governmental Activities ............................................................................15
Statement of Revenues, Expenditures and Changes in FundBalances – Governmental Funds ........................................................................................16
Reconciliation of the Statement of Revenues, Expenditures andChanges in Fund Balances of Governmental Funds to
the Statement of Activities...............................................................................................17

ii
Pike County Joint Vocational School DistrictComprehensive Annual Financial ReportFor The Fiscal Year Ended June 30, 2017
TABLE OF CONTENTS(Continued)
Statement of Revenues, Expenditures and Changes in Fund Balance –Budget and Actual (Budget Basis) – General Fund............................................................18
Statement of Fiduciary Assets and Liabilities – Agency Funds.............................................19
Notes to the Basic Financial Statements ...................................................................................20
Required Supplementary Information:
Schedule of the School District’s Proportionate Share of the Net Pension Liability – SERS – Last Four Fiscal Years ............................................................52
Schedule of the School District’s Proportionate Share of the Net Pension Liability – STRS – Last Four Fiscal Years ............................................................53
Schedule of School District Contributions – SERS – Last Ten Fiscal Years .............................54
Schedule of School District Contributions – STRS – Last Ten Fiscal Years .............................56
Notes to the Required Supplementary Information ....................................................................58
Combining and Individual Fund Statements:
Nonmajor Fund Descriptions ....................................................................................................60
Combining Statements – Nonmajor Funds:
Combining Balance Sheet – Nonmajor Governmental Funds..............................................63
Combining Statement of Revenues, Expenditures and Changes inFund Balances – Nonmajor Governmental Funds...........................................................64
Combining Balance Sheet – Nonmajor Special Revenue Funds..........................................65
Combining Statement of Revenues, Expenditures and Changes inFund Balances – Nonmajor Special Revenue Funds .......................................................68
Agency Fund Descriptions ........................................................................................................71
Statement of Changes in Assets and Liabilities – Agency Funds .............................................72
Schedule of Revenues, Expenditures and Changes inFund Balance – Budget and Actual (Budget Basis) for the following funds:
Major Funds:General Fund ...................................................................................................................74Permanent Improvement Fund ........................................................................................78

iii
Pike County Joint Vocational School DistrictComprehensive Annual Financial ReportFor The Fiscal Year Ended June 30, 2017
TABLE OF CONTENTS(Continued)
Nonmajor Funds:Food Service Fund...........................................................................................................79Adult Education Fund......................................................................................................80Ohio School Facilities Maintenance Fund.......................................................................81Pre-Service School Bus Driver Training Fund................................................................82Career Development Fund...............................................................................................83ONENet Ohio Fund .........................................................................................................84Adult Basic Literacy Education Fund..............................................................................85Vocational Education Fund .............................................................................................86Improving Teacher Quality Fund ....................................................................................87Miscellaneous Federal Grants Fund ................................................................................88
STATISTICAL SECTION
Statistical Tables Descriptions......................................................................................................89
Net Position by Component – Governmental Activities – Last Ten Fiscal Years........................90
Changes in Net Position – Governmental Activities – Last Ten Fiscal Years .............................92
Program Revenues by Function / Program – Governmental Activities –Last Ten Fiscal Years ................................................................................................................96
Fund Balances – Governmental Funds – Last Ten Fiscal Years ..................................................98
Changes in Fund Balances – Governmental Funds – Last Ten Fiscal Years .............................100
Assessed Valuation and Estimated Actual Value of Taxable Property –Last Ten Collection (Calendar) Years .....................................................................................102
Principal Real and Personal Property Taxpayers – Fiscal Years 2015 and 2008 .......................104
Property Tax Rates (Per $1,000 of Assessed Valuation) – Direct and Overlapping Governments – Last Ten Collection (Calendar) Years.......................................106
Property Tax Levies and Collections – Real, Public Utility and Tangible Personal Property – Last Ten Collection (Calendar) Years.....................................................109
Ratios of Debt to Estimated Actual Value, Personal Income and Debt Per Capita – Last Ten Fiscal Years .................................................................................................110
Computation of Direct and Overlapping Debt............................................................................113
Computation of Legal Debt Margin – Last Ten Fiscal Years.....................................................114
Principal Employers – Fiscal Years 2015 and 2008 ...................................................................116

iv
Pike County Joint Vocational School DistrictComprehensive Annual Financial ReportFor The Fiscal Year Ended June 30, 2017
TABLE OF CONTENTS(Continued)
Demographic and Economic Statistics – Last Ten Fiscal Years ................................................118
Building Statistics – Last Ten Fiscal Years ................................................................................120
Employees by Function – Last Ten Fiscal Years .......................................................................126
Per Pupil Cost – Last Ten Fiscal Years ......................................................................................128
Teaching Staff Education and Experience..................................................................................129
Percentage of Students who Receive Free and Reduced Lunches – Last Ten Fiscal Years..............................................................................................130

v
Pike County Career Technology Center Eric Meredith, Superintendent Shon Tackett, Director Nancy Bloomfield, Director of Guidance Tonya Cooper, Treasurer
December 20, 2017 Board of Education Members and Residents of the Pike County Joint Vocational School District: We are pleased to present the Comprehensive Annual Financial Report (CAFR) of the Pike County Joint Vocational School District for the fiscal year ended June 30, 2017. This CAFR, which includes financial statements and other financial and statistical data, conforms to generally accepted accounting principles as applicable to governmental entities. The intent of this report is to provide the taxpayers of the Pike County Joint Vocational School District with comprehensive financial data in a format that enables them to gain a true understanding of the School District’s financial affairs as well as provide management with better financial information for future decision making. This report enables the School District to comply with Ohio Administrative Code Section 117-2-03(B), which requires reporting on a GAAP (Generally Accepted Accounting Principles) basis, and Ohio Revised Code Section 117.38, which requires that school districts reporting on a GAAP basis file an unaudited annual report with the Auditor of State within 150 days of fiscal year-end. Management assumes full responsibility for the completeness and reliability of the information contained in this report, based upon a comprehensive framework of internal control that it has established for this purpose. Because the cost of internal control should not exceed the anticipated benefits, the objective is to provide reasonable, rather than absolute, assurance that the financial statements are free of any material misstatements. Ohio Auditor of State, has issued an unmodified (“clean”) opinion on the Pike County Joint Vocational School District’s financial statements for the fiscal year ended June 30, 2017. The independent auditor’s report is located at the front of the Financial Section of this report. Management’s discussion and analysis immediately follows the independent auditor’s report and provides a narrative introduction, overview, and analysis of the basic financial statements. Management’s discussion and analysis complements this letter of transmittal and should be read in conjunction with it.

vi
FORMATION OF THE SCHOOL DISTRICT
The Pike County Joint Vocational School District offers students a variety of classes, including Innovative Medical Technician, Patient Care Technician, Building Maintenance, Basic Food Service,Culinary, Hospitality and Facility Care, Business Management, Interactive Media, Automotive Technology, Carpentry, Electricity, Welding, Public Safety, Heating, Ventilation, Air Conditioning, Engineering Technology, and Agriculture and Environmental Systems.
The Pike County Joint Vocational School District was established in 1956. This marked the beginning of jointures for a single county vocational school district. We are very proud of the fact that the Pike County Joint Vocational School District was the first of its kind in the State of Ohio.
The original location of the school was 941 Market Street, Piketon, Ohio, but this location no longer fit the needs of the vocational students of the County. In 1982, the Pike County Joint Vocational School District moved to its current site at 175 Beaver Creek Road, Piketon, Ohio. This move did not come about without a struggle. In 1972, the Division of Vocational Education of the State Department of Education attempted to cease the existence of the School District. The students of Pike County who wished to choose a vocational education would be sent either to the Pickaway-Ross Jointure or the Scioto County Jointure, two neighboring districts. Through the leadership of Ohio House of Representative’s Speaker Vernal G. Riffe, Jr., this action was nullified. This was done by granting an exemption to the Pike County Joint Vocational School District exclusively. Speaker Riffe also led the effort to receive funding necessary to erect the existing building. The citizens of Pike County passed a bond levy issue, but more financial resources were needed. The additional monies were received through the tireless efforts led by Speaker Riffe, former Superintendent Kenneth Thompson and former Vocational Director Lindsay Ratliff. The School District exists today because our State Representative truly represented our county, its people and, most importantly, the future of our students. The School District’s building was built in 1980 with a major addition and renovation project being completed in fiscal year 2009.
Because of Vernal G. Riffe, Jr.’s immense support and effort on behalf of the youth of Pike County toward affording them the opportunity of obtaining a vocational education, the new structure was named the Vernal G. Riffe, Jr. Joint Vocational School of Pike County by Board Resolution.
FORM OF GOVERNMENT AND REPORTING ENTITY
The Pike County Joint Vocational School is a body politic and corporate established for the purpose of exercising the rights and privileges conveyed to it by the constitution and laws of the State of Ohio.
House Bill 59, which was passed in 2013, changed the composition of the Pike County Joint Vocational School District Board of Education. The five-member Pike County Joint Vocational School District Board of Education is comprised of one representative appointed by the one city school district in the County and four are appointed from the Ross-Pike County Educational Service Center. New members may serve an unlimited amount of 3-year terms. The appointing board shall appoint individuals who represent employers in the region who are qualified to consider the state’s workforce opportunities. During 2017, House Bill 3 was passed which stated that “members of a joint vocational school district board may either be a current elected board member of a school district board that is a member of the joint vocational school district or an individual who has experienced or knowledge regarding the labor needs of the state and region with an understanding of the skills, training, and education needed for current and future employment opportunities in the state. The appointing board may give preference to individuals who have served as members on a joint vocational school business advisory committee.” The Board of Education serves as the taxing authority, contracting body and policy maker for the School District. The Board adopts the annual operating budget and approves all expenditures of School District monies. The appointing board of education cannot directly impose its will on the School District.

vii
The Superintendent is the chief administrative officer of the School District and is responsible for the development, supervision, and operation of the school programs and facilities.
The Treasurer is the chief financial officer of the School District, and is responsible for maintaining financial records, issuing warrants, acting as the custodian of all School District funds and investing idle funds as specified by Ohio law.
Other administrators include a Vocational Director, a Director of Adult and Continuing Education, and supervisors of various educational and support services.
The School District employs 59 full-time employees. These employees include certified, non-certified and administrative personnel providing services to 388 students. Due to the student enrollment of the local school districts and its current enrollment, the Pike County Joint Vocational School District anticipates its student enrollment to remain consistent from school year to school year.
The reporting entity consists of all funds, departments, boards and agencies that are not legally separate from the School District. This includes general operations, food service and student related activities of the School District.
Component units are legally separate organizations for which the School District is financially accountable. The School District is financially accountable for an organization if the School District appoints a voting majority of the organization’s governing board and (1) the School District is able to significantly influence the programs or services performed or provided by the organization; or (2) the School District is legally entitled to or can otherwise access the organization’s resources; the School District is legally obligated or has otherwise assumed the responsibility to finance the deficits of, or provide financial support to, the organization; or the School District is obligated for the debt of the organization. Component units may also include organizations that are fiscally dependent on the School District in that the School District approves the organization’s budget, the issuance of its debt or the levying of its taxes, and there is a potential for the organization to provide specific financial benefits to, or impose specific financial burdens on, the School District. The School District has no component units.
The Village of Piketon and the member school districts have not been included in the accompanying financial statements. The boards are not appointed by the School District, nor are they fiscally dependent on the School District. The South Central Ohio Computer Association Regional Council of Governmentsand the Coalition of Rural and Appalachian Schools are reported as jointly governed organizations in Note 18. The Ohio SchoolComp Group Retrospective Rating Program and the Ohio School Plan arereported as insurance purchasing pools in Note 18.
The School Board adopts an annual budget, for all funds except agency funds, by July 1 which may be amended any time during the fiscal year as new information becomes available. This annual budget serves as the foundation of the Pike County Joint Vocational School District’s financial planning and control. The objective of budgetary controls is to ensure compliance with legal provisions embodied in the annual appropriation resolution. The legal level of budgetary control (the level at which expenditures cannot legally exceed the appropriated amount) is established at the fund level. The Treasurer has been authorized to allocate Board appropriations to the function and object level within each fund.

viii
ECONOMIC CONDITION AND OUTLOOK
Major industries located within the School District’s boundaries include paper, automotive components, and fuel enrichment industries.
Pike County is a rural community in Southern Ohio with relatively high unemployment rates. According to the Ohio Department of Job and Family Services, the unemployment rate decreased from 7.3 percent in 2016 to 7.1 in 2017. The population of Pike County in the 2010 census was 28,709. The economic growth in Pike County is uncertain at the present time. This is due to the closing of MASCO Retail Cabinet Group (formerly Mill’s Pride) in 2011 and the closing of other local establishments throughout the year. The addition of Fluor-B&W at the U.S. Department of Energy’s Gaseous Diffusion Plant in Piketon is another hope for the County for the addition of jobs to the area.
The Pike County Joint Vocational School District is located in the center of the four member school districts it serves. The School District encompasses approximately 444 square miles which includes one city, two villages and many townships. The County itself is located approximately 60 miles south of Columbus on U.S. Route 23, 75 miles east of Cincinnati on U.S. Route 32, and 50 miles north of Ashland, Kentucky. This central position provides a strategic location for the future development of business and industry.
Agriculture contributes over $14 million of agricultural output annually to the County’s economy. There were approximately 540 farms located over 79,000 acres in Pike County in 2009. Farming in Pike County continues to develop and become more commercial. In fact, the average size of a farm in 2009 was 146 acres with average receipts per farm of $27,736 (Pike County Auditor). Pike County has approximately 23 sawmills which produce over 30 million board feet of lumber annually.
Tourism has improved and grown in Pike County. The summer parks and resorts in the County (Pike Lake State Park and Long’s Retreat) will help to improve the tourism sector of the County’s economy. Pike County also has a PGA rated golf course, Big Beaver Creek Golf Club. The course helps to bring visitors to the County.
Graduates of the Pike County Joint Vocational School District may seek local employment with major industrial employers like Van-Rob formerly Brown Corporation, the Gas Centrifuge Enrichment Plant, and Fluor-B&W.
FINANCIAL TRENDS
During fiscal year 2017, the School District was on the guarantee with State foundation revenue (cash basis), there was no increase or decrease in State funding. We hope with the addition of our new Vocational Agricultural Program, our enrollment will increase and we can start receiving additional funding in the future.
FINANCIAL PLANNING AND POLICIES
Another issue the School District is encountering is House Bill 282. House Bill 282 requires career-technical centers to spend weighted funds from the State only on costs associated with the delivery of career-technical programming to career-technical students. In May 2004, part of this bill was replaced to require career-technical centers to spend at least 75 percent of their weighted State funds on specified areas; these areas do not include salaries or fringe benefits. This amendment to House Bill 282 requiresthe Pike County Joint Vocational School District to keep our expenditures on vocational instruction, excluding salaries and fringe benefits, at a much higher level. With the new State budget, any unused funds will be returned to the State for redistribution.

ix
MAJOR INITIATIVES
FOR THE YEAR
Accomplishments by the students of the School District included State and National level honors for Business Professionals of America, Skills-USA and Family, Career and Community Leaders of America. The Pike County Joint Vocational School District received the Certificate of Achievement for Excellence in Financial Reporting award from the Government Finance Officers Association and the Certificate of Excellence in Financial Reporting award from the Association of School Business Officials International for its CAFR for the fiscal year ended June 30, 2016.
FOR THE FUTURE
The School District’s five-year forecast continues to be the instrument used to make future decisions with regard to program and funding strategies. Because the State of Ohio provides the majority of its funding, the School District is very concerned as to what effect the phase out of the tangible personal property tax distributions will have on its General Fund. The School District was to receive tangible personal property tax loss reimbursement payments through fiscal year 2015. With the passage of HB 64, the phase out of the Tangible Personal Property Tax began in fiscal year 2016. The School District will lose approximately $458,600 between fiscal years 2016 and 2018. We are hopeful that with the projected increase in enrollment for the 2017-2018 school year, our State foundation will increase. However,House Bill 64 limits growth to 7.5 percent for fiscal year 2017 and with HB 49, the funding formula changed and we are expected to lose an additional $166,000 due to decreased enrollment over the three year average. Career-Technical Education funding was removed from the guarantee base and was exempt from the cap in fiscal year 2017. We are hopeful this will help offset the loss of funds from the Tangible Personal Property Tax Loss.
The Treasurer plans to continue with the Comprehensive Annual Financial Report in future fiscal years.
AWARDS AND ACKNOWLEDGEMENTS
GFOA CERTIFICATE OF ACHIEVEMENT
The Government Finance Officers Association of the United States and Canada (GFOA) awarded a Certificate of Achievement for Excellence in Financial Reporting to the Pike County Joint Vocational School District for its CAFR for the fiscal year ended June 30, 2016. The Pike County Joint Vocational School District has received a Certificate of Achievement for the last twenty-one fiscal years. In order to be awarded a Certificate of Achievement, a government must publish an easily readable and efficiently organized comprehensive annual financial report. This report must satisfy both generally accepted accounting principles and applicable legal requirements.
A Certificate of Achievement is valid for a period of one year only. We believe that our current comprehensive annual financial report continues to meet the Certificate of Achievement Program’s requirements and we are submitting it to the GFOA to determine its eligibility for another certificate.
ASBO CERTIFICATE OF EXCELLENCE
The Association of School Business Officials International (ASBO) awarded a Certificate of Excellence in Financial Reporting to the Pike County Joint Vocational School District for its CAFR for the fiscal year ended June 30, 2016.

x
A Certificate of Excellence is awarded to those school districts who have voluntarily submitted their system’s CAFR for review by an ASBO Panel of Review. Upon completion of a vigorous technical review, the panel members conclude whether the school system’s financial report has met the criteria for excellence in financial reporting.
ACKNOWLEDGMENTS
The publication of this report is a major step toward professionalizing the financial reporting of the Pike County Joint Vocational School District. Appreciation is expressed to the Treasurer’s staff: Janet Bobst and Paula Staker. A special thank you is also extended to the Local Government Services Section of the Office of the Auditor of State for their assistance in preparing this year’s CAFR. Sincere gratitude goes to the Board of Education, where the commitment to excellence begins.
Respectfully submitted,
Eric D. Meredith, Superintendent
Tonya L. Cooper, TreasurerPike County Joint Vocational School District

xi

The Certificate of Excellence in Financial Reportingis presented to
Pike County Joint Vocational School District
for its Comprehensive Annual Financial Report (CAFR) for the Fiscal Year Ended June 30, 2016.
The CAFR has been reviewed and met or exceeded
ASBO International’s Certificate of Excellence standards.
Anthony N. Dragona, Ed.D., RSBA John D. Musso, CAE President Executive Director
xii

xiii
Pike County Joint Vocational School DistrictList of Principal Officials
June 30, 2017
Board of Education
Mr. Jan L. Leeth .................................................................................... PresidentMr. Gregory Fout.......................................................................... Vice-PresidentMrs. Sharon Manson................................................................................MemberMr. Turman Helton..................................................................................MemberMr. Tim Williams ....................................................................................Member
Administration
Mr. Eric D. Meredith .................................................................... SuperintendentMrs. Tonya L. Cooper ...........................................................................TreasurerMr. Shon Tackett .................................................................. Vocational DirectorMrs. Nancy Bloomfield ...................................................... Director of GuidanceMr. Lathe Moore...........................................Director of Adult Education/ABLE

Pike
Cou
nty
Care
er T
echn
olog
y Ce
nter
Org
aniz
atio
nal C
hart
BOAR
D O
F ED
UCA
TIO
N
SUPE
RIN
TEN
DEN
T/CE
O
TREA
SURE
R/CF
O
ASSI
STAN
T
DIRE
CTO
R/T
& I
SUPE
RVIS
OR
PRE-
SERV
ICE
TRAN
SPO
RTAT
ION
DI
RECT
OR
ADU
LT E
DUCA
TIO
N/A
BLE
DIRE
CTO
R -
COO
RDIN
ATO
R
ASSI
STAN
T TR
EASU
RERS
/PAY
ROLL
M
AIN
TEN
ANCE
SU
PERV
ISO
R
C.D.
L.
Exam
iner
Cler
ical
Staf
f
Cust
odia
l Sta
ff
Fina
ncia
l Aid
Ad
min
istra
tor
Guid
ance
Co
ordi
nato
r Ad
ult E
d.
Adm
in.
Asst
.
Heal
th
Prog
ram
s Co
ordi
nato
r
Med
ia
Cent
er
Food
Se
rvic
e Su
perv
isor
Tech
.
Coor
dina
tor
Inst
ruct
iona
l St
aff
Dean
of
St
uden
ts
Guid
ance
Sp
ecia
l Pr
ogra
ms
Coor
dina
tor
Mar
ketin
g
& P
lace
men
t, St
udy
Isla
nd,
RTI C
oord
inat
or
Cook
Assis
tant
Co
ok
Cler
ical
St
aff
Cler
ical
St
aff
Spec
ial N
eeds
In
stru
ctor
Cler
ical
Sta
ff
T &
I In
stru
ctor
s
Assis
tant
Fi
nanc
ial A
id
Adm
in.
ABLE
In
stru
ctor
s
Prac
tical
N
ursin
g Fa
culty
Adul
t Ed.
In
stru
ctor
Opt
ion
IV
Coor
dina
tor
Mod
ified
09/
10
GRAD
S

Hospitality and FacilityCare 11
Patient Care Technician 12

This Page Intentionally Left Blank

1
INDEPENDENT AUDITOR’S REPORT Pike County Joint Vocational School District Pike County 175 Beaver Creek Rd Piketon, Ohio 45661 To the Board of Education: Report on the Financial Statements We have audited the accompanying financial statements of the governmental activities, each major fund, and the aggregate remaining fund information of the Pike County Joint Vocational School District, Pike County, Ohio (the District), as of and for the year ended June 30, 2017, and the related notes to the financial statements, which collectively comprise the District’s basic financial statements as listed in the table of contents. Management’s Responsibility for the Financial Statements Management is responsible for preparing and fairly presenting these financial statements in accordance with accounting principles generally accepted in the United States of America; this includes designing, implementing, and maintaining internal control relevant to preparing and fairly presenting financial statements that are free from material misstatement, whether due to fraud or error. Auditor's Responsibility Our responsibility is to opine on these financial statements based on our audit. We audited in accordance with auditing standards generally accepted in the United States of America and the financial audit standards in the Comptroller General of the United States’ Government Auditing Standards. Those standards require us to plan and perform the audit to reasonably assure the financial statements are free from material misstatement. An audit requires obtaining evidence about financial statement amounts and disclosures. The procedures selected depend on our judgment, including assessing the risks of material financial statement misstatement, whether due to fraud or error. In assessing those risks, we consider internal control relevant to the District’s preparation and fair presentation of the financial statements in order to design audit procedures that are appropriate in the circumstances, but not to the extent needed to opine on the effectiveness of the District's internal control. Accordingly, we express no such opinion. An audit also includes evaluating the appropriateness of management’s accounting policies and the reasonableness of their significant accounting estimates, as well as our evaluation of the overall financial statement presentation. We believe the audit evidence we obtained is sufficient and appropriate to support our audit opinions.
CorporateCentreofBlueAsh,11117KenwoodRoad,BlueAsh,Ohio45242Phone:513‐361‐8550or800‐368‐7419Fax:513‐361‐8577
www.ohioauditor.gov

Pike County Joint Vocational School District Pike County Independent Auditor’s Report Page 2
2
Opinion In our opinion, the financial statements referred to above present fairly, in all material respects, the respective financial position of the governmental activities, each major fund, and the aggregate remaining fund information of the Pike County Joint Vocational School District, Pike County, Ohio, as of June 30, 2017, and the respective changes in financial position thereof and the budgetary comparison for the General fund thereof for the year then ended in accordance with the accounting principles generally accepted in the United States of America. Other Matters Required Supplementary Information Accounting principles generally accepted in the United States of America require this presentation to include management’s discussion and analysis, and schedules of net pension liabilities and pension contributions listed in the table of contents, to supplement the basic financial statements. Although this information is not part of the basic financial statements, the Governmental Accounting Standards Board considers it essential for placing the basic financial statements in an appropriate operational, economic, or historical context. We applied certain limited procedures to the required supplementary information in accordance with auditing standards generally accepted in the United States of America, consisting of inquiries of management about the methods of preparing the information and comparing the information for consistency with management’s responses to our inquiries, to the basic financial statements, and other knowledge we obtained during our audit of the basic financial statements. We do not opine or provide any assurance on the information because the limited procedures do not provide us with sufficient evidence to opine or provide any other assurance. Supplementary and Other Information Our audit was conducted to opine on the District’s basic financial statements taken as a whole. The introductory section, the financial section’s combining statements, individual fund statements and schedules and the statistical section information present additional analysis and are not a required part of the basic financial statements. The statements and schedules are management’s responsibility, and derive from and relate directly to the underlying accounting and other records used to prepare the basic financial statements. We subjected this information to the auditing procedures we applied to the basic financial statements. We also applied certain additional procedures, including comparing and reconciling this information directly to the underlying accounting and other records used to prepare the basic financial statements or to the basic financial statements themselves in accordance with auditing standards generally accepted in the United States of America. In our opinion, this information is fairly stated in all material respects in relation to the basic financial statements taken as a whole. We did not subject the introductory section and statistical section information to the auditing procedures applied in the audit of the basic financial statements and, accordingly, we express no opinion or any other assurance on them.

Pike County Joint Vocational School District Pike County Independent Auditor’s Report Page 3
3
Other Reporting Required by Government Auditing Standards In accordance with Government Auditing Standards, we have also issued our report dated December 20, 2017, on our consideration of the District’s internal control over financial reporting and our tests of its compliance with certain provisions of laws, regulations, contracts and grant agreements and other matters. That report describes the scope of our internal control testing over financial reporting and compliance, and the results of that testing, and does not opine on internal control over financial reporting or on compliance. That report is an integral part of an audit performed in accordance with Government Auditing Standards in considering the District’s internal control over financial reporting and compliance. Dave Yost Auditor of State Columbus, Ohio December 20, 2017

This page intentionally left blank.

Pike County Joint Vocational School DistrictManagement’s Discussion and Analysis
For the Fiscal Year Ended June 30, 2017Unaudited
4
The discussion and analysis of the Pike County Joint Vocational School District’s financial performance provides an overall review of the School District’s financial activities for the fiscal year ended June 30, 2017. The intent of this discussion and analysis is to look at the School District’s financial performance as a whole; readers should also review the transmittal letter, basic financial statements, and notes to the basic financial statements to enhance their understanding of the School District’s financial performance.
Financial Highlights
� In total, Net Position decreased $841,264. There was a decrease in total revenues of $20,680;total expenses increased by $464,168.
� General revenues accounted for $5,332,217 of all revenues, and reflect the School District’s continued dependence on property taxes and unrestricted State entitlements.
Using this Comprehensive Annual Financial Report (CAFR)
This annual report consists of a series of financial statements and notes to those statements. These statements are organized so the reader can understand the Pike County Joint Vocational School District as a financial whole, an entire operating entity. The statements then proceed to provide an increasingly detailed look at specific financial activities.
The Statement of Net Position and the Statement of Activities provide information about the activities of the whole School District, presenting both an aggregate view of the School District’s finances and a longer-term view of those finances. Fund financial statements provide the next level of detail. For governmental funds, these statements tell how services were financed in the short-term as well as what remains for future spending. The fund financial statements also look at the School District’s most significant funds with all other nonmajor funds presented in total in one column.
Reporting the School District as a Whole
One of the most important questions asked about the School District is “How did we do financially duringfiscal year 2017?” The Statement of Net Position and the Statement of Activities, which appear first in the School District’s financial statements, report information on the School District as a whole and its activities in a way that helps answer this question. These statements include all assets and deferred outflows of resources and liabilities and deferred inflows of resources using the accrual basis of accounting, which is similar to the accounting used by most private-sector companies. This basis of accounting takes into account all of the current fiscal year’s revenues and expenses regardless of when cash is received or paid.

Pike County Joint Vocational School DistrictManagement’s Discussion and Analysis
For the Fiscal Year Ended June 30, 2017Unaudited
5
These two statements report the School District’s Net Position and changes in Net Position. This change in Net Position is important because it tells the reader that, for the School District as a whole, the financial position of the School District has improved or diminished. The causes of this change may be the result of many factors, some financial, some not. Non-financial factors include the School District’s property tax base, current property tax laws in Ohio restricting revenue growth, facility conditions, required educational programs and other factors.
In the Statement of Net Position and the Statement of Activities, the School District has only one kind of activity:
� Governmental Activities – All of the School District’s educational programs and services are reported here including instruction, support services, operation and maintenance of plant, pupil transportation, extracurricular activities, and food service.
Reporting the School District’s Most Significant Funds
Fund Financial Statements
The analysis of the School District’s major funds begins on page ten. Fund financial reports provide detailed information about the School District’s major funds. The School District uses many funds to account for a multitude of financial transactions. However, these fund financial statements focus on the School District’s most significant funds, which are the General Fund and the Permanent ImprovementCapital Projects Fund.
Governmental Funds – Most of the School District’s activities are reported in governmental funds, which focus on how money flows into and out of those funds and the balances left at fiscal year-end available for spending in future periods. These funds are reported using the accounting method called modified accrual accounting, which measures cash and all other financial assets that can readily be converted to cash. The governmental fund statements provide a detailed short-term view of the School District’s general government operations and the basic services it provides. Governmental fund information helps you determine whether there are more or fewer financial resources that can be spent in the near future to finance educational programs. The relationship (or difference) between governmental activities (reported in the Statement of Net Position and the Statement of Activities) and governmental funds is reconciled in the financial statements.
Fiduciary Funds – The School District’s only fiduciary funds are agency funds. All of the School District’s fiduciary activities are reported in a separate Statement of Fiduciary Assets and Liabilities. We exclude these activities from the School District’s other financial statements because the School District cannot use these assets to finance its operations. The School District is responsible for ensuring that the assets reported in these funds are used for their intended purposes. Agency funds are custodial in nature (assets equal liabilities) and do not involve measurement of results of operations. Fiduciary funds use the accrual basis of accounting.

Pike County Joint Vocational School DistrictManagement’s Discussion and Analysis
For the Fiscal Year Ended June 30, 2017Unaudited
6
The School District as a Whole
Recall that the Statement of Net Position provides the perspective of the School District as a whole.
Table 1 provides a summary of the School District’s Net Position for fiscal year 2017 and fiscal year 2016:
Governmental Activities
2017 2016Increase/
(Decrease)Assets:Current and Other Assets $7,809,400 $7,873,470 ($64,070)Capital Assets, Net 15,415,493 15,925,116 (509,623)Total Assets 23,224,893 23,798,586 (573,693)
Deferred Outflows of Resources:Pension 1,887,147 845,673 1,041,474
Liabilities:Current and Other Liabilities 542,313 430,350 111,963Long-Term Liabilities:
Due Within One Year 213,005 216,809 (3,804)Due In More Than One Year:
Net Pension Liability 10,432,740 8,943,671 1,489,069Other Amounts 2,892,343 2,899,320 (6,977)
Total Liabilities 14,080,401 12,490,150 1,590,251
Deferred Inflows of Resources:Property Taxes 1,421,331 1,432,102 (10,771)Pension 438,018 708,453 (270,435)Revenue In Lieu of Taxes 4,706 4,706 0Total Deferred Inflows of Resources 1,864,055 2,145,261 (281,206)
Net Position:Net Investment in Capital Assets 12,896,796 13,275,328 (378,532)Restricted 1,106,973 1,123,105 (16,132)Unrestricted (Deficit) (4,836,185) (4,389,585) (446,600)Total Net Position $9,167,584 $10,008,848 ($841,264)
Table 1Net Position

Pike County Joint Vocational School DistrictManagement’s Discussion and Analysis
For the Fiscal Year Ended June 30, 2017Unaudited
7
The net pension liability (NPL) is the largest single liability reported by the School District at June 30, 2017 and is reported pursuant to GASB Statement 68, “Accounting and Financial Reporting for Pensions—an Amendment of GASB Statement 27.” For reasons discussed below, many end users of this financial statement will gain a clearer understanding of the School District’s actual financial condition by adding deferred inflows related to pension and the net pension liability to the reported net position and subtracting deferred outflows related to pension.
Governmental Accounting Standards Board standards are national and apply to all government financial reports prepared in accordance with generally accepted accounting principles. When accounting for pension costs, GASB 27 focused on a funding approach. This approach limited pension costs to contributions annually required by law, which may or may not be sufficient to fully fund each plan’s net pension liability. GASB 68 takes an earnings approach to pension accounting; however, the nature of Ohio’s statewide pension systems and state law governing those systems requires additional explanation in order to properly understand the information presented in these statements.
GASB 68 requires the net pension liability to equal the School District’s proportionate share of each plan’s collective:
1. Present value of estimated future pension benefits attributable to active and inactive employees’ past service.
2. Minus plan assets available to pay these benefits.
GASB notes that pension obligations, whether funded or unfunded, are part of the “employment exchange” – that is, the employee is trading his or her labor in exchange for wages, benefits, and the promise of a future pension. GASB noted that the unfunded portion of this pension promise is a present obligation of the government, part of a bargained-for benefit to the employee, and should accordingly be reported by the government as a liability since they received the benefit of the exchange. However, the School District is not responsible for certain key factors affecting the balance of this liability. In Ohio, the employee shares the obligation of funding pension benefits with the employer. Both employer and employee contribution rates are capped by State statute. A change in these caps requires action of both Houses of the General Assembly and approval of the Governor. Benefit provisions are also determined by State statute. The employee enters the employment exchange with the knowledge that the employer’s promise is limited not by contract but by law. The employer enters the exchange also knowing that there is a specific, legal limit to its contribution to the pension system. In Ohio, there is no legal means to enforce the unfunded liability of the pension system as against the public employer. State law operates to mitigate/lessen the moral obligation of the public employer to the employee, because all parties enter the employment exchange with notice as to the law. The pension system is responsible for the administration of the plan.
Most long-term liabilities have set repayment schedules or, in the case of compensated absences (i.e. sick and vacation leave), are satisfied through paid time-off or termination payments. There is no repayment schedule for the net pension liability. As explained above, changes in pension benefits, contribution rates, and return on investments affect the balance of the net pension liability, but are outside the control of the local government. In the event that contributions, investment returns, and other changes are insufficient to keep up with required pension payments, State statute does not assign/identify the responsible party forthe unfunded portion. Due to the unique nature of how the net pension liability is satisfied, this liability is separately identified within the long-term liability section of the statement of net position.

Pike County Joint Vocational School DistrictManagement’s Discussion and Analysis
For the Fiscal Year Ended June 30, 2017Unaudited
8
In accordance with GASB 68, the School District’s statements prepared on an accrual basis of accounting include an annual pension expense for their proportionate share of each plan’s change in net pension liability not accounted for as deferred inflows/outflows.
A decrease of $573,693 occurred within total assets of governmental activities when compared to the prior fiscal year. Capital assets decreased by $509,623 primarily due to current year depreciation exceeding current year additions.
Total liabilities increased $1,590,251 for fiscal year 2017 when compared to the prior fiscal year, of which $1,489,069 is from the long-term Net Pension Liability.
Net Investment in Capital Assets of decreased $378,532. This is due depreciation exceeding capital assetadditions for the fiscal year. Unrestricted Net Position decreased $446,600. This decrease is primarily due to the increase in the Net Pension Liability.
Table 2 shows the changes in Net Position for fiscal years 2017 and 2016.
Increase/2017 2016 (Decrease)
Revenues:Program Revenues: Charges for Services and Sales $361,971 $310,154 $51,817 Operating Grants, Contributions, and Interest 1,630,689 1,576,446 54,243Total Program Revenues 1,992,660 1,886,600 106,060General Revenues: Property Taxes 1,592,249 1,504,605 87,644 Payments in Lieu of Taxes 789 437 352 Grants and Entitlements not Restricted to Specific Programs 3,680,990 3,837,411 (156,421) Investment Earnings 19,550 83,239 (63,689) Contributions and Donations 4,706 4,706 0 Miscellaneous 33,933 28,559 5,374Total General Revenues 5,332,217 5,458,957 (126,740)Total Revenues $7,324,877 $7,345,557 ($20,680)
(continued)
Governmental Activities
Table 2Change in Net Position

Pike County Joint Vocational School DistrictManagement’s Discussion and Analysis
For the Fiscal Year Ended June 30, 2017Unaudited
9
Increase/2017 2016 (Decrease)
Program Expenses:Instruction: Special $292,797 $152,761 $140,036 Vocational 4,258,462 3,941,144 317,318 Adult/Continuing 245,537 269,947 (24,410) Student Intervention Services 99,944 70,567 29,377Support Services: Pupils 389,157 320,863 68,294 Instructional Staff 106,116 138,526 (32,410) Board of Education 98,961 117,179 (18,218) Administration 678,868 666,560 12,308 Fiscal 460,061 441,900 18,161 Operation and Maintenance of Plant 695,585 719,646 (24,061) Pupil Transportation 15,149 11,731 3,418 Central 396,249 411,468 (15,219)Operation of Non-Instructional Services 285,738 291,443 (5,705)Interest and Fiscal Charges 143,517 148,238 (4,721)Total Expenses 8,166,141 7,701,973 464,168Change in Net Position (841,264) (356,416) ($484,848)Net Position at Beginning of Year 10,008,848 10,365,264Net Position at End of Year $9,167,584 $10,008,848
Governmental Activities
Table 2Change in Net Position
(continued)
Program revenues, which are primarily represented by charges for tuition, fees, sales, and extracurricular activities, as well as restricted intergovernmental revenues were $1,992,660 of total revenues for fiscal year 2017. Charges for services increased due to a combination of an increase in tests given to individuals through the CDL/School Bus Driving program and an increase in the Adult Education program having an increase in revenue from classes offered and increased participation in those classes. Operating grants and contributions also increased. General revenue grant monies decreased mostly due to a change with career-tech program revenues for fiscal year 2017.
As previously mentioned, general revenues were $5,332,217 of total revenues for fiscal year 2017. Grants and entitlements not Restricted to Specific Programs decreased by $156,421. This resulted from adecrease in money received by the School District for career technical education. Investment earnings also decreased, by $63,689. This resulted partially from the decrease in fair market value of investments.
As should be expected, instruction costs represent the largest of the School District’s expenses, $4,896,740 for fiscal year 2017. The instruction category, however, does not include all activities associated with educating students. Maintenance of the School District’s facilities also represents a significant expense of $695,585. Overall, expenses increased $464,168. This resulted mainly fromincreased expense from pension liability.

Pike County Joint Vocational School DistrictManagement’s Discussion and Analysis
For the Fiscal Year Ended June 30, 2017Unaudited
10
The School District’s Funds
Information about the School District’s most significant funds starts on page 14. Governmental funds are accounted for using the modified accrual basis of accounting. All governmental funds had total revenues of $7,318,503 and expenditures of $7,490,650. All governmental funds had a fund balance of $5,562,172, of which $3,759,383 is unassigned. The net change in fund balance for the fiscal year was most significant in the General Fund with a decrease of $179,741. Revenues decreased as a result decrease in money received for career and technical education. The expenditures increased in fiscal year 2017 when compared to the prior fiscal year. The increase in expenditures was mainly due to salary step increases.
The Permanent Improvement Capital Projects Fund balance is restricted for capital improvements and increased $36,083 as a result of the School District’s revenue from property taxes and intergovernmentalexceeding current fiscal year debt payments.
General Fund - Budget Highlights
The School District’s budget is prepared according to Ohio law and is based on accounting for certain transactions on a basis of cash receipts, disbursements and encumbrances. The most significant budgeted fund is the General Fund.
During the course of fiscal year 2017, the School District revised its budget as it attempted to deal with unexpected changes in revenues and expenditures. A review of the budgetary comparison statement for the General Fund reflects an increase of $59,365 between the original budget and final budget revenues.Throughout the fiscal year, the School District adjusted its estimates to deal with current economic conditions. The change in revenues from the final budget to actual revenues received was insignificant.
The increase in expenditures from the original to the final budget was $461,773. However, the difference in actual expenditures compared to the final budget was $844,810, a decrease. The School District bases their annual budget on prior year expenditures. Due to closely monitoring expenditures, the School District was able to significantly reduce expenditures overall. The largest savings were realized in the vocational instruction.
Actual General Fund revenues and other financing sources were less than expenditures and other financing uses by $63,278.
The School District’s ending unobligated cash balance was $833,363 above the final budgeted amount.
Capital Assets and Debt Administration
Capital Assets
At the end of fiscal year 2017, the School District had $15,415,493 invested in capital assets (net of accumulated depreciation), a decrease of $509,623. Additions to capital assets primarily include an addition to furniture and equipment purchases related to routine computer and computer related purchasesand other educational equipment. Disposals for the fiscal year primarily included various furniture andequipment. For further information regarding the School District’s capital assets, refer to Note 10 to the basic financial statements.

Pike County Joint Vocational School DistrictManagement’s Discussion and Analysis
For the Fiscal Year Ended June 30, 2017Unaudited
11
Debt
The School District had an outstanding lease-purchase agreement for a nine passenger van,improvements, renovations and additions to the School District’s building, including equipment, furnishings and fixtures in the amount of $2,518,697. The School District’s long-term obligations also include compensated absences.
The School District’s overall legal debt margin was $41,845,087 with an unvoted debt margin of $464,945 at June 30, 2017. For further information regarding the School District’s long-term obligations, refer to Note 16 to the basic financial statements.
Contacting the School District’s Financial Management
This financial report is designed to provide our citizens, taxpayers, investors and creditors with a general overview of the School District’s finances and to show the School District’s accountability for the money it receives. If you have questions about this report or need additional information, contact Tonya L. Cooper, Treasurer at Pike County Joint Vocational School District, 175 Beaver Creek Road, Piketon, Ohio 45661 or e-mail [email protected].

12
Pike County Joint Vocational School DistrictStatement of Net Position
June 30, 2017
GovernmentalActivities
Assets:Equity in Pooled Cash and Cash Equivalents $5,928,098Cash and Cash Equivalents With Fiscal Agent 5,000Materials and Supplies Inventory 395Inventory Held for Resale 5,705Accrued Interest Receivable 13,059Prepaid Items 11,473Accounts Receivable 7,329Property Taxes Receivable 1,808,230Intergovernmental Receivable 25,405Payments in Lieu of Taxes Receivable 4,706Capital Assets: Land 156,701 Depreciable Capital Assets, Net 15,258,792
Total Assets 23,224,893
Deferred Outflows of Resources:Pension 1,887,147
Liabilities:Accounts Payable 36,663Accrued Wages and Benefits Payable 371,239Intergovernmental Payable 118,815Matured Bonds Payable 5,000Accrued Interest Payable 10,596Long-Term Liabilities: Due Within One Year 213,005 Due in More Than One Year:
Net Pension Liability (See Note 12) 10,432,740 Other Amounts 2,892,343
Total Liabilities 14,080,401
Deferred Inflows of Resources:Property Taxes 1,421,331Pension 438,018Payments In Lieu of Taxes 4,706
Total Deferred Inflows of Resources 1,864,055
Net Position:Net Investment In Capital Assets 12,896,796Restricted for:
Capital Improvements 821,411Debt Service 3,499Other Purposes:
Food Service 55,409School Facilities Maintenance 188,968ONENet Ohio 9,000Adult Basic Literary Education 14,239Miscellaneous Grants 14,447
Unrestricted (Deficit) (4,836,185)
Total Net Position $9,167,584
See accompanying notes to the basic financial statements

13
Pike County Joint Vocational School DistrictStatement of Activities
For the Fiscal Year Ended June 30, 2017
Net (Expense)Revenue and Changes
in Net Position
OperatingCharges for Grants,
Services Contributions, GovernmentalExpenses and Sales and Interest Activities
Governmental Activities:Instruction: Special $292,797 $0 $749,546 $456,749 Vocational 4,258,462 36,636 130,015 (4,091,811) Adult/Continuing 245,537 42,904 163,520 (39,113) Student Intervention Services 99,944 0 0 (99,944)Support Services: Pupils 389,157 0 0 (389,157) Instructional Staff 106,116 15,616 148,218 57,718 Board of Education 98,961 0 0 (98,961) Administration 678,868 34,170 81,184 (563,514) Fiscal 460,061 0 40,839 (419,222) Operation and Maintenance of Plant 695,585 25,285 0 (670,300) Pupil Transportation 15,149 0 0 (15,149) Central 396,249 177,216 104,869 (114,164)Operation of Non-Instructional Services 285,738 30,144 212,498 (43,096)Interest and Fiscal Charges 143,517 0 0 (143,517)
Total Governmental Activities $8,166,141 $361,971 $1,630,689 (6,173,481)
General Revenues:
1,316,521 Capital Outlay 275,728Payments in Lieu of Taxes 789Grants and Entitlements not Restricted to Specific Programs 3,680,990Investment Earnings 19,550Contributions and Donations 4,706Miscellaneous 33,933
Total General Revenues 5,332,217
Change in Net Position (841,264)
10,008,848
Net Position at End of Year $9,167,584
See accompanying notes to the basic financial statements
Program Revenues
Property Taxes Levied for: General Purposes
Net Position at Beginning of Year

14
Pike County Joint Vocational School DistrictBalance Sheet
Governmental FundsJune 30, 2017
Permanent Nonmajor TotalImprovement Governmental Governmental
General Fund Fund Funds Funds
Assets:Equity in Pooled Cash and Cash Equivalents $4,798,068 $739,326 $367,157 $5,904,551Cash and Cash Equivalents With Fiscal Agent 0 0 5,000 5,000Restricted Assets: Equity in Pooled Cash and Cash Equivalents 23,547 0 0 23,547Receivables: Property Taxes 1,427,937 380,293 0 1,808,230 Payments in Lieu of Taxes 4,706 0 0 4,706 Accounts 6,110 0 1,219 7,329 Accrued Interest 13,059 0 0 13,059 Intergovernmental 0 0 25,405 25,405 Interfund 5,948 0 0 5,948Prepaid Items 10,570 0 903 11,473Materials and Supplies Inventory 0 0 395 395Inventory Held for Resale 0 0 5,705 5,705
Total Assets $6,289,945 $1,119,619 $405,784 $7,815,348
Liabilities:Accounts Payable $7,047 $0 $29,616 $36,663Accrued Wages and Benefits Payable 362,299 0 8,940 371,239Intergovernmental Payable 116,602 0 2,213 118,815Interfund Payable 0 0 5,948 5,948Matured Bonds Payable 0 0 5,000 5,000
Total Liabilities 485,948 0 51,717 537,665
Deferred Inflows of Resource:Property Taxes 1,133,719 287,612 0 1,421,331Payment in Lieu of Taxes 4,706 0 0 4,706Unavailable Revenue 206,540 63,186 19,748 289,474
Total Deferred Inflows of Resources 1,344,965 350,798 19,748 1,715,511
Fund Balances:Nonspendable 10,570 0 1,298 11,868Restricted 0 768,821 333,291 1,102,112Assigned 688,809 0 0 688,809Unassigned (Deficit) 3,759,653 0 (270) 3,759,383
Total Fund Balances 4,459,032 768,821 334,319 5,562,172
Total Liabilites, Deferred Inflows of Resources and Fund Balance $6,289,945 $1,119,619 $405,784 $7,815,348
See accompanying notes to the basic financial statements

15
Pike County Joint Vocational School DistrictReconciliation of Total Governmental Fund Balances to
Net Position of Governmental ActivitiesJune 30, 2017
Total Governmental Fund Balances $5,562,172
Amounts reported for governmental activities in the Statement of Net Position are different because:
Capital assets used in governmental activities are not financial resources and therefore are not reported in the funds. These assets consist of:
Land 156,701Other capital assets 25,073,869Accumulated depreciation (9,815,077)
Total 15,415,493
Some of the School District's revenues will be collected after fiscal year-end, but are not available soon enough to pay for the current period's expenditures and therefore are reported as unavailable revenue in the funds.
Delinquent property taxes 266,233Intergovernmental 19,748Interest 3,493
Total 289,474
In the Statement of Activities, interest is accrued on capital leases,whereas in governmental funds, an interest expenditureis reported when due. (10,596)
The net pension liability is not due and payable in the current period; therefore, the liability and related deferred inflows/outflows are not reported in governmental funds: Deferred Outflows - Pension 1,887,147 Deferred Inflows - Pension (438,018) Net Pension Liability (10,432,740)Total (8,983,611)
Some liabilities are not due and payable in the current period and therefore are not reported in the funds. Those liabilities consist of:
Capital leases (2,518,697)Compensated absences (586,651)
Total (3,105,348)
Net Position of Governmental Activities $9,167,584
See accompanying notes to the basic financial statements

16
Pike County Joint Vocational School DistrictStatement of Revenues, Expenditures and Changes in Fund Balances
Governmental FundsFor the Fiscal Year Ended June 30, 2017
Permanent Nonmajor TotalImprovement Governmental Governmental
General Fund Fund Funds Funds
Revenues:Property Taxes $1,186,138 $271,057 $115,236 $1,572,431Payments in Lieu of Taxes 789 0 0 789Intergovernmental 4,543,648 40,839 739,528 5,324,015Investment Earnings 20,078 0 580 20,658Tuition and Fees 16,219 0 92,690 108,909Rentals 25,285 0 0 25,285Charges for Services 165,132 0 62,645 227,777Contributions and Donations 4,706 0 0 4,706Miscellaneous 28,081 0 5,852 33,933
Total Revenues 5,990,076 311,896 1,016,531 7,318,503
Expenditures:Current: Instruction: Special 210,649 0 0 210,649 Vocational 3,726,144 0 75,622 3,801,766 Adult/Continuing 0 0 229,366 229,366
Student Intervention Services 115,964 0 0 115,964 Support Services: Pupils 310,833 0 0 310,833 Instructional Staff 3,128 0 94,373 97,501 Board of Education 98,961 0 0 98,961 Administration 510,062 0 104,913 614,975 Fiscal 412,852 12,321 0 425,173 Operation and Maintenance of Plant 491,012 0 160,088 651,100 Pupil Transportation 11,526 0 0 11,526 Central 223,630 0 172,749 396,379 Operation of Non-Instructional Services 43,429 0 199,111 242,540Capital Outlay 0 0 8,798 8,798Debt Service: Principal Retirement 10,091 121,000 0 131,091 Interest and Fiscal Charges 1,536 142,492 0 144,028
Total Expenditures 6,169,817 275,813 1,045,020 7,490,650
Net Change in Fund Balances (179,741) 36,083 (28,489) (172,147)
Fund Balances at Beginning of Year 4,638,773 732,738 362,808 5,734,319
Fund Balances at End of Year $4,459,032 $768,821 $334,319 $5,562,172
See accompanying notes to the basic financial statements

17
Pike County Joint Vocational School DistrictReconciliation of the Statement of Revenues, Expenditures
and Changes in Fund Balances of Governmental Funds
Net Change in Fund Balances - Total Governmental Funds ($172,147)
Amounts reported for governmental activities in the Statement of Activities are different because:
Capital outlays are reported as expenditures in governmental funds. However, in the Statement of Activities, the cost of capital assets is allocated over their estimated useful lives as depreciation expense. In the current period, these amounts are:
Capital assets additions 177,862Depreciation expense (686,678)
Excess of depreciation expense over captial outlay (508,816)
Governrmental funds report only the disposal of capital assets to the extentproceeds are received from the sale. In the Statement of Activities, a gainor loss is reported for each sale.
Loss on disposal of capital assets (807)
Because some revenues will not be collected for several months after the School District's fiscal year ends, they are not considered "available" revenues and
are therefore recorded as deferred inflows of resources in the governmentalfunds. Deferred inflows of resources changed by these amounts this fiscal year:
Delinquent property taxes 19,818Intergovernmental (12,336)Interest (1,108)
Total 6,374
Contractually required contributions are reported as expenditures in governmental funds; however, the Statement of Net Position reports these amounts as deferred outflows. 517,901
Except for amounts reported as deferred inflows/outflows, changes in the net pension liability are reported as pension expense in the Statement of Activities. (695,061)
Repayment of long-term obligations is reported as an expenditure in governmental funds, but the repayment reduces long-term liabilities in the Statement of Net Position. In the current fiscal year, these amounts consist of:
Capital Lease Principal Payments 131,091
Accrued interest payable on the capital lease is not reported in the funds, but is allocated as an expense over the life of the lease in the Statement of Activities. 511
Some items reported in the Statement of Activities do not require the use of current financial resources and therefore are not reported as expenditures in governmental funds. These activities consist of:
Increase in compensated absences payable (120,310)
Change in Net Position of Governmental Activities ($841,264)
See accompanying notes to the basic financial statements
to the Statement of ActivitiesFor the Fiscal Year Ended June 30, 2017

18
Pike County Joint Vocational School DistrictStatement of Revenues, Expenditures and Changes
In Fund Balance - Budget and Actual (Budget Basis)General Fund
For the Fiscal Year Ended June 30, 2017
Budgeted Amounts VariancePositive
Original Final Actual (Negative)Revenues:Property Taxes $1,212,219 $1,244,890 $1,244,890 $0Payments in Lieu of Taxes 27,024 789 789 0Intergovernmental 4,518,913 4,594,081 4,594,061 (20)Investment Earnings 19,703 61,282 67,136 5,854Tuition and Fees 1,476 16,170 16,170 0Rentals 19,110 25,285 25,285 0Charges for Services 182,660 164,877 165,132 255Contributions and Donations 4,706 4,706 4,706 0Miscellaneous 89,615 22,711 22,686 (25)
Total Revenues 6,075,426 6,134,791 6,140,855 6,064
Expenditures:Current: Instruction: Special 131,948 204,265 199,562 4,703 Vocational 4,099,385 4,251,475 3,740,987 510,488 Student Intervention Services 0 109,695 109,206 489 Support Services: Pupils 293,055 329,932 302,479 27,453 Instructional Staff 19,479 6,794 3,675 3,119 Board of Education 114,729 145,648 102,451 43,197 Administration 514,476 556,737 512,415 44,322 Fiscal 426,495 459,802 414,344 45,458 Operation and Maintenance of Plant 555,144 580,614 488,556 92,058 Pupil Transportation 13,938 13,628 11,415 2,213 Central 290,999 291,653 221,329 70,324 Operation of Non-Instructional Services 74,128 45,306 44,320 986
Total Expenditures 6,533,776 6,995,549 6,150,739 844,810
Excess of Revenues Under Expenditures (458,350) (860,758) (9,884) 850,874
Other Financing Sources (Uses):Transfers In 128,838 67,496 0 (67,496)Transfers Out (170,033) (103,379) (66,655) 36,724Advances In 8,022 19,209 19,209 0Advances Out (19,209) (19,209) (5,948) 13,261
Total Other Financing Sources (Uses) (52,382) (35,883) (53,394) (17,511)
Net Change in Fund Balance (510,732) (896,641) (63,278) 833,363
Fund Balance at Beginning of Year 4,762,429 4,762,429 4,762,429 0
Prior Year Encumbrances Appropriated 112,891 112,891 112,891 0
Fund Balance at End of Year $4,364,588 $3,978,679 $4,812,042 $833,363
See accompanying notes to the basic financial statements

19
Pike County Joint Vocational School DistrictStatement of Fiduciary Assets and Liabilities
Agency FundsJune 30, 2017
Assets:Equity in Pooled Cash
and Cash Equivalents $4,081
Liabilities:Undistributed Monies $4,081
See accompanying notes to the basic financial statements

Pike County Joint Vocational School DistrictNotes to the Basic Financial Statements
For the Fiscal Year Ended June 30, 2017
20
NOTE 1 – DESCRIPTION OF THE SCHOOL DISTRICT AND REPORTING ENTITY
The Pike County Joint Vocational School District (the “School District”) is a body politic and corporate established for the purpose of exercising the rights and privileges conveyed to it by the constitution and laws of the State of Ohio.
The Pike County Joint Vocational School District is operated under the direction of a five-member Board of Education, which is not directly elected. By charter, 4 members of the Board are either members of or appointed by the Ross-Pike County Educational Service Center’s Board of Education. Currently, the Board of Education for the Pike County Joint Vocational School District consists of three of the eleven members of the Ross-Pike County Educational Service Center’s Board of Education and one member who is appointed by the Ross-Pike County Educational Service Center but does not serve on the Educational Service Center’s Board. Also, according to the charter, one member is appointed by the Waverly City School District Board of Education. That individual may or may not be a member of their Board. The School District exposes students to job training, leading to employment upon graduationfrom high school.
The School District was established in 1956 through the cooperation of all school districts within the County. The School District serves an area of approximately 444 square miles. It is located in Pike County, and includes Eastern Local School District, Scioto Valley Local School District, Western Local School District, and Waverly City School District. The School District has an enrollment of 388 students and is staffed by 15 non-certificated employees, 41 certificated full-time teaching employees, and 3administrative employees. The School District currently operates one building.
Reporting Entity:
Since the School District does not have a separately elected governing board and does not meet the definition of a component unit, it is classified as a stand-alone government under the provisions of GASB Statement No. 14, “The Financial Reporting Entity”.
The reporting entity is comprised of the stand-alone government, component units, and other organizations that are included to ensure that the financial statements are not misleading. The School District consists of all funds, departments, boards, and agencies that are not legally separate from the School District. For the Pike County Joint Vocational School District, this includes general operations, food service, and student related activities of the School District.
Component units are legally separate organizations for which the School District is financially accountable. The School District is financially accountable for an organization if the School District appoints a voting majority of the organization’s governing board and (1) the School District is able to significantly influence the programs or services performed or provided by the organization; or (2) the School District is legally entitled to or can otherwise access the organization’s resources; the School District is legally obligated or has otherwise assumed the responsibility to finance the deficits of, or provide financial support to, the organization; or the School District is obligated for the debt of the organization. Component units may also include organizations that are fiscally dependent on the School District in that the School District approves the budget, the issuance of debt, or the levying of taxes, and there is a potential for the organization to provide specific financial benefits to, or impose specific financial burdens on, the School District. The School District has no component units.
The School District participates in four organizations, two of which are defined as jointly governed organizations and two of which are defined as insurance purchasing pools. These organizations are presented in Note 18 to the basic financial statements. These organizations are:

Pike County Joint Vocational School DistrictNotes to the Basic Financial Statements
For the Fiscal Year Ended June 30, 2017
21
Jointly Governed Organizations:South Central Ohio Computer Association Regional Council of GovernmentsCoalition of Rural and Appalachian Schools
Insurance Purchasing Pools:Ohio SchoolComp Group Retrospective Rating ProgramOhio School Plan
NOTE 2 – SUMMARY OF SIGNIFICANT ACCOUNTING POLICIES
The financial statements of the Pike County Joint Vocational School District have been prepared in conformity with generally accepted accounting principles (GAAP) as applied to governmental units. The Governmental Accounting Standards Board (GASB) is the accepted standard-setting body for establishing governmental accounting and financial reporting principles. The more significant of the School District’s accounting policies are described below.
Basis of Presentation
The School District’s basic financial statements consist of government-wide statements, including a Statement of Net Position and a Statement of Activities, and fund financial statements which provide a more detailed level of financial information.
Government-wide Financial Statements
The Statement of Net Position and the Statement of Activities display information about the School District as a whole. These statements include the financial activities of the School District, except for fiduciary funds. The government-wide financial statements usually distinguish between those activities of the School District that are governmental and those that are considered business-type; however, the School District has no business-type activities.
The Statement of Net Position presents the financial condition of the governmental activities of the School District at fiscal year-end. The Statement of Activities presents a comparison between direct expenses and program revenues for each program or function of the School District’s governmental activities. Direct expenses are those that are specifically associated with a service, program or department and are therefore clearly identifiable to a particular function. Program revenues include charges paid by the recipient of the goods or services offered by the program, grants and contributions that are restricted to meeting the operational or capital requirements of a particular program and interest earned on grants that is required to be used to support a particular program. Revenues which are not classified as program revenues are presented as general revenues of the School District, with certain limited exceptions. The comparison of direct expenses with program revenues identifies the extent to which each governmental function is self-financing or draws from the general revenues of the School District.
Fund Financial Statements
During the fiscal year, the School District segregates transactions related to certain School District functions or activities into separate funds in order to aid financial management and to demonstrate legal compliance. Fund financial statements are designed to present financial information of the School District at this more detailed level. The focus of governmental fund financial statements is on major funds rather than reporting by type. Each major fund is presented in a separate column. Nonmajor funds are aggregated and presented in a single column. Fiduciary funds are reported by type.

Pike County Joint Vocational School DistrictNotes to the Basic Financial Statements
For the Fiscal Year Ended June 30, 2017
22
Fund Accounting
The School District uses funds to maintain its financial records during the fiscal year. A fund is defined as a fiscal and accounting entity with a self-balancing set of accounts. The funds of the School District are divided into two categories, governmental and fiduciary.
Governmental Funds
Governmental funds are those through which most governmental functions of the School District are financed. Governmental fund reporting focuses on the sources, uses and balances of current financial resources. Expendable assets are assigned to the various governmental funds according to the purposes for which they may or must be used. Current liabilities are assigned to the fund from which they will be paid. The difference between governmental fund assets and deferred outflows of resources and liabilities and deferred inflows of resources is reported as fund balance. The following are the School District’smajor governmental funds:
General Fund – The General Fund is the operating fund of the School District and is used to account for and report all financial resources except those required to be accounted for in another fund. The General Fund balance is available to the School District for any purpose provided it is expended or transferred according to the general laws of Ohio.
Permanent Improvement Fund – The Permanent Improvement Fund is used to account for and report property tax revenues restricted for the acquiring, constructing, or improving of school facilities or other capital outlays with a useful life of five years or more.
The nonmajor governmental funds of the School District account for grants and other resources whose use is restricted to a particular purpose.
Fiduciary Funds
Fiduciary fund reporting focuses on Net Position and changes in Net Position. The fiduciary fund category is split into four classifications: pension trust funds, investment trust funds, private purpose trust funds and agency funds. Trust funds are used to account for assets held by the School District under a trust agreement for individuals, private organizations, or other governments and are not available to support the School District’s own programs. The School District has two agency funds. One agency fund is used to account for student activity programs. The second agency fund is used to account for theactivity of the Stafford Loan and PELL grant programs. The agency funds are custodial in nature (assets equal liabilities) and do not involve measurement of results of operations.
Measurement Focus
Government-wide Financial Statements
The government-wide financial statements are prepared using a flow of economic resources measurement focus. All assets and deferred outflows of resources and liabilities and deferred inflows of resources associated with the operation of the School District are included on the Statement of Net Position. The Statement of Activities presents increases (e.g., revenues) and decreases (e.g., expenses) in total Net Position.

Pike County Joint Vocational School DistrictNotes to the Basic Financial Statements
For the Fiscal Year Ended June 30, 2017
23
Fund Financial Statements
All governmental funds are accounted for using a flow of current financial resources measurement focus. With this measurement focus, only current assets and deferred outflows of resources and current liabilitiesdeferred inflows of resources generally are included on the Balance Sheet. The Statement of Revenues, Expenditures and Changes in Fund Balances reports on the sources (i.e., revenues and other financing sources) and uses (i.e., expenditures and other financing uses) of current financial resources. This approach differs from the manner in which the governmental activities of the government-wide financial statements are prepared. Governmental fund financial statements therefore include a reconciliation with brief explanations to better identify the relationship between the government-wide statements and the statements for governmental funds.
Basis of Accounting
Basis of accounting determines when transactions are recorded in the financial records and reported on the financial statements. Government-wide and fiduciary fund financial statements are prepared using the accrual basis of accounting. Governmental funds use the modified accrual basis of accounting. Differences in the accrual and the modified accrual basis of accounting arise in the recognition of revenue, the recording of deferred inflows/outflows of resources, and in the presentation of expenses versus expenditures.
Revenues - Exchange and Non-exchange Transactions
Revenue resulting from exchange transactions, in which each party gives and receives essentially equal value, is recorded on the accrual basis when the exchange takes place. On a modified accrual basis, revenue is recorded in the fiscal year in which the resources are measurable and become available. “Measurable” means that the amount of the transaction can be determined and “available” means that the resources are collectible within the current fiscal year, or are expected to be collected soon enough thereafter to be used to pay liabilities of the current fiscal year. For the School District, available means expected to be received within 60 days of fiscal year-end.
Non-exchange transactions, in which the School District receives value without directly giving equal value in return, include property taxes, grants, entitlements and donations. On the accrual basis, revenue from property taxes is recognized in the fiscal year for which the taxes are levied (See Note 8). Revenue from grants, entitlements and donations is recognized in the fiscal year in which all eligibility requirements have been satisfied. Eligibility requirements include timing requirements, which specify the fiscal year when the resources are required to be used or the fiscal year when use is first permitted;matching requirements, in which the School District must provide local resources to be used for a specified purpose; and expenditure requirements, in which the resources are provided to the School District on a reimbursement basis. On a modified accrual basis, revenue from non-exchange transactions must also be available before it can be recognized.
Under the modified accrual basis, the following revenue sources are considered to be both measurable and available at fiscal year-end: property taxes available for advance, tuition and fees, accrued interest, and grants.

Pike County Joint Vocational School DistrictNotes to the Basic Financial Statements
For the Fiscal Year Ended June 30, 2017
24
Deferred Outflows/Inflows of Resources:
In addition to assets, the statements of financial position will sometimes report a separate section for deferred outflows of resources. Deferred outflows of resources, represents a consumption of net position that applies to a future period and will not be recognized as an outflow of resources (expense/expenditure) until then. For the School District, deferred outflows of resources are reported on the government-wide statement of net position for pension. The deferred outflows of resources related to pension are explained in Note 12.
In addition to liabilities, the statement of financial position reports a separate section for deferred inflows of resources. Deferred inflows of resources represent an acquisition of net position that applies to a future period and will not be recognized until that time. For the School District, deferred inflows of resources included property taxes, pension, payments in lieu of taxes and unavailable revenue. Property taxes and payments in lieu of taxes represent amounts for which there is an enforceable legal claim as of June 30, 2017, but which were levied to finance fiscal year 2018 operations. These amounts have been recorded as a deferred inflow on both the government-wide statement of net position and the governmental fund financial statements. Unavailable revenue is reported only on the governmental fund balance sheet, and represents receivables which will not be collected within the available period. For the School District, unavailable revenue includes delinquent property taxes, intergovernmental grants, and interest. These amounts are deferred and recognized as an inflow of resources in the period the amounts become available. Deferred inflows of resources related to pension are reported on the government-widestatement of net position (See Note 12). The details of these unavailable revenues are identified on the Reconciliation of Total Governmental Fund Balance to Net Position of Governmental Activities found on page 15.
Expenses/Expenditures
On the accrual basis of accounting, expenses are recognized at the time they are incurred.
The measurement focus of governmental fund accounting is on decreases in net financial resources (expenditures) rather than expenses. Expenditures are generally recognized in the accounting period in which the related fund liability is incurred, if measurable. Allocations of cost, such as depreciation and amortization, are not recognized in the governmental funds.
Pensions
For purposes of measuring the net pension liability, deferred outflows of resources and deferred inflows of resources related to pensions, and pension expense, information about the fiduciary net position of the pension plans and additions to/deductions from their fiduciary net positon have been determined on the same basis as they are reported by the pension systems. For this purpose, benefit payments (including refunds of employee contributions) are recognized when due and payable in accordance with the benefit terms. The pension systems report investments at fair value.
Cash and Cash Equivalents
To improve cash management, all cash received by the School District is pooled. Monies for all other funds are maintained in this pool. Individual fund integrity is maintained through the School District’s records. Interest in the pool is presented as “Equity in Pooled Cash and Cash Equivalents”. In prior years,The School District utilized a financial institution to service bonded debt as principal and interest payments came due. The balance in this account represents matured bonds that have yet to be redeemed and is presented on the financial statements as “Cash and Cash Equivalents With Fiscal Agent.”

Pike County Joint Vocational School DistrictNotes to the Basic Financial Statements
For the Fiscal Year Ended June 30, 2017
25
During fiscal year 2017, the School District invested in STAR Ohio, Commercial Paper, First American Treasury Obligations Fund, Federal Home Loan Bank Notes, Federal Home Loan Mortgage Association Notes, Federal National Mortgage Association Debenture Notes and Negotiable Certificates of Deposit.Investments, not including STAR Ohio, are reported at fair value which is based on quoted market prices. For investments in open-end mutual funds, the fair value is determined by the fund’s current share price.
STAR Ohio (the State Treasury Asset Reserve of Ohio), is an investment pool managed by the State Treasurer’s Office which allows governments within the State to pool their funds for investment purposes. STAR Ohio is not registered with the SEC as an investment company, but has adopted Governmental Accounting Standards Board (GASB), Statement No. 79, “Certain External Investment Pools and Pool Participants.” The School District measures their investment in STAR Ohio at the net asset value (NAV) per share provided by STAR Ohio. The NAV per share is calculated on an amortized cost basis that provides an NAV per share that approximates fair value.
For the fiscal year 2017, there were no limitations or restrictions on any participant withdrawals due to redemption notice periods, liquidity fees, or redemption gates. However, notice must be given 24 hours in advance of all deposits and withdrawals exceeding $25 million. STAR Ohio reserves the right to limit the transaction to $50 million, requiring the excess amount to be transacted the following business day(s), but only to the $50 million limit. All accounts of the participant will be combined for these purposes.
Following Ohio statutes, the Board of Education has, by resolution, specified the funds to receive an allocation of interest earnings. Interest revenue, including an increase in the fair market value of investments, credited to the General Fund during fiscal year 2017 amounted to $20,078, which includes $3,748 assigned from other School District funds.
Investments of the cash management pool and investments with an original maturity of three months or less at the time they are purchased by the School District are presented on the financial statements as cash equivalents.
Restricted Assets
Assets are reported as restricted when limitations on their use change the nature or normal understanding of the availability of the asset. Such constraints are either externally imposed by creditors, contributors, grantors, laws of other governments, or imposed by law through constitutional provisions. Restricted assets in the General Fund represent cash and cash equivalents legally required to be set aside by the School District for budget stabilization. See Note 19 for additional information regarding set-asides.
Prepaid Items
Payments made to vendors for services that will benefit periods beyond June 30, 2017, are recorded as prepaid items using the consumption method. A current asset for the prepaid amount is recorded at the time of the purchase and an expenditure/expense is reported in the fiscal year in which services are consumed.
Inventory
Inventories are presented at cost on a first-in, first-out basis and are expended/expensed when used.Inventory consists of expendable supplies held for consumption and purchased food held for resale.

Pike County Joint Vocational School DistrictNotes to the Basic Financial Statements
For the Fiscal Year Ended June 30, 2017
26
Capital Assets
The School District’s only capital assets are general capital assets. General capital assets are those assets not specifically related to activities reported in the proprietary fund. These assets generally result from expenditures in the governmental funds. These assets are reported in the governmental activities column of the government-wide Statement of Net Position but are not reported in the fund financial statements.
All capital assets are capitalized at cost (or estimated historical cost) and updated for additions and retirements during the year. The School District was able to estimate the historical cost for the initial reporting of assets by back-trending (i.e., estimating the current replacement cost of the asset to be capitalized and using an appropriate price-level index to deflate the cost to the acquisition year or estimated acquisition year.) Donated capital assets are recorded at their acquisition values as of the date received. The capitalization threshold is two thousand five hundred dollars. The School District does not possess any infrastructure. Improvements are capitalized; the costs of normal maintenance and repairs that do not add to the value of the asset or materially extend an asset’s life are not.
All reported capital assets, except land, are depreciated. Improvements are depreciated over the remaining useful lives of the related capital assets. Depreciation is computed using the straight-line method over thefollowing useful lives:
Description Estimated LivesLand Improvements 5 - 7 yearsBuildings and Improvements 20 - 50 yearsFurniture and Equipment 5 - 20 yearsVehicles 10 years
Interfund Balances
On fund financial statements, outstanding interfund loans are reported as “Interfund Receivable” and “Interfund Payable”. Interfund balances are eliminated in the Statement of Net Position.
Compensated Absences
Vacation benefits are accrued as a liability as the benefits are earned if the employees’ rights to receive compensation are attributable to services already rendered and it is probable that the School District will compensate the employees for the benefits through paid time off or some other means. The School District records a liability for accumulated unused vacation time when earned for all employees with more than one year of service.
Sick leave benefits are accrued as a liability using the termination method. An accrual for earned sick leave is made to the extent it is probable that benefits will result in termination payments. The liability is an estimate based on the School District’s past experience of making termination payments.
The entire compensated absences liability is reported on the government-wide financial statements.

Pike County Joint Vocational School DistrictNotes to the Basic Financial Statements
For the Fiscal Year Ended June 30, 2017
27
Accrued Liabilities and Long-term Obligations
All payables, accrued liabilities and long-term obligations are reported in the government-wide financial statements.
In general, governmental fund payables and accrued liabilities that, once incurred, are paid in a timely manner and in full from current financial resources are reported as obligations of the funds. However, compensated absences and net position liability that will be paid from governmental funds are reported as a liability in the fund financial statements only to the extent that they are due for payment during the current fiscal year. Capital leases that will be paid from governmental funds are recognized as an expenditure and liability in the governmental fund financial statements when due.
Fund Balance
Fund balance is divided into five classifications based primarily on the extent to which the School District is bound to observe constraints imposed upon the use of the resources in the governmental funds. The classifications are as follows:
Nonspendable
The nonspendable fund balance category includes amounts that cannot be spent because they are not in spendable form, or legally or contractually required to be maintained intact. The “not in spendable form” criterion includes items that are not expected to be converted to cash.
Restricted
Fund balance is reported as restricted when constraints placed on the use of resources are either externally imposed by creditors (such as through debt covenants), grantors, contributors, or laws or regulations of other governments or is imposed by law through constitutional provisions.
Committed
The committed fund balance classification includes amounts that can be used only for the specific purposes imposed by the highest level of formal action (resolution) of the School District’s Board of Education. Those committed amounts cannot be used for any other purpose unless the School District’sBoard of Education removes or changes the specified use by taking the same type of action (resolution) it employed to previously commit those amounts. Committed fund balance also incorporates contractual obligations to the extent that existing resources in the fund have been specifically committed for use in satisfying those contractual requirements.
Assigned
Amounts in the assigned fund balance classification are intended to be used by the School District for specific purposes but do not meet the criteria to be classified as restricted or committed. In governmental funds other than the General Fund, assigned fund balance represents the remaining amount that is not restricted or committed. The Treasurer has been given authority to assign amounts for these purposes by the School District Board of Education.
The Treasurer assigned fund balance to cover a gap between estimated revenue and appropriations in the 2018 appropriated budget. State Statute authorizes the Treasurer to assign fund balance for purchases on order, provided such amounts have been lawfully appropriated.

Pike County Joint Vocational School DistrictNotes to the Basic Financial Statements
For the Fiscal Year Ended June 30, 2017
28
Unassigned
Unassigned fund balance is the residual classification for the General Fund and includes all spendable amounts not contained in the other classifications. In other governmental funds, the unassigned classification is used only to report a deficit fund balance.
The School District applies restricted resources first when expenditures are incurred for purposes for which either restricted or unrestricted (committed, assigned, and unassigned) amounts are available. Similarly, within unrestricted fund balance, committed amounts are reduced first followed by assigned, and then unassigned amounts when expenditures are incurred for purposes for which amounts in any of the unrestricted fund balance classifications could be used.
Net Position
Net Position represents the difference between all other elements in a statement of financial position. Net investment in capital assets consists of capital assets, net accumulated depreciation, reduced by the outstanding balances of any borrowing used for the acquisition, construction or improvement of those assets. Net Position is reported as restricted when there are limitations imposed on their use through external restrictions imposed by creditors, grantors or laws or regulations of other governments. NetPosition restricted for other purposes include food service and federal and State grants restricted to expenditures for specified purposes.
The School District applies restricted resources when an expense is incurred for purposes for which both restricted and unrestricted Net Position is available.
Internal Activity
Transfers within governmental activities are eliminated on the government-wide financial statements.
Internal allocations of overhead expenses from one function to another or within the same function are eliminated on the Statement of Activities. Interfund payments for services provided and used are not eliminated.
Exchange transactions between funds are reported as revenues in the seller funds and as expenditures/expenses in the purchaser funds. Flows of cash or goods from one fund to another without a requirement for repayment are reported as interfund transfers. Interfund transfers are reported as other financing sources/uses in governmental funds. Repayments from funds responsible for particular expenditures/expenses to the funds that initially paid for them are not presented on the financial statements.
Estimates
The preparation of financial statements in conformity with generally accepted accounting principles requires management to make estimates and assumptions that affect the amounts reported in the financial statements and accompanying notes. Actual results may differ from those estimates.

Pike County Joint Vocational School DistrictNotes to the Basic Financial Statements
For the Fiscal Year Ended June 30, 2017
29
Budgetary Process
All funds, other than agency funds, are legally required to be budgeted and appropriated. The major documents prepared are the tax budget, the appropriations resolution and the certificate of estimated resources, which are prepared on the budgetary basis of accounting. The tax budget demonstrates a need for existing or increased tax rates. The certificate of estimated resources establishes a limit on the amounts that the Board of Education may appropriate. The appropriations resolution is the Board of Education’s authorization to spend resources and sets annual limits on expenditures plus encumbrances at a level of control selected by the Board of Education. The legal level of control has been established by the Board of Education at the fund level. The Treasurer maintains budgetary information at the fund, function, and object level and has the authority to allocate appropriations at the function and object levelwithout resolution by the Board of Education.
The certificate of estimated resources may be amended during the fiscal year if projected increases or decreases in revenue are identified by the School District Treasurer. The amounts reported as the original budgeted amounts in the budgetary statements reflect the amounts in the certificate when the original appropriations were adopted. The amounts reported as final budgeted amounts represent estimates from the amended certificate in effect at the time the final appropriations were passed.
The appropriations resolution is subject to amendment by the Board of Education throughout the fiscal year with the restriction that appropriations may not exceed estimated revenues. The amounts reported as the original budgeted amounts in the budgetary statements reflect the first appropriation for that fund that covered the entire fiscal year, including amounts automatically carried over from prior fiscal years. The amounts reported as the final budgeted amounts represent the final appropriation amounts passed by the Board of Education during the fiscal year, including all supplemental appropriations.
NOTE 3 – CHANGE IN ACCOUNTING PRINCIPLE
For fiscal year 2017, the School District implemented Governmental Accounting Standards Board (GASB) Statement No. 77, Tax Abatement Disclosures. GASB Statement No. 77 requires disclosure of information about the nature and magnitude of tax abatements. These changes were incorporated in the School District’s 2017 financial statements; however, the School District had no abatement that met the GASB 77 definition.
The School District also implemented GASB’s Implementation Guide No. 2016-1. These changes were incorporated in the School District’s fiscal year 2017 financial statements; however, there was no effect on beginning net position/fund balance.
NOTE 4 – FUND BALANCES
Fund balance is classified as nonspendable, restricted, committed, assigned and/or unassigned based primarily on the extent to which the School District is bound to observe constraints imposed upon the use of the resources in the governmental funds. The constraints placed on fund balance for the major governmental funds and all other governmental funds are presented below:

Pike County Joint Vocational School DistrictNotes to the Basic Financial Statements
For the Fiscal Year Ended June 30, 2017
30
Permanent NonmajorGeneral Improvement Governmental
Fund Balances Fund Fund Funds Total
Nonspendable:Prepaids $10,570 $0 $903 $11,473Materials and Supplies Inventory 0 0 395 395
Total Nonspendable 10,570 0 1,298 11,868
Restricted for:Capital Improvements 0 768,821 0 768,821Debt Service 0 0 3,499 3,499Food Service 0 0 62,241 62,241Adult Education 0 0 8,737 8,737School Facilities Maintenance 0 0 212,503 212,503Bus Driver Training 0 0 24,187 24,187ONENet Ohio 0 0 9,000 9,000Miscellaneous Grants 0 0 13,124 13,124
Total Restricted 0 768,821 333,291 1,102,112
Assigned to:Future Appropriations 676,264 0 0 676,264Purchases on Order: Classroom Supplies 12,545 0 0 12,545
Total Assigned 688,809 0 0 688,809
Unassigned (Deficit) 3,759,653 0 (270) 3,759,383
Total Fund Balances $4,459,032 $768,821 $334,319 $5,562,172
NOTE 5 – ACCOUNTABILITY
At June 30, 2017, the Improving Teacher Quality Special Revenue Fund had a deficit fund balance of $270. The General Fund provides transfers to cover deficit balances; however, this is done when cash is needed rather than when accruals occur.
NOTE 6 – BUDGETARY BASIS OF ACCOUNTING
While the School District is reporting financial position, results of operations, and changes in fund balances on the basis of generally accepted accounting principles (GAAP), the budgetary basis as provided by law is based upon accounting for certain transactions on a basis of cash receipts, disbursements, and encumbrances. The Statement of Revenues, Expenditures and Changes in Fund Balance - Budget and Actual (Budget Basis) for the General Fund is presented for the General Fund on the budgetary basis to provide a meaningful comparison of actual results with the budget.
The major differences between the budget basis and GAAP basis are that:

Pike County Joint Vocational School DistrictNotes to the Basic Financial Statements
For the Fiscal Year Ended June 30, 2017
31
1. Revenues are recorded when received in cash (budget basis) as opposed to when susceptible to accrual (GAAP basis).
2. Expenditures are recorded when paid in cash (budget basis) as opposed to when the liability is incurred (GAAP basis).
3. Advances In and Advances Out are operating transactions (budget basis) as opposed to balance sheet transactions (GAAP basis).
4. Encumbrances are treated as expenditures (budget basis) rather than restricted, committed, or assigned fund balance (GAAP basis).
5. Investments are recorded at fair value (GAAP basis) rather than cost (budget basis).
GAAP Basis ($179,741)Adjustments:
Revenue Accruals 99,569Expenditure Accruals (28,006)Advances 13,261Encumbrances (19,571)Net Increase in Fair
Value of Investments - FY 2016 41,212Net Decrease in Fair
Value of Investments - FY 2017 9,998Budget Basis ($63,278)
NOTE 7 – DEPOSITS AND INVESTMENTS
Monies held by the School District are classified by State statute into three categories.
Active monies are public monies determined to be necessary to meet current demands upon the School District treasury. Active monies must be maintained either as cash in the School District treasury, in commercial accounts payable or withdrawable on demand, including negotiable order of withdrawal (NOW) accounts, or in money market deposit accounts.
Inactive deposits are public deposits that the Board of Education has identified as not required for use within the current five year period of designation of depositories. Inactive deposits must either be evidenced by certificates of deposit maturing not later than the end of the current period of designation of depositories, or by savings or deposit accounts including, but not limited to, passbook accounts.
Interim deposits are deposits of interim monies. Interim monies are those monies which are not needed for immediate use but which will be needed before the end of the current period of designation of depositories. Interim deposits must be evidenced by time certificates of deposit maturing not more than one year from the date of deposit, or by savings or deposit accounts, including passbook accounts.
Interim monies held by the School District may be deposited or invested in the following securities:
1. United States Treasury notes, bills, bonds, or any other obligation or security issued by the United States Treasury, or any other obligation guaranteed as to principal and interest by the United States;

Pike County Joint Vocational School DistrictNotes to the Basic Financial Statements
For the Fiscal Year Ended June 30, 2017
32
2. Bonds, notes, debentures, or any other obligations or security issued by any federal government agency or instrumentality including, but not limited to, the Federal National Mortgage Association, Federal Home Loan Bank, Federal Farm Credit Bank, Federal Home Loan Mortgage Corporation, and Government National Mortgage Association. All federal agency securities shall be direct issuances of federal government agencies or instrumentalities;
3. No-load money market mutual funds consisting exclusively of obligations described in (1) or (2) and repurchase agreements secured by such obligations, provided that investments in securities described in this division are made only through eligible institutions;
4. Time certificates of deposit or savings or deposit accounts including, but not limited to, passbook accounts;
5. Bonds and other obligations of the State of Ohio and with certain limitations bonds and other obligations of political subdivisions of the State of Ohio;
6. The State Treasurer’s investment pool (STAROhio);
7. Certain bankers’ acceptances and commercial paper notes for a period not to exceed one hundred eighty days in an amount not to exceed 40 percent of the interim monies available for investment at any one time if training requirements have been met; and
8. Written repurchase agreements in the securities described in (1) or (2) provided the market value of the securities subject to the repurchase agreement must exceed the principal value of the agreement by at least two percent and be marked to market daily, and the term of the agreement must not exceed thirty days.
Investments in stripped principal or interest obligations reverse repurchase agreements and derivatives are prohibited. The issuance of taxable notes for the purpose of arbitrage, the use of leverage and short selling are also prohibited. Investments may only be made through specified dealers and institutions.
Deposits
The School District has no deposit policy for custodial credit risk beyond the requirements of State statute. Ohio law requires that deposits be either insured or be protected by eligible securities pledged to and deposited either with the School District or a qualified trustee by the financial institution as security for repayment, or by a collateral pool of eligible securities deposited with a qualified trustee and pledged to secure the repayment of all public monies deposited in the financial institution whose market value at all times shall be at least one hundred five percent of the deposits being secured. Effective July 1, 2017, the Ohio Pooled Collateral System (OPCS) was implemented by the Office of the Ohio Treasurer of State. Financial institutions can elect to participate in the OPCS and will collateralize at 102 percent or a rate set by the Treasurer of State. Financial institution opting not to participate in OPCS will collateralize utilizing the specific pledge method at 105 percent.
As of June 30, 2017, the School District had the following investments:

Pike County Joint Vocational School DistrictNotes to the Basic Financial Statements
For the Fiscal Year Ended June 30, 2017
33
Investment Maturities in Years Percent ofMeasurement/
Investment Less than 1 1 - 2 3 - 4 5+S&P
RatingTotal
InvestmentsNet Asset Value per Share: STAROhio $1,639,560 $1,639,560 $0 $0 $0 N/A 27.46%Fair Value - Level Two Inputs Commercial Paper 1,231,684 1,231,684 0 0 0 A-1+ 20.63% First American Treasury
Obligations Fund 11,162 11,162 0 0 0 AA+ N/A Federal Home Loan Bank Notes 64,436 64,436 0 0 0 AA+ N/A Federal Home Loan Mortgage
Association Notes 1,372,631 0 0 927,750 444,881 AA+ 22.99% Federal National Mortgage
Association Debenture Notes 671,541 209,513 0 462,028 0 AA+ 11.25% Negotiable Certificates of Deposit 978,868 0 248,201 730,667 0 N/A 16.40%Totals $5,969,882 $3,156,355 $248,201 $2,120,445 $444,881
The School District categorizes its fair value measurements within the fair value hierarchy established by generally accepted accounting principles. The hierarchy is based on the valuation inputs used to measure the fair value of the asset. Level 1 inputs are quoted prices in active markets for identical assets. Level 2 inputs are significant other observable inputs; Level 3 inputs are significant unobservable inputs. The above chart identifies the School District’s recurring fair value measurements as of June 30, 2017. The Money Market Mutual Fund is measured at fair value and is valued using quoted market prices (Level 1 inputs). The School District’s remaining investments measured at fair value are valued using methodologies that incorporate market inputs such as benchmark yields, reported trades, broker/dealer quotes, issuer spreads, two-sided markets, benchmark securities, bids, offers and reference data including market research publications. Market indicators and industry and economic events are also monitored, which could require the need to acquire further market data. (Level 2 inputs).
Interest Rate Risk: As a means of limiting its exposure to fair value losses caused by rising interest rates, the School District’s investment policy requires that, to the extent possible, investments will match anticipated cash flow requirements. No investment shall be made unless the Treasurer, at the time of making the investment, reasonably expects it can be held to its maturity. Unless matched to a specific obligation or debt of the School District, the School District will not directly invest in securities maturing more than five years from the date of investment.
Credit Risk: The S&P ratings of the School District’s investments are listed in the table above. Ohio law requires that STAROhio maintain the highest rating provided by at least one nationally recognized standard rating service and that the money market mutual fund be rated in the highest category at the time of purchase by at least one nationally recognized standard rating service. The School District’s investment policy limits investments to those authorized by State statute which restricts investments to those that are highly rated or issued by United States government sponsored enterprises.
Custodial Credit Risk: Custodial credit risk is the risk that in the event of the failure of the counterparty, the School District will not be able to recover the value of its investments or collateral securities that are in the possession of an outside party. All of the School District’s securities are either insured and registered in the name of the School District or at least registered in the name of the School District. The School District has no investment policy dealing with investment custodial risk beyond the requirement in State statute that prohibits payment for investments prior to the delivery of the securities representing such investments to the Treasurer or qualified trustee.

Pike County Joint Vocational School DistrictNotes to the Basic Financial Statements
For the Fiscal Year Ended June 30, 2017
34
Concentration of Credit Risk: The School District’s investment policy provides that the School District will diversify its investments by security, type, and institution. With the exception of direct obligations of the U.S. Treasury and STAROhio, no more than 90 percent of the School District’s total investment portfolio will be invested in a single security type or with a single financial institution. The percentage that each investment represents of the total investments is listed in the table above.
NOTE 8 – PROPERTY TAXES
Property taxes are levied and assessed on a calendar year basis while the School District’s fiscal year runs from July through June. First half tax collections are received by the School District in the second half of the fiscal year. Second half tax distributions occur in the first half of the following fiscal year.
Property taxes include amounts levied against all real and public utility property located in the School District. Real property tax revenue received in calendar year 2017 represents collections of calendar year 2016 taxes. Real property taxes received in calendar year 2017 were levied after April 1, 2016, on the assessed value listed as of January 1, 2016, the lien date. Assessed values for real property taxes are established by State statute at 35 percent of appraised market value. Real property taxes are payable annually or semi-annually. If paid annually, payment is due December 31; if paid semi-annually, the first payment is due December 31 with the remainder payable by June 20. Under certain circumstances, State statute permits alternate payment dates to be established.
Public utility property tax revenue received in calendar year 2017 represents collections of calendar year 2016 taxes. Public utility real and tangible personal property taxes received in calendar year 2017became a lien December 31, 2015, were levied after April 1, 2016, and are collected with real property taxes. Public utility real property is assessed at 35 percent of true value; public utility tangible personal property currently is assessed at varying percentages of true value.
The School District receives property taxes from Pike County. The County Auditor periodically advances to the School District its portion of the taxes collected. Second-half real property tax payments collected by the County by June 30, 2017, are available to finance fiscal year 2017 operations. The amount available to be advanced can vary based on the date the tax bills are sent.
Accrued property taxes receivable includes real property and public utility property taxes which were measurable as of June 30, 2017 and for which there is an enforceable legal claim. Although total property tax collections for the next fiscal year are measurable, only the amount of real property taxes available as an advance at June 30 was levied to finance current fiscal year operations and is reflected as revenue at fiscal year-end. The portion of the receivable not levied to finance current fiscal year operations is offsetby a credit to deferred inflows - property taxes.
The amount available as an advance at June 30, 2017, was $120,666 and is recognized as revenue: $91,171in the General Fund and $29,495 in the Permanent Improvement Fund. The amount available as an advance at June 30, 2016, was $83,268 in the General Fund and $26,962 in the Permanent Improvement Fund.
On an accrual basis, collectible delinquent property taxes have been recorded as a receivable and revenue, while on a modified accrual basis the revenue is reported as deferred inflow or resources - unavailable revenue.

Pike County Joint Vocational School DistrictNotes to the Basic Financial Statements
For the Fiscal Year Ended June 30, 2017
35
The assessed values upon which the fiscal year 2017 taxes were collected are:
Amount Percent Amount PercentReal Estate $383,577,656 83.21% $386,336,655 83.09%Public Utility Personal 77,402,380 16.79% 78,608,760 16.91%Total Assessed Value $460,980,036 100.00% $464,945,415 100.00%
Voted tax rate per $1,000 of assessed valuation $7.50 $7.50
2016 Second-Half Collections
2017 First-Half Collections
NOTE 9 – RECEIVABLES
Receivables at June 30, 2017, consisted of property taxes, payments in lieu of taxes, accounts, accrued interest, intergovernmental grants, and interfund. All receivables are considered collectible in full due to the ability to foreclose for the nonpayment of taxes, the stable condition of State programs, and the current fiscal year guarantee of federal funds. All receivables, except for delinquent property taxes, are expected to be collected within one year. Property taxes, although ultimately collectible, include some portion of delinquents that will not be collected within one year. Payments in lieu of taxes will be received over the designated period established by the agreements.
A summary of the principal items of intergovernmental receivables follows:
NOTE 10 – CAPITAL ASSETS
Capital assets activity for the fiscal year ended June 30, 2017, was as follows:
Balance at6/30/16 Additions Deductions
Balance at6/30/17
Governmental Activities:Capital Assets Not Being Depreciated:
Land $156,701 $0 $0 $156,701Capital Assets Being Depreciated:
Land Improvements 1,243,081 0 0 1,243,081Buildings and Improvements 20,005,277 21,247 0 20,026,524Furniture and Equipment 3,405,264 132,715 (16,544) 3,521,435Vehicles 258,929 23,900 0 282,829
Total Capital Assets Being Depreciated $24,912,551 $177,862 ($16,544) $25,073,869(continued)
Governmental Activities: Adult Basic Literacy Education Grant $23,354 Carl D. Perkins Secondary Grant 112 Title II - A Improving Teacher Quality 1,939
Total Intergovernmental Receivables $25,405

Pike County Joint Vocational School DistrictNotes to the Basic Financial Statements
For the Fiscal Year Ended June 30, 2017
36
Balance at6/30/16 Additions Deductions
Balance at6/30/17
Less Accumulated Depreciation:Land Improvements ($1,159,022) ($8,941) $0 ($1,167,963)Buildings and Improvements (5,257,685) (422,350) 0 (5,680,035)Furniture and Equipment (2,555,333) (241,432) 15,737 (2,781,028)Vehicles (172,096) (13,955) 0 (186,051)
Total Accumulated Depreciation (9,144,136) (686,678) * 15,737 (9,815,077)Total Capital Assets Being Depreciated, Net 15,768,415 (508,816) (807) 15,258,792Governmental Activities Capital Assets, Net $15,925,116 ($508,816) ($807) $15,415,493
* Depreciation expense was charged to governmental functions as follows:
Instruction: AmountSpecial $58,617Vocational 404,159Adult/Continuing 15,839
Support Services:Pupils 22,054Instructional Staff 23,695Administration 23,473Fiscal 21,814Operation and Maintenance of Plant 39,882Pupil Transportation 3,623Central 35,415
Operation of Non-Instructional Services 38,107Total Depreciation Expense $686,678
NOTE 11 – RISK MANAGEMENT
Property, Fleet and Liability Insurance
The School District is exposed to various risks of loss related to torts; theft of, damage to, and destruction of assets; errors and omissions; injuries to employees; and natural disasters. The School District, along with other School Districts in Ohio, participates in the Ohio School Plan (OSP), an insurance purchasing pool. (See Note 18) Each individual School District enters into an agreement with the OSP and its premium is based on types of coverage, limits of coverage, and deductibles that it selects. The School District pays this annual premium to Hylant Administrative Services, LLC. During fiscal year 2017, the School District contracted with the Ohio School Plan for liability, fleet, and property insurance coverage.
Settled claims have not exceeded this commercial coverage in any of the past three fiscal years. There has not been a significant reduction in coverage from the prior fiscal year.
Workers’ Compensation
For fiscal year 2017, the School District participated in the Ohio SchoolComp Group Retrospective Rating Program (GRRP), an insurance purchasing pool (See Note 18). The intent of the GRRP is to reward participants that are able to keep their claims costs below a predetermined amount. As part of the

Pike County Joint Vocational School DistrictNotes to the Basic Financial Statements
For the Fiscal Year Ended June 30, 2017
37
GRRP, school districts join together as a group. Each school district continues to pay its own individual premium to the State. However, each school district has the opportunity to receive retrospective premium adjustments (refunds or assessments) at 12, 24, and 36 months after the end of the policy year. At the end of each policy year, the Bureau of Workers’ Compensation (BWC) will take a snap-shot of the incurred claims losses (indemnity, medical, and reserves) for the entire group and calculate the group’s retrospective premium. If the retrospective premium that is calculated is less than the group’s total standard premium, the participants will receive a refund. However, if the retrospective premium is greater than the group’s total standard premium, an assessment will be levied by BWC. Each group limits the maximum assessment by selecting a premium cap between five percent and 100 percent of merit rated premium. Participation in the GRRP is limited to school districts that can meet the GRRP’s selection criteria. The firm of CompManagement, Inc. provides administrative, cost control, and actuarial services to the GRRP.
NOTE 12 – DEFINED BENEFIT PENSION PLANS
Net Pension Liability
The net pension liability reported on the statement of net position represents a liability to employees for pensions. Pensions are a component of exchange transactions-–between an employer and its employees—of salaries and benefits for employee services. Pensions are provided to an employee—on a deferred-payment basis—as part of the total compensation package offered by an employer for employee services each financial period. The obligation to sacrifice resources for pensions is a present obligation because it was created as a result of employment exchanges that already have occurred.
The net pension liability represents the School District’s proportionate share of each pension plan’s collective actuarial present value of projected benefit payments attributable to past periods of service, net of each pension plan’s fiduciary net position. The net pension liability calculation is dependent on critical long-term variables, including estimated average life expectancies, earnings on investments, cost of living adjustments and others. While these estimates use the best information available, unknowable future events require adjusting this estimate annually.
Ohio Revised Code limits the School District’s obligation for this liability to annually required payments. The School District cannot control benefit terms or the manner in which pensions are financed; however, the School District does receive the benefit of employees’ services in exchange for compensation including pension.
GASB 68 assumes the liability is solely the obligation of the employer, because (1) they benefit from employee services; and (2) State statute requires all funding to come from these employers. All contributions to date have come solely from these employers (which also includes costs paid in the form of withholdings from employees). State statute requires the pension plans to amortize unfunded liabilities within 30 years. If the amortization period exceeds 30 years, each pension plan’s board must propose corrective action to the State legislature. Any resulting legislative change to benefits or funding could significantly affect the net pension liability. Resulting adjustments to the net pension liability would be effective when the changes are legally enforceable.
The proportionate share of each plan’s unfunded benefits is presented as a long-term net pension liability on the accrual basis of accounting. Any liability for the contractually-required pension contribution outstanding at the end of the year is included in intergovernmental payable on both the accrual and modified accrual bases of accounting.

Pike County Joint Vocational School DistrictNotes to the Basic Financial Statements
For the Fiscal Year Ended June 30, 2017
38
Plan Description - School Employees Retirement System (SERS)
Plan Description – School District non-teaching employees participate in SERS, a cost-sharing multiple-employer defined benefit pension plan administered by SERS. SERS provides retirement, disability and survivor benefits, annual cost-of-living adjustments, and death benefits to plan members and beneficiaries. Authority to establish and amend benefits is provided by Ohio Revised Code Chapter 3309.SERS issues a publicly available, stand-alone financial report that includes financial statements, required supplementary information and detailed information about SERS’ fiduciary net position. That report can be obtained by visiting the SERS website at www.ohsers.org under Employers/Audit Resources.
Age and service requirements for retirement are as follows:
Eligible to Eligible toRetire on or before Retire on or afterAugust 1, 2017 * August 1, 2017
Full Benefits Any age with 30 years of service credit Age 67 with 10 years of service credit; orAge 57 with 30 years of service credit
Actuarially Reduced Benefits Age 60 with 5 years of service credit Age 62 with 10 years of service credit; orAge 55 with 25 years of service credit Age 60 with 25 years of service credit
* Members with 25 years of service credit as of August 1, 2017, will be included in this plan.
Annual retirement benefits are calculated based on final average salary multiplied by a percentage that varies based on year of service; 2.2 percent for the first thirty years of service and 2.5 percent for years of service credit over 30. Final average salary is the average of the highest three years of salary.
One year after an effective benefit date, a benefit recipient is entitled to a three percent cost-of-living adjustment (COLA). This same COLA is added each year to the base benefit amount on the anniversary date of the benefit.
Funding Policy – Plan members are required to contribute 10 percent of their annual covered salary and the School District is required to contribute 14 percent of annual covered payroll. The contribution requirements of plan members and employers are established and may be amended by the SERS’ Retirement Board up to statutory maximum amounts of 10 percent for plan members and 14 percent for employers. The Retirement Board, acting with the advice of the actuary, allocates the employer contribution rate among four of the System’s funds (Pension Trust Fund, Death Benefit Fund, Medicare B Fund, and Health Care Fund). For the fiscal year ended June 30, 2017, the allocation to pension, death benefits, and Medicare B was 14 percent. No allocation was made to the Health Care Fund.
The School District’s contractually required contribution to SERS was $131,777 for fiscal year 2017. Of this amount $3,240 is reported as an intergovernmental payable.
Plan Description - State Teachers Retirement System (STRS)
Plan Description – School District licensed teachers and other faculty members participate in STRS Ohio, a cost-sharing multiple-employer public employee retirement system administered by STRS. STRS provides retirement and disability benefits to members and death and survivor benefits to beneficiaries. STRS issues a stand-alone financial report that includes financial statements, required supplementary information and detailed information about STRS’ fiduciary net position. That report can be obtained by writing to STRS, 275 E. Broad St., Columbus, OH 43215-3771, by calling (888) 227-7877, or by visiting the STRS Web site at www.strsoh.org.

Pike County Joint Vocational School DistrictNotes to the Basic Financial Statements
For the Fiscal Year Ended June 30, 2017
39
New members have a choice of three retirement plans; a Defined Benefit (DB) Plan, a Defined Contribution (DC) Plan and a Combined Plan. Benefits are established by Ohio Revised Code Chapter 3307.
The DB plan offers an annual retirement allowance based on final average salary multiplied by a percentage that varies based on years of service. Effective August 1, 2015, the calculation is 2.2 percent of final average salary for the five highest years of earnings multiplied by all years of service. With certain exceptions, the basic benefit is increased each year by two percent of the original base benefit. For members retiring August 1, 2013, or later, the first two percent is paid on the fifth anniversary of the retirement benefit. Members are eligible to retire at age 60 with five years of qualifying service credit, or age 55 with 26 years of service, or 31 years of service regardless of age. Eligibility changes will be phased in until August 1, 2026, when retirement eligibility for unreduced benefits will be five years of service credit and age 65, or 35 years of service credit and at least age 60.
The DC Plan allows members to place all their member contributions and 9.5 percent of the 14 percent employer contributions into an investment account. Investment allocation decisions are determined by the member. The remaining 4.5 percent of the 14 percent employer rate is allocated to the defined benefit unfunded liability. A member is eligible to receive a retirement benefit at age 50 and termination of employment. The member may elect to receive a lifetime monthly annuity or a lump sum withdrawal.
The Combined Plan offers features of both the DB Plan and the DC Plan. In the Combined Plan, 12percent of the 14 percent member rate goes to the DC Plan and the remaining 2 percent is applied to the DB Plan. Member contributions to the DC Plan are allocated among investment choices by the member, and contributions to the DB Plan from the employer and the member are used to fund the defined benefit payment at a reduced level from the regular DB Plan. The defined benefit portion of the Combined Plan payment is payable to a member on or after age 60 with five years of service. The defined contribution portion of the account may be taken as a lump sum payment or converted to a lifetime monthly annuity after termination of employment at age 50 or later.
New members who choose the DC plan or Combined Plan will have another opportunity to reselect a permanent plan during their fifth year of membership. Members may remain in the same plan or transfer to another STRS plan. The optional annuitization of a member’s defined contribution account or the defined contribution portion of a member’s Combined Plan account to a lifetime benefit results in STRS bearing the risk of investment gain or loss on the account. STRS has therefore included all three plan options as one defined benefit plan for GASB 68 reporting purposes.
A DB or Combined Plan member with five or more years of credited service who is determined to be disabled may qualify for a disability benefit. Eligible survivors of members who die before service retirement may qualify for monthly benefits. New members on or after July 1, 2013, must have at least ten years of qualifying service credit that apply for disability benefits. Members in the DC Plan who become disabled are entitled only to their account balance. If a member of the DC Plan dies before retirement benefits begin, the member’s designated beneficiary is entitled to receive the member’s account balance.
Funding Policy – Employer and member contribution rates are established by the State Teachers Retirement Board and limited by Chapter 3307 of the Ohio Revised Code. For the fiscal year ended June 30, 2017, the employer rate was 14 percent and the plan members were also required to contribute 14percent of covered salary. The statutory member contribution rate was increased one percent to 14 percent on July 1, 2016. The fiscal year 2017 contribution rates were equal to the statutory maximum rates.

Pike County Joint Vocational School DistrictNotes to the Basic Financial Statements
For the Fiscal Year Ended June 30, 2017
40
The School District’s contractually required contribution to STRS was $386,124 for fiscal year 2017. Of this amount $41,973 is reported as an intergovernmental payable.
Pension Liabilities, Pension Expense, and Deferred Outflows of Resources and Deferred Inflows of Resources Related to Pensions
The net pension liability was measured as of June 30, 2016, and the total pension liability used to calculate the net pension liability was determined by an actuarial valuation as of that date. The School District's proportion of the net pension liability was based on the School District's share of contributions to the pension plan relative to the contributions of all participating entities. Following is information related to the proportionate share and pension expense:
SERS STRS TotalProportion of the Net Pension Liability Prior Measurement Date 0.03140680% 0.02587672%Proportion of the Net Pension Liability Current Measurement Date 0.02834140% 0.02497059%
Change in Proportionate Share -0.00306540% -0.00090613%
Proportionate Share of the Net Pension Liability $2,074,330 $8,358,410 $10,432,740Pension Expense $145,506 $549,554 $695,060
At June 30, 2017, the School District reported deferred outflows of resources and deferred inflows of resources related to pensions from the following sources:
SERS STRS TotalDeferred Outflows of Resources:Differences between expected and actual experience $27,978 $337,720 $365,698Changes of assumptions 138,473 0 138,473Net difference between projected and actual earnings on pension plan investments 171,102 693,973 865,075School District contributions subsequent to the measurement date 131,777 386,124 517,901
Total Deferred Outflows of Resources $469,330 $1,417,817 $1,887,147
Deferred Inflows of Resources:Changes in Proportionate Share and Difference between School District contributions and proportionate share of contributions $178,357 $259,661 $438,018
$517,901 reported as deferred outflows of resources related to pension resulting from School District contributions subsequent to the measurement date will be recognized as a reduction of the net pension liability in the year ending June 30, 2018. Other amounts reported as deferred outflows of resources and deferred inflows of resources related to pension will be recognized in pension expense as follows:

Pike County Joint Vocational School DistrictNotes to the Basic Financial Statements
For the Fiscal Year Ended June 30, 2017
41
SERS STRS TotalFiscal Year Ending June 30:
2018 $14,240 $94,209 $108,4492019 14,116 94,209 108,3252020 81,654 360,508 442,1622021 49,186 223,106 272,292
Total $159,196 $772,032 $931,228
Actuarial Assumptions - SERS
SERS’ total pension liability was determined by their actuaries in accordance with GASB Statement No. 67, as part of their annual actuarial valuation for each defined benefit retirement plan. Actuarial valuations of an ongoing plan involve estimates of the value of reported amounts (e.g., salaries, credited service) and assumptions about the probability of occurrence of events far into the future (e.g., mortality, disabilities, retirements, employment termination). Actuarially determined amounts are subject to continual review and potential modifications, as actual results are compared with past expectations and new estimates are made about the future.
Projections of benefits for financial reporting purposes are based on the substantive plan (the plan as understood by the employers and plan members) and include the types of benefits provided at the time of each valuation and the historical pattern of sharing benefit costs between the employers and plan members to that point. The projection of benefits for financial reporting purposes does not explicitly incorporate the potential effects of legal or contractual funding limitations.
Actuarial calculations reflect a long-term perspective. For a newly hired employee, actuarial calculations will take into account the employee’s entire career with the employer and also take into consideration the benefits, if any, paid to the employee after termination of employment until the death of the employee and any applicable contingent annuitant. In many cases actuarial calculations reflect several decades of service with the employer and the payment of benefits after termination.
Key methods and assumptions used in calculating the total pension liability in the latest actuarial valuation, prepared as of June 30, 2016, compared with June 30, 2015, are presented below:
June 30, 2016 June 30, 2015
Wage Inflation 3.00 percent 3.25 percentFuture Salary Increases, including inflation 3.50 percent to 18.20 percent 4.00 percent to 22.00 percentCOLA or Ad Hoc COLA 3 percent 3 percentInvestment Rate of Return 7.50 percent net of investments 7.75 percent net of investments
expense, including inflation expense, including inflationActuarial Cost Method Entry Age Normal Entry Age Normal
For 2016, the mortality assumptions are that mortality rates were based on the RP-2014 Blue Collar Mortality Table with fully generational projection and a five year age set-back for both males and females. For 2015, the mortality assumptions were based on the 1994 Group Annuity Mortality Table set back one year for both men and women. Special mortality tables were used for the period after disability retirement.
The most recent experience study was completed for the five year period ended June 30, 2015.

Pike County Joint Vocational School DistrictNotes to the Basic Financial Statements
For the Fiscal Year Ended June 30, 2017
42
The long-term return expectation for the Pension Plan Investments has been determined by using a building-block approach and assumes a time horizon, as defined in SERS’ Statement of Investment Policy.A forecasted rate of inflation serves as the baseline for the return expectation. Various real return premiums over the baseline inflation rate have been established for each asset class. The long-term expected nominal rate of return has been determined by calculating an arithmetic weighted averaged of the expected real return premiums for each asset class, adding the projected inflation rate, and adding the expected return from rebalanced uncorrelated asset classes.
TargetAsset Class Allocation
Cash 1.00 % 0.50 %US Stocks 22.50 4.75Non-US Stocks 22.50 7.00Fixed Income 19.00 1.50Private Equity 10.00 8.00Real Assets 15.00 5.00Multi-Asset Strategies 10.00 3.00Total 100.00 %
Long-Term ExpectedReal Rate of Return
Discount Rate The total pension liability was calculated using the discount rate of 7.50 percent. Adiscount rate of 7.75 percent was used in the prior measurement period. The projection of cash flows used to determine the discount rate assumed the contributions from employers and from the members would be computed based on contribution requirements as stipulated by State statute. Projected inflows from investment earning were calculated using the long-term assumed investment rate of return (7.50 percent). Based on those assumptions, the plan’s fiduciary net position was projected to be available to make all future benefit payments of current plan members. Therefore, the long-term expected rate of return on pension plan investments was applied to all periods of projected benefits to determine the total pension liability.
Sensitivity of the School District's Proportionate Share of the Net Pension Liability to Changes in the Discount Rate Net pension liability is sensitive to changes in the discount rate, and to illustrate the potential impact the following table presents the net pension liability calculated using the discount rate of 7.50 percent, as well as what each plan’s net pension liability would be if it were calculated using a discount rate that is one percentage point lower (6.50 percent), or one percentage point higher (8.50 percent) than the current rate.
Current1% Decrease Discount Rate 1% Increase
(6.50%) (7.50%) (8.50%)School District's proportionate share of the net pension liability $2,746,282 $2,074,330 $1,511,876
Actuarial Assumptions - STRS
The total pension liability in the June 30, 2016, actuarial valuation was determined using the following actuarial assumptions, applied to all periods included in the measurement:

Pike County Joint Vocational School DistrictNotes to the Basic Financial Statements
For the Fiscal Year Ended June 30, 2017
43
Inflation 2.75 percentSalary increases 12.25 percent at age 20 to 2.75 percent at age 70Investment Rate of Return 7.75 percent, net of investment expenses, including inflationCost-of-Living Adjustments 2 percent simple applied as follows: for members retiring before (COLA) August 1, 2013, 2 percent per year; for members retiring August 1, 2013,
or later, 2 percent COLA commences on fifth anniversary of retirement date.
Mortality rates were based on the RP-2000 Combined Mortality Table (Projection 2022—Scale AA) for Males and Females. Males’ ages are set-back two years through age 89 and no set-back for age 90 and above. Females younger than age 80 are set back four years, one year set back from age 80 through 89 and not set back from age 90 and above.
Actuarial assumptions used in the June 30, 2016, valuation are based on the results of an actuarial experience study, effective July 1, 2012.
STRS’ investment consultant develops best estimates for the investment return assumption based on the target allocation adopted by the Retirement Board. The target allocation and best estimates of geometric real rates of return for each major asset class are summarized as follows:
TargetAsset Class Allocation
Domestic Equity 31.00 % 8.00 %International Equity 26.00 7.85Alternatives 14.00 8.00Fixed Income 18.00 3.75Real Estate 10.00 6.75Liquidity Reserves 1.00 3.00
Total 100.00 % 7.61 %
* 10 year annualized geometric nominal returns include the real rate of return and inflation of 2.5 percent, and does not includeinvestment expenses. The total fund long-term expected return reflects diversification among the asset classes and therefore isnot a weighted average return of the individual asset classes.
ExpectedRate of Return *
Long-Term
Discount Rate The discount rate used to measure the total pension liability was 7.75 percent as of June 30, 2016. The projection of cash flows used to determine the discount rate assumes member and employer contributions will be made at the statutory contribution rates in accordance with rate increases described above. For this purpose, only employer contributions that are intended to fund benefits of current plan members and their beneficiaries are included. Projected employer contributions that are intended to fund the service costs of future plan members and their beneficiaries, as well as projected contributions from future plan members, are not included. Based on those assumptions, STRS’ fiduciary net position was projected to be available to make all projected future benefit payments to current plan members as of June 30, 2016. Therefore, the long-term expected rate of return on pension plan investments of 7.75 percent was applied to all periods of projected benefit payment to determine the total pension liability as of June 30, 2016.

Pike County Joint Vocational School DistrictNotes to the Basic Financial Statements
For the Fiscal Year Ended June 30, 2017
44
Sensitivity of the School District's Proportionate Share of the Net Pension Liability to Changes in the Discount Rate The following table presents the School District's proportionate share of the net pension liability calculated using the current period discount rate assumption of 7.75 percent, as well as what the School District's proportionate share of the net pension liability would be if it were calculated using a discount rate that is one-percentage-point lower (6.75 percent) or one-percentage-point higher (8.75 percent) than the current rate:
Current1% Decrease Discount Rate 1% Increase
(6.75%) (7.75%) (8.75%)School District's proportionate share of the net pension liability $11,107,647 $8,358,410 $6,036,265
Changes between Measurement Date and Report Date
In March 2017, the STRS Board adopted certain assumption changes which will impact their annual actuarial valuation prepared as of June 30, 2017. The most significant change is a reduction in the discount rate from 7.75 percent to 7.45 percent. In April 2017, the STRS Board voted to suspend cost of living adjustments granted on or after July 1, 2017. Although the exact amount of these changes is not known, the overall decrease to School District’s NPL is expected to be significant.
NOTE 13 – POSTEMPLOYMENT BENEFITS
School Employees Retirement System
Health Care Plan Description - The School District contributes to the SERS Health Care Fund, administered by SERS for non-certificated retirees and their beneficiaries. For GASB 45 purposes, this plan is considered a cost-sharing, multiple-employer, defined benefit other postemployment benefit (OPEB) plan. SERS offers several types of health plans from various vendors, including HMO’s, PPO’s, Medicare Advantage, and traditional indemnity plans. A prescription drug program is also available to those who elect health coverage. SERS employs two third-party administrator and a pharmacy benefit manager to manage the self-insurance and prescription drug plans, respectively. The financial report of the Plan is included in the SERS Comprehensive Annual Financial Report which can be obtained on SERS’ website at www.ohsers.org under Employers/Audit Resources.
Access to health care for retirees and beneficiaries is permitted in accordance with Section 3309 of the Ohio Revised Code. The Health Care Fund was established and is administered in accordance with Internal Revenue Code Section 105(e). SERS’ Retirement Board reserves the right to change or discontinue any health plan or program. Active employee members do not contribute to the Health Care Plan. The SERS Retirement Board established the rules for the premiums paid by the retirees for health care coverage for themselves and their dependents or for their surviving beneficiaries. Premiums vary depending on the plan selected, qualified years of service, Medicare eligibility, and retirement status.
Funding Policy - State statute permits SERS to fund the health care benefits through employer contributions. Each year, after the allocation for statutorily required pensions and benefits, the Retirement Board may allocate the remainder of the employer contribution of 14 percent of covered payroll to the Health Care Fund in accordance with the funding policy. For fiscal year 2017, no allocation of covered payroll was made to health care. An additional health care surcharge on employers is collected for employees earning less than an actuarially determined minimum compensation amount, pro-rated if less than a full year of service credit was earned. For fiscal year 2017, this amount was $23,500. Statutes provide that no employer shall pay a health care surcharge greater than 2 percent of that employer’s

Pike County Joint Vocational School DistrictNotes to the Basic Financial Statements
For the Fiscal Year Ended June 30, 2017
45
SERS-covered payroll; nor may SERS collect in aggregate more than 1.5 percent of the total statewide SERS-covered payroll for the health care surcharge. For fiscal year 2017, the School District’s surcharge obligation was $19,800.
The surcharge, added to the unallocated portion of the 14 percent employer contribution rate is the total amount assigned to the Health Care Fund. The School District’s contributions for health care for the fiscal years ended June 30, 2017, 2016, and 2015 were $19,800, $21,955, and $29,671, respectively. The full amount has been contributed for fiscal years 2017, 2016, and 2015.
State Teachers Retirement System of Ohio
Plan Description – The State Teachers Retirement System of Ohio (STRS Ohio) administers a cost-sharing multiple-employer defined benefit Health Plan administered for eligible retirees who participated in the defined benefit or combined pension plans offered by STRS Ohio. Ohio law authorizes STRS to offer this plan. Benefits include hospitalization, physicians’ fees, prescription drugs and reimbursement of monthly Medicare Part B premiums. The Plan is included in the report of STRS Ohio which can be obtained by visiting www.strsoh.org or by calling (888) 227-7877.
Funding Policy – Ohio Revised Code Chapter 3307 authorizes STRS Ohio to offer the Plan and gives the Retirement Board discretionary authority over how much, if any, of the health care costs will be absorbed by STRS Ohio. Active employee members do not contribute to the Health Care Plan. Nearly all health care plan enrollees, for the most recent year, pay a portion of the health care costs in the form of a monthly premium. Under Ohio law, funding for post-employment health care may be deducted from employer contributions. For the fiscal years ended June 30, 2017, 2016, and 2015, STRS Ohio did not allocate any employer contributions to post-employment health care.
NOTE 14 – EMPLOYEE BENEFITS
Compensated Absences
The criteria for determining vacation and sick leave benefits are derived from negotiated agreements and State laws. Eligible classified employees and administrators earn 10 to 25 days of vacation per fiscal year, depending upon length of service. Accumulated, unused vacation time is paid to classified employees upon termination of employment. Teachers do not earn vacation time.
Teachers, administrators, and classified employees earn sick leave at the rate of one and one-fourth days per month. Sick leave may be accumulated up to a maximum of 210 days for all personnel. Upon retirement, payment is made for one-fourth of accrued, but unused sick leave credit up to a maximum of 50 days.
Insurance Benefits
The School District provides life insurance to most employees through MetLife Benefits. The School District provides employee medical/surgical benefits and prescription drugs through United Health Care.The School District also provides vision benefits through Vision Service Plan and dental benefits through Superior Dental Care.
Pike County Joint Vocational School DistrictNotes to the Basic Financial Statements
For the Fiscal Year Ended June 30, 2017
46
Deferred Compensation
School District employees may participate in the Ohio Public Employees Deferred Compensation Plan.This plan was created in accordance with Internal Revenue Code Section 457. Participation is on a voluntary payroll deduction basis. The plan permits deferral of compensation until future years. According to the plan, the deferred compensation is not available until termination, retirement, death or an unforeseeable emergency.
NOTE 15 – CAPITALIZED LEASE – LESSEE DISCLOSURE
In prior years, the School District entered into a lease-purchase agreement for constructing improvements, renovations and additions to the School District’s building. The terms of the agreement transfersownership of the building to the School District at the expiration of the lease term. The School District is leasing the project from the Columbus Regional Airport Authority. Columbus Regional Airport Authority will retain title to the project during the lease term. In turn, Columbus Regional Airport Authority has assigned U.S. Bank National Association as trustee. The School District will make semi-annual lease payments to U.S. Bank National Association. The interest rate is fixed at 5.07 percent. The lease is renewable annually and expires in fiscal year 2031. The intention of the School District is to renew the lease annually and payments will be made using revenue generated from an ongoing permanent improvement levy passed in 2005. Capital lease payments are reflected as debt service expenditures in the basic financial statements for the governmental funds and on a budgetary basis. In fiscal year 2016, the School District entered into a lease-purchase agreement for a passenger van. The terms of the agreement transfers ownership of the vehicle to the School District at the expiration of the lease term.
At fiscal year-end, capital assets under these leases have been capitalized as buildings and improvements and vehicles in the Statement of Net Position for governmental activities. A liability was recorded on the Statement of Net Position for governmental activities. Principal payments in fiscal year 2017 totaled$131,091 and were paid from the General and Permanent Improvement Funds.
The assets acquired through capital leases as of June 30, 2017, are as follows:
Asset Value
Accumulated Depreciation
Net Book Value
Asset:Buildings and Improvements $3,057,179 $568,921 $2,488,258Vehicles 30,794 3,242 27,552Total $3,087,973 $572,163 $2,515,810
The following is a schedule of the future long-term minimum lease payments required under the capital lease and the present value of the minimum lease payments as of June 30, 2017:

Pike County Joint Vocational School DistrictNotes to the Basic Financial Statements
For the Fiscal Year Ended June 30, 2017
47
Fiscal Year Ending June 30, Total Payments2018 $265,4892019 254,7172020 254,9232021 254,7742022 254,271
2023-2027 1,272,1602028-2031 1,018,015
Total 3,574,349Less: Amount Representing Interest (1,055,652)Present Value of Net Minimum Lease Payments $2,518,697
NOTE 16 – LONG-TERM OBLIGATIONS
The changes in the School District’s long-term obligations during fiscal year 2017 were as follows:
PrincipalOutstanding
6/30/16 Additions Deductions
PrincipalOutstanding
6/30/17Amounts Due in One Year
Governmental Activities:Net Pension Liability:STRS $7,151,567 $1,206,843 $0 $8,358,410 $0SERS 1,792,104 282,226 0 2,074,330 0Total Net Pension Liability 8,943,671 1,489,069 0 10,432,740 0
Capital Leases 2,649,788 0 131,091 2,518,697 137,697Compensated Absences 466,341 183,907 63,597 586,651 75,308
Total Governmental Activities Long-Term Obligations $12,059,800 $1,672,976 $194,688 $13,538,088 $213,005
There is no repayment schedule for the net pension liability. However, employer pension contributions are made from the following funds: the General Fund and the Food Service, Adult Education, Pre-Service School Bus Driver Training, and Adult Basic Literacy Education Special Revenue Funds. For Additional information related to the net pension liability see Note 12. Compensated absences will be paid from the General Fund and the Food Service, Adult Education, Pre-Service School Bus Driver Training, and Adult Basic Literacy Education Special Revenue Funds. Capital leases will be paid from the Permanent Improvement Fund.
The School District’s overall legal debt margin was $41,845,087 with an unvoted debt margin of $464,945 at June 30, 2017.
NOTE 17 – INTERFUND ACTIVITY
As of June 30, 2017, interfund receivables and payables resulted from the General Fund advancing monies to Nonmajor Governmental Funds in the amount of $5,948.

Pike County Joint Vocational School DistrictNotes to the Basic Financial Statements
For the Fiscal Year Ended June 30, 2017
48
General Fund advances are made to move unrestricted balances to support programs and projects accounted for in other funds. Advancing monies to other funds is necessary due to timing differences in the receiving grant monies. When the monies are finally received, the grant fund reimburses the General Fund for the initial advance.
NOTE 18 – JOINTLY GOVERNED ORGANIZATIONS AND INSURANCE PURCHASING POOLS
South Central Ohio Computer Association Regional Council of Governments (SCOCARCoG)
The School District is a participant in the South Central Ohio Computer Association Regional Council of Governments (SCOCARCoG), which is organized under ORC Code Chapter 167 as a council of governments. SCOCARCoG is an association of public school districts within the boundaries of Pickaway, Gallia, Adams, Brown, Highland, Pike, Ross, Scioto, Vinton, Jackson, and Lawrence Counties. The organization was formed for the purpose of applying modern technology with the aid of computersand other electronic equipment to administrative and instructional functions among member school districts. The governing board of SCOCARCoG consists of two representatives from each county in the SCOCARCoG service region designated by the Ohio Department of Education and two representatives of the school treasurers. The Board exercises total control over the operations of SCOCARCoG including budgeting, appropriating, contracting and designating management. Each School District’s degree of control is limited to its representation on the Board.
During fiscal year 2016, SCOCARCoG entered into a merger agreement with Metropolitan Educational Technology Association (“META”). Pursuant to an addendum to the agreement, certain liabilities will remain the sole responsibility of SCOCARCoG, and once these remaining liabilities are satisfied, SCOCARCoG will be dissolved and the member districts will become members of META. SCOCARCoG entered into a subcontract agreement with META to provide services to SCOCARCoG, and on behalf of SCOCARCoG, to the member districts. Consistent with the merger agreement and updated bylaws, SCOCARCoG is currently governed by a four person executive governing board. The School District paid SCOCARCoG $28,058 for services provided during the fiscal year. Financial information can be obtained from the SCOCA Regional Council of Governments through META Solutions, David Varda, CFO, 100 Executive Drive, Marion Ohio 43302.
Coalition of Rural and Appalachian Schools
The Coalition of Rural and Appalachian Schools (the “Coalition”) is a jointly governed organization of over 100 school districts in southeastern Ohio. The Coalition is operated by a board which is composed of 14 members. The board members are composed of one superintendent from each county elected by the school districts within that county. The Coalition provides various services for school district administrative personnel; gathers data regarding education conditions in the region; cooperates with other professional groups to assess and develop programs designed to meet the needs of member districts; and provides staff development programs for school district personnel. The Board exercises total control over the operations of the coalition including budget, appropriating, contracting and designating management. Each School District’s degree of control is limited to its representation on the Board. The School District’s membership fee was $325 for fiscal year 2017. The financial information for the Coalition can be obtained from the Executive Director, at McCraken Hall, Ohio University, Athens, Ohio 45701.

Pike County Joint Vocational School DistrictNotes to the Basic Financial Statements
For the Fiscal Year Ended June 30, 2017
49
Ohio SchoolComp Group Retrospective Rating Program
The School District participates in the Ohio SchoolComp Group Retrospective Rating Program (GRRP), an insurance purchasing pool. The GRRP’s business and affairs are conducted by a five member Board of Directors. Each fiscal year, the participants pay an enrollment fee to CompManagement, Inc. to cover the costs of administering the program.
Ohio School Plan
The School District participates in the Ohio School Plan (Plan), an insurance purchasing pool established under Section 2744.081 of the Ohio Revised Code. The Plan is an unincorporated nonprofit association of its members which enables the participants to provide for a formalized joint insurance purchasing program for maintaining adequate insurance protection and provides risk management programs and other administrative services. The Plan’s business and affairs are conducted by a fifteen member board consisting of superintendents, treasurers, the president of Harcum-Shuett Insurance Agency, Inc., and a member of the Hylant Group, Inc. The Hylant Group, Inc. is the Plan’s administrator and is responsible for processing claims. Harcum-Shuett Insurance Agency serves as the sales and marketing representative which establishes agreements between the Plan and its members. Financial information can be obtained from Harcum-Shuett Insurance Agency, 246 East Sycamore Street, Columbus, Ohio 43206.
NOTE 19 – SET-ASIDE CALCULATIONS
The School District is required by State statute to annually set aside, in the General Fund, an amount based on a statutory formula for the acquisition and construction of capital improvements. Amounts not spent by fiscal year-end or offset by similarly restricted resources received during the fiscal year must be held in cash at fiscal year-end and carried forward to be used for the same purposes in future fiscal years.
The Schools District’s set aside for budget stabilization represents refunds received from the Bureau of Workers’ Compensation prior to April 10, 2001. Senate Bill 345 places conditions on the use of these dollars, including offsetting a budget deficit. The School District plans to use their set aside to offset any budget deficit the School District may experience in future years. There are no requirements for additional amounts to be set aside for budget stabilization. The School District has not adopted any additional guidelines for spending the money; therefore, the balance of $23,547 is included in the unassigned fund balance of the general fund.
The following cash basis information identifies the change in the fiscal year-end set-aside amounts forcapital acquisition and budget stabilization. Disclosure of this information is required by State statute.
CapitalAcquisition
BudgetStabilization
Set-aside Balance as of June 30, 2016 $0 $23,547Current Fiscal Year Set-aside Requirement 64,713 0Current Fiscal Year Offsets (64,713) 0Set-aside Balance as of June 30, 2017 $0 $23,547Required Set-aside Balances Carried Forward to Fiscal Year 2018 $0 $23,547

Pike County Joint Vocational School DistrictNotes to the Basic Financial Statements
For the Fiscal Year Ended June 30, 2017
50
Amounts of offsets and qualifying expenditures presented in the table for the capital acquisition set-asides were limited to those necessary to reduce the year-end balance to zero. Although the School District may have had additional offsets and qualifying expenditures for capital acquisitions, these amounts may not be used to reduce the set-aside requirements of future fiscal years and therefore is not presented as being carried forward to the next fiscal year.
NOTE 20 – SIGNIFICANT COMMITMENTS
Encumbrances
Encumbrances are commitments related to unperformed contracts for goods and services. Encumbrances accounting is utilized to the extent necessary to assure effective budgetary control and accountability and to facilitate effective cash planning and control. At fiscal year end, the amount of encumbrances expected to be honored upon performance by the vendor in the next fiscal year were as follows:
General Fund $19,571Nonmajor Governmental Funds 837Total $20,408
NOTE 21 – CONTINGENCIES
Grants
The School District received financial assistance from federal and State agencies in the form of grants. The expenditure of funds received under these programs generally requires compliance with terms and conditions specified in the grant agreements and are subject to audit by the grantor agencies. Any disallowed claims resulting from such audits could become a liability of the General Fund or other applicable funds. However, the effect of any such disallowed claims on the overall financial position of the School District at June 30, 2017, if applicable, cannot be determined at this time.
School Foundation
School District foundation funding is based on the annualized full-time equivalent (FTE) enrollment of each student. The Ohio Department of Education (ODE) is legislatively required to adjust/reconcile funding as enrollment information is updated by schools throughout the State, which can extend past the fiscal year end. As of the date of this report, additional ODE adjustments for fiscal year 2017 are not finalized. As a result, the impact of future FTE adjustments on the fiscal year 2017 financial statements is not determinable, at this time. Management believes this may result in either an additional receivable to, or a liability of, the School District.
Litigation
The School District is not party to any legal proceedings.

This page intentionally left blank.

51
Pike County Joint Vocational School District
Required Supplementary Information

52
2017 2016 2015 2014
School District's Proportion of the Net Pension Liability 0.02834140% 0.03140680% 0.03291000% 0.03291000%
School District's Proportionate Share of the Net Pension Liability $2,074,330 $1,792,104 $1,665,557 $1,957,052
School District's Covered Payroll $858,350 $941,121 $837,794 $915,878
School District's Proportionate Share of the Net Pension Liability as a Percentage of its Covered Payroll 241.66% 190.42% 198.80% 213.68%
Plan Fiduciary Net Position as a Percentage of the Total Pension Liability 62.98% 69.16% 71.70% 65.52%
Note: Amounts presented as of the School District's measurement date which is the prior fiscal year end.
(1) Although this schedule is intended to reflect information for ten years, information prior to 2014 is not available. An additional column will be added each year.
Pike County Joint Vocational School DistrictRequired Supplementary Information
Schedule of the School District's Proportionate Share of the Net Pension LiabilitySchool Employees Retirement System of Ohio
Last Four Fiscal Years (1) *

53
2017 2016 2015 2014
School District's Proportion of the Net Pension Liability 0.02497059% 0.02587672% 0.02615554% 0.02615554%
School District's Proportionate Share of the Net
Pension Liability $8,358,410 $7,151,567 $6,361,931 $7,578,292
School District's Covered Payroll $2,647,329 $2,703,779 $2,678,236 $2,625,369
School District's Proportionate Share of the Net Pension Liability as a Percentage of its Covered Payroll 315.73% 264.50% 237.54% 288.66%
Plan Fiduciary Net Position as a Percentage of the Total Pension Liability 66.80% 72.10% 74.70% 69.30%
Note: Amounts presented as of the School District's measurement date which is the prior fiscal year end.
(1) Although this schedule is intended to reflect information for ten years, information prior to 2014 is not available. An additional column will be added each year.
Pike County Joint Vocational School District Required Supplementary Information
Schedule of the School District's Proportionate Share of the Net Pension LiabilityState Teachers Retirement System of Ohio
Last Four Fiscal Years (1) *

54
2017 2016 2015 2014
Contractually Required Contribution $131,777 $120,169 $124,040 $116,118
Contributions in Relation to the Contractually Required Contribution (131,777) (120,169) (124,040) (116,118)
Contribution Deficiency (Excess) $0 $0 $0 $0
School District Covered Payroll $941,264 $858,350 $941,121 $837,794
Contributions as a Percentage of Covered Payroll 14.00% 14.00% 13.18% 13.86%
Pike County Joint Vocational School DistrictRequired Supplementary Information
Schedule of School District ContributionsSchool Employees Retirement System of Ohio
Last Ten Fiscal Years

55
2013 2012 2011 2010 2009 2008
$126,757 $419,288 $380,881 $394,480 $282,300 $288,450
(126,757) (419,288) (380,881) (394,480) (282,300) (288,450)
$0 $0 $0 $0 $0 $0
$915,878 $3,117,386 $3,030,076 $2,913,443 $2,868,900 $2,937,369
13.84% 13.45% 12.57% 13.54% 9.84% 9.82%

56
2017 2016 2015 2014
Contractually Required Contribution $386,124 $370,626 $378,529 $364,911
Contributions in Relation to the Contractually Required Contribution (386,124) (370,626) (378,529) (364,911)
Contribution Deficiency (Excess) $0 $0 $0 $0
School District Covered Payroll $2,785,029 $2,647,329 $2,703,779 $2,678,236
Contributions as a Percentage of Covered Payroll 14.00% 14.00% 14.00% 13.00%
Pike County Joint Vocational School DistrictRequired Supplementary Information
Schedule of School District ContributionsState Teachers Retirement System of Ohio
Last Ten Fiscal Years

57
2013 2012 2011 2010 2009 2008
$341,298 $343,062 $425,622 $368,395 $367,789 $347,312
(341,298) (343,062) (425,622) (368,395) (367,789) (347,312)
$0 $0 $0 $0 $0 $0
$2,625,369 $2,638,938 $3,274,015 $2,833,808 $2,829,146 $2,671,631
13.00% 13.00% 13.00% 13.00% 13.00% 13.00%

Pike County Joint Vocational School DistrictNotes to Required Supplementary Information
For the Fiscal Year Ended June 30, 2017
58
Changes in Assumptions - SERS
Amounts reported for fiscal year 2017 incorporate changes in assumptions used by SERS in calculating the total pension liability in the latest actuarial valuation. These new assumptions compared with those used in fiscal year 2016 and prior are presented below:
Fiscal Year 2017 Fiscal Year 2016 and Prior
Wage Inflation 3.00 percent 3.25 percentFuture Salary Increases, including inflation 3.50 percent to 18.20 percent 4.00 percent to 22.00 percentInvestment Rate of Return 7.50 percent net of investments 7.75 percent net of investments
expense, including inflation expense, including inflation
Amounts reported for fiscal year 2017 use mortality assumptions with mortality rates that are based on the RP-2014 Blue Collar Mortality Table with fully generational projection and a five year age set-back for both males and females. Amounts reported for fiscal year 2016 and prior, use mortality assumptions that are based on the 1994 Group Annuity Mortality Table set back one year for both men and women. Special mortality tables were used for the period after disability retirement.

59
Pike County Joint Vocational School District
Combining and Individual Fund Statements and Schedules

60
Pike County Joint Vocational School District
Nonmajor Fund Descriptions
SPECIAL REVENUE FUNDS
Special Revenue Funds are established to account for and report the proceeds of specific revenue sources that are restricted or committed to expenditure for specific purposes other than debt service or capital projects. The following are descriptions of the School District’s nonmajor special revenue funds:
Nonmajor Special Revenue Funds
Food Service FundThis fund accounts for and reports restricted financial transactions related to the food service operations of the School District.
Adult Education FundTo account for and report tuition and State monies restricted for advancing and retraining out-of-school youths and adults for the purpose of improving their skills and knowledge in their occupation or their planned occupation.
Ohio School Facilities Maintenance FundTo account for and report property taxes restricted to expenditures for the maintenance and upkeep of School District classroom facilities.
Pre-Service School Bus Driver Training FundTo account for and report restricted State grants used for school bus driver training programs.
Education Management Information System FundTo account for and report restricted State grants which support the hardware and software development or other costs associated with the requirements of the management information system. (This fund did not have any budgetary activity in fiscal year 2017, therefore, budgetary information is not provided.)
Career Development FundTo account for and report monies received and expended in conjunction with Vocational Education Career Development projects funded by the State of Ohio, Ohio Department of Education, Division of Vocational Education.
ONENet Ohio FundTo account for and report restricted State grants appropriated for Ohio Educational Computer Network Connections.
Ohio SchoolNet Professional Development FundTo account for and report restricted State grants used to provide professional development for teachers.(This fund did not have any budgetary activity in fiscal year 2017, therefore, budgetary information is not provided.)
Miscellaneous State Grants FundTo account for and report various restricted grants received from State agencies which are not classified elsewhere. (This fund did not have any budgetary activity in fiscal year 2017, therefore, budgetary information is not provided.)

61
Pike County Joint Vocational School District
Nonmajor Fund Descriptions - (continued)
Adult Basic Literacy Education FundTo account for and report restricted federal and State grants used to provide programs in reading, writing, and math competency for adults that do not have a high school diploma.
Summer Youth Employment Training FundTo account for and report restricted federal grants used for planning and conducting programs that provide for the training of unemployed persons and for the advancement of underemployed persons. (This fund did not have any budgetary activity in fiscal year 2017, therefore, budgetary information is not provided.)
Vocational Education FundTo account for and report restricted State grants used for the development of vocational education programs in the following categories: secondary, post-secondary, adult, disadvantaged and handicapped persons, exemplary programs, cooperative education, ancillary services, research, advisory committees, and work-study projects.
Improving Teacher Quality FundTo account for and report restricted federal grants used to hire additional classroom teachers in grades one through three, so that the number of students per teacher will be reduced and to improve teacher quality.
Miscellaneous Federal Grants FundTo account for and report restricted grants received from federal agencies which are not classified elsewhere.
NONMAJOR DEBT SERVICE FUND
The Debt Service Fund is used to account for and report financial resources that are restricted or committed for payment of general obligation principal and interest and fiscal charges. The School District has only one Debt Service Fund. (This fund did not have any budgetary activity in fiscal year 2017,therefore, budgetary information is not provided.)

62
This Page Intentionally Left Blank

63
Pike County Joint Vocational School DistrictCombining Balance Sheet
Nonmajor Governmental FundsJune 30, 2017
Nonmajor Nonmajor TotalSpecial Debt Nonmajor
Revenue Service GovernmentalFunds Fund Funds
Assets:Equity in Pooled Cash and Cash Equivalents $363,658 $3,499 $367,157Cash and Cash Equivalents With Fiscal Agent 0 5,000 5,000Receivables: Accounts 1,219 0 1,219 Intergovernmental 25,405 0 25,405Prepaid Items 903 0 903Materials and Supplies Inventory 395 0 395Inventory Held for Resale 5,705 0 5,705
Total Assets $397,285 $8,499 $405,784
Liabilities:Accounts Payable $29,616 $0 $29,616Accrued Wages and Benefits Payable 8,940 0 8,940Intergovernmental Payable 2,213 0 2,213Interfund Payable 5,948 0 5,948Matured Bonds Payable 0 5,000 5,000
Total Liabilities 46,717 5,000 51,717
Deferred Inflows of Resources:Unavailable Revenue 19,748 0 19,748
Fund Balances:Nonspendable 1,298 0 1,298Restricted 329,792 3,499 333,291Unassigned (Deficit) (270) 0 (270)
Total Fund Balances 330,820 3,499 334,319
Total Liabilities, Deferred Inflows ofResources and Fund Balances $397,285 $8,499 $405,784

64
Pike County Joint Vocational School DistrictCombining Statement of Revenues, Expenditures and Changes in Fund Balances
Nonmajor Governmental FundsFor the Fiscal Year Ended June 30, 2017
Nonmajor Nonmajor TotalSpecial Debt Nonmajor
Revenue Service GovernmentalFunds Fund Funds
Revenues:Property Taxes $115,236 $0 $115,236Intergovernmental 739,528 0 739,528Investment Earnings 580 0 580Tuition and Fees 92,690 0 92,690Charges for Services 62,645 0 62,645Miscellaneous 5,852 0 5,852
Total Revenues 1,016,531 0 1,016,531
Expenditures:Current: Instruction: Vocational 75,622 0 75,622 Adult/Continuing 229,366 0 229,366 Support Services: Instructional Staff 94,373 0 94,373 Administration 104,913 0 104,913 Operation and Maintenance of Plant 160,088 0 160,088 Central 172,749 0 172,749 Operation of Non-Instructional Services 199,111 0 199,111Capital Outlay 8,798 0 8,798
Total Expenditures 1,045,020 0 1,045,020
Net Change in Fund Balances (28,489) 0 (28,489)
Fund Balances at Beginning of Year 359,309 3,499 362,808
Fund Balances at End of Year $330,820 $3,499 $334,319

65
Pike County Joint Vocational School DistrictCombining Balance Sheet
Nonmajor Special Revenue FundsJune 30, 2017
Ohio School Pre-ServiceFood Adult Facilities School Bus
Service Education Maintenance Driver TrainingFund Fund Fund Fund
Assets:Equity in Pooled Cash and Cash Equivalents $67,174 $37,191 $212,373 $24,011Receivables: Accounts 515 398 130 176 Intergovernmental 0 0 0 0Prepaid Items 506 209 68 96Materials and Supplies Inventory 395 0 0 0Inventory Held for Resale 5,705 0 0 0
Total Assets $74,295 $37,798 $212,571 $24,283
Liabilities:Accounts Payable $0 $28,852 $0 $0Accrued Wages and Benefits Payable 8,940 0 0 0Intergovernmental Payable 2,213 0 0 0Interfund Payable 0 0 0 0
Total Liabilities 11,153 28,852 0 0
Deferred Inflows of Resources:Unavailable Revenue 0 0 0 0
Fund Balances:Nonspendable 901 209 68 96Restricted 62,241 8,737 212,503 24,187Unassigned (Deficit) 0 0 0 0
Total Fund Balances (Deficit) 63,142 8,946 212,571 24,283
Total Liabilities, Deferred Inflows ofResources and Fund Balances $74,295 $37,798 $212,571 $24,283
(continued)

66
Education OhioManagement SchoolNetInformation ONENet Professional Miscellaneous
System Ohio Development State GrantsFund Fund Fund Fund
Assets:Equity in Pooled Cash and Cash Equivalents $51 $9,000 $50 $1,745Receivables: Accounts 0 0 0 0 Intergovernmental 0 0 0 0Prepaid Items 0 0 0 0Materials and Supplies Inventory 0 0 0 0Inventory Held for Resale 0 0 0 0
Total Assets $51 $9,000 $50 $1,745
Liabilities:Accounts Payable $0 $0 $0 $0Accrued Wages and Benefits Payable 0 0 0 0Intergovernmental Payable 0 0 0 0Interfund Payable 0 0 0 0
Total Liabilities 0 0 0 0
Deferred Inflows of Resources:Unavailable Revenue 0 0 0 0
Fund Balances:Nonspendable 0 0 0 0Restricted 51 9,000 50 1,745Unassigned (Deficit) 0 0 0 0
Total Fund Balances (Deficit) 51 9,000 50 1,745
Total Liabilities, Deferred Inflows ofResources and Fund Balances $51 $9,000 $50 $1,745
Pike County Joint Vocational School DistrictCombining Balance Sheet
Nonmajor Special Revenue FundsJune 30, 2017
(continued)

67
SummerAdult Basic Youth Improving Miscellaneous Total
Literacy Employment Vocational Teacher Federal NonmajorEducation Training Education Quality Grants Special Revenue
Fund Fund Fund Fund Fund Funds
$231 $242 $0 $585 $11,005 $363,658
0 0 0 0 0 1,21923,354 0 112 1,939 0 25,405
24 0 0 0 0 9030 0 0 0 0 3950 0 0 0 0 5,705
$23,609 $242 $112 $2,524 $11,005 $397,285
$179 $0 $0 $585 $0 $29,6160 0 0 0 0 8,9400 0 0 0 0 2,213
5,251 0 112 585 0 5,948
5,430 0 112 1,170 0 46,717
18,124 0 0 1,624 0 19,748
24 0 0 0 0 1,29831 242 0 0 11,005 329,792
0 0 0 (270) 0 (270)
55 242 0 (270) 11,005 330,820
$23,609 $242 $112 $2,524 $11,005 $397,285

68
Pike County Joint Vocational School DistrictCombining Statement of Revenues, Expenditures and Changes in Fund Balances
Nonmajor Special Revenue FundsFor the Fiscal Year Ended June 30, 2017
Ohio School Pre-ServiceFood Adult Facilities School Bus
Service Education Maintenance Driver TrainingFund Fund Fund Fund
Revenues:Property Taxes $0 $0 $115,236 $0Intergovernmental 212,498 142,247 0 104,869Investment Earnings 580 0 0 0Tuition and Fees 0 92,690 0 0Charges for Services 21,482 0 0 41,163Miscellaneous 85 2,236 130 3,331
Total Revenues 234,645 237,173 115,366 149,363
Expenditures:Current: Instruction: Vocational 0 0 0 0 Adult/Continuing 0 122,644 0 0 Support Services: Instructional Staff 0 34,131 0 0 Administration 0 73,425 0 0 Operation and Maintenance of Plant 0 0 160,088 0 Central 0 0 0 172,749 Operation of Non-Instructional Services 199,111 0 0 0Capital Outlay 0 0 8,798 0
Total Expenditures 199,111 230,200 168,886 172,749
Net Change in Fund Balances 35,534 6,973 (53,520) (23,386)
Fund Balances (Deficit) at Beginning of Year 27,608 1,973 266,091 47,669
Fund Balances (Deficit) at End of Year $63,142 $8,946 $212,571 $24,283

69
Education Ohio SummerManagement SchoolNet Adult Basic YouthInformation Career ONENet Professional Miscellaneous Literacy Employment
System Development Ohio Development State Grants Education TrainingFund Fund Fund Fund Fund Fund Fund
$0 $0 $0 $0 $0 $0 $00 4,196 1,800 0 0 160,718 00 0 0 0 0 0 00 0 0 0 0 0 00 0 0 0 0 0 00 0 0 0 0 70 0
0 4,196 1,800 0 0 160,788 0
0 4,196 2,479 0 0 0 00 0 0 0 0 106,722 0
0 0 0 0 0 22,554 00 0 0 0 0 31,488 00 0 0 0 0 0 00 0 0 0 0 0 00 0 0 0 0 0 00 0 0 0 0 0 0
0 4,196 2,479 0 0 160,764 0
0 0 (679) 0 0 24 0
51 0 9,679 50 1,745 31 242
$51 $0 $9,000 $50 $1,745 $55 $242(continued)

70
Improving Miscellaneous TotalVocational Teacher Federal NonmajorEducation Quality Grants Special Revenue
Fund Fund Fund Funds
Revenues:Property Taxes $0 $0 $0 $115,236Intergovernmental 103,917 790 8,493 739,528Investment Earnings 0 0 0 580Tuition and Fees 0 0 0 92,690Charges for Services 0 0 0 62,645Miscellaneous 0 0 0 5,852
Total Revenues 103,917 790 8,493 1,016,531
Expenditures:Current: Instruction: Vocational 59,394 1,060 8,493 75,622 Adult/Continuing 0 0 0 229,366 Support Services: Instructional Staff 37,688 0 0 94,373 Administration 0 0 0 104,913 Operation and Maintenance of Plant 0 0 0 160,088 Central 0 0 0 172,749 Operation of Non-Instructional Services 0 0 0 199,111Capital Outlay 0 0 0 8,798
Total Expenditures 97,082 1,060 8,493 1,045,020
Net Change in Fund Balances 6,835 (270) 0 (28,489)
Fund Balances (Deficit) at Beginning of Year (6,835) 0 11,005 359,309
Fund Balances (Deficit) at End of Year $0 ($270) $11,005 $330,820
Pike County Joint Vocational School DistrictCombining Statement of Revenues, Expenditures and Changes in Fund Balances
Nonmajor Special Revenue FundsFor the Fiscal Year Ended June 30, 2017
(continued)

71
Pike County Joint Vocational School District
Agency Fund Descriptions
AGENCY FUNDS
Agency Funds are used to account for assets held by the School District as an agent for individuals, private organizations, and other governmental units. The following are descriptions of the School District’s agency funds:
Student Managed Activity FundTo account for and report student activity programs which have student participation in the activity and have students involved in the management of the program.
District Agency FundTo account for and report the Stafford Loan and PELL grant monies received by the School District that are distributed to chosen recipients.

72
Balance at Balance at6/30/2016 Additions Deletions 6/30/2017
STUDENT MANAGED ACTIVITY FUND
Assets:Equity in Pooled Cash and Cash Equivalents $3,084 $1,761 $1,093 $3,752
Liabilities:Undistributed Monies $3,084 $1,761 $1,093 $3,752
DISTRICT AGENCY FUND
Assets:Equity in Pooled Cash and Cash Equivalents $329 $0 $0 $329
Liabilities:Undistributed Monies $329 $0 $0 $329
TOTAL - ALL AGENCY FUNDS
Assets:Equity in Pooled Cash and Cash Equivalents $3,413 $1,761 $1,093 $4,081
Liabilities:Undistributed Monies $3,413 $1,761 $1,093 $4,081
Pike County Joint Vocational School DistrictStatement of Changes in Assets and Liabilities
Agency FundsFor the Fiscal Year Ended June 30, 2017

73
PIKE COUNTY JOINT VOCATIONAL SCHOOL DISTRICT
INDIVIDUAL FUND SCHEDULES OF REVENUES, EXPENDITURES ANDCHANGES IN FUND BALANCE - BUDGET AND ACTUAL (BUDGET BASIS)

74
Pike County Joint Vocational School DistrictSchedule of Revenues, Expenditures and Changes
In Fund Balance - Budget and Actual (Budget Basis)General Fund
For the Fiscal Year Ended June 30, 2017
Budgeted Amount VariancePositive
Final Actual (Negative)Revenues:Property Taxes $1,244,890 $1,244,890 $0Payments in Lieu of Taxes 789 789 0Intergovernmental 4,594,081 4,594,061 (20)Investment Earnings 61,282 67,136 5,854Tuition and Fees 16,170 16,170 0Rentals 25,285 25,285 0Charges for Services 164,877 165,132 255Contributions and Donations 4,706 4,706 0Miscellaneous 22,711 22,686 (25)
Total Revenues 6,134,791 6,140,855 6,064
Expenditures:Current: Instruction: Special Salaries 128,186 127,470 716 Fringe Benefits 41,299 40,452 847 Purchased Services 26,100 25,114 986 Materials and Supplies 6,211 5,938 273 Capital Outlay 2,469 588 1,881
Total Special 204,265 199,562 4,703
Vocational Salaries 2,014,535 1,932,925 81,610 Fringe Benefits 870,894 847,830 23,064 Purchased Services 83,701 66,568 17,133 Materials and Supplies 917,864 713,397 204,467 Capital Outlay 357,431 174,117 183,314 Other 7,050 6,150 900
Total Vocational 4,251,475 3,740,987 510,488
Student Intervention Services Salaries 80,644 80,644 0 Fringe Benefits 27,496 27,278 218 Purchased Services 640 389 251 Materials and Supplies 439 419 20 Capital Outlay 476 476 0
Total Student Intervention Services 109,695 109,206 489
Total Instruction $4,565,435 $4,049,755 $515,680(continued)

75
Pike County Joint Vocational School DistrictSchedule of Revenues, Expenditures and Changes
In Fund Balance - Budget and Actual (Budget Basis)General Fund
For the Fiscal Year Ended June 30, 2017(continued)
VariancePositive
Final Actual (Negative) Support Services: Pupils Salaries $166,616 $162,092 $4,524 Fringe Benefits 98,244 97,269 975 Purchased Services 15,913 6,068 9,845 Materials and Supplies 45,619 36,911 8,708 Capital Outlay 3,390 89 3,301 Other 150 50 100
Total Pupils 329,932 302,479 27,453
Instructional Staff Materials and Supplies 5,974 2,855 3,119 Capital Outlay 820 820 0
Total Instructional Staff 6,794 3,675 3,119
Board of Education Salaries 7,250 7,250 0 Fringe Benefits 1,781 1,675 106 Purchased Services 72,712 60,029 12,683 Other 63,905 33,497 30,408
Total Board of Education 145,648 102,451 43,197
Administration Salaries 332,084 320,979 11,105 Fringe Benefits 162,024 151,623 10,401 Purchased Services 10,913 6,845 4,068 Materials and Supplies 39,701 28,567 11,134 Capital Outlay 7,289 0 7,289 Other 4,726 4,401 325
Total Administration 556,737 512,415 44,322
Fiscal Salaries 204,926 198,777 6,149 Fringe Benefits 105,306 98,139 7,167 Purchased Services 21,961 20,624 1,337 Materials and Supplies 70,249 40,500 29,749 Other 57,360 56,304 1,056
Total Fiscal 459,802 414,344 45,458
Operation and Maintenance of Plant Salaries 107,892 107,374 518 Fringe Benefits 47,922 47,830 92 Purchased Services 343,325 270,771 72,554 Materials and Supplies 76,716 57,879 18,837 Capital Outlay 4,759 4,702 57
Total Operation and Maintenance of Plant $580,614 $488,556 $92,058(continued)
Budgeted Amount

76
Pike County Joint Vocational School DistrictSchedule of Revenues, Expenditures and Changes
In Fund Balance - Budget and Actual (Budget Basis)General Fund
For the Fiscal Year Ended June 30, 2017(continued)
VariancePositive
Final Actual (Negative) Pupil Transportation Salaries $8,134 $8,134 $0 Fringe Benefits 1,566 1,561 5 Materials and Supplies 3,732 1,578 2,154 Other 196 142 54
Total Pupil Transportation 13,628 11,415 2,213
Central Salaries 135,826 127,825 8,001 Fringe Benefits 64,821 64,163 658 Purchased Services 22,417 9,771 12,646 Materials and Supplies 19,944 15,089 4,855 Capital Outlay 44,606 442 44,164 Other 4,039 4,039 0
Total Central 291,653 221,329 70,324
Total Support Services 2,384,808 2,056,664 328,144
Operation of Non-Instructional Services: Food Service Salaries 27,568 27,568 0 Fringe Benefits 7,089 6,103 986 Materials and Supplies 10,649 10,649 0
Total Operation of Non-Instructional Services 45,306 44,320 986
Total Expenditures 6,995,549 6,150,739 844,810
Excess of Revenues Under Expenditures ($860,758) ($9,884) $850,874(continued)
Budgeted Amount

77
Pike County Joint Vocational School DistrictSchedule of Revenues, Expenditures and Changes
In Fund Balance - Budget and Actual (Budget Basis)General Fund
For the Fiscal Year Ended June 30, 2017(continued)
VariancePositive
Final Actual (Negative)Other Financing Sources (Uses):Transfers In $67,496 $0 ($67,496)Transfers Out (103,379) (66,655) 36,724Advances In 19,209 19,209 0Advances Out (19,209) (5,948) 13,261
Total Other Financing Sources (Uses) (35,883) (53,394) (17,511)
Net Change in Fund Balance (896,641) (63,278) 833,363
Fund Balance at Beginning of Year 4,762,429 4,762,429 0
Prior Year Encumbrances Appropriated 112,891 112,891 0
Fund Balance at End of Year $3,978,679 $4,812,042 $833,363
Budgeted Amount

Pike County Joint Vocational School DistrictSchedule of Revenues, Expenditures and Changes
in Fund Balance - Budget and Actual (Budget Basis)Permanent Improvement Fund
For the Fiscal Year Ended June 30, 2017
VariancePositive
Final Actual (Negative)Revenues:Property Taxes $317,106 $317,106 $0Intergovernmental 40,839 40,839 0
Total Revenues 357,945 357,945 0
Expenditures:Current: Support Services: Fiscal Other 12,321 12,321 0
Debt Service: Principal Retirement 187,645 121,000 66,645 Interest and Fiscal Charges 79,164 142,492 (63,328)
Total Debt Service 266,809 263,492 3,317
Total Expenditures 279,130 275,813 3,317
Excess of Revenues Over Expenditures 78,815 82,132 3,317
Other Financing Uses:Transfers Out (48,582) (48,582) 0
Net Change in Fund Balance 30,233 33,550 3,317
Fund Balance at Beginning of Year 705,776 705,776 0
Fund Balance at End of Year $736,009 $739,326 $3,317
Budgeted Amount
78

Pike County Joint Vocational School DistrictSchedule of Revenues, Expenditures and Changes
in Fund Balance - Budget and Actual (Budget Basis)Food Service Fund
For the Fiscal Year Ended June 30, 2017
VariancePositive
Final Actual (Negative)Revenues:Intergovernmental $192,960 $192,960 $0Investment Earnings 622 681 59Charges for Services 21,176 21,176 0
Total Revenues 214,758 214,817 59
Expenditures:Current: Operation of Non-Instructional Services: Food Service Salaries 53,557 51,506 2,051 Fringe Benefits 11,138 9,916 1,222 Purchased Services 3,734 3,698 36 Materials and Supplies 147,372 111,212 36,160 Capital Outlay 800 800 0
Total Expenditures 216,601 177,132 39,469
Net Change in Fund Balance (1,843) 37,685 39,528
Fund Balance at Beginning of Year 29,590 29,590 0
Fund Balance at End of Year $27,747 $67,275 $39,528
Budgeted Amount
79

Pike County Joint Vocational School DistrictSchedule of Revenues, Expenditures and Changes
in Fund Balance - Budget and Actual (Budget Basis)Adult Education Fund
For the Fiscal Year Ended June 30, 2017
VariancePositive
Final Actual (Negative)Revenues:Intergovernmental $141,905 $142,247 $342Tuition and Fees 93,930 93,930 0Miscellaneous 1,838 1,838 0
Total Revenues 237,673 238,015 342
Expenditures:Current: Instruction: Adult/Continuing Salaries 37,893 37,893 0 Fringe Benefits 6,151 6,151 0 Purchased Services 10,536 10,536 0 Materials and Supplies 29,097 29,053 44 Capital Outlay 269 269 0 Other 10,079 10,079 0
Total Instruction 94,025 93,981 44
Support Services: Instructional Staff Salaries 8,376 8,376 0 Fringe Benefits 25,778 25,778 0
Total Instructional Staff 34,154 34,154 0
Administration Salaries 50,556 50,556 0 Fringe Benefits 22,863 22,863 0 Purchased Services 1,305 55 1,250
Total Administration 74,724 73,474 1,250
Total Support Services 108,878 107,628 1,250
Total Expenditures 202,903 201,609 1,294
Net Change in Fund Balance 34,770 36,406 1,636
Fund Balance at Beginning of Year 733 733 0
Fund Balance at End of Year $35,503 $37,139 $1,636
Budgeted Amount
80

Pike County Joint Vocational School DistrictSchedule of Revenues, Expenditures and Changes
in Fund Balance - Budget and Actual (Budget Basis)Ohio School Facilities Maintenance FundFor the Fiscal Year Ended June 30, 2017
VariancePositive
Final Actual (Negative)
Revenues: $0 $0 $0
Expenditures:Current:
Support Services:Operation and Maintenance of Plant
Salaries 74,671 71,542 3,129Fringe Benefits 32,485 32,391 94Purchased Services 64,593 57,652 6,941Materials and Supplies 13,129 0 13,129
Total Support Services 184,878 161,585 23,293
Capital Outlay: Building Improvement Services
Capital Outlay 23,766 8,798 14,968
Total Expenditures 208,644 170,383 38,261
Excess of Revenues Under Expenditures (208,644) (170,383) 38,261
Other Financing Sources:Transfers In 115,236 115,236 0
Net Change in Fund Balance (93,408) (55,147) 38,261
Fund Balance at Beginning of Year 267,520 267,520 0
Fund Balance at End of Year $174,112 $212,373 $38,261
Budgeted Amount
81

Pike County Joint Vocational School DistrictSchedule of Revenues, Expenditures and Changes
in Fund Balance - Budget and Actual (Budget Basis)Pre-Service School Bus Driver Training Fund
For the Fiscal Year Ended June 30, 2017
VariancePositive
Final Actual (Negative)Revenues:Intergovernmental $104,869 $104,869 $0Charges for Services 41,163 41,163 0Miscellaneous 3,155 3,155 0
Total Revenues 149,187 149,187 0
Expenditures:Current: Support Services: Central Salaries 108,024 103,724 4,300 Fringe Benefits 36,302 34,647 1,655 Purchased Services 9,835 8,117 1,718 Materials and Supplies 4,068 3,691 377 Capital Outlay 24,691 24,691 0
Total Expenditures 182,920 174,870 8,050
Net Change in Fund Balance (33,733) (25,683) 8,050
Fund Balance at Beginning of Year 48,903 48,903 0
Prior Year Encumbrances Appropriated 791 791 0
Fund Balance at End of Year $15,961 $24,011 $8,050
Budgeted Amount
82

Pike County Joint Vocational School DistrictSchedule of Revenues, Expenditures and Changes
in Fund Balance - Budget and Actual (Budget Basis)Career Development Fund
For the Fiscal Year Ended June 30, 2017
VariancePositive
Final Actual (Negative)
Revenues:Intergovernmental $4,196 $4,196 $0
Expenditures:Current: Instruction: Vocational Salaries and Wages 3,650 3,650 0 Fringe Benefits 546 546 0
Total Expenditures 4,196 4,196 0
Excess of Revenues Over Expenditures 0 0 0
Fund Balance at Beginning of Year 0 0 0
Fund Balance at End of Year $0 $0 $0
Budgeted Amount
83

VariancePositive
Final Actual (Negative)Revenues:Intergovernmental $1,800 $1,800 $0
Expenditures:Current: Instruction: Vocational Materials and Supplies 1,800 1,800 0 Capital Outlay 1,800 1,800 0
Total Expenditures 3,600 3,600 0
Net Change in Fund Balance (1,800) (1,800) 0
Fund Balance at Beginning of Year 9,679 9,679 0
Prior Year Encumbrances 1,121 1,121 0
Fund Balance at End of Year $9,000 $9,000 $0
Budgeted Amount
Pike County Joint Vocational School DistrictSchedule of Revenues, Expenditures and Changes
in Fund Balance - Budget and Actual (Budget Basis)ONENet Ohio Fund
For the Fiscal Year Ended June 30, 2017
84

Pike County Joint Vocational School DistrictSchedule of Revenues, Expenditures and Changes
in Fund Balance - Budget and Actual (Budget Basis)Adult Basic Literacy Education Fund
For the Fiscal Year Ended June 30, 2017
VariancePositive
Final Actual (Negative)Revenues:Intergovernmental $165,237 $165,237 $0Miscellaneous 70 70 0
Total Revenues 165,307 165,307 0
Expenditures:Current: Instruction: Adult/Continuing Salaries 87,181 87,181 0 Fringe Benefits 12,972 12,972 0 Purchased Services 4,195 4,195 0 Materials and Supplies 2,395 2,395 0
Total Instruction 106,743 106,743 0
Support Services: Instructional Staff Salaries 20,000 20,000 0 Purchased Services 2,559 2,559 0
Total Instructional Staff 22,559 22,559 0
Administration Salaries 20,000 20,000 0 Fringe Benefits 10,000 10,000 0 Purchased Services 1,507 1,507 0
Total Administration 31,507 31,507 0
Total Support Services 54,066 54,066 0
Total Expenditures 160,809 160,809 0
Excess of Revenues Over Expenditures 4,498 4,498 0
Other Financing Sources (Uses):Advances In 5,251 5,251 0Advances Out (9,749) (9,749) 0
Total Other Financing Sources (Uses) (4,498) (4,498) 0
Net Change in Fund Balance 0 0 0
Fund Balance at Beginning of Year 31 31 0
Fund Balance at End of Year $31 $31 $0
Budgeted Amount
85

Pike County Joint Vocational School DistrictSchedule of Revenues, Expenditures and Changes
in Fund Balance - Budget and Actual (Budget Basis)Vocational Education Fund
For the Fiscal Year Ended June 30, 2017
VariancePositive
Final Actual (Negative)Revenues:Intergovernmental $116,345 $116,345 $0
Expenditures:Current: Instruction: Vocational Salaries 41,500 41,500 0 Fringe Benefits 18,006 18,006 0
Total Instruction 59,506 59,506 0
Support Services: Instructional Staff Salaries 47,491 47,491 0
Total Expenditures 106,997 106,997 0
Excess of Revenues Over Expenditures 9,348 9,348 0
Other Financing Sources (Uses):Advances In 112 112 0Advances Out (9,460) (9,460) 0
Total Other Financing Sources (Uses) (9,348) (9,348) 0
Net Change in Fund Balance 0 0 0
Fund Balance at Beginning of Year 0 0 0
Fund Balance at End of Year $0 $0 $0
Budgeted Amount
86

Pike County Joint Vocational School DistrictSchedule of Revenues, Expenditures and Changes
in Fund Balance - Budget and Actual (Budget Basis)Improving Teacher Quality Fund
For the Fiscal Year Ended June 30, 2017
VariancePositive
Final Actual (Negative)Revenues:Intergovernmental $475 $475 $0
Expenditures:Current: Instruction: Vocational Materials and Supplies 1,060 1,060 0
Excess of Revenues Under Expenditures (585) (585) 0
Other Financing Sources:Advances In 585 585 0
Net Change in Fund Balance 0 0 0
Fund Balance at Beginning of Year 0 0 0
Fund Balance at End of Year $0 $0 $0
Budgeted Amount
87

Pike County Joint Vocational School DistrictSchedule of Revenues, Expenditures and Changes
in Fund Balance - Budget and Actual (Budget Basis)Miscellaneous Federal Grants Fund
For the Fiscal Year Ended June 30, 2017
VariancePositive
Final Actual (Negative)Revenues:Intergovernmental $8,493 $8,493 $0
Expenditures:Current: Instruction: Vocational Materials and Supplies 4,088 4,088 0 Capital Outlay 4,405 4,405 0
Total Expenditures 8,493 8,493 0
Net Change in Fund Balance 0 0 0
Fund Balance at Beginning of Year 11,005 11,005 0
Fund Balance at End of Year $11,005 $11,005 $0
Budgeted Amount
88

Patient CareTechnician 11
Welding 12
Public Safety 11

This Page Intentionally Left Blank

89
STATISTICAL TABLES
This part of Pike County Joint Vocational School District’s comprehensive annual financial report presents detailed information as a context for understanding what the information in the financial statements, note disclosures, and required supplementary information says about the School District’s overall financial health.
CONTENTS PAGES
Financial Trends 90-101
These schedules contain trend information to help the reader understand how the School District’s financial performance and well-being have changed over time.
Revenue Capacity 102-109
These schedules contain information to help the reader assess the School District’s most significant local revenue sources.
Debt Capacity 110-115
These schedules present information to help the reader assess the affordability of the School District’s current levels of outstanding debt and the School District’s ability to issue additional debt in the future.
Demographic and Economic Information 116-119
These schedules offer demographic and economic indicators to help the reader understand the environment within which the School District’s financial activities take place.
Operating information 120-131
These schedules contain service and capital assets data to help the readerunderstand how the information in the School District’s financial report relates to the services the School District provides and the activities it performs.
Unless otherwise noted, the information in these schedules is derived from the comprehensive annual financial reports for the relevant year.

90
Fiscal Year 2008 2009 2010 2011
Net Investment in Capital Assets $14,774,623 $15,583,851 $15,432,779 $15,037,465Restricted 1,718,921 824,764 891,802 1,156,076Unrestricted 5,209,857 4,182,594 3,648,678 2,903,338
Total Net Position $21,703,401 $20,591,209 $19,973,259 $19,096,879
Note: The School District implemented GASB 68 in fiscal year 2015.
(accrual basis of accounting)
Pike County Joint Vocational School DistrictNet Position by Component
Governmental ActivitiesLast Ten Fiscal Years

91
2012 2013 2014 2015 2016 2017
$14,822,821 $14,419,935 $14,113,447 $13,704,407 $13,275,328 $12,896,7961,112,749 1,027,683 1,064,593 1,138,756 1,123,105 1,106,9733,319,542 3,465,253 (5,065,459) (4,477,899) (4,389,585) (4,836,185)
$19,255,112 $18,912,871 $10,112,581 $10,365,264 $10,008,848 $9,167,584

92
Fiscal Year 2008 2009 2010 2011
Expenses:Current: Instruction: Regular $59,318 $29,434 $882 $0 Special 142,885 117,367 127,944 152,056 Vocational 3,731,108 4,854,086 4,384,954 4,705,143 Adult/Continuing 464,850 491,337 437,898 597,407 Student Intervention Services 0 0 0 0 Support Services: Pupils 437,055 377,863 443,531 417,099 Instructional Staff 262,748 238,938 353,702 381,077 Board of Education 155,411 85,962 77,634 107,428 Administration 521,458 534,989 532,861 607,940 Fiscal 390,027 376,961 367,795 393,109 Operation and Maintenance of Plant 806,465 1,309,787 775,179 774,317 Pupil Transportation 80,687 43,335 25,682 24,820 Central 219,481 238,054 234,994 230,249 Operation of Non-Instructional Services 213,136 332,466 425,277 363,771 Extracurricular Activities 3,421 2,708 1,692 2,631 Interest and Fiscal Charges 194,065 188,205 181,880 175,588
Total Expenses 7,682,115 9,221,492 8,371,905 8,932,635
Program Revenues:Charges for Services: Instruction: Vocational 139,909 107,808 138,399 145,664 Adult/Continuing 194,811 195,087 235,955 451,418 Support Services: Instructional Staff 1,143 3,016 32,162 52,554 Administration 47,225 47,104 44,526 63,414 Fiscal 0 0 0 12,720 Operation and Maintenance of Plant 5,625 53,975 30,600 7,634 Central 53,125 46,555 54,835 73,826 Operation of Non-Instructional Services 58,914 75,349 60,665 70,079Operating Grants, Contributions, and Interest 1,035,276 1,242,568 1,240,072 1,084,235Capital Grants and Contributions 0 0 12,000 0
Total Program Revenues 1,536,028 1,771,462 1,849,214 1,961,544
Net Expense ($6,146,087) ($7,450,030) ($6,522,691) ($6,971,091)
Pike County Joint Vocational School DistrictChanges in Net PositionGovernmental Activities
Last Ten Fiscal Years(accrual basis of accounting)

93
2012 2013 2014 2015 2016 2017
$0 $0 $0 $0 $0 $0137,308 $145,513 167,570 146,947 152,761 292,797
3,802,014 3,791,382 3,801,250 3,730,121 3,941,144 4,258,462562,623 616,241 608,763 551,983 269,947 245,537
0 0 0 87,804 70,567 99,944
317,289 335,091 297,239 307,629 320,863 389,157436,279 469,054 206,984 230,011 138,526 106,11683,071 89,278 102,632 82,225 117,179 98,961
478,430 512,983 521,370 504,700 666,560 678,868402,530 399,685 421,828 445,260 441,900 460,061663,487 586,844 569,151 701,538 719,646 695,58521,670 23,085 13,125 12,250 11,731 15,149
226,912 247,882 369,452 342,382 411,468 396,249288,164 341,455 302,788 352,416 291,443 285,738
2,795 1,200 700 600 0 0175,983 168,467 172,436 154,222 148,238 143,517
7,598,555 7,728,160 7,555,288 7,650,088 7,701,973 8,166,141
153,307 119,160 221,339 152,772 51,339 36,636406,451 365,369 417,730 198,995 28,308 42,904
59,629 58,191 54,181 27,864 14,675 15,61670,556 49,899 72,959 39,224 24,522 34,1706,076 5,205 6,083 3,261 0 0
15,550 28,760 28,545 30,360 15,109 25,28596,600 113,613 135,733 170,661 146,850 177,21673,159 32,630 29,820 27,146 29,351 30,144
1,140,062 1,149,373 1,515,022 1,457,674 1,576,446 1,630,6890 0 0 0 0 0
2,021,390 1,922,200 2,481,412 2,107,957 1,886,600 1,992,660
($5,577,165) ($5,805,960) ($5,073,876) ($5,542,131) ($5,815,373) ($6,173,481)(continued)

94
Fiscal Year 2008 2009 2010 2011
General Revenues and Other Changes in Net Position:Property Taxes Levied for: General Purposes $988,759 $973,485 $857,843 $882,066 Debt Service 297,022 285,239 172,045 114,420 Capital Outlay 0 0 99,960 163,089Payments in Lieu of Taxes 504 643 516 438Grants and Entitlements not Restricted to Specific Programs: Operating 4,179,109 4,487,422 4,554,255 4,654,926 Capital 0 414,409 0 0Investment Earnings 410,369 107,269 16,478 11,631Contributions and Donations 4,706 4,706 4,706 4,706Miscellaneous 144,018 64,665 198,938 263,435
Total General Revenues and Other Changes in Net Position 6,024,487 6,337,838 5,904,741 6,094,711
Change in Net Position ($121,600) ($1,112,192) ($617,950) ($876,380)
Note: The School District implemented GASB 68 in fiscal year 2015.
(continued)
Pike County Joint Vocational School DistrictChanges in Net PositionGovernmental Activities
Last Ten Fiscal Years(accrual basis of accounting)

95
2012 2013 2014 2015 2016 2017
$866,916 $822,223 $1,136,507 $1,276,330 $1,247,841 $1,316,5210 0 0 0 0 0
351,659 253,527 254,247 280,669 256,764 275,728496 226 433 33,668 437 789
4,408,085 4,278,475 3,849,541 4,001,297 3,837,411 3,680,9900 0 0 0 0 0
17,393 (5,608) 27,687 29,766 83,239 19,5504,706 5,155 4,706 4,706 4,706 4,706
86,143 40,253 54,780 168,378 28,559 33,933
5,735,398 5,394,251 5,327,901 5,794,814 5,458,957 5,332,217
$158,233 ($411,709) $254,025 $252,683 ($356,416) ($841,264)

96
Fiscal Year 2008 2009 2010 2011
Function / Program:Current: Instruction: Special $262,147 $377,697 $380,530 $383,384 Vocational 278,039 331,111 279,073 188,427 Adult/Continuing 413,890 413,027 362,423 581,366 Support Services: Instructional Staff 141,630 140,710 211,681 263,164 Administration 83,331 81,429 76,519 94,237 Fiscal 5,520 5,498 0 13,132 Operation and Maintenance of Plant 5,625 53,975 30,600 7,634 Central 156,953 151,421 159,701 178,692 Operation of Non-Instructional Services 188,893 216,594 348,687 251,508
Total Program Revenues $1,536,028 $1,771,462 $1,849,214 $1,961,544
Pike County Joint Vocational School DistrictProgram Revenues by Function / Program
Governmental ActivitiesLast Ten Fiscal Years
(accrual basis of accounting)

97
2012 2013 2014 2015 2016 2017
$383,384 $383,384 $829,653 $737,633 $703,400 $749,546244,367 188,412 286,817 206,001 115,060 166,651542,978 561,250 593,385 418,350 244,692 206,424
262,411 248,077 188,768 154,600 166,226 163,83495,201 77,016 96,965 73,009 102,814 115,354
6,231 5,395 6,302 4,190 69,468 40,83915,550 28,760 28,545 30,360 15,109 25,285
201,466 218,479 240,599 275,527 251,719 282,085269,802 211,427 210,378 208,287 218,112 242,642
$2,021,390 $1,922,200 $2,481,412 $2,107,957 $1,886,600 $1,992,660

98
Fiscal Year 2008 2009 2010 2011
General FundNonspendable $0 $0 $3,964 $4,036Assigned 0 0 9,797 50,870Unassigned 0 0 4,358,214 3,124,500Reserved 125,813 140,647 0 0Unreserved 5,193,768 4,684,883 0 0
Total General Fund 5,319,581 4,825,530 4,371,975 3,179,406
All Nonmajor Governmental FundsNonspendable 0 0 406 871Restricted 0 0 805,665 1,090,367Unassigned (Deficit) 0 0 (440,072) (31,832)Reserved 601,384 30,847 0 0Unreserved (Deficit), Reported in:
Special Revenue Funds 371,313 359,173 0 0Debt Service Fund 200,735 212,857 0 0Capital Projects Funds 1,167,924 (239,680) 0 0
Total All Nonmajor Governmental Funds 2,341,356 363,197 365,999 1,059,406
Total Governmental Funds $7,660,937 $5,188,727 $4,737,974 $4,238,812
Note: The School District implemented GASB 54 in fiscal year 2011.
Pike County Joint Vocational School DistrictFund Balances - Governmental Funds
Last Ten Fiscal Years(modified accrual basis of accounting)

99
2012 2013 2014 2015 2016 2017
$1,701 $66,065 $1,853 $1,392 $5,774 $10,5706,552 62,838 10,818 272,378 603,470 688,809
3,535,809 3,583,842 4,127,261 4,312,046 4,029,529 3,759,6530 0 0 0 0 00 0 0 0 0 0
3,544,062 3,712,745 4,139,932 4,585,816 4,638,773 4,459,032
444 544 215 973 770 1,2981,082,741 1,001,412 1,065,235 1,115,750 1,105,415 1,102,112
(19,503) (60,732) (5,103) (19,538) (10,639) (270)0 0 0 0 0 0
0 0 0 0 0 00 0 0 0 0 00 0 0 0 0 0
1,063,682 941,224 1,060,347 1,097,185 1,095,546 1,103,140
$4,607,744 $4,653,969 $5,200,279 $5,683,001 $5,734,319 $5,562,172

100
Fiscal Year 2008 2009 2010 2011
Revenues:Property Taxes $1,265,016 $1,243,673 $1,115,078 $1,141,692Payments in Lieu of Taxes 504 643 516 438Intergovernmental 10,997,893 6,317,328 5,804,561 5,782,112Investment Earnings 456,599 145,111 22,204 11,636Tuition and Fees 380,675 332,487 434,233 702,699Rentals 5,625 53,975 30,600 7,634Charges for Services 114,819 142,649 136,437 177,536Contributions and Donations 4,706 4,706 4,706 4,706Miscellaneous 144,018 64,665 198,938 263,435
Total Revenues 13,369,855 8,305,237 7,747,273 8,091,888
Expenditures:Current: Instruction: Regular 56,305 29,380 0 0 Special 76,865 79,357 84,816 90,059 Vocational 3,477,156 4,220,129 4,128,332 4,305,744 Adult/Continuing 439,480 465,415 432,828 560,378 Student Intervention Services 0 0 0 0 Support Services: Pupils 390,033 345,995 421,786 401,188 Instructional Staff 240,118 237,999 331,201 360,644 Board of Education 155,411 85,962 77,634 107,428 Administration 489,319 525,855 513,156 599,713 Fiscal 356,065 351,235 352,680 362,718 Operation and Maintenance of Plant 1,059,391 873,033 735,360 731,544 Pupil Transportation 69,044 31,792 14,139 13,277 Central 183,483 210,164 208,271 190,714 Operation of Non-Instructional Services 198,964 295,429 401,158 326,651 Extracurricular Activities 3,421 2,708 1,692 2,631Capital Outlay 11,280,056 2,705,756 178,172 221,892Debt Service: Principal Retirement 123,107 128,915 134,797 140,753 Interest and Fiscal Charges 194,179 188,323 182,004 175,716
Total Expenditures 18,792,397 10,777,447 8,198,026 8,591,050
Excess of Revenues Over (Under) Expenditures (5,422,542) (2,472,210) (450,753) (499,162)
Other Financing Sources (Uses):Inception of Capital Lease 0 0 0 0Proceeds from Sale of Capital Assets 0 0 0 0Transfers In 238,471 407,416 306,047 552,337Transfers Out (238,471) (407,416) (306,047) (552,337)
Total Other Financing Sources (Uses) 0 0 0 0
Net Change in Fund Balances ($5,422,542) ($2,472,210) ($450,753) ($499,162)
Debt Service as a Percentage of Noncapital Expenditures 4.3% 3.9% 4.1% 3.8%
Pike County Joint Vocational School DistrictChanges in Fund Balances - Governmental Funds
Last Ten Fiscal Years(modified accrual basis of accounting)

101
2012 2013 2014 2015 2016 2017
$1,212,639 $1,067,769 $1,390,508 $1,545,183 $1,501,867 $1,572,431496 226 433 33,668 437 789
5,548,147 5,470,537 5,373,197 5,453,250 5,405,376 5,324,01517,131 (6,004) 27,542 27,452 83,556 20,658
664,914 578,616 753,324 395,390 92,355 108,90915,550 28,760 28,545 30,360 15,109 25,285
200,864 165,451 184,521 224,533 202,690 227,7774,706 5,155 4,706 4,706 4,706 4,706
86,143 40,253 54,780 168,378 28,559 33,933
7,750,590 7,350,763 7,817,556 7,882,920 7,334,655 7,318,503
0 0 0 0 0 094,266 92,026 118,356 107,886 102,077 210,649
3,546,732 3,423,491 3,649,564 3,503,186 3,680,405 3,801,766535,172 598,291 577,525 529,600 250,609 229,366
0 0 0 87,025 51,610 115,964
322,980 297,982 282,840 320,347 314,682 310,833400,448 472,761 203,439 190,519 116,359 97,501
83,071 89,278 102,632 82,225 117,179 98,961466,603 470,596 491,540 519,787 606,061 614,975378,132 376,757 399,778 417,649 417,666 425,173625,582 584,596 571,762 734,988 677,705 651,100
10,127 15,502 9,502 8,627 8,108 11,526201,323 214,845 332,344 313,008 386,394 396,379268,512 303,126 265,586 316,173 255,365 242,540
2,795 1,200 700 600 0 0122,022 40,579 300 4,750 56,181 8,798
147,789 154,890 105,000 110,000 126,627 131,091176,104 168,618 160,378 154,687 148,724 144,028
7,381,658 7,304,538 7,271,246 7,401,057 7,315,752 7,490,650
368,932 46,225 546,310 481,863 18,903 (172,147)
0 0 0 0 32,415 00 0 0 859 0 0
40,037 0 62,286 114,057 12,658 0(40,037) 0 (62,286) (114,057) (12,658) 0
0 0 0 859 32,415 0
$368,932 $46,225 $546,310 $482,722 $51,318 ($172,147)
4.6% 4.5% 3.7% 3.7% 3.9% 3.8%

102
Pike County Joint Vocational School DistrictAssessed Valuation and Estimated Actual Value of Taxable Property
Last Ten Collection (Calendar) Years
Real Property Tangible Personal Property
Collection Residential/ Commercial/ Total Estimated Assessed EstimatedYear Agricultural Industrial/PU Real Property Actual Value Value Actual Value
2008 $258,457,370 $44,711,880 $303,169,250 $866,197,857 $32,642,490 $130,569,960
2009 273,169,640 46,861,320 320,030,960 914,374,171 32,211,560 128,846,240
2010 275,535,710 45,824,400 321,360,110 918,171,743 34,793,000 139,172,000
2011 279,936,060 46,954,050 326,890,110 933,971,743 37,560,690 150,242,760
2012 309,543,600 46,748,650 356,292,250 1,017,977,857 43,670,850 174,683,400
2013 308,506,020 39,406,960 347,912,980 994,037,086 44,140,790 176,563,160
2014 308,533,530 40,181,670 348,715,200 996,329,143 71,579,980 286,319,920
2015 325,424,830 39,815,790 365,240,620 1,043,544,629 72,904,980 291,619,920
2016 341,767,691 41,809,965 383,577,656 1,095,936,160 77,402,380 309,609,520
2017 344,225,960 42,110,695 386,336,655 1,103,819,014 78,608,760 314,435,040
Real property is reappraised every six years with a State mandated update of the current market value in the third year following each reappraisal.
The assessed value of real property (including public utility real property) is 35 percent of estimated true value. The assessed value of public utility personal property ranges from 25 percent of true value for railroad property to 88 percent for electric transmission and distribution property. General business tangible personal property tax has been phased out, and during the pase out period, all general business tangible personal property was assessed at 6.25 percent for 2008 and zero for 2009. Beginning in 2007, House Bill 66 switched telephone companies from being public utilities to general business taxpayers and began a four year phase out of the tangible personal property tax on local and inter-exchange telephone companies, at 5 percent for 2010. No tangible personal property taxes were levied or collected in 2009 from general business taxpayers, (except telephone companies whose last year to pay tangible personal property tax was 2010.)
The tangible personal property values associated with each year are the values that, when multiplied by the applicable rates, generated the property tax revenue billed in that year. For real property, the amounts generated by multiplying the assessed values by the applicable rates would be reduced by the 10 and 2 1/2 percent rollback, and homestead exemption before being billed.
Source: Ohio Department of Taxation
Public UtilityAssessed Value

103
Tangible Personal PropertyWeightedAverageTax Rate
Assessed Estimated Assessed Estimated (per $1,000 ofValue Actual Value Value Actual Value Ratio assessed value)
$12,618,150 $201,890,400 $348,429,890 $1,198,658,217 29.07% $3.56
1,379,740 13,797,400 353,622,260 1,057,017,811 33.45 3.36
707,170 14,143,400 356,860,280 1,071,487,143 33.31 3.42
0 0 364,450,800 1,084,214,503 33.61 3.44
0 0 399,963,100 1,192,661,257 33.54 3.40
0 0 392,053,770 1,170,600,246 33.49 3.46
0 0 420,295,180 1,282,649,063 32.77 3.74
0 0 438,145,600 1,335,164,549 32.82 3.68
0 0 460,980,036 1,405,545,680 32.80 3.66
0 0 464,945,415 1,418,254,054 32.78 3.67
TotalGeneral Business

104
PercentageTotal of Total
Assessed AssessedTaxpayer Valuation Rank Valuation
Ohio Power Co. $37,531,957 1 8.57%
Bristol Village Home 31,842,085 2 7.27
AEP Ohio Transmission Co. 26,092,168 3 5.96
Scioto Land Company, LLC 7,030,114 4 1.60
Ewing, Nathaniel G 4,922,342 5 1.12
Echo Environmental 4,849,628 6 1.11
HCF Realty of Pleasant Hill Inc. 4,517,657 7 1.03
Walmart Stores Inc. 4,173,942 8 0.95
Hopewell Waverly LLC 4,008,856 9 0.91
LRM Limited an Ohio LTD 3,876,485 10 0.88
Masco Retial Cabinet Group (formerly Mills Pride) - -
Columbus Southern Power - -
Pike Metropolitan Housing - -
Skid Montgomery - -
Ohio Valley Electric Coroporation - -
Total Real and Personal Property 128,845,234 29.40
All Others 309,300,366 70.60
Total Assessed Valuation $438,145,600 100.00%
Source: Pike County Auditor(1) 2015 is the latest information available, The Pike County Auditor could not provide updated information.
2015(1)
Pike County Joint Vocational School DistrictPrincipal Real and Personal Property Taxpayers
Fiscal Years 2015 and 2008

105
PercentageTotal of Total
Assessed AssessedValuation Rank Valuation
$7,584,557 5 2.18%
32,607,856 1 9.36
- -
2,963,999 10 0.85
- -
- -
4,084,943 7 1.17
4,343,496 6 1.25
- -
- -
29,061,080 2 8.34
15,476,084 3 4.44
14,243,314 4 4.09
3,059,685 8 0.88
2,979,951 9 0.86
116,404,965 33.42
232,024,925 66.58
$348,429,890 100.00%
2008

106
2008 2009 2010 2011
VOTED MILLAGE - BY LEVY:1976 Current Expense Residential/Agricultural Real $0.40 $0.40 $0.40 $0.40 Commercial/Industrial and Public Utility Real 0.53 0.53 0.58 0.58 General Business and Public Utility Personal 1.50 1.50 1.50 1.50
1977 Current Expense Residential/Agricultural Real 0.27 0.27 0.27 0.27 Commercial/Industrial and Public Utility Real 0.36 0.36 0.39 0.39 General Business and Public Utility Personal 1.00 1.00 1.00 1.00
1980 Current Expense Residential/Agricultural Real 1.34 1.33 1.33 1.33 Commercial/Industrial and Public Utility Real 1.86 1.86 2.03 2.03 General Business and Public Utility Personal 4.00 4.00 4.00 4.00
2005 Permanent Improvement Residential/Agricultural Real 0.84 0.80 0.80 0.80 Commercial/Industrial and Public Utility Real 0.94 0.94 1.00 1.00 General Business and Public Utility Personal 1.00 1.00 1.00 1.00
TOTAL VOTED MILLAGE BY TYPE OF PROPERTY Residential/Agricultural Real 2.85 2.80 2.80 2.80 Commercial/Industrial and Public Utility Real 3.69 3.69 4.00 4.00 General Business and Public Utility Personal 7.50 7.50 7.50 7.50
WEIGHTED AVERAGE 3.56 3.36 3.42 3.44
OVERLAPPING RATES BY TAXING DISTRICTTOWNSHIPS: Residential/Agricultural Real 0.14 - 1.64 0.14 - 1.57 0.14 - 2.39 0.14 - 3.00 Commercial/Industrial and Public Utility Real 0.14 - 1.88 0.14 - 1.88 0.14 - 2.94 0.14 - 3.00 General Business and Public Utility Personal 0.25 - 3.00 0.40 - 3.00 0.25 - 3.00 0.40 - 3.00
CORPORATIONS: 5 Residential/Agricultural Real 0.25 - 3.26 0.25 - 3.24 0.25 - 3.24 0.25 - 3.24 Commercial/Industrial and Public Utility Real 0.25 - 3.69 0.25 - 3.69 0.25 - 3.72 0.25 - 3.73 General Business and Public Utility Personal 0.25 - 4.00 0.25 - 4.00 0.25 - 4.00 0.25 - 4.00
SCHOOL DISTRICTS: Residential/Agricultural Real 0.36 - 16.00 0.01 - 16.00 0.01 - 16.00 0.34 - 16.00 Commercial/Industrial and Public Utility Real 0.42 - 16.00 0.01 - 16.00 0.01 - 16.00 0.42 - 16.00 General Business and Public Utility Personal 0.50 - 16.00 0.01 - 16.00 0.01 - 16.00 0.50 - 16.00
COUNTY AND OTHER UNITS: PIKE COUNTY
Residential/Agricultural Real 0.21 - 4.90 0.20 - 4.90 0.20 - 4.90 0.20 - 4.90 Commercial/Industrial and Public Utility Real 0.29 - 4.90 0.29 - 4.90 0.31 - 4.90 0.31 - 4.90 General Business and Public Utility Personal 0.50 - 4.90 0.50 - 4.90 0.50 - 4.90 0.50 - 4.90
PAINT VALLEY MENTAL HEALTH DISTRICT Residential/Agricultural Real 0.48 0.47 0.46 0.46 Commercial/Industrial and Public Utility Real 0.57 0.58 0.60 0.60 General Business and Public Utility Personal 1.00 1.00 1.00 1.00
Source: Ohio Department of Taxation
The rates presented for a particular calendar year are the rates that, when applied to the assessed values presented in theAssessed Value Table, generated the property tax revenue for that year.
Rates may only be raised by obtaining the approval of the voters at a public election.
Real property tax rates are reduced so that inflationary increases in value do not generate additional taxes. Real propertyis reappraised every six years and property values are updated in the third year following each reappraisal.
Pike County Joint Vocational School DistrictProperty Tax Rates (Per $1,000 of Assessed Valuation)
Direct and Overlapping GovernmentsLast Ten Collection (Calendar) Years
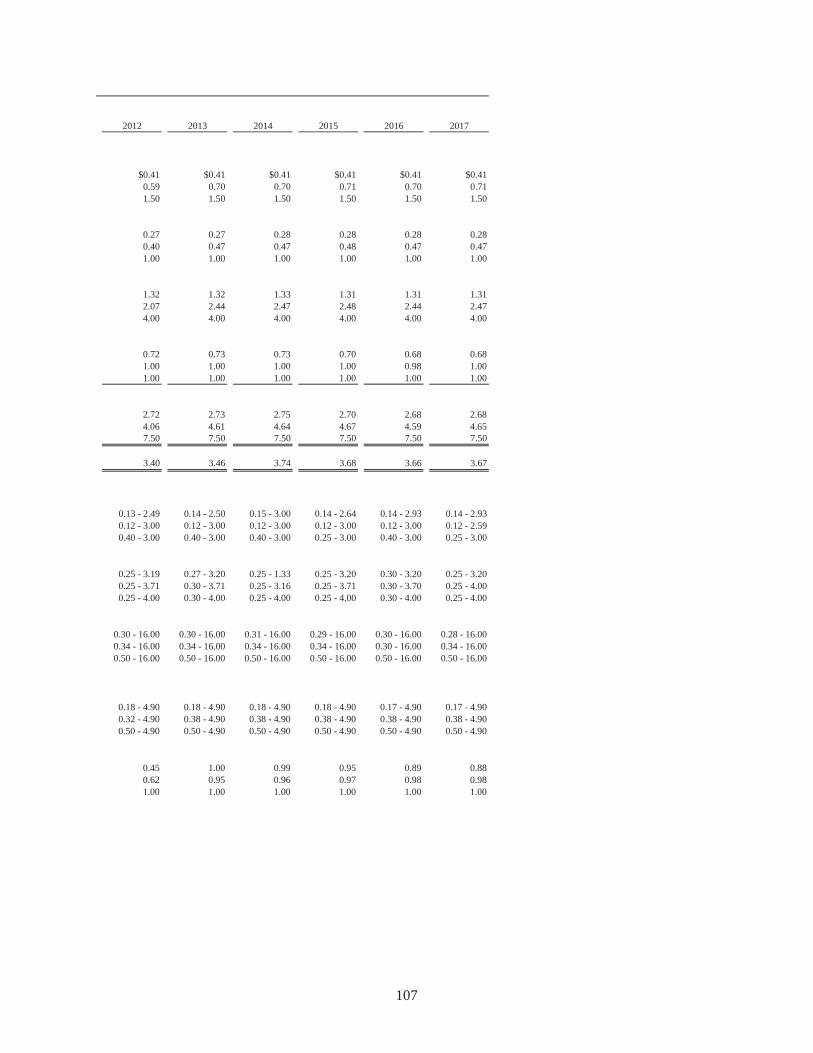
107
2012 2013 2014 2015 2016 2017
$0.41 $0.41 $0.41 $0.41 $0.41 $0.410.59 0.70 0.70 0.71 0.70 0.711.50 1.50 1.50 1.50 1.50 1.50
0.27 0.27 0.28 0.28 0.28 0.280.40 0.47 0.47 0.48 0.47 0.471.00 1.00 1.00 1.00 1.00 1.00
1.32 1.32 1.33 1.31 1.31 1.312.07 2.44 2.47 2.48 2.44 2.474.00 4.00 4.00 4.00 4.00 4.00
0.72 0.73 0.73 0.70 0.68 0.681.00 1.00 1.00 1.00 0.98 1.001.00 1.00 1.00 1.00 1.00 1.00
2.72 2.73 2.75 2.70 2.68 2.684.06 4.61 4.64 4.67 4.59 4.657.50 7.50 7.50 7.50 7.50 7.50
3.40 3.46 3.74 3.68 3.66 3.67
0.13 - 2.49 0.14 - 2.50 0.15 - 3.00 0.14 - 2.64 0.14 - 2.93 0.14 - 2.930.12 - 3.00 0.12 - 3.00 0.12 - 3.00 0.12 - 3.00 0.12 - 3.00 0.12 - 2.590.40 - 3.00 0.40 - 3.00 0.40 - 3.00 0.25 - 3.00 0.40 - 3.00 0.25 - 3.00
0.25 - 3.19 0.27 - 3.20 0.25 - 1.33 0.25 - 3.20 0.30 - 3.20 0.25 - 3.200.25 - 3.71 0.30 - 3.71 0.25 - 3.16 0.25 - 3.71 0.30 - 3.70 0.25 - 4.000.25 - 4.00 0.30 - 4.00 0.25 - 4.00 0.25 - 4.00 0.30 - 4.00 0.25 - 4.00
0.30 - 16.00 0.30 - 16.00 0.31 - 16.00 0.29 - 16.00 0.30 - 16.00 0.28 - 16.000.34 - 16.00 0.34 - 16.00 0.34 - 16.00 0.34 - 16.00 0.30 - 16.00 0.34 - 16.000.50 - 16.00 0.50 - 16.00 0.50 - 16.00 0.50 - 16.00 0.50 - 16.00 0.50 - 16.00
0.18 - 4.90 0.18 - 4.90 0.18 - 4.90 0.18 - 4.90 0.17 - 4.90 0.17 - 4.900.32 - 4.90 0.38 - 4.90 0.38 - 4.90 0.38 - 4.90 0.38 - 4.90 0.38 - 4.900.50 - 4.90 0.50 - 4.90 0.50 - 4.90 0.50 - 4.90 0.50 - 4.90 0.50 - 4.90
0.45 1.00 0.99 0.95 0.89 0.880.62 0.95 0.96 0.97 0.98 0.981.00 1.00 1.00 1.00 1.00 1.00

108
This Page Intentionally Left Blank

109
Pike County Joint Vocational School DistrictProperty Tax Levies and Collections - Real, Public Utility and Tangible Personal Property
Last Ten Collection (Calendar) Years
Percent Total Current Percent Delinquent of Total
Collection Current Taxes Tax of Current Levy Tax Total Tax CollectionsYear (1) Levied (2) Collection (2) Collected Collection (3) Collections To Total Levy
2007 $1,407,528 $1,000,347 71.07% $70,325 $1,070,672 76.07%
2008 1,428,668 922,209 64.55% 70,846 993,055 69.51%
2009 1,405,674 904,153 64.32% 67,767 971,920 69.14%
2010 1,435,032 947,928 66.06% 83,708 1,031,637 71.89%
2011 1,572,851 978,019 62.18% 73,878 1,051,897 66.88%
2012 1,524,971 1,039,221 68.15% 84,049 1,123,270 73.66%
2013 1,541,376 1,040,501 67.50% 104,739 1,145,240 74.30%
2014 1,595,187 1,110,513 69.62% 84,805 1,195,318 74.93%
2015 N/A N/A N/A N/A N/A N/A
2016 1,580,295 1,105,662 69.97% 36,903 1,142,565 72.30%
Source: Pike County Auditor
(1) This the latest information available, The Pike County Auditor could not provide updated information.
(2) Current taxes levied and current tax collections do not include rollback and homestead amounts.
(3) Delinquent tax collections include amounts collected from penalties, interest, and other delinquent collections.Allocations of delinquent collections to prior periods are unavailable.
The levies and collections for all years are estimates based upon the tax rate in effect for each calendar year for thePike County Joint Vocational School. This information was provided by the Pike County Auditor.
Note: The County's current system does not track delinquent tax collections by tax year in total. This presentation will be updated as new information becomes available.

110
Energy TotalFiscal Conservation Capital Outstanding EstimatedYear Loan Leases Debt Actual Value (1)
2008 $254,144 $3,412,000 $3,666,144 $1,198,658,217
2009 207,229 3,330,000 3,537,229 1,057,017,811
2010 158,432 3,244,000 3,402,432 1,071,487,143
2011 107,679 3,154,000 3,261,679 1,084,214,503
2012 54,890 3,059,000 3,113,890 1,192,661,257
2013 0 2,959,000 2,959,000 1,170,600,246
2014 0 2,854,000 2,854,000 1,282,649,063
2015 0 2,744,000 2,744,000 1,335,164,549
2016 0 2,649,788 2,649,788 1,405,545,680
2017 0 2,518,697 2,518,697 1,418,254,054
Source: (1) Pike County Auditor(2) 2000 and 2010 Census Reports(3) Computation of per capita personal income multiplied by population
Pike County Joint Vocational School DistrictRatios of Debt to Estimated Actual Value,
Personal Income and Debt Per CapitaLast Ten Fiscal Years

111
Ratio of Ratio ofPersonal Debt to Estimated Debt to Personal Debt
Population (2) Income (3) Actual Value Income Per Capita
27,695 $445,695,635 0.31% 0.82% $132.38
27,695 445,695,635 0.33% 0.79% 127.72
28,709 499,220,801 0.32% 0.68% 118.51
28,709 499,220,801 0.30% 0.65% 113.61
28,709 499,220,801 0.26% 0.62% 108.46
28,709 499,220,801 0.25% 0.59% 103.07
28,709 499,220,801 0.22% 0.57% 99.41
28,709 499,220,801 0.21% 0.55% 95.58
28,709 499,220,801 0.19% 0.53% 92.30
28,709 499,220,801 0.18% 0.50% 87.73

112
This Page Intentionally Left Blank

113
Pike County Joint Vocational School DistrictComputation of Direct and Overlapping Debt
June 30, 2017
DebtAttributable to Percentage AmountGovernmental Applicable to Applicable to
Jurisdiction Activities District District
Direct:Pike County Joint Vocational School District:
Capital Lease Obligation $2,518,697 100.00% $2,518,697
Overlapping:Pike County:
General Obligation Bonds 1,372,090 100.00 1,372,090Revenue Bonds 2,384,500 100.00 2,384,500Loan Obligations 5,137,028 100.00 5,137,028Capital Lease Obligation 166,350 100.00 166,350
Jackson County:General Obligation Bonds 1,000,000 0.71 7,100Loan Obligation 871,920 0.71 6,191Engineer Department Note 138,568 0.71 984Capital Lease Obligation 10,884 0.71 77
Ross County:General Obligation Bonds 3,276,602 0.52 17,038Sales Tax Refunding Bonds 3,358,802 0.52 17,466Capital Lease Obligation 135,125 0.52 703
Scioto County:General Obligation Bonds 6,623,516 0.97 64,248Capital Lease Obligation 405,812 0.97 3,936
Village of Waverly:Loan Obligations 90,520 100.00 90,520Note Obligations 526,852 100.00 526,852
Scioto Valley Local School District:General Obligation Refunding Bonds 360,000 100.00 360,000Capital Lease Obligation 602,209 100.00 602,209
Waverly City School District:General Obligation Bonds 9,187,489 100.00 9,187,489Capital Lease Obligation 1,791,200 100.00 1,791,200
Eastern Local School District:General Obligation Bonds 365,000 100.00 365,000Energy Conservation Improvement Bonds 237,061 100.00 237,061
Western Local School District:General Obligation Bonds 95,000 100.00 95,000Energy Conservation Bond 500,000 100.00 500,000
Total Overlapping Debt 38,636,528 22,933,042
Total Direct and Overlapping Debt $41,155,225 $25,451,739
Source: Ohio Municipal Advisory Council
Overlapping governments are those that coincide, at least in part, with the geographic boundaries of theSchool District. This schedule estimates the portion of the outstanding debt of those overlapping governments that is borne by the residents and businesses of the School District. This process recognizes that, when considering the School District's ability to issue and repay long-term debt, the entiredebt burden borne by the residents and businesses should be taken into account. However, this does notimply that every taxpayer is a resident, and therefore, responsible for repaying the debt, of eachoverlapping government.
(1) Percentages determined by dividing each overlapping subdivisions' assessed valuation within the School District by the subdivisions' total assessed valuation.

114
2008 2009 2010
Total Assessed Valuation $348,429,890 $353,622,260 $356,860,280 Less Railroad and Telephone Property Valuation (4,680,490) (3,068,070) (961,030) Less General Business Tangible Personal Property Valuation (12,618,150) (1,379,740) (707,170)
Total Assessed Valutaion used to Calculate Legal Debt Margin (1) 331,131,250 349,174,450 355,192,080
Overall debt limitation - 9.0% of assessed valuation (2) 29,801,813 31,425,701 31,967,287
Gross indebtedness authorized by the School District 254,144 207,229 158,432 Less exempt debt: Energy Conservation Loan (254,144) (207,229) (158,432)
Debt within 9.0% limitation 0 0 0
Less amount available in the debt service fund 0 0 0
Net debt within 9.0% limitation 0 0 0
Legal debt margin within 9.0% limitation $29,801,813 $31,425,701 $31,967,287
Legal Debt Margin as a Percentage of the Debt Limit 100.0% 100.0% 100.0%
Energy Conservation Debt limitation 0.9% of assessed valuation (2) $2,980,181 $3,142,570 $3,196,729
Net debt within 0.9% limitation (254,144) (207,229) (158,432)
Energy Conservation Debt Margin $2,726,037 $2,935,341 $3,038,297
Energy Conservation Debt Margin as a Percentage of theEnergy Conservation Debt Limit 91.5% 93.4% 95.0%
Unvoted debt limitation .10% of assessed valuation (2) $331,131 $349,174 $355,192
Gross indebtedness authorized by the School District 254,144 207,229 158,432 Less exempt debt: Energy Conservation Loan (254,144) (207,229) (158,432)
Debt within 9.0% limitation 0 0 0
Less amount available in the debt service fund 0 0 0
Net debt within .10% limitation 0 0 0
Legal debt margin within .10% limitation $331,131 $349,174 $355,192
Unvoted Legal Debt Margin as a Percentage of theUnvoted Debt Limitation 100.0% 100.0% 100.0%
Source: Pike County Auditor and School District Records
(1) The definition of tax valuation for the purpose of calculating the debt margin was modified by H.B. 530, effective 3/30/06, to exclude tangible personal property used in business, telephone or telegraph property, interexchange telecommunications company property, or personal property owned or leased by a railroad company and used in railroad operations.
(2) Ohio Bond Law sets a limit of nine percent for voted debt, .90 percent for Energy Conservation measures, and .10 percent for unvoted debt.
Pike County Joint Vocational School DistrictComputation of Legal Debt Margin
Last Ten Fiscal Years

115
2011 2012 2013 2014 2015 2016 2017
$364,450,800 $399,963,100 $392,053,770 $420,295,180 $438,145,600 $460,980,036 $464,945,4150 0 0 0 0 0 00 0 0 0 0 0 0
364,450,800 399,963,100 392,053,770 420,295,180 438,145,600 460,980,036 464,945,415
32,800,572 35,996,679 35,284,839 37,826,566 39,433,104 41,488,203 41,845,087
107,679 54,890 0 0 0 0 0
(107,679) (54,890) 0 0 0 0 0
0 0 0 0 0 0 0
0 0 0 0 0 0 0
0 0 0 0 0 0 0
$32,800,572 $35,996,679 $35,284,839 $37,826,566 $39,433,104 $41,488,203 $41,845,087
100.0% 100.0% 100.0% 100.0% 100.0% 100.0% 100.0%
$3,280,057 $3,599,668 $3,528,484 $3,782,657 $3,943,310 $4,148,820 $4,184,509
(107,679) (54,890) 0 0 0 0 0
$3,172,378 $3,544,778 $3,528,484 $3,782,657 $3,943,310 $4,148,820 $4,184,509
96.7% 98.5% 100.0% 100.0% 100.0% 100.0% 100.0%
$364,451 $399,963 $392,054 $420,295 $438,146 $460,980 $464,945
107,679 54,890 0 0 0 0 0
(107,679) (54,890) 0 0 0 0 0
0 0 0 0 0 0 0
0 0 0 0 0 0 0
0 0 0 0 0 0 0
$364,451 $399,963 $392,054 $420,295 $438,146 $460,980 $464,945
100.0% 100.0% 100.0% 100.0% 100.0% 100.0% 100.0%
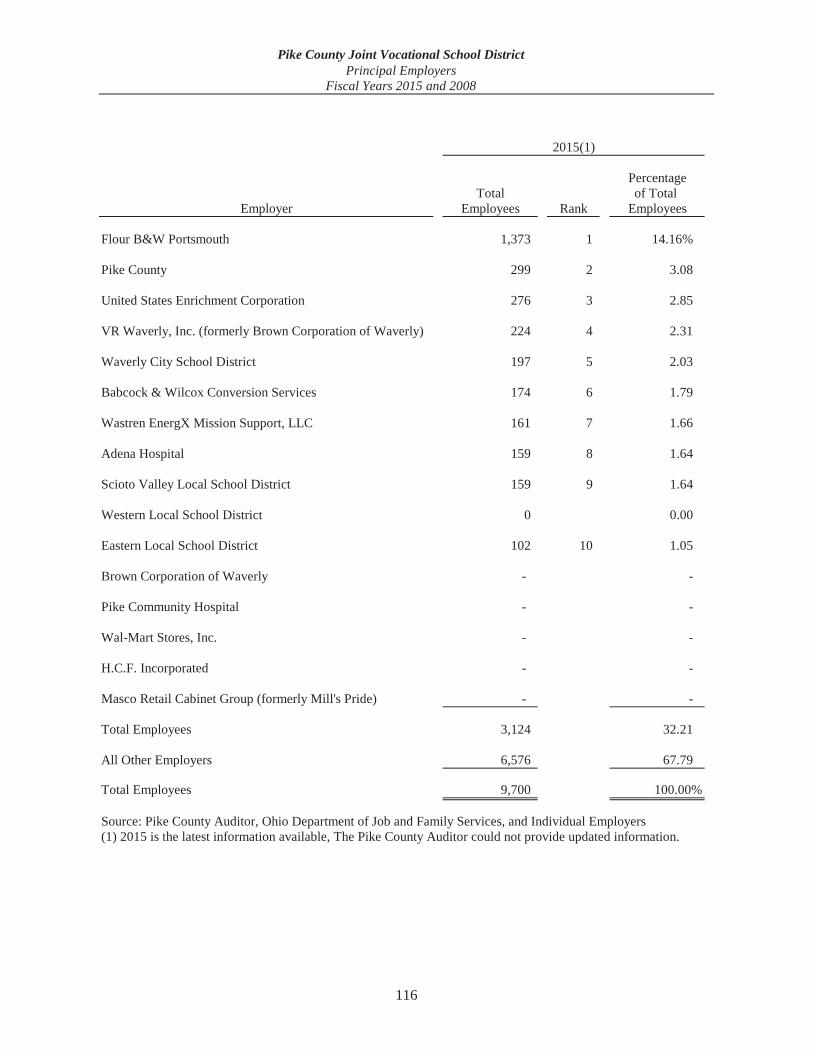
116
PercentageTotal of Total
Employer Employees Rank Employees
Flour B&W Portsmouth 1,373 1 14.16%
Pike County 299 2 3.08
United States Enrichment Corporation 276 3 2.85
VR Waverly, Inc. (formerly Brown Corporation of Waverly) 224 4 2.31
Waverly City School District 197 5 2.03
Babcock & Wilcox Conversion Services 174 6 1.79
Wastren EnergX Mission Support, LLC 161 7 1.66
Adena Hospital 159 8 1.64
Scioto Valley Local School District 159 9 1.64
Western Local School District 0 0.00
Eastern Local School District 102 10 1.05
Brown Corporation of Waverly - -
Pike Community Hospital - -
Wal-Mart Stores, Inc. - -
H.C.F. Incorporated - -
Masco Retail Cabinet Group (formerly Mill's Pride) - -
Total Employees 3,124 32.21
All Other Employers 6,576 67.79
Total Employees 9,700 100.00%
(1) 2015 is the latest information available, The Pike County Auditor could not provide updated information.Source: Pike County Auditor, Ohio Department of Job and Family Services, and Individual Employers
2015(1)
Pike County Joint Vocational School DistrictPrincipal Employers
Fiscal Years 2015 and 2008

117
PercentageTotal of Total
Employees Rank Employees
- -
266 5 2.69%
1,929 1 19.48
0 -
231 7 2.33
0 -
0 -
0 -
181 9 1.83
0 -
102 10 1.03
324 3 3.27
283 4 2.86
250 6 2.53
216 8 2.18
1,545 2 15.61
5,327 53.81
4,573 46.19
9,900 100.00%
2008

118
Pike County Joint Vocational School DistrictDemographic and Economic Statistics
Last Ten Fiscal Years
Total Per Capita MedianPersonal Personal Household Median
Year Population (1) Income (2) Income (1) Income (1) Age (1)
2008 27,695 $445,695,635 $16,093 $31,649 35
2009 27,695 445,695,635 16,093 31,649 35
2010 28,709 499,220,801 17,389 40,363 39
2011 28,709 499,220,801 17,389 40,363 39
2012 28,709 499,220,801 17,389 40,363 39
2013 28,709 499,220,801 17,389 40,363 39
2014 28,709 499,220,801 17,389 40,363 39
2015 28,709 499,220,801 17,389 40,363 39
2016 28,709 499,220,801 17,389 40,363 39
2017 28,709 499,220,801 17,389 40,363 39
Source: (1) 2000 and 2010 Census Reports(2) Computation of per capita personal income multiplied by population(3) School District records
(5) Pike County Auditor
(4) Ohio Department of Job and Family Services and Ohio Labor Market Information

119
Educational Attainment:
Bachelor's Degree School Unemployment Total Assessedor Higher (1) Enrollment (3) Rate (4) Property Value (5)
9.7 425 9.3 $348,429,890
9.7 455 15.2 353,622,260
12.6 435 14.5 356,860,280
12.6 439 15.4 364,450,800
12.6 423 13.0 399,963,100
12.6 406 12.4 392,053,770
12.6 408 7.8 420,295,180
12.6 391 7.1 438,145,600
12.6 388 7.3 460,980,036
12.6 388 7.1 464,945,415

120
2008 2009 2010 2011
Medical Laboratory Technology Square Footage of Program Space 2,622 2,622 2,480 2,567
Maximum Capacity of Program 50 50 50 50Number of Students at End of Year (2) 38 42 45 44Students Who Graduated from Program 19 16 22 23Cost of Program (3) $157,873 $185,910 $184,080 $211,743Percentage of Students to Maximum Capacity of Program 76% 84% 90% 88%Cost of Program Per Student $4,155 $4,426 $4,091 $4,812
Diversified Health Occupations Square Footage of Program Space 3,183 3,183 2,560 3,000
Maximum Capacity of Program 50 50 50 50Number of Students at End of Year (2) 38 45 46 46Students Who Graduated from Program 16 22 21 23Cost of Program (3) $129,675 $138,533 $152,284 $101,037Percentage of Students to Maximum Capacity of Program 76% 90% 92% 92%Cost of Program Per Student $3,413 $3,079 $3,311 $2,196
Information Technology/Business Administration Square Footage of Program Space 1,743 1,743 5,672 5,376
Maximum Capacity of Program 75 75 75 75Number of Students at End of Year (2) 38 55 47 42Students Who Graduated from Program 19 16 35 16Cost of Program (3) $297,296 $394,663 $317,234 $420,340Percentage of Students to Maximum Capacity of Program 51% 73% 63% 56%Cost of Program Per Student $7,824 $7,176 $6,750 $10,008
Air Conditioning, Heating, and Refrigeration Technology Square Footage of Program Space 4,454 4,454 4,505 4,510
Maximum Capacity of Program 50 50 50 50Number of Students at End of Year (2) 15 20 20 30Students Who Graduated from Program 5 14 6 14Cost of Program (3) $158,300 $206,778 $195,064 $220,484Percentage of Students to Maximum Capacity of Program 30% 40% 40% 60%Cost of Program Per Student $10,553 $10,339 $9,753 $7,349
Automobile Technology Square Footage of Program Space 7,942 7,942 8,820 8,672
Maximum Capacity of Program 50 50 50 50Number of Students at End of Year (2) 36 36 22 12Students Who Graduated from Program 16 16 12 5Cost of Program (3) $182,230 $221,372 $205,349 $180,595Percentage of Students to Maximum Capacity of Program 72% 72% 44% 24%Cost of Program Per Student $5,062 $6,149 $9,334 $15,050
Pike County Joint Vocational School DistrictBuilding Statistics (1)Last Ten Fiscal Years
(cash basis of accounting)

121
2012 2013 2014 2015 2016 2017
2,567 2,567 2,567 2,567 2,567 2,56750 50 50 50 50 5034 41 39 22 28 3414 16 22 13 6 10
$209,755 $196,655 $190,863 $199,886 $113,921 $118,70468% 82% 78% 44% 56% 68%
$6,169 $4,796 $4,894 $9,086 $4,069 $3,491
3,000 3,000 3,000 3,000 3,000 3,00050 50 50 50 50 5031 42 39 30 30 2417 18 22 17 6 7
$111,182 $93,283 $96,319 $100,127 $135,952 $99,87162% 84% 78% 60% 60% 48%
$3,587 $2,221 $2,470 $3,338 $4,532 $4,161
5,376 5,376 5,376 5,376 5,376 5,37650 50 75 50 75 7556 66 72 60 65 5625 33 31 29 26 27
$248,537 $239,842 $244,492 $221,298 $298,026 $266,729112% 132% 96% 120% 87% 75%
$4,438 $3,634 $3,396 $3,688 $4,585 $4,763
4,510 4,510 4,510 4,510 4,510 4,51050 50 50 50 50 5025 16 12 15 16 2515 9 6 7 7 5
$151,417 $136,107 $123,414 $125,145 $82,354 $159,28150% 32% 24% 30% 32% 50%
$6,057 $8,507 $10,285 $8,343 $5,147 $6,371
8,672 8,672 8,672 8,672 8,672 8,67250 50 50 50 50 5015 23 20 30 32 275 12 7 9 15 10
$108,364 $126,562 $151,392 $113,915 $120,825 $163,34230% 46% 40% 60% 64% 54%
$7,224 $5,503 $7,570 $3,797 $3,776 $6,050(continued)

122
2008 2009 2010 2011
Carpentry Square Footage of Program Space 6,949 6,949 6,901 6,570
Maximum Capacity of Program 50 50 50 50Number of Students at End of Year (2) 28 26 37 37Students Who Graduated from Program 10 20 13 19Cost of Program (3) $158,300 $203,272 $173,471 $211,903Percentage of Students to Maximum Capacity of Program 56% 52% 74% 74%Cost of Program Per Student $5,654 $7,818 $4,688 $5,727
Electrical Trades Square Footage of Program Space 4,574 4,574 7,587 7,272
Maximum Capacity of Program 50 50 50 50Number of Students at End of Year (2) 37 39 29 22Students Who Graduated from Program 15 20 19 8Cost of Program (3) $170,027 $172,028 $170,659 $170,013Percentage of Students to Maximum Capacity of Program 74% 78% 58% 44%Cost of Program Per Student $4,595 $4,411 $5,885 $7,728
Welding and Cutting Square Footage of Program Space 6,015 6,015 5,996 5,725
Maximum Capacity of Program 50 50 50 50Number of Students at End of Year (2) 38 44 45 39Students Who Graduated from Program 17 20 25 16Cost of Program (3) $149,834 $234,939 $172,285 $222,913Percentage of Students to Maximum Capacity of Program 76% 88% 90% 78%Cost of Program Per Student $3,943 $5,340 $3,829 $5,716
Engineering Technology Square Footage of Program Space 1,942 1,942 4,408 3,960
Maximum Capacity of Program 40 40 50 50Number of Students at End of Year (2) 44 44 47 47Students Who Graduated from Program 20 21 23 23Cost of Program (3) $166,540 $206,030 $189,060 $291,371Percentage of Students to Maximum Capacity of Program 110% 110% 94% 94%Cost of Program Per Student $3,785 $4,683 $4,023 $6,199
Criminal Justice Square Footage of Program Space 6,187 6,187 4,932 6,300
Maximum Capacity of Program 50 50 50 50Number of Students at End of Year (2) 27 40 31 33Students Who Graduated from Program 8 17 17 13Cost of Program (3) $157,888 $170,175 $155,554 $166,391Percentage of Students to Maximum Capacity of Program 54% 80% 62% 66%Cost of Program Per Student $5,848 $4,254 $5,018 $5,042
Pike County Joint Vocational School DistrictBuilding Statistics (1)Last Ten Fiscal Years
(cash basis of accounting)(continued)

123
2012 2013 2014 2015 2016 2017
6,570 6,570 6,570 6,750 6,750 6,75050 50 50 50 50 5023 22 11 12 13 149 14 6 2 6 5
$124,606 $201,507 $162,668 $131,461 $137,104 $129,66446% 44% 22% 24% 26% 28%
$5,418 $9,159 $14,788 $10,955 $10,546 $9,262
7,272 7,272 7,272 7,272 7,272 7,27250 50 50 50 50 5022 23 12 25 26 2011 11 6 10 10 5
$169,205 $111,725 $181,011 $162,550 $128,232 $130,95244% 46% 24% 50% 52% 40%
$7,691 $4,858 $15,084 $6,502 $4,932 $6,548
5,725 5,725 5,725 5,725 5,725 5,72550 50 50 50 50 5035 43 35 33 35 4715 23 18 12 15 19
$173,111 $133,220 $135,196 $156,176 $184,388 $147,41370% 86% 70% 66% 70% 94%
$4,946 $3,098 $3,863 $4,733 $5,268 $3,136
3,960 3,960 3,960 3,960 3,960 3,96050 50 50 50 50 5049 51 44 48 49 4623 26 23 20 24 21
$199,719 $229,767 $225,885 $214,960 $209,648 $196,64398% 102% 88% 96% 98% 92%
$4,076 $4,505 $5,134 $4,478 $4,279 $4,275
6,300 6,300 6,300 6,300 6,300 6,30050 50 50 50 50 5026 25 17 20 21 2722 13 9 6 9 13
$111,749 $83,609 $105,402 $86,592 $95,087 $101,47852% 50% 34% 40% 42% 54%
$4,298 $3,344 $6,200 $4,330 $4,528 $3,758(continued)

124
2008 2009 2010 2011
Building and Property Maintenance Square Footage of Program Space 2,717 2,717 8,079 7,835
Maximum Capacity of Program 36 36 36 36Number of Students at End of Year (2) 11 20 29 29Students Who Graduated from Program 2 7 6 6Cost of Program (3) $228,991 $274,112 $273,972 $295,143Percentage of Students to Maximum Capacity of Program 31% 56% 81% 81%Cost of Program Per Student $20,817 $13,706 $9,447 $10,177
Community Home Service Square Footage of Program Space 7,095 7,095 7,280 9,955
Maximum Capacity of Program 36 36 36 36Number of Students at End of Year (2) 17 21 22 38Students Who Graduated from Program 3 7 10 7Cost of Program (3) $244,598 $364,101 $351,195 $389,290Percentage of Students to Maximum Capacity of Program 47% 58% 61% 106%Cost of Program Per Student $14,388 $17,338 $15,963 $10,244
Agriculture and Environmental Systems Square Footage of Program Space 0 0 0 0
Maximum Capacity of Program 0 0 0 0Number of Students at End of Year (2) 0 0 0 0Students Who Graduated from Program 0 0 0 0Cost of Program (3) $0 $0 $0 $0Percentage of Students to Maximum Capacity of Program 0% 0% 0% 0%Cost of Program Per Student $0 $0 $0 $0
Source: Pike County Joint Vocational School District Records
(1) The Pike County Joint Vocational School District operates one building.
(2) Number of students represents the total number of juniors and seniors in the program for the fiscal year.
(3) The cost of programs represents the actual amount of monies the School District expends on a cash basis to operate each program. The information is obtained from the School District's EMIS reports.
Building Statistics (1)Last Ten Fiscal Years
(cash basis of accounting)(continued)
Pike County Joint Vocational School District

125
2012 2013 2014 2015 2016 2017
7,835 7,835 7,835 7,835 7,835 7,83536 36 36 36 24 2427 36 43 35 40 361 6 10 2 3 3
$304,443 $269,983 $311,529 $304,589 $245,174 $183,16375% 100% 119% 97% 167% 150%
$11,276 $7,500 $7,245 $8,703 $6,129 $5,088
9,955 9,955 9,955 9,955 9,955 9,95536 36 36 36 36 3627 32 43 25 25 451 8 10 2 3 6
$378,044 $364,535 $422,684 $399,654 $448,299 $495,91875% 89% 119% 69% 69% 125%
$14,002 $11,392 $9,830 $15,986 $17,932 $11,020
0 0 0 0 9,955 9,9550 0 0 0 50 500 0 0 0 8 130 0 0 0 2 3
$0 $0 $0 $0 $136,706 $131,6580% 0% 0% 0% 16% 26%$0 $0 $0 $0 $17,088 $10,128

126
2008 2009 2010 2011Governmental Activities
Instruction: Special 7 7 7 7 Vocational 38 41 41 38 Adult/Continuing 2 2 3 4Support Services: Pupils 3 3 3 3 Instructional Staff 2 2 2 2 Administration 2 2 2 3 Fiscal 3 3 3 3 Operation and Maintenance of Plant 3 4 4 4 Central 4 4 4 4Operation of Non-Instructional Services 1 1 1 1
Total Number of Employees 65 69 70 69
Method: Using 1.0 for each full-time employee and 0.50 for part-time and seasonal employee.
Source: Pike County Joint Vocational School District records (Count is taken on June 30th of each fiscal year)
Pike County Joint Vocational School DistrictEmployees by FunctionLast Ten Fiscal Years

127
2012 2013 2014 2015 2016 2017
7 7 7 7 8 1026 26 26 26 27 272 4 4 4 2 2
3 3 3 3 3 33 3 3 3 3 33 3 3 3 3 33 3 3 3 3 33 3 3 3 3 34 4 4 4 4 41 1 1 1 1 1
55 57 57 57 57 59

128
Pike County Joint Vocational School DistrictPer Pupil Cost
Last Ten Fiscal Years
Average Per Pupil/General Government Daily Pupil Teaching Teacher
Year Expenditures (1) Membership Cost Staff Ratio
2008 $18,792,397 425 $44,217 46 9.24
2009 10,777,447 455 23,687 47 9.68
2010 8,198,026 435 18,846 47 9.26
2011 8,591,050 439 19,570 47 9.34
2012 7,381,658 423 17,451 36 11.75
2013 7,304,538 406 17,991 36 11.28
2014 7,271,246 408 17,822 36 11.33
2015 7,401,057 391 18,929 37 10.57
2016 7,315,752 388 18,855 39 9.95
2017 7,490,650 388 19,306 41 9.46
Source: Pike County Joint Vocational School District Records
(1) Statement of Revenues, Expenditures and Changes in Fund Balances - Governmental Funds

129
Pike County Joint Vocational School DistrictTeaching Staff Education and Experience
June 30, 2017
Number Percentof of
Degree Staff Total
Bachelor's Degree 16 39.02%
Bachelor + 5 5 12.20%
Master's Degree 20 48.78%
Total 41 100.00%
Number Percentof of
Years of Experience Staff Total
0-5 11 26.83%
6-10 5 12.20%
11 and over 25 60.97%
Total 41 100.00%
Source: Pike County Joint Vocational School District Records

130
2008 2009 2010 2011
Free Lunches 50.23% 53.91% 58.60% 61.20%
Reduced Lunches 6.81 6.93 8.00 9.56
Total 57.04% 60.84% 66.60% 70.76%
Pike County Joint Vocational School DistrictPercentage of Students who Receive Free and Reduced Lunches
Last Ten Fiscal Years
Source: Food Service Director

131
2012 2013 2014 2015 2016 2017
73.34% 64.28% 64.71% 59.08% 55.60% 56.83%
7.31 5.41 3.93 4.61 8.2 6.83
80.65% 69.69% 68.64% 63.69% 63.80% 63.66%

132
This Page Intentionally Left Blank

88EastBroadStreet,FourthFloor,Columbus,Ohio43215‐3506Phone:614‐466‐4514or800‐282‐0370Fax:614‐466‐4490
www.ohioauditor.gov
PIKE COUNTY JOINT VOCATIONAL SCHOOL DISTRICT
PIKE COUNTY
CLERK’S CERTIFICATION This is a true and correct copy of the report which is required to be filed in the Office of the Auditor of State pursuant to Section 117.26, Revised Code, and which is filed in Columbus, Ohio.
CLERK OF THE BUREAU CERTIFIED DECEMBER 28, 2017