pilbara · the pilbara regional investment blueprint (the blueprint) sets out a bold, aspirational...
TRANSCRIPT

1
PILBARAREGIONAL INVESTMENT
BLUEPRINTS U M M A R Y R E P O R T

2
3 FOREWORD
4 EXECUTIVE SUMMARY
6 BLUEPRINT FRAMEWORK
6 BLUEPRINT DEVELOPMENT
AND STRUCTURE
7 POLICY ALIGNMENT
8 PILBARA VISION
8 PILBARA 2050 VISION
8 ASPIRATIONAL
POPULATION TARGETS
10 REGIONAL OVERVIEW
10 GEOGRAPHY AND HISTORY
12 POPULATION
13 ECONOMY
15 REGIONAL AND GLOBAL INFLUENCES
18 REGIONAL CAPACITY FOR GROWTH
18 CAPITAL
19 SUSTAINABLE COMMUNITIES
20 CONNECTIVITY
21 COMPETITIVENESS
22 COMPARATIVE ADVANTAGES
24 STRATEGIC PRIORITIES
25 REGIONAL PILLARS
25 APPROACH TO GROWTH
& DEVELOPMENT
26 REGIONAL PILLARS
26 PILLAR OBJECTIVES
30 THE FUTURE ROLE OF THE
RESOURCES SECTOR
31 TRANSFORMATIONAL OPPORTUNITIES
31 REALISING THE PILBARA
2050 VISION
31 TRANSFORMATIONAL
OPPORTUNITY SUMMARIES
33 IMPLEMENTATION OVERVIEW
35 REFERENCES
TABLE OF CONTENTS

3
“The future is not some place we are going but one we are creating”
John H Schaar
Innovation and technological change are the greatest drivers of productivity and the greatest sources of inspiration for the Pilbara’s future.
The Pilbara Regional Investment Blueprint is our commitment to view our challenges and changing environment as opportunities to be innovative in our thinking, and resilient as a community.
Haul trucks will be driverless, one in four people will be working from home and energy will be harvested from renewable sources; these are some of the likely scenarios the Pilbara, and the world, will be experiencing in the year 2050.
Considering these scenarios, among a myriad of emerging global trends that will shape the way we live and do business 35 years from now, has been vital in the development of the Blueprint.
The success of the Government of Western Australia’s Pilbara Cities initiative in addressing the land and infrastructure needs of the growing population centres has been critical to revitalising the region. It is also a great example of what is possible if we work together towards a clear, shared vision.
While there is still work to be done, the Blueprint heralds a new direction for the Pilbara and the Commission as we turn our focus firmly towards expanding the
region’s economic base and building a legacy that we are proud to pass on to our children, and grandchildren.
More than three times the size of England and accounting for 36% of the Australia’s exports, the Pilbara boasts a powerhouse combination of location, access to markets, a world-class customer base and unique natural assets that position us for future growth and prosperity. It’s an exciting region on the cusp of new discoveries and opportunities.
Undeniably, the resources sector will remain the foundation of the Pilbara’s economy for decades to come; however, the region boasts numerous other comparative advantages that present exciting opportunities for new industries. These opportunities will take the Pilbara beyond just “business as usual” and will chart our aspirational future.
Through our extensive consultation during the development of this report we have forged new relationships and strengthened existing ones. This is the Pilbara’s plan for the future and the key to its achievement will be our ability to harness the momentum that has been created.
This is a time for the Commission to answer the call for bold leadership and meaningful collaboration, and we are ready to lead the charge. The Blueprint is
our commitment to enable new industries, fast-track development and nurture innovative ideas.
In reading this Blueprint, I encourage you to embrace big-picture thinking towards what could be possible for the Pilbara of tomorrow. Collective strategic action will enable us to seize new opportunities that will achieve prosperous economic outcomes for the region and for Western Australia.
We look forward to working with you to make the Blueprint Vision a reality.
Chris GilmourCHAIRMAN
FOREWORD
This report is a summary of the Regional Investment Blueprint for the Pilbara. It is supported by a Technical Report, which contains extensive data, research, evidence and analysis that forms the basis of the Vision, Pillars and Opportunities identification.

4
The Pilbara is a globally significant mining and energy region boasting a wealth of resource endowments, dynamic communities, rich Aboriginal culture and stunning natural landscapes. The Pilbara of today offers a glimpse of what a prosperous Northern Australia could be in the future with sustained strategic investment.
The Pilbara region, located in northern Western Australia, accounts for 20% of the state’s total land mass. Its 507,896km2 equates to two thirds of the area of New South Wales, is twice the size of Victoria and more than five times bigger than Tasmania. A population of just 67,000 people call the Pilbara home. While the Pilbara’s Aboriginal population make up 12% of the total population, there is a diverse mix of cultures and nationalities.
In the last decade the Pilbara has been the powerhouse of economic growth for Western Australia and the nation. Its proximity to Asia and extensive resource endowments have resulted in the Pilbara being recognised as a region of global significance.
The Pilbara’s share of Australia’s Gross Domestic Product (GDP) has risen from 2% in the late 1990’s and early 2000’s, to 6.2% in 2014. The size of the Pilbara’s economy is approximately 55% of New Zealand’s GDP and greater than the individual GDP of 127 of the world’s 189 nation states1.
The Pilbara produces 95% ($62 billion) of the value Western Australia’s iron ore production. The region also services the north-west shelf oil and gas fields, which produce approximately two thirds of Australia’s oil and gas, worth $27 billion2.
The Pilbara will remain a significant contributor to state and national economies. In March 2015, Western Australia had an estimated $179 billion worth of resource projects under construction or in the committed stage of development. A further $118 billion has been identified as being allocated to, planned, or possible projects in coming years3. The majority of these projects are located in the Pilbara, such as Chevrons’ Gorgon and Wheatstone Liquefied Natural Gas (LNG) projects on Barrow Island and at Onslow respectively, the Roy Hill
Figure 1 Location of the Pilbara
SUMMARYEXECUTIVE
Figure 2 Overview of the Pilbara
POPULATION67,000
LAND MASS507,896km2
6.2% OF AUSTRALIA’S GDP
GREATER THAN GDP OF 127
NATION STATES
STATE ROYALTIES$5.0 billion
PETROLEUM PRODUCTION
$27 billion
IRON ORE PRODUCTION
$7 billion

5
Iron Ore mine and expansions of current operating iron ore mines. The production timeframes for these projects range from years to many decades.
However, the rapid growth and heavy reliance on resource exports resulted in a range of challenging outcomes – the region has a high cost structure, it is highly exposed to commodity price fluctuations, and regional towns do not possess the critical mass to support certain services and industries. Additionally, geographic dispersion, community service availability and income inequality present challenging social issues.
The Government of Western Australia recognises the importance of a prosperous and secure future for the Pilbara, a region that has contributed more than $5 billion to state royalties. It’s landmark $1.7 billion Royalties for Regions Pilbara Cities initiative has contributed significantly to addressing these challenges, with Pilbara townships receiving considerable public and private sector investment in amenity and liveability enhancements over the past five years. This investment has allowed Pilbara to move towards the levels of services and amenity usually expected for a similar sized population, creating a strong sense of permanency for settlements that bore the legacy of mining towns. However, the remaining challenges to growth, community development and economic diversification in the Pilbara will
require a coordinated, whole-of-business, government and community approach to achieve a sustainable future for the Pilbara to 2050 and beyond.
The continued growth and sustainability of Pilbara communities will rely on our ability to attract people to live, work and invest in the region. A diverse local economy with attractive job opportunities and lifestyle options will be key to this.
The Pilbara Regional Investment Blueprint (the Blueprint) sets out a bold, aspirational Vision for the region in 2050.
Central to the Blueprint is recognition that the region needs more than “business as usual” growth and development. The Pilbara needs to chart a more aspirational future based on a diversified economy and enhanced liveability.
The Blueprint provides momentum for continual transformation of the Pilbara towards a future that offers diversity of jobs and career opportunities, high standards of services and vibrant community life. It is a roadmap that builds on the Pilbara Cities Vision to sustainably grow and develop communities that meet the aspirations of their people.
The Blueprint Vision is supported by nine regional investment “Pillars” based on analysis of needs, regional interests and comparative advantages that will
deliver new sources of growth. Two “Transformational Opportunities” that will achieve significant positive economic and community outcomes for the region are identified Regional Pillar.
These Transformational Opportunities will be catalysts for projects that will drive transformational change and map an even brighter future for the region.
Table 1 Transformational Opportunities
APPROACH REGIONAL PILLAR TRANSFORMATIONAL OPPORTUNITY
Enabling
Land Access and Economic Infrastructure
Normalised Property Market and Land Access
Secure and Sustainable Infrastructure Services
Education, Training and a Skilled Workforce
Lifelong Education
Workforce Development and Skilled Migration
People and Communities
Diverse and Vibrant Intergenerational Communities
Innovative Local and Remote Healthcare Delivery
Value-Adding
Logistics, Engineering and Supply Chains
Maritime Maintenance, Safety & Emergency Management
Industrial Fabrication, Assembly and Technology
Innovation and Advanced Technology
Business Digital Connectivity
Automation Technology and Services
Diverse and Robust Small to Medium Sized Businesses
SME Support
Streamlining Governance
Diversifying
Agriculture & Aquaculture
High Value Agriculture and Cropping
Aquaculture, Algae Biofuels and Co-products
Energy
Energy Production
Energy Export
Tourism
Nature Based Tourism
Heritage and Aboriginal Tourism Development

6
The Pilbara Regional Investment Blueprint (the Blueprint) identifies Pillars, opportunities and priorities for the region to achieve an aspirational economic and community development Vision.
By highlighting the development potential of the Pilbara, the Blueprint aims to:
• encourage diverse investment in the region;
• inform infrastructure planning, investment and delivery decisions; and
• maximise social, environmental and economic outcomes for local communities, the state of Western Australia and the national as a whole.
The Blueprint seeks to achieve these aims through a collaborative approach to the region’s development. It establishes a common framework for all stakeholders to coordinate infrastructure development and service delivery, and improve the regulatory, social and physical environment where public and private investment can be attracted and delivered with confidence.
Central to the Blueprint is recognition that the region needs more than “business as usual” planning and instead needs to chart a more aspirational future. The Blueprint therefore establishes a Vision and supporting Regional Pillars and Transofrmational Opportunities
based on local knowledge and analysis to encourage aspirational economic and social development outcomes. The Blueprint challenges stakeholders to collectively create a future Pilbara which fully capitalises on the region’s strengths and comparative advantages, maximising leverage of emerging global trends to deliver prosperity, diversity, sustainability and quality of life for residents.
BLUEPRINT DEVELOPMENT AND STRUCTURE
The Blueprint is the outcome of extensive engagement and analytical understanding of the region. It has been prepared by the Pilbara Development Commission (the Commission) and it incorporates the efforts, skills and knowledge of local government, key state and federal government agencies and the non-government, community and non-profit sectors. The Blueprint has been structured through a logical process of understanding:
• where we are• where we want to be (and why)• how we can get there.
BLUEPRINT FRAMEWORK
7
POLICY ALIGNMENT
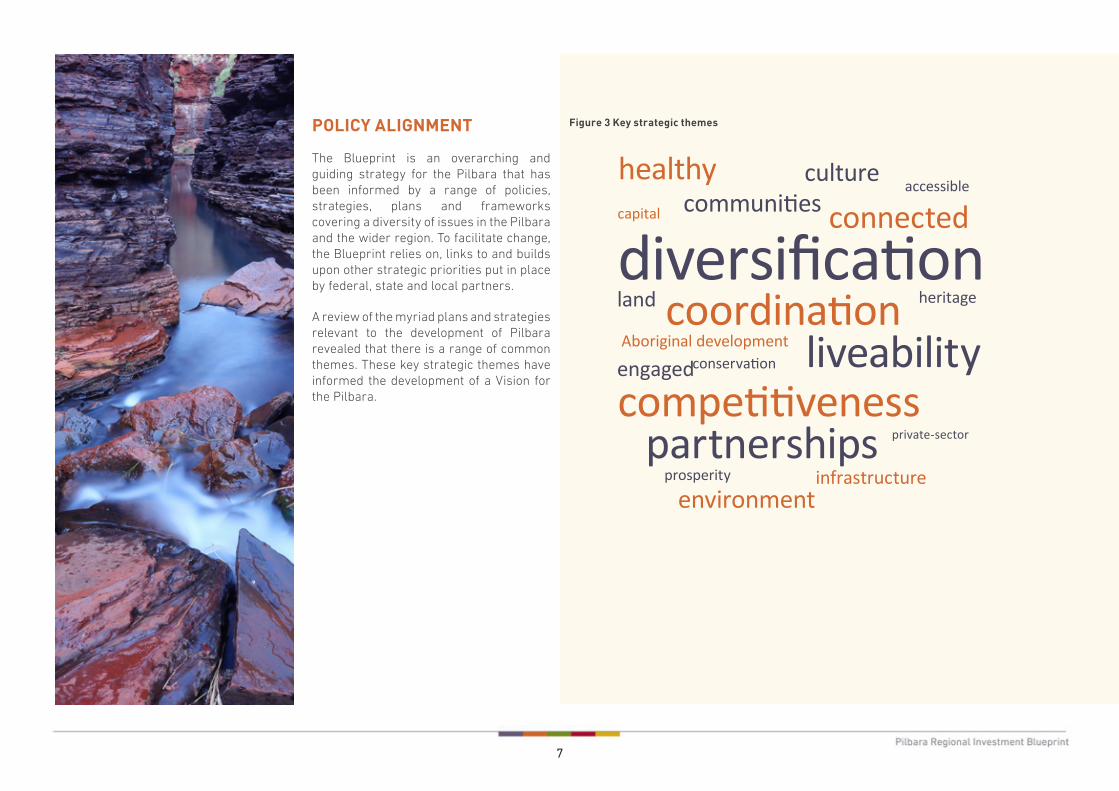
The Blueprint is an overarching and guiding strategy for the Pilbara that has been informed by a range of policies, strategies, plans and frameworks covering a diversity of issues in the Pilbara and the wider region. To facilitate change, the Blueprint relies on, links to and builds upon other strategic priorities put in place by federal, state and local partners.
A review of the myriad plans and strategies relevant to the development of Pilbara revealed that there is a range of common themes. These key strategic themes have informed the development of a Vision for the Pilbara.
Figure 3 Key strategic themes
diversificationcoordination
competitivenessliveability
partnerships
communitiesculture
infrastructure
private-sector
conservation
heritage
accessible
capital
prosperity
Aboriginal development
connectedhealthy
engaged
land
environment

8
PILBARA VISION
PILBARA 2050 VISION
In 2050 – in a world of over 9 billion people, where global economic and military power has shifted, new unknown technologies exist and climate change has altered global weather – what place will the Pilbara take on the world stage?
Resource development has and will continue to be fundamental to the region’s economic prosperity. However, the opportunity exists to build a more diverse regional economy to enhance the sustainability of regional businesses, households and communities and promote a dynamic and prosperous local economy.
Given this, the Blueprint’s Vision for the Pilbara is:
ASPIRATIONAL POPULATION TARGETS
Population growth should never be pursued simply for the sake of growth itself. A region can experience unexpected impacts and outcomes from rapid population growth if it is not pursued in a strategic and effective manner.
The population of the Pilbara has been historically characterised by periods of rapid growth interspersed with times of stagnation and even decline. The continuation of this volatile population growth cycle in the Pilbara, in the absence of any intervention by government, would likely see the Pilbara’s population reach approximately 140,000 by 2050.
The Pilbara Cities initiative represented a major intervention by the Government of Western Australia in the future growth profile of the regional population. The Pilbara Cities Vision explicitly established an aspirational target for the resident populations of towns and cities in the Pilbara.
Across the Pilbara, this is expected to equate to a total resident population of 140,000 by 2035, or some 15 years sooner than under the “business as usual” scenario. The Blueprint builds upon the investment made under Pilbara Cities to establish a strategy to sustain population
growth beyond 2035 into the long term.
The Blueprint establishes an aspirational resident population target for the Pilbara region of 200,000. This is an additional 135,000 residents, or a tripling of the current population of the region. The population growth rates required to achieve this target allow for a slowing of the rate of growth (to 3.0% per annum) in the Pilbara post-2035, as the size of the resident base gets larger. This makes the population target aspirational but also achievable.
The Blueprint identifies the opportunities to realise the employment and population growth to achieve these targets. Growth is expected to be uneven, with periods of rapid growth. Population growth will also vary across regional towns and cities. The Blueprint identifies region-wide initiatives and therefore does not specify town- or city-based targets.
“In 2050, the Pilbara will have 200,000 people living in vibrant, modern and inclusive cities and communities which offer quality services, career choice, affordable living and strong local communities.
The economy will feature diverse, innovative and resilient local and international firms underpinned by the resources and energy industries.”
The Pilbara Cities Vision is to build the population of Karratha and Port Hedland into cities of 15,000 people by 2035, with other Pilbara towns growing into more attractive, sustainable communities.
9
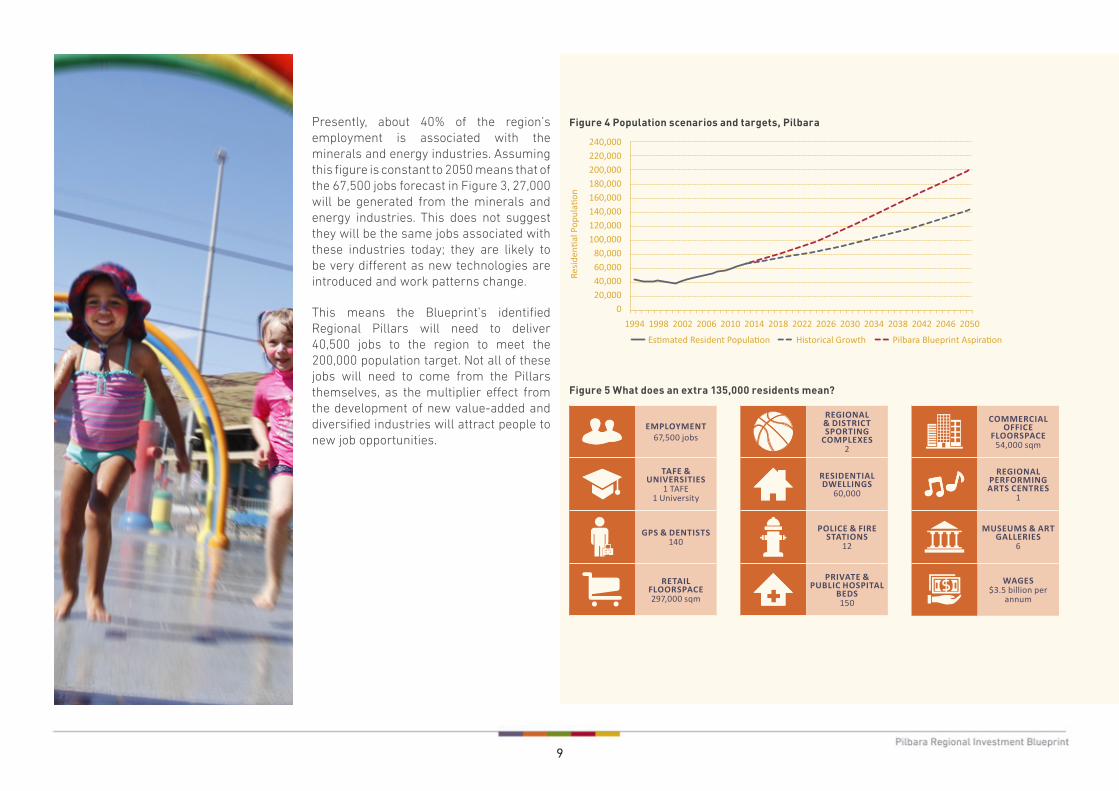
Presently, about 40% of the region’s employment is associated with the minerals and energy industries. Assuming this figure is constant to 2050 means that of the 67,500 jobs forecast in Figure 3, 27,000 will be generated from the minerals and energy industries. This does not suggest they will be the same jobs associated with these industries today; they are likely to be very different as new technologies are introduced and work patterns change.
This means the Blueprint’s identified Regional Pillars will need to deliver 40,500 jobs to the region to meet the 200,000 population target. Not all of these jobs will need to come from the Pillars themselves, as the multiplier effect from the development of new value-added and diversified industries will attract people to new job opportunities.
Figure 4 Population scenarios and targets, Pilbara
1994 1998 2002 2006
Es�mated Resident Popula�on Historical Growth Pilbara Blueprint Aspira�on
2010 2014 2018 2022 2026 2030 2034 2038 2042 2046 2050
Resid
en�a
l Pop
ula�
on
20,00040,00060,00080,000
100,000120,000140,000160,000180,000200,000220,000240,000
0
Figure 5 What does an extra 135,000 residents mean?
EMPLOYMENT67,500 jobs
REGIONAL & DISTRICT SPORTING
COMPLEXES2
COMMERCIAL OFFICE
FLOORSPACE54,000 sqm
TAFE & UNIVERSITIES
1 TAFE 1 University
RESIDENTIAL DWELLINGS
60,000
REGIONAL PERFORMING ARTS CENTRES
1
GPS & DENTISTS140
POLICE & FIRE STATIONS
12
MUSEUMS & ART GALLERIES
6
RETAIL FLOORSPACE297,000 sqm
PRIVATE & PUBLIC HOSPITAL
BEDS150
WAGES$3.5 billion per
annum

10
REGIONAL OVERVIEW
GEOGRAPHY AND HISTORY
Representing 20% of Western Australia’s land mass, the Pilbara is a vast, diverse region of mountain ranges, deserts, plains and numerous offshore islands. While at its southern edge the Pilbara is located approximately 1200km north of Perth, the region extends over an area of 507,896km2 from the Indian Ocean in the west, north to the Kimberley and across the Great Sandy Desert to the border of the Northern Territory in the east.
The region’s history dates back as far as 40,000 years with evidence of the Aboriginal population living off the land. Over 700 historic Aboriginal archaeological sites have been found in the Pilbara, and over 10,000 rock engravings. The region, and most notably on the Burrup Peninsula which is recognised as one of the richest petroglyph sites recorded, is a major rock engraving area and features a greater number and variety of figures than anywhere else in Australia, many dating back 30,000 years or more.
Shire of Ashburton Shire of East Pilbara City of Karratha Town of Port Hedland
Size (km2) 101,240 379,571 15,882 10,587
Resident population (2013)
10,959 12,960 25,907 16,472
Population (%) 9.3% 17.0% 8.8% 14.8%
Population growth (2003-2013)
69.5% 110.0% 21.5% 52.4%
Median age (years) 33 32 32 31
Gross regional product (billion) $10.616 $10.576 $8.836 $4.834
Local employment 10,277 11,280 14,829 8,570
Number of businesses 482 1,256 4,540 4,278
Major towns Tom PriceOnslowParaburdooPannawonica
NewmanMarble BarNullagine
Karratha DampierWickhamRoebournePort SampsonCossack
Port Hedland South Hedland
Aboriginal communities Bindi BindiWakathuniBellary (Innawonga)YoungaleenaNgurrawaana
JigalongPunmuParnngurrIrrungadjiParnpajinyaWarralongStrelleyWoodstock
CheedithaMingullatharndu
JinparinyaMarta MartaYandeyarraPunju NjamalTjalka Boorda
Table 2 Local government key indicators, Pilbara1

11
Figure 6 Pilbara regional context

12
The Aboriginal population lived predominantly alone in this area until around 1861 when European explorers first came to settle in the Pilbara. Early European settlement occurred at Roebourne and the port of Cossack. Early industry was largely pastoral, gold mining and pearling. Until the advent of iron ore mining in the 1960s, the only towns were Onslow, Roebourne, Point Samson (having replaced Cossack as the port servicing Roebourne), Wittenoom, Marble Bar, Nullagine and Port Hedland.
The removal of Commonwealth restrictions on the export of iron ore in response to a growth in world demand, particularly from Japan, changed the region dramatically. The Pilbara had long been known to contain immense deposits, and the commencement of exports sparked the establishment of nine new towns in the region by 1970 (Dampier, Tom Price, Paraburdoo, South Hedland, Newman, Wickham, Pannawonica, Goldsworthy (now closed) and Shay Gap (now closed)). Almost overnight, the Pilbara’s population increased tenfold.
POPULATION
The population in the Pilbara has grown from a few thousand in 1966 to around 66,300 in 20132. This growth, which has been largely associated with the development of mining and energy
projects in the region, has been a significant catalyst for the establishment and growth of settlements like Karratha, Port Hedland, Newman and Tom Price.
The Pilbara also hosts a substantial non-resident population made up generally of industry fly-in fly-out (FIFO) construction and production workforces. The 2011 Census of Population and Housing provided a snapshot of the service population in the Pilbara. There were around 20,000 respondents in the Pilbara on Census night who claimed to have a usual residence outside of the Pilbara4.
While significant non-resident populations were recorded across the region, one-third of the non-resident population were in the City of Karratha on Census night. The transient nature of the Pilbara workforce with additional influences from the FIFO workforces have resulted in a unique gender and age profile. Across the Pilbara, the median age was just 32 years in 2011, compared to 37 across the nation5.
The proportion of males between the ages of 20 and 59 and females between the ages of 25 and 34 are disproportionately higher than national share. The historical lack of health and welfare services has also discouraged the retention of older residents. Only 2.3% of residents as of June 2013 were older than 65 years compared to 12.5% of Western Australian residents.
Figure 7 Historical population by local government area, Pilbara3
70,000
1991 1993 1995 1997 1999 2001 2003 2005 2007 2009 2011 2013
60,000
50,000
40,000
30,000
20,000
10,000
Ashburton (S) East Pilbara (S) Port Hedland (T) Karratha (C)
0
Es�m
ated
Res
iden
t Pop
ula�
on
Figure 8 Age and gender profile, Pilbara, 20136
80-84 yrs
70-74 yrs
60-64 yrs
50-54 yrs
40-44 yrs
30-34 yrs
20-24 yrsAg
e Ra
nge
Percentage of Total Popula�onMales Females
10-14 yrs
0-4 yrs
9 6 3 0 3 6 9

13
Indigenous Australians make up 12% of the Pilbara’s population compared to 2.5% of the nation’s population7. Approximately 7200 Aboriginal people living in the Pilbara as of 2011 were residing in a number of towns and small communities. The Shire of East Pilbara had the highest proportion of Indigenous residents at 21.8%, followed by the Town of Port Hedland at 14.8%.
The Pilbara’s strong and expanding resources sector has provided significant opportunities for Indigenous employment and business development. The establishment of State Agreements for resource projects has enabled traditional owners to negotiate a range of social and economic outcomes for their communities. A number of significant strategic partnerships have been established across the region, targeting and promoting Indigenous economic participation and employment.
However, Indigenous Australians in the Pilbara, as across Australia, still face significant disadvantage, including much higher rates of preventable health problems and a shorter life expectancy than much of the developed world (more than 20 years less than the non-Indigenous population)8. High rates of homelessness and youth unemployment are also significant issues.
ECONOMY
The Pilbara has been the centre of the most rapid expansion of iron ore production in history and the site of construction of some of the largest gas projects in the world. The economic activity associated with these projects has driven a substantial increase the importance of the Pilbara to both the Western Australian and Australian economies.
The labour market in the Pilbara has been one of the strongest in the country, with sustained low levels of unemployment over the past two decades. Since 2003, the Pilbara has experienced an average unemployment rate of just 3.1% compared to 5.2% across the nation10.
There were around 46,000 people employed to work in the Pilbara in 2011. This included approximately 27,400 local residents and 18,600 people based around Australia11. Workers from outside the Pilbara are predominantly based in Greater Perth, followed by Queensland, the South West, New South Wales and Victoria. There are also several hundred residents of neighbouring regions who are employed in the Pilbara. The mining and construction sectors accounted for the majority of employment, with 60% or 27,500 workers in these two sectors in the region compared to 10.0% at a national level during 2011. Overall, 10.7% of Australia’s mining workforce was employed in the Pilbara.
The manufacturing sector is significant in the Pilbara yet accounts for a relatively modest proportion of the it’s total economic activity. Most current manufacturing capacity is directed towards servicing the mining industry and is dominated by chemical manufacturing, machinery and equipment manufacturing and fabricated metal products. Basic chemical manufacturing represents close to half of the Pilbara’s manufacturing output. This includes the fertiliser and explosive sub-categories representing businesses such as the Yara Pilbara Nitrates technical ammonium nitrate production facility in the City of Karratha.
08 Jobs by Top Industries, Pilbara12
Top Industries Pilbara NationJobs % %
Mining 18,500 44.15 1.80
Construction 8,404 18.69 8.44
Accommodation & Food Services
2,467 5.49 6.62
Transport, Postal & Warehousing
2,354 5.24 4.88
Education & Training 1,527 3.40 8.19
Manufacturing 1,445 3.21 9.19
Health Care & Social Assistance
1,424 3.17 11.88
Administrative & Support Services
1,380 3.07 3.30
Public Administration & Safety 1,369 3.05 7.02
Professional, Scientific & Technical Services
1,366 3.04 7.43
Retail Trade 1,349 3.00 10.76
Other Services 1,101 2.45 3.85
Rental, Hiring & Real Estate Services
689 1.53 1.62
Wholesale Trade 626 1.39 4.11
Electricity, Gas, Water & Waste Services
456 1.01 1.18
Agriculture, Forestry & Fishing 163 0.36 2.54
Financial & Insurance Services 144 0.32 3.84
Arts & Recreation Services 99 0.22 1.54
Information Media & Telecommunications
93 0.21 1.81
TOTAL 44,956 100% 100%
Table 3 Jobs by industries, Pilbara12Figure 9 Contribution of Pilbara economy9
EMPLOYMENT46,000 jobs
STATE ROYALTIES$5.0 billion
IRON ORE PRODUCTION
SHARE28% of World
Production
PETROLEUM PRODUCTION
$27 billion
MINERAL PRODUCTION
$72.5 billion

14
Tourism and visitation is a secondary but valuable contributor to the Pilbara economy. It represented an estimated $404.6 million of the Pilbara economy in 2012/13, though a large portion of this economic activity is associated with servicing business visitors which represent the majority of total visitation to the region13. In 2013/14, there was an average of 18,400 visitors to the Pilbara per day, of which three quarters were business travellers. Leisure visitation represented 19.1% of total visitation14.
The dominance of business visitation and the general under-supply of short-stay accommodation due to the dominance of the resources industry in recent years have been considered barriers to growth for the tourism industry16. Nonetheless, there are numerous leisure-based tourism segments in the Pilbara. The recently completed Pilbara Tourism Product Development Plan identified a range of initiatives to attract new leisure tourists to the region.
Agriculture, aquaculture and fisheries production is underdeveloped in the Pilbara despite the presence of a natural environment conducive to a number of agriculture and aquaculture operations and products. Agriculture production was valued at $61.3 million in 2010/11, and this consisted predominantly of livestock production and exports, namely cattle and calves17. Cattle are mainly exported
to Indonesia and Malaysia with some occasional trade to smaller markets18. Opportunities to expand agricultural production in the region are currently being explored. A small number of pilot projects have been carried out by both mining and private companies, capturing the excess mine dewater and using it for producing feedstock crops.
The local business environment is changing as mining expenditure and investment shifts from a construction focus to operations and maintenance. Small and medium enterprises are increasingly focussed on opportunities relating to the growing population. Although the cost of operating a commercial business, on average, has declined in Pilbara towns since 2013, the absolute level of costs remains one of the highest in Australia, with significantly higher wages, rents and other operating expenditures19. The high cost structure in the Pilbara, combined with difficulties associated with the availability of appropriate staff and commercial, retail and industrial land and floorspace, has expressed itself as below average new business development. On a per capita basis, as at June 2013, there were nearly three times as many small businesses across the nation than in the Pilbara20.
Figure 10 Average daily visitation15
20,000
2005/06 2006/07 2007/08 2009/10 2010/11 2011/12 2012/13 2013/14
18,000
16,000
14,000
12,000
10,000
8,000
6,000
4,000
2,000
0
Aver
age
Daily
Visi
tors
Leisure Visitors Business Visitors Other

15
REGIONAL AND GLOBAL INFLUENCES
Regions are increasingly confronted by changing global megatrends that shape the economic and social landscape. A megatrend or substantial shift in conditions – social, economic, environmental, technological and political – may reshape the way an industry operates or communities and economies develop in coming decades.
Megatrends are of particular importance to the Pilbara, which is linked to the global economy through considerable mineral and energy exports and proximity to growing markets. A Pilbara that is resilient in the future will be one which anticipates and reacts to these global influences, exploiting emerging trends to its advantage by capturing market opportunities. This involves business and government collaborating to systematically identify and act on emerging trends, test risks and aggressively pursue opportunities.
Three broad megatrends have been analysed in the Blueprint:
• emerging markets
• security and sustainability
• technological advances.
These megatrends overlap and interact with one another, creating a highly fluid and volatile global environment.
Figure 11 Global megatrend relationship
Emerging Markets
TechnologicalAdvances
Security & Sustainability

16
Key issues under each of these global megatrends are summarised in the following table.
Table 4 Megatrends
Megatrend Issue/Opportunity Description
Emerging
Markets
UrbanisationAcross the globe, the continued shift from rural to urban living will be profound. The world’s urban population is now close to 3.9 billion and is
expected to reach 6.3 billion in 2050. This will be a strong influencing factor on market demand in an array of areas.
Rising Middle Class
The extraordinary growth of affluence and the reduction in absolute poverty across the globe has brought sweeping economic and social
change and it’s not over yet. The size of the middle class is expected to increase from 1.8 billion in 2009 to 4.9 billion by 2030. Almost all of this
growth (85%) comes from Asia.
Global Food
Consumption
The world’s population is expected to increase by more than 25% to 9.1 billion by 2050. At the same time, the world will have to produce more
food and fibre with a smaller rural workforce and less arable land, adopt more sustainable methods to adapt to climate change, and adapt
to changing food preferences. The UN Food and Agriculture Organisation predicts that feeding a world population of 9.1 billion in 2050 would
require raising overall food production by 60% between 2007 and 2050.
Security &
Sustainability
Climate Change &
Water Security
Regions around the globe face significant environmental and economic impacts from climate change, with changing temperatures, weather
patterns and extreme events impacting on biodiversity, agriculture, infrastructure, coastal communities and water supply. CSIRO climate
scenarios for the Pilbara generally pointed towards a hotter and dryer climate for the Pilbara. The largest reductions in rainfall are projected
for the western portion of the Pilbara, whilst there are small pockets of potential rainfall increases further inland.
Low Carbon Future
Climate change, and policy and social action directed at responding to climate change, is creating economic opportunities and challenges. It is
shifting incentives towards lower carbon energy sources and industrial processes. It is also expanding market demand for carbon-reducing
technologies and environmentally friendly products. Global energy demand is expected to increase by 35% between 2010 and 2035. Although
coal is expected to account for 59% of the increase in demand, gas, nuclear, hydro and renewables are expected to increase at a faster rate. Gas
is expected to increase by 49.9% from 2010 to 2035. Biofuels and other renewable energy sources are expected to increase by 86.5% for the
same period.
Shift in Economic &
Military Power
Emerging economies are lifting millions of people out of poverty while also exerting more influence in their region and across the globe. This
geographical shift in economic and military power presents new challenges and opportunities for Australia and the Pilbara. On current trends,
the aggregate purchasing power of the “E7” emerging economies – Brazil, China, India, Indonesia, Mexico, Russia and Turkey – will nearly
double that of the G7 by 2050. These growth countries will shift from centres of labour and production to consumption. They will become
exporters of capital, talent and innovation, competing against an array of developed economies.
Technological
Advances
Digital Connectivity
Countries that have achieved advanced levels of digital connectivity have realised significant benefits in their economies, societies and the
functioning of their public services, and this trend is expected to continue. By 2020, there will be 50 billion networked devices that will impact
on issues such as labour mobility, the future of urban development and design, and investment in digital infrastructure, amongst others.
Increasing digital connectivity will stimulate the emergence of new services and tradeable commodities through improved access to markets,
improved learning and trading platforms and increased mobility through a connected world that will help break down the financial and social
costs of remoteness and isolation.
Automation
The take-up of industrial automation technologies in recent years has been rapid. Over 178,000 industrial robots were sold in 2013, up from
80,000 in 2003. Sales are projected to continue to increase and lift the worldwide stock of industrial robots from 1.4 million to 1.9 million by
2017. Whil industrial automation is historically focussed in process manufacturing – refining raw materials – and discrete manufacturing –
assembling/building parts – it is permeating into other areas of the economy on the back of recent technological advances and rapidly reducing
costs. In the Pilbara, the future of automation in mining is already upon us. Advances in computing, signalling and sensing technology have
brought driverless trucks and trains, automated drills and other pieces of equipment to the Australian mining scene.
Figure 12 Global middle class opportunities
High Quality Produce and Food
Tourism
Minerals and Energy

17
Figure 13 Projected agriculture imports by commodity, World21
0 50 100 150 200
Real Value of Imports (2007 US$ Billions)
Meat
Vegetables and Fruit
Dairy Products
Cereals
Other Foods
Oilseed Oils
Fish
Oilseed Meal
Fish Meal and Oil
2050 2007
Figure 14 Projected energy consumption by source, World21
0 1,000 2,000
Global Energy Demand (Million Tonnes of Oil Equivalent)
3,000 4,000 5,000
Biofuel and OtherRenewables
Hydro
Nuclear
Gas
Oil
Coal
2035 2010
18
REGIONAL CAPACITY FOR GROWTH
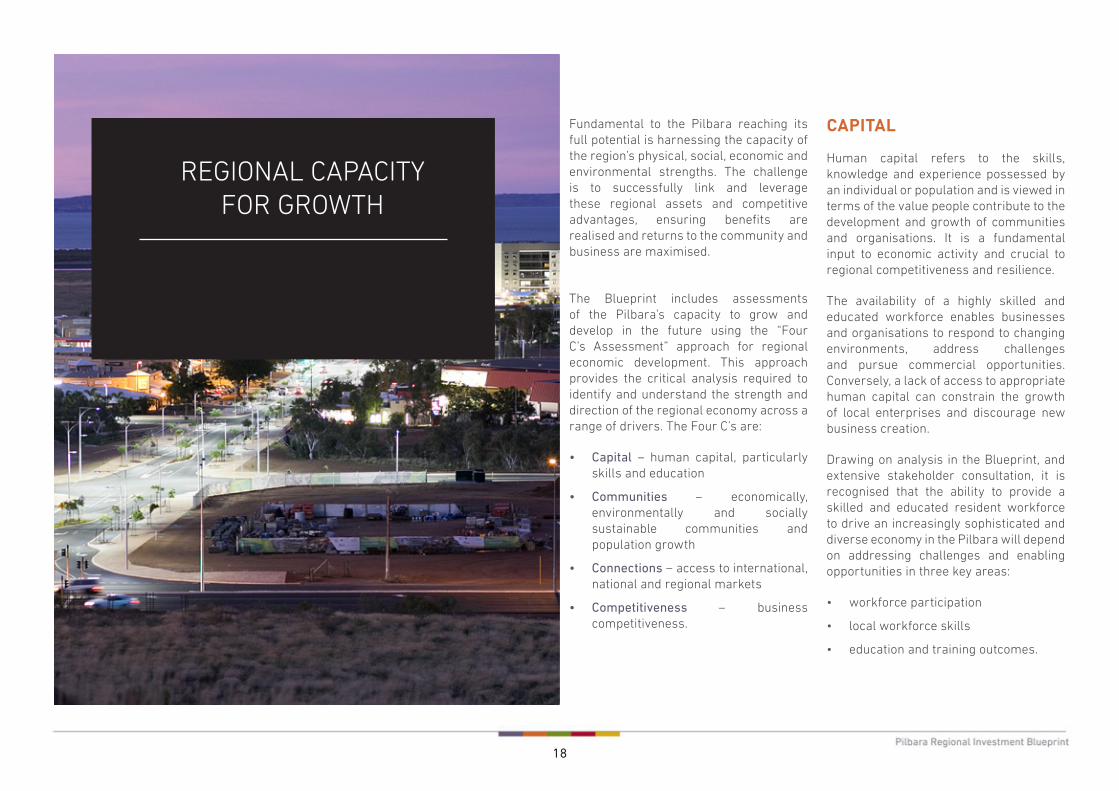
Fundamental to the Pilbara reaching its full potential is harnessing the capacity of the region’s physical, social, economic and environmental strengths. The challenge is to successfully link and leverage these regional assets and competitive advantages, ensuring benefits are realised and returns to the community and business are maximised.
The Blueprint includes assessments of the Pilbara’s capacity to grow and develop in the future using the “Four C’s Assessment” approach for regional economic development. This approach provides the critical analysis required to identify and understand the strength and direction of the regional economy across a range of drivers. The Four C’s are:
• Capital – human capital, particularly skills and education
• Communities – economically, environmentally and socially sustainable communities and population growth
• Connections – access to international, national and regional markets
• Competitiveness – business competitiveness.
CAPITAL
Human capital refers to the skills, knowledge and experience possessed by an individual or population and is viewed in terms of the value people contribute to the development and growth of communities and organisations. It is a fundamental input to economic activity and crucial to regional competitiveness and resilience.
The availability of a highly skilled and educated workforce enables businesses and organisations to respond to changing environments, address challenges and pursue commercial opportunities. Conversely, a lack of access to appropriate human capital can constrain the growth of local enterprises and discourage new business creation.
Drawing on analysis in the Blueprint, and extensive stakeholder consultation, it is recognised that the ability to provide a skilled and educated resident workforce to drive an increasingly sophisticated and diverse economy in the Pilbara will depend on addressing challenges and enabling opportunities in three key areas:
• workforce participation
• local workforce skills
• education and training outcomes.
19
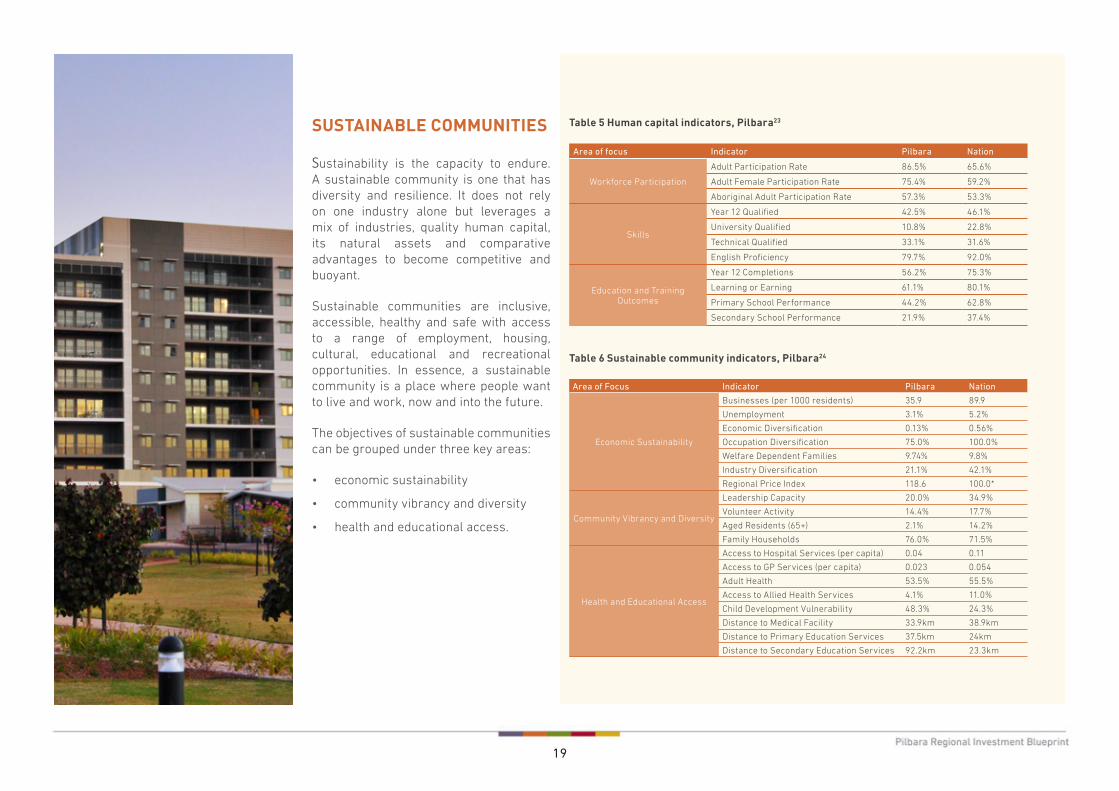
SUSTAINABLE COMMUNITIES
Sustainability is the capacity to endure. A sustainable community is one that has diversity and resilience. It does not rely on one industry alone but leverages a mix of industries, quality human capital, its natural assets and comparative advantages to become competitive and buoyant.
Sustainable communities are inclusive, accessible, healthy and safe with access to a range of employment, housing, cultural, educational and recreational opportunities. In essence, a sustainable community is a place where people want to live and work, now and into the future.
The objectives of sustainable communities can be grouped under three key areas:
• economic sustainability
• community vibrancy and diversity
• health and educational access.
Table 5 Human capital indicators, Pilbara23
Table 6 Sustainable community indicators, Pilbara24
Area of focus Indicator Pilbara Nation
Workforce Participation
Adult Participation Rate 86.5% 65.6%
Adult Female Participation Rate 75.4% 59.2%
Aboriginal Adult Participation Rate 57.3% 53.3%
Skills
Year 12 Qualified 42.5% 46.1%
University Qualified 10.8% 22.8%
Technical Qualified 33.1% 31.6%
English Proficiency 79.7% 92.0%
Education and Training Outcomes
Year 12 Completions 56.2% 75.3%
Learning or Earning 61.1% 80.1%
Primary School Performance 44.2% 62.8%
Secondary School Performance 21.9% 37.4%
Area of Focus Indicator Pilbara Nation
Economic Sustainability
Businesses (per 1000 residents) 35.9 89.9
Unemployment 3.1% 5.2%
Economic Diversification 0.13% 0.56%
Occupation Diversification 75.0% 100.0%
Welfare Dependent Families 9.74% 9.8%
Industry Diversification 21.1% 42.1%
Regional Price Index 118.6 100.0*
Community Vibrancy and Diversity
Leadership Capacity 20.0% 34.9%
Volunteer Activity 14.4% 17.7%
Aged Residents (65+) 2.1% 14.2%
Family Households 76.0% 71.5%
Health and Educational Access
Access to Hospital Services (per capita) 0.04 0.11
Access to GP Services (per capita) 0.023 0.054
Adult Health 53.5% 55.5%
Access to Allied Health Services 4.1% 11.0%
Child Development Vulnerability 48.3% 24.3%
Distance to Medical Facility 33.9km 38.9km
Distance to Primary Education Services 37.5km 24km
Distance to Secondary Education Services 92.2km 23.3km

20
CONNECTIVITY
Access and connection with global markets is critical to the growth of business, employment, incomes and the broader economy. Trade with other locations within the state, nation and around the world is the most effective way for a region to exploit its comparative advantages and competitiveness to generate prosperity for local residents.
Broadly, connectivity to global markets can take a number of forms, for instance ports, airports, personal connections and broadband communication. The Blueprint has assessed the level of connectivity of the region to identify relative strengths and weaknesses of three key areas:
• digital connectivity
• movement of people
• freight infrastructure access and capacity.
Table 7 Connectivity indicators, Pilbara25
Area of Focus Indicator Pilbara Nation
Digital Connectivity
Broadband Connections 74.7% 62.5%
Mobile Coverage 38.0% 80.0%
Mobile Internet 260.0% 310.0%
Internet Connectivity 82.9% 79.0%
Movement of People
Airport RPT Usage (per capita) 27.6 6.3
Overseas-Born Residents 38.5% 30.2%
Population Turnover 159.9% 46.2%
Airport Access 41 km 79.7 km
International Merchandise Exports (per capita)
$1.48m $0.012m
Freight Infrastructure Access & Capacity
Port Access 108.1 km 141.6 km
Road Infrastructure 17.9 km 19.4 km
Rail Infrastructure 29.0 km 35.6 km

21
COMPETITIVENESS
Countries, regions, communities and organisations must become more competitive if they are to maintain their economic position and respond to challenges such as perceived productivity gaps, competition for mobile investment, rapid adoption of new technology and electronic commerce.
The Organisation for Economic Co-operation and Development (OECD) defines a competitive region as one that can attract and maintain successful firms and maintain or increase standards of living for the region’s inhabitants. This means that skilled labour and investment will gravitate away from uncompetitive regions towards more competitive ones.
The competitiveness of a region can be readily assessed through the application of Porter’s Diamond Model of Competitive Advantage. Developed by Michael Porter in his book, The Competitive Advantage of Nations, the Diamond Model represents a form of economic SWOT analysis. The Diamond Model was originally developed to analyse competitiveness at a national level but has since been widely applied to regions and industry clusters.
The results of the competitiveness assessment for the Pilbara are outlined in the following table.
Table 8 Business competitiveness summary, Pilbara
Advantages Challenges
Factor Conditions
• Expansive geography and underutilised land• Oceans, islands and coastal land• Large and developed port infrastructure• Multiple regional airports• High number of hours of sunlight per day• Spare capacity for urban water and waste (approx. 10-15 years)• Extensive, but regionalised, water resources
associated with quality soils suitable for agriculture (potable) and industry (non-potable)
• Globally significant iron ore deposits and petroleum resources• Proximity to major South East Asian markets• Extensive intra-regional transport infrastructure
• Limited capacity for new operations to access existing rail and port infrastructure
• Limited freehold land availability• Lack of inbound shipping facilities• Commercial property affordability• Weather challenges• Low average rainfall• Capture and storage of water• Absence of key intra-regional transport infrastructure
corridors to shorten distances between centres
Demand Conditions
• Strong presence of large mining corporations and associated expenditure
• High incomes and wages and resident purchasing power• High levels of inter-regional and inter-
state travellers to the region• Established export relationship with
rapidly growing global markets
• Small resident population and workforce• Low levels of population retention, particularly during
mature family and retiree stages of household lifecycle• Above average cost of living and cost of doing business• High levels of competition for skilled workers• Cyclical/project-based demand
Related & Supporting Industries
• Robust construction and transport and logistics sectors• Presence of first and second tier mining
support firms and businesses
• Local professional services sectors• Café, restaurant and food and beverage
availability, particularly after hours• Short-stay accommodation capacity and affordability• Foreshore or public realm amenities in many locations• Reliance on imported skills and labour from other regions/states
Firm Strategy, Structure & Rivalry
• Strong local, state and Commonwealth government structure• Strong presence of major national and international businesses
• Ability to finance infrastructure and commercial enterprise investments (general payback period of 10 years, 20% min deposit)
• Complicated Native Title processes and constrained arrangements of use
• Insurance costs• Below average numbers of small local businesses
Innovation
• Research and innovation levels high in mining sector• Strong reliance on machinery, equipment
and technology in major sectors• Health and education services have some tele-service delivery
• No research organisation and/or university campus presence• Significantly underrepresented research
and development professionals• Few technology-related local businesses

22
The growth and development of the Pilbara will be driven by leveraging comparative advantages. The Pilbara’s comparative advantages are determined by the region’s location, natural resource endowment, settlement pattern and industrial advances.
The following principal comparative advantages of the Pilbara have been identified:
Strong investment links with Asia
The Pilbara sits on the doorstep of Asia, with both Karratha and Port Hedland less than 3000km and four hours by air from Singapore and less than three hours from Jakarta. While this advantage is shared by the rest of Australia, the fact that the Pilbara is in the north accentuates this advantage. The region’s geographical proximity to Asia has to date benefitted the trade of minerals and energy but there are considerably more opportunities that could be developed to capitalise on the established bilateral relationships and growing international profile of the region.
Natural environment and resources
The region has significant deposits of offshore petroleum and natural gas, iron ore, nickel, copper, manganese, gold, rare earths, uranium and potash. There are also comparative advantages in renewable energy production, including geothermal, tidal, algae, and solar-based energy
systems drawing on an average 11 hours of sunlight a day with some the highest levels of solar radiation on the planet. Rich soils, vast underground potable water and unique natural beauty also characterise the region.
Aboriginal culture and heritage
The Pilbara has a unique Indigenous culture and heritage with the region’s Aboriginal people maintaining over 40,000 years of continuous connection to country in the region. The Burrup Peninsula and surrounding Dampier Archipelago have the highest concentration of rock art in the world. Associated with the art is a rich archaeological record, including campsites, quarries, shell middens and stone features.
COMPARATIVE ADVANTAGES

23
Location of major industrial activity
The established presence of major industrial activity focussed on natural resource extraction is a key regional asset for the Pilbara. The presence of multi-billion dollar resource extraction activity naturally generates synergistic development and supply chain opportunities through the demand for goods and services, maintenance and operation capacity and the viability of down-stream processing utilising natural resources and extraction by-products.
Export infrastructure
The Pilbara enjoys strong access to markets and is a globally recognised export hub. This includes both physical access, through three major ports and regional airports with capacity to expand, as well as business relationships and networks including trading partners, clients and labour.
Figure 15 Comparative advantages, Pilbara
Strong Investment Links with Asia
Natural Environment and Resources
Aboriginal Culture and Heritage
Location of Major Industrial Activity
Export Infrastructure
Inherent within the comparative advantages listed is the fact that many of them can be combined to create a unique set of imperatives for the establishment of new industries that few, if any other regions anywhere in the world can compete with to the same degree.

24
STRATEGIC PRIORITIES
There are a number of strategic priorities which are considered important to support the development of the Pilbara – not just for the Blueprint’s 2050 Vision but for the regions development in general. Many of these priorities are shared with other parts of regional Western Australia and Australia, though all are particularly relevant to the Pilbara’s current and future development and growth.
The strategic priorities should act as a lens through which investment opportunities can be identified and assessed. They allow for projects and initiatives to be assessed not only in terms of their relevance to the Pilbara’s future growth, but in their contribution to addressing critical issues and priorities for the region’s industries, businesses, communities and households. This ensures that scarce resources are allocated in the most efficient way.
The strategic priorities can be divided into three broad areas – people priorities, economic priorities, and supporting priorities.
PEOPLE PRIORITIES
Liveability
The Pilbara needs to become a place of choice for people to live. Therefore, enhancing and fostering the attractiveness
of the Pilbara – that is, its liveability – as a place for people to live, work and play is critical to attracting new residents to the region.
Population growth and retention
The resident population of the Pilbara currently lacks a critical mass. Shifting the Pilbara’s growth profile from a “business as usual” to a more aspirational profile will provide a larger resident population, which will yield a range of benefits for the region. Part of the population growth must come from the transient workforce being converted to resident, but also from attracting people to work in other industries.
Local employment growth
The ideal scenario is a fully resident workforce supporting all industries, from minerals and energy to new value-added and diversified industries and small and medium businesses. Local employment growth is viewed as fundamental for supporting prosperous and sustainable communities, maximising resident participation in the workforce and enhancing the resilience of households to economic shocks and the rising cost of living.
Aboriginal development
The Pilbara has a proud and diverse Aboriginal community. Aboriginal people are an integral part of communities
across the region, from remote parts of East Pilbara to major towns and cities of Karratha, Port Hedland and Newman. However, like many parts of Australia, the socio-economic characteristics of the Pilbara’s Aboriginal residents are below that of the rest of the population, raising issues of social welfare and inequity in the region.
ECONOMIC PRIORITIES
Import replacement
The Pilbara economy, businesses and communities import a significant quantity and variety of goods from outside the region – some from many thousands of kilometres away – for input into local production. This represents a significant proportion of the costs of goods and services in the region.
Export potential
The Pilbara is Australia’s leading export-oriented economy. Its profile in global markets is exemplary, and the region is seen as an investment location of choice for national and global businesses in mining and resource development, accommodation and infrastructure sectors. Leveraging this profile to diversify the Pilbara’s export potential was identified as a critical priority for new and emerging sectors, ensuring the Pilbara has a strong exposure to emerging global megatrends.
Investment attraction
To diversify and expand the economy, new types and sources of investment for value adding and new industries will be needed. This means identifying, finding, attracting, retaining and maintaining investment in the region.
SUPPORTING PRIORITIES
Environmental sustainability
The Pilbara region has a unique natural environment that must be protected. Promoting smart economic and social development that works with and leverages the environmental attributes of the region is viewed as a strategic priority by stakeholders and is critical to ensuring the sustainability and resilience of the Pilbara economy and population.
Research and innovation
The Blueprint takes a holistic view of research and innovation and promotes approaches that facilitate integrated education/training with industry growth and development, and cross-sectoral fertilisation of ideas, concepts, technologies and processes.

25
APPROACH TO GROWTH AND DEVELOPMENT
Shifting the Pilbara’s population and economic growth from “business as usual” towards a more transformational future requires a comprehensive, consolidated and integrated approach to the growth and development of the region. There is a range of ways to foster and promote the grwoth of a regional economy. Different initiatives generally fall into three broad approaches to growth and development:
Enabling Initiatives –
investment in activities, infrastructure, facilities and services that catalyse and enable the private sector and the community to grow and prosper in a region
Value-Adding –
building upon and adding value to the strengths of the foundational industries to deepen regional economic activity; this can include physical value adding to raw materials, increased capture of supply chain expenditure or the innovative use of existing infrastructure and economic capacity
Diversifying –
broadening of the economic base of a region through the promotion, fostering and growth of new industries and businesses; these businesses are generally separate from the value adding
activities associated with the principal industry, drawing upon the region’s competitive advantages, innovation, research and entrepreneurship to drive growth.
These three approaches to growth and development require different levels of intervention from government and stakeholders, but also provide different scales of benefits and impacts. Enabling initiatives are critical to de-constrain business investment and community development, but do not necessarily directly generate substantial new activity and benefits. In contrast, diversifying actions have the largest impact, supporting the creation and development of new industries and sectors. However, such actions require significant up-front investment and intervention.
REGIONAL PILLARS
Figure 16 Spectrum of approaches to regional growth and development
Enabling
Value-adding
Diversifying

26
REGIONAL PILLARS
Realising the Vision for the Pilbara at 2050 will require the development and growth of a regional economy founded on a range of strengths or “Pillars”. These Pillars represent areas of opportunity for the region’s economy and community where public and private investment should be focussed in order to realise the Vision.
In all, nine Regional Pillars spread across each of the three different broad approaches to growth and development have been identified. They are based on the detailed analysis and understanding of the regional and global influences, regional capacity for growth, regional characteristics and comparative advantages identified in this Blueprint. They build upon and complement the core foundation industries of mining and resource development, which currently underpins the prosperity of the region.
The nine Regional Pillars are detailed overleaf.
PILLAR OBJECTIVES
Identifying these Pillars as areas in which to invest is only part of the story. What is also required are the objectives for investing in the Pillars as they relate to the Pilbara.
To this end, a set of short, medium- and long-term objectives have been identified. These objectives should guide the identification of actions as well as investment across the region.
Figure 17 Detailed analysis and understanding of the Pilbara has led to the identification of nine Regional Pillars
VALUE-ADDING
Logistics, Engineering and Supply Chain Hubs
Innovation & Advanced Technology
Diverse & Robust Small
& Medium Businesses
ENABLING
Education, Training and
a Skilled Workforce
People and Communities
Land Access and Economic Infrastructure
DIVERSIFYING
Agriculture & Aquaculture
Energy Tourism
REGIONAL PILLARS
REGIONAL & GLOBAL INFLUENCES
• Urbanisation• Rising Middle Class• Global Food Consumption• Climate Change &
Water Security• Low Carbon Future• Shift in Economic &
Military Power• Digital Connectivity• Automation
COMPARATIVE ADVANTAGES
• Strong Investment Links with Asia
• Natural Environment & Resources
• Aboriginal Culture & Heritage• Location of Major
Industrial Activity• Export Infrastructure
REGIONAL CAPACITY FOR GROWTH
• Capital• Communities• Connections• Competitiveness
REGIONAL CHARACTERISTICS
• Geography and History• Population• Economy

27
Land Access and Economic Infrastructure: The provision of suitable land and economic infrastructure has been a barrier to the development of the Pilbara. Continuing investment in land access and economic infrastructure, such as energy, water (potable and for agriculture and industry), waste, digital communications and transport (roads, rail, sea and airports) will be required. Overcoming land tenure challenges and improving access to quality services, markets and communities will improve the attractiveness of the region to households and investors, catalysing new industries and businesses in the region.
Education, Training and a Skilled Workforce: The growing global middle class with higher levels of education will mean that the Pilbara will need to maintain a high level of skills and knowledge in order to compete. Therefore, quality secondary and tertiary education and training facilities and services are needed to educate and develop the skills and capabilities of the region’s current and future workforce. Increased access to educational services, from early childhood care and development to university, will encourage local residents to live and study in the region and provide opportunities for industry-specific research and development and innovation to be generated. The Pilbara’s high level of industrial activity provides the opportunity for the region be a significant influence in education, training and knowledge in these areas.
People and Communities: The perception of the Pilbara as a challenging place to live will be overcome, and the Pilbara will be regarded as an attractive place to live, work, invest and visit. Continued investment in health, sports and recreation, arts and culture services and facilities will improve, maintain and enhance the quality of life of the region’s residents. Further investment in cultural events and activities will encourage community vibrancy and help to overcome isolation and remoteness challenges. The Pilbara’s unique Aboriginal culture and history will be celebrated across the region.
Logistics, Engineering and Supply Chains: Opportunities exist to leverage the region’s industrial activity, advancements in technology, existing local skills and infrastructure base, and growing population to promote and encourage globally competitive logistics, engineering and supply chain common use facilities, hubs or centres of excellence to service onshore and offshore industry needs, including defence support and emergency management. Greater levels of locally provided services to the existing minerals and energy supply chains will improve the local capacity in the supply of services, equipment and materials fabrication, assembly and technologies.
Innovative & Advanced Technology: Capitalising on technological change, including micronisation, automation, telecommunications capacity and new
communication mediums, will unlock opportunities in the Pilbara across both the foundation mining base and new industries. The research, development and integration of new and advanced technologies will improve access to learning and commerce opportunities, drive productivity growth and support the resilience and sustainability of communities, businesses and industry. In partnership with the region’s education and training providers, the Pilbara can be a global leader in innovative and advanced operations technologies associated with the mining, resource and new and emerging industries.
Diverse & Robust Small & Medium Businesses: Currently under-represented in the Pilbara compared to national averages, the Pilbara’s small and medium business sector will need to be the heart of the Pilbara’s diversified economy. Diverse, robust and resilient small and medium businesses must take advantage of a growing population base and be innovative, entrepreneurial and use technologies to address operational challenges and access new markets. Local businesses will fully incorporate into mining and major project supply chains, leverage the region’s reputation as a quality and reliable supplier and will actively target opportunities in Asia. A thriving small and medium business sector will support communities during mining downturns and provide a diversity of career choices for local residents.

28
Agriculture & Aquaculture: Amid changing climates and increased water security challenges, market opportunities in Asia for safe, quality food will drive the promotion and development of the natural comparative advantages of the Pilbara in food production. With considerable mine dewater and ground water opportunities, and vast amounts of sunlight and suitable soils for agriculture, the region is in a strong position to utilise existing local export infrastructure and expertise to capture existing and emerging food markets. Optimal environmental conditions make local algae production highly attractive, while the coastal orientation of the region allows for the development of both onshore and offshore aquaculture.
Energy: The Pilbara’s latent energy resources (particularly in LNG, but also uranium) and expansive and underutilised land and natural assets will be developed for local, national and global markets. Proximity, political stability and export infrastructure advantages will be exploited with targeted investment in traditional and innovative alternate energy production opportunities, including solar, geothermal, algae and crop-based biofuel, hydrogen, tidal and other stationary and mobile energy sources. This energy production will help to support the growth of the regional population as well as provide new export opportunities to major and emerging global markets.
Tourism: By leveraging the Pilbara’s unique and iconic environmental and cultural assets (e.g. Karijini and Murujuga National Parks), current strong regional visitation for business and employment reasons will be fostered and diversified to increase travel and expenditure for education, leisure and “visiting friends and relatives” visitation. The Pilbara will capitalise on its proximity to Asia and emerging middle class markets and its airport infrastructure to realise the tourism industry’s potential. Greater investments in the Five A’s of tourism activity – accommodation, accessibility, amenity , attractions and awareness – will be pursued.

29
Table 9 2050 objectives for Regional PillarsD
IVER
SIF
YIN
G Agriculture & Aquaculture• Pilbara and Australia’s North West contribute significantly to regional and global food security
• Triple Gross Value of Agricultural Production (GVAP)
Energy• The Pilbara has a diversified source of sustainable energy including renewable and alternative energy sources
• The Pilbara exports diverse energy sources to regional, national and international markets
Tourism • The Pilbara is a recognised tourism destination, attracting a range of visitors with its natural and man-made attractions and
delivering a variety of significant economic, social and community benefits to the residents of the region.
• Heritage and Aboriginal tourist attractions are recognised by the international market as unique offerings that draw visitors from around the world in their own right
PILLARAPPROACH
ENA
BLI
NG
Land Access and Economic Infrastructure
• Investments are not impeded by a lack of land availability and access
• Utilities are able to respond to market needs and demands in a competitive and efficient market environment
• Low-cost utility services provide a competitive advantage for the region and encourage investment
• A fully integrated public and private transport network of roads, rail, sea and airports which support development
• Urban environments are attractive and promote a strong sense of place
Education, Training and a Skilled Workforce
• A full choice of quality vocational, technical and tertiary education options are available across the region, including a university campus
• Education levels of the workforce are in line with regional Australian averages
• Aboriginal education levels are comparable to the regional Australian average
• Pilbara attracts and retains national and international migrants
People and Communities
• Age and gender profile fully balanced
• Aboriginal residents are empowered and have equal opportunities to participate fully in the social and economic development of the Pilbara
• The Pilbara community celebrates and participates in the unique Aboriginal cultures of the region
• Residents can access quality health advice and services comparable to metropolitan markets using innovative delivery methods
• Resident health and wellbeing in line with metropolitan average
• Sustainable community and NGO sectors promoting community well-being and civic life through human services, sports, recreation, arts, and culture
VALU
E-A
DD
ING
Logistics, Engineering and Supply Chains
• The Pilbara is recognised for maritime safety and emergency management, exporting the expertise to other regions
• The Pilbara is recognised as a world-class industrial fabrication and technology producer, exporting technology and services throughout Asia
• The region’s resource and infrastructure assets and supply chain networks are utilised to support defence and emergency response operations for Northern Australia and South East Asia
Innovation and Advanced Technology
• Businesses in the Pilbara are fully integrated into the global digital economy and are using advanced technologies
• Automation technologies are developed, tested and serviced in the Pilbara
• Advanced technologies and services are exported to other regions
Diverse and Robust Small & Medium Businesses
• The Pilbara is recognised internationally as an attractive, safe and stable place to do business, with a supportive regulatory environment that encourages entrepreneurship, investment and exports
• A full range of small to medium sized businesses contribute to diverse and vibrant communities comparable to other regional centres
2050 OBJECTIVE

30
THE FUTURE ROLE OF THE RESOURCES SECTOR
The fundamental role of the resources sector in the Pilbara is recognised in the Blueprint. Promoting and fostering investment in the Regional Pillars will not displace mining and resource development as the foundational industry in the Pilbara economy. In fact, it is expected that the resources sector will be a major beneficiary of the realisation of the Pilbara 2050 Vision and the Regional Pillars. Potential benefits may include:
• improved access to local skilled workers, through the growth of regional population and labour markets and greater depth and diversity of secondary and tertiary education services
• improved retention of high skilled workers, through the provision of higher amenity urban environments, including associated health, education, retail and community services and facilities
• improved infrastructure, reducing competition for capacity between resource and non-resource (including residential) sectors of the regional economy
• increased productivity, through enhanced access to local supply chains, including key services,
equipment, innovation and research capacity.
The future economic, social and environmental potential of the Pilbara cannot be realised without a robust, dynamic, innovative resources sector in the medium and long term. It is also in the interests of the Pilbara resources sector, and therefore the broader Western Australian economy, that the region transitions from its current mono-economy structure into a more diversified, integrated and collaborative framework that leverages all of the Pilbara’s competitive advantages.
While the Pilbara is known predominanatly for its iron ore and energy resources, there are a number of other resource opportunities. These include copper, manganese and nickel, while significant deposits of uranium and potash have also been found in the region.

31
The capacity of the Pilbara to reach its economic, social and environmental potential in 2050 and beyond is contingent on a range of Transformational Opportunities being captured and leveraged. Each of the broad Regional Pillars identified in this Blueprint will be realised through investment in a range of more specific opportunities that enable, add value and diversify the regional economy and community.
REALISING THE PILBARA 2050 VISION
The Pilbara Development Commission, in consultation and partnership with Pilbara stakeholders, has identified a range of potential investment opportunities in the region out to 2050. These opportunities are based on consideration of regional characteristics and attributes (including competitive advantages) within the context of current and emerging global mega trends.
Individual investments or developments have not been identified in this Blueprint. Instead, the Blueprint provides a framework for identifying and profiling higher-level Transformational Opportunities. Individual actions, projects and initiatives required to realise the Transformational Opportunities will be identified by Blueprint stakeholders in the future. This maximises the flexibility, and therefore longevity, of the Blueprint.
TRANSFORMATIONAL OPPORTUNITIES SUMMARIES
Two Transformational Opportunities have been identified for each of the nine Regional Pillars profiled in the Blueprint.
This represents six individual Transformational Opportunities across each of the three approaches –18 in total.
The Transformational Opportunities identified are identifed in the table overleaf. For further details, refer to the Pilbara Regional Investment Blueprint Technical Report.
TRANSFORMATIONAL OPPORTUNITIES

32
APPROACH REGIONAL PILLAR TRANSFORMATIONAL OPPORTUNITY
Enabling
Land Access and Economic Infrasturcture
Normalised Property Market and Land Access
Secure and Sustainable Infrastructure Services
Education, Training and a Skilled Workforce
Lifelong Education
Workforce Development and Skilled Migration
People and Communities
Diverse and Vibrant Intergenerational Communities
Innovative Local and Remote Healthcare Delivery
Value-Adding
Logistics, Engineering and Supply Chains
Maritime Maintenance, Safety & Emergency Management
Industrial Fabrication, Assembly and Technology
Innovation and Advanced Technology
Business Digital Connectivity
Automation Technology and Services
Diverse and Robust Small to Medium Sized Businesses
SME Support
Streamlining Governance
Diversifying
Agriculture & Aquaculture
High-Value Agriculture and Cropping
Aquaculture, Algae Biofuels and Co-products
Energy
Energy Production
Energy Export
Tourism
Nature-Based Tourism
Heritage and Aboriginal Tourism Development
Table 10 Transformational Opportunities

33
IMPLEMENTATION OVERVIEW
The Blueprint provides a Vision for the whole Pilbara, and therefore, implementation will be the responsibility of all of the region’s stakeholders.
The implementation of the Blueprint will utilise the following basic framework:
Alignment and coordination
An important component of the Blueprint’s implementation will be aligning stakeholders towards common objectives.
Advocacy and promotion
The Pilbara should change perceptions and be viewed as a “region with mining” and not a “mining region”. The Pilbara continues to and will always continue to rely on the minerals and energy sectors. However, significant investments over the past decade in liveability and amenity have transformed the region. The Pilbara needs to reinvent and promote itself as a region offering everything a person could want and need for a satisfying life. Every Pilbara stakeholder striving to meet the Blueprints Vision has a role in advocating for the region in order to change the perception of the region to place to live, work, invest and visit.
Knowledge portal
Poor information limits the ability of stakeholders to make informed decisions about investing in the region – whether that
is a family looking to move to the region or an international investor looking at investment opportunities. The Pilbara will need to improve the process of collecting data about itself and packing it up in a form that is meaningful to stakeholders. This includes forecasting the future of the Pilbara and how certain investments can advance the region.
Investment Prioritisation
A key element of the implementation of the Blueprint will be prioritisation of investments. This is particularly important for investments made by government, whether the investment is actual funding, agency funding or the provision of resources to attract and assist investors. However, not all investments need prioritisation. Private sector investments have different drivers and therefore will be predominantly prioritised by the investor. A major element will be an assessment of the ability of the investment to deliver transformational change to the Pilbara while meeting the strategic priorities outlined in the Blueprint.

34
Financing and funding development
The Pilbara’s forecast population growth trajectory will demand ongoing investment in economic, social and community infrastructure to overcome current deficits and cater for additional demand for housing, utilities and liveable communities. Financing the next phase of Pilbara investment in economic, social and community infrastructure will be a challenge. Coordination of investment attraction to the region will be important. Better investment coordination between the public and private sectors could also help overcome the current fragmented and duplicated approach to infrastructure funding. New models for financing regional development are needed that can:
• utilise public funding to leverage other capital sources to attract new complementary and supplementary funding
• mobilise and coordinate the considerable sums of domestic latent capital that exists in the region
• overcome the fragmented approach to sector funding through employing pooled funding and sector-wide approaches and scaling up successful models of coordinated industry, community and government funding for the health and education sectors
• investigate new capital-raising mechanisms such as public-private partnerships, municipal bonds and value capture
• examine the viability of public asset sales that can both release new capital for priority infrastructure investment and support expansion and more efficient management of existing assets.
Monitoring and reviewing outcomes and actions
The Commission and stakeholders will jointly develop a framework for monitoring and evaluation, including performance measures.The monitoring and evaluation framework will serve several purposes including to:
• measure investment across the region disaggregated by sector
• assess business case development including the number and focus of business cases prepared
• capture policy and procedural initiatives and reforms that improve the investment and development in the region
• monitor demographic and population changes, wellbeing and social cohesion
• Report on outcomes, achievements and any shortcomings in implementation of the Regional Investment Blueprint.
Implementing the nine Regional Pillars
The nine Regional Pillars of the Blueprint will have their own unique set of stakeholders and their own unique challenges
The process of implementing the Pillars should follow the overall strategy for the Blueprint as outlined above:
• Alignment and coordination
• Advocacy and promotion
• Knowledge portal
• Investment prioritisation
• Financing and funding development
• Monitoring and evaluation.
35
REFERENCES
1 ABS (2012) Census of Population and Housing, 2011, Australian Bureau of Statistics, Canberra
2 ABS (2014) Regional Population Growth, Australia, 2012-13, Cat No. 3218.0, Australian Bureau of Statistics, Canberra
3 ABS (2014) Regional Population Growth, Australia, 2012-13, Cat No. 3218.0, Australian Bureau of Statistics, Canberra
4 ABS (2012) Census of Population and Housing, 2011, Australian Bureau of Statistics, Canberra
5 ABS (2012) Census of Population and Housing, 2011, Australian Bureau of Statistics, Canberra
6 ABS (2013) Regional Population Growth, Australia, 2012-13, Cat No. 3218.0, Australian Bureau of Statistics, Canberra
7 ABS (2012) Census of Population and Housing, 2011, Australian Bureau of Statistics, Canberra
8 Curtin (2014) Pilbara 2050: Ensuring the Long-Term Viability of the Pilbara, Curtin University of Technology, Perth
9 Author calculations; DMP (2014) Mineral and Petroleum Statistics,
Department of Mines and Petroleum, Perth; ABS (2014) International Trade in Goods and Services, Australia, Oct 2014, Cat No. 5368.0, Australian Bureau of Statistics, Canberra; & ABS (2012) Census of Population and Housing, 2011, Australian Bureau of Statistics, Canberra
10 Department of Employment (2014) Small Area Labour Markets Publication, Australian Government, Canberra http://employment.gov.au/small-area-labour-markets-publication
11 ABS (2012) Census of Population and Housing, Australian Bureau of Statistics, Canberra
12 ABS (2012) Census of Population and Housing, Australian Bureau of Statistics, Canberra
13 REMPLAN (2014) Pilbara Region Output http://www.economicprofile.com.au/pilbara
14 TRA (2014) Visitor Survey Data, Tourism Research Australia, AusTrade, Australian Government, Canberra
15 TRA (2014) Visitor Survey Data, Tourism Research Australia, AusTrade, Australian Government, Canberra
16 Curtin (2014) Pilbara 2050: Ensuring the Long-Term Viability
of the Pilbara, Curtin University of Technology, Perth http://www.curtin.edu.au/research/cusp/local/docs/pilbara-2050-final-report.pdf
17 ABS (2012) Value of Agricultural Commodities Produced, 2010-11, Australian Bureau of Statistics, Canberra
18 DRD (2011) Pilbara: A Region in Profile, Department of Regional Development, Perth
19 RDAP (2014) Cost of Doing Business in the Pilbara, Regional Development Australia – Pilbara, Karratha
20 ABS (2014) Counts of Australian Businesses, including Entries and Exits, Jun 2009 to Jun 2013, Cat No. 8165.0
21 FAO (2012) World agriculture towards 2030/2050 :The 2012 Revision, Food and Agriculture Organisation of the United Nations http://www.fao.org/docrep/016/ap106e/ap106e.pdf
22 IEA (2012) World Energy Outlook 2012, International Energy Agency
23 See Technical Report for sources
24 Ibid.
25 Ibid.

36
Photos contained in this document were contributed by Shot in Oz, Travis Hayto, Bewley Shaylor, Rebecca Dray, Town of Port Hedland and John Holland
AcknowledgementsThis Blueprint was prepared by the Pilbara Development Commission with the assistance of RPS Group.
We also thank the numerous stakeholders who generously contributed their time and expertise.
DisclaimerWhile the information contained in the publication is provided in good faith and believed to be accurate at the time of publication, appropriate professional advice should be obtained in relation to any information in this publication. RPS Group, the Government of Western Australia and the Pilbara Development Commission shall in no way be liable for any loss sustained or incurred by anyone relying on the information.

KARRATHA OFFICE | Suite 49, 5 Sharpe Avenue Karratha, WA 6714
PORT HEDLAND OFFICE | Shop 2, 6 Wedge Street Port Hedland, WA 6721
PERTH OFFICE | Level 2, 16 Parliament Place, WA 6827
Tel 1800 THE PILBARA (+61) 1800 843 [email protected] | www.pdc.wa.gov.au