piperonyl butoxide environmental risk assessment · 2009-10-05 · piperonyl butoxide (pbo) is an...
TRANSCRIPT

Page 1 of239
PIPERONYL BUTOXIDE
Environmental Risk Assessment
Provided for SRRD
by
EFED’s Piperonyl Butoxide RED Team:
William P. Eckel Michael DavyRichard Lee
December 2004Revised September 2005

Page 2 of239

Page 3 of239
Executive Summary . . . . . . . . . . . . . . . . . . . . . . . . . . . . . . . . . . . . . . . . . . . . . . . . . . . . . . Page -1-
1. Problem Formulation . . . . . . . . . . . . . . . . . . . . . . . . . . . . . . . . . . . . . . . . . . . . . . . . . . Page -3-1.1. Source and Exposure Characteristics . . . . . . . . . . . . . . . . . . . . . . . . . . . . . . Page -3-1.2. Exposure Pathways . . . . . . . . . . . . . . . . . . . . . . . . . . . . . . . . . . . . . . . . . . . . Page -8-1.3. Analysis Plan. . . . . . . . . . . . . . . . . . . . . . . . . . . . . . . . . . . . . . . . . . . . . . . . . Page -9-
1.3.2. Measures of Effects . . . . . . . . . . . . . . . . . . . . . . . . . . . . . . . . . . . Page -10-1.3.3. Assessment Endpoints . . . . . . . . . . . . . . . . . . . . . . . . . . . . . . . . . . Page -11-1.3.3.a. Aquatic Organisms . . . . . . . . . . . . . . . . . . . . . . . . . . . . . . . . . . Page -11-1.3.4. Conceptual Model. . . . . . . . . . . . . . . . . . . . . . . . . . . . . . . . . . . . Page -12-1.3.5 Risk Quotient and Levels of Concern . . . . . . . . . . . . . . . . . . . . . . Page -14-
1.4 Risk Hypothesis . . . . . . . . . . . . . . . . . . . . . . . . . . . . . . . . . . . . . . . . . . . . . . Page -15-
2. Exposure and Effects Analysis . . . . . . . . . . . . . . . . . . . . . . . . . . . . . . . . . . . . . . . . . . Page -16-2.1. Measures of Exposure . . . . . . . . . . . . . . . . . . . . . . . . . . . . . . . . . . . . . . . . . Page -16-
2.1.1. Terrestrial Measure of Exposure Profile . . . . . . . . . . . . . . . . . . . Page -16-2.1.2. Aquatic Measure of Exposure Analysis . . . . . . . . . . . . . . . . . . . . Page -17-
2.1.2.a. Physicochemical Properties and Environmental Fate Assessment . . . Page -17-2.1.2.b. Surface Water Measure of Exposure from Terrestrial Application . . . . Page -18-2.1.2.c. Surface Water Measure of Exposure from Mosquito Abatement . . . . . Page -21-2.1.2.d. Surface Water Measure of Exposure from Spray Drift alone . . . . . . . . Page -22-2.2. Exposure Profile . . . . . . . . . . . . . . . . . . . . . . . . . . . . . . . . . . . . . . . . . . . . . Page -22-
2.2.1 Aquatic . . . . . . . . . . . . . . . . . . . . . . . . . . . . . . . . . . . . . . . . . . . . . Page -22-2.2.2 Terrestrial . . . . . . . . . . . . . . . . . . . . . . . . . . . . . . . . . . . . . . . . . . Page -23-
2.3. Ecological Response Analysis . . . . . . . . . . . . . . . . . . . . . . . . . . . . . . . . . . . Page -23-2.4. Stressor-Response Profile . . . . . . . . . . . . . . . . . . . . . . . . . . . . . . . . . . . . . . Page -25-
2.4.1 Fish and Invertebrates. . . . . . . . . . . . . . . . . . . . . . . . . . . . . . . . . . Page -25-2.4.2 Terrestrial Animals . . . . . . . . . . . . . . . . . . . . . . . . . . . . . . . . . . . . . Page -26-
2.5 Incident Data Review . . . . . . . . . . . . . . . . . . . . . . . . . . . . . . . . . . . . . . . . . . Page -26-2.5.1 Aquatic organisms incidents . . . . . . . . . . . . . . . . . . . . . . . . . . . . . Page -26-2.5.2 Terrestrial animals incidents . . . . . . . . . . . . . . . . . . . . . . . . . . . . . Page -27-2.5.3 Phytotoxicity incidents . . . . . . . . . . . . . . . . . . . . . . . . . . . . . . . . . Page -27-
2.6 Summary of Incidents . . . . . . . . . . . . . . . . . . . . . . . . . . . . . . . . . . . . . . . . . . Page -27-
3. Risk Characterization . . . . . . . . . . . . . . . . . . . . . . . . . . . . . . . . . . . . . . . . . . . . . . . . . . Page -28-3.1 Risk Estimation. . . . . . . . . . . . . . . . . . . . . . . . . . . . . . . . . . . . . . . . . . . . . . . . Page -28-
3.1.1. Terrestrial Ecosystems . . . . . . . . . . . . . . . . . . . . . . . . . . . . . . . . . Page -28-3.1.2. Aquatic Ecosystems. . . . . . . . . . . . . . . . . . . . . . . . . . . . . . . . . . . . Page -29-
3.2. Risk Description. . . . . . . . . . . . . . . . . . . . . . . . . . . . . . . . . . . . . . . . . . . . . . Page -34-3.2.1 General description . . . . . . . . . . . . . . . . . . . . . . . . . . . . . . . . . . . . Page -34-
3.2.1.1 Mammals . . . . . . . . . . . . . . . . . . . . . . . . . . . . . . . . . . . Page -34-3.2.1.2 Birds . . . . . . . . . . . . . . . . . . . . . . . . . . . . . . . . . . . . . . Page -35-3.2.1.3 Freshwater Invertebrates . . . . . . . . . . . . . . . . . . . . . . . Page -35-

Page 4 of239
3.2.1.4 Freshwater Fish . . . . . . . . . . . . . . . . . . . . . . . . . . . . . . Page -35-3.2.1.5 Amphibians . . . . . . . . . . . . . . . . . . . . . . . . . . . . . . . . . Page -35-3.2.1.6 Estuarine/Marine Invertebrates . . . . . . . . . . . . . . . . . . Page -36-3.2.1.7 Estuarine Fish . . . . . . . . . . . . . . . . . . . . . . . . . . . . . . . Page -36-
3.2.2 Alternative Application Scenarios . . . . . . . . . . . . . . . . . . . . . . . . Page -36-3.2.2.1 Terrestrial Scenarios . . . . . . . . . . . . . . . . . . . . . . . . . . Page -36-3.2.2.2 Aquatic Scenarios . . . . . . . . . . . . . . . . . . . . . . . . . . . . . Page -37-
3.2.3 Summaries of Literature Sources . . . . . . . . . . . . . . . . . . . . . . . . . Page -40-3.2.3.1 Insecticides Antagonized by Piperonyl Butoxide . . . . Page -40-3.2.3.2 Antagonistic Effects with Organophosphorous Insecticides
. . . . . . . . . . . . . . . . . . . . . . . . . . . . . . . . . . . . . . Page -41-3.2.3.3 Synergistic Effects with Pyrethroid Insecticides . . . . Page -42-3.2.3.4 Effects on Enzyme Activity in Fish . . . . . . . . . . . . . . . Page -42-
3.2.4. Endocrine Disruption . . . . . . . . . . . . . . . . . . . . . . . . . . . . . . . . . . Page -43-3.2.5 Organisms at Risk . . . . . . . . . . . . . . . . . . . . . . . . . . . . . . . . . . . . . . Page -43-
3.2.5.1 Aquatic Animals . . . . . . . . . . . . . . . . . . . . . . . . . . . . . Page -43-3.2.5.2 Terrestrial Animals . . . . . . . . . . . . . . . . . . . . . . . . . . . Page -44-
3.2.6 Description of Assumptions, Uncertainties, Strengths, and Limitations. . . . . . . . . . . . . . . . . . . . . . . . . . . . . . . . . . . . . . . . . . . . . . . . . . . Page -44-
3.2.6.1 Fate and Exposure . . . . . . . . . . . . . . . . . . . . . . . . . . . . Page -44-3.2.6.2 Slope Probit Analysis . . . . . . . . . . . . . . . . . . . . . . . . . . Page -45-3.2.6.3 Location of Wildlife Species . . . . . . . . . . . . . . . . . . . . Page -45-3.2.6.4 Routes of Exposure . . . . . . . . . . . . . . . . . . . . . . . . . . Page -46-3.2.6.5 Residue Levels Selection . . . . . . . . . . . . . . . . . . . . . . Page -47-3.2.6.6 Dietary Intake - Differences Between Laboratory and Field Conditions
. . . . . . . . . . . . . . . . . . . . . . . . . . . . . . . . . . . . . . . . . . . . . Page -47-3.2.6.7 Terrestrial residue distribution from Fletcher et. al. . . . . Page -48-3.2.6.8 Data gaps . . . . . . . . . . . . . . . . . . . . . . . . . . . . . . . . . . . . Page -49-
3.3. Listed Species . . . . . . . . . . . . . . . . . . . . . . . . . . . . . . . . . . . . . . . . . . . . . . . . Page -49-3.3.1. Introduction . . . . . . . . . . . . . . . . . . . . . . . . . . . . . . . . . . . . . . . . . Page -49-
3.3.1.1 Federal Action . . . . . . . . . . . . . . . . . . . . . . . . . . . . . . . Page -50-3.3.1.2 Action Area . . . . . . . . . . . . . . . . . . . . . . . . . . . . . . . . . Page -50-3.3.1.3 No Effect and Potential for May Effect Determination Page -51-
3.3.2 EPA’s ECOTOX Database Analysis . . . . . . . . . . . . . . . . . . . . . . Page -51-3.3.2 Taxonomic Groups of Listed Species Potentially at Risk . . . . . . . Page -53-
3.3.2.1. Listed Aquatic Animal Species . . . . . . . . . . . . . . . . . Page -53-3.3.2.2. Listed Terrestrial Animals . . . . . . . . . . . . . . . . . . . . . Page -54-3.3.2.3 Listed Species Summary . . . . . . . . . . . . . . . . . . . . . . . . Page -55-
3.3.3. Probit Slope Response Relationship on the Listed Species Levels ofConcern . . . . . . . . . . . . . . . . . . . . . . . . . . . . . . . . . . . . . . . . . . . . Page -55-
3.3.3.2 Terrestrial listed species (quail, rat, and beneficial insects) . . . . . . . . . . . . . . . . . . . . . . . . . . . . . . . . . . . . . . . . . . . . . Page -57-
3.3.3.1 Aquatic Animals . . . . . . . . . . . . . . . . . . . . . . . . . . . . . Page -58-3.3.4. Indirect Effect Analyses . . . . . . . . . . . . . . . . . . . . . . . . . . . . . . . Page -59-

Page 5 of239
3.3.5. Critical Habitats . . . . . . . . . . . . . . . . . . . . . . . . . . . . . . . . . . . . . Page -59-
4. References . . . . . . . . . . . . . . . . . . . . . . . . . . . . . . . . . . . . . . . . . . . . . . . . . . . . . . . . . Page -61-
Appendix A. Environmental Fate Data Requirements Summary . . . . . . . . . . . Page -64-
Appendix B. Calculation of Modeling Parameters for PRZM-EXAMS . . . . . Page -70-
Appendix C. Summary of Ecotoxicity Data . . . . . . . . . . . . . . . . . . . . . . . . . . . Page -72-
Appendix D. Terrestrial Exposure T-REX model . . . . . . . . . . . . . . . . . . . . . . . Page -80-
Appendix E. Environmental Fate Data Requirements for Piperonyl Butoxide . . Page -110-
Appendix F. Ecological Data Requirements for Piperonyl Butoxide . . . . . . . Page -113-
Appendix G Listed Species Listing . . . . . . . . . . . . . . . . . . . . . . . . . . . . . . . . Page -118-
Appendix H Results of PRZM-EXAMS Modeling . . . . . . . . . . . . . . . . . . . . Page -119-
Appendix I. Agricultural Usage Information from USDA Regional IPM Centers Page -227-
Appendix J Terrestrial Residue Distribution . . . . . . . . . . . . . . . . . . . . . . . . . Page -230-
Page -1- Page 6 of239
Executive Summary
- Acute risk to amphibians, freshwater invertebrates and freshwater fish from the many differentagricultural uses of Piperonyl Butoxide (PBO).
- Chronic risk to freshwater invertebrates and freshwater fish is triggered from the manydifferent agricultural uses of Piperonyl Butoxide (PBO).
- Chronic risk to birds and mammals is estimated from the many different agricultural uses of(PBO).
- Mosquito control usage triggers only listed species Levels of Concern for freshwaterinvertebrates, and amphibians.
- Federal endangered/threaten species (listed) Level of Concern is triggered for mammals, birds,amphibians, freshwater invertebrates, and freshwater fish.
- Avian reproductive study indicates PBO to be a candidate for endocrine disruptor testing.
- Uncertainty exists for chronic risk to chronic estuarine fish and invertebrates due to lack ofdata.
- Uncertainty exists for risk to freshwater fish reproduction due to lack of data.
- Uncertainty exist for risk to non-target terrestrial plants due to lack of data.
- PBO degrades rapidly (8.4-hour half-life) in the environment by photolysis in water, and ismetabolized by soil microorganisms (half-life 14 days in one experiment). The estimatedatmospheric half-life of PBO is 3.4 hours, based on the estimated reaction rate with hydroxylradicals.
- PBO is moderately mobile in soil-water systems.
- Little volatilization from soil or water is expected, however PBO may enter the atmosphere asan aerosol as a result of spraying.
- There is no concern for risk to predators via consumption of contaminated fish.
- The major degradates PBO-alcohol, PBO-aldehyde, and PBO-acid are expected to be moresoluble in water than the parent and therefore more mobile in soil-water systems.
- ECOTOX database from Duluth ORD has been analyzed for additional data for this riskassessment. Of the data reviewed, only one study showed an endpoint more sensitive than thedata endpoint chosen for the risk assessment. That particular study was inadequate for RQ usage

Page -2- Page 7 of239
in the risk assessment.
- The probit slope response relationship on the listed species Levels of Concern (0.05 for aquaticand 0.1 for terrestrial) show that the effect probability p(Z) ranges from 2.05E-12 (1 in 4.88E+11chance for daphnid) to 3.4E-6 (1 in 294,000 chance for quail and rat) for listed speciesonly. This does not mean that non-listed species are protected. For such species another probitslope analysis needs to be done using the non-listed species LOC of 0.5.

Page -3- Page 8 of239
1. Problem Formulation
1.1. Source and Exposure Characteristics.
Piperonyl butoxide (PBO) is an insecticide synergist. Synergists are chemicals that lackpesticidal effects of their own but enhance the pesticidal properties of other chemicals. Piperonyl butoxide is used in combination with a wide variety of insecticides in ratios rangingfrom 3:1 to 20:1 by weight. It is usually formulated with natural pyrethrins or syntheticpyrethroids and is an ingredient in thousands of registered pest control products. It hasnumerous and varied commercial and residential applications, is available in a broad range offormulations, and is applied by wide variety of application methods. Commercial uses includepre- and post-harvest application to food and non-food agricultural crops, applications in foodand non-food handling commercial and agricultural structures and outdoor premises, housing forveterinary and farm animals, and direct application to veterinary and farm animals. Piperonylbutoxide (PBO) currently has 70 tolerances (40 CFR 180.127) in/on various crop and livestockfood commodities. Residentially, it is used to control insects both inside the home, and outsideon gardens, lawns and ornamentals, patios, and other outdoor structures, and is directly appliedto pets. As a synergist, it inhibits the mixed function oxidase system of insects and reduces theoxidative breakdown of other pesticides like pyrethrum and synthetic pyrethroids. Comprehensive information on use patterns and formulations is provided in the PiperonylButoxide Master Label which was submitted to the EPA by the Piperonyl Butoxide Task ForceII. The risk assessments for piperonyl butoxide are based solely on the Master Label, since itonly lists the uses that the Task Force II are supporting (C. Rodia, Use Closure Memo,11/17/03). The Master Label for PBO (Feb. 5, 2003, 53 pp.) lists ten crop groups and amiscellaneous category of agricultural uses. These are listed in Table I below, along with thePRZM scenarios that are being used to represent them in this assessment.
Screening level estimate of piperonyl butoxide usage performed by HED’s Biologicaland Economical Analysis Division (BEAD) indicates that 5,000 to 10,000 pounds of piperonylbutoxide are used annually in the U.S. for application to agricultural crops, with highest usage onpotatoes (30% crop treated) and other uses at 5% or less. An estimated 100,000 to 200,000pounds are used annually for non-crop uses.
BEAD did not provide a Quantitative Use Assessment for PBO in time for thisassessment (C. Rodia, SRRD personal commun., 6/23/2004). The majority of PBO use isexpected to be for non-agricultural uses.
Some agricultural usage information was obtained from the USDA Regional IPM Centerswebsite www.ipmcenters.org/datasources/nass/output/NASS.cfm. . A copy of the data table isgiven in Appendix I. The USDA website reports the use of PBO in some years between 1990and 2001 in the following states and crops: eggplant (NJ), tomatoes (NJ, MI), and fall potatoes(MI, NY, PA, ME, WI). In California, use was reported on head and “other” lettuce, spinach,cauliflower, and celery. The quantitative reliability of the data could not be assessed, however,the following information was given.

Page -4- Page 9 of239
In California, PBO was used on 1 to 3% of cauliflower (1994) and celery (1994, 1996)acres, on 3 to 25% of combined head/other lettuce (even years 1992-2000), and 13 to 24% offresh-market spinach acres (1992, 1994, 1996).
In New Jersey, PBO was used on eggplant (25 to 26% of acres in 1992, 1994), and on 21to 25% of fresh-market tomato acres (1992, 1994). In Michigan, PBO was used on 28% oftomato acres in 1992.
Potatoes appear to be the most widespread agricultural use of PBO. The use of PBO onfall potatoes in Maine was 4 to 7% of acres (1993-4); 45 to 70% of acres in Michigan (1992-4);22 to 41 % of acres in New York (1992-4); 1 to 75% of acres in Pennsylvania (1992-5, 1998);and 17 to 33% of acres in Wisconsin (1995, 1997-9, 2001).
The highest reported use rates for PBO were in New Jersey on eggplant (average 4.4 to5.1 applications totaling 2.4 to 2.89 lb/acre/year) and on tomatoes (average 3.5 to 5.3applications totaling 1.89 to 2.47 lb/acre/year). The highest use reported on potatoes was in NewYork (1994), with an average 2.8 applications totaling 2.24 lb/acre/year. In California lettuce,the highest reported use rate was 0.58 lb/acre/year from 1 to 2 applications.
It is most likely that PBO will enter the environment due to the agricultural and publichealth (mosquito control) uses. Non-target organisms are more likely to be exposed to PBO intheir natural habitats due to these outdoor uses. Exposure analyses will focus on the use of PBOin post-crop emergence sprays to control insects. Both ground and aerial spray applications willbe considered. The use of PBO in mosquito control will be examined with the EFED InterimRice model, which estimates environmental concentrations from direct water applications. Table I: PBO Registered Crop Groups and PRZM Scenarios to Represent Them
Crop Group PRZM Scenario
1: Root and Tuber Vegetables (39 crops)2: Leaves of Root and Tuber Vegetables (18 crops)
ID potato, ME potato, FL carrot, CA sugarbeet, MN sugarbeet
4: Leafy Vegetables (Except Brassica Vegetables) (31) CA lettuce
5: Brassica (cole) Leafy Vegetables (16 crops) FL cabbage
6: Legume Vegetables (succulent or dried) (43 crops)7: Foliage of Legume Vegetables (7 crops)
MI beans, OR snapbeans
8: Fruiting Vegetables (except Cucurbits) (10crops) FL peppers, FL tomato, CA tomato, PA tomato
9: Cucurbit Vegetables (17 crops) FL cucumber
10: Citrus Fruits (14 crops) CA citrus, FL citrus
13: Berries (9 crops) OR berries

Page -5- Page 10 of239
Miscellaneous (3 crops) MS cotton, TX cotton, NC cottonFL turf, PA turfFL strawberries, CA grapes
Note: Number in parentheses after Crop Group name is number of crops listed on Master Label for that group.
PRZM (Pesticide Root Zone Model) is a computer model that estimates the amount of pesticidein run-off from agricultural fields (both dissolved and attached to sediment). It is linked to theEXAMS (Exposure Analysis Modeling System) model for estimation of pesticide concentrationsin water bodies. These estimates will be used to derive Expected Environmental Concentrations(EEC) for the aquatic risk assessment.

Page -6- Page 11 of239
O
O
H3C
O
O
O
H3C
Figure 1. Structure of Piperonyl Butoxide
Piperonyl butoxide (PBO, Figure 1) is the common name for 5-2-(2-butoxyethoxy)ethoxymethyl-6-propyl-1,3-benzodioxole. The physical and chemical propertiesof PBO are given below.
Property Value
Chemical Formula C19H30O5
Molecular weight 338.45 g/mol

Page -7- Page 12 of239
Water Solubility 14.3 mg/L
Log Octanol-Water PartitionCoefficient (Log Kow)
4.75
Melting Point Liquid at 25°C
Vapor Pressure 5 x 10-13 mmHg @ 25°C (extrapolated from data athigher temperature – seeAppendix B)
Henry’s Law Constant 1.6 x 10⁻¹⁴ atm-m3/mol (calculated as VP/solubility)
Subdivision N guideline studies for PBO indicate that it has the followingenvironmental fate properties.
Guideline Test Value or Result
Hydrolysis Stable
Aqueous Photolysis Parent half-life 8.4 hours at 25°C andpH 7Total Toxic Residues (TTR) half-life5.7 days
Soil Photolysis Result uncertain due to rapiddegradation of dark control
Aerobic Soil Metabolism Parent half-life 14 days in sandy loamsoilTTR half-life 24 days
Anaerobic Aquatic Metabolism Stable for 181days in flooded sandyloam soil-water system at 25°C
Aerobic Aquatic Metabolism Parent half-life 75 daysTTR half-life 133 days
Adsorption-Desorption (BatchEquilibrium)
Adsorption Koc range 399 - 830 mL/gDesorption Koc range 390 - 1152 mL/g
Adsorption-Desorption (ColumnLeaching)
Aged Soil Column data invalidUnaged soil Column: Parent PBOleached only in sand soil

Page -8- Page 13 of239
Hydroxyl Radical Reaction half-life 0.1 day (estimated by EPI-Suite)
Taken together, these data indicate that PBO will have a moderate tendency to movefrom soil to surface water, and little tendency to leach to ground water except in coarse-texturedsoils. In water bodies, it will be slowly metabolized (75-day half-life), or in shallow, clearwaters, rapdily degraded by photolysis to PBO-alcohol, PBO-aldehyde, and PBO-acid (seeAppendix A for structures). PBO reaching anaerobic sediments will tend to be stable, andavailable for desorption to the water column.
In soil, PBO metabolism appears to be relatively quick (parent half-life 14 days in onesoil tested). PBO-acid is the main degradate formed in soil (17% at 30 days). While parent PBOis not expected to leach except in coarse soil, PBO-acid is expected to be more soluble (2000ppm or more) and therefore more mobile and subject to leaching.
PBO will have very little tendency to partition from water to the atmosphere. If presentin the air as a vapor or spray drift it is expected to reaction rapidly with hydroyl radicals. Themajor degradates PBO-alcohol, PBO-aldehyde, and PBO-acid are expected to have less tendencyto partition from water to air, due to their much higher expected solubility in water.
Exposure to PBO from agricultural use will therefore take place mainly in soil andsurface water, and from consumption of plants and other food items onto which it is sprayed.
1.2. Exposure Pathways.
Ground applications of PBO may result in residues at the use site that terrestrial organisms caningest, inhale or touch (i.e., dermal exposure). Additionally, PBO may reach off-site terrestrialor aquatic systems through spray drift during application or from surface water run-off. Directapplications of PBO to water as a mosquito abatement result in exposure to aquatic organismswithin the water column and to sediment dwellers from partitioning to the sediment. Indirectexposure through the food chain could occur in both the terrestrial and aquatic ecosystem, ifuptake is faster than degradation (photolysis or metabolism in soil).

Page -9- Page 14 of239
1.3. Analysis Plan.
EFED was directed by SRRD to assess the risks from PBO independently from any otheractive ingredient.
Risks to terrestrial and aquatic organisms will be assessed as described below. Applications of PBO were assumed to be at the maximum rate and frequency allowed on theMaster Label (ten applications of 0.5 lb a.i./acre at 3-day intervals). Exposure to both parentPBO and its major degradates (PBO-alcohol, PBO-aldehyde, and PBO-acid) will be considered. The toxicity of the degradates will be considered equivalent to the parent.
1.3.a. Terrestrial Organisms. Onsite exposure of non-target birds and mammals to PBO via ingestion will be assessed by assuming 100% of their diet is obtained from onsite sources andusing the Hoerger-Kenaga nomogram for estimating residues on plants, seeds, insects, and otherfood items. Offsite non-target bird and mammal exposures to plant and insect residues will notbe quantitatively evaluated because onsite plant and insect residue levels will be higher thanoffsite residue levels. For the scenario considered, acute and chronic risk quotient (RQ) valueswill be calculated by dividing estimated exposure concentrations (EECs) by the toxicityendpoints for acute exposure (median lethal dose, LD50) or chronic exposure (no-observed-adverse-effect-concentration, NOAEC), respectively. None of the studies reviewed for foliardissipation were found to have sufficient data points to calculate half-life. Due to lack of foliardissipation data, a default half-life of 35 days will be used. The RQ values will then becompared to standard Levels of Concern (LOCs).
1.3.b. Aquatic Organisms. A Total Toxic Residue approach was used for the aquaticassessment (including freshwater and estuarine habitats). The major degradates of PBO (PBO-alcohol, PBO-aldehyde, and PBO-acid) were included in estimates of PBO exposure byincluding their residues in calculations of half-life values from the relevant metabolism and fatestudies (aerobic soil, aqueous photolysis, aerobic aquatic). Each of the three degradates retainsthe 1,3-benzodioxole (methylenedioxyphenyl) moiety, which is common to a number of relatedcompounds with synergistic or piscicidal properties. There include Sesamex (Merck Index 10th
ed. monograph 8309), Sesamin (monograph 8310), Sesamolin (8311), Asarinin (837), Piperine(7347), and Justicidins (5110).
The three degradates are formed in a series of reactions (PBO, alcohol, aldehyde, acid). Only the alcohol and aldehyde appeared in the aqueous photolysis study, with maxima at 36hours (55% and 12% of applied radiation, respectively). The acid was the only one of the threedegradates detected in the aerobic soil metabolism study (max. 17% of applied at 30 days). Allthree were detected in the aerobic aquatic metabolism study, however, with maxima at 21 to 30days.
EECs of PBO in an aquatic system due to run-off and spray drift from ground or aerialapplications to the crops listed in Table 1 will be modeled using PRZM-EXAMS and AgDrift,respectively. All available PRZM scenarios representing agricultural use on Master Label were

Page -10- Page 15 of239
used. These modeled exposure concentrations will then be divided by the LC50 and EC50 valuesfor fish and aquatic invertebrates, to calculate acute RQs. Chronic RQ values will be calculatedby dividing appropriate EEC values (21-day or 60-day average concentrations) from the PRZM-EXAMS by early-life stage NOEC values .
The AgDrift analysis will examine exposure from spray drift alone in the EFED standardfarm pond and the standard wetland, to determine if spray drift exposure by itself (from theagricultural uses) is of concern. Modeled exposures to a pond or wetland adjacent to the treatedarea will be greater than the assumption of 1% used in the PRZM-EXAMS analysis.
Finally, the EFED Interim Rice Model will be used to assess the risk to aquaticorganisms from a single application of PBO for mosquito abatement. The Interim Rice Model isused because it represents a 4-inch deep water body, similar to the wetlands described on theMaster Label. It is intended to represent a conservative estimate of exposure from a singlemosquito abatement application, but not multiple applications.
1.3.2. Measures of Effects
Assessment endpoints are defined as “explicit expressions of the actual environmentalvalue that is to be protected.” Defining an assessment endpoint involves two steps: 1) identifying the valued attributes of the environment that are considered to be at risk, and 2)operationally defining the assessment endpoint in terms of an ecological entity (i.e., acommunity of fish and aquatic invertebrates) and its attributes (i.e., survival and reproduction). Therefore, selection of the assessment endpoints is based on valued entities (i.e., ecologicalreceptors), the ecosystems potentially at risk, the migration pathways of pesticides, and theroutes by which ecological receptors are exposed to pesticide-related contamination. Theselection of clearly defined assessment endpoints is important because they provide direction andboundaries in the risk assessment for addressing risk management issues of concern.
Ecosystems potentially at risk are expressed in terms of the selected assessmentendpoints. The typical assessment endpoints for screening-level pesticide ecological risks arereduced survival, and impairment of reproduction and growth for both aquatic and terrestrialanimal species. Aquatic animal species of potential concern include freshwater fish andinvertebrates, estuarine/marine fish and invertebrates, and amphibians. Terrestrial animalspecies of potential concern include birds, mammals, beneficial insects, and earthworms. Forboth aquatic and terrestrial animal species, direct acute and direct chronic exposures areconsidered. In order to protect threatened and listed species, all assessment endpoints aremeasured at the individual level. Although all endpoints are measured at the individual level,they provide insight about risks at higher levels of biological organization (e.g., populations andcommunities). For example, pesticide effects on individual survivorship have importantimplications for both population rates of increase and habitat carrying capacity.
The ecological relevance of selecting the above-mentioned assessment endpoints is asfollows: 1) complete exposure pathways exist for these receptors; 2) the receptors may be

Page -11- Page 16 of239
potentially sensitive to pesticides in affected media and in residues on plants, seeds, and insects;and 3) the receptors could potentially inhabit areas where pesticides are applied, or areas whererunoff and/or spray drift may impact the sites because suitable habitat is available.
Each assessment endpoint requires one or more “measures of effect,” which are definedas changes in the attributes of an assessment endpoint itself or changes in a surrogate entity orattribute in response to exposure to a pesticide. Measurement endpoints for the screening-levelrisk assessment are based on a suite of registrant-submitted toxicity studies performed on alimited number of organisms in the following broad groupings:
• Birds (mallard duck and bobwhite quail) used as surrogate species for terrestrial-phase amphibians and reptiles,
• Mammals (laboratory rat),• Freshwater Fish (bluegill sunfish and rainbow trout) used as a surrogate species
for aquatic phase amphibians,• Freshwater invertebrates (Daphnia magna),• Estuarine/marine fish (sheepshead minnow),• Estuarine/marine invertebrates Eastern oyster (Crassostrea virginica) and mysid
shrimp (Americamysis bahia),
Within each of these very broad taxonomic groups, an acute and chronic endpoint isselected from the available test data, as the data sets allow.
1.3.3. Assessment Endpoints.
1.3.3.a. Aquatic Organisms.
Based on the available data and the ecosystems believed to be at risk, the assessmentendpoint is survival and reproduction of individuals and communities of fish and aquaticinvertebrates. The acute measurement endpoints for fish are rainbow trout, sheepshead minnow,and bluegill sunfish acute LC50. The acute measurement endpoints for aquatic invertebrates arewater flea , eastern oyster, and mysid shrimp acute EC50. The chronic measurement endpointsfor fish are embryo larval survival at hatch and growth of the larva, including length and wetweight and, for aquatic invertebrates, mobility and reproduction. The stressors in theseexperiments are assumed to be exposure to PBO and its major degradates, PBO-alcohol, PBO-aldehyde, and PBO-acid.
1.3.3.b. Terrestrial Organisms.
Based on the available data and the ecosystems believed to be at risk, theassessment endpoint is abundance (i.e., survival, reproduction, and growth) of individuals andpopulations of birds and mammals. The acute measurement endpoints are the bobwhite quailand mallard duck acute oral LD50 and short-term dietary LC50. The laboratory rat LD50 is the

Page -12- Page 17 of239
acute measurement endpoint for mammals. The avian chronic measurement endpoints includeadult body weight and food consumption, number of eggs laid, number of eggs cracked, andeggshell thickness. The mammalian chronic measurement endpoints include pup survival anddecreased weight and decreased weight gain in mother or pup. The stressors in theseexperiments are assumed to be exposure to PBO and its major degradates, PBO-alcohol, PBO-aldehyde, and PBO-acid.
1.3.4. Conceptual Model.
The conceptual model (Figure 2) diagrams the relationships between PBO and itsdegradates and the ecological entities potentially exposed. It should be noted that these entitiesare likely exposed to other chemical and environmental stressors (e.g., habitat loss) as well, butonly the direct effects of the pesticide are considered in this assessment. Based on the foregoingdiscussion, the conceptual model for exposure of non-target fish and invertebrates involvesapplication of PBO to a terrestrial site (crop) resulting in spray drift or run-off to the aquaticecosystem, or direct application to water as a mosquito abatement. The non-target organisms arethen exposed to PBO or its degradates in the water column. Exposure to the stressor in sufficientconcentration may result in effects to populations and as a result, effects to ecosystems.
Exposure of birds and mammals in terrestrial environments to PBO and its degradates isexpected to be via consumption of spray-contaminated food items (foliage, seeds, insects, etc.). Exposed birds may be at risk of reduced adult body weight and food consumption, reducednumber of eggs laid, increased number of eggs cracked, and reduced eggshell thickness

Page -13- Page 18 of239
Figure 2. Conceptual Model for Ground and Aerial Applications of PBO to Crops andMosquito Abatement
Source: Ground & aerial application to crops andmosquito abatement
þ
Stressor: Piperonyl Butoxide (synergist)and degradates (PBO-alcohol, PBO-aldehyde, and
PBO-acid)
þ þ
Offsite PotentialExposure Pathways: -surface water run-offand spray drift -direct application towater
Onsite PotentialExposure Pathway: foliage deposits
þ þ
Non-target Receptors: listed freshwater fish,estuarine/marine fish,freshwater invertebrates,estuarine/marine invertebrates,plants
Non-target Receptors:birds, mammals, beneficialinsects, other terrestrialinvertebrates, plants
þ þ
Measurement Endpoints: acute and chronic (reproductive) effects on birds
and mammals; acute and chronic effects on aquatic organisms;
growth effects on plants

Page -14- Page 19 of239
1.3.5 Risk Quotient and Levels of ConcernRisk characterization integrates exposure and ecotoxicity data to evaluate the likelihood ofadverse effects. For ecological effects, the Agency accomplishes this integration using thequotient risk method. Risk quotients (RQs) are calculated by dividing exposure estimates byacute and chronic ecotoxicity values.
RQ = EXPOSURE / TOXICITY
RQs are then compared to the Office of Pesticide Program’s levels of concern (LOCs) to assesspotential risk to non-target organisms and the need to consider regulatory action. Calculation ofan RQ that exceeds the LOC indicates that a particular pesticide use poses a presumed risk tonon-target organisms. LOCs currently address the following categories of presumed risk:
! acute - potential for acute risk is high and regulatory action beyondrestricted use classification may be warranted
! acute restricted - the potential for acute risk is high, but may be mitigatedthrough restricted use classification
! acute listed species - threatened and listed species may be adverselyaffected
! chronic risk - the potential for chronic risk is high and regulatory actionmay be warranted.
The ecotoxicity values used in the acute and chronic risk quotients are endpoints derived fromrequired laboratory toxicity studies. Ecotoxicity endpoints derived from short-term laboratorystudies that assess acute effects are:
! LC50 - fish and birds! LD50 - birds and mammals! EC50 - aquatic plants and aquatic invertebrates! EC25 - terrestrial plants
The NOAEC (No Observable Adverse Effect Concentration) is the endpoint used to assesschronic effects. Table 2 gives formulas for calculating RQs and LOCs for various riskpresumptions.

Page -15- Page 20 of239
Table 2. Formulas for RQ calculations and LOC used for risk assessment.
Risk Presumption RQ LOC
Terrestrial Animals
Acute Risk EEC1/LC50 0.5
Acute Restricted Use EEC/LC50 0.2
Acute Listed Species EEC/LC50 0.1
Chronic Risk EEC/NOAEC 1.0
Aquatic Animals
Acute Risk EEC1/LC50 0.5
Acute Restricted Use EEC/LC50 0.1
Acute Listed Species EEC/LC50 0.05
Chronic Risk EEC/NOAEC 1.0
Terrestrial plants and plants inhabiting semi-aquatic habitats
Acute Risk EEC/EC25 1.0
Acute Listed Species EEC/NOAEC or EC05 1.0
Aquatic Plants
Acute Risk EEC/EC50 1.0
Acute Listed Species EEC/NOAEC or EC05 1.01 abbreviation for estimated environmental concentration
1.4 Risk Hypothesis
Exposure at lethal concentrations to aquatic organisms in water column is expected to causedeath. Sub-lethal concentrations in water column may result in reproductive impairment toaquatic organisms. Exposure at lethal concentrations on wildlife food items is expected to causedeath. Sub-lethal concentrations to wildlife from contaminated food items may causereproductive impairment.

Page -16- Page 21 of239
2. Exposure and Effects Analysis
2.1. Measures of Exposure. The following sections describe the quantitative assessment ofexposure for terrestrial and aquatic organisms.
2.1.1. Terrestrial Measure of Exposure Profile (Food Residues).
Hoerger and Kenaga (1973), as modified by Fletcher et al. (1994), empirically derivedresidue concentrations on avian and mammalian dietary food items immediately followingapplication of any pesticide at 1 pound of active ingredient per acre (lb ai/A). These EECs aregiven in Table 3.
Table 3. Estimated Environmental Concentrations (EECs) on Avian and Mammalian Food Items for a1 lb ai/A Application.
Food Item EEC (ppm)Predicted Maximum Residue
EEC (ppm)Predicted Mean Residue
Short grass 240 85
Tall grass 110 36
Broad-leaved/forage plants, and small insects 135 45
Fruits, pods, seeds, and large insects 15 7
Terrestrial exposure was modeled with the T-REX v.1.1 model, which automatesHoerger-Kenaga nomogram exposure and RQ calculations. It was assumed that PBO wasapplied ten times at the maximum use rate (0.5 lb/acre). Ten applications at 3-day intervals weremodeled. The default assumption for the decay rate on foliage (35-day half-life) was used. Table 4 gives the predicted maximum residues of PBO that are expected to occur on selectedavian or mammalian dietary food items.
Table 4. Maximum Estimated Environmental Concentrations (EECs) on Avian and Mammalian FoodItems for PBO Application at the Maximum Use Rate and Frequency (T-REX v.1.1 ).
No. of appli-cations
Short grass(ppm)
Tall grass(ppm)
Broad-leaved/forageplants,small insects (ppm)
Fruits/pods/seeds/large insects (ppm)
0.5 lb/acre,10 x @ 3 days
932 427 524 58

Page -17- Page 22 of239
2.1.2. Aquatic Measure of Exposure Analysis.
Exposure was modeled in three ways. Exposure due to terrestrial application (crops) wasassessed using the standard farm pond scenario in the PRZM-EXAMS models. The scenarios inTable I were used to represent the numerous crop groups for which PBO is registered. AllPRZM-EXAMS exposure analyses were done at maximum application rates and frequency.
The EFED Interim Rice Model was used to calculate acute exposure due to directapplication to water for the mosquito abatement use. Finally, the AgDrift model was used tocalculate exposures in the EFED standard farm pond and standard wetland due to spray driftalone, from the terrestrial application (crops). The Interim Rice model and AgDrift analyseswere performed for single applications.
2.1.2.a. Physicochemical Properties and Environmental Fate Assessment.
Piperonyl butoxide (“PBO,” C19H30O5, molecular weight 338.45) is a liquid at roomtemperature, and boils at 180°C (1 mmHg). Its solubility in water is 14.3 mg/L, and the logoctanol-water partition coefficient is 4.75. Its calculated vapor pressure is 5.0E-13 mmHg at 25°C, and the calculated Henry’s Law constant is 1.558 E-14 atm-m3/mole (see Appendix B).
Piperonyl butoxide degrades rapidly (8.4-hour half-life) in the environment by photolysisin water, and is metabolized by soil microorganisms (half-life 14 days in one experiment). Othertested routes of degradation are very slow (hydrolysis, aerobic and anaerobic aqueousmetabolism) or have questionable rates due to experimental difficulties (soil photodegradation). The estimated atmospheric half-life of PBO is 3.4 hours, based on the estimated reaction ratewith hydroxyl radicals (SRC PhysProp databse).
PBO is moderately mobile in soil-water systems, with Koc values of 399 to 830. Littlevolatilization from soil or water is expected, however PBO may enter the atmosphere as anaerosol as a result of spraying. A flow-through fish bioaccumulation study in bluegill sunfishproduced bioaccumulation factors of 260x, 91x, and 380x for whole fish, edible tissue, and non-edible tissue, respectively. Based on this study, there is little concern for exposure viaconsumption of contaminated fish to ecological organisms. PBO will have very little tendencyto partition from water to the atmosphere. If present in the air as a vapor or spray drift it isexpected to reaction rapidly with hydroyl radicals.
The major degradates PBO-alcohol, PBO-aldehyde, and PBO-acid are expected to bemore soluble in water than the parent and therefore more mobile in soil-water systems, based ontheir lower molecular weights and hydrophilic moieties. The reported solubility of piperonal,which differs from PBO-aldehyde by lacking the propyl side chain, is 1 part in 500 parts water(Merck Index 10th Ed., 1983, monograph 7350), or 2000 parts per million. Piperonylic acid(monograph 7352) which differs from PBO-acid by lacking the propyl side chain is “slightly”soluble in water (Appendix A).

Page -18- Page 23 of239
2.1.2.b. Surface Water Measure of Exposure from Terrestrial Application.
The following input parameters (Table 5) were used for the linked PRZM and EXAMS models. The values were selected in accordance with the EFED Input Parameter Guidance datedFebruary 28, 2002. The scenarios listed in Table I were chosen to represent use on the variouscrop groups for which PBO is registered. The standard farm pond scenario was used. Calculated half-lives reflect combined residues of parent PBO and its major degradates PBO-alcohol, PBO-aldehyde, and PBO-acid, expressed as PBO equivalents (Appendix B).
Table 5. PRZM-EXAMS Input ParametersInput Parameter Value Reference/ Comment
Application Rate 0.5 lb/acre (0.56 kg/hectare), tentimes, at 3-day intervals
Master Label (02/05/2003)
Application type Aerial spray (5% drift) or ground spray (1% drift)Unincorporated
Master Label (02/05/2003)
Laboratory Soil Metabolism Half-life
73 days (3 x single value of 24.2days for Total Toxic Residues:parent, PBO-alcohol, PBO-aldehyde, PBO-acid)
MRID 438064-01as amended 5/17/2004
Laboratory Aerobic AquaticMetabolism Half-life
133 days for Total ToxicResidues
MRID 438034-01as amended 5/17/2004
Laboratory Hydrolysis Half-life(pH 7)
stable MRID 435956-01
Laboratory Aqueous PhotolysisHalf-life
5.07 days (for Total ToxicResidues)
MRID 436372-01as amended 5/17/2004
Soil-Water PartitioningCoefficient (Koc)
399 (lowest non-sand Koc) MRID 436738-01
Solubility 143 ppm (parent) 10 x actual solubility as perEFED Input Parameter Gudiance(Feb. 2002)
Chemical Application Method(CAM)
2 (linear foliar based on cropcanopy), incorporation depth 0(zero) cm
consistent with post-emergentspraying
Molecular Weight 338.45 amu from formula
Henry’s Law constant 1.56E-14 atm-m3/mol calculated from vapor pressureand solubility
Vapor Pressure 5E-13 torr calculated (see Appendix B)
FILTRA, UPTKF, PLVKRT,PLDKRT
0 (default value) no data
Page -19- Page 24 of239
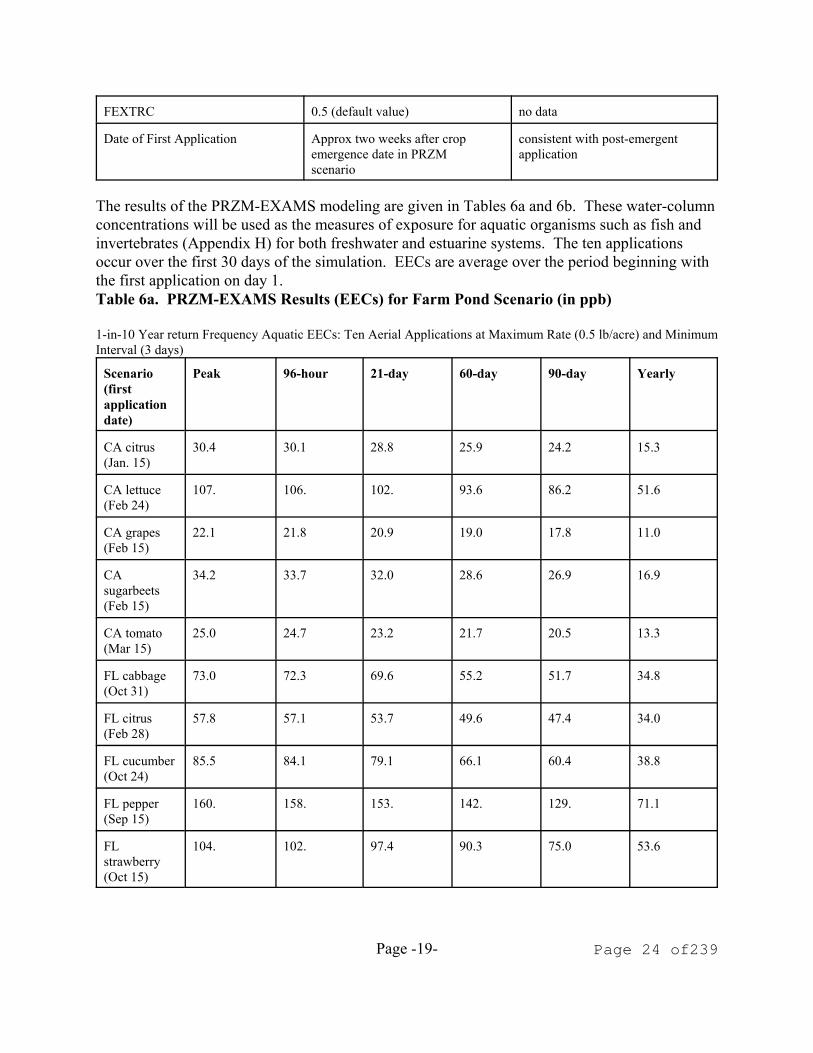
FEXTRC 0.5 (default value) no data
Date of First Application Approx two weeks after cropemergence date in PRZMscenario
consistent with post-emergentapplication
The results of the PRZM-EXAMS modeling are given in Tables 6a and 6b. These water-columnconcentrations will be used as the measures of exposure for aquatic organisms such as fish andinvertebrates (Appendix H) for both freshwater and estuarine systems. The ten applicationsoccur over the first 30 days of the simulation. EECs are average over the period beginning withthe first application on day 1.Table 6a. PRZM-EXAMS Results (EECs) for Farm Pond Scenario (in ppb)
1-in-10 Year return Frequency Aquatic EECs: Ten Aerial Applications at Maximum Rate (0.5 lb/acre) and MinimumInterval (3 days)
Scenario(firstapplicationdate)
Peak 96-hour 21-day 60-day 90-day Yearly
CA citrus(Jan. 15)
30.4 30.1 28.8 25.9 24.2 15.3
CA lettuce(Feb 24)
107. 106. 102. 93.6 86.2 51.6
CA grapes(Feb 15)
22.1 21.8 20.9 19.0 17.8 11.0
CAsugarbeets(Feb 15)
34.2 33.7 32.0 28.6 26.9 16.9
CA tomato(Mar 15)
25.0 24.7 23.2 21.7 20.5 13.3
FL cabbage(Oct 31)
73.0 72.3 69.6 55.2 51.7 34.8
FL citrus(Feb 28)
57.8 57.1 53.7 49.6 47.4 34.0
FL cucumber(Oct 24)
85.5 84.1 79.1 66.1 60.4 38.8
FL pepper(Sep 15)
160. 158. 153. 142. 129. 71.1
FLstrawberry(Oct 15)
104. 102. 97.4 90.3 75.0 53.6

Page -20- Page 25 of239
FL tomato(Jan 24)
86.5 84.5 79.5 72.4 71.2 43.5
FL turf (Feb15)
39.8 39.2 36.7 33.2 31.0 18.9
ID potato(May 24)
29.7 29.3 27.8 26.1 24.8 19.1
ME potato(Jun 13)
89.1 88.3 86.6 84.2 82.5 70.6
MI beans(Jun 19)
132. 131. 126. 123. 120. 96.2
MNsugarbeet(May 25)
77.6 76.9 74.3 66.9 63.4 52.0
MS cotton(Jun 15)
131. 130. 127. 124. 121. 79.9
NC cotton(Jun 15)
98.1 96.5 93.1 87.2 84.3 65.2
OR berries(Apr 21)
27.9 27.5 26.4 23.8 22.3 16.4
OR snbeans(Jun 25)
77.2 76.8 75.4 73.0 72.2 58.7
PA tomato(Apr 29)
72.0 71.0 66.9 60.1 56.5 40.3
PA turf (Apr 15)
39.6 39.1 36.9 34.4 32.2 23.8
TX cotton(May 9)
101. 98.1 93.3 84.0 80.2 46.0
Table 6b.1-in-10-Year Return Frequency Aquatic EECs: Ten Ground Applications at Maximum Rate (0.5lb/acre) and Minimum Interval (3 days)
Scenario Peak 96-hour 21-day 60-day 90-day Yearly
CA citrus 17.9 17.8 17.4 15.6 14.6 8.9
CA lettuce 103. 101. 97.9 88.7 81.6 47.8
CA grapes 8.4 8.3 7.9 7.1 6.7 4.2
CAsugarbeets
21.1 20.8 19.5 17.2 16.2 10.2
CA tomato 13.2 13.0 12.1 10.7 10.0 6.6

Page -21- Page 26 of239
FL cabbage 65.5 64.8 62.3 48.4 45.3 29.9
FL citrus 48.3 47.6 45.1 42.2 40.2 29.7
FL cucumber 77.7 76.3 71.6 60.5 54.2 33.4
FL pepper 159. 158. 152. 140. 126. 68.1
FLstrawberry
96.1 94.5 90.2 83.4 69.3 49.2
FL tomato 81.7 79.8 73.8 66.5 64.6 39.5
FL turf 29.3 28.8 26.8 24.2 23.1 13.3
ID potato 13.4 13.2 12.9 11.6 10.8 8.3
ME potato 73.8 73.2 71.6 70.3 69.2 59.0
MI beans 119. 118. 113. 110. 107. 85.6
MNsugarbeet
64.3 63.2 59.6 55.0 52.8 41.9
MS cotton 130. 129. 127. 123. 119. 76.5
NC cotton 88.5 87.3 84.3 79.3 76.8 59.7
OR berries 10.7 10.6 10.1 9.0 8.3 6.4
OR snbeans 69.4 69.1 67.9 65.4 63.8 49.9
PA tomato 58.1 57.3 54.0 48.6 45.9 32.0
PA turf 25.5 25.1 24.0 22.2 20.8 14.5
TX cotton 92.8 90.7 85.7 76.8 73.8 41.7
2.1.2.c. Surface Water Measure of Exposure from Mosquito Abatement.
The EFED interim standard Rice Paddy Model (10/29/2002) was used as a measure of exposurefor the mosquito abatement application. The standard Rice Paddy Model represents the exposureconcentration in a four-inch deep water body at the time of application, and accounts forpartitioning to sediment, but not dissipation. Thus it represents a conservative measure ofexposure. The Master Label indicates that the application rate of PBO for mosquito abatementapplications is up to 0.08 lb/acre (0.0896 kg/hectare) for Aedes taeirorhynchus and other difficultspecies. No maximum number of applications is given. The minimum soil-water distributioncoefficient (Kd = 0.98) measured for PBO was used, to provide maximum partitioning to thewater phase, and thus a conservative measure of exposure in the water column.
The Rice Paddy EEC is based on a calculation for a one-hectare rice paddy with four inches (10cm) of water, and a one-centimeter deep sediment interaction zone:

Page -22- Page 27 of239
EEC = (109 MT)*(VT + msed*Kd)-1 (Eq. 1)
where MT is the mass of pesticide applied, VT is the volume of water (1,067,000 liters/ha), msed isthe mass of the sediment (130,000 kg/ha), Kd is the soil-water partitioning coefficient, and 109 isa unit conversion factor to give the result in parts-per-billion.
With inputs of MT = 0.0896 kg a.i./hectare, and Kd = 0.98, the Rice Paddy EEC for a singleapplication is 75 ppb.
2.1.2.d. Surface Water Measure of Exposure from Spray Drift alone.
Ground ApplicationThe AgDrift model was used to calculate aquatic exposures in the EPA standard pond andstandard wetland, from spray drift due to agricultural use (single application only). A groundspray Tier 1 aquatic assessment was performed, assuming high boom application with ASAEvery fine to fine spray, 90th percentile drift, and a zero-foot buffer, at an application rate of 0.5 lba.i./acre. AgDrift calculated that 6.16% of the applied mass would reach the pond or wetland,resulting in an initial average concentration of 1.7 ppb in the pond, and 23 ppb in the wetland.
Aerial ApplicationTier 1 aerial analysis (assuming ASAE fine to very fine spray and a zero-foot buffer) indicatedthat the concentrations in the pond and wetland would be 6.8 ppb and 90.6 ppb, respectively.
2.2. Exposure Profile.
2.2.1 Aquatic
The PRZM-EXAMS models were used to simulate farm pond EECs. The peak EECs rangedfrom 22.1 ppb (CA grapes) to 160 ppb (FL peppers) for aerial application. For groundapplication, the peak EECs ranged from 8.4 ppb (CA grapes) to 159 ppb (FL peppers). Thehighest peak EECs were in Florida (peppers, strawberry), MI beans, cotton (MS, TX), and CAlettuce, all of which were above 100 ppb for aerial application. The highest 21-day average and60-day average exposures were parallel to the highest peak exposures, with some still above 100ppb from aerial exposure (CA lettuce, FL pepper, MI beans, MS and NC cotton).
The EFED standard Rice Paddy Model was used for predicting surface water exposure frommosquito abatement application. The acute EEC was 75 ppb.
The spray drift-only analysis for the standard farm pond yielded a lower modeled concentrationin the EFED standard 6-foot deep pond (1.7 to 6.8 ppb) than the PRZM-EXAMS calculation,since it does not include run-off exposure. However, the wetland exposure (in a 6-inch deepwater body) is higher (23 to 91 ppb) due to the smaller water volume. The EFED standardwetland represents the EEC in shallow water bodies (swamps, marshes, etc) exposed only tospray drift from a single application at 0.5 lb/acre.

Page -23- Page 28 of239
2.2.2 Terrestrial
Terrestrial exposure was modeled with the T-REX v.1.1 model, which automates Hoerger-Kenaga nomogram exposure and RQ calculations. It was assumed that PBO was applied tentimes at the maximum use rate (0.5 lb/acre) with 3-day intervals. In the absence of foliageresidue data, the default assumption for the decay rate on foliage (35-day half-life) was used. The maximum EEC on food items available for wildlife ranges from 58 ppm to 932 ppm. TheHoerger-Kenaga nomogram also has mean values for residues on food items. The mean EEC onfood items available for wildlife ranges from 17 ppm to 330 ppm.
2.3. Ecological Response Analysis.
In screening-level ecological risk assessments, effects characterization describes the types ofeffects a pesticide can produce in an organism. This characterization is based on registrant-submitted studies that describe acute and chronic effects toxicity information for various aquaticand terrestrial animals and plants. In addition, other sources of information, including reviews ofthe open literature and the Ecological Incident Information System (EIIS), are conducted tofurther refine the characterization of potential ecological effects.
Appendix C summarizes the results of the registrant-submitted toxicity studies used tocharacterize effects for this risk assessment. Toxicity testing reported in this section does notrepresent all species of birds, mammals, or aquatic organisms. Only a few surrogate species forboth freshwater fish and birds are used to represent all freshwater fish (2000+) and bird (680+)species in the United States. For mammals, acute studies are usually limited to Norway or NewZealand rat or the house mouse. Estuarine/marine testing is usually limited to a crustacean, amollusk, and a fish. Also, neither reptile nor amphibian tests are required. The risk assessmentassumes that avian and reptilian toxicities are similar. However, Amphibian toxicity studieswere submitted and reviewed. The endpoint is below.
Table 7. Acute PBO Toxicities used in Risk Assessment to Fish, Daphnids, and Birds, and Acute and ChronicToxicity to Mammals
Table 7A. Acute Toxicity Data for Aquatic Freshwater and Estuarine/ Marine OrganismsSpecies (test duration) LC50 (ppm) Reference
Freshwater Fish
Rainbow trout (96 hr.) 1.9 MRID 40098001
Freshwater Invertebrates
Daphnia magna 0.51 MRID 42540301
Estuarine/Marine Fish
Sheepshead minnow 3.94 MRID 42540304
Estuarine/Marine Invertebrates

Page -24- Page 29 of239
Shrimp (Mysid opsis bahai) 0.49 MRID 43901801
Amphibians
Western chorus frog tadpolePseudacris triseriata (96-hour)
0.210 MRID 40098001
Table 7B. Chronic Toxicity Data for Freshwater and Estuarine/Marine Fish and InvertebratesSpecies (test duration) NOEC/LOEC (ppm) Reference
Freshwater Invertebrates
Daphnia magna (21-day life cycle) 0.030 / 0.047 MRID 43311301
Freshwater Fish
Fathead minnow (Pimephales promelas) 0.04 / 0.11 MRID 43300301
Table 7C. Acute Toxicity to Terrestrial SpeciesSpecies (Test Duration) Effect level Reference
Birds
Northern Bobwhite Quail LD50 > 2250 mg a.i./kg bw (no mortalities at highest dose)NOEC = 486 mg a.i./kg bw
MRID 41969008
Northern Bobwhite Quail and Mallard Duck Dietary LC50 > 5620 ppm (no mortalities)NOEC = 1000 ppm (toxicosis)
MRID 41969006
Insects
Honey Bee LD50> 25 :g/bee; NOAEC = 25 :g/bee MRID 41969009
Mammals
Laboratory Rat LD50 = 4570 mg/kg bw MRID 41969001
Table 7D. Chronic Toxicity to Terrestrial SpeciesSpecies Effect level Reference
Birds
Mallard Duck NOEC = 300 ppmLOEC = 1200 ppm (adult and hatchling body weight andfood consumption, number of eggs laid, number of eggscracked, and eggshell thickness)
MRID 43876302
Mammals
Laboratory rat Maternal NOAEC = 1000 ppm (89 mg/kg bw)Maternal LOAEC = 5000 ppm (469 mg/kg)Offspring NOAEC = 1000 ppm (89 mg/kg bw)Offspring LOAEC = 5000 ppm (469 mg/kg)
MRID 00161118

Page -25- Page 30 of239
2.4. Stressor-Response Profile
2.4.1 Fish and Invertebrates.
Freshwater fish. Aquatic toxicity data (LC50 = 1.8 to 12.2 ppm) suggest that PBO is moderatelytoxic to freshwater fish on an acute basis. The toxicity endpoint value that will be used for RiskQuotients (RQ) for freshwater fish is 1.9 ppm (rainbow trout) and not the 1.8 ppm (rainbowtrout) (both references to Mayer, 1986, MRID 40098001). The 1.8 ppm value was tested in hardwater (272 ppm CaCO3) which would not make the study a core classification but supplementalclassification. The 1.9 ppm tox value is from a core study. The confidence interval for the LC50= 1.9 ppm study is 1.0 - 3.5 ppm.
Chronic data from early life stage of fish (fathead minnow) suggest that aquatic environmentshaving more than 0.04 ppm PBO may adversely affect reproductive capacity of freshwater fish. The LOEC = 0.11 ppm. The affected endpoint measured is embryo survival at hatch and growthlarval (total length and wet weight).
Freshwater invertebrates. Aquatic toxicity data suggest that PBO ranges from moderately toxic(LC50 = 12.0 ppm) to highly toxic (LC50 = 0.51 ppm) to freshwater invertebrates on an acutebasis. The species selected for RQ calculation is Daphnia magna with LC50 = 0.51 ppm (C.I. =0.430 - 0.627).
Chronic data from life cycle study of Daphnia magna suggest that aquatic environments havingmore than 0.030 ppm PBO may adversely affect reproduction of freshwater invertebrates. TheLOEC = 0.047 ppm.
Estuarine fish. Aquatic toxicity data suggest that PBO is moderately toxic (LC50 = 3.94 ppm) tosheepshead minnow on an acute basis. The confidence interval is 2.97 - 5.24. There are nochronic data available for estuarine fish.
Estuarine invertebrate. Mysid shrimp study (core) suggest that PBO is highly toxic to estuarineinvertebrates (LC50 = 0.49 ppm). The 95% confidence interval is 0.41 and 0.61, and the slope ofthe concentration response curve is 4.7. The maximum toxicant concentration is 0.12 ppm. TheNo Observed Adverse Effect Concentration is 0.085 ppm. An oyster study showing a moresensitive toxicity is supplemental since the only control in this study had a solvent concentrationequal to that of the highest test concentration. It is not known whether the solvent exerted anyeffects on the oysters since no dilution control was included in the study design. Therefore, theEC50 toxicity value in the study may be either over-estimated or under-estimated. The EC50 =0.23 ppm (C.I. 0.197 - 0.264). The probit slope is 1.89 (C.I. 1.58 - 2.20). Therefore, it wasdecided to use the core shrimp study to represent estuarine invertebrates in the risk assessmentsince the shrimp study provides less uncertainty than the oyster study.
There are no chronic data available for estuarine invertebrates .

Page -26- Page 31 of239
2.4.2 Terrestrial Animals
Birds. Avian toxicity data suggest that PBO is practically nontoxic on an acute basis. There were no mortalities observed at the highest concentration tested for acute oral (2250mg/kg bw) and for the subacute dietary studies (5620 ppm). NOAEC levels were based on toxicsymptoms observed. Therefore, no attempt will be made to calculate RQ from the acute toxicitydata since an assumption is made that there will be minimal adverse acute effects to birds.
Chronic avian toxicity data from avian reproduction study suggest that avian food itemscontaining more than 300 ppm PBO residues may adversely affect avian reproduction. Theendpoints measured for reproductive effects in birds above 300 ppm (LOAEC = 1200 ppm) areadult and hatchling body weight and food consumption, number of eggs laid, number of eggscracked, and eggshell thickness.
Mammals. Mammalian toxicity data suggest that PBO is practically nontoxic on anacute basis. Mortalities were observed at higher concentrations. Therefore, RQ will becalculated based on the toxicity data provided (LD50 = 4570 mg/ kg bw).
Chronic mammalian toxicity data from a 2-generation rat reproductive study suggest mammalianfood items containing more than 1000 ppm (NOAEC = 89 mg/kg bw) PBO residues mayadversely affect mammalian reproduction. The endpoints measured for reproductive effects inmammals are decreased body weight gain (12%) in the mother and decreased body weight gainin pups (12%). The LOAEC = 5000 ppm (469 mg/kg bw).
Beneficial insects. Honey bee (Apis mellifera) toxicity data suggests that PBO ispractically nontoxic to honey bee on an acute oral basis. The LD50 > 25 µg/bee. Due to theuncertainty of estimating environmental exposure to the honey bee, there will be no attempt tocalculate an RQ. The toxicity data will be used for labeling purposes (Appendix C).
2.5 Incident Data Review
Under FIFRA, Section 6(a)2, registrants must report to EPA any reports of adverse incidents thatthey may receive. According to the Ecological Incident Information System (EIIS) databasesummarizing 6(a)2 incident reports, for PBO, there are three terrestrial animals alleged incidents(bee, butterflies, and birds), seven alleged plant incidents (mostly ornamental flowers) and onealleged aquatic organisms incident (fish and invertebrates). They are all applied as co-formulatedsprays or mix-tanked mist blower with pyrethrins, pyrethroids or rotenone.
The incident reports are summarized below:
2.5.1 Aquatic organisms incidents
After spray of SCOURGE ® (18% resmethrin, 54% PBO) in the mosquito control program, hundreds of dead baby flounders, flukes, grass shrimps and mud crabs were found. However, the

Page -27- Page 32 of239
incident was considered as potential misuse since aerial application was made near a water’sedge. Master label does not have buffer zone (I012536-001).
2.5.2 Terrestrial animals incidents
One incident involves 1000 to 10,000 butterflies (mostly Monarchs) after spraying Biomist(containing piperonyl butoxide plus permethrin) for mosquito abatement. This is the only case ofall reported incidents that had chemical confirmation. Mortality is more likely attributed toinsecticides rather than synergist (I011527-001). Another incident report (I012515-004) involvesalleged apiary damage (bee kills) due to spray of Biomist ®. In one alleged incident (I009311-001), several mortalities of swan and geese were reported after spray of Prentox PrenfishToxicant (rotenone plus PBO).
2.5.3 Phytotoxicity incidents
a). The insecticide Biomist ® (30+30 ULV), for mosquito control, allegedly damaged nativeunknown tropical plant exhibiting burn spot, yellowing leaves, and defoliation. It wasmentioned that plants may have been suffering from chronic nutrient deficiency (I012515-002).
b).After spraying of Tomato and Vegetable Insect Killer, which contains Pyrethrin I and PBO, observations were made of deaths of 12 out of 14 roses, a few snapdragons, about dozen ofsunflowers, and several other flowers in the flower gardens. Being a synergist, EFED does notrequire phytotoxicity data, but the registrant settled the claim for $ 80 (I009262-001).
c). Pyrenone Crop Spray ® (pyrethrin plus PBO) allegedly damaged 10,000 peppers in thegreenhouse (I007155 - 181).
d). Application of Rose Pride Rose and Flower insect killer (pyrethrin + PBO) alleged to havecaused dead roses (I008693-047), dead ornamental trees (I010017-017), dead unknown plants,magnitude and location also unknown (I008693-046), and damaged 6 or 7 roses, turned brown(I009916-023) .
2.6 Summary of Incidents - EFED can not attribute any of the incidents to PBO by itself since asan insecticide synergist, it is never used by itself but always with another insecticide. However,the incidents do show that PBO in conjunction with an insecticide has the potential to causeadverse effects to aquatic ecosystems and among beneficial insect populations.

Page -28- Page 33 of239
3. Risk Characterization
3.1 Risk Estimation.
3.1.1. Terrestrial Ecosystems.
Since PBO is practically non-toxic to birds and no mortality was observed at the highestconcentrations, no RQ calculation is necessary. The Agency’s Level of Concern (LOC) is notexceeded for acute risk to birds.
Chronic risk quotients for birds (as represented by mallard duck and bobwhite quail) are given inTable 8a. The EEC are based on an application rate of 0.5 lb ai/A applied ten times during aseason at 3-day intervals between applications. All of the calculations can be found inAppendix D.
Table 8a. Chronic Risk Quotients for Birds Diets Maximum Kenaga Mean Kenaga
EEC RQ EEC RQ
Short grass 932 3.1 330 1.1
Tall grass 427 1.4 140 0.5
Broadleaf plants/sm insects 524 1.8 17 0.6
Fruits/pod/lg insects 58 <1 27 0.1RQs in Bold indicate that the Agency’s LOC for chronic risk is exceeded.
Acute risk quotients for mammals (Dose based RQ) are given in Table 8b. The EECs(maximums) are from Table 8a. All of the RQs using mean Kenaga EEC values are below theLOC for listed species. Only the maximum EECs were used in Table 8b.
Table 8b. Acute Risk Quotients for MammalsDiets 15-gram mammal 35-gram mammal 1000-gram mammal
Short grass <0.1 <0.1 <0.1
Tall grass <0.1 <0.1 <0.1
Broadleaf plants/sm insects <0.1 <0.1 <0.1
Fruits/pod/lg insects <0.1 <0.1 <0.1 LOC for listed species = 0.1
Chronic risk quotients for mammals (dose-based RQ) are given in Table 8c (Maximum KenagaEEC) and 8d (Mean Kenaga EEC). The EECs are from Table 8a.

Page -29- Page 34 of239
Table 8c. Chronic Risk Quotients for Mammals from Maximum Kenaga EECDiets 15-gram mammal 35-gram mammal 1000-gram mammal
Short grass 4.5* 3.9* 2.0*
Tall grass 2.1* 1.8* <1.0
Broadleaf plants/sm insects 2.6* 2.2* 1.2*
Fruits/pod/lg insects <1.0 <1.0 <1.0 * indicate that the Agency’s LOC for chronic risk is exceeded.
Table 8d. Chronic Risk Quotients for Mammals from Mean Kenaga EECDiets 15-gram mammal 35-gram mammal 1000-gram mammal
Short grass 1.6* 1.4* <1.0
Tall grass <1.0 <1.0 <1.0
Broadleaf plants/sm insects <1.0 <1.0 <1.0
Fruits/pod/lg insects <1.0 <1.0 <1.0 * indicate that the Agency’s LOC for chronic risk is exceeded.
3.1.2. Aquatic Ecosystems.
The following acute and chronic risk quotients were calculated.
Table 9a Acute RQ for freshwater organisms for Ten Aerial Applications at Maximum Rate and Minimum Interval
Scenario Freshwater InvertebrateLC50 = 510 ppb
Freshwater FishLC50 = 1900 ppb
FreshwaterAmphibian LC50 = 210 ppb
EstuarineInvertebrateLC50 = 490 ppb
Estuarine Fish LC50 = 3940 ppb
CA citrus 0.06 * < 0.05 0.14 ** 0.06 * < 0.05
CA lettuce 0.21 ** 0.056 * 0.51 *** 0.22 ** < 0.05
CA grapes < 0.05 < 0.05 0.11 ** < 0.05 < 0.05
CA sugar-beets
0.07 * < 0.05 0.16 ** 0.07 * < 0.05
CA tomato < 0.05 < 0.05 0.12 ** 0.05 * < 0.05
FLcabbage
0.14 ** < 0.05 0.35 ** 0.15 ** < 0.05
FL citrus 0.11 ** < 0.05 0.28 ** 0.12 ** < 0.05
FLcucumber
0.17 ** < 0.05 0.41 ** 0.17 ** < 0.05

Page -30- Page 35 of239
FL pepper 0.31 ** 0.08 * 0.76 *** 0.33 ** < 0.05
FLstrawberry
0.20 ** 0.055 * 0.50 *** 0.21 ** < 0.05
FL tomato 0.17 ** < 0.05 0.41 ** 0.18 ** < 0.05
FL turf 0.08 * < 0.05 0.19 ** 0.08 * < 0.05
ID potato 0.06 * < 0.05 0.14 ** 0.06 * < 0.05
ME potato 0.17 ** < 0.05 0.42 ** 0.18 ** < 0.05
MI beans 0.26 ** 0.07 * 0.63 *** 0.27 ** < 0.05
MNsugarbeet
0.15 ** < 0.05 0.37 ** 0.16 ** < 0.05
MS cotton 0.26 ** 0.07 * 0.62 *** 0.27 ** < 0.05
NC cotton 0.19 ** 0.052 * 0.47 ** 0.20 ** < 0.05
OR berries 0.054 * < 0.05 0.13 ** 0.06 * < 0.05
ORsnbeans
0.15 ** < 0.05 0.37 ** 0.16 ** < 0.05
PA tomato 0.14 ** < 0.05 0.34 ** 0.15 ** < 0.05
PA turf 0.08 * < 0.05 0.19 ** 0.08 * < 0.05
TX cotton 0.20 ** 0.053 * 0.48 ** 0.21 ** < 0.05Key: * Exceeds Acute Listed Species LOC (RQ = 0.05)
** Exceeds Acute Restricted Use LOC (RQ = 0.1)*** Exceeds Acute High Risk LOC (RQ = 0.5)
Table 9b. Acute RQ for Freshwater Organisms for Ten Ground Applications at MaximumRate and Minimum Intervals
Scenario Freshwater InvertebrateLC50 = 510 ppb
FreshwaterFish LC50 =1900 ppb
FreshwaterAmphibian LC50 = 210 ppb
EstuarineInvertebrateLC50 = 490 ppb
Estuarine Fish LC50 = 3940ppb
CA citrus < 0.05 < 0.05 0.085 * < 0.05 < 0.05
CA lettuce 0.20 ** 0.054 * 0.49 ** 0.21 ** < 0.05
CA grapes < 0.05 < 0.05 < 0.05 < 0.05 < 0.05
CA sugarbeets < 0.05 < 0.05 0.10 ** < 0.05 < 0.05
CA tomato < 0.05 < 0.05 0.063 * < 0.05 < 0.05
FL cabbage 0.13 ** < 0.05 0.31 ** 0.13 ** < 0.05
FL citrus 0.095 * < 0.05 0.23 ** 0.10 ** < 0.05

Page -31- Page 36 of239
FL cucumber 0.15 ** < 0.05 0.37 ** 0.16 ** < 0.05
FL pepper 0.31 ** 0.084 * 0.76 *** 0.32 ** < 0.05
FL strawberry 0.19 ** 0.051 * 0.46 ** 0.20 ** < 0.05
FL tomato 0.16 ** < 0.05 0.39 ** 0.17 ** < 0.05
FL turf 0.057 * < 0.05 0.14 ** 0.06 * < 0.05
ID potato < 0.05 < 0.05 0.064 * < 0.05 < 0.05
ME potato 0.14 ** < 0.05 0.35 ** 0.15 ** < 0.05
MI beans 0.23 ** 0.063 * 0.57 *** 0.24 ** < 0.05
MN sugarbeet 0.13 ** < 0.05 0.31 ** 0.13 ** < 0.05
MS cotton 0.25 ** 0.068 * 0.62 *** 0.27 ** < 0.05
NC cotton 0.17 ** < 0.05 0.42 ** 0.18 ** < 0.05
OR berries < 0.05 < 0.05 0.051 * < 0.05 < 0.05
OR snbeans 0.14 ** < 0.05 0.33 ** 0.14 ** < 0.05
PA tomato 0.11 ** < 0.05 0.28 ** 0.12 ** < 0.05
PA turf 0.050 * < 0.05 0.12 ** 0.05 * < 0.05
TX cotton 0.18 ** < 0.05 0.44 ** 0.19 ** < 0.05Key: * Exceeds Acute Listed Species LOC (RQ = 0.05)
** Exceeds Acute Restricted Use LOC (RQ = 0.1)*** Exceeds Acute High Risk LOC (RQ = 0.5)
Table 9C. Chronic RQ for Freshwater Organisms for Ten Aerial Applications at MaximumRate and Minimum Interval
Scenario Freshwater Invertebrate 21-dayNOEC = 30 ppb
Freshwater Fish NOEC = 40 ppb(calc vs 60-d)
CA citrus < 1 < 1
CA lettuce 3.4 * 2.3 *
CA grapes < 1 < 1
CA sugarbeets 1.1 * < 1
CA tomato < 1 < 1
FL cabbage 2.3 * 1.4 *
FL citrus 1.8 * 1.2 *

Page -32- Page 37 of239
FL cucumber 2.6 * 1.7 *
FL pepper 5.1 * 3.6 *
FL strawberry 3.2 * 2.3 *
FL tomato 2.7 * 1.8 *
FL turf 1.2 * < 1
ID potato < 1 < 1
ME potato 2.9 * 2.1 *
MI beans 4.2 * 3.1 *
MN sugarbeet 2.5 * 1.7 *
MS cotton 4.2 * 3.1 *
NC cotton 3.1 * 2.2 *
OR berries < 1 < 1
OR snbeans 2.5 * 1.8 *
PA tomato 2.2 * 1.5 *
PA turf 1.2 * < 1
TX cotton 3.1 * 2.1 *Key: * Exceeds Chronic Level of Concern (RQ = 1)
Table 9D: Chronic RQ for freshwater organisms for Ten Ground Applications at Maximum Rateand Minimum Interval
Scenario Freshwater Invertebrate 21-dayNOEC = 30 ppb (Daphniamagna)
Freshwater Fish NOEC = 40 ppb(calc vs 60-d) (Fathead minnow)
CA citrus < 1 < 1
CA lettuce 3.3 * 2.2 *
CA grapes < 1 < 1
CA sugarbeets < 1 < 1
CA tomato < 1 < 1
FL cabbage 2.1 * 1.2 *
FL citrus 1.5 * 1.1 *
FL cucumber 2.4 * 1.5 *
FL pepper 5.1 * 3.5 *

Page -33- Page 38 of239
FL strawberry 3.0 * 2.1 *
FL tomato 2.5 * 1.7 *
FL turf < 1 < 1
ID potato < 1 < 1
ME potato 2.4 * 1.8 *
MI beans 3.8 * 2.8 *
MN sugarbeet 2.0 * 1.4 *
MS cotton 4.2 * 3.1 *
NC cotton 2.8 * 2.0 *
OR berries < 1 < 1
OR snbeans 2.3 * 1.6 *
PA tomato 1.8 * 1.2 *
PA turf < 1 < 1
TX cotton 2.9 * 1.9 *Key: * Exceeds Chronic Level of Concern (RQ = 1)
Table 9E Acute RQ for Mosquito Abatement and Drift Exposure ScenariosScenario Freshwater
InvertebrateLC50 = 510 ppb
Freshwater FishLC50 = 1900ppb
FreshwaterAmphibian LC50 = 210 ppb
EstuarineInvertebrateLC50 = 490 ppb
Estuarine Fish LC50 = 2340ppb
Mosquitoabatement(Interim Ricemodel) EEC =75 ppb
0.15 ** < 0.05 0.36 ** 0.15 ** < 0.05
AgDrift GroundSpray (Pond)EEC = 1.7 ppb
< 0.05 < 0.05 < 0.05 < 0.05 < 0.05
AgDrift GroundSpray(Wetland)EEC= 23 ppb
< 0.05 < 0.05 0.11 ** < 0.05 < 0.05
AgDrift AerialSpray (Pond)EEC = 6.8 ppb
< 0.05 < 0.05 < 0.05 < 0.05 < 0.05

Page -34- Page 39 of239
AgDrift AerialSpray(Wetland)EEC = 90.6 ppb
0.18 ** 0.05 * 0.43 ** 0.18 ** < 0.05
Key: * Exceeds Acute Listed Species LOC (RQ = 0.05)** Exceeds Acute Restricted Use LOC (RQ = 0.1)*** Exceeds Acute High Risk LOC (RQ = 0.5)
3.2. Risk Description.
3.2.1 General description
Piperonyl butoxide is a synergist for pyrethrin and pyrethroid insecticides. It is often used incombination with another synergist, MGK-264. This enables the same degree of insect pestcontrol to be achieved with a lower application rate of the synergized insecticide.
Because PBO is never used alone, its adverse effects must be considered in light of the otheractive ingredients used. Generally speaking, PBO is less toxic to the species of concern forpyrethrins and pyrethroids (aquatic invertebrates). However, the effect of PBO (blocking de-toxifying enzymes in invertebrates) makes a given dose of pyrethrin/pyrethroid more toxic. Thissynergistic effect, by the same token, allows less pyrethrin/pyrethroid to be used to achieve adesired level of insect pest control. Thus, should the PBO and pyrethrin/pyrethroid becomeseparated by fate processes (such as their widely different solubilities), then the lower amount ofpyrethrin/pyrethroid used may cause fewer adverse effects. If, however, invertebrates areexposed to both active ingredients (PBO and pyrethrin/pyrethroid) simultaneously, then there isa potential for greater adverse effects than if exposure was to the pyrethrin/pyrethroid alone.
The risks deemed to be of concern in this assessment include acute toxicity (death, orimmobilization followed by predation) in freshwater fish, invertebrates and amphibians,estuarine invertebrates and fish; and chronic effects, including reproductive effects in birds,mammals, and freshwater fish and invertebrates. The specific LOC exceedences are listedbelow.
3.2.1.1 Mammals
Using the maximum Kenaga residue EEC, there are no mammalian Listed Species acute LOCexceedances. Chronic LOCs are exceeded for all mammal weight classes except for thoseanimals that only consume the fruit/pods/large insects food category. The range of chronic RQsis from 4.5 to 1.8 .
Using the mean Kenaga residue EEC, there are no mammalian Listed Species acute LOCexceedances. Chronic LOCs are exceeded for only 15-gram and 35-gram mammal weightclasses that only consume short grass food category. The range of chronic RQs is from 1.6 to1.4.

Page -35- Page 40 of239
3.2.1.2 Birds
Using the maximum Kenaga residue EEC, there are no avian Listed Species acute LOCexceedances. Chronic LOCs are exceeded for those birds that only consume all plant food itemgroups except the fruit/pods/large insects food category. The range of Chronic RQs is from 3.1to 1.4.
Using the mean Kenaga residue EEC, there are no avian Listed Species acute LOCexceedances. Chronic LOCs are exceeded for only birds that consume short grass food category. The Chronic RQs is 1.1
3.2.1.3 Freshwater Invertebrates
Acute risk. Twenty-three PRZM scenarios were modeled to determine EECs. RQ values foraerial spraying exceeded the Listed Species LOC (RQ = 0.05) was exceeded in 21 PRZMscenarios for aerial spraying. Fifteen PRZM scenarios also exceeded the Restricted Use LOC(RQ = 0.1). No acute risk LOC was exceeded. For ground spraying, 17 freshwater invertebratesListed Species LOC (RQ = 0.05) were exceeded. Fourteen PRZM scenarios also exceeded theRestricted Use LOC (RQ = 0.1). No acute risk LOC was exceeded. Two mosquito use (InterimRice model) or AgDrift scenarios exceeded any Listed Species and restricted use LOCs. Themaximum range of RQ is from 0.31 to <0.05.
Chronic Risk. The chronic risk LOC (RQ = 1) was exceeded for 18 PRZM scenarios (aerialspray) and 15 scenarios (ground spray). The maximum range of RQ is from 5.1 to <1.0.
3.2.1.4 Freshwater Fish
Acute Risk. The freshwater fish Listed Species LOC (RQ = 0.05) was exceeded in 6 PRZMscenarios for aerial spraying. There are no PRZM scenarios exceeded the Restricted Use LOC(RQ = 0.1). For ground spraying, 5 freshwater fish Listed Species LOC (RQ = 0.05) wereexceeded. There are no PRZM scenarios exceeded the Restricted Use LOC (RQ = 0.1). There isno mosquito use (Interim Rice model) or AgDrift scenarios exceeded for any Listed SpeciesLOCs. The maximum range of RQ is from 0.08 to <0.05.
Chronic Risk. The Chronic Risk LOC (RQ = 1) was exceeded for 15 of 23 PRZM scenarios, forboth aerial and ground spraying. The maximum range of RQ is from 3.6 to <1.0.
3.2.1.5 Amphibians
Acute Risk. For aerial spraying, all 23 PRZM scenarios exceed the amphibian Listed SpeciesLOC (RQ = 0.05). Of these, 18 exceeded the Restricted use LOC (RQ = 0.1) and 5 exceeded theAcute Risk LOC (RQ = 0.5).
For ground spraying, 22 of 23 PRZM scenarios exceeded the Listed Species LOC (RQ = 0.05).

Page -36- Page 41 of239
Of these, 15 exceeded the Restricted Use LOC (RQ = 0.1) and 3 exceeded the Acute Risk LOC(RQ= 0.5).
Three mosquito use (Interim Rice model) or AgDrift scenarios exceeded any Listed Species andrestricted use LOCs.
The maximum range of RQ is from 0.76 to 1.1.
3.2.1.6 Estuarine/Marine Invertebrates
Acute Risk. For aerial spraying, 22 of the 23 PRZM scenarios exceed the estuarine/marineinvertebrate Listed Species LOC (RQ = 0.05). Of these, 15 exceed the Restricted Use LOC (RQ= 0.1) and none exceed the Acute Risk LOC (RQ = 0.5).
For ground spraying, 17 of the 23 PRZM scenarios exceeded the Listed Species LOC (RQ =0.05). Of these, 15 exceeded the Restricted Use LOC (RQ = 0.1) and none exceeded the AcuteRisk LOC (RQ = 0.5).
Two mosquito use (Interim Rice model) or AgDrift scenarios exceeded any Listed Species andrestricted use LOCs.
The maximum range of RQ is from 0.33 to <0.05.
3.2.1.7 Estuarine Fish
Acute Risk. No Listed Species LOC (RQ = 0.05) was exceeded for both aerial and groundspraying. No LOCs were exceeded for the mosquito use or AgDrift scenarios.
3.2.2 Alternative Application Scenarios
A question of what if one application input was changed, what would the RQs be like. EFEDdecided to change one of the three application inputs (rate of application, interval days, ornumber of applications per year) for exposure in order to access the difference in RQ. Below aretables showing such changes.
3.2.2.1 Terrestrial Scenarios
There are four scenarios - the maximum labeled application, only the application rate wasreduced to 0.25 lb ai/A from 0.5 lb ai/A, only the interval between application was changed fromthree days to 6 days, and only the number of applications per year was changed from 10applications to 5 applications per year. Since there was no acute LOC exceedances, only thechronic RQ was calculated using T-REX model v.1.1.

Page -37- Page 42 of239
Table 10a Mammalian Chronic Risk Quotients under alternative application inputs
Maximum LabeledApplication
Application rate of0.25 lb ai/A
Interval of 6 days 5 applications peryear
EEC RQ EEC RQ EEC RQ EEC RQ
Diets 15 g 35 g 15 g 35 g 15 g 35 g 15 g 35 g
Short grass 932 4.5* 3.9* 466 2.3*
1.9* 745 3.6* 3.1* 535 2.6* 2.2*
Tall grass 427 2.1* 1.8* 214 1.0* <1.0 341 1.7* 1.4* 245 1.2* 1.0*
Broadleaf plants,small insects
524 2.6* 2.2* 262 1.3* 1.1* 419 2.0* 1.8* 301 1.5* 1.3*
Fruits/pod/lginsects
58 <1.0 <1.0 29 <1.0 <1.0 47 <1.0 <1.0 33 <1.0 <1.0
Table 10b Avian Chronic Risk Quotients under alternative application inputs
max. applic. applic rate 0.25 lb ai/A
interval of 6 days 5 applic/yr
Diets EEC RQ EEC RQ EEC RQ EEC RQ
Short grass 932 3.9* 466 1.6* 745 2.5* 535 1.8*
Tall grass 427 1.8* 214 <1 341 1.1* 245 <1
Broadleaf plants/sm insects 524 2.2* 262 <1 419 1.4* 301 1.0*
Fruits/pod/lg insects 58 <1 29 <1 47 <1 33 <1Asterisks indicate that the Agency’s LOC for chronic risk is exceeded.
3.2.2.2 Aquatic Scenarios
There are 8 scenarios - the maximum labeled application, only the interval was changed from 3days to 6 days, only the interval was changed from 3 days to 10 days, only the one applicationrate at 0.5 lb ai/A, zero percent drift was put into the PRZM-EXAMS model, application ratewas reduced to 0.25 lb ai/A from 0.5 lb ai/A, and only the number of applications per year waschanged from 10 applications to 5 applications per year.

Page -38- Page 43 of239
Table 10c Aquatic Acute RQ with different application input scenarios
Use site = FL Pepper
Freshwater InvertebrateLC50 = 510 ppb
FreshwaterFish LC50= 1900 ppb
FreshwaterAmphibian LC50 = 210 ppb
EstuarineInvertebrateLC50 = 490 ppb
EstuarineFish LC50 =3940 ppb
Scenarios EEC1 RQ RQ RQ RQ RQ
max residues 160 0.31 ** 0.08 * 0.76 *** 0.33 ** < 0.05
6 day interval 154 0.30 ** 0.08 * 0.73 *** 0.31 ** < 0.05
10 day interval 110 0.22 ** 0.06 * 0.52 *** 0.22 ** < 0.05
1 application 14.8 < 0.05 < 0.05 0.07 * < 0.05 < 0.05
No drift 151 0.30 ** 0.08 * 0.72 *** 0.31 ** < 0.05
0.25 lb ai/Aapplication rate
79.9 0.16 ** < 0.05 0.38 ** 0.16 ** < 0.05
5 applications 89.4 0.18 ** < 0.05 0.43 ** 0.18 ** < 0.05
1 EEC used was peak EEC value in ppbKey: * Exceeds Acute Listed Species LOC (RQ = 0.05)
** Exceeds Acute Restricted Use LOC (RQ = 0.1)*** Exceeds Acute Risk LOC (RQ = 0.5)
Table 10d Aquatic Chronic RQ with different application input scenariosUse site = FL Pepper
Freshwater Invertebrate NOEC = 30 ppb
Freshwater Fish NOEC = 40 ppb
Scenarios EEC1 RQ EEC2 RQ
max residues 153 5.1 * 142 3.6 *
6 day interval 140 4.7* 120 3.5*
10 day interval 104 3.5* 90.6 2.3*
1 application 13.5 <1 12.2 <1
No drift 144 4.8* 132 3.3*
0.25 lb ai/A application rate 76.3 2.5* 71 1.8*
5 applications 82.0 2.7* 70.1 1.8*
1 EEC used was 21-day EEC value in ppb2 EEC used was 60-day EEC value in ppb* Asterisks indicate that the Agency’s LOC for chronic risk is exceeded.
A sensitivity analysis was conducted with the scenario that produced the highest EECs (Floridapeppers with aerial application). The EEC appears to be proportional to both the application rate(lb/acre) and the number of applications. A decrease from 0.5 lb/acre to 0.25 lb/acre decreasedthe EEC by about half. Similarly, a decrease in number of application from 10 to 5 decreasedthe EEC by about half.

Page -39- Page 44 of239
An increase in the application interval from 3 to 6 days had little effect on the EEC, butthe longer time averages dropped somewhat (21-day average from 153 ppb to 140, and 60-dayaverage from 142 ppb to 120). An increase to ten-day application intervals reduced the 21-dayaverage EEC to 104 ppb, and the 6-day average to 90.5 ppb. The relatively small changes intime-averaged concentrations versus changed application intervals are likely due to the largenumber of applications allowed (10).

Page -40- Page 45 of239
3.2.3 Summaries of Literature Sources
3.2.3.1 Insecticides Antagonized by Piperonyl Butoxide
Table 10. Insecticides Antagonized by Piperonyl ButoxideChemical (Class)CAS RN
Metabol-icallyactivated?
Antagon-ismobserved?
Organism(s) Reference
Azinphos-methyl (OP) Yes Yes Hyalella aztecaChironomus tentans
Ankley & Collyard(1995)
No Lumbriculus variegatus Ankley & Collyard(1995)
Carbofuran (carbamate) unknown No Ceriodaphnia dubia Bailey et al. (1995)
Chlorfenvinphos (OP)470-90-6
No No Ceriodaphnia dubiaDaphnia magnaDaphnia pulex
Ankley et al. (1991)
Chlorpyrifos (OP) Yes Yes Hyalella aztecaChironomus tentans
Ankley & Collyard(1995)
Yes Ceriodaphnia dubia Bailey et al. (1995)
No Lumbriculus variegatus Ankley & Collyard(1995)
Diazinon (OP)333-41-5
Yes Yes Hyalella aztecaChironomus tentans
Ankley & Collyard(1995)
No Lumbriculus variegatus Ankley & Collyard(1995)
Yes Ceriodaphnia dubiaDaphnia magnaDaphnia pulex
Ankley et al. (1991)
Yes Ceriodaphnia dubia Bailey et al. (1995)
YesPenaeus japonicus
Kobayashi et al.(1993a, 1993b)
Dichlorvos (OP)62-73-7
No No Hyalella aztecaChironomus tentansLumbriculus variegatus
Ankley & Collyard(1995)
No Ceriodaphnia dubiaDaphnia magnaDaphnia pulex
Ankley et al. (1991)
NoPenaeus japonicus
Kobayashi et al.(1993a, 1993b)

Chemical (Class)CAS RN
Metabol-icallyactivated?
Antagon-ismobserved?
Organism(s) Reference
Page -41- Page 46 of239
Dioxabenzophos (OP)3811-49-2
Yes YesPenaeus japonicus
Kobayashi et al.(1993a, 1993b)
Fenitrothion (OP)122-14-5
Yes YesPenaeus japonicus
Penaeus paucidens
Kobayashi et al.(1993a, 1993b)
Malathion (OP)121-75-5
Yes Yes Ceriodaphnia dubiaDaphnia magnaDaphnia pulex
Ankley et al. (1991)
Yes Kuruma prawn(Penaeus japonicus)
Kobayashi et al.(1993a, 1993b)
YesOreochromis niloticus
Pathiratne & George(1998)
Mevinphos (OP)7786-34-7
No No Ceriodaphnia dubiaDaphnia magnaDaphnia pulex
Ankley et al. (1991)
Methyl parathion (OP) 298-00-0
Yes Yes Ceriodaphnia dubiaDaphnia magnaDaphnia pulex
Ankley et al. (1991)
Parathion (OP)56-38-2
Yes Yes Ceriodaphnia dubiaDaphnia magnaDaphnia pulex
Ankley et al. (1991)
Phenthoate (OP)2597-03-7
Yes YesPenaeus japonicus
Kobayashi et al.(1993a, 1993b)
3.2.3.2 Antagonistic Effects with Organophosphorous Insecticides
Table 10 lists 12 organophosphate (OP) insecticides and one carbamate insecticide thathave been tested for PBO antagonism, that is, whether they are made less toxic by simultaneousexposure to PBO.
Nine OP insecticides (azinphos-methyl, chlorpyrifos, diazinon, dioxabenzophos,fenitrothion, malathion, methyl parathion, parathion, and phenthoate) that require metabolicactivation (for example, oxidation of a -P=S thion group to a -P=O oxon group by cytochrome
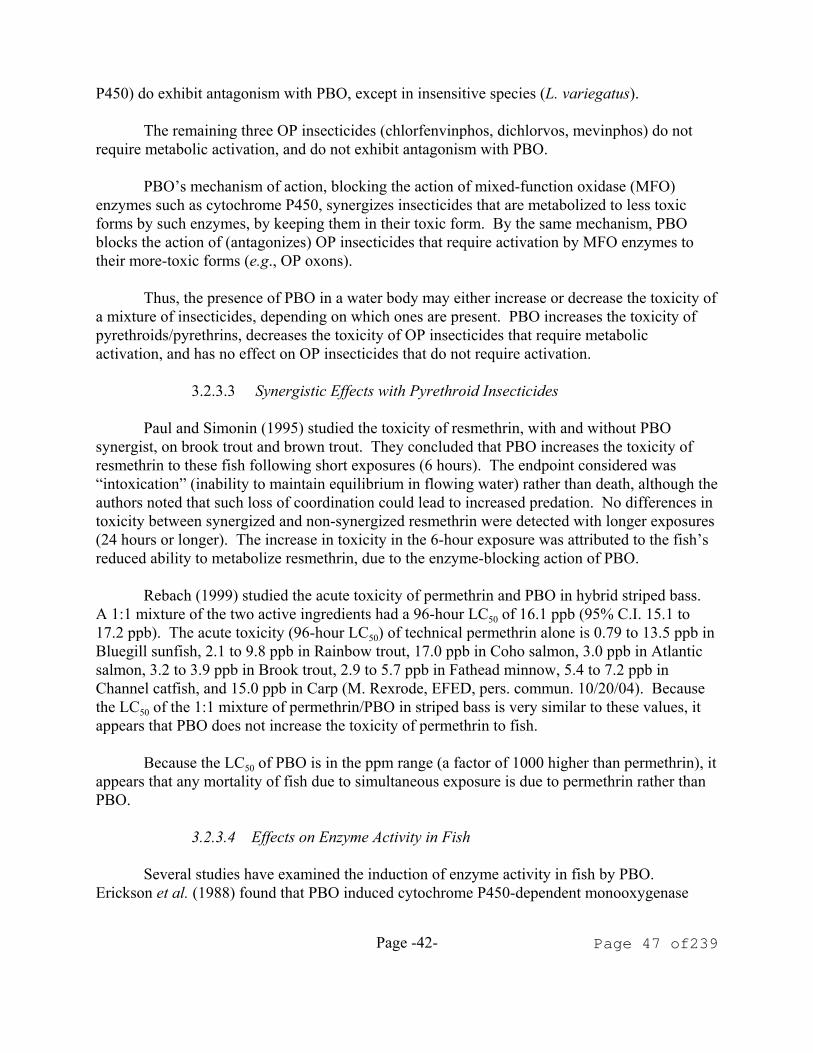
Page -42- Page 47 of239
P450) do exhibit antagonism with PBO, except in insensitive species (L. variegatus).
The remaining three OP insecticides (chlorfenvinphos, dichlorvos, mevinphos) do notrequire metabolic activation, and do not exhibit antagonism with PBO.
PBO’s mechanism of action, blocking the action of mixed-function oxidase (MFO)enzymes such as cytochrome P450, synergizes insecticides that are metabolized to less toxicforms by such enzymes, by keeping them in their toxic form. By the same mechanism, PBOblocks the action of (antagonizes) OP insecticides that require activation by MFO enzymes totheir more-toxic forms (e.g., OP oxons).
Thus, the presence of PBO in a water body may either increase or decrease the toxicity ofa mixture of insecticides, depending on which ones are present. PBO increases the toxicity ofpyrethroids/pyrethrins, decreases the toxicity of OP insecticides that require metabolicactivation, and has no effect on OP insecticides that do not require activation.
3.2.3.3 Synergistic Effects with Pyrethroid Insecticides
Paul and Simonin (1995) studied the toxicity of resmethrin, with and without PBOsynergist, on brook trout and brown trout. They concluded that PBO increases the toxicity ofresmethrin to these fish following short exposures (6 hours). The endpoint considered was“intoxication” (inability to maintain equilibrium in flowing water) rather than death, although theauthors noted that such loss of coordination could lead to increased predation. No differences intoxicity between synergized and non-synergized resmethrin were detected with longer exposures(24 hours or longer). The increase in toxicity in the 6-hour exposure was attributed to the fish’sreduced ability to metabolize resmethrin, due to the enzyme-blocking action of PBO.
Rebach (1999) studied the acute toxicity of permethrin and PBO in hybrid striped bass. A 1:1 mixture of the two active ingredients had a 96-hour LC50 of 16.1 ppb (95% C.I. 15.1 to17.2 ppb). The acute toxicity (96-hour LC50) of technical permethrin alone is 0.79 to 13.5 ppb inBluegill sunfish, 2.1 to 9.8 ppb in Rainbow trout, 17.0 ppb in Coho salmon, 3.0 ppb in Atlanticsalmon, 3.2 to 3.9 ppb in Brook trout, 2.9 to 5.7 ppb in Fathead minnow, 5.4 to 7.2 ppb inChannel catfish, and 15.0 ppb in Carp (M. Rexrode, EFED, pers. commun. 10/20/04). Becausethe LC50 of the 1:1 mixture of permethrin/PBO in striped bass is very similar to these values, itappears that PBO does not increase the toxicity of permethrin to fish.
Because the LC50 of PBO is in the ppm range (a factor of 1000 higher than permethrin), itappears that any mortality of fish due to simultaneous exposure is due to permethrin rather thanPBO.
3.2.3.4 Effects on Enzyme Activity in Fish
Several studies have examined the induction of enzyme activity in fish by PBO. Erickson et al. (1988) found that PBO induced cytochrome P450-dependent monooxygenase

Page -43- Page 48 of239
activity in hepatic microsomes of rainbow trout after static exposure to 1 ppm for 24 hours. Grosvik et al. (1996) found increased cytochrome P4501A (CYP1A) activity in the liver afterintraperitoneal injection in Atlantic salmon. Pathiratne and George (1998) however, did not findevidence that PBO antagonism of malathion activity in Nile tilapia fish was associated withcytochrome P450 (CYP1, CYP2B or CYP3A) activity.
3.2.4. Endocrine Disruption.
EPA is required under the FFDCA, as amended by FQPA, to develop a screening program todetermine whether certain substances (including all pesticide active and other ingredients) "mayhave an effect in humans that is similar to an effect produced by a naturally occurring estrogen,or other such endocrine effects as the Administrator may designate." Following therecommendations of its Endocrine Disruptor Screening and Testing Advisory Committee(EDSTAC), EPA determined that there was scientific bases for including, as part of the program,the androgen and thyroid hormone systems, in addition to the estrogen hormone system. EPAalso adopted EDSTAC’s recommendation that the Program include evaluations of potentialeffects in wildlife. For pesticide chemicals, EPA will use FIFRA and, to the extent that effects inwildlife may help determine whether a substance may have an effect in humans, FFDCAauthority to require the wildlife evaluations. As the science develops and resources allow,screening of additional hormone systems may be added to the Endocrine Disruptor ScreeningProgram (EDSP). When the appropriate screening and/or testing protocols being consideredunder the Agency’s EDSP have been developed, PBO may be subjected to additional screeningand/or testing to better characterize effects related to endocrine disruption. In the available toxicity studies on piperonyl butoxide, an avian reproduction study shows thatPBO may cause decreases in adult and hatchling body weight and food consumption, number ofeggs laid, and eggshell thickness. In addition, PBO may cause increases in number of eggscracked.
3.2.5 Organisms at Risk
3.2.5.1 Aquatic Animals
In the aquatic ecosystem, the group of organisms most at risk from exposure to PBO isamphibians, followed by freshwater invertebrates and estuarine invertebrates. There appears tobe greater risk to aquatic organisms from aerial application than ground application. However,the difference of risk between aerial application and ground application is not very great. Acuterisk RQ is no higher than 0.76 for any aquatic organism. Freshwater and estuarine fish seem tohave the least amount of risk from exposure to PBO only listed species LOC exceeded forfreshwater fish.
The highest calculated exposures (EECs > 100 ppb for aerial application) were for the followingcrop scenarios: CA lettuce, FL peppers and strawberries, MI beans, and MS and TX cotton.

Page -44- Page 49 of239
These scenarios represent the following crop categories from the Master Label, as shown inTable I. CA lettuce represents crop group 4, Leafy Vegetables. MI beans represents crop groups6 and 7, Legume Vegetables and Foliage of Legume Vegetables. FL peppers represent cropgroup 8, Fruiting Vegetables, except Cucurbits. The remaining scenarios (FL strawberry andMS and TX cotton) are from the Master Labels’s Miscellaneous category.
The next highest group of exposures (EECs 50 to 99 ppb) includes ME potatoes and MNsugarbeets (crop groups 1 and 2, Root and Tuber Vegetables and Leaves of Root and TuberVegetables), FL cabbage (crop group 5, Brassica vegetables), OR snap beans (again representingcrop groups 6 and 7, like MI beans), FL and PA tomatoes (crop group 8, like FL pepper), FLcucumbers (crop group 9, Cucurbit vegetables), FL citrus (crop group 10, Citrus fruits), and NCcotton (Miscellaneous). The only crop group that did not have an EEC above 50 ppb was 13 (Berries, a category of ninecrops represented only by OR berries).
The greater concern seems to be in chronic risk to aquatic organisms. The chronic RQ are nohigher than 5.1. Freshwater invertebrates (RQ = 5.1) are more at risk than freshwater fish (RQ =3.6). There are no data available to ascertain chronic risk to estuarine species.
3.2.5.2 Terrestrial Animals
There is no acute risk to terrestrial animals including listed species. Chronic risk has beenidentified to birds and mammals. Chronic RQ to mammals range from 4.5 to 1.8 usingmaximum EEC. Chronic risk to birds range from 3.1 to 1.4. Using the mean Kenaga EEC, theRQ drops almost drastically with a range of 1.6 to 1.4 and on only two food item groups for onlyvery small mammals. The avian RQ drops to 1.1 for only short grass diet.
3.2.6 Description of Assumptions, Uncertainties, Strengths, and Limitations
3.2.6.1 Fate and Exposure
Limitations in fate data available for this assessment create uncertainties in the conclusions. Forexample, there were only single studies for aerobic soil metabolism, and anaerobic aqueousmetabolism, so variability in the degradation rate of PBO in different soils and water-sedimentsystems could not be addressed. Likewise, the result of the soil photolysis experiment wasambiguous, so the importance of this fate process is not well understood. Aqueous photolysisappears to be a dominant process, from the point of view of its relatively large reaction rateconstant, but the important of photolysis in murky or deeper waters is likely smaller.
Volatilization from soil surfaces was not considered in the PRZM-EXAMS modeling, due topending corrections to the volatilization routines in PRZM version 3.12 beta. The Henry’s Law

Page -45- Page 50 of239
constant of parent PBO was used in the PRZM-EXAMS modeling, which likely overestimatesthe volatilization of the major degradates (PBO-alcohol, PBO-aldehyde, and PBO-acid) inEXAMS, since they are more water-soluble than the parent. The vapor pressure of the parentPBO at 25oC had to be estimated from data at higher temperatures in order to calculate theHenry’s Constant. See Appendix B for details.
The usual assumptions in the aquatic and estuarine-marine exposure assessment apply, and resultin a conservative estimate of exposure. These include yearly use for 30 years at the maximumlabel rate and minimum application interval; the assumption of use in 100% of the watershed;and the assumption of constant water volume in the standard farm pond. These last assumptionsmay not represent estuarine systems that are subject to tidal flushing very well.
A default half-life of 35 days on foliage was used in the terrestrial assessment (Hoerger-Kenaganomogram analysis). The relatively quick aqueous photolysis of PBO (total residues half-life of5 days) suggests that 35 days may be too conservative.
3.2.6.2 Slope Probit Analysis
It should be noted that the estimate of the probability of affecting an individual non-targetorganism, for example with an aquatic invertebrate, is based on an assumption of a probit dose-response relationship with a mean estimated slope of 5.33 for piperonyl butoxide but that probitslope data for the piperonyl butoxide toxicity test ranged from 3.24 to 7.42. It is recognized thatextrapolation of very low probability events is associated with considerable uncertainty in theresulting estimates and the range of reported slopes increases the uncertainty. To explorepossible bounds to such estimates, the upper and lower values (3.24 and 7.42) for the range ofslope estimates from avian tests were used to calculate upper and lower estimates of the effectsprobability associated with the listed species LOC. At a slope of 3.24, there is a one in 1.25x10⁵
probability of an individual being killed, and for a slope of 7.42, a one in 1 x 10¹⁶ probability ofan individual being killed. In addition to noting the relatively large uncertainty bounds aroundthe probabilities, care should be employed in interpreting these probabilities beyond theirintended purpose as an indication of a margin of safety, or lack there of, for the listed speciesrisk estimates based on the quotient model.
3.2.6.3 Location of Wildlife Species
For screening terrestrial risk assessments for listed species, a generic bird or mammal is assumedto occupy either the treated field or adjacent areas receiving pesticide at a rate commensuratewith the treatment rate on the field. Spray drift model predictions suggest that this assumptionleads to an overestimation of exposure to species that do not occupy the treated field. Forscreening risk assessment purposes, the actual habitat requirements of any particular terrestrialspecies are not considered, and it assumed that species occupy, exclusively and permanently, thetreated area being modeled. This assumption leads to a maximum level of exposure in the riskcharacterization.

Page -46- Page 51 of239
Terrestrial EECs are based on the peak value from the Hoerger-Kenaga nomogram (1973), asmodified by Fletcher et al. (1994). The residues from the Hoerger-Kenaga nomogram areestimated immediately after application. The peak maximum value is the upper limit value andmay be conservative. PBO is applied to plants throughout the season when large amounts offoliage are present. The LOC for avian reproductive impairment is exceeded for PBO applicationand, based on this timing information, it is apparent that wildlife will be present in the fieldsduring the period of application.
A variety of avian populations are nested in cotton, potato, and Brassica fields among manyother various fields. The application of PBO is expected to be outside and within thereproductive period of time. Therefore, it is assumed that avian exposure will occur during thereproductive period.
Small mammals also inhabit cotton, potato, alfalfa, and Brassica fields among many othervarious fields. Mammals may be exposed to PBO through food items in heavily vegetated fields, as well as around transitional areas around the fields that may receive PBO from spraydrift. There are several small mammals such as mice that breed throughout the summer. Thesemammals will also be exposed to PBO contaminated food items during their breeding andgestation period.
3.2.6.4 Routes of Exposure
Screening-level risk assessments for spray applications of pesticides consider dietary exposurealone. Other routes of exposure, not considered in this assessment, are discussed below:
• Incidental soil ingestion exposure - This risk assessment does not considerincidental soil ingestion. Available data suggest that up to 15% of the diet canconsist of incidentally ingested soil depending on the species and feeding strategy(Beyer et al., 1994).
• Inhalation exposure - The screening risk assessment does not consider inhalationexposure. Such exposure may occur through three potential sources: (1) spraymaterial in droplet form at the time of application (2) vapor phase pesticidevolatilizing from treated surfaces, and (3) airborne particulate (soil, vegetativematerial, and pesticide dusts).
• Dermal Exposure - The screening assessment does not consider dermal exposure,except as it is indirectly included in calculations of RQs based on lethal doses perunit of pesticide treated area. Dermal exposure may occur through three potentialsources: (1) direct application of spray to terrestrial wildlife in the treated area orwithin the drift footprint, (2) incidental contact with contaminated vegetation, or(3) contact with contaminated water or soil.
• Drinking Water Exposure - Drinking water exposure of terrestrial organisms to a

Page -47- Page 52 of239
pesticide active ingredient may be the result of consumption of surface water orconsumption of the pesticide in dew or other water on the surfaces of treatedvegetation. For pesticide active ingredients with a potential to dissolve in runoff,puddles on the treated field may contain the chemical.
3.2.6.5 Residue Levels Selection
As discussed earlier in the exposure section of this document, the Agency relies on the work ofFletcher et al. (1994) for setting the assumed pesticide residues in wildlife dietary items. TheAgency believes that these residue assumptions reflect a realistic upper-bound residue estimate,although the degree to which this assumption reflects a specific percentile estimate is difficult toquantify. It is important to note that the field measurement efforts used to develop the Fletcherestimates of exposure involve highly varied sampling techniques. It is entirely possible thatmuch of these data reflect residues averaged over entire above ground plants in the case of grassand forage sampling. Depending upon a specific wildlife species’ foraging habits, wholeaboveground plant samples may either underestimate or overestimate actual exposure.
3.2.6.6 Dietary Intake - Differences Between Laboratory and Field Conditions
The acute and chronic characterization of risk rely on comparisons of wildlife dietary residueswith LC50 or NOAEC values expressed in concentrations of pesticides in laboratory feed. Thesecomparisons assume that ingestion of food items in the field occurs at rates commensurate withthose in the laboratory. Although the screening assessment process adjusts dry-weight estimatesof food intake to reflect the increased mass in fresh-weight wildlife food intake estimates, it doesnot allow for gross energy and assimilative efficiency differences between wildlife food itemsand laboratory feed.
On gross energy content alone, direct comparison of a laboratory dietary concentration-basedeffects threshold to a fresh-weight pesticide residue estimate would result in an underestimationof field exposure by food consumption by a factor of 1.25 - 2.5 for most food items. Only forseeds would the direct comparison of dietary threshold to residue estimate lead to anoverestimate of exposure.
Differences in assimilative efficiency between laboratory and wild diets suggest that currentscreening assessment methods do not account for a potentially important aspect of foodrequirements. Depending upon species and dietary matrix, bird assimilation of wild diet energyranges from 23 - 80%, and mammal’s assimilation ranges from 41 - 85% (U.S. EnvironmentalProtection Agency, 1993). If it is assumed that laboratory chow is formulated to maximizeassimilative efficiency (e.g., a value of 85%), a potential for underestimation of exposure mayexist by assuming that consumption of food in the wild is comparable with consumption duringlaboratory testing. In the screening process, exposure may be underestimated because metabolicrates are not related to food consumption.
Finally, the screening procedure does not account for situations where the feeding rate may be
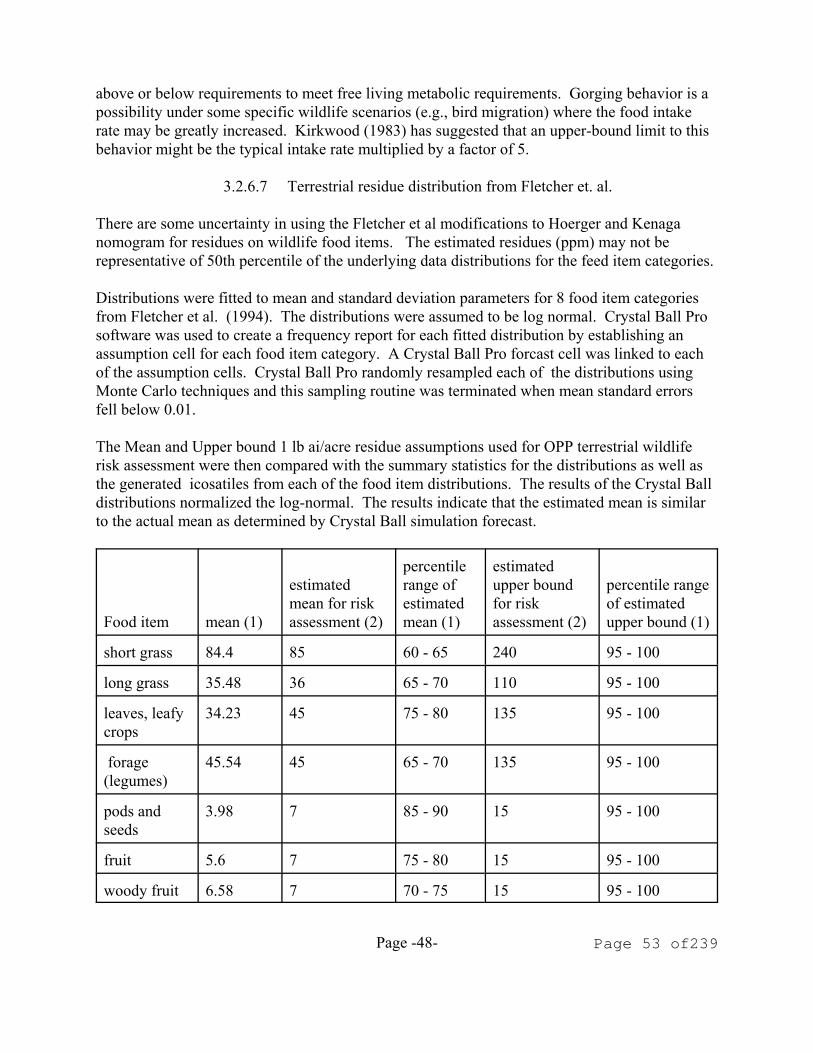
Page -48- Page 53 of239
above or below requirements to meet free living metabolic requirements. Gorging behavior is apossibility under some specific wildlife scenarios (e.g., bird migration) where the food intakerate may be greatly increased. Kirkwood (1983) has suggested that an upper-bound limit to thisbehavior might be the typical intake rate multiplied by a factor of 5.
3.2.6.7 Terrestrial residue distribution from Fletcher et. al.
There are some uncertainty in using the Fletcher et al modifications to Hoerger and Kenaganomogram for residues on wildlife food items. The estimated residues (ppm) may not berepresentative of 50th percentile of the underlying data distributions for the feed item categories.
Distributions were fitted to mean and standard deviation parameters for 8 food item categoriesfrom Fletcher et al. (1994). The distributions were assumed to be log normal. Crystal Ball Prosoftware was used to create a frequency report for each fitted distribution by establishing anassumption cell for each food item category. A Crystal Ball Pro forcast cell was linked to eachof the assumption cells. Crystal Ball Pro randomly resampled each of the distributions usingMonte Carlo techniques and this sampling routine was terminated when mean standard errorsfell below 0.01.
The Mean and Upper bound 1 lb ai/acre residue assumptions used for OPP terrestrial wildliferisk assessment were then compared with the summary statistics for the distributions as well asthe generated icosatiles from each of the food item distributions. The results of the Crystal Balldistributions normalized the log-normal. The results indicate that the estimated mean is similarto the actual mean as determined by Crystal Ball simulation forecast.
Food item mean (1)
estimatedmean for riskassessment (2)
percentilerange ofestimatedmean (1)
estimatedupper boundfor riskassessment (2)
percentile rangeof estimatedupper bound (1)
short grass 84.4 85 60 - 65 240 95 - 100
long grass 35.48 36 65 - 70 110 95 - 100
leaves, leafycrops
34.23 45 75 - 80 135 95 - 100
forage(legumes)
45.54 45 65 - 70 135 95 - 100
pods andseeds
3.98 7 85 - 90 15 95 - 100
fruit 5.6 7 75 - 80 15 95 - 100
woody fruit 6.58 7 70 - 75 15 95 - 100

Page -49- Page 54 of239
herbaceousfruit
3.65 7 85 - 90 15 95 - 100
(1) From Crystal Ball Simulation(2) Fletcher et al modifications to Hoerger and Kenaga nomogram for residues on wildlife fooditems
3.2.6.8 Data gaps
There are uncertainties in this risk assessment due to data gaps in the toxicity and exposureprofile. These data gaps are described below.
The exposure of birds and mammals would be better understood if data on the dissipation of totalfoliar residues (guideline 132-1a) were submitted. Due to lack of these data, a default half-life of35 days on foliage has been assumed. A measured foliar dissipation rate, if shorter than 35 days,might remove the presumption of chronic risk to birds and mammals.
72-4 Life-cycle estuarine invertebrate using shrimp - There are no shrimp chronic studies. Thereare chronic LOC exceedances to freshwater invertebrates. The acute shrimp results are similarto the freshwater daphnid studies. It is expected that the chronic shrimp may be similar to thechronic freshwater invertebrate studies.
72-5 Full Life Cycle Fish (freshwater) - This study has been requested by EFED before. Amemo dated November 28, 1994 to Alan Dixon in the Registration Division, OPP, pertained towaver request for fish full life cycle. This request was based on Piscicide use. EFED stated atthe time that the request for fish full life cycle study was based on PBO use in a great variety ofproducts that are applied directly to water as well as many agricultural uses. EFED believes thatchronic toxicity data to fish beyond that found in the fish early life stage study is necessary. NOAEC for the early life stage of fish is 40 ppb. The single application of mosquito adulticidewill provide up to 75 ppb in water. Runoff from cotton fields may contribute up to 127 ppb toEEC. Since the early life study of fish only shows the chronic effects to the fish, EFED believesthat it becomes important that reproductive effects to fish be known.
122-1 Tier I Terrestrial Plant Study. - Alleged field incidents reported under section 6(a)(2)indicate that PBO with pyrethrin or pyrethroid insecticides may cause plant mortality. Since thisis an area of great uncertainty due to lack of data, Tier I terrestrial plant studies (VegetativeVigor) would be needed to decrease this uncertainty.
3.3. Listed Species
3.3.1. Introduction
Section 7 of the Endangered Species Act, 16 U.S.C. Section 1536(a)(2), requires all federalagencies to consult with the National Marine Fisheries Service (NMFS) for marine andanadromous listed species, or the United States Fish and Wildlife Services (FWS) for listed

Page -50- Page 55 of239
wildlife and freshwater organisms, if they are proposing an "action" that may affect listed speciesor their designated habitat. Each federal agency is required under the Act to insure that anyaction they authorize, fund, or carry out is not likely to jeopardize the continued existence of alisted species or result in the destruction or adverse modification of designated critical habitat. To jeopardize the continued existence of a listed species means "to engage in an action thatreasonably would be expected, directly or indirectly, to reduce appreciably the likelihood of boththe survival and recovery of a listed species in the wild by reducing the reproduction, numbers,or distribution of the species." 50 C.F.R. § 402.02.
To facilitate compliance with the requirements of the Endangered Species Act subsection (a)(2)the Environmental Protection Agency, Office of Pesticide Programs has established proceduresto evaluate whether a proposed registration action may directly or indirectly reduce appreciablythe likelihood of both the survival and recovery of a listed species in the wild by reducing thereproduction, numbers, or distribution of any listed species (U.S. EPA 2004). After theAgency’s screening-level risk assessment is performed, if any of the Agency’s Listed SpeciesLOC Criteria are exceeded for either direct or indirect effects, a determination is made toidentify if any listed or species may co-occur in the area of the proposed pesticide use. If determined that listed or candidate species may be present in the proposed use areas, furtherbiological assessment is undertaken. The extent to which listed species may be at risk thendetermines the need for the development of a more comprehensive consultation package asrequired by the Endangered Species Act.
3.3.1.1 Federal Action
The federal action addressed herein is the proposed re-registration of pesticide products thatcontain the active ingredient piperonyl butoxide. Crops for which piperonyl butoxide uses areproposed for re-registration are identified in Section 1.1. Use areas for this pesticideencompasses most of the United States and its territories.
3.3.1.2 Action Area
For listed species assessment purposes, the action area is considered to be the area affecteddirectly or indirectly by the Federal action and not merely the immediate area involved in theaction. At the initial screening-level, the risk assessment considers broadly described taxonomicgroups and so conservatively assumes that listed species within those broad groups arecollocated with the pesticide treatment area. This means that terrestrial plants and wildlife areassumed to be located on or adjacent to the treated site and aquatic organisms are assumed to belocated in a surface water body adjacent to the treated site. The assessment also assumes that thelisted species are located within an assumed area which has the relatively highest potentialexposure to the pesticide, and that exposures are likely to decrease with distance from thetreatment area. Section 1.1 of this risk assessment presents the pesticide use sites that are used toestablish initial collocation of species with treatment areas.
3.3.1.3 No Effect and Potential for May Effect Determination

Page -51- Page 56 of239
If the assumptions associated with the screening-level action area result in RQs that are belowthe listed species LOCs, a "no effect" determination conclusion is made with respect to listedspecies in that taxa, and no further refinement of the action area is necessary. Furthermore, RQsbelow the listed species LOCs for a given taxonomic group indicate no concern for indirecteffects upon listed species that depend upon the taxonomic group covered by the RQ as aresource. However, in situations where the screening assumptions lead to RQs in excess of thelisted species LOCs for a given taxonomic group, a potential for a "may affect" conclusion existsand may be associated with direct effects on listed species belonging to that taxonomic group ormay extend to indirect effects upon listed species that depend upon that taxonomic group as aresource. In such cases, additional information on the biology of listed species, the locations ofthese species, and the locations of use sites could be considered to determine the extent to whichscreening assumptions regarding an action area apply to a particular listed organism. Thesesubsequent refinement steps could consider how this information would impact the action areafor a particular listed organism and may potentially include areas of exposure that are downwindand downstream of the pesticide use site.
The following sections present the initial screen for a “no effect” or “potential for a may effect”determination for listed species as a result of the proposed piperonyl butoxide re-registrationaction. Included in the screen is a preliminary evaluation to determine if any listed or candidatespecies occur in the proposed action areas. Section 3.1 identifies direct effect concerns, by taxa,triggered by exceeding listed LOCs in the screeninglevel risk assessment with an evaluation ofthe potential probability of individual effects for exposures that may occur at the establishedlisted species LOC. Data on exposure and effects collected under field conditions are evaluatedto make determinations on the predictive utility of the direct effect screening assessment findingsto listed species. Additionally, the results of a screen for indirect effects to listed species, usingdirect effect LOCs for each taxonomic group, are presented and evaluated. Section 3.3 providesthe current state-of-the art screening-level risk assessment for critical habitat, which consists of alisting of potential biological features that, if they are constituent elements of one or more criticalhabitats, would be of potential concern. A preliminary analysis of the co-occurrence of listedspecies and the action area is presented in Section 3.3.
3.3.2 EPA’s ECOTOX Database Analysis
Under the agreement and understanding with USFWS, EPA will conduct a literature search inthe ECOTOX database for sensitive endpoints that could be used in assessing potential adverseeffects to listed species.
No useable data on the effects of piperonyl butoxide to plants was identified either in the datasubmitted in support of registration or in the literature search conducted through ECOTOX. Data from EPA’s Duluth ECOTOX database show some toxicity values that may be moresensitive than data submitted in support of registration of PBO:
Hilscherova, K. et. al. 2003, Oxidative stress in laboratory-incubated double-crested

Page -52- Page 57 of239
cormorant eggs collected from the Great Lakes, Archives of Environmental Contaminationand Toxicology, 45:4, pp:533-546.
Blakenship, A.L. et. al. 2003. Mechanisms of TCDD-induced abnormalities and embryolethality in white leghorn chickens, Comparative Biochemistry and Physiology. Toxicologyand Pharmacology: CBP . Vol.136:1 pp. 47-62. September 2003.
Data from these studies were not used since PBO was injected into test eggs. An environmental route has not been established so that data can be useful for ecological risk assessments.
The following study was also evaluated:
Tanaka, T., et. al. 1994. Developmental toxicity evaluation of piperonyl butoxide in CD-1mice. Toxicology Letters. vol. 71:2 pp. 123-129. April, 1994.
Data from this study were not used in the risk assessment because pregnant mice were dosed bygavage. No LD50 was generated. The study only found NOAEL at around 1710 mg/kg/bw-day.
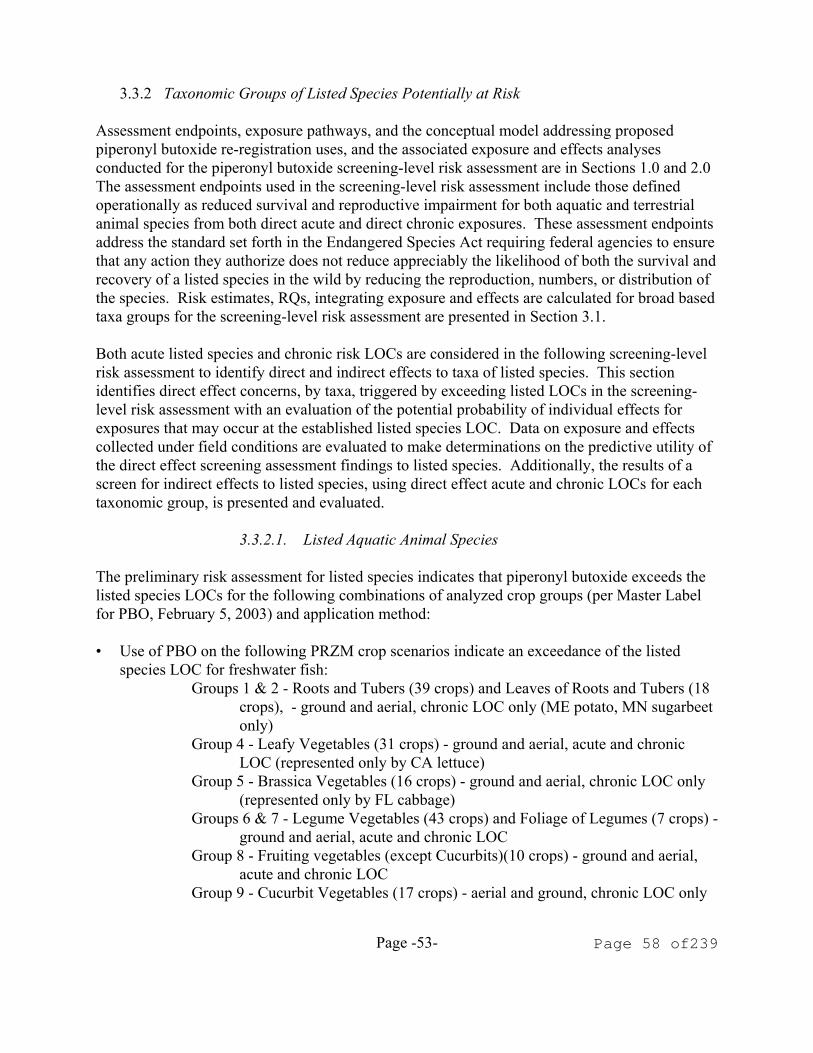
Page -53- Page 58 of239
3.3.2 Taxonomic Groups of Listed Species Potentially at Risk
Assessment endpoints, exposure pathways, and the conceptual model addressing proposedpiperonyl butoxide re-registration uses, and the associated exposure and effects analysesconducted for the piperonyl butoxide screening-level risk assessment are in Sections 1.0 and 2.0 The assessment endpoints used in the screening-level risk assessment include those definedoperationally as reduced survival and reproductive impairment for both aquatic and terrestrialanimal species from both direct acute and direct chronic exposures. These assessment endpointsaddress the standard set forth in the Endangered Species Act requiring federal agencies to ensurethat any action they authorize does not reduce appreciably the likelihood of both the survival andrecovery of a listed species in the wild by reducing the reproduction, numbers, or distribution ofthe species. Risk estimates, RQs, integrating exposure and effects are calculated for broad basedtaxa groups for the screening-level risk assessment are presented in Section 3.1.
Both acute listed species and chronic risk LOCs are considered in the following screening-levelrisk assessment to identify direct and indirect effects to taxa of listed species. This sectionidentifies direct effect concerns, by taxa, triggered by exceeding listed LOCs in the screening-level risk assessment with an evaluation of the potential probability of individual effects forexposures that may occur at the established listed species LOC. Data on exposure and effectscollected under field conditions are evaluated to make determinations on the predictive utility ofthe direct effect screening assessment findings to listed species. Additionally, the results of ascreen for indirect effects to listed species, using direct effect acute and chronic LOCs for eachtaxonomic group, is presented and evaluated.
3.3.2.1. Listed Aquatic Animal Species The preliminary risk assessment for listed species indicates that piperonyl butoxide exceeds thelisted species LOCs for the following combinations of analyzed crop groups (per Master Labelfor PBO, February 5, 2003) and application method:
• Use of PBO on the following PRZM crop scenarios indicate an exceedance of the listedspecies LOC for freshwater fish:
Groups 1 & 2 - Roots and Tubers (39 crops) and Leaves of Roots and Tubers (18crops), - ground and aerial, chronic LOC only (ME potato, MN sugarbeetonly)
Group 4 - Leafy Vegetables (31 crops) - ground and aerial, acute and chronicLOC (represented only by CA lettuce)
Group 5 - Brassica Vegetables (16 crops) - ground and aerial, chronic LOC only(represented only by FL cabbage)
Groups 6 & 7 - Legume Vegetables (43 crops) and Foliage of Legumes (7 crops) -ground and aerial, acute and chronic LOC
Group 8 - Fruiting vegetables (except Cucurbits)(10 crops) - ground and aerial,acute and chronic LOC
Group 9 - Cucurbit Vegetables (17 crops) - aerial and ground, chronic LOC only

Page -54- Page 59 of239
(represented only by FL cucumber)Group 10 - Citrus Fruits (14 crops) - ground and aerial, chronic LOC only.Miscellaneous (4 crops) - ground and aerial, acute and chronic LOC (cotton and
strawberries only).
• Use of PBO on the following crop scenarios indicate an exceedance of the listed species
LOC for listed freshwater invertebrates, listed freshwater amphibians, and listedestuarine/marine invertebrates:
Freshwater Invertebrates: all Groups, aerial and ground, acute and chronic LOC,except group 13 (OR berries), aerial acute LOC only.
Amphibians: all groups, acute LOC only.
Estuarine Invertebrates: all Groups, aerial and ground, acute LOC, except Group13 (OR berries), acute aerial only.
• Use of piperonyl butoxide did not indicate an exceedance of the listed species LOC for listedestuarine fish. Only acute RQ values were calculated, due to a lack of chronic data.
3.3.2.2. Listed Terrestrial Animals
• Piperonyl butoxide applied at an application rate of 0.5 lb ai/A and ten times during a seasonat 3-day intervals between applications will have residues on mammalian food items. Thereare no LOC exceedances for acute risk to birds and mammals. The Agency’s LOC forspecific weight class of listed mammals feeding on specific food items as indicated in thetables 12b:
Table 12b Chronic Risk Quotients for Mammals from Maximum Kenaga EECDiets 15-gram mammal 35-gram mammal 1000-gram mammal
Short grass 4.5* 3.9* 2.0*
Tall grass 2.1* 1.8* <1.0
Broadleaf plants/sm insects 2.6* 2.2* 1.2*
Fruits/pod/lg insects <1.0 <1.0 <1.0 * indicate that the Agency’s LOC for chronic risk is exceeded.
Table 8d. Chronic Risk Quotients for Mammals from Mean Kenaga EECDiets 15-gram mammal 35-gram mammal 1000-gram mammal
Short grass 1.6* 1.4* <1.0
Tall grass <1.0 <1.0 <1.0

Page -55- Page 60 of239
Broadleaf plants/sm insects <1.0 <1.0 <1.0
Fruits/pod/lg insects <1.0 <1.0 <1.0 * indicate that the Agency’s LOC for chronic risk is exceeded.
• Piperonyl butoxide applied at an application rate of 0.5 lb ai/A and ten times during a seasonat 3-day intervals between applications will have residues on mammalian food items. TheAgency’s LOC for listed birds feeding on specific food items as indicated in table 12c:
Table 12c Chronic Risk Quotients for Birds Diets Maximum Kenaga Mean Kenaga
EEC RQ EEC RQ
Short grass 932 3.1 330 1.1
Tall grass 427 1.4 140 0.5
Broadleaf plants/sm insects 524 1.8 17 0.6
Fruits/pod/lg insects 58 0.2 27 0.1RQs in Bold indicate that the Agency’s LOC for chronic risk is exceeded.
3.3.2.3 Listed Species Summary
Table 12d Listed Species in which PBO triggers LOC for Listed Species
Group of Organism Number of Species Number of States
Amphibian 16 9
Bird 56 47
Clam 65 27
Crustacean 19 12
Fish 100 38
Mammals 61 48
Reptile 28 26
Snail 28 12
3.3.3. Probit Slope Response Relationship on the Listed Species Levels of Concern
The Agency uses the probit dose-response relationship as a tool for providing additionalinformation on the listed animal species acute levels of concern (LOC). The acute listed species

Page -56- Page 61 of239
LOCs of 0.1 and 0.05 are used for terrestrial and aquatic animals, respectively. As part of therisk characterization, an interpretation of acute LOCs for listed species is discussed. Thisinterpretation is presented in terms of the chance of an individual event (i.e., mortality orimmobilization) should exposure at the estimated environmental concentration actually occur fora species with sensitivity to piperonyl butoxide chemicals on par with the acute toxicityendpoint selected for RQ calculation. To accomplish this interpretation, the Agency uses theslope of the dose-response relationship available from the toxicity study used to establish theacute toxicity measurement endpoints for each taxonomic group. The individual effectsprobability associated with the LOCs is based on the mean estimate of the slope and anassumption of a probit dose- response relationship. In addition to a single effects probabilityestimate based on the mean, upper and lower estimates of the effects probability are alsoprovided to account for variance in the slope. The upper and lower bounds of the effectsprobability are based on available information on the 95% confidence interval of the slope. Astatement regarding the confidence in the applicability of the assumed probit dose-responserelationship for predicting individual event probabilities is also included. Studies with goodprobit fit characteristics (i.e., statistically appropriate for the data set) are associated with a highdegree of confidence. Conversely, a low degree of confidence is associated with data fromstudies that do not statistically support a probit dose-response relationship. In addition,confidence in the data set may be reduced by high variance in the slope (i.e., large 95%confidence intervals), despite good probit fit characteristics.
Individual effect probabilities are calculated based on an Excel spreadsheet tool IECV1.1(Individual Effect Chance Model Version 1.1) developed by Ed Odenkirchen of the U.S. EPA,OPP, Environmental Fate and Effects Division (June 22, 2004). The model allows for suchcalculations by entering the mean slope estimate (and the 95% confidence bounds of thatestimate) as the slope parameter for the spreadsheet. In addition, the LOC (0.1 for terrestrialanimals and 0.05 for aquatic animals) is entered as the desired threshold. The following is thesummary of screening assessment of listed terrestrial and aquatic species Levels Of Concernusing probit slope relationship.
Table 13a. Probit Dose Slope RelationshipsListed Listed Species Bobwhite quail Rat Rainbow trout
Acute Tox. End Point LC50 2250 mg/kg** 4570 mg/kgbw 1.9 ppm
Probit X2value - - -
Mean Slope 4.5* 4.5* 4.5*
Slope Confid. Interval - - -
Effect probability p (Z) 3.40E-06 3.40E-06 2.40E-09
Chance of Individual effect (1/p) 2.94E+05 2.94E+05 4.17E+08
* default value, ** practically nontoxic without mortality
Table 13b

Page -57- Page 62 of239
Listed Listed Species Daphnid Sheepshead minnow Shrimp
Acute Tox. End Point LC50 0.51 ppm 3.94 ppm 0.49ppm
Probit X2value 0.996 - -
Mean Slope 5.33 4.5* 4.7
Slope Confid. Interval 3.24 - 7.42 - -
Effect probability p (Z) 2.05E-12 2.40E-09 4.85E-10
Chance of Individual effect (1/p) 4.88E+11 4.17E+08 2.06E+09* default value
The results show chance of individual effect is minimal. The effect probability p(Z) ranges from2.05E-12 ( 1 in 4.88 E+11chance for daphnid) to 3.4E-6 (1 in 294,000 chance for quail and rat).When the slope value is unavailable, a default value of 4.5 is assigned in the case of quails, rats, bees, rainbow trout, and sheepshead minnow. Furthermore, if they share the same LOC values(0.05 or 0.1) they will have the same effect probability and hence the chance of individual effect.Generally, the species with the higher slope value, such as daphnid, their probability to exceedLOC is less.
3.3.3.2 Terrestrial listed species (quail, rat, and beneficial insects)
Based on an assumption of a probit dose-response relationship with a mean estimated slope ofdefault 4.5, the corresponding estimated chance of individual mortality associated with the listedspecies LOC of 0.1 the acute toxic endpoint for those terrestrial organisms is 2250 mg/kg,4750 mg/kg bw, and 25 ug/bee for quail, rat, and bee, respectively. As discussed above, theyshare default slope value of 4.5 and LOC value of 0.1; therefore, they possess the same effectprobability and chance of individual effect. It is also recognized that extrapolation of very low probability events is associated withconsiderable uncertainty in the resulting estimates. To explore possible bounds to suchestimates, the upper and lower values for the mean slope estimate were needed to calculateupper and lower estimates of the effects probability associated with the listed species LOC, butno information is available.
3.3.3.1 Aquatic Animals
Freshwater invertebrates (daphnid)Based on an assumption of a probit dose-response relationship with a mean estimated slope of5.33 the corresponding estimated chance of individual mortality associated with the listedspecies LOC of 0.05 the acute toxic endpoint for freshwater invertebrate is 0.51 ppm. It isrecognized that extrapolation of very low probability events is associated with considerableuncertainty in the resulting estimates. To explore possible bounds to such estimates, the upperand lower values for the mean slope estimate 3.24 to 7.42 were used to calculate upper and lowerestimates of the effects probability p(z) associated with the listed species LOC. These values are

Page -58- Page 63 of239
1.25E-5 to 1.00 E-16 (or 1.25E-3 % to 1.00E-14 % chance).
Although the Agency has assumed a probit dose-response relationship in establishing the listedspecies LOCs, the available data for the toxicity study generating RQs for this taxonomic groupdo statistically support a probit dose-response relationship 0.996 and so the confidence inestimated event probabilities based on this dose-response relationship and the listed species LOCis very high. Estuarine invertebrate (Shrimp) Based on an assumption of a probit dose response relationship with a mean estimated slope of(4.7), the corresponding estimated chance of individual mortality associated with the listedspecies LOC of (0.05) the acute toxic endpoint for (estuarine invertebrates) is 2.06E+09. It isrecognized that extrapolation of very low probability events is associated with considerableuncertainty in the resulting estimates. To explore possible bounds to such estimates, the upperand lower values for the mean slope estimate (which is currently in review) would be used tocalculate upper and lower estimates of the effects probability associated with the listed speciesLOC.
Freshwater and estuarine fish (rainbow trout and sheepshead minnow )Based on an assumption of a probit dose-response relationship with a mean estimated slope ofdefault 4.5, the corresponding estimated chance of individual mortality associated with the listedspecies LOC of 0.05 the acute toxic endpoint for these aquatic organisms are 1.97 ppm and3.94 ppm for rainbow trout and sheepshead minnow, respectively. As discussed above, theyshare default slope value of 4.5 and LOC value of 0.1; therefore, they share the same effectprovability and chance of individual effect.
It is recognized that extrapolation of very low probability events is associated with considerableuncertainty in the resulting estimates. To explore possible bounds to such estimates, the upperand lower values for the mean slope estimate were need to calculate upper and lower estimatesof the effects probability associated with the listed species LOC, but no information is available.
Based on the above available results, Chi-Sq p-values range from 0.157 to 0.996. These valuesare greater than critical alpha value of 0.05; therefore, fitting of the probit slope regression line isacceptable and the confidence in estimated event probability with these listed species LOC isrelatively high.
3.3.4. Indirect Effect Analyses
The Agency acknowledges that pesticides have the potential to exert indirect effects upon thelisted organisms by, for example, perturbing forage or prey availability, altering the extent ofnesting habitat, creating gaps in the food chain, etc.
In conducting a screen for indirect effects, direct effect LOCs for each taxonomic group are usedto make inferences concerning the potential for indirect effects upon listed species that rely upon

Page -59- Page 64 of239
non-listed organisms in these taxonomic groups as resources critical to their life cycle.
Because screening-level acute RQs for freshwater fish, freshwater invertebrates,estuarine/marine invertebrates, and mammals exceed the listed species acute LOCs, the Agencyuses the dose-response relationship from the toxicity study used for calculating the RQ toestimate the probability of acute effects associated with an exposure equivalent to the EEC. Thisinformation serves as a guide to establish the need for, and extent of, additional analysis that maybe performed using Services-provided “species profiles”, as well as evaluations of thegeographical and temporal nature of the exposure to ascertain if a “not likely to adversely affect”determination can be made. The degree to which additional analyses are performed iscommensurate with the predicted probability of adverse effects from the comparison of the doseresponse information with the EECs. The greater the probability that exposures will produceeffects on a taxa, the greater the concern for potential indirect effects for listed species dependentupon that taxa, and therefore, the more intensive the analysis on the potential listed species ofconcern, their locations relative to the use site, and information regarding the use scenario (e.g.,timing, frequency, and geographical extent of pesticide application).
Indirect effects to aquatic animals may result from 1) reduction in sensitive plants that serve asfood items for some species of aquatic organisms, 2) loss of sensitive aquatic emergent plantsthat provide shade alters the temperature of the water inhabited by the sensitive organisms,and/or 3) reduction of aquatic invertebrate populations from direct or chronic effects, thus,limiting the amount of food items for larger aquatic animals.
Indirect effects to terrestrial animals may result from reduced food items to animals, behaviormodifications from reduced or a modified habitat, and from alterations of habitats. Alterationsof habitats can affect the reproductive capacity of some terrestrial animals.
3.3.5. Critical Habitats
In the evaluation of pesticide effects on designated critical habitat, consideration is given to thephysical and biological features (constituent elements) of a critical habitat identified by the U.SFish and Wildlife and National Marine Fisheries Services as essential to the conservation of alisted species and which may require special management considerations or protection. Theevaluation of impacts for a screening level pesticide risk assessment focuses on the biologicalfeatures that are constituent elements and is accomplished using the screening-level taxonomicanalysis (risk quotients, RQs) and listed species levels of concern (LOCs) that are used toevaluate direct and indirect effects to listed organisms.
The screening-level risk assessment has identified potential concerns for indirect effects on listedspecies for those organisms dependant upon aquatic organisms, birds, amphibians, reptiles, andinsects. In light of the potential for indirect effects, the next step for EPA and the Service(s) is toidentify which listed species and critical habitat are potentially implicated. Analytically, theidentification of such species and critical habitat can occur in either of two ways. First, theagencies could determine whether the action area overlaps critical habitat or the occupied range

Page -60- Page 65 of239
of any listed species. If so, EPA would examine whether the pesticide's potential impacts onnon-listed species would affect the listed species indirectly or directly affect a constituentelement of the critical habitat. Alternatively, the agencies could determine which listed speciesdepend on biological resources, or have constituent elements that fall into, the taxa that may bedirectly or indirectly impacted by the pesticide. Then EPA would determine whether use of thepesticide overlaps the critical habitat or the occupied range of those listed species. At present,the information reviewed by EPA does not permit use of either analytical approach to make adefinitive identification of species that are potentially impacted indirectly or critical habitats thatare potentially impacted directly by the use of the pesticide. EPA and the Service(s) are workingtogether to conduct the necessary analysis.
This screening-level risk assessment for critical habitat provides a listing of potential biologicalfeatures that, if they are constituent elements of one or more critical habitats, would be ofpotential concern. These correspond to the taxa identified above as being of potential concernfor indirect effects and include aquatic organisms, birds, amphibians, reptiles, and insects. Thislist should serve as an initial step in problem formulation for further assessment of criticalhabitat impacts outlined above, should additional work be necessary

Page -61- Page 66 of239
4. References
AgDrift Spray Drift Sofware Version 2.01. Spray Drift Task Force
Ankley, GT, JR Dierkes, DA Jensen and GS Peterson, 1991. Piperonyl butoxide as a tool inaquatic toxicological research with organophosphate insecticides. Ecotoxicology andEnvironmental Safety, vol 21, no 3, 266-274.
Ankley, GT and SA Collyard, 1995. Influence of piperonyl butoxide on the toxicity oforganophosphate insecticides to three species of freshwater benthic invertebrates. Comp.Biochem. Physiol., vol 110C, no 2, 149-155.
Bailey, HC, C. DiGiorgio, K. Kroll, JL Miller, DE Hinton, and G Starrett, 1995. Developmentof procedures for identifying pesticide toxicity in ambient waters: carbofuran, diazinon,chlorpyrifos. Environmental Toxicology and Chemistry, vol 15, no 6, 837-845.
Beyer, N.; E. Conner, S. Gerould. 1994. Estimates of Soil Ingestion by Wildlife. J. WildlifeManagement, 1994.
Blankenship, A.L. et. al. 2003. Mechanisms of TCDD-induced abnormalities and embryolethality in white leghorn chickens, Comparative Biochemistry and Physiology. Toxicologyand Pharmacology: CBP . Vol.136:1 pp. 47-62. September 2003.
Ecological Incident Information System (EIIS), USEPA OPP EFED
EFED Input Parameter Guidance, February 28, 2002.
EFED interim standard Rice Paddy Model (10/29/2002)
Endangered Species Act, 16 U.S.C. 1536(a)(2)
Erickson, DA, MS Goodrich, and JL Lech, 1988. The effect of piperonyl butoxide on hepaticcytochrome P-450-dependent monoxygenase activities in rainbow trout (Salmo gairdneri). Toxicology and Applied Pharmacology, vol 94, no 1, 1-10.
Fletcher, J.S., J.E. Nellessen, and T.G. Pfleeger, 1994. Literature Review and Evaluation of theEPA Food-Chain (Kenaga) Nomogram, An Instrument for Estimation Pesticide Residues onPlants. Environmental Toxicology and Chemistry, vol 13, no 9, 1383-91.
Grosvik, BE, HE Larsen and A Goksoyr, 1996. Effects of piperonyl butoxide and [beta]-naphthoflavone on cytochrome P4501A expression and activity in Atlantic salmon (Salmo salarL.). Environmental Toxicology and Chemistry, vol 16, no 3, 415-423.
Hazardous Substances Data Bank monograph for MGK-264. National Library of Medicine.(toxnet.nlm.nih.gov)
Page -62- Page 67 of239
Hoerger, F.D. and E.E. Kenaga. 1972. Pesticide residues on plants: Correlation ofrepresentative data as a basis for estimation of their magnitude in the environment. in,Environmental Quality. F. Coulston and F. Korte, Eds. Academic Press, New York. Vol. I,pp. 9-28.
Hilscherova, K. et. al. 2003, Oxidative stress in laboratory-incubated double-crested cormoranteggs collected from the Great Lakes, Archives of Environmental Contamination and Toxicology,45:4, pp:533-546.
Individual Effect Chance Model Version 1.1 (IECV1.1), USEPA OPP EFED June 22, 2004
Jones, D.G., ed., 1998. Piperonyl Butoxide The Insecticide Synergist. Academic Press.
Kirkwood, J.K. 1983. A limit to metabolisable energy intake in mammals and birds. Comp.Biochem. Physiol 75A: 1-3.Kobayashi, K, W Yang, K Shigeo, RR Max, I. Nobuyoshi, and O. Yuji, 1993a. Practicalapplication of piperonyl butoxide for the reduction of organophosphate insecticide-toxicity tokuruma prawn. Nippon Suisan Gakkaishi, vol 59, no 12, 2053-2057.
Kobayashi, K, W Yang, I. Nobuyoshi, O. Yuji, and RR Max, 1993b. Reduction of the toxicity offenitrothion to prawns by piperonyl butoxide. Nippon Suisan Gakkaishi, vol 59, no 4, 717-720.
Master Label for Piperonyl butoxide (2/05/2003), 53 pp.
Merck Index 10th Ed., 1983. Merck & Co. Rahway NJ
MPBPWIN v1.40 program in EPISuite program. Syracuse Research Corporation(http://www.epa.gov/oppt/exposure/docs/episuitedl.htm)
NIST Chemistry Webbook. Http://webbook.nist.gov/chemistry/
Pathiratne, A, and SG George, 1998. Toxicity of malathion to nile tilapia, Oreochromis niloticusand modulation by other environmental contaminants. Aquatic Toxicology, vol 43, 261-271.
Paul, EA and HA Simonin, 1995. Comparison of the toxicity of a synergized and non-synergized insecticide to young trout. Bulletin of Environmental Contamination and Toxicology,vol 55, 453-460.
Prentiss, Inc (undated). Material Safety Data Sheet, Prentox Piperonyl Butoxide Technical, 4 pp.
Rebach, S., 1999. Acute toxicity of permethrin/piperonyl butoxide on hybrid striped bass. Bulletin of Environmental Contamination and Toxicology, vol 62, 448-454.

Page -63- Page 68 of239
Rodia, C., U.S. EPA OPP/SRRD. Use Closure Memo, November 17, 2003.
Sander, HO, 1970. Pesticide toxicities to tadpoles of the Western Chorus Frog Pseudacristriseriata and Fowler’s Toad Bufo woodhousii fowleri. Copeia, vol 2, 246-251.
Schwarzenbach, R.P., P.M. Gschwend, and D.M. Imboden, 1993. Environmental OrganicChemistry. John Wiley & Sons, New York.
SRC PhysProp database. Syracuse Research Corporation ( http://www.syrres.com/esc/physprop.htm)
Tanaka, T., et. al. 1994. Developmental toxicity evaluation of piperonyl butoxide in CD-1 mice. Toxicology Letters. vol. 71:2 pp. 123-129. April, 1994.
USDA Regional IPM Centers. Www.ipmcenters.org/datasources/nass/output/NASS.cfm
USEPA, 1993. Wildlife Exposure Factors Handbook. EPA/600/R-93/187a. December, 1993.
USEPA, 2004. Overview of the Ecological Risk Assessment Process in the Office of PesticidePrograms, US Environmental Protection Agency. Endangered and Threatened Species EffectsDeterminations. Jan. 23, 2004.

Page -64- Page 69 of239
Appendix A. Environmental Fate Data Requirements Summary
Hydrolysis (161-2)
Uniformly phenyl ring-labeled [14C]piperonyl butoxide, at a concentration of 1.1-1.2 mg/L, washydrolytically stable in sterile pH 5, 7, and 9 aqueous buffer solutions incubated in darkness at25 ± 1.5°C for up to 30 days. Data for the parent are reported as fractions of the totalradioactivity recovered from individual analyses. Following the incubation period, >97% of therecovered radioactivity was present as parent compound in the pH 5, 7, and 9 test systems.MRID 43595601
Photodegradation in Water (161-2)
Uniformly phenyl ring-labeled [14C]piperonyl butoxide, at a nominal concentration of 8.6 ppm,degraded with a registrant-calculated half-life of 8.4 hours (r2 = 0.99) of continuous sunlightexposure in sterilized pH 7 aqueous buffer solution which was irradiated under natural sunlightfor up to 168 hours (equivalent to 84 hours of sunlight) while maintained at 25 ± 1°C. Incontrast, the parent compound was stable in the dark control solution. MRID 43637201
Photodegradation in Soil (161-3)
Nonradiolabeled plus uniformly phenyl ring-labeled [14C]piperonyl butoxide, at a nominalapplication rate of 100 µg/cm2 (equivalent to 10 kg a.i./ha), degraded with registrant-calculatedhalf-life of 0.8 days (reviewer-calculated r2 = 0.86; based on 0-3 day data; equivalent to 2.1 daysof natural sunlight) on sandy loam soil adjusted to 75% of 0.33 bar moisture content andincubated at 25 ± 1°C for up to 15 days while continuously irradiated with a xenon arc lamp. Incontrast, in the dark control soil, the parent degraded with a registrant-calculated half-life of 1.3days (reviewer-calculated r2 = 0.92; based on 0-3 day data). The reviewer-calculated photolytichalf-life was 2.1 days. However, the very rapid degradation observed in both the irradiated anddark control samples may preclude a definitive determination of whether photodegradation was asignificant factor in the degradation of the compound. MRID 43720801
Aerobic Soil Metabolism (162-1)
Uniformly phenyl ring-labeled piperonyl butoxide, at a nominal application rate of 10 ppm,degraded with a registrant-calculated half-life (reported as a DT50; determined using nonlinearregression) of 14 days (r2 = 1.0; 0- to 210- day data) in sandy loam soil adjusted to 75% of 0.33bar moisture content and incubated in darkness at 25 ± 1°C for up to 285 days. MRID 43806401
Anaerobic Soil Metabolism (162-2)
Anaerobic Aquatic Metabolism (162-3)
Uniformly phenyl ring-labeled [14C]piperonyl butoxide, at a nominal application rate of 10.2

Page -65- Page 70 of239
µg/g soil, was stable in anaerobic flooded sandy loam soil that was incubated in darkness at 25 ±2°C for up to 181 days. MRID 43836501
Aerobic Aquatic Metabolism (162-4)
Uniformly phenyl ring-labeled [14C]piperonyl butoxide, at a nominal application rate of 10 ppm,degraded with a registrant-calculated half-life (reported as a DT50) of 213 days (r2 = 0.97) inflooded soil that was incubated in darkness at 25 ± 1°C for up to 30 days. However, thecalculated half-life was beyond the scope of the observed data; the parent was present in the totalsoil/water system at 72.0% of the applied radioactivity at 30 days posttreatment. In addition, thedata may not accurately depict the metabolism of the parent under aerobic aquatic conditionsbecause a 20-day pre-incubation period was used, during which the soil was flooded (prior totreatment with pesticide). MRID 43803401
Adsorption/Desorption (163-1)
Batch Equilibrium. Uniformly phenyl ring-labeled [14C]piperonyl butoxide, at nominalconcentrations of 0.4, 2.0, 3.0, and 4.0 mg/L, was studied in sand, sandy loam, clay loam, andsilt loam soil:solution slurries (1:10, w:v) that were equilibrated for 24 hours at 25 ± 1 oC indarkness. Freundlich Kads values were 8.4 for the sandy loam soil, 0.98 for the sand soil (0.2%o.m.), 12.0 (non-Freundlich) for the clay loam soil, and 29.9 for the silt loam soil (3.6% o.m.);corresponding Koc values were 399, 490, 708, and 830 mL/g. Respective 1/N values were 0.67,0.90, 1.6, and 0.84 for adsorption. The reported Kads value calculated for the clay loam wasbased only on data obtained from 0.4, 2.0, and 3.0 mg/L treatment levels; the use of three datapoints does not allow for the calculation of a Freundlich K. Freundlich Kdes values determinedfollowing a single 24-hour equilibration period were 8.2 for the sandy loam soil, 16.8 for theclay loam soil, and 41.5 for the silt loam soil; corresponding Koc values were 390, 989, and 1152mL/g. Respective 1/N values were 0.63, 1.3, and 0.87 for desorption. A Freundlich Kdes valuewas not reported for the sand soil. The reviewer-calculated coefficients of determination (r2) forthe relationships Kads vs. organic matter, Kads vs. soil pH, and Kads vs. clay content were 0.89,0.003, and 0.40, respectively. MRID 43673801
Soil Column Leaching. The aged soil column study was invalid for the sandy loam soil due toexperimental variability. This part of the study did not meet Subdivision N Guidelinesbecause the column was aged for longer than one half-life before leaching.
The studies of unaged column leaching in sand, clay loam, sandy loam, and silt loamsoils were scientifically valid, but Kd values could not be calculated due to limitedmovement of the parent compound. PBO (parent) was mobile only in the sand soil (Kd =0.42 mL/g). MRID 43673802
Summary of Degradation Pathways

Page -66- Page 71 of239
This section summarizes maxiumum levels of degradates found in the environmental fatestudies for piperonyl butoxide (PBO). These data are taken from the Photodegradation inWater (MRID 43637201), Photodegradation on Soil (43720801), Aerobic Soil Metabolism(43806401), Aerobic Aquatic Metabolism (43803401), and Anaerobic Aquatic Metabolism(43836501) studies.
Structures and names of the degradates identified in these studies are provided below inFigures I, II, and III.
The first side-chain degradate (Butyl Carbitol) is the other product formed when PBO iscleaved to form PBO-alcohol (p. 3 of attachment). This compound is “used as a marker forthe degree of photodegradation...of PBO.” (C.A.J. Harbach et al., Photolytic Degradation ofPiperonyl Butoxide, chapt. 6 in Piperonyl Butoxide The Insecticide Synergist, D.G. Jones, ed.Academic Press, 1998). Its initial concentration should therefore be the same as PBO-alcohol. The other two side-chain degradates are also formed by ether cleavage.
Table 1. Maximum Concentrations of PBO DegradatesDegradate Name
Photodeg/Water
Photodeg/Soil (a)
Aerobic Soil Aerobic Aquatic AnaerobicAquatic
Application Rate
8.6 ppm 100 :g/cm2
/10 kg/ha10 ppm 10 ppm 10.2 ppm
PBO-alcohol 4.7 ppm @ 36 hr
4.41 kg/ha@ 3 days
-- (water) 0.38 ppm @ 30days(sed) 0.075 ppm @ 30 days
(w) #0.04ppm(s) #0.10 ppm
PBO-aldehyde 1.0 ppm @ 36 hr
0.76 kg/ha@ 6 days
-- (w) 0.18 ppm @ 30 days(s) 0.09 ppm @ 21-30 days
(w) #0.12ppm(s) --
PBO-acid -- 0.98 kg/ha@ 10 days
1.7 ppm @ 30 days
(w) 0.34 ppm @ 30 days(s) 0.15 ppm @ 30 days
(w) #0.15ppm(s) #0.10 ppm
PBO-alcoholdimer
– 0.48 kg/ha@3 days
– – --
PBO prop-1-one -- 0.3 ppm @ 30 days
-- --
PBO prop-1-onebenzaldehyde
-- 0.58 ppm @ 7 days -- --
“M8" -- 0.89 ppm @ 30days
-- --
Notes: (a) Data from the Photodegradation on Soil study are provided to show qualitativesimilarity to the Photodegradation in Water study. The half-lives from the former study are

Page -67- Page 72 of239
questionable, therefore the timing of maximum degradate concentration is also questionable.

Page -68- Page 73 of239
O
OO
OO
Piperonyl butoxide
O
OOH
PBO-alcoholhydroxymethyl dihydrosafrolMDPB-alcohol3,4-methylene-6-propylbenzyl alcohol
O
OO
PBO-aldehydedihydrosafrol aldehydeMDPB-aldehyde3,4-methylene-6-propylbenzaldehyde
O
OO
OH
PBO-acidMDPB-acid3,4-methylene-6-propylbenzoic acid
Piperonyl Butoxide Degradation: Pathway 1Side-Chain Cleavage and Oxidation
CO2
Figure I

Page -69- Page 74 of239
O
O
O
OO
O
PBO prop-1-one
"M16"
O
O
O
O
PBO prop-1-one benzaldehyde
"M11"
O
O
OH
O
OO
O
OH 5[2-(2-butoxyethoxy)-hydroxymethyl]-6-carboxy-1,3-benzodioxole
"M8"
O
O
O O
O
PBO-alcohol dimer
PBO
PBO Degradation: Aerobic SoilPathway 2
PBO-acid
PBO-alcohol(Soil Photodeg. only)
Figure II

Page -70- Page 75 of239
HOO
O
2-(2-butoxy ethoxy) ethanolButyl Carbitol
HOO
2-butoxy ethanolButyl Cellosolve
HO
butyl alcoholPropyl Carbinol
Piperonyl Butoxide Degradation: Glycol Ether Side-Chainfrom Pathway 1
PBO
Figure III

Page -71- Page 76 of239
Appendix B. Calculation of Modeling Parameters for PRZM-EXAMS
Vapor Pressure
The vapor pressure of piperonyl butoxide has been reported as shown below.
Pressure (mmHg) Temperature (K) Reference
2 468 Piperonyl Butoxide: theInsecticide Synergist. DGJones, ed. Academic Press,1998, p. 56
1 453
0.0004 bar (0.3 mmHg) 428 NIST Chemistry Webbook:http://webbook.nist.gov/chemistry/
1.59E-7 333 Material Safety Data Sheet,Prentox Piperonyl ButoxideTechnical. Prentiss Inc.Floral Park, NY. 4 pp.
< 1E-7 298
The pressure-temperature data from 333K to 468K were regressed using SigmaPlot, with theresult:
Ln P = - 49.5439 + 53573(1/T) - 1.408E+7 (1/T)2 R2 = 0.99992 (eq. 1)
This equation predicts that the vapor pressure at 298K (25°C) is 5.0E-13 mmHg, whichagrees with the reported pressure of less than 1E-7 mmHg.
Henry’s Law Constant (HLC)
The HLC at 25°C was calculated as the vapor pressure calculated above (5.0E-13 mmHg or6.58 E-15 atm) divided by the solubility (14.3 mg/L or 4.225E-5 mole/liter with a molecularweight of 338.45 g/mole).
The result of this calculation is 1.558 E-14 atm-m3/mole.
Diffusion Coefficient in Air (Da)
Da was calculated from the molecular mass (338.45 amu) by the method given inSchwarzenbach, Gschwend & Imboden, Environmental Organic Chemistry, Wiley-Interscience,New York, 1993, p. 197 ff).

Page -72- Page 77 of239
Da = 1.55 / (molecular mass)0.65 (eq. 2)
The result of this calculation is 0.0352 cm2/sec, or 4.07E-7 cm2/day.
Enthalpy of Vaporization
)Hvap was calculated from the slope of a plot of the pressure-temperature data (natural logpressure in mmHg versus inverse temperature in K) shown in the Table above. This is agraphical representation of the Clausius-Clayperon equation. The resulting slope is equal to)Hvap/R, where R is the universal gas constant. The result is )Hvap = 18.8 kcal/mole, which isclose to the default value of 20 kcal/mole in PRZM.

Page -73- Page 78 of239
Appendix C. Summary of Ecotoxicity Data
1. Ecological Toxicity Data
a. Toxicity to Terrestrial Animals
i. Birds, Acute and Subacute
An acute oral toxicity study using the technical grade of the active ingredient (TGAI) isrequired to establish the toxicity of PBO to birds. The preferred test species is either mallardduck (a waterfowl) or bobwhite quail (an upland gamebird). Results of this test are tabulatedbelow.
Avian Acute Oral Toxicity
Species % aiLD50(mg/kg) Toxicity Category
MRID No.Author/Year
Study Classification1
Northern bobwhite quail (Colinus virginianus)
90.78 > 22502 practically non-toxic
419690-08Campbell, 1991
core
1 Core (study satisfies guideline). Supplemental (study is scientifically sound, but does not satisfy guideline)2 No mortalities at the maximum dose.
Since the LD50's are greater than 2250 mg/kg, PBO is practically non- toxic to avian species on an acute oral basis.
Two subacute dietary studies using the TGAI are required to establish the toxicity of PBO tobirds. The preferred test species are mallard duck and bobwhite quail. Results of these tests aretabulated below.
Avian Subacute Dietary Toxicity
Species % ai5-Day LC50(ppm)1 Toxicity
Category
MRID No.Author/Year
StudyClassification
Northern bobwhite quail(Colinus virginianus)
90.78 > 5620 2 practicallynontoxic
419690-06Grimes 1991
core
Mallard duck(Anas platyrhynchos)
> 5620 2 practicallynontoxic
419690-07Grimes 1991
core
1 Test organisms observed an additional three days while on untreated feed. 2 No mortalities at the maximum dose.
Since the LC50's are greater than 5620 ppm, PBO is practically non- toxic to avian species on a subacute dietary basis.

Page -74- Page 79 of239
ii. Birds, Chronic
Avian reproduction studies using the TGAI were required for PBO because the followingconditions were met: (1) birds may be subject to repeated or continuous exposure to thepesticide, especially preceding or during the breeding season, (2) the pesticide is stable in theenvironment to the extent that potentially toxic amounts may persist in animal feed, (3) thepesticide is stored or accumulated in plant or animal tissues, and/or, (4) information derived frommammalian reproduction studies indicates reproduction in terrestrial vertebrates may beadversely affected by the anticipated use of the product. The preferred test species are mallardduck and bobwhite quail. Results of these tests are tabulated below.
Species NOEC Results MRID No.Author/Year
StudyClassification
NorthernBobwhite Quail
NOEC = 300 ppmLOEC = 1500 ppm
male body weight 438763-01Rodgers 1995
core
Mallard Duck NOEC = 300 ppmLOEC = 1200 ppm
Eggs laid, eggs laid per female,percentage of eggs cracked,eggshell thickness, viable embryos,live 3-week embryos, 14-daysurvivors, normal hatchlings, foodconsumption, hatchling and adultbody weights
438763-02Rodgers 1995
core
iii. Mammals, Acute and Chronic
Wild mammal testing is required on a case-by-case basis, depending on the results of lowertier laboratory mammalian studies, intended use pattern and pertinent environmental fatecharacteristics. In most cases, rat or mouse toxicity values obtained from the Agency's HealthEffects Division (HED) substitute for wild mammal testing. These toxicity values are reportedbelow.

Page -75- Page 80 of239
Mammalian ToxicitySpecies/Study Duration % ai
TestType
ToxicityValue
AffectedEndpoints
MRIDNo.
laboratory rat(Rattusnorvegicus)
tech Acute oral LD50 = 4570 mg/kg (m)LD50 = 7220 mg/kg (f)
mortality 41969001
laboratory rat(Rattusnorvegicus)
89.5 Acute oral male LD50 = 4700 mg/kg bw female LD50 = 4100 mg/kg bw
mortality 246018
Laboratory rat(Rattusnorvegicus)
(1) Acute oral LD50 > 5000 mg/kg bw mortality 242853
Laboratory rat(Rattusnorvegicus)
90.78 Developmentaltoxicity
(Maternal) NOAEL = 200 mg/kg/d LOAEL = 500 mg/kg/d
reduced body weight gainand food consumptionduring days 6-9 oftreatment. Also increasedincidence of urogenital reddischarge and perinasalencrustation
42380801
New Zealandwhite rabbit
100 Developmentaltoxicity
(Maternal) NOAEL = 50 mg/kg/d LOAEL = 100 mg/kg/d
decrease body weight gain 00157157
Laboratory rat(Rattusnorvegicus)
Tech. 2-generationreproduction
Reproductive NOAEC > 5000 ppm (469mg/kg)Maternal NOAEC = 1000 ppm (89 mg/kg bw)Maternal LOAEC = 5000 ppm (469 mg/kg)Offspring NOAEC = 1000 ppm (89 mg/kg bw)Offspring LOAEC = 5000 ppm (469 mg/kg)
decreased body weightgain (12%)decreased body weightgain in pups (12%)
00161118
Laboratory rat(Rattusnorvegicus)
80 2-generationreproduction
Reproductive NOAEC = 1000 ppmReproductive LOAEC = 10,000 ppm
body weight decreased.(at 25,000 ppm - livereffects)
(2)
(1) formulated product of Piperonyl Butoxide (Registration No. 4816-353)(2) Tox. Appl. Pharm. 47:353 (1979). Study is classified as supplemental due to too few animals tested and too few observations
iv. Insects
A honey bee acute contact study using the TGAI was required for Piperonyl Butoxidebecause its widespread use on agricultural will result in honey bee exposure. Results of this testare tabulated below.
Species % ai LD50 ToxicityCategory
MRID No.Author/Year
StudyClassification
Honey Bee 90.78 $25 :g/bee practicallynontoxic
419690-09Lynn 1991
core
Piperonyl Butoxide is practically non-toxic to honey bees.

Page -76- Page 81 of239
b. Toxicity to Freshwater Aquatic Animals
i. Freshwater Fish, Acute
Two freshwater fish toxicity studies using the TGAI are required to establish the toxicity ofPBO to fish. The preferred test species are rainbow trout (a coldwater fish) and bluegill sunfish(a warmwater fish). Results of these tests are tabulated below.
Freshwater Fish Acute Toxicity
Species/(Flow-through or Static) % ai
96-hourLC50 (ppm)
ToxicityCategory
MRID No.Author/Year
StudyClassification
Rainbow trout(Oncorhynchus mykiss)flow-thru
90.78 6.1 moderatelytoxic
42540303Holmes 1992
core
Bluegill sunfish (Lepomis macrochirus)Flow-thru
90.78 5.37 moderatelytoxic
42540302Holmes 1992
core
Rainbow trout(Oncorhynchus mykiss)static
100 3.4 moderatelytoxic
40098001Mayer, 1986
core
Bluegill sunfish (Lepomis macrochirus)static
100 4.2 moderatelytoxic
40098001Mayer, 1986
core
Rainbow trout(Oncorhynchus mykiss)static
100 1.8 moderatelytoxic
40098001Mayer, 1986
supplemental(1)
Rainbow trout(Oncorhynchus mykiss)static
100 1.9 moderatelytoxic
40098001Mayer, 1986
core
Bluegill sunfish (Lepomis macrochirus)static
100 4.2 moderatelytoxic
40098001Mayer, 1986
core
Bluegill sunfish (Lepomis macrochirus)static
100 9.7 moderatelytoxic
40098001Mayer, 1986
supplemental(2)
Rainbow trout(Oncorhynchus mykiss)
tech. 2.82 moderatelytoxic
40991205Bills, 1985
supplemental(3)
Goldfish tech 5.32 moderatelytoxic
40991205Bills, 1985
supplemental(3)
Common Carp tech 4.22 moderatelytoxic
40991205Bills, 1985
supplemental(3)

Freshwater Fish Acute Toxicity
Species/(Flow-through or Static) % ai
96-hourLC50 (ppm)
ToxicityCategory
MRID No.Author/Year
StudyClassification
Page -77- Page 82 of239
Fathead minnow tech 6.2 moderatelytoxic
40991205Bills, 1985
supplemental(3)
White sucker tech 6.95 moderatelytoxic
40991205Bills, 1985
supplemental(3)
Channel catfish tech 6.4 moderatelytoxic
40991205Bills, 1985
supplemental(3)
Black bullhead tech 5.65 moderatelytoxic
40991205Bills, 1985
supplemental(3)
Green sunfish tech 12.2 moderatelytoxic
40991205Bills, 1985
supplemental(3)
Bluegill sunfish tech 4.0 moderatelytoxic
40991205Bills, 1985
supplemental(3)
Yellow perch tech 6.9 moderatelytoxic
40991205Bills, 1985
supplemental(3)
1 Supplemental because it was tested in hard water, 272 ppm CaCO3.2 Supplemental because it was tested in 12 oC.3 Supplemental due to lack of raw data. This study was prepared by U.S. Fish and Wildlife Service.
On an acute toxicity basis, PBO is moderately toxic to freshwater fish on an acute basis.
ii. Freshwater Fish, Chronic
A freshwater fish early life-stage test using the TGAI was required for PBO because the end-useproduct is expected to be transported to water from the intended use site, and the followingconditions are met: (1) the pesticide is intended for use such that its presence in water is likely tobe continuous or recurrent regardless of toxicity, (2) any aquatic acute LC50 or EC50 is less than 1mg/L, and (3) studies of other birds and small mammals indicate the reproductive physiology offish may be affected. The preferred test species is rainbow trout. Results of this test aretabulated below.
Species % ai Toxicity value Affectedendpoints
MRID No.Author/Year
StudyClassification
FatheadMinnow(Pimephalespromelas)
92.4 NOAEC = 0.04 ppmLOAEC = 0.11 ppm
embryo survivalat hatch andgrowth larval(total length andwet weight)
433003-01Machado, 1994
core
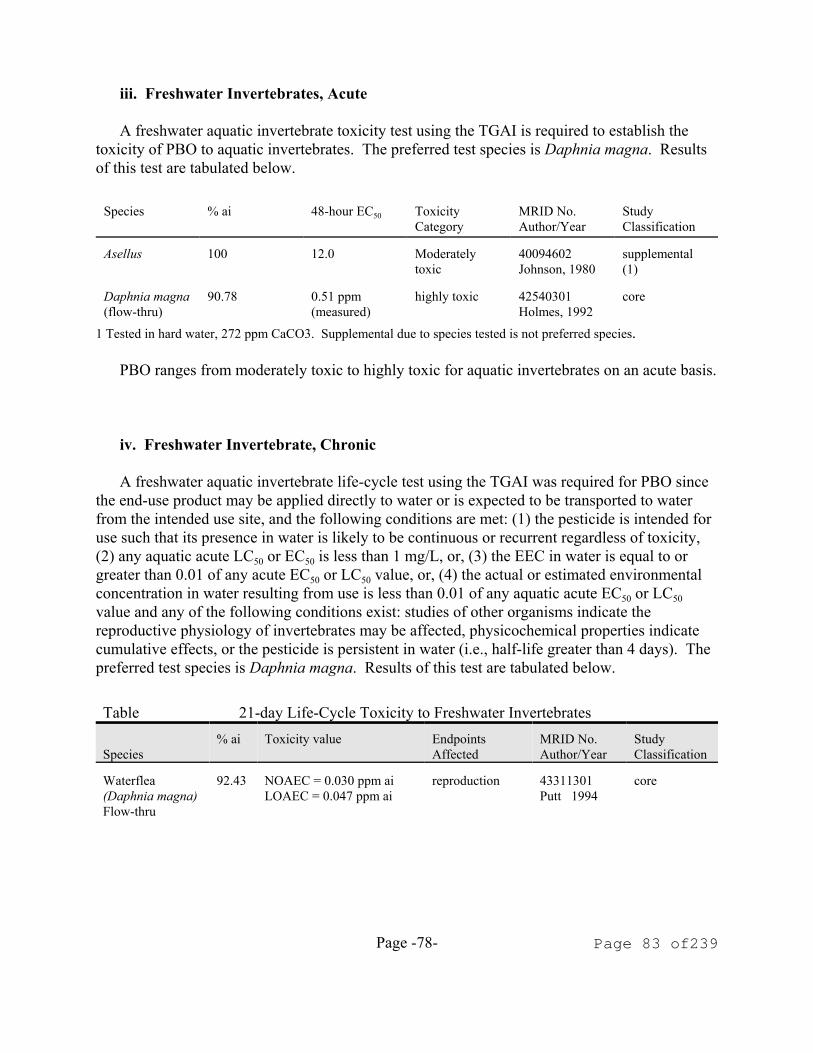
Page -78- Page 83 of239
iii. Freshwater Invertebrates, Acute
A freshwater aquatic invertebrate toxicity test using the TGAI is required to establish thetoxicity of PBO to aquatic invertebrates. The preferred test species is Daphnia magna. Resultsof this test are tabulated below.
Species % ai 48-hour EC50 ToxicityCategory
MRID No.Author/Year
StudyClassification
Asellus 100 12.0 Moderatelytoxic
40094602Johnson, 1980
supplemental(1)
Daphnia magna(flow-thru)
90.78 0.51 ppm(measured)
highly toxic 42540301Holmes, 1992
core
1 Tested in hard water, 272 ppm CaCO3. Supplemental due to species tested is not preferred species.
PBO ranges from moderately toxic to highly toxic for aquatic invertebrates on an acute basis.
iv. Freshwater Invertebrate, Chronic
A freshwater aquatic invertebrate life-cycle test using the TGAI was required for PBO sincethe end-use product may be applied directly to water or is expected to be transported to waterfrom the intended use site, and the following conditions are met: (1) the pesticide is intended foruse such that its presence in water is likely to be continuous or recurrent regardless of toxicity,(2) any aquatic acute LC50 or EC50 is less than 1 mg/L, or, (3) the EEC in water is equal to orgreater than 0.01 of any acute EC50 or LC50 value, or, (4) the actual or estimated environmentalconcentration in water resulting from use is less than 0.01 of any aquatic acute EC50 or LC50value and any of the following conditions exist: studies of other organisms indicate thereproductive physiology of invertebrates may be affected, physicochemical properties indicatecumulative effects, or the pesticide is persistent in water (i.e., half-life greater than 4 days). Thepreferred test species is Daphnia magna. Results of this test are tabulated below.
Table 21-day Life-Cycle Toxicity to Freshwater Invertebrates
Species% ai Toxicity value Endpoints
AffectedMRID No.Author/Year
StudyClassification
Waterflea (Daphnia magna)Flow-thru
92.43 NOAEC = 0.030 ppm aiLOAEC = 0.047 ppm ai
reproduction 43311301Putt 1994
core

Page -79- Page 84 of239
v. Amphibians
Although amphibian testing is not required under FIFRA, toxicity data was also collected onamphibians. The results are tabulated below.
Table Toxicity to Amphibians
Species % aiToxicity value LC50 (ppm)
MRID No.Author/Year
StudyClassification
Fowler’s toad(Bufo woodhousii)
tech. 1.0 (96 hr.) (1) supplemental
Western Chorus frog(Pseudacris triseriata)
100 0.210 (96 hr.) 40098001Mayer, 1986
supplemental
1 Sanders, H.O. 1970. Pesticide Toxicities to Tadpoles of the Western Chorus Frog Psuedacris triseriata andFowler’s Toad Bufo woodhousii. Copeia 2:246-251.
v. Toxicity to Estuarine and Marine Animals
Acute toxicity testing with estuarine/marine invertebrates and fish using the TGAI was requiredfor PBO because the end-use product is expected to reach this environment because of its use incoastal counties. The preferred test species is sheepshead minnow for fish and mysid shrimp andeastern oyster for invertebrates.
Species % ai 96-hour EC50 ToxicityCategory
MRID No.Author/Year
StudyClassification
Mysid Shrimp (Mysidopsis bahia)flow-thru
90.78 0.49 Highly toxic 43901801Roberts, 1995
core
Eastern Oyster(Crassostreavirginica) flow-thrushell deposition
90.78 0.23 mg ai/L highly toxic 425403-05Holmes, 1992
supplemental (1)
Sheepshead minnow(Cyrinodonvariegatus)flow-thru
90.78 3.94 mg ai/L moderatelytoxic
42540304Holmes, 1992
core

Page -80- Page 85 of239
Appendix D. Terrestrial Exposure T-REX model
Upper Bound Kenaga ResiduesFor RQ Calculation
Chemical Name: PBO Use 0
Formulation 0Application Rate 0.5 lbs
a.i./acreHalf-life 35 days
Application Interval 3 daysMaximum # Apps./Year 10
Length of Simulation 1 yearConcentration of
Concern300.00 (ppm)
Name of Concentrationof Concern
Avian chronic NOAEC
EndpointsAvian Bobwhite quail LD50
(mg/kg-bw)0
Bobwhite quail LD50(mg/kg-bw)
0
Bobwhite quail NOAEL(mg/kg-bw)
0
Bobwhite quail NOAEC(mg/kg-bw)
300
Mammals LD50 (mg/kg-bw)
4570
LC50 (mg/kg-diet)
0
NOAEL(mg/kg-bw)
89
NOAEC (mg/kg-diet) 1780
EECs (ppm) Kenaga
Values
Short Grass 931.91Tall Grass 427.13Broadleaf plants/smInsects
524.20
Fruits/pods/seeds/lginsects
58.24
Avian Results

Page -81- Page 86 of239
Avian Body % bodywgt
Adjusted
Class Weight consumed
LD50
Small 20 114 0Mid 100 65 0Large 1000 29 0
EECequivalent
dose (mg/kg-bw)
Avian Classes andBody Weights
small mid large
20 g 100 g 1000 g
Short Grass 1062 606 270Tall Grass 487 278 124Broadleaf plants/smInsects
598 341 152
Fruits/pods/lg insects 66 38 17
Dose-basedRQs (daily
dose/LD50)
AvianAcute RQs
20 g 100 g 1000 g
Short Grass #DIV/0! #DIV/0! #DIV/0!Tall Grass #DIV/0! #DIV/0! #DIV/0!
Broadleaf plants/sminsects
#DIV/0! #DIV/0! #DIV/0!
Fruits/pods/lg insects #DIV/0! #DIV/0! #DIV/0!
Dietary-based RQs
(EEC/LC50 orNOAEC)
RQs
Acute Chronic
Short Grass #DIV/0! 3.11Tall Grass #DIV/0! 1.42Broadleaf plants/smInsects
#DIV/0! 1.75
Fruits/pods/lg insects #DIV/0! 0.19

Page -82- Page 87 of239
MammalianResults
Mammalian Body % bodywgt
Adjusted Adjusted
Class Weight consumed LD50 NOAEL15 95 10044 196
Herbivores/ 35 66 8127 158insectivores 1000 15 3515 68
15 21 10044 196Grainvores 35 15 8127 158
1000 3 3515 68
EECequivalent
dose (mg/kg-bw)
Mammalian Classes and Bodyweight
Herbivores/ insectivores Granivores
15 g 35 g 1000 g 15 g 35 g 1000 gShort Grass 885 615 140Tall Grass 406 282 64Broadleaf plants/smInsects
498 346 79
Fruits/pods/seeds/lginsects
55 38 9 12 9 2
Dose-basedRQs (daily
dose/LD50 orNOAEL)
15 g mammal 35 gmammal
1000 g mammal
Acute Chronic Acute Chronic Acute ChronicShort Grass 0.09 4.53 0.08 3.89 0.04 2.04Tall Grass 0.04 2.07 0.03 1.78 0.02 0.94Broadleaf plants/sminsects
0.05 2.55 0.04 2.19 0.02 1.15
Fruits/pods/lg insects 0.01 0.28 0.00 0.24 0.00 0.13Seeds (granivore) 0.00 0.06 0.00 0.06 0.00 0.03
Dietary-basedRQs (EEC/LC50
Mammal RQs
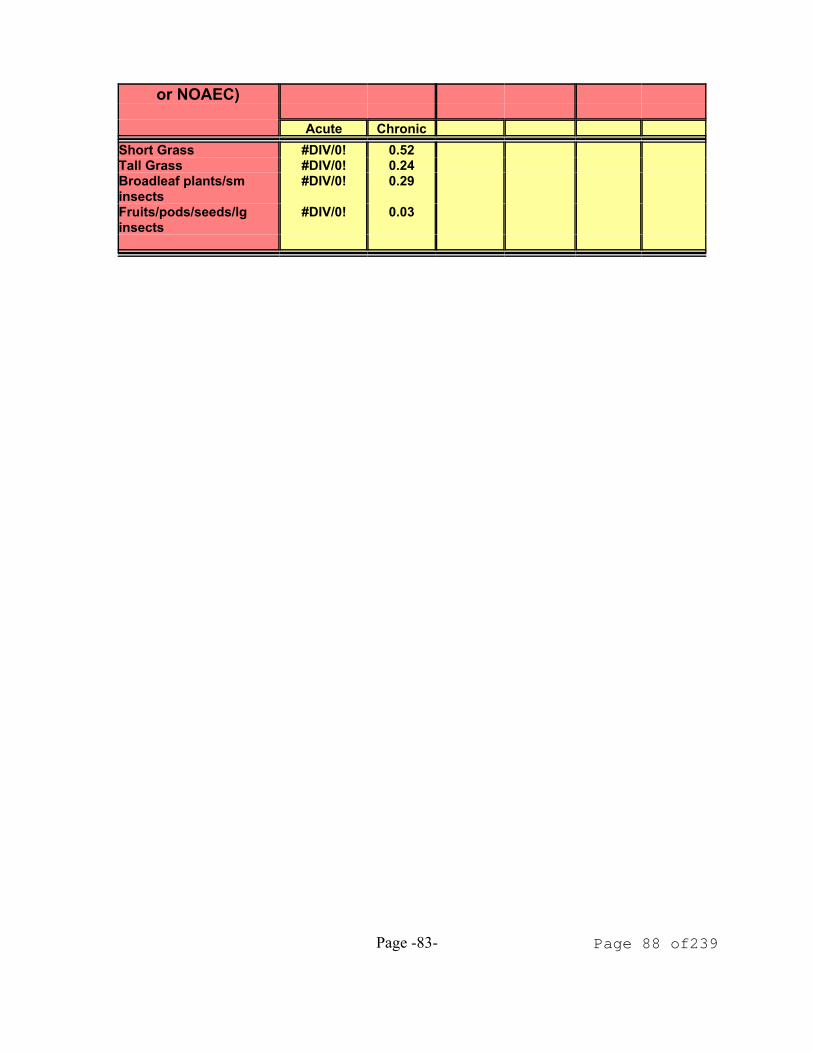
Page -83- Page 88 of239
or NOAEC)
Acute ChronicShort Grass #DIV/0! 0.52Tall Grass #DIV/0! 0.24Broadleaf plants/sminsects
#DIV/0! 0.29
Fruits/pods/seeds/lginsects
#DIV/0! 0.03
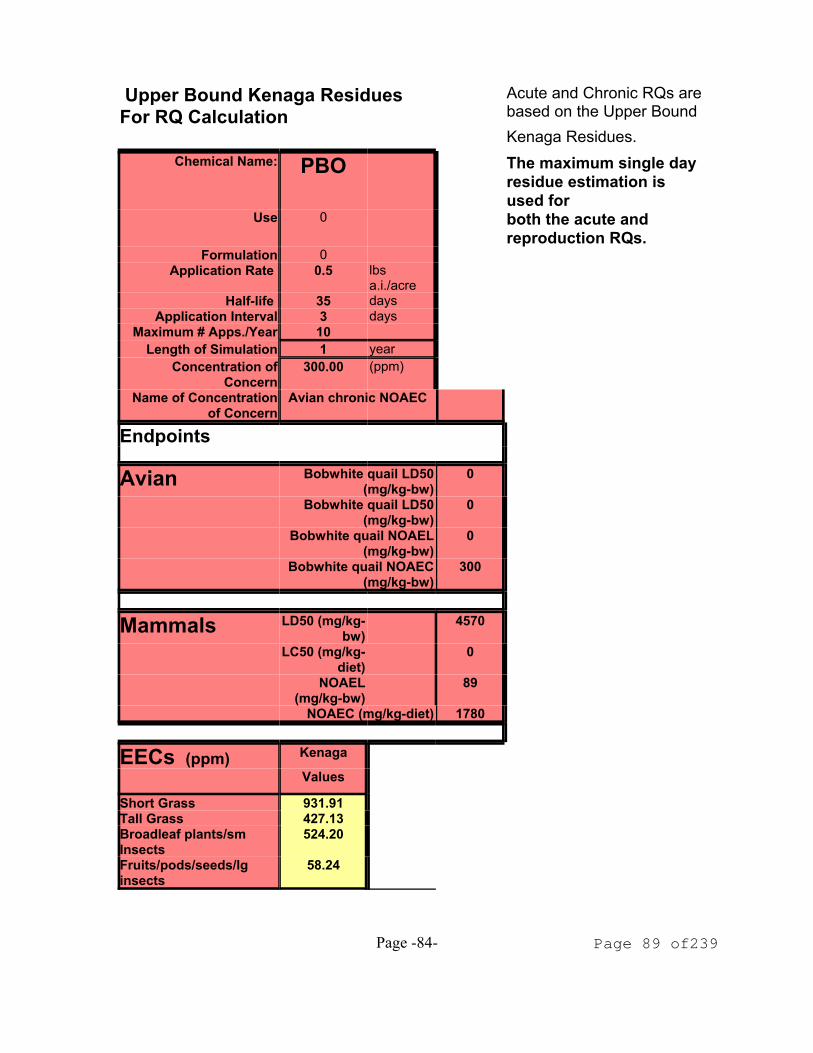
Page -84- Page 89 of239
Upper Bound Kenaga ResiduesFor RQ Calculation
Acute and Chronic RQs arebased on the Upper Bound Kenaga Residues.
Chemical Name: PBO The maximum single dayresidue estimation isused for
Use 0 both the acute andreproduction RQs.
Formulation 0Application Rate 0.5 lbs
a.i./acreHalf-life 35 days
Application Interval 3 daysMaximum # Apps./Year 10
Length of Simulation 1 yearConcentration of
Concern300.00 (ppm)
Name of Concentrationof Concern
Avian chronic NOAEC
Endpoints
Avian Bobwhite quail LD50(mg/kg-bw)
0
Bobwhite quail LD50(mg/kg-bw)
0
Bobwhite quail NOAEL(mg/kg-bw)
0
Bobwhite quail NOAEC(mg/kg-bw)
300
Mammals LD50 (mg/kg-bw)
4570
LC50 (mg/kg-diet)
0
NOAEL(mg/kg-bw)
89
NOAEC (mg/kg-diet) 1780
EECs (ppm) Kenaga
Values
Short Grass 931.91Tall Grass 427.13Broadleaf plants/smInsects
524.20
Fruits/pods/seeds/lginsects
58.24

Page -85- Page 90 of239
Avian ResultsAvian Body % body
wgtAdjusted
Class Weight consumed
LD50
Small 20 114 0Mid 100 65 0Large 1000 29 0
EECequivalent
dose (mg/kg-bw)
Avian Classes andBody Weights
small mid large20 g 100 g 1000 g
Short Grass 1062 606 270Tall Grass 487 278 124Broadleaf plants/smInsects
598 341 152
Fruits/pods/lg insects 66 38 17
Dose-basedRQs (daily
dose/LD50)
AvianAcute RQs
20 g 100 g 1000 g
Short Grass #DIV/0! #DIV/0! #DIV/0!Tall Grass #DIV/0! #DIV/0! #DIV/0!
Broadleaf plants/sminsects
#DIV/0! #DIV/0! #DIV/0!
Fruits/pods/lg insects #DIV/0! #DIV/0! #DIV/0!
Dietary-based RQs
(EEC/LC50 orNOAEC)
RQs
Acute Chronic
Short Grass #DIV/0! 3.11Tall Grass #DIV/0! 1.42Broadleaf plants/smInsects
#DIV/0! 1.75
Fruits/pods/lg insects #DIV/0! 0.19

Page -86- Page 91 of239
MammalianResults
Mammalian Body % bodywgt
Adjusted Adjusted
Class Weight consumed LD50 NOAEL15 95 10044 196
Herbivores/ 35 66 8127 158insectivores 1000 15 3515 68
15 21 10044 196Grainvores 35 15 8127 158
1000 3 3515 68
EECequivalent
dose (mg/kg-bw)
Mammalian Classes and Bodyweight
Herbivores/ insectivores Granivores
15 g 35 g 1000 g 15 g 35 g 1000 gShort Grass 885 615 140Tall Grass 406 282 64Broadleaf plants/smInsects
498 346 79
Fruits/pods/seeds/lginsects
55 38 9 12 9 2
Dose-basedRQs (daily
dose/LD50 orNOAEL)
15 g mammal 35 gmammal
1000 g mammal
Acute Chronic Acute Chronic Acute ChronicShort Grass 0.09 4.53 0.08 3.89 0.04 2.04Tall Grass 0.04 2.07 0.03 1.78 0.02 0.94Broadleaf plants/sminsects
0.05 2.55 0.04 2.19 0.02 1.15
Fruits/pods/lg insects 0.01 0.28 0.00 0.24 0.00 0.13Seeds (granivore) 0.00 0.06 0.00 0.06 0.00 0.03
Dietary-basedRQs (EEC/LC50
or NOAEC)
Mammal RQs
Acute Chronic
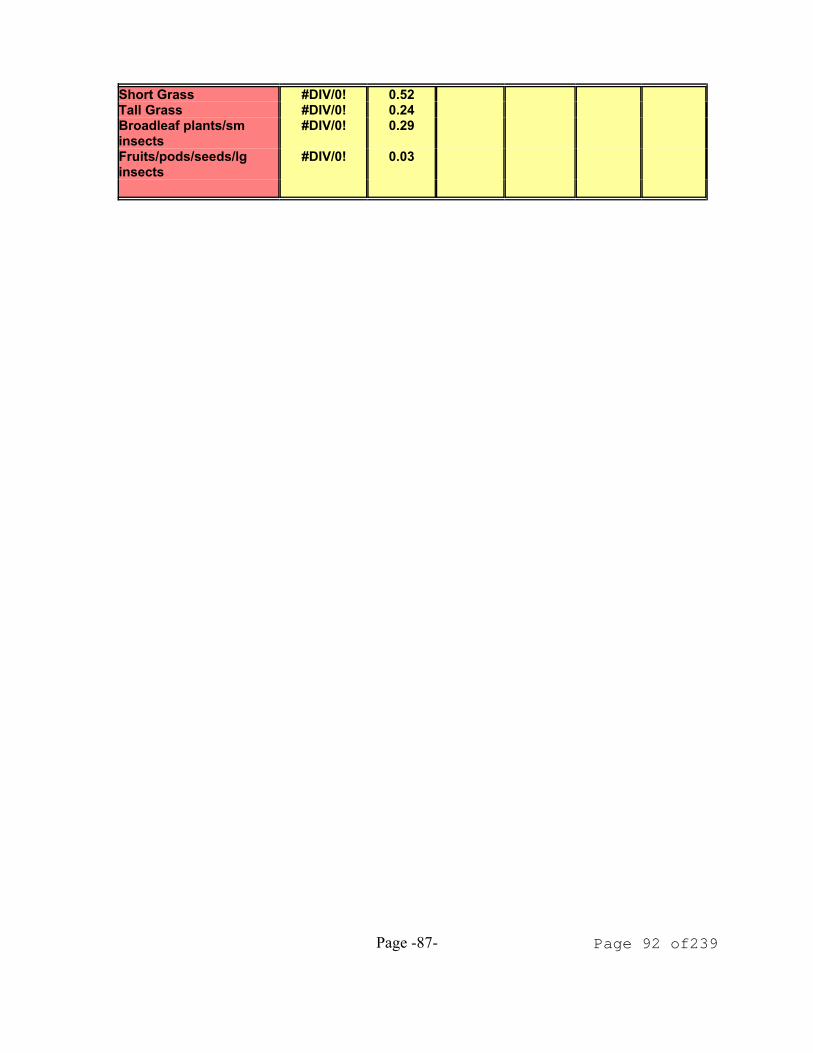
Page -87- Page 92 of239
Short Grass #DIV/0! 0.52Tall Grass #DIV/0! 0.24Broadleaf plants/sminsects
#DIV/0! 0.29
Fruits/pods/seeds/lginsects
#DIV/0! 0.03
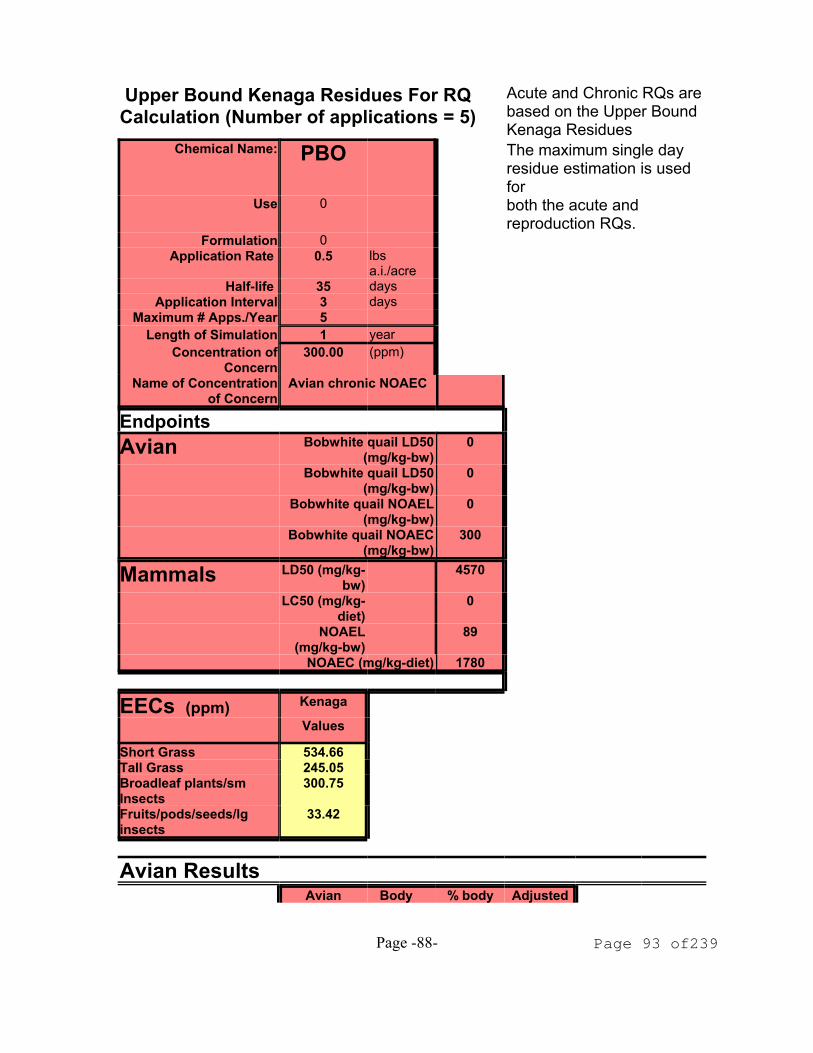
Page -88- Page 93 of239
Upper Bound Kenaga Residues For RQCalculation (Number of applications = 5)
Acute and Chronic RQs arebased on the Upper BoundKenaga Residues
Chemical Name: PBO The maximum single dayresidue estimation is usedfor
Use 0 both the acute andreproduction RQs.
Formulation 0Application Rate 0.5 lbs
a.i./acreHalf-life 35 days
Application Interval 3 daysMaximum # Apps./Year 5
Length of Simulation 1 yearConcentration of
Concern300.00 (ppm)
Name of Concentrationof Concern
Avian chronic NOAEC
EndpointsAvian Bobwhite quail LD50
(mg/kg-bw)0
Bobwhite quail LD50(mg/kg-bw)
0
Bobwhite quail NOAEL(mg/kg-bw)
0
Bobwhite quail NOAEC(mg/kg-bw)
300
Mammals LD50 (mg/kg-bw)
4570
LC50 (mg/kg-diet)
0
NOAEL(mg/kg-bw)
89
NOAEC (mg/kg-diet) 1780
EECs (ppm) Kenaga
Values
Short Grass 534.66Tall Grass 245.05Broadleaf plants/smInsects
300.75
Fruits/pods/seeds/lginsects
33.42
Avian ResultsAvian Body % body Adjusted
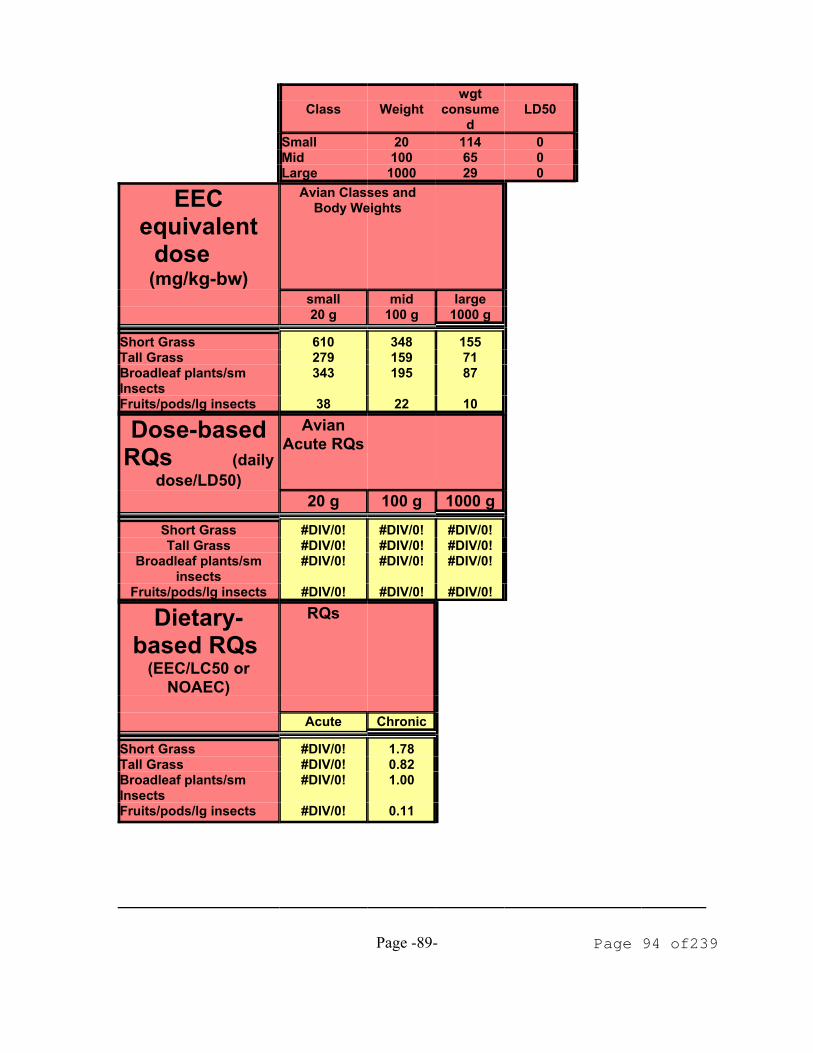
Page -89- Page 94 of239
wgtClass Weight consume
dLD50
Small 20 114 0Mid 100 65 0Large 1000 29 0
EECequivalent
dose (mg/kg-bw)
Avian Classes andBody Weights
small mid large20 g 100 g 1000 g
Short Grass 610 348 155Tall Grass 279 159 71Broadleaf plants/smInsects
343 195 87
Fruits/pods/lg insects 38 22 10
Dose-basedRQs (daily
dose/LD50)
AvianAcute RQs
20 g 100 g 1000 g
Short Grass #DIV/0! #DIV/0! #DIV/0!Tall Grass #DIV/0! #DIV/0! #DIV/0!
Broadleaf plants/sminsects
#DIV/0! #DIV/0! #DIV/0!
Fruits/pods/lg insects #DIV/0! #DIV/0! #DIV/0!
Dietary-based RQs
(EEC/LC50 orNOAEC)
RQs
Acute Chronic
Short Grass #DIV/0! 1.78Tall Grass #DIV/0! 0.82Broadleaf plants/smInsects
#DIV/0! 1.00
Fruits/pods/lg insects #DIV/0! 0.11

Page -90- Page 95 of239
Mammalian ResultsMammalian Body % body
wgtAdjusted Adjusted
Class Weight consumed LD50 NOAEL15 95 10044 196
Herbivores/ 35 66 8127 158insectivores 1000 15 3515 68
15 21 10044 196Grainvores 35 15 8127 158
1000 3 3515 68
EECequivalent
dose (mg/kg-bw)
Mammalian Classes and Bodyweight
Herbivores/ insectivores Granivores
15 g 35 g 1000 g 15 g 35 g 1000 g
Short Grass 508 353 80Tall Grass 233 162 37Broadleaf plants/smInsects
286 198 45
Fruits/pods/seeds/lginsects
32 22 5 7 5 1
Dose-basedRQs (daily
dose/LD50 orNOAEL)
15 g mammal 35 g mammal 1000 g mammal
Acute Chronic Acute Chronic Acute Chronic
Short Grass 0.05 2.60 0.04 2.23 0.02 1.17Tall Grass 0.02 1.19 0.02 1.02 0.01 0.54Broadleaf plants/sminsects
0.03 1.46 0.02 1.25 0.01 0.66
Fruits/pods/lg insects 0.00 0.16 0.00 0.14 0.00 0.07Seeds (granivore) 0.00 0.04 0.00 0.03 0.00 0.01
Dietary-basedRQs (EEC/LC50
or NOAEC)
Mammal RQs
Acute Chronic
Short Grass #DIV/0! 0.30Tall Grass #DIV/0! 0.14Broadleaf plants/sminsects
#DIV/0! 0.17
Fruits/pods/seeds/lginsects
#DIV/0! 0.02

Page -91- Page 96 of239
Mean Kenaga Residue Values on 5 applications per year
Mean Kenaga Residues Chemical Name: PBO
Use 0 Formulation 0
Application Rate 0.5 lbs a.i./acreHalf-life 35 days
Application Interval 3 daysMaximum # Apps./Year 5
Length of Simulation 1 yearConcentration of
Concern300.00 (ppm)
Name of Concentrationof Concern
Avian chronic NOAEC
EndpointsAvian Bobwhite quail LD50
(mg/kg-bw)0
Bobwhite quail LD50(mg/kg-bw)
0
Bobwhite quail NOAEL(mg/kg-bw)
0
Bobwhite quail NOAEC(mg/kg-bw)
300
Mammals LD50 (mg/kg-bw) 4570
LC50 (mg/kg-diet) 0NOAEL (mg/kg-bw) 89
NOAEC (mg/kg-diet) 1780
EECs (ppm) Kenaga
Values
Short Grass 189.36Tall Grass 80.20Broadleaf plants/smInsects
100.25
Fruits/pods/seeds/lginsects
15.59
Avian ResultsAvian Body % body
wgtAdjusted
Class Weight consumed LD50Small 20 114 0Mid 100 65 0Large 1000 29 0
EECequivalent
Avian Classes and Body Weights
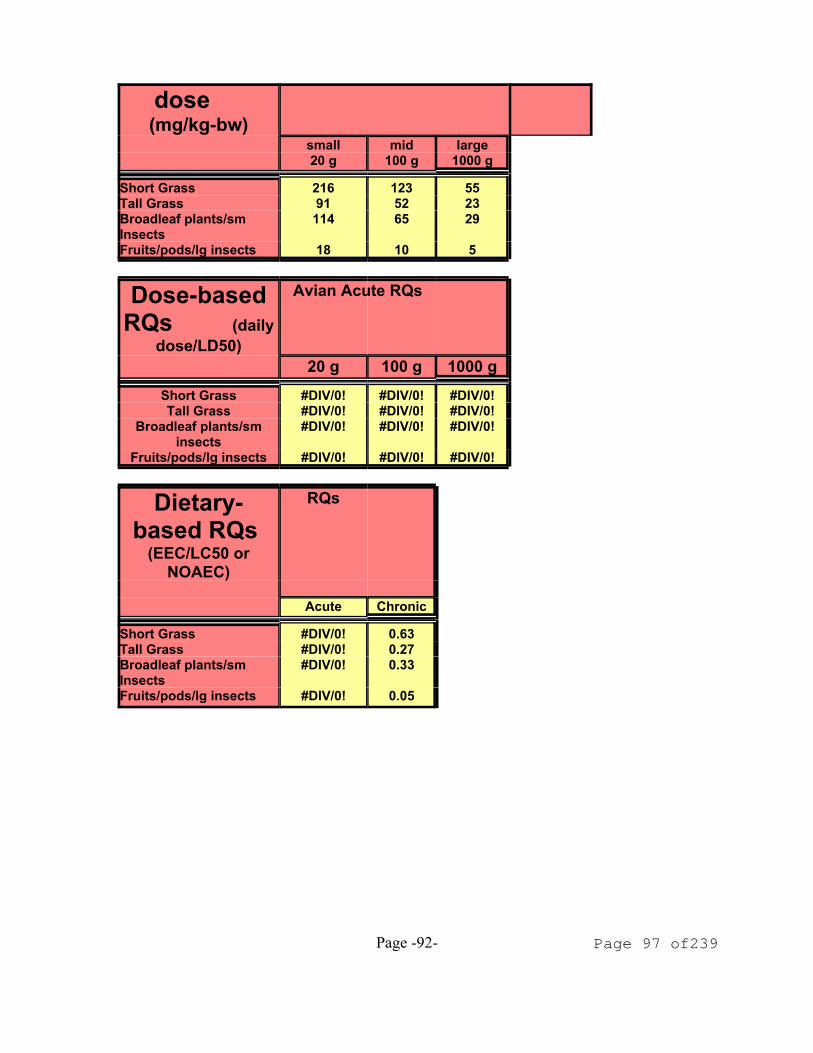
Page -92- Page 97 of239
dose (mg/kg-bw)
small mid large20 g 100 g 1000 g
Short Grass 216 123 55Tall Grass 91 52 23Broadleaf plants/smInsects
114 65 29
Fruits/pods/lg insects 18 10 5
Dose-basedRQs (daily
dose/LD50)
Avian Acute RQs
20 g 100 g 1000 g
Short Grass #DIV/0! #DIV/0! #DIV/0!Tall Grass #DIV/0! #DIV/0! #DIV/0!
Broadleaf plants/sminsects
#DIV/0! #DIV/0! #DIV/0!
Fruits/pods/lg insects #DIV/0! #DIV/0! #DIV/0!
Dietary-based RQs
(EEC/LC50 orNOAEC)
RQs
Acute Chronic
Short Grass #DIV/0! 0.63Tall Grass #DIV/0! 0.27Broadleaf plants/smInsects
#DIV/0! 0.33
Fruits/pods/lg insects #DIV/0! 0.05
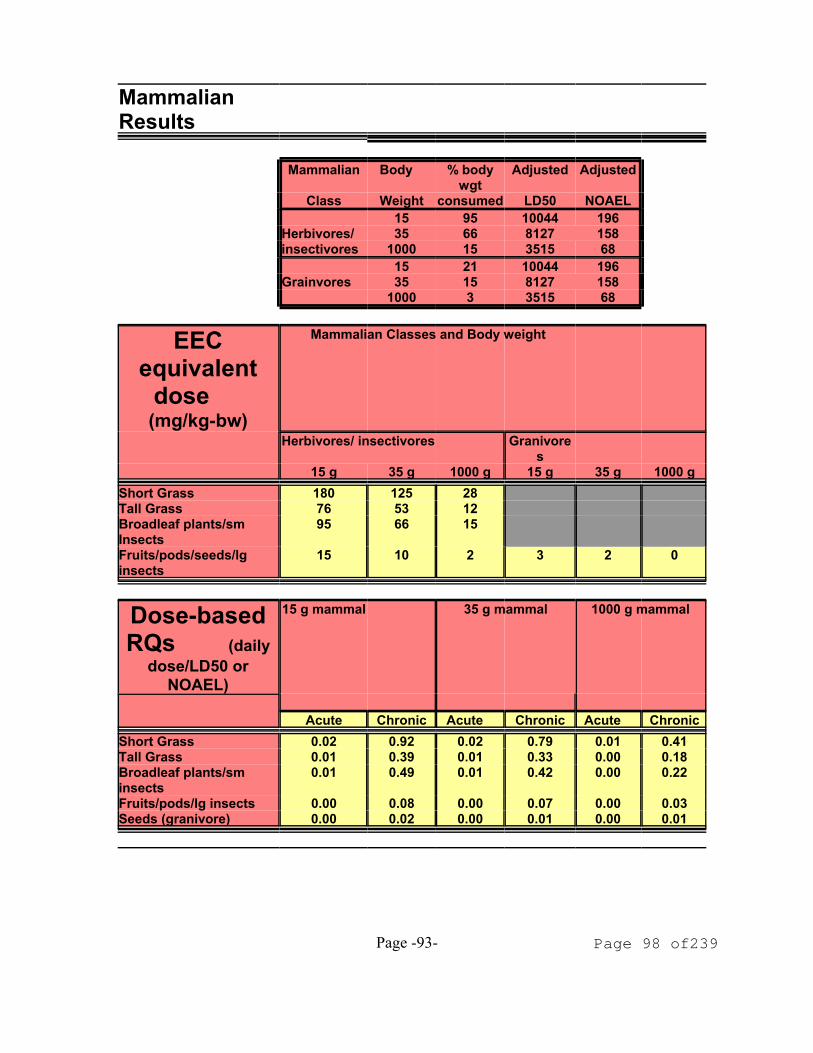
Page -93- Page 98 of239
MammalianResults
Mammalian Body % bodywgt
Adjusted Adjusted
Class Weight consumed LD50 NOAEL15 95 10044 196
Herbivores/ 35 66 8127 158insectivores 1000 15 3515 68
15 21 10044 196Grainvores 35 15 8127 158
1000 3 3515 68
EECequivalent
dose (mg/kg-bw)
Mammalian Classes and Body weight
Herbivores/ insectivores Granivores
15 g 35 g 1000 g 15 g 35 g 1000 gShort Grass 180 125 28Tall Grass 76 53 12Broadleaf plants/smInsects
95 66 15
Fruits/pods/seeds/lginsects
15 10 2 3 2 0
Dose-basedRQs (daily
dose/LD50 orNOAEL)
15 g mammal 35 g mammal 1000 g mammal
Acute Chronic Acute Chronic Acute ChronicShort Grass 0.02 0.92 0.02 0.79 0.01 0.41Tall Grass 0.01 0.39 0.01 0.33 0.00 0.18Broadleaf plants/sminsects
0.01 0.49 0.01 0.42 0.00 0.22
Fruits/pods/lg insects 0.00 0.08 0.00 0.07 0.00 0.03Seeds (granivore) 0.00 0.02 0.00 0.01 0.00 0.01

Page -94- Page 99 of239
Dietary-basedRQs (EEC/LC50
or NOAEC)
Mammal RQs
Acute Chronic
Short Grass #DIV/0! 0.11Tall Grass #DIV/0! 0.05Broadleaf plants/sminsects
#DIV/0! 0.06
Fruits/pods/seeds/lginsects
#DIV/0! 0.01
Application Rate Reduced to 0.25 lb ai/A. All other Parameters constant with otherinputs.
Upper Bound Kenaga Residues For RQCalculation (applic. rate = 0.25 lb ai/A)
Chemical Name: PBO Use 0
Formulation 0Application Rate 0.25 lbs
a.i./acreHalf-life 35 days
Application Interval 3 daysMaximum # Apps./Year 10
Length of Simulation 1 yearConcentration of
Concern300.00 (ppm)
Name of Concentrationof Concern
Avian chronic NOAEC
EndpointsAvian Bobwhite quail LD50
(mg/kg-bw)0
Bobwhite quail LD50(mg/kg-bw)
0
Bobwhite quail NOAEL(mg/kg-bw)
0
Bobwhite quail NOAEC(mg/kg-bw)
300
Mammals LD50 (mg/kg-bw)
4570
LC50 (mg/kg-diet)
0
NOAEL(mg/kg-bw)
89
NOAEC (mg/kg-diet) 1780
EECs (ppm) Kenaga

Page -95- Page 100 of239
Values
Short Grass 465.96Tall Grass 213.56Broadleaf plants/smInsects
262.10
Fruits/pods/seeds/lginsects
29.12
Avian ResultsAvian Body % body
wgtClass Weight consume
dSmall 20 114Mid 100 65Large 1000 29
EECequivalent
dose (mg/kg-bw)
Avian Classes andBody Weights
small mid large20 g 100 g 1000 g
Short Grass 531 303 135Tall Grass 243 139 62Broadleaf plants/smInsects
299 170 76
Fruits/pods/lg insects 33 19 8
Dose-basedRQs (daily
dose/LD50)
AvianAcute RQs
20 g 100 g 1000 g
Short Grass #DIV/0! #DIV/0! #DIV/0!Tall Grass #DIV/0! #DIV/0! #DIV/0!
Broadleaf plants/sminsects
#DIV/0! #DIV/0! #DIV/0!
Fruits/pods/lg insects #DIV/0! #DIV/0! #DIV/0!
Dietary-based RQs
(EEC/LC50 orNOAEC)
RQs

Page -96- Page 101 of239
Acute Chronic
Short Grass #DIV/0! 1.55Tall Grass #DIV/0! 0.71Broadleaf plants/smInsects
#DIV/0! 0.87
Fruits/pods/lg insects #DIV/0! 0.10
Mammalian ResultsMammalian Body % body
wgtAdjusted Adjusted
Class Weight consumed LD50 NOAEL15 95 10044 196
Herbivores/ 35 66 8127 158insectivores 1000 15 3515 68
15 21 10044 196Grainvores 35 15 8127 158
1000 3 3515 68
EECequivalent
dose (mg/kg-bw)
Mammalian Classes and Bodyweight
Herbivores/ insectivores Granivores
15 g 35 g 1000 g 15 g 35 g 1000 gShort Grass 443 308 70Tall Grass 203 141 32Broadleaf plants/smInsects
249 173 39
Fruits/pods/seeds/lginsects
28 19 4 6 4 1
Dose-basedRQs (daily
dose/LD50 orNOAEL)
15 g mammal 35 gmammal
1000 g mammal
Acute Chronic Acute Chronic Acute ChronicShort Grass 0.04 2.26 0.04 1.94 0.02 1.02Tall Grass 0.02 1.04 0.02 0.89 0.01 0.47Broadleaf plants/sminsects
0.02 1.27 0.02 1.09 0.01 0.57
Fruits/pods/lg insects 0.00 0.14 0.00 0.12 0.00 0.06Seeds (granivore) 0.00 0.03 0.00 0.03 0.00 0.01
Dietary-based Mammal RQs

Page -97- Page 102 of239
RQs (EEC/LC50or NOAEC)
Acute ChronicShort Grass #DIV/0! 0.26Tall Grass #DIV/0! 0.12Broadleaf plants/sminsects
#DIV/0! 0.15
Fruits/pods/seeds/lginsects
#DIV/0! 0.02
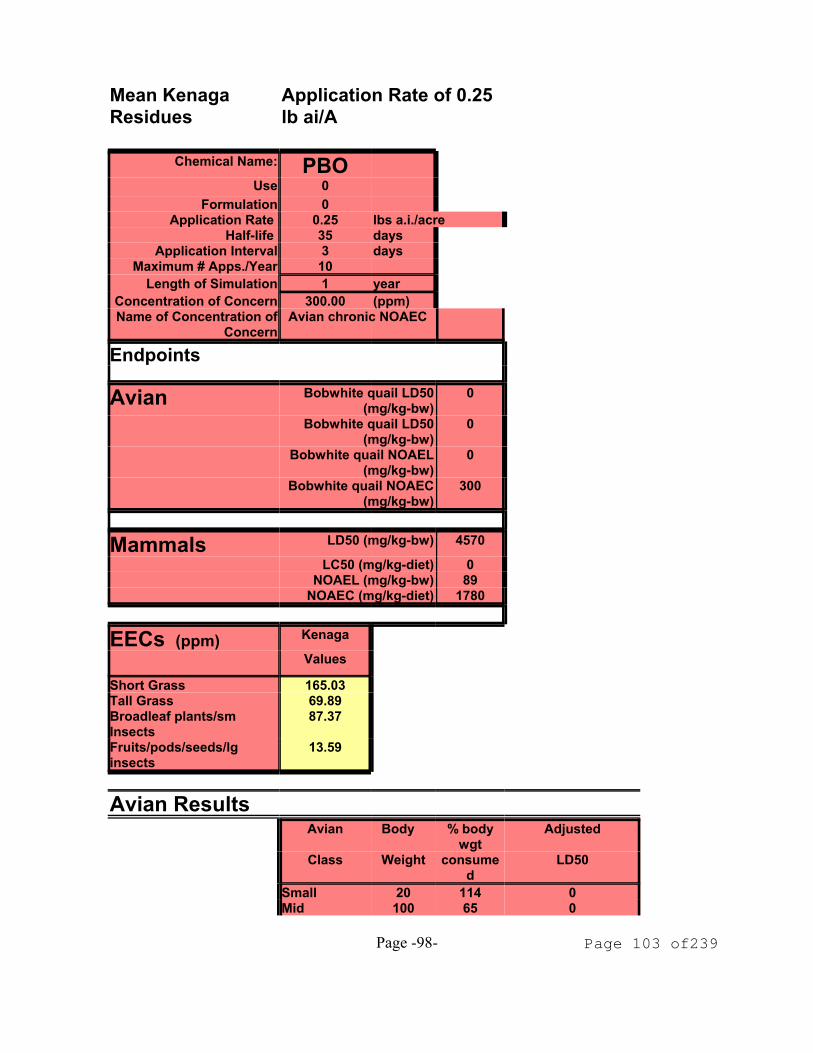
Page -98- Page 103 of239
Mean KenagaResidues
Application Rate of 0.25lb ai/A
Chemical Name: PBO Use 0
Formulation 0Application Rate 0.25 lbs a.i./acre
Half-life 35 days Application Interval 3 days
Maximum # Apps./Year 10Length of Simulation 1 year
Concentration of Concern 300.00 (ppm)Name of Concentration of
ConcernAvian chronic NOAEC
Endpoints
Avian Bobwhite quail LD50(mg/kg-bw)
0
Bobwhite quail LD50(mg/kg-bw)
0
Bobwhite quail NOAEL(mg/kg-bw)
0
Bobwhite quail NOAEC(mg/kg-bw)
300
Mammals LD50 (mg/kg-bw) 4570
LC50 (mg/kg-diet) 0NOAEL (mg/kg-bw) 89
NOAEC (mg/kg-diet) 1780
EECs (ppm) Kenaga
Values
Short Grass 165.03Tall Grass 69.89Broadleaf plants/smInsects
87.37
Fruits/pods/seeds/lginsects
13.59
Avian ResultsAvian Body % body
wgtAdjusted
Class Weight consumed
LD50
Small 20 114 0Mid 100 65 0

Page -99- Page 104 of239
Large 1000 29 0
EECequivalent
dose (mg/kg-bw)
Avian Classes and Body Weights
small mid large20 g 100 g 1000 g
Short Grass 188 107 48Tall Grass 80 45 20Broadleaf plants/smInsects
100 57 25
Fruits/pods/lg insects 15 9 4
Dose-basedRQs (daily
dose/LD50)
Avian Acute RQs
20 g 100 g 1000 g
Short Grass #DIV/0! #DIV/0! #DIV/0!Tall Grass #DIV/0! #DIV/0! #DIV/0!
Broadleaf plants/sminsects
#DIV/0! #DIV/0! #DIV/0!
Fruits/pods/lg insects #DIV/0! #DIV/0! #DIV/0!
Dietary-basedRQs (EEC/LC50 or
NOAEC)
RQs
Acute Chronic
Short Grass #DIV/0! 0.55Tall Grass #DIV/0! 0.23Broadleaf plants/smInsects
#DIV/0! 0.29
Fruits/pods/lg insects #DIV/0! 0.05
PBO 0 Mean Kenaga Residues
MammalianResults
Mammalian Body % bodywgt
Adjusted Adjusted
Class Weight consumed LD50 NOAEL15 95 10044 196

Page -100- Page 105 of239
Herbivores/ 35 66 8127 158insectivores 1000 15 3515 68
15 21 10044 196Grainvores 35 15 8127 158
1000 3 3515 68
EECequivalent
dose (mg/kg-bw)
Mammalian Classes and Body weight
Herbivores/ insectivores Granivores
15 g 35 g 1000 g 15 g 35 g 1000 gShort Grass 157 109 25Tall Grass 66 46 10Broadleaf plants/smInsects
83 58 13
Fruits/pods/seeds/lginsects
13 9 2 3 2 0
Dose-basedRQs (daily
dose/LD50 orNOAEL)
15 g mammal 35 g mammal 1000 g mammal
Acute Chronic Acute Chronic Acute ChronicShort Grass 0.02 0.80 0.01 0.69 0.01 0.36Tall Grass 0.01 0.34 0.01 0.29 0.00 0.15Broadleaf plants/sminsects
0.01 0.42 0.01 0.36 0.00 0.19
Fruits/pods/lg insects 0.00 0.07 0.00 0.06 0.00 0.03Seeds (granivore) 0.00 0.01 0.00 0.01 0.00 0.01
Dietary-basedRQs (EEC/LC50
or NOAEC)
Mammal RQs
Acute ChronicShort Grass #DIV/0! 0.09Tall Grass #DIV/0! 0.04Broadleaf plants/sminsects
#DIV/0! 0.05
Fruits/pods/seeds/lginsects
#DIV/0! 0.01
Interval Increased to 6 days. All other Parameters constant with other inputs.

Page -101- Page 106 of239
Upper Bound Kenaga Residues For RQCalculation (Interval = 6 days)
Chemical Name: PBO Use 0
Formulation 0Application Rate 0.5 lbs
a.i./acreHalf-life 35 days
Application Interval 6 daysMaximum # Apps./Year 10
Length of Simulation 1 yearConcentration of
Concern300.00 (ppm)
Name of Concentrationof Concern
Avian chronic NOAEC
EndpointsAvian Bobwhite quail LD50
(mg/kg-bw)0
Bobwhite quail LD50(mg/kg-bw)
0
Bobwhite quail NOAEL(mg/kg-bw)
0
Bobwhite quail NOAEC(mg/kg-bw)
300
Mammals LD50 (mg/kg-bw)
4570
LC50 (mg/kg-diet)
0
NOAEL(mg/kg-bw)
89
NOAEC (mg/kg-diet) 1780
EECs (ppm) Kenaga
Values
Short Grass 744.66Tall Grass 341.30Broadleaf plants/smInsects
418.87
Fruits/pods/seeds/lginsects
46.54
Avian Results
Avian Body % bodywgt
Adjusted
Class Weight consumed
LD50
Small 20 114 0

Page -102- Page 107 of239
Mid 100 65 0Large 1000 29 0
EECequivalent
dose (mg/kg-bw)
Avian Classes andBody Weights
small mid large20 g 100 g 1000 g
Short Grass 849 484 216Tall Grass 389 222 99Broadleaf plants/smInsects
478 272 121
Fruits/pods/lg insects 53 30 13
Dose-basedRQs (daily
dose/LD50)
AvianAcute RQs
20 g 100 g 1000 g
Short Grass #DIV/0! #DIV/0! #DIV/0!Tall Grass #DIV/0! #DIV/0! #DIV/0!
Broadleaf plants/sminsects
#DIV/0! #DIV/0! #DIV/0!
Fruits/pods/lg insects #DIV/0! #DIV/0! #DIV/0!
Dietary-based RQs
(EEC/LC50 orNOAEC)
RQs
Acute Chronic
Short Grass #DIV/0! 2.48Tall Grass #DIV/0! 1.14Broadleaf plants/smInsects
#DIV/0! 1.40
Fruits/pods/lg insects #DIV/0! 0.16
Mammalian ResultsMammalian Body % body
wgtAdjusted Adjusted
Class Weight consumed LD50 NOAEL15 95 10044 196
Herbivores/ 35 66 8127 158insectivores 1000 15 3515 68
15 21 10044 196

Page -103- Page 108 of239
Grainvores 35 15 8127 1581000 3 3515 68
EECequivalent
dose (mg/kg-bw)
Mammalian Classes and Bodyweight
Herbivores/ insectivores Granivores
15 g 35 g 1000 g 15 g 35 g 1000 gShort Grass 707 491 112Tall Grass 324 225 51Broadleaf plants/smInsects
398 276 63
Fruits/pods/seeds/lginsects
44 31 7 10 7 1
Dose-basedRQs (daily
dose/LD50 orNOAEL)
15 g mammal 35 gmammal
1000 g mammal
Acute Chronic Acute Chronic Acute ChronicShort Grass 0.07 3.62 0.06 3.11 0.03 1.63Tall Grass 0.03 1.66 0.03 1.42 0.01 0.75Broadleaf plants/sminsects
0.04 2.03 0.03 1.75 0.02 0.92
Fruits/pods/lg insects 0.00 0.23 0.00 0.19 0.00 0.10Seeds (granivore) 0.00 0.05 0.00 0.04 0.00 0.02
Dietary-basedRQs (EEC/LC50
or NOAEC)
Mammal RQs
Acute Chronic
Short Grass #DIV/0! 0.42Tall Grass #DIV/0! 0.19Broadleaf plants/sminsects
#DIV/0! 0.24
Fruits/pods/seeds/lginsects
#DIV/0! 0.03
Mean Kenaga Residues (interval = 6 days)
Chemical Name: PBO

Page -104- Page 109 of239
Use 0 Formulation 0
Application Rate 0.5 lbs a.i./acreHalf-life 35 days
Application Interval 6 daysMaximum # Apps./Year 10
Length of Simulation 1 yearConcentration of
Concern300.00 (ppm)
Name of Concentrationof Concern
Avian chronic NOAEC
EndpointsAvian Bobwhite quail LD50
(mg/kg-bw)0
Bobwhite quail LD50(mg/kg-bw)
0
Bobwhite quail NOAEL(mg/kg-bw)
0
Bobwhite quail NOAEC(mg/kg-bw)
300
Mammals LD50 (mg/kg-bw) 4570
LC50 (mg/kg-diet) 0NOAEL (mg/kg-bw) 89
NOAEC (mg/kg-diet) 1780
EECs (ppm) Kenaga
Values
Short Grass 263.73Tall Grass 111.70Broadleaf plants/smInsects
139.62
Fruits/pods/seeds/lginsects
21.72
Avian ResultsAvian Body % body wgt AdjustedClass Weight consumed LD50
Small 20 114 0Mid 100 65 0Large 1000 29 0
EECequivalent
dose
Avian Classes and Body Weights

Page -105- Page 110 of239
(mg/kg-bw)small mid large20 g 100 g 1000 g
Short Grass 301 171 76Tall Grass 127 73 32Broadleaf plants/smInsects
159 91 40
Fruits/pods/lg insects 25 14 6
Dose-basedRQs (daily
dose/LD50)
Avian Acute RQs
20 g 100 g 1000 g
Short Grass #DIV/0! #DIV/0! #DIV/0!Tall Grass #DIV/0! #DIV/0! #DIV/0!
Broadleaf plants/sminsects
#DIV/0! #DIV/0! #DIV/0!
Fruits/pods/lg insects #DIV/0! #DIV/0! #DIV/0!
Dietary-based RQs
(EEC/LC50 orNOAEC)
RQs
Acute Chronic
Short Grass #DIV/0! 0.88Tall Grass #DIV/0! 0.37Broadleaf plants/smInsects
#DIV/0! 0.47
Fruits/pods/lg insects #DIV/0! 0.07
PBO 0 Mean Kenaga Residues
MammalianResults
Mammalian Body % bodywgt
Adjusted Adjusted
Class Weight consumed LD50 NOAEL15 95 10044 196
Herbivores/ 35 66 8127 158insectivores 1000 15 3515 68
15 21 10044 196

Page -106- Page 111 of239
Grainvores 35 15 8127 1581000 3 3515 68
EECequivalent
dose (mg/kg-bw)
Mammalian Classes and Body weight
Herbivores/ insectivores Granivores
15 g 35 g 1000 g 15 g 35 g 1000 gShort Grass 251 174 40Tall Grass 106 74 17Broadleaf plants/smInsects
133 92 21
Fruits/pods/seeds/lginsects
21 14 3 5 3 1
Dose-basedRQs(daily
dose/LD50 orNOAEL)
15 g mammal 35 g mammal 1000 g mammal
Acute Chronic Acute Chronic Acute Chronic
Short Grass 0.02 1.28 0.02 1.10 0.01 0.58Tall Grass 0.01 0.54 0.01 0.47 0.00 0.24Broadleaf plants/sminsects
0.01 0.68 0.01 0.58 0.01 0.31
Fruits/pods/lg insects 0.00 0.11 0.00 0.09 0.00 0.05Seeds (granivore) 0.00 0.02 0.00 0.02 0.00 0.01
Dietary-basedRQs (EEC/LC50
or NOAEC)
Mammal RQs
Acute Chronic
Short Grass #DIV/0! 0.15Tall Grass #DIV/0! 0.06Broadleaf plants/sminsects
#DIV/0! 0.08
Fruits/pods/seeds/lginsects
#DIV/0! 0.01

Page -107- Page 112 of239
T-REX Model Description T-REX Version 1.1 December 7, 2004
Upper Bound and Mean Kenaga Residue and RQ
This spreadsheet-based model calculates the decay of a chemical applied to foliarsurfaces for single or multiple applications. It uses the same principle as the batchcode models FATE and TERREEC that calculate terrestrial exposure concentrationestimates on plant surfaces following pesticide application. A first order decayassumption is used to determine the concentration at each day after initial applicationbased on the concentration resulting from the initial and additional applications. Thedecay is calculated from the first order rate equation:
C0 = Cie-kt
or in log form:ln(Ci) = kT – ln(C0)
Where
C0 = concentration at time T = day zero.
Ci = concentration, in parts per million (PPM), present initially (on day zero) onthe surfaces. Ci is calculated by multiplying the application rate, in pounds activeingredient per acre, by 240 for short grass, 110 for tall grass, and 135 for broad-leafed plants/small insects and 15 for fruits/pods/large insects based on theKenaga nomogram (Hoerger and Kenaga, 1972) as modified by Fletcher (1994). For maximum concentrations, additional applications are converted from poundsactive ingredient per acre to PPM on the plant surface and the additional massadded to the mass of the chemical still present on the surfaces on the day ofapplication.
k = If the foliar dissipation data submitted to EFED are found scientifically validand statistically robust for a specific pesticide, the 90% upper confidence limit ofthe mean half-lives should be used. When scientifically valid, statistically robustdata are not available, EFED recommends the using a default half-life value of 35days. The use of the 35-day half-life is based on the highest reported value (36.9days), as reported by Willis and McDowell (Pesticide persistence on foliage,Environ. Contam. Toxicol, 100:23-73, 1987).
t = time, in days, since the start of the simulation. The initial application is onday 0. The simulation is designed to run for 365 days.
The spreadsheet calculates the pesticide residue concentrations on each type ofsurface on a daily interval for one year. The maximum concentration during theyear is calculated for both maximum and mean residues.

Page -108- Page 113 of239
The calculated residue concentrations are used to calculate Avian and Mammalianrisk quotient (RQ) values. The maximum calculated concentration is divided byuser input values for acute and chronic endpoints to give RQs for each type ofplant surface.
Dosed- based RQ
In both worksheets, dose-based RQs are calculated using a body weight-adjustedLD50 and consumption-weighted equivalent dose. The scaling factors (USEPA,1993) used in the consumption-weighted (EECs) are:
Avian consumption F = 0.648* BW0.651
(1-W)Mammal consumption F = 0.621* BW0.564
(1-W)
These consumption-weighted EECs (i.e., EEC equivalent dose) are sorted by foodsource and body size. There is a corresponding table for birds and mammals.
The LD50 values entered on the input form are adjusted for animal class (20, 100and 1000 g birds and 15, 35, and 1000 g mammals) using the following equations:
Avian LD50 Adj. LD50 = LD50 (AW)(1.15 - 1)
(TW)Mammal LD50 Adj. LD50 = LD50 (AW)(0.25)
(TW)
The dose-based RQs are calculated by dividing the daily dose (EEC equivalentdose) by the adjusted LD50 for each food category and animal class.
For dietary-based RQs, the Kenaga EEC is divided by the LC50 (acute RQ) or theNOAEC (chronic RQ).
References
Fletcher, J.S., J.E. Nellesson and T. G. Pfleeger. 1994. Literature review andevaluation of the EPA food-chain(Kenaga) nomogram, an instrument forestimating pesticide residues on plants. Environ. Tox. and Chem.13(9):1383-1391

Page -109- Page 114 of239
Hoerger, F. and E.E. Kenaga. 1972. Pesticide residues on plants: correlation ofrespresentative dada as a basis for estimation of their magnitude in theenvironment. IN: F. Coulston and F. Corte, eds., Environmental Quality andSafety: Chemistry, Toxicology and Technology. Vol 1. Georg TheimePublishers, Stuttgart, Germany. pp. 9-28
Mineau, P., B.T. Collins, A. Baril. 1996. On the use of scaling factors toimprove interspecies extrapolation to acute toxicity in birds. Reg. Toxicol.Pharmacol. 24:24-29
USEPA. 1993. Wildlife Exposure Factors Handbook. Volume I of II. EPA/600/R-93/187a. Office of Research and Development, Washington, D. C.20460.
Willis and McDowell. 1987. Pesticide persistence on foliage. Environ. Contam.Toxicol. 100:23-73
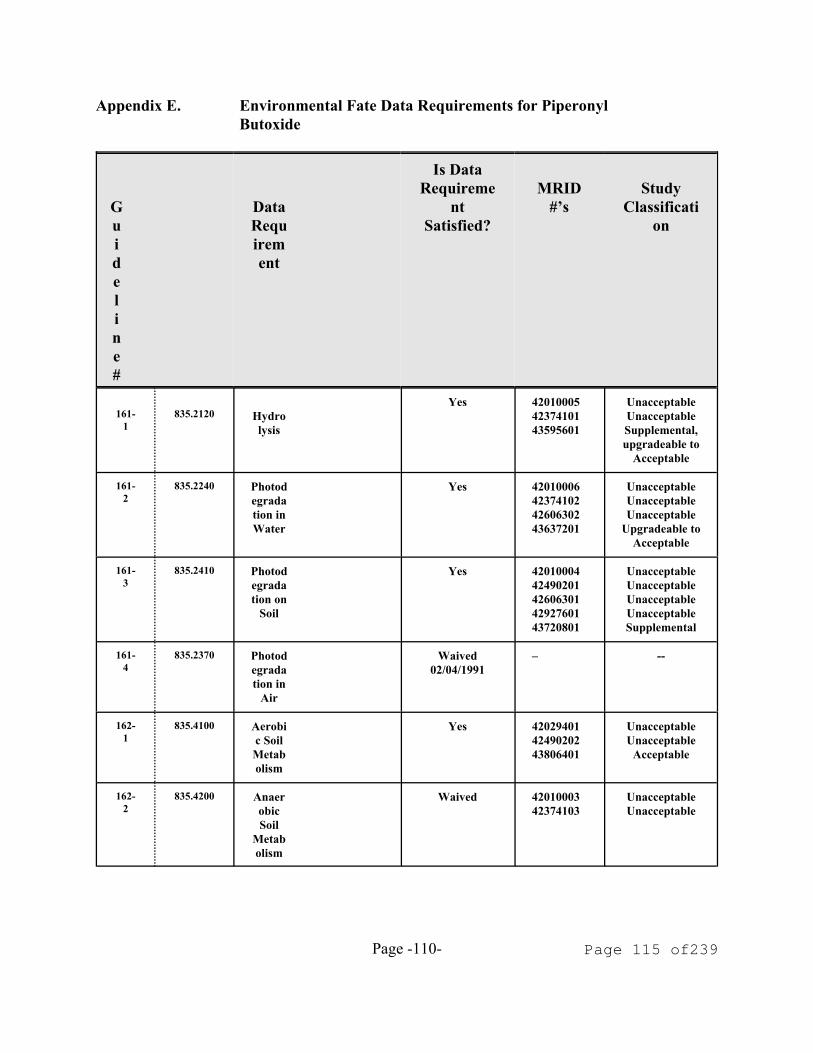
Page -110- Page 115 of239
Appendix E. Environmental Fate Data Requirements for PiperonylButoxide
Guideline#
DataRequirement
Is DataRequireme
ntSatisfied?
MRID#’s
StudyClassificati
on
161-1
835.2120 Hydrolysis
Yes 420100054237410143595601
UnacceptableUnacceptableSupplemental,upgradeable to
Acceptable
161-2
835.2240 Photodegradation inWater
Yes 42010006423741024260630243637201
UnacceptableUnacceptableUnacceptable
Upgradeable toAcceptable
161-3
835.2410 Photodegradation on
Soil
Yes 4201000442490201426063014292760143720801
UnacceptableUnacceptableUnacceptableUnacceptableSupplemental
161-4
835.2370 Photodegradation in
Air
Waived02/04/1991
– --
162-1
835.4100 Aerobic SoilMetabolism
Yes 420294014249020243806401
UnacceptableUnacceptable
Acceptable
162-2
835.4200 AnaerobicSoil
Metabolism
Waived 4201000342374103
UnacceptableUnacceptable
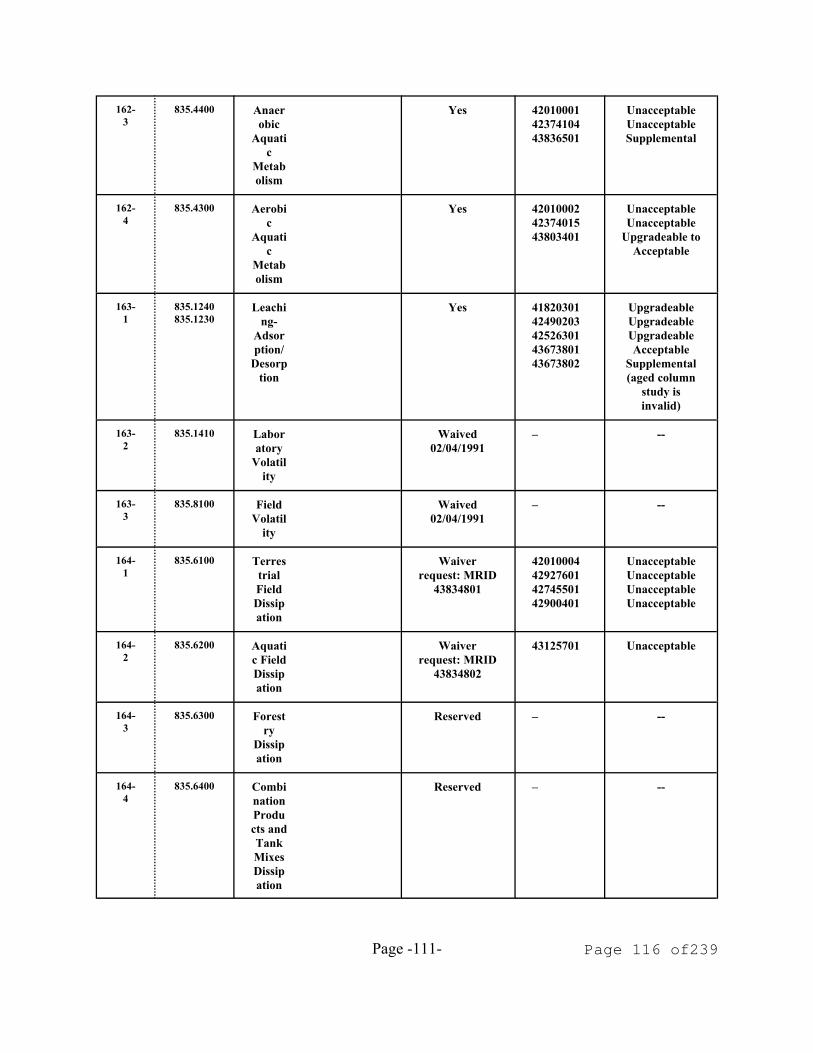
Page -111- Page 116 of239
162-3
835.4400 Anaerobic
Aquatic
Metabolism
Yes 420100014237410443836501
UnacceptableUnacceptableSupplemental
162-4
835.4300 Aerobic
Aquatic
Metabolism
Yes 420100024237401543803401
UnacceptableUnacceptable
Upgradeable toAcceptable
163-1
835.1240835.1230
Leaching-
Adsorption/
Desorption
Yes 4182030142490203425263014367380143673802
UpgradeableUpgradeableUpgradeableAcceptable
Supplemental(aged column
study isinvalid)
163-2
835.1410 Laboratory
Volatility
Waived02/04/1991
– --
163-3
835.8100 FieldVolatil
ity
Waived02/04/1991
– --
164-1
835.6100 TerrestrialFieldDissipation
Waiverrequest: MRID
43834801
42010004429276014274550142900401
UnacceptableUnacceptableUnacceptableUnacceptable
164-2
835.6200 Aquatic FieldDissipation
Waiverrequest: MRID
43834802
43125701 Unacceptable
164-3
835.6300 Forestry
Dissipation
Reserved – --
164-4
835.6400 CombinationProducts andTankMixesDissipation
Reserved – --

Page -112- Page 117 of239
165-4
850.1730 Accumulationin Fish
Yes 4240440142538803
AcceptableAcceptable
165-5
850.1950 Accumulatio
n-aquatic non-target
Reserved – --
166-1
835.7100 Ground
Water-small
prospective
Reserved – --
201-1
840.1100 Droplet SizeSpectr
um
Reserved – --
202-1
840.1200 DriftField
Evaluation
Reserved – --

Page -113- Page 118 of239
Appendix F. Ecological Data Requirements for Piperonyl Butoxide
Table A2. Status of ecological effect data needs forPiperonyl Butoxide
Guideline # Data RequirementAre Data
Adequate forRisk Assessment?
MRID #’s Study Classification
71-1a Bobwhite Quail Acute Oral
419690-08 Core
71-1b Mallard DuckAcute Oral
71-2a Bobwhite Quail Subacute Dietary
419690-06 Core
71-2b Mallard Duck Subacute Dietary
419690-07 core
71-3 Wild MammalToxicity
71-4a Bobwhite Quail Reproduction
438763-01 Core
71-4b Mallard Duck Reproduction
438763-02 Core
71-5a SimulatedTerrestrial Field
Study
71-5b Actual TerrestrialField Study
72-1a Freshwater Fish (Bluegill Sunfish)
Acute
42540302 core
72-1b Freshwater FishAcute
72-1c Freshwater Fish (Rainbow Trout)
Acute
42540303 core
72-1d Freshwater Fish Acute
72-2a FreshwaterInvertebrate(Waterflea)
Acute
42540301 core
72-2b FreshwaterInvertebrate(Waterflea)
Acute

Guideline # Data RequirementAre Data
Adequate forRisk Assessment?
MRID #’s Study Classification
Page -114- Page 119 of239
72-3a Estuarine/MarineFish (Sheepshead
Minnow) Acute
42540304 core
72-3b Estuarine/MarineInvertebrate
(Eastern Oyster) Acute
425403-05 Supplemental
72-3c Estuarine/MarineInvertebrate
(Mysid Shrimp) Acute
43901801 core
72-4a Freshwater Fish Early Life Stage
(Fathead Minnow)
433003-01 Core
72-4b FreshwaterInvertebrate
Life Cycle(Waterflea)
43311301 core
72-4c Estuarine/MarineInvertebrate
Life Cycle (Mysid Shrimp)
72-4 Estuarine/MarineFish
Early life Stage
72-5 Freshwater FishLife Cycle
Waiver requested1994 denied now
outstanding
72-6 Aquatic OrganismAccumulation
72-7a Simulated AquaticField Study
72-7b Actual Aquatic FieldStudy
122-1a Seed Germination/Seedling Emergence
(Tier I)
122-1b Vegetative Vigor(Tier I)
122-2 Aquatic PlantGrowth (Tier I)
122-2 Aquatic Plant algalToxicity (Tier I)
123-1a Seed Germination/ Seedling Emergence
(Tier II)
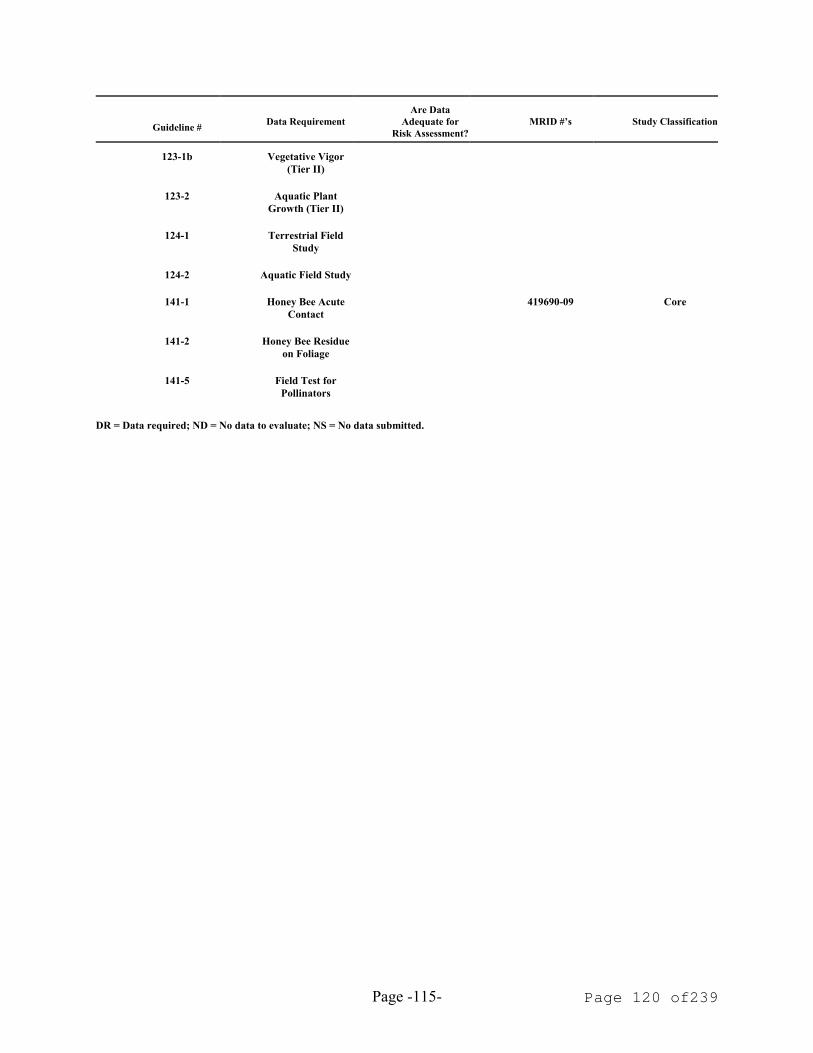
Guideline # Data RequirementAre Data
Adequate forRisk Assessment?
MRID #’s Study Classification
Page -115- Page 120 of239
123-1b Vegetative Vigor(Tier II)
123-2 Aquatic PlantGrowth (Tier II)
124-1 Terrestrial FieldStudy
124-2 Aquatic Field Study
141-1 Honey Bee AcuteContact
419690-09 Core
141-2 Honey Bee Residueon Foliage
141-5 Field Test forPollinators
DR = Data required; ND = No data to evaluate; NS = No data submitted.

Page -116- Page 121 of239
Appendix G Listed Species Listing
Summary of Listed Species
Group ofOrganism
Number ofSpecies
Number ofStates
Amphibian 16 9
Bird 56 47
Clam 65 27
Crustacean 19 12
Fish 100 38
Mammals 61 48
Reptile 28 26
Snail 28 12

Page -117- Page 122 of239
Appendix H Results of PRZM-EXAMS Modeling
Key: “stored as” gives state and crop (PRZM scenario). ‘G’ after crop nameindicates ground spray; no letter indicates aerial spray.
stored as CAcitrus.outChemical: PBOPRZM environment: CAcitrusC.txt modified Satday, 12 October 2002at 16:31:50EXAMS environment: pond298.exv modified Thuday, 29 August 2002at 16:33:30Metfile: w23155.dvf modified Wedday, 3 July 2002 at 09:04:20Water segment concentrations (ppb)
Year Peak 96 hr 21 Day 60 Day 90 Day Yearly1961 12.37 12.14 11.4 10.16 9.415 5.4211962 28.65 28.21 26.63 24.35 22.52 13.281963 31.42 30.91 29.03 26.08 24.44 15.51964 21.3 21.05 20.22 18.77 17.84 11.621965 19.82 19.57 18.66 17.76 17.2 11.351966 21.35 21.07 20.18 18.42 17.29 10.831967 19 18.75 17.96 16.54 15.75 10.031968 17.59 17.34 16.52 15.11 14.29 8.9311969 17.35 17.13 16.66 15.67 14.81 9.1131970 19.79 19.49 18.43 16.55 15.52 9.471971 17.83 17.59 16.81 15.41 14.52 9.1911972 17.38 17.13 16.33 14.87 13.95 9.0041973 18.94 18.67 17.8 16.45 15.59 9.561974 20.81 20.51 19.4 17.52 16.92 10.651975 18.85 18.59 17.75 16.27 15.36 9.5671976 17.32 17.07 16.27 14.89 14.03 8.6991977 16.9 16.65 15.84 14.86 14.37 9.1711978 84.89 83.73 78.11 67.78 62.09 33.941979 30.58 30.31 29.42 27.78 26.63 17.441980 21.28 21.02 20.19 18.8 17.88 11.691981 19.08 18.82 17.99 16.58 15.68 9.6971982 17.64 17.39 16.56 15.27 14.47 8.961983 21.66 21.35 20.4 18.81 17.77 11.031984 18.33 18.1 17.31 15.92 15.04 9.5031985 17.57 17.33 16.54 15.2 14.31 9.071986 17.62 17.38 16.59 15.4 14.58 9.2621987 17.56 17.33 16.55 15.19 14.28 9.061988 17.61 17.36 16.56 15.14 14.29 9.081989 17.41 17.18 16.41 15.01 14.08 8.8041990 17.21 16.98 16.22 14.84 13.94 8.689
0.1 30.387 30.1 28.79 25.907 24.248 15.278

Page -118- Page 123 of239
Average of yearly averages:10.9204
Inputs generated by pe4.pl - 8-August-2003
Data used for this run:Output File: CAcitrusMetfile: w23155.dvfPRZM scenario: CAcitrusC.txtEXAMS environment file: pond298.exvChemical Name: PBODescription Variable Name Value Units CommentsMolecular weight mwt 338.45 g/molHenry's Law Const. henry 1.56e-14 atm-m^3/molVapor Pressure vapr 5e-13 torrSolubility sol 14.3 mg/LKd Kd mg/LKoc Koc 399 mg/LPhotolysis half-life kdp 5.07 days Half-lifeAerobic Aquatic Metabolism kbacw 133 days HalfifeAnaerobic Aquatic Metabolism kbacs 0 days HalfifeAerobic Soil Metabolism asm 73 days HalfifeHydrolysis: pH 5 0 days Half-lifeHydrolysis: pH 7 0 days Half-lifeHydrolysis: pH 9 0 days Half-lifeMethod: CAM 2 integer See PRZM manualIncorporation Depth: DEPI 0 cmApplication Rate: TAPP 0.56 kg/haApplication Efficiency: APPEFF 0.95 fractionSpray Drift DRFT 0.05 fraction of application rate applied to pondApplication Date Date 15-01 dd/mm or dd/mmm or dd-mm ordd-mmmInterval 1 interval 3 days Set to 0 or delete line for singleapp.Interval 2 interval 3 days Set to 0 or delete line for singleapp.Interval 3 interval 3 days Set to 0 or delete line for singleapp.Interval 4 interval 3 days Set to 0 or delete line for singleapp.Interval 5 interval 3 days Set to 0 or delete line for singleapp.Interval 6 interval 3 days Set to 0 or delete line for singleapp.Interval 7 interval 3 days Set to 0 or delete line for singleapp.Interval 8 interval 3 days Set to 0 or delete line for single
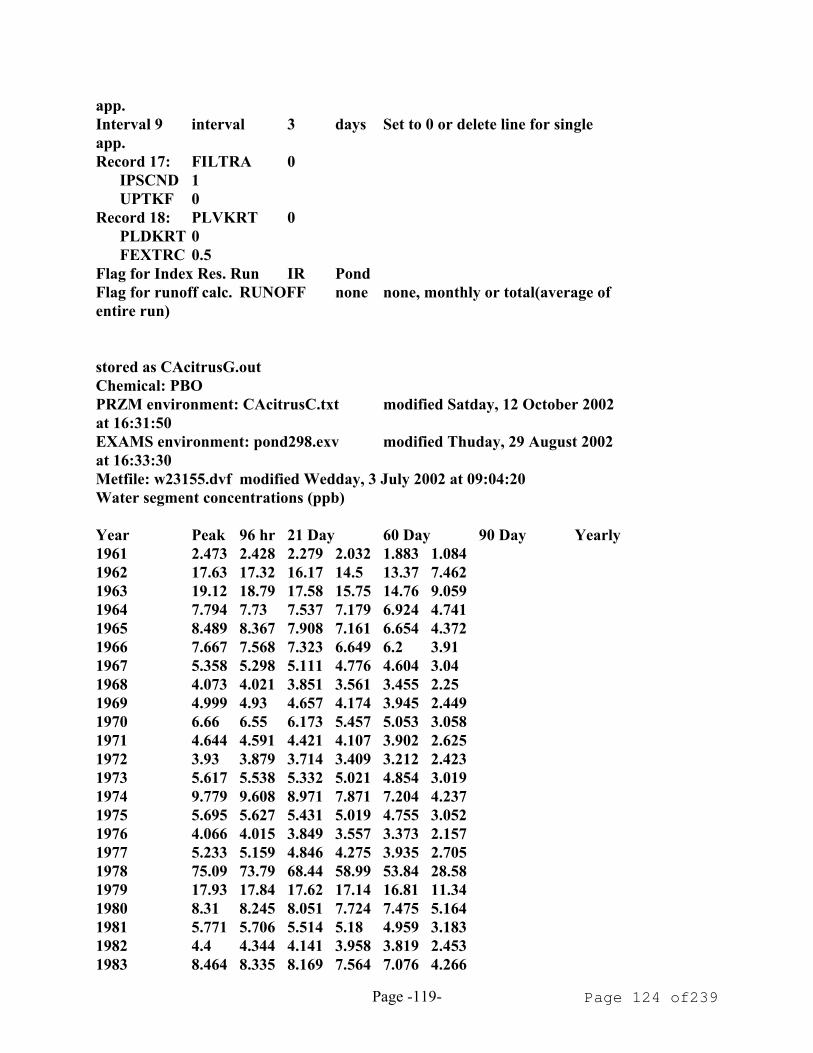
Page -119- Page 124 of239
app.Interval 9 interval 3 days Set to 0 or delete line for singleapp.Record 17: FILTRA 0
IPSCND 1UPTKF 0
Record 18: PLVKRT 0PLDKRT 0FEXTRC 0.5
Flag for Index Res. Run IR PondFlag for runoff calc. RUNOFF none none, monthly or total(average ofentire run)
stored as CAcitrusG.outChemical: PBOPRZM environment: CAcitrusC.txt modified Satday, 12 October 2002at 16:31:50EXAMS environment: pond298.exv modified Thuday, 29 August 2002at 16:33:30Metfile: w23155.dvf modified Wedday, 3 July 2002 at 09:04:20Water segment concentrations (ppb)
Year Peak 96 hr 21 Day 60 Day 90 Day Yearly1961 2.473 2.428 2.279 2.032 1.883 1.0841962 17.63 17.32 16.17 14.5 13.37 7.4621963 19.12 18.79 17.58 15.75 14.76 9.0591964 7.794 7.73 7.537 7.179 6.924 4.7411965 8.489 8.367 7.908 7.161 6.654 4.3721966 7.667 7.568 7.323 6.649 6.2 3.911967 5.358 5.298 5.111 4.776 4.604 3.041968 4.073 4.021 3.851 3.561 3.455 2.251969 4.999 4.93 4.657 4.174 3.945 2.4491970 6.66 6.55 6.173 5.457 5.053 3.0581971 4.644 4.591 4.421 4.107 3.902 2.6251972 3.93 3.879 3.714 3.409 3.212 2.4231973 5.617 5.538 5.332 5.021 4.854 3.0191974 9.779 9.608 8.971 7.871 7.204 4.2371975 5.695 5.627 5.431 5.019 4.755 3.0521976 4.066 4.015 3.849 3.557 3.373 2.1571977 5.233 5.159 4.846 4.275 3.935 2.7051978 75.09 73.79 68.44 58.99 53.84 28.581979 17.93 17.84 17.62 17.14 16.81 11.341980 8.31 8.245 8.051 7.724 7.475 5.1641981 5.771 5.706 5.514 5.18 4.959 3.1831982 4.4 4.344 4.141 3.958 3.819 2.4531983 8.464 8.335 8.169 7.564 7.076 4.266

Page -120- Page 125 of239
1984 4.777 4.726 4.559 4.256 4.057 2.6551985 3.932 3.883 3.721 3.442 3.257 2.1481986 3.969 3.921 3.74 3.651 3.504 2.2841987 3.792 3.744 3.585 3.305 3.118 2.0711988 3.943 3.891 3.722 3.425 3.284 2.2091989 3.803 3.754 3.595 3.298 3.098 1.9551990 3.55 3.504 3.35 3.073 2.891 1.811
0.1 17.9 17.788 17.439 15.625 14.621 8.8993Average of yearly averages:
4.39206666666667
Inputs generated by pe4.pl - 8-August-2003
Data used for this run:Output File: CAcitrusGMetfile: w23155.dvfPRZM scenario: CAcitrusC.txtEXAMS environment file: pond298.exvChemical Name: PBODescription Variable Name Value Units CommentsMolecular weight mwt 338.45 g/molHenry's Law Const. henry 1.56e-14 atm-m^3/molVapor Pressure vapr 5e-13 torrSolubility sol 143 mg/LKd Kd mg/LKoc Koc 399 mg/LPhotolysis half-life kdp 5.07 days Half-lifeAerobic Aquatic Metabolism kbacw 133 days HalfifeAnaerobic Aquatic Metabolism kbacs 0 days HalfifeAerobic Soil Metabolism asm 73 days HalfifeHydrolysis: pH 5 0 days Half-lifeHydrolysis: pH 7 0 days Half-lifeHydrolysis: pH 9 0 days Half-lifeMethod: CAM 2 integer See PRZM manualIncorporation Depth: DEPI 0 cmApplication Rate: TAPP 0.56 kg/haApplication Efficiency: APPEFF 0.99 fractionSpray Drift DRFT 0.01 fraction of application rate applied to pondApplication Date Date 15-01 dd/mm or dd/mmm or dd-mm ordd-mmmInterval 1 interval 3 days Set to 0 or delete line for singleapp.Interval 2 interval 3 days Set to 0 or delete line for singleapp.Interval 3 interval 3 days Set to 0 or delete line for singleapp.

Page -121- Page 126 of239
Interval 4 interval 3 days Set to 0 or delete line for singleapp.Interval 5 interval 3 days Set to 0 or delete line for singleapp.Interval 6 interval 3 days Set to 0 or delete line for singleapp.Interval 7 interval 3 days Set to 0 or delete line for singleapp.Interval 8 interval 3 days Set to 0 or delete line for singleapp.Interval 9 interval 3 days Set to 0 or delete line for singleapp.Record 17: FILTRA 0
IPSCND 1UPTKF 0
Record 18: PLVKRT 0PLDKRT 0FEXTRC 0.5
Flag for Index Res. Run IR PondFlag for runoff calc. RUNOFF none none, monthly or total(average ofentire run)
stored as CAgrapes.outChemical: PBOPRZM environment: CAgrapesC.txt modified Satday, 12 October 2002at 16:36:14EXAMS environment: pond298.exv modified Thuday, 29 August 2002at 16:33:30Metfile: w93193.dvf modified Wedday, 3 July 2002 at 09:04:24Water segment concentrations (ppb)
Year Peak 96 hr 21 Day 60 Day 90 Day Yearly1961 12.32 12.1 11.36 10.07 9.299 5.1121962 15.56 15.33 14.57 13.15 12.26 7.4741963 16.95 16.73 16.1 14.86 13.98 8.8481964 17.66 17.42 16.63 15.22 14.32 9.181965 22.36 22.02 20.9 18.67 17.37 10.921966 18.91 18.65 17.82 16.27 15.24 9.7961967 18.71 18.46 17.62 16.23 15.29 9.6661968 17.78 17.54 16.73 15.27 14.33 9.1251969 26.89 26.49 25.46 23.6 22.13 13.311970 21.76 21.47 20.56 19 17.85 11.471971 19.05 18.8 17.98 16.62 15.75 10.281972 18.2 17.94 17.08 15.61 14.66 9.4241973 18.14 17.9 17.4 15.98 14.97 9.431974 17.85 17.6 16.82 15.42 14.48 9.1181975 17.64 17.4 16.63 15.28 14.37 9.18

Page -122- Page 127 of239
1976 17.74 17.49 16.7 15.32 14.39 9.3331977 17.94 17.73 16.94 15.42 14.47 9.1361978 19.05 18.76 17.87 16.47 15.4 9.5151979 18.02 17.76 16.94 15.46 14.47 9.0111980 22.19 21.87 20.92 19.07 17.88 10.981981 18.67 18.42 17.9 16.42 15.41 9.6061982 19.06 18.87 17.94 16.36 15.33 9.7221983 19.63 19.36 18.57 17.09 16.05 10.021984 17.82 17.56 16.73 15.27 14.3 8.8191985 17.22 16.98 16.19 14.68 13.7 8.3981986 19.33 19.03 17.94 16.17 15.05 9.1421987 18.33 18.07 17.24 15.64 14.56 9.071988 17.46 17.2 16.38 15.05 14.17 8.8911989 18.08 17.81 17.05 15.54 14.5 8.9961990 17.47 17.21 16.39 14.92 14 8.804
0.1 22.147 21.83 20.866 18.967 17.802 10.974Average of yearly averages:
9.39253333333333
Inputs generated by pe4.pl - 8-August-2003
Data used for this run:Output File: CAgrapesMetfile: w93193.dvfPRZM scenario: CAgrapesC.txtEXAMS environment file: pond298.exvChemical Name: PBODescription Variable Name Value Units CommentsMolecular weight mwt 338.45 g/molHenry's Law Const. henry 1.56e-14 atm-m^3/molVapor Pressure vapr 5e-13 torrSolubility sol 143 mg/LKd Kd mg/LKoc Koc 399 mg/LPhotolysis half-life kdp 5.07 days Half-lifeAerobic Aquatic Metabolism kbacw 133 days HalfifeAnaerobic Aquatic Metabolism kbacs 0 days HalfifeAerobic Soil Metabolism asm 73 days HalfifeHydrolysis: pH 5 0 days Half-lifeHydrolysis: pH 7 0 days Half-lifeHydrolysis: pH 9 0 days Half-lifeMethod: CAM 2 integer See PRZM manualIncorporation Depth: DEPI 0 cmApplication Rate: TAPP 0.56 kg/haApplication Efficiency: APPEFF 0.95 fraction

Page -123- Page 128 of239
Spray Drift DRFT 0.05 fraction of application rate applied to pondApplication Date Date 15-02 dd/mm or dd/mmm or dd-mm ordd-mmmInterval 1 interval 3 days Set to 0 or delete line for singleapp.Interval 2 interval 3 days Set to 0 or delete line for singleapp.Interval 3 interval 3 days Set to 0 or delete line for singleapp.Interval 4 interval 3 days Set to 0 or delete line for singleapp.Interval 5 interval 3 days Set to 0 or delete line for singleapp.Interval 6 interval 3 days Set to 0 or delete line for singleapp.Interval 7 interval 3 days Set to 0 or delete line for singleapp.Interval 8 interval 3 days Set to 0 or delete line for singleapp.Interval 9 interval 3 days Set to 0 or delete line for singleapp.Record 17: FILTRA 0
IPSCND 1UPTKF 0
Record 18: PLVKRT 0PLDKRT 0FEXTRC 0.5
Flag for Index Res. Run IR PondFlag for runoff calc. RUNOFF none none, monthly or total(average ofentire run)
stored as CAgrapesG.outChemical: PBOPRZM environment: CAgrapesC.txt modified Satday, 12 October 2002at 16:36:14EXAMS environment: pond298.exv modified Thuday, 29 August 2002at 16:33:30Metfile: w93193.dvf modified Wedday, 3 July 2002 at 09:04:24Water segment concentrations (ppb)
Year Peak 96 hr 21 Day 60 Day 90 Day Yearly1961 2.465 2.42 2.272 2.014 1.86 1.0251962 3.131 3.084 2.941 2.659 2.48 1.5141963 3.843 3.792 3.692 3.439 3.237 2.0381964 3.712 3.664 3.505 3.218 3.033 1.9771965 8.496 8.356 7.893 6.924 6.347 3.702

Page -124- Page 129 of239
1966 4.775 4.719 4.541 4.203 3.97 2.6941967 4.768 4.705 4.501 4.161 3.923 2.5331968 3.938 3.886 3.718 3.413 3.215 2.0981969 13.56 13.39 13.19 12.05 11.15 6.2971970 7.92 7.827 7.615 7.123 6.704 4.4731971 5.152 5.096 4.917 4.687 4.52 3.1491972 4.261 4.204 4.023 3.715 3.509 2.3711973 4.471 4.416 4.201 3.888 3.654 2.3351974 3.863 3.812 3.669 3.414 3.215 2.0631975 3.671 3.624 3.468 3.195 3.009 1.9441976 3.608 3.56 3.401 3.123 2.936 1.9441977 3.7 3.673 3.524 3.214 3.019 1.921978 5.265 5.18 4.968 4.667 4.353 2.5871979 4.235 4.179 4.001 3.681 3.462 2.21980 8.782 8.648 8.431 7.632 7.195 4.2161981 5.324 5.264 5.045 4.695 4.443 2.9151982 5.492 5.426 5.199 4.68 4.357 2.7811983 5.75 5.673 5.527 5.166 4.852 2.9911984 4.125 4.071 3.896 3.593 3.382 2.1661985 3.679 3.63 3.47 3.16 2.956 1.8481986 6.101 5.994 5.593 4.918 4.529 2.6381987 4.88 4.812 4.631 4.224 3.924 2.4781988 3.96 3.905 3.731 3.538 3.389 2.1921989 4.467 4.401 4.298 3.995 3.736 2.3051990 3.802 3.75 3.582 3.304 3.144 2.083
0.1 8.4384 8.3031 7.8652 7.1031 6.6683 4.1646Average of yearly averages:
2.58256666666667
Inputs generated by pe4.pl - 8-August-2003
Data used for this run:Output File: CAgrapesGMetfile: w93193.dvfPRZM scenario: CAgrapesC.txtEXAMS environment file: pond298.exvChemical Name: PBODescription Variable Name Value Units CommentsMolecular weight mwt 338.45 g/molHenry's Law Const. henry 1.56e-14 atm-m^3/molVapor Pressure vapr 5e-13 torrSolubility sol 143 mg/LKd Kd mg/LKoc Koc 399 mg/LPhotolysis half-life kdp 5.07 days Half-life

Page -125- Page 130 of239
Aerobic Aquatic Metabolism kbacw 133 days HalfifeAnaerobic Aquatic Metabolism kbacs 0 days HalfifeAerobic Soil Metabolism asm 73 days HalfifeHydrolysis: pH 5 0 days Half-lifeHydrolysis: pH 7 0 days Half-lifeHydrolysis: pH 9 0 days Half-lifeMethod: CAM 2 integer See PRZM manualIncorporation Depth: DEPI 0 cmApplication Rate: TAPP 0.56 kg/haApplication Efficiency: APPEFF 0.99 fractionSpray Drift DRFT 0.01 fraction of application rate applied to pondApplication Date Date 15-02 dd/mm or dd/mmm or dd-mm ordd-mmmInterval 1 interval 3 days Set to 0 or delete line for singleapp.Interval 2 interval 3 days Set to 0 or delete line for singleapp.Interval 3 interval 3 days Set to 0 or delete line for singleapp.Interval 4 interval 3 days Set to 0 or delete line for singleapp.Interval 5 interval 3 days Set to 0 or delete line for singleapp.Interval 6 interval 3 days Set to 0 or delete line for singleapp.Interval 7 interval 3 days Set to 0 or delete line for singleapp.Interval 8 interval 3 days Set to 0 or delete line for singleapp.Interval 9 interval 3 days Set to 0 or delete line for singleapp.Record 17: FILTRA 0
IPSCND 1UPTKF 0
Record 18: PLVKRT 0PLDKRT 0FEXTRC 0.5
Flag for Index Res. Run IR PondFlag for runoff calc. RUNOFF none none, monthly or total(average ofentire run)
stored as CAlettuce.outChemical: PBOPRZM environment: CAlettuceC.txt modified Monday, 8 November2004 at 11:06:34
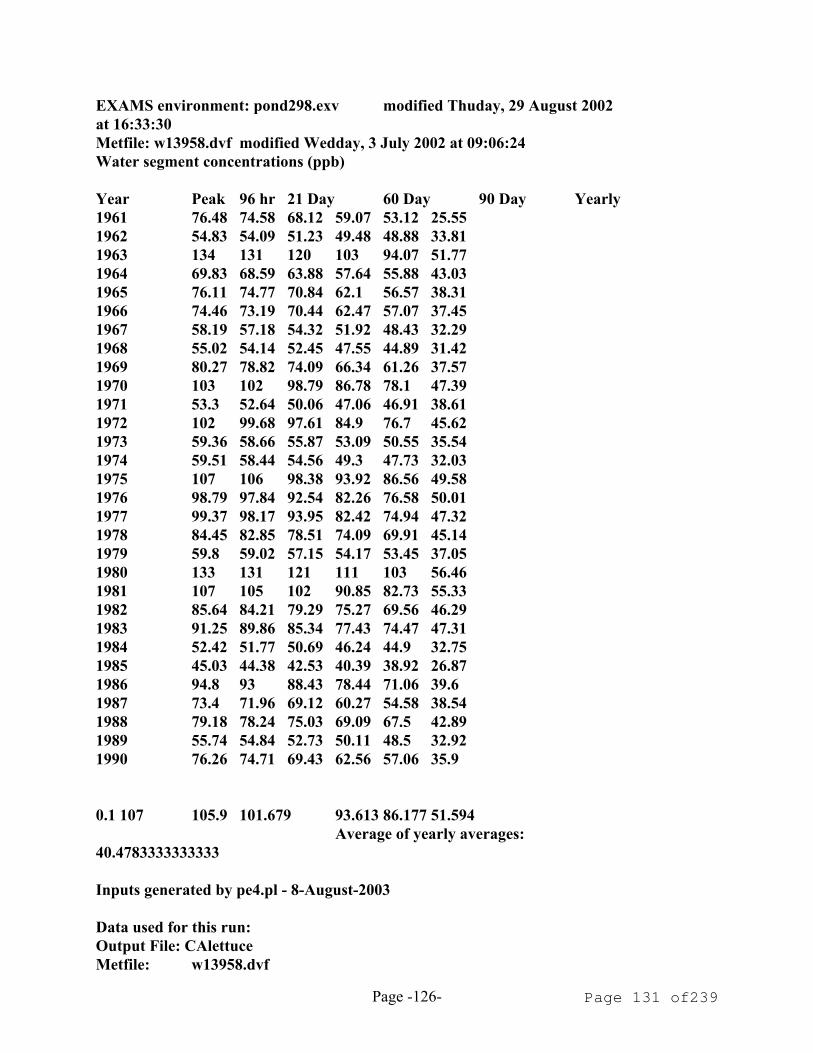
Page -126- Page 131 of239
EXAMS environment: pond298.exv modified Thuday, 29 August 2002at 16:33:30Metfile: w13958.dvf modified Wedday, 3 July 2002 at 09:06:24Water segment concentrations (ppb)
Year Peak 96 hr 21 Day 60 Day 90 Day Yearly1961 76.48 74.58 68.12 59.07 53.12 25.551962 54.83 54.09 51.23 49.48 48.88 33.811963 134 131 120 103 94.07 51.771964 69.83 68.59 63.88 57.64 55.88 43.031965 76.11 74.77 70.84 62.1 56.57 38.311966 74.46 73.19 70.44 62.47 57.07 37.451967 58.19 57.18 54.32 51.92 48.43 32.291968 55.02 54.14 52.45 47.55 44.89 31.421969 80.27 78.82 74.09 66.34 61.26 37.571970 103 102 98.79 86.78 78.1 47.391971 53.3 52.64 50.06 47.06 46.91 38.611972 102 99.68 97.61 84.9 76.7 45.621973 59.36 58.66 55.87 53.09 50.55 35.541974 59.51 58.44 54.56 49.3 47.73 32.031975 107 106 98.38 93.92 86.56 49.581976 98.79 97.84 92.54 82.26 76.58 50.011977 99.37 98.17 93.95 82.42 74.94 47.321978 84.45 82.85 78.51 74.09 69.91 45.141979 59.8 59.02 57.15 54.17 53.45 37.051980 133 131 121 111 103 56.461981 107 105 102 90.85 82.73 55.331982 85.64 84.21 79.29 75.27 69.56 46.291983 91.25 89.86 85.34 77.43 74.47 47.311984 52.42 51.77 50.69 46.24 44.9 32.751985 45.03 44.38 42.53 40.39 38.92 26.871986 94.8 93 88.43 78.44 71.06 39.61987 73.4 71.96 69.12 60.27 54.58 38.541988 79.18 78.24 75.03 69.09 67.5 42.891989 55.74 54.84 52.73 50.11 48.5 32.921990 76.26 74.71 69.43 62.56 57.06 35.9
0.1 107 105.9 101.679 93.613 86.177 51.594Average of yearly averages:
40.4783333333333
Inputs generated by pe4.pl - 8-August-2003
Data used for this run:Output File: CAlettuceMetfile: w13958.dvf

Page -127- Page 132 of239
PRZM scenario: CAlettuceC.txtEXAMS environment file: pond298.exvChemical Name: PBODescription Variable Name Value Units CommentsMolecular weight mwt 338.45 g/molHenry's Law Const. henry 1.56e-14 atm-m^3/molVapor Pressure vapr 5e-13 torrSolubility sol 143 mg/LKd Kd mg/LKoc Koc 399 mg/LPhotolysis half-life kdp 5.07 days Half-lifeAerobic Aquatic Metabolism kbacw 133 days HalfifeAnaerobic Aquatic Metabolism kbacs 0 days HalfifeAerobic Soil Metabolism asm 73 days HalfifeHydrolysis: pH 5 0 days Half-lifeHydrolysis: pH 7 0 days Half-lifeHydrolysis: pH 9 0 days Half-lifeMethod: CAM 2 integer See PRZM manualIncorporation Depth: DEPI 0 cmApplication Rate: TAPP 0.56 kg/haApplication Efficiency: APPEFF 0.95 fractionSpray Drift DRFT 0.05 fraction of application rate applied to pondApplication Date Date 24-02 dd/mm or dd/mmm or dd-mm ordd-mmmInterval 1 interval 3 days Set to 0 or delete line for singleapp.Interval 2 interval 3 days Set to 0 or delete line for singleapp.Interval 3 interval 3 days Set to 0 or delete line for singleapp.Interval 4 interval 3 days Set to 0 or delete line for singleapp.Interval 5 interval 3 days Set to 0 or delete line for singleapp.Interval 6 interval 3 days Set to 0 or delete line for singleapp.Interval 7 interval 3 days Set to 0 or delete line for singleapp.Interval 8 interval 3 days Set to 0 or delete line for singleapp.Interval 9 interval 3 days Set to 0 or delete line for singleapp.Record 17: FILTRA 0
IPSCND 1UPTKF 0
Record 18: PLVKRT 0PLDKRT 0

Page -128- Page 133 of239
FEXTRC 0.5Flag for Index Res. Run IR PondFlag for runoff calc. RUNOFF none none, monthly or total(average ofentire run)
stored as CAlettuceG.outChemical: PBOPRZM environment: CAlettuceC.txt modified Monday, 8 November2004 at 11:06:34EXAMS environment: pond298.exv modified Thuday, 29 August 2002at 16:33:30Metfile: w13958.dvf modified Wedday, 3 July 2002 at 09:06:24Water segment concentrations (ppb)
Year Peak 96 hr 21 Day 60 Day 90 Day Yearly1961 74.54 72.62 66.07 57.12 51.15 22.661962 49.06 48.23 46.2 43.58 42.41 29.651963 128 125 114 97.8 89.23 48.031964 65.3 64.1 59.55 51.54 50.25 38.731965 70.04 68.75 64.97 56.5 51.39 33.531966 66.74 65.55 63.24 55.94 51.03 32.491967 50.02 49.13 46.74 44.6 41.76 27.321968 47.82 47.02 45.38 40.82 37.75 26.141969 71.54 70.2 65.93 59.1 53.99 32.551970 98.36 96.92 93.75 82.18 73.76 42.751971 47.38 46.56 43.38 40.38 40.17 33.791972 95.97 94.39 92.37 80.11 72.21 41.241973 50.43 49.84 47.49 44.21 42.27 30.491974 52.31 51.33 47.78 42.01 39.9 26.921975 102 101 93.81 88.84 81.86 45.021976 91.51 90.67 85.73 76.1 70.21 45.391977 92.03 90.85 86.75 75.96 68.96 42.661978 77.61 76.09 72.15 68.61 63.78 40.621979 50.27 49.62 46.96 45.47 45.25 32.011980 126 123 114 105 97.42 52.431981 103 101 98.35 87.22 79.02 51.341982 79.75 78.38 73.72 69.39 64.18 41.991983 81.74 80.49 76.3 69.54 67.37 42.841984 42.07 41.71 40.52 36.74 36.29 27.821985 33.86 33.39 31.71 30.95 30.39 21.741986 89.72 87.86 83.2 73.34 66.33 35.061987 68.18 66.78 63.94 55.53 50.03 33.81988 70.6 69.51 65.47 60.62 59.9 38.361989 48.94 48.13 45.99 43.1 40.86 28.051990 69.4 67.93 62.99 56.53 51.56 31.23

Page -129- Page 134 of239
0.1 102.9 101 97.896 88.678 81.576 47.766Average of yearly averages:
35.8883333333333
Inputs generated by pe4.pl - 8-August-2003
Data used for this run:Output File: CAlettuceGMetfile: w13958.dvfPRZM scenario: CAlettuceC.txtEXAMS environment file: pond298.exvChemical Name: PBODescription Variable Name Value Units CommentsMolecular weight mwt 338.45 g/molHenry's Law Const. henry 1.56e-14 atm-m^3/molVapor Pressure vapr 5e-13 torrSolubility sol 143 mg/LKd Kd mg/LKoc Koc 399 mg/LPhotolysis half-life kdp 5.07 days Half-lifeAerobic Aquatic Metabolism kbacw 133 days HalfifeAnaerobic Aquatic Metabolism kbacs 0 days HalfifeAerobic Soil Metabolism asm 73 days HalfifeHydrolysis: pH 5 0 days Half-lifeHydrolysis: pH 7 0 days Half-lifeHydrolysis: pH 9 0 days Half-lifeMethod: CAM 2 integer See PRZM manualIncorporation Depth: DEPI 0 cmApplication Rate: TAPP 0.56 kg/haApplication Efficiency: APPEFF 0.99 fractionSpray Drift DRFT 0.01 fraction of application rate applied to pondApplication Date Date 24-02 dd/mm or dd/mmm or dd-mm ordd-mmmInterval 1 interval 3 days Set to 0 or delete line for singleapp.Interval 2 interval 3 days Set to 0 or delete line for singleapp.Interval 3 interval 3 days Set to 0 or delete line for singleapp.Interval 4 interval 3 days Set to 0 or delete line for singleapp.Interval 5 interval 3 days Set to 0 or delete line for singleapp.Interval 6 interval 3 days Set to 0 or delete line for singleapp.Interval 7 interval 3 days Set to 0 or delete line for singleapp.

Page -130- Page 135 of239
Interval 8 interval 3 days Set to 0 or delete line for singleapp.Interval 9 interval 3 days Set to 0 or delete line for singleapp.Record 17: FILTRA 0
IPSCND 1UPTKF 0
Record 18: PLVKRT 0PLDKRT 0FEXTRC 0.5
Flag for Index Res. Run IR PondFlag for runoff calc. RUNOFF none none, monthly or total(average ofentire run)
stored as CAsugarbeet.outChemical: PBOPRZM environment: CAsugarbeetC.txt modified Thuday, 29 May 2003 at15:17:54EXAMS environment: pond298.exv modified Thuday, 29 August 2002at 16:33:30Metfile: w93193.dvf modified Wedday, 3 July 2002 at 09:04:24Water segment concentrations (ppb)
Year Peak 96 hr 21 Day 60 Day 90 Day Yearly1961 12.32 12.1 11.36 10.09 9.34 5.171962 15.8 15.57 15.05 13.69 12.78 7.8361963 20.81 20.53 19.95 18.71 17.61 11.071964 19.15 18.91 18.11 16.66 15.72 10.331965 34.5 33.92 32.14 28.57 26.31 15.811966 22.09 21.82 20.95 19.31 18.19 12.211967 24.43 24.1 23.08 21.73 20.47 13.071968 21.39 21.19 20.28 18.78 17.69 11.531969 42.2 41.56 40.36 38.1 35.75 21.131970 31.4 31 29.96 27.82 26.12 17.021971 23.48 23.2 22.28 21.18 20.39 13.921972 20.34 20.06 19.17 17.66 16.65 11.141973 24.86 24.56 23.29 21.24 19.93 12.521974 20.38 20.11 19.52 18.42 17.38 11.181975 19.81 19.55 18.65 17.15 16.14 10.451976 18.69 18.45 17.64 16.22 15.26 10.131977 18.68 18.54 17.77 16.22 15.27 9.7731978 25.64 25.23 24.21 23.47 22.07 13.221979 22.43 22.12 21.26 19.69 18.51 11.721980 34.99 34.46 33.39 30.06 27.98 16.891981 25.12 24.81 23.61 21.8 20.57 13.2

Page -131- Page 136 of239
1982 28.87 28.5 27.66 25.51 23.67 14.791983 31.96 31.53 30.81 28.57 26.96 16.641984 21.63 21.35 20.47 18.93 17.85 11.551985 19.01 18.76 18.01 16.41 15.36 9.6581986 30.57 30.04 28.05 24.78 22.82 13.361987 23.14 22.82 22 20.12 18.79 12.021988 20.91 20.71 19.82 18.74 18.28 11.921989 26.54 26.17 24.63 23.12 21.75 13.41990 20.24 19.97 19.11 17.61 16.7 11.27
0.1 34.246 33.681 32.007 28.57 26.895 16.865Average of yearly averages:
12.4642333333333
Inputs generated by pe4.pl - 8-August-2003
Data used for this run:Output File: CAsugarbeetMetfile: w93193.dvfPRZM scenario: CAsugarbeetC.txtEXAMS environment file: pond298.exvChemical Name: PBODescription Variable Name Value Units CommentsMolecular weight mwt 338.45 g/molHenry's Law Const. henry 1.56e-14 atm-m^3/molVapor Pressure vapr 5e-13 torrSolubility sol 143 mg/LKd Kd mg/LKoc Koc 399 mg/LPhotolysis half-life kdp 5.07 days Half-lifeAerobic Aquatic Metabolism kbacw 133 days HalfifeAnaerobic Aquatic Metabolism kbacs 0 days HalfifeAerobic Soil Metabolism asm 73 days HalfifeHydrolysis: pH 5 0 days Half-lifeHydrolysis: pH 7 0 days Half-lifeHydrolysis: pH 9 0 days Half-lifeMethod: CAM 2 integer See PRZM manualIncorporation Depth: DEPI 0 cmApplication Rate: TAPP 0.56 kg/haApplication Efficiency: APPEFF 0.95 fractionSpray Drift DRFT 0.05 fraction of application rate applied to pondApplication Date Date 15-02 dd/mm or dd/mmm or dd-mm ordd-mmmInterval 1 interval 3 days Set to 0 or delete line for singleapp.

Page -132- Page 137 of239
Interval 2 interval 3 days Set to 0 or delete line for singleapp.Interval 3 interval 3 days Set to 0 or delete line for singleapp.Interval 4 interval 3 days Set to 0 or delete line for singleapp.Interval 5 interval 3 days Set to 0 or delete line for singleapp.Interval 6 interval 3 days Set to 0 or delete line for singleapp.Interval 7 interval 3 days Set to 0 or delete line for singleapp.Interval 8 interval 3 days Set to 0 or delete line for singleapp.Interval 9 interval 3 days Set to 0 or delete line for singleapp.Record 17: FILTRA 0
IPSCND 1UPTKF 0
Record 18: PLVKRT 0PLDKRT 0FEXTRC 0.5
Flag for Index Res. Run IR PondFlag for runoff calc. RUNOFF none none, monthly or total(average ofentire run)
stored as CAsugarbeetG.outChemical: PBOPRZM environment: CAsugarbeetC.txt modified Thuday, 29 May 2003 at15:17:54EXAMS environment: pond298.exv modified Thuday, 29 August 2002at 16:33:30Metfile: w93193.dvf modified Wedday, 3 July 2002 at 09:04:24Water segment concentrations (ppb)
Year Peak 96 hr 21 Day 60 Day 90 Day Yearly1961 2.465 2.42 2.272 2.037 1.902 1.0861962 3.781 3.727 3.513 3.224 3.023 1.8921963 8.907 8.766 8.437 7.806 7.32 4.3511964 5.269 5.215 5.044 4.722 4.502 3.1731965 21.28 21.01 19.62 17.26 15.79 8.8021966 8.089 8.019 7.818 7.402 7.087 5.2081967 10.73 10.59 10.22 10.04 9.506 6.0851968 7.815 7.718 7.507 7.135 6.736 4.6031969 30.87 30.39 29.44 27.16 25.34 14.441970 18.1 17.95 17.64 16.33 15.33 10.26

Page -133- Page 138 of239
1971 10.75 10.64 10.21 9.539 9.377 6.9411972 6.489 6.421 6.223 5.86 5.605 4.1581973 11.66 11.52 10.89 9.629 8.871 5.5531974 7.321 7.272 7.014 6.543 6.255 4.2131975 5.935 5.864 5.614 5.15 4.859 3.2711976 4.607 4.552 4.377 4.067 3.839 2.7751977 4.621 4.566 4.391 4.045 3.852 2.5841978 13.32 13.12 12.67 11.96 11.32 6.4481979 8.828 8.724 8.501 8.108 7.705 5.021980 22.78 22.53 21.53 19.04 17.67 10.381981 12.16 12.03 11.49 10.44 9.838 6.6561982 16.32 16.08 15.5 14.45 13.41 8.061983 19.56 19.29 18.45 17.12 16.23 9.8871984 8.093 8.02 7.817 7.427 7.135 5.0141985 5.539 5.48 5.365 4.959 4.689 3.161986 17.81 17.47 16.2 14.01 12.79 7.0361987 9.89 9.768 9.63 8.888 8.375 5.5511988 10.54 10.41 9.949 8.802 8.126 5.3531989 14.37 14.15 13.26 11.89 11.3 6.8911990 6.993 6.908 6.514 6.104 6.027 4.65
0.1 21.108 20.838 19.503 17.246 16.186 10.2227Average of yearly averages:
5.78336666666667
Inputs generated by pe4.pl - 8-August-2003
Data used for this run:Output File: CAsugarbeetGMetfile: w93193.dvfPRZM scenario: CAsugarbeetC.txtEXAMS environment file: pond298.exvChemical Name: PBODescription Variable Name Value Units CommentsMolecular weight mwt 338.45 g/molHenry's Law Const. henry 1.56e-14 atm-m^3/molVapor Pressure vapr 5e-13 torrSolubility sol 143 mg/LKd Kd mg/LKoc Koc 399 mg/LPhotolysis half-life kdp 5.07 days Half-lifeAerobic Aquatic Metabolism kbacw 133 days HalfifeAnaerobic Aquatic Metabolism kbacs 0 days HalfifeAerobic Soil Metabolism asm 73 days HalfifeHydrolysis: pH 5 0 days Half-lifeHydrolysis: pH 7 0 days Half-life

Page -134- Page 139 of239
Hydrolysis: pH 9 0 days Half-lifeMethod: CAM 2 integer See PRZM manualIncorporation Depth: DEPI 0 cmApplication Rate: TAPP 0.56 kg/haApplication Efficiency: APPEFF 0.99 fractionSpray Drift DRFT 0.01 fraction of application rate applied to pondApplication Date Date 15-02 dd/mm or dd/mmm or dd-mm ordd-mmmInterval 1 interval 3 days Set to 0 or delete line for singleapp.Interval 2 interval 3 days Set to 0 or delete line for singleapp.Interval 3 interval 3 days Set to 0 or delete line for singleapp.Interval 4 interval 3 days Set to 0 or delete line for singleapp.Interval 5 interval 3 days Set to 0 or delete line for singleapp.Interval 6 interval 3 days Set to 0 or delete line for singleapp.Interval 7 interval 3 days Set to 0 or delete line for singleapp.Interval 8 interval 3 days Set to 0 or delete line for singleapp.Interval 9 interval 3 days Set to 0 or delete line for singleapp.Record 17: FILTRA 0
IPSCND 1UPTKF 0
Record 18: PLVKRT 0PLDKRT 0FEXTRC 0.5
Flag for Index Res. Run IR PondFlag for runoff calc. RUNOFF none none, monthly or total(average ofentire run)
stored as CAtomato.outChemical: PBOPRZM environment: CAtomatoC.txt modified Satday, 12 October 2002at 16:38:04EXAMS environment: pond298.exv modified Thuday, 29 August 2002at 16:33:30Metfile: w93193.dvf modified Wedday, 3 July 2002 at 09:04:24Water segment concentrations (ppb)
Year Peak 96 hr 21 Day 60 Day 90 Day Yearly

Page -135- Page 140 of239
1961 12.32 12.07 11.34 10.05 9.199 4.9031962 16.7 16.42 15.53 14.03 13.05 8.1561963 23.72 23.38 22.76 20.86 19.48 12.061964 19.76 19.49 18.62 17.07 16.01 10.891965 21.24 20.93 19.87 18.02 16.83 11.121966 19.02 18.72 17.79 16.16 15.06 10.121967 31.41 30.96 29.33 25.78 23.94 14.671968 22.03 21.72 20.77 19.01 17.76 12.621969 29.77 29.33 28.24 25.18 23.19 15.051970 21.74 21.47 20.59 18.88 17.68 12.291971 23.89 23.57 22.33 20.69 19.52 13.141972 19.83 19.55 18.67 17.04 16.01 111973 20.04 19.75 18.84 17.15 15.97 10.851974 20.99 20.69 19.76 18.04 16.78 11.171975 20 19.74 18.91 17.31 16.18 10.931976 19.98 19.7 18.84 17.2 16.08 11.431977 20.45 20.14 19.19 17.67 16.61 111978 23.61 23.26 22.27 20.23 18.67 11.71979 19.43 19.15 18.24 16.59 15.44 9.9981980 18.42 18.14 17.27 15.72 14.69 9.4341981 20.24 19.92 19.33 17.67 16.44 10.181982 22.71 22.36 21.26 19.3 17.86 11.581983 25.16 24.78 23.24 21.8 20.66 13.291984 19.83 19.56 18.67 16.96 15.78 10.321985 18.51 18.21 17.27 15.65 14.54 9.7141986 20.12 19.81 18.88 17.17 15.97 10.251987 20.48 20.16 19.2 17.86 16.94 11.371988 21.03 20.74 19.99 18.21 17.01 10.731989 20.69 20.35 19.37 17.77 16.63 10.631990 19.32 19.04 18.38 17.6 17.15 11.34
0.1 25.033 24.659 23.192 21.706 20.546 13.275Average of yearly averages:
11.0645
Inputs generated by pe4.pl - 8-August-2003
Data used for this run:Output File: CAtomatoMetfile: w93193.dvfPRZM scenario: CAtomatoC.txtEXAMS environment file: pond298.exvChemical Name: PBODescription Variable Name Value Units CommentsMolecular weight mwt 338.45 g/mol

Page -136- Page 141 of239
Henry's Law Const. henry 1.56e-14 atm-m^3/molVapor Pressure vapr 5e-13 torrSolubility sol 143 mg/LKd Kd mg/LKoc Koc 399 mg/LPhotolysis half-life kdp 5.07 days Half-lifeAerobic Aquatic Metabolism kbacw 133 days HalfifeAnaerobic Aquatic Metabolism kbacs 0 days HalfifeAerobic Soil Metabolism asm 73 days HalfifeHydrolysis: pH 5 0 days Half-lifeHydrolysis: pH 7 0 days Half-lifeHydrolysis: pH 9 0 days Half-lifeMethod: CAM 2 integer See PRZM manualIncorporation Depth: DEPI 0 cmApplication Rate: TAPP 0.56 kg/haApplication Efficiency: APPEFF 0.95 fractionSpray Drift DRFT 0.05 fraction of application rate applied to pondApplication Date Date 15-03 dd/mm or dd/mmm or dd-mm ordd-mmmInterval 1 interval 3 days Set to 0 or delete line for singleapp.Interval 2 interval 3 days Set to 0 or delete line for singleapp.Interval 3 interval 3 days Set to 0 or delete line for singleapp.Interval 4 interval 3 days Set to 0 or delete line for singleapp.Interval 5 interval 3 days Set to 0 or delete line for singleapp.Interval 6 interval 3 days Set to 0 or delete line for singleapp.Interval 7 interval 3 days Set to 0 or delete line for singleapp.Interval 8 interval 3 days Set to 0 or delete line for singleapp.Interval 9 interval 3 days Set to 0 or delete line for singleapp.Record 17: FILTRA 0
IPSCND 1UPTKF 0
Record 18: PLVKRT 0PLDKRT 0FEXTRC 0.5
Flag for Index Res. Run IR PondFlag for runoff calc. RUNOFF none none, monthly or total(average ofentire run)

Page -137- Page 142 of239
stored as CAtomatoG.outChemical: PBOPRZM environment: CAtomatoC.txt modified Satday, 12 October 2002at 16:38:04EXAMS environment: pond298.exv modified Thuday, 29 August 2002at 16:33:30Metfile: w93193.dvf modified Wedday, 3 July 2002 at 09:04:24Water segment concentrations (ppb)
Year Peak 96 hr 21 Day 60 Day 90 Day Yearly1961 2.604 2.572 2.453 2.15 1.975 1.191962 4.519 4.451 4.255 3.903 3.665 2.5531963 11.09 10.93 10.73 9.883 9.252 5.6651964 6.019 5.955 5.762 5.395 5.13 4.0271965 7.484 7.382 7.025 6.339 5.938 4.1581966 5.325 5.262 5.024 4.505 4.243 3.2771967 18.79 18.49 17.39 15.06 13.66 8.0011968 8.492 8.395 8.183 7.581 7.15 6.0011969 16.59 16.4 15.76 13.93 12.8 8.3731970 8.024 7.951 7.748 7.313 6.976 5.591971 10.97 10.83 10.28 9.363 8.787 6.3731972 6.093 6.026 5.831 5.444 5.24 4.2261973 6.2 6.127 5.925 5.513 5.198 4.0871974 7.3 7.208 6.996 6.474 6.024 4.4751975 6.216 6.155 5.966 5.583 5.293 4.0521976 6.53 6.436 6.08 5.563 5.322 4.3991977 6.548 6.467 6.256 5.921 5.675 4.1331978 10.15 10.01 9.691 8.823 8.116 5.1111979 5.88 5.809 5.609 5.205 4.889 3.4831980 4.957 4.894 4.703 4.352 4.108 2.8751981 7.23 7.125 6.789 6.384 6.028 3.7991982 9.366 9.223 8.794 8.018 7.392 5.0131983 13.4 13.18 12.3 10.74 10.05 6.6771984 6.354 6.286 6.09 5.679 5.366 3.9951985 5.248 5.177 4.977 4.596 4.327 3.511986 6.98 6.889 6.676 6.243 5.899 4.0451987 8.074 7.957 7.509 6.972 6.845 5.1451988 8.617 8.51 8.06 7.255 6.686 4.3531989 7.425 7.308 7.112 6.72 6.349 4.2551990 9.658 9.501 8.82 7.572 7.221 4.979
0.1 13.169 12.955 12.143 10.6543 9.9702 6.6466Average of yearly averages: 4.594
Inputs generated by pe4.pl - 8-August-2003

Page -138- Page 143 of239
Data used for this run:Output File: CAtomatoGMetfile: w93193.dvfPRZM scenario: CAtomatoC.txtEXAMS environment file: pond298.exvChemical Name: PBODescription Variable Name Value Units CommentsMolecular weight mwt 338.45 g/molHenry's Law Const. henry 1.56e-14 atm-m^3/molVapor Pressure vapr 5e-13 torrSolubility sol 143 mg/LKd Kd mg/LKoc Koc 399 mg/LPhotolysis half-life kdp 5.07 days Half-lifeAerobic Aquatic Metabolism kbacw 133 days HalfifeAnaerobic Aquatic Metabolism kbacs 0 days HalfifeAerobic Soil Metabolism asm 73 days HalfifeHydrolysis: pH 5 0 days Half-lifeHydrolysis: pH 7 0 days Half-lifeHydrolysis: pH 9 0 days Half-lifeMethod: CAM 2 integer See PRZM manualIncorporation Depth: DEPI 0 cmApplication Rate: TAPP 0.56 kg/haApplication Efficiency: APPEFF 0.99 fractionSpray Drift DRFT 0.01 fraction of application rate applied to pondApplication Date Date 15-03 dd/mm or dd/mmm or dd-mm ordd-mmmInterval 1 interval 3 days Set to 0 or delete line for singleapp.Interval 2 interval 3 days Set to 0 or delete line for singleapp.Interval 3 interval 3 days Set to 0 or delete line for singleapp.Interval 4 interval 3 days Set to 0 or delete line for singleapp.Interval 5 interval 3 days Set to 0 or delete line for singleapp.Interval 6 interval 3 days Set to 0 or delete line for singleapp.Interval 7 interval 3 days Set to 0 or delete line for singleapp.Interval 8 interval 3 days Set to 0 or delete line for singleapp.Interval 9 interval 3 days Set to 0 or delete line for singleapp.Record 17: FILTRA 0
IPSCND 1

Page -139- Page 144 of239
UPTKF 0Record 18: PLVKRT 0
PLDKRT 0FEXTRC 0.5
Flag for Index Res. Run IR PondFlag for runoff calc. RUNOFF none none, monthly or total(average ofentire run)
stored as FLcabbage.outChemical: PBOPRZM environment: FLcabbageC.txt modified Satday, 12 October 2002at 16:39:00EXAMS environment: pond298.exv modified Thuday, 29 August 2002at 16:33:30Metfile: w12842.dvf modified Wedday, 3 July 2002 at 09:04:28Water segment concentrations (ppb)
Year Peak 96 hr 21 Day 60 Day 90 Day Yearly1961 45.5 44.54 31.1 16.73 11.18 2.7571962 40.94 40.22 37.51 32.91 30.56 19.971963 62.63 61.73 60.73 50.96 36.96 21.451964 62.88 62.09 59.14 55.25 52.7 36.11965 48.49 47.94 46 42.44 40.38 27.61966 37.33 36.93 35.91 33.64 32.51 22.361967 27.42 27 25.4 21.17 20.31 15.671968 30.84 30.36 29.33 25.59 20.01 16.191969 85.53 84 78.8 46.69 35.22 25.561970 73.7 72.99 70.39 64.62 60.84 38.761971 42.36 41.82 39.88 36.36 34.3 24.691972 35.42 34.92 31.47 25.59 24.02 18.761973 34.93 34.46 32.32 29.33 27.73 19.941974 36.49 35.91 31.33 28.13 26.41 18.641975 32.59 32.12 30.36 27.48 25.74 17.11976 19.56 19.29 18.44 16.23 14.6 12.681977 28.44 28 27.24 21.65 19.47 14.551978 28.06 27.62 23.65 22.98 22.13 15.551979 36.95 36.41 34.8 32.29 31.12 20.891980 32.53 31.97 30.15 24.39 19.52 15.611981 55.11 54.2 38.25 34.47 32.07 22.821982 52.89 52.05 50.16 45.86 43.13 28.151983 55.2 54.31 51.13 33.18 29.65 23.41984 52.02 51.32 48.77 44.34 41.72 271985 27.38 26.9 25.92 24.09 19.77 16.191986 32.58 31.99 29.94 23.15 22.94 18.011987 33.52 32.96 30.95 27.43 26.37 19.671988 82.25 81 77 54.85 39.97 24.36
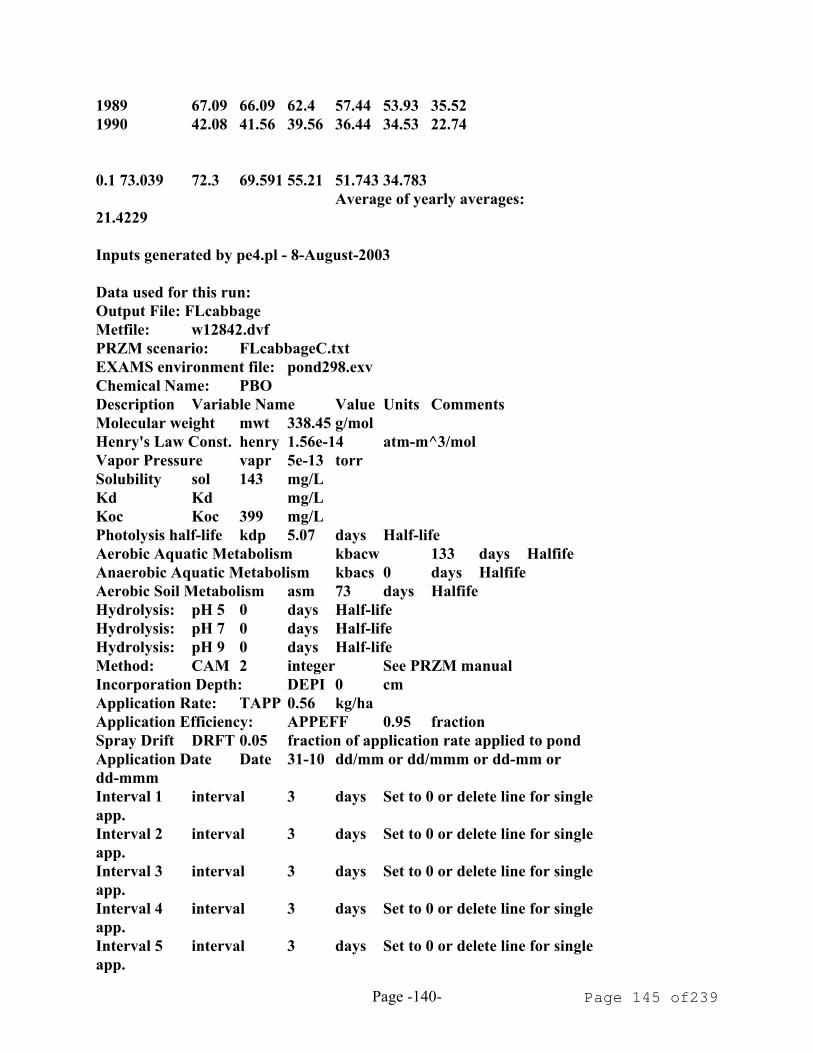
Page -140- Page 145 of239
1989 67.09 66.09 62.4 57.44 53.93 35.521990 42.08 41.56 39.56 36.44 34.53 22.74
0.1 73.039 72.3 69.591 55.21 51.743 34.783Average of yearly averages:
21.4229
Inputs generated by pe4.pl - 8-August-2003
Data used for this run:Output File: FLcabbageMetfile: w12842.dvfPRZM scenario: FLcabbageC.txtEXAMS environment file: pond298.exvChemical Name: PBODescription Variable Name Value Units CommentsMolecular weight mwt 338.45 g/molHenry's Law Const. henry 1.56e-14 atm-m^3/molVapor Pressure vapr 5e-13 torrSolubility sol 143 mg/LKd Kd mg/LKoc Koc 399 mg/LPhotolysis half-life kdp 5.07 days Half-lifeAerobic Aquatic Metabolism kbacw 133 days HalfifeAnaerobic Aquatic Metabolism kbacs 0 days HalfifeAerobic Soil Metabolism asm 73 days HalfifeHydrolysis: pH 5 0 days Half-lifeHydrolysis: pH 7 0 days Half-lifeHydrolysis: pH 9 0 days Half-lifeMethod: CAM 2 integer See PRZM manualIncorporation Depth: DEPI 0 cmApplication Rate: TAPP 0.56 kg/haApplication Efficiency: APPEFF 0.95 fractionSpray Drift DRFT 0.05 fraction of application rate applied to pondApplication Date Date 31-10 dd/mm or dd/mmm or dd-mm ordd-mmmInterval 1 interval 3 days Set to 0 or delete line for singleapp.Interval 2 interval 3 days Set to 0 or delete line for singleapp.Interval 3 interval 3 days Set to 0 or delete line for singleapp.Interval 4 interval 3 days Set to 0 or delete line for singleapp.Interval 5 interval 3 days Set to 0 or delete line for singleapp.

Page -141- Page 146 of239
Interval 6 interval 3 days Set to 0 or delete line for singleapp.Interval 7 interval 3 days Set to 0 or delete line for singleapp.Interval 8 interval 3 days Set to 0 or delete line for singleapp.Interval 9 interval 3 days Set to 0 or delete line for singleapp.Record 17: FILTRA 0
IPSCND 1UPTKF 0
Record 18: PLVKRT 0PLDKRT 0FEXTRC 0.5
Flag for Index Res. Run IR PondFlag for runoff calc. RUNOFF none none, monthly or total(average ofentire run)
stored as FLcabbageG.outChemical: PBOPRZM environment: FLcabbageC.txt modified Satday, 12 October 2002at 16:39:00EXAMS environment: pond298.exv modified Thuday, 29 August 2002at 16:33:30Metfile: w12842.dvf modified Wedday, 3 July 2002 at 09:04:28Water segment concentrations (ppb)
Year Peak 96 hr 21 Day 60 Day 90 Day Yearly1961 39.18 38.31 24.31 10.06 6.711 1.6551962 35.21 34.55 32.1 27.97 25.92 15.891963 57.26 56.59 52.96 42.86 30.66 16.11964 55.7 54.96 52.24 48.57 46.25 30.941965 40.18 39.71 38.1 35.15 33.48 22.041966 29.37 29.02 28.26 26.16 25.07 16.431967 16.65 16.38 15.46 14.1 13.19 9.5431968 19.65 19.41 18.86 15.98 12.36 9.9751969 76.86 75.43 70.55 37.95 28.37 19.61970 66.14 65.49 63.07 57.76 54.29 33.381971 35.26 34.77 32.99 29.86 28.11 18.941972 26.07 25.69 21.97 18.73 17.65 13.081973 25.92 25.55 22.96 21.69 20.48 14.271974 26.92 26.45 23.11 20.64 19.34 13.081975 23.81 23.45 22.07 19.89 18.59 11.531976 10.51 10.39 9.836 8.694 8.189 6.741977 17.1 16.84 16.54 12.17 11.55 8.4341978 18.9 18.57 14.95 14.66 14.21 9.445
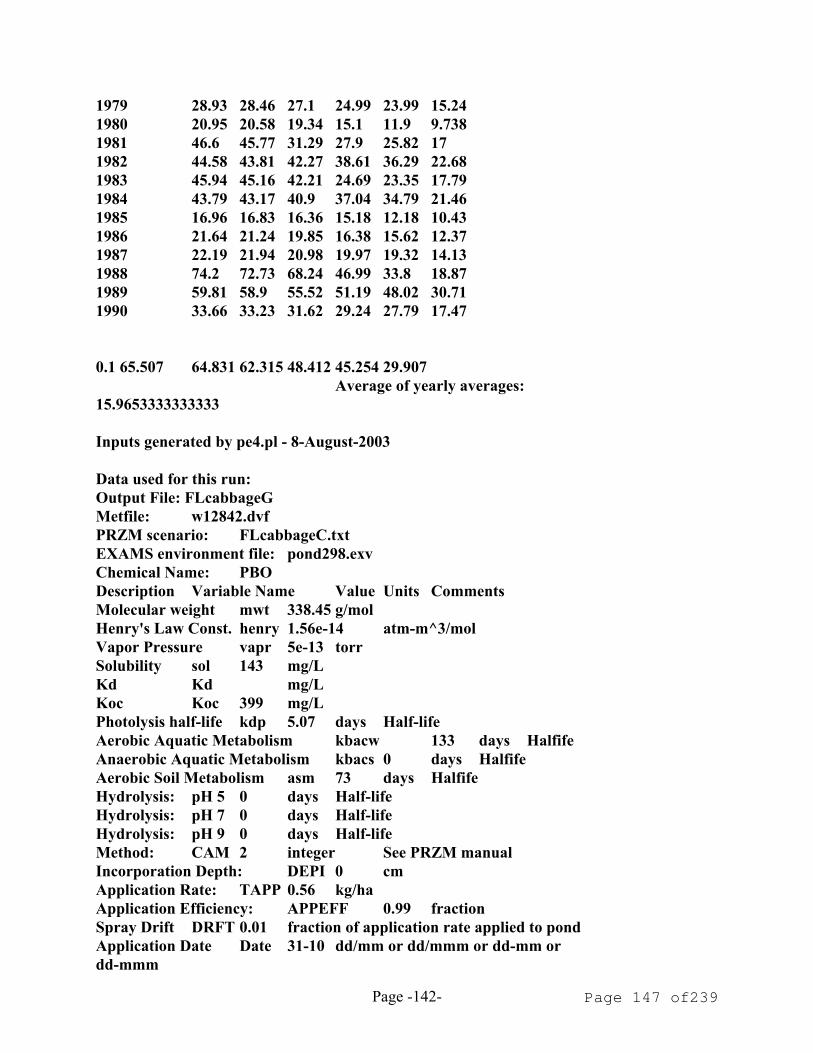
Page -142- Page 147 of239
1979 28.93 28.46 27.1 24.99 23.99 15.241980 20.95 20.58 19.34 15.1 11.9 9.7381981 46.6 45.77 31.29 27.9 25.82 171982 44.58 43.81 42.27 38.61 36.29 22.681983 45.94 45.16 42.21 24.69 23.35 17.791984 43.79 43.17 40.9 37.04 34.79 21.461985 16.96 16.83 16.36 15.18 12.18 10.431986 21.64 21.24 19.85 16.38 15.62 12.371987 22.19 21.94 20.98 19.97 19.32 14.131988 74.2 72.73 68.24 46.99 33.8 18.871989 59.81 58.9 55.52 51.19 48.02 30.711990 33.66 33.23 31.62 29.24 27.79 17.47
0.1 65.507 64.831 62.315 48.412 45.254 29.907Average of yearly averages:
15.9653333333333
Inputs generated by pe4.pl - 8-August-2003
Data used for this run:Output File: FLcabbageGMetfile: w12842.dvfPRZM scenario: FLcabbageC.txtEXAMS environment file: pond298.exvChemical Name: PBODescription Variable Name Value Units CommentsMolecular weight mwt 338.45 g/molHenry's Law Const. henry 1.56e-14 atm-m^3/molVapor Pressure vapr 5e-13 torrSolubility sol 143 mg/LKd Kd mg/LKoc Koc 399 mg/LPhotolysis half-life kdp 5.07 days Half-lifeAerobic Aquatic Metabolism kbacw 133 days HalfifeAnaerobic Aquatic Metabolism kbacs 0 days HalfifeAerobic Soil Metabolism asm 73 days HalfifeHydrolysis: pH 5 0 days Half-lifeHydrolysis: pH 7 0 days Half-lifeHydrolysis: pH 9 0 days Half-lifeMethod: CAM 2 integer See PRZM manualIncorporation Depth: DEPI 0 cmApplication Rate: TAPP 0.56 kg/haApplication Efficiency: APPEFF 0.99 fractionSpray Drift DRFT 0.01 fraction of application rate applied to pondApplication Date Date 31-10 dd/mm or dd/mmm or dd-mm ordd-mmm
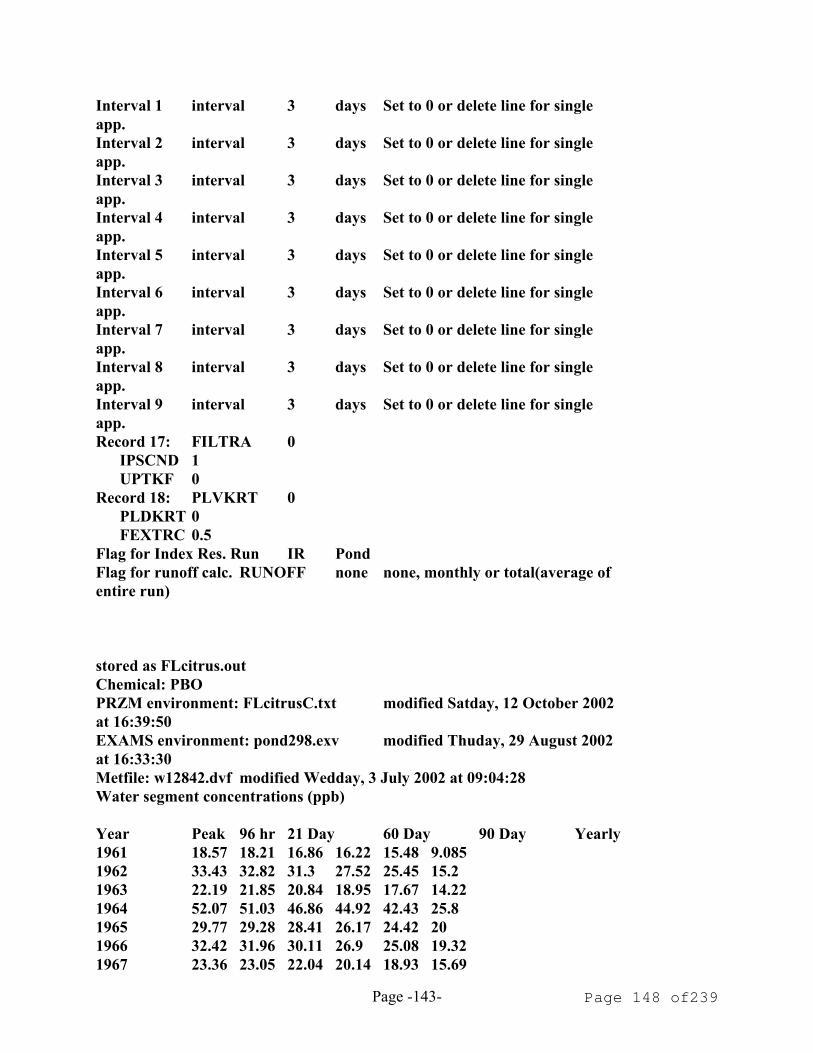
Page -143- Page 148 of239
Interval 1 interval 3 days Set to 0 or delete line for singleapp.Interval 2 interval 3 days Set to 0 or delete line for singleapp.Interval 3 interval 3 days Set to 0 or delete line for singleapp.Interval 4 interval 3 days Set to 0 or delete line for singleapp.Interval 5 interval 3 days Set to 0 or delete line for singleapp.Interval 6 interval 3 days Set to 0 or delete line for singleapp.Interval 7 interval 3 days Set to 0 or delete line for singleapp.Interval 8 interval 3 days Set to 0 or delete line for singleapp.Interval 9 interval 3 days Set to 0 or delete line for singleapp.Record 17: FILTRA 0
IPSCND 1UPTKF 0
Record 18: PLVKRT 0PLDKRT 0FEXTRC 0.5
Flag for Index Res. Run IR PondFlag for runoff calc. RUNOFF none none, monthly or total(average ofentire run)
stored as FLcitrus.outChemical: PBOPRZM environment: FLcitrusC.txt modified Satday, 12 October 2002at 16:39:50EXAMS environment: pond298.exv modified Thuday, 29 August 2002at 16:33:30Metfile: w12842.dvf modified Wedday, 3 July 2002 at 09:04:28Water segment concentrations (ppb)
Year Peak 96 hr 21 Day 60 Day 90 Day Yearly1961 18.57 18.21 16.86 16.22 15.48 9.0851962 33.43 32.82 31.3 27.52 25.45 15.21963 22.19 21.85 20.84 18.95 17.67 14.221964 52.07 51.03 46.86 44.92 42.43 25.81965 29.77 29.28 28.41 26.17 24.42 201966 32.42 31.96 30.11 26.9 25.08 19.321967 23.36 23.05 22.04 20.14 18.93 15.69

Page -144- Page 149 of239
1968 25.53 25.09 23.46 22.51 21.09 16.011969 46.85 46 44.55 41.17 37.98 25.941970 40.26 39.67 37.46 33.45 33.04 23.21971 51.78 50.72 46.76 39.98 36.46 23.941972 28.35 27.94 26.51 24.69 23.85 19.121973 57.86 57.16 53.79 46.57 42.15 24.41974 36.07 35.43 33.09 29.08 27.27 21.551975 28.61 28.08 27.01 24.46 22.88 17.931976 45.66 45.04 42.32 37.53 34.3 21.751977 25.43 25.08 24.07 22.16 20.85 15.31978 23.31 22.92 21.99 20.56 20.43 14.031979 144 142 130 110 97.35 48.611980 57.07 56.29 53.27 49.97 47.79 34.771981 37.06 36.42 35.41 31.9 31.21 24.141982 31.02 30.58 29.19 27.04 26.95 20.031983 55.59 54.59 52.61 46.45 44.36 27.391984 31.83 31.31 29.24 26.3 26.11 19.951985 32.22 31.57 29.21 26.1 24.14 18.81986 47.94 47.3 46.46 41.53 38.4 22.951987 87.58 85.84 79.26 68.89 62.9 35.411988 38.02 37.53 36.44 34.08 32.43 23.761989 23.84 23.51 22.51 20.64 19.33 15.261990 27.38 26.88 24.99 22 20.57 13.86
0.1 57.781 57.073 53.738 49.63 47.447 34.032Average of yearly averages:
21.5805
Inputs generated by pe4.pl - 8-August-2003
Data used for this run:Output File: FLcitrusMetfile: w12842.dvfPRZM scenario: FLcitrusC.txtEXAMS environment file: pond298.exvChemical Name: PBODescription Variable Name Value Units CommentsMolecular weight mwt 338.45 g/molHenry's Law Const. henry 1.56e-14 atm-m^3/molVapor Pressure vapr 5e-13 torrSolubility sol 143 mg/LKd Kd mg/LKoc Koc 399 mg/LPhotolysis half-life kdp 5.07 days Half-lifeAerobic Aquatic Metabolism kbacw 133 days HalfifeAnaerobic Aquatic Metabolism kbacs 0 days Halfife

Page -145- Page 150 of239
Aerobic Soil Metabolism asm 73 days HalfifeHydrolysis: pH 5 0 days Half-lifeHydrolysis: pH 7 0 days Half-lifeHydrolysis: pH 9 0 days Half-lifeMethod: CAM 2 integer See PRZM manualIncorporation Depth: DEPI 0 cmApplication Rate: TAPP 0.56 kg/haApplication Efficiency: APPEFF 0.95 fractionSpray Drift DRFT 0.05 fraction of application rate applied to pondApplication Date Date 28-02 dd/mm or dd/mmm or dd-mm ordd-mmmInterval 1 interval 3 days Set to 0 or delete line for singleapp.Interval 2 interval 3 days Set to 0 or delete line for singleapp.Interval 3 interval 3 days Set to 0 or delete line for singleapp.Interval 4 interval 3 days Set to 0 or delete line for singleapp.Interval 5 interval 3 days Set to 0 or delete line for singleapp.Interval 6 interval 3 days Set to 0 or delete line for singleapp.Interval 7 interval 3 days Set to 0 or delete line for singleapp.Interval 8 interval 3 days Set to 0 or delete line for singleapp.Interval 9 interval 3 days Set to 0 or delete line for singleapp.Record 17: FILTRA 0
IPSCND 1UPTKF 0
Record 18: PLVKRT 0PLDKRT 0FEXTRC 0.5
Flag for Index Res. Run IR PondFlag for runoff calc. RUNOFF none none, monthly or total(average ofentire run)
stored as FLcitrusG.outChemical: PBOPRZM environment: FLcitrusC.txt modified Satday, 12 October 2002at 16:39:50EXAMS environment: pond298.exv modified Thuday, 29 August 2002at 16:33:30

Page -146- Page 151 of239
Metfile: w12842.dvf modified Wedday, 3 July 2002 at 09:04:28Water segment concentrations (ppb)
Year Peak 96 hr 21 Day 60 Day 90 Day Yearly1961 10.76 10.54 9.731 9.262 8.878 5.71962 22.79 22.5 21.4 18.9 17.46 10.561963 15.42 15.12 14.58 13.33 12.33 9.0211964 44.03 43.13 39.79 36.55 34.87 20.941965 23.59 23.18 22.47 20.74 19.3 14.791966 25.97 25.49 23.92 21.28 19.74 13.981967 15.35 15.11 14.33 13.51 12.95 10.281968 18.5 18.13 16.98 16.53 15.5 10.51969 39.89 39.36 38.02 35.14 32.4 20.781970 28.49 28.22 27.15 24.05 24.54 18.031971 44.82 43.83 40.18 34.05 30.94 18.891972 21.66 21.27 19.81 18.56 17.4 14.031973 48 47.13 44.06 38.06 34.4 19.561974 30.91 30.31 28.05 24.32 22.35 16.71975 23.17 22.7 21.76 19.36 18.04 13.041976 38.92 38.39 36 31.85 29.02 16.891977 13.41 13.28 13.1 12.71 12.77 10.071978 16.08 15.78 14.85 13.51 12.68 8.7351979 141 139 127 106 94.38 44.851980 48.35 47.7 45.22 42.71 40.55 30.441981 31.07 30.51 29.47 26.48 24.47 19.191982 24.29 23.94 22.85 21.14 19.71 14.921983 44.75 43.93 42.74 37.9 36.67 22.571984 24.81 24.36 22.65 20.39 19.06 14.841985 26.54 25.96 23.82 21.18 19.53 13.851986 39.8 39.18 36.97 32.62 30.23 18.171987 78.66 77.06 71 61.61 56.26 31.111988 27.06 26.82 26.11 24.74 23.87 18.891989 15.42 15.19 14.69 13.51 12.47 10.21990 16.21 15.92 14.8 13.11 12.44 8.857
0.1 48.315 47.643 45.104 42.245 40.162 29.653Average of yearly averages:
16.6794333333333
Inputs generated by pe4.pl - 8-August-2003
Data used for this run:Output File: FLcitrusGMetfile: w12842.dvfPRZM scenario: FLcitrusC.txtEXAMS environment file: pond298.exv

Page -147- Page 152 of239
Chemical Name: PBODescription Variable Name Value Units CommentsMolecular weight mwt 338.45 g/molHenry's Law Const. henry 1.56e-14 atm-m^3/molVapor Pressure vapr 5e-13 torrSolubility sol 143 mg/LKd Kd mg/LKoc Koc 399 mg/LPhotolysis half-life kdp 5.07 days Half-lifeAerobic Aquatic Metabolism kbacw 133 days HalfifeAnaerobic Aquatic Metabolism kbacs 0 days HalfifeAerobic Soil Metabolism asm 73 days HalfifeHydrolysis: pH 5 0 days Half-lifeHydrolysis: pH 7 0 days Half-lifeHydrolysis: pH 9 0 days Half-lifeMethod: CAM 2 integer See PRZM manualIncorporation Depth: DEPI 0 cmApplication Rate: TAPP 0.56 kg/haApplication Efficiency: APPEFF 0.99 fractionSpray Drift DRFT 0.01 fraction of application rate applied to pondApplication Date Date 28-02 dd/mm or dd/mmm or dd-mm ordd-mmmInterval 1 interval 3 days Set to 0 or delete line for singleapp.Interval 2 interval 3 days Set to 0 or delete line for singleapp.Interval 3 interval 3 days Set to 0 or delete line for singleapp.Interval 4 interval 3 days Set to 0 or delete line for singleapp.Interval 5 interval 3 days Set to 0 or delete line for singleapp.Interval 6 interval 3 days Set to 0 or delete line for singleapp.Interval 7 interval 3 days Set to 0 or delete line for singleapp.Interval 8 interval 3 days Set to 0 or delete line for singleapp.Interval 9 interval 3 days Set to 0 or delete line for singleapp.Record 17: FILTRA 0
IPSCND 1UPTKF 0
Record 18: PLVKRT 0PLDKRT 0FEXTRC 0.5
Flag for Index Res. Run IR Pond

Page -148- Page 153 of239
Flag for runoff calc. RUNOFF none none, monthly or total(average ofentire run)
stored as FLcucumber.outChemical: PBOPRZM environment: FLcucumberC.txt modified Satday, 12 October 2002at 16:40:38EXAMS environment: pond298.exv modified Thuday, 29 August 2002at 16:33:30Metfile: w12842.dvf modified Wedday, 3 July 2002 at 09:04:28Water segment concentrations (ppb)
Year Peak 96 hr 21 Day 60 Day 90 Day Yearly1961 50.29 49.23 33.75 18.47 12.58 3.1021962 45.49 44.68 41.66 36.57 33.89 22.071963 89.87 88.34 84.26 68.47 48.9 24.541964 75.81 74.91 71.54 67.45 64.06 43.241965 51.72 51.16 49.27 45.71 43.51 29.951966 40.58 40.14 39.01 36.59 35.3 24.281967 32.97 32.43 30.42 22.29 21.02 16.621968 39.52 38.87 37.89 32.46 25.08 19.391969 86.43 84.93 79.87 51.31 38.82 27.741970 74.69 73.97 71.4 65.5 61.68 39.561971 42.46 41.93 40.04 36.57 34.47 24.961972 37.34 36.85 33.38 29.21 25.96 20.361973 38.12 37.62 34.46 31.05 29.37 21.671974 44.03 43.3 36.72 30.83 28.94 20.671975 39.17 38.59 36.42 33.03 30.95 21.031976 21.74 21.45 20.53 18.87 18.09 14.941977 28.88 28.46 27.94 23.34 21.36 15.961978 31.2 30.73 24.47 23.52 22.58 16.581979 41.99 41.38 39.56 36.59 35.02 23.361980 37.38 36.75 35.66 29.22 22.58 17.841981 61.93 60.89 39.09 35.44 33.08 24.21982 59.39 58.43 56.37 51.48 48.27 31.511983 57.21 56.32 53.34 36.84 33.68 26.451984 54.9 54.19 51.58 46.97 44.15 28.691985 42.72 42.08 41.67 38.38 29.06 18.761986 37.65 37.22 36.1 33.45 32.43 24.291987 38.4 37.79 36.36 33.33 30.94 23.441988 101 98.72 91.78 65.26 47.51 27.831989 77.51 76.38 72.15 66.18 62.08 40.671990 44.44 43.91 41.89 38.61 36.56 24.21
0.1 85.538 84.075 79.098 66.112 60.402 38.755

Page -149- Page 154 of239
Average of yearly averages:23.9304
Inputs generated by pe4.pl - 8-August-2003
Data used for this run:Output File: FLcucumberMetfile: w12842.dvfPRZM scenario: FLcucumberC.txtEXAMS environment file: pond298.exvChemical Name: PBODescription Variable Name Value Units CommentsMolecular weight mwt 338.45 g/molHenry's Law Const. henry 1.56e-14 atm-m^3/molVapor Pressure vapr 5e-13 torrSolubility sol 143 mg/LKd Kd mg/LKoc Koc 399 mg/LPhotolysis half-life kdp 5.07 days Half-lifeAerobic Aquatic Metabolism kbacw 133 days HalfifeAnaerobic Aquatic Metabolism kbacs 0 days HalfifeAerobic Soil Metabolism asm 73 days HalfifeHydrolysis: pH 5 0 days Half-lifeHydrolysis: pH 7 0 days Half-lifeHydrolysis: pH 9 0 days Half-lifeMethod: CAM 2 integer See PRZM manualIncorporation Depth: DEPI 0 cmApplication Rate: TAPP 0.56 kg/haApplication Efficiency: APPEFF 0.95 fractionSpray Drift DRFT 0.05 fraction of application rate applied to pondApplication Date Date 24-10 dd/mm or dd/mmm or dd-mm ordd-mmmInterval 1 interval 3 days Set to 0 or delete line for singleapp.Interval 2 interval 3 days Set to 0 or delete line for singleapp.Interval 3 interval 3 days Set to 0 or delete line for singleapp.Interval 4 interval 3 days Set to 0 or delete line for singleapp.Interval 5 interval 3 days Set to 0 or delete line for singleapp.Interval 6 interval 3 days Set to 0 or delete line for singleapp.Interval 7 interval 3 days Set to 0 or delete line for singleapp.Interval 8 interval 3 days Set to 0 or delete line for single
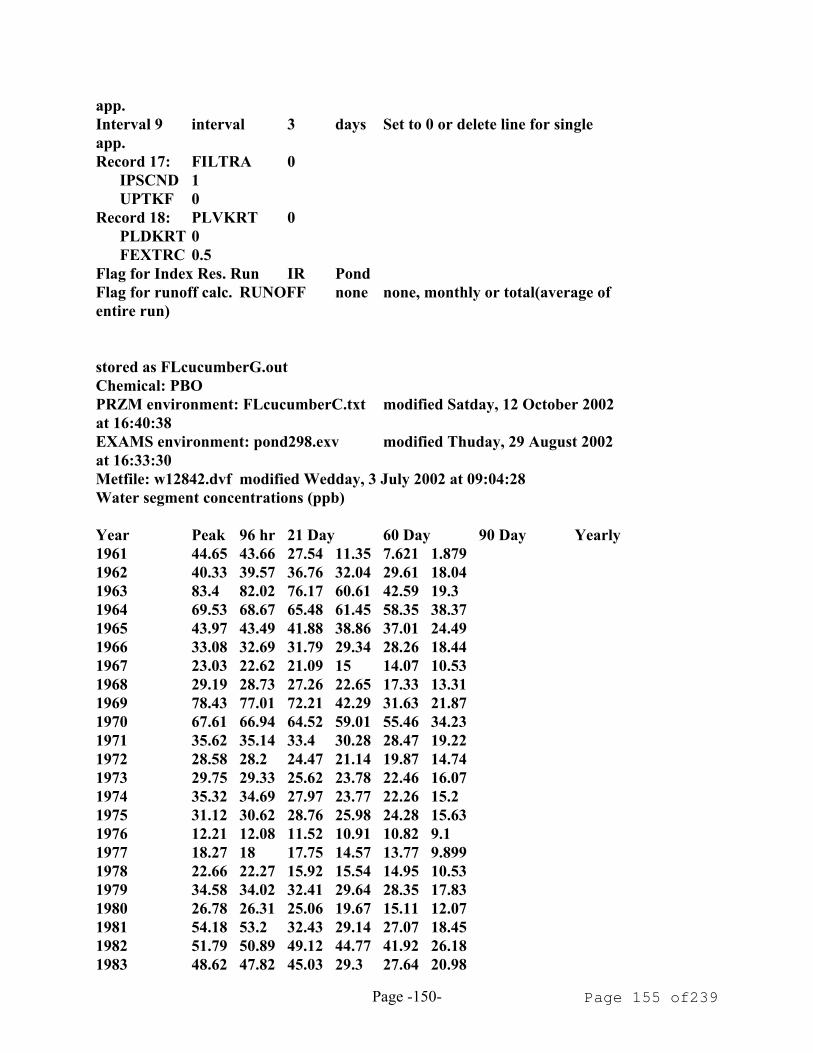
Page -150- Page 155 of239
app.Interval 9 interval 3 days Set to 0 or delete line for singleapp.Record 17: FILTRA 0
IPSCND 1UPTKF 0
Record 18: PLVKRT 0PLDKRT 0FEXTRC 0.5
Flag for Index Res. Run IR PondFlag for runoff calc. RUNOFF none none, monthly or total(average ofentire run)
stored as FLcucumberG.outChemical: PBOPRZM environment: FLcucumberC.txt modified Satday, 12 October 2002at 16:40:38EXAMS environment: pond298.exv modified Thuday, 29 August 2002at 16:33:30Metfile: w12842.dvf modified Wedday, 3 July 2002 at 09:04:28Water segment concentrations (ppb)
Year Peak 96 hr 21 Day 60 Day 90 Day Yearly1961 44.65 43.66 27.54 11.35 7.621 1.8791962 40.33 39.57 36.76 32.04 29.61 18.041963 83.4 82.02 76.17 60.61 42.59 19.31964 69.53 68.67 65.48 61.45 58.35 38.371965 43.97 43.49 41.88 38.86 37.01 24.491966 33.08 32.69 31.79 29.34 28.26 18.441967 23.03 22.62 21.09 15 14.07 10.531968 29.19 28.73 27.26 22.65 17.33 13.311969 78.43 77.01 72.21 42.29 31.63 21.871970 67.61 66.94 64.52 59.01 55.46 34.231971 35.62 35.14 33.4 30.28 28.47 19.221972 28.58 28.2 24.47 21.14 19.87 14.741973 29.75 29.33 25.62 23.78 22.46 16.071974 35.32 34.69 27.97 23.77 22.26 15.21975 31.12 30.62 28.76 25.98 24.28 15.631976 12.21 12.08 11.52 10.91 10.82 9.11977 18.27 18 17.75 14.57 13.77 9.8991978 22.66 22.27 15.92 15.54 14.95 10.531979 34.58 34.02 32.41 29.64 28.35 17.831980 26.78 26.31 25.06 19.67 15.11 12.071981 54.18 53.2 32.43 29.14 27.07 18.451982 51.79 50.89 49.12 44.77 41.92 26.181983 48.62 47.82 45.03 29.3 27.64 20.98

Page -151- Page 156 of239
1984 47.24 46.59 44.22 40.09 37.6 23.221985 36.59 36.19 33.97 29.64 22.08 13.111986 29.64 29.29 28.48 26.4 25.78 18.941987 27.92 27.65 26.52 25.39 24.39 18.081988 92.62 90.52 84.09 57.38 41.18 22.51989 71.13 70.06 66.08 60.61 56.79 36.091990 36.56 36.13 34.45 31.82 30.18 19
0.1 77.7 76.315 71.597 60.45 54.173 33.425Average of yearly averages:
18.5766
Inputs generated by pe4.pl - 8-August-2003
Data used for this run:Output File: FLcucumberGMetfile: w12842.dvfPRZM scenario: FLcucumberC.txtEXAMS environment file: pond298.exvChemical Name: PBODescription Variable Name Value Units CommentsMolecular weight mwt 338.45 g/molHenry's Law Const. henry 1.56e-14 atm-m^3/molVapor Pressure vapr 5e-13 torrSolubility sol 143 mg/LKd Kd mg/LKoc Koc 399 mg/LPhotolysis half-life kdp 5.07 days Half-lifeAerobic Aquatic Metabolism kbacw 133 days HalfifeAnaerobic Aquatic Metabolism kbacs 0 days HalfifeAerobic Soil Metabolism asm 73 days HalfifeHydrolysis: pH 5 0 days Half-lifeHydrolysis: pH 7 0 days Half-lifeHydrolysis: pH 9 0 days Half-lifeMethod: CAM 2 integer See PRZM manualIncorporation Depth: DEPI 0 cmApplication Rate: TAPP 0.56 kg/haApplication Efficiency: APPEFF 0.99 fractionSpray Drift DRFT 0.01 fraction of application rate applied to pondApplication Date Date 24-10 dd/mm or dd/mmm or dd-mm ordd-mmmInterval 1 interval 3 days Set to 0 or delete line for singleapp.Interval 2 interval 3 days Set to 0 or delete line for singleapp.Interval 3 interval 3 days Set to 0 or delete line for single

Page -152- Page 157 of239
app.Interval 4 interval 3 days Set to 0 or delete line for singleapp.Interval 5 interval 3 days Set to 0 or delete line for singleapp.Interval 6 interval 3 days Set to 0 or delete line for singleapp.Interval 7 interval 3 days Set to 0 or delete line for singleapp.Interval 8 interval 3 days Set to 0 or delete line for singleapp.Interval 9 interval 3 days Set to 0 or delete line for singleapp.Record 17: FILTRA 0
IPSCND 1UPTKF 0
Record 18: PLVKRT 0PLDKRT 0FEXTRC 0.5
Flag for Index Res. Run IR PondFlag for runoff calc. RUNOFF none none, monthly or total(average ofentire run)
stored as FLpepper.outChemical: PBOPRZM environment: FLpeppersC.txt modified Satday, 12 October 2002at 16:41:28EXAMS environment: pond298.exv modified Thuday, 29 August 2002at 16:33:30Metfile: w12844.dvf modified Wedday, 3 July 2002 at 09:04:30Water segment concentrations (ppb)
Year Peak 96 hr 21 Day 60 Day 90 Day Yearly1961 33.31 32.53 29.86 26.83 23.57 6.0841962 50.25 49.56 48.74 46.21 43.14 20.551963 136 133 127 114 105 42.641964 177 173 163 146 130 71.421965 269 263 251 221 190 96.321966 161 160 155 144 137 98.141967 111 109 104 96.28 88.88 60.351968 147 144 135 125 117 64.461969 110 108 104 95.44 91.37 68.261970 77.01 76.49 74.43 70.31 67.27 49.111971 58.72 57.64 54 47.5 43.14 29.811972 130 127 116 93.16 69.39 34.84

Page -153- Page 158 of239
1973 79.51 78.53 75.03 68.77 64.75 49.571974 105 103 99.76 87.96 80.28 42.711975 67.91 66.98 65.9 62.65 59.57 44.81976 73.35 72.09 67.34 62.19 57.24 37.251977 53.31 52.75 50.16 46.88 44.53 34.921978 70.14 69.44 65.73 60 57.02 34.531979 83.33 81.57 75.18 66.11 61.38 39.031980 50.43 50.02 48.42 45.55 43.54 34.411981 84.36 82.75 76.75 66.14 56.95 31.531982 104 102 97.14 86.31 78.21 45.981983 94.23 92.51 88.03 80.83 77.71 52.931984 116 114 107 92.46 82.28 51.621985 86.53 85.68 82.4 76.08 71.8 53.771986 76.42 75.53 71.03 62.29 54.35 38.521987 121 120 112 106 98.22 47.51988 81.85 81.12 78.22 72.77 69.19 53.591989 58.44 57.38 55.23 50.07 46.29 36.091990 69.75 68.58 66.94 62.07 57.46 33.43
0.1 159.6 158.4 153 142.1 128.7 71.104Average of yearly averages:
46.8054666666667
Inputs generated by pe4.pl - 8-August-2003
Data used for this run:Output File: FLpepperMetfile: w12844.dvfPRZM scenario: FLpeppersC.txtEXAMS environment file: pond298.exvChemical Name: PBODescription Variable Name Value Units CommentsMolecular weight mwt 338.45 g/molHenry's Law Const. henry 1.56e-14 atm-m^3/molVapor Pressure vapr 5e-13 torrSolubility sol 143 mg/LKd Kd mg/LKoc Koc 399 mg/LPhotolysis half-life kdp 5.07 days Half-lifeAerobic Aquatic Metabolism kbacw 133 days HalfifeAnaerobic Aquatic Metabolism kbacs 0 days HalfifeAerobic Soil Metabolism asm 73 days HalfifeHydrolysis: pH 5 0 days Half-lifeHydrolysis: pH 7 0 days Half-lifeHydrolysis: pH 9 0 days Half-life

Page -154- Page 159 of239
Method: CAM 2 integer See PRZM manualIncorporation Depth: DEPI 0 cmApplication Rate: TAPP 0.56 kg/haApplication Efficiency: APPEFF 0.95 fractionSpray Drift DRFT 0.05 fraction of application rate applied to pondApplication Date Date 15-09 dd/mm or dd/mmm or dd-mm ordd-mmmInterval 1 interval 3 days Set to 0 or delete line for singleapp.Interval 2 interval 3 days Set to 0 or delete line for singleapp.Interval 3 interval 3 days Set to 0 or delete line for singleapp.Interval 4 interval 3 days Set to 0 or delete line for singleapp.Interval 5 interval 3 days Set to 0 or delete line for singleapp.Interval 6 interval 3 days Set to 0 or delete line for singleapp.Interval 7 interval 3 days Set to 0 or delete line for singleapp.Interval 8 interval 3 days Set to 0 or delete line for singleapp.Interval 9 interval 3 days Set to 0 or delete line for singleapp.Record 17: FILTRA 0
IPSCND 1UPTKF 0
Record 18: PLVKRT 0PLDKRT 0FEXTRC 0.5
Flag for Index Res. Run IR PondFlag for runoff calc. RUNOFF none none, monthly or total(average ofentire run)
stored as FLpepperG.outChemical: PBOPRZM environment: FLpeppersC.txt modified Satday, 12 October 2002at 16:41:28EXAMS environment: pond298.exv modified Thuday, 29 August 2002at 16:33:30Metfile: w12844.dvf modified Wedday, 3 July 2002 at 09:04:30

Page -155- Page 160 of239
Water segment concentrations (ppb)
Year Peak 96 hr 21 Day 60 Day 90 Day Yearly1961 26.55 25.91 23.71 20.93 17.53 4.4221962 45.08 44.1 42.42 39.09 36.36 16.71963 130 127 121 109 100 38.791964 172 169 158 142 127 68.491965 269 262 251 221 188 94.511966 161 160 154 143 136 96.31967 105 104 97.42 90.14 83.18 56.861968 141 138 129 120 112 61.021969 104 102 97.89 89.78 85.63 64.891970 72.69 72.2 70.25 66.35 63.48 45.011971 51.28 50.3 46.94 41 35.7 25.061972 126 123 112 89.03 63.37 30.631973 76.08 75.11 71.67 65.55 61.64 46.021974 98.58 96.36 92.76 81.81 74.52 38.831975 61.36 60.58 58.65 55.43 52.96 40.941976 66.27 65.09 60.7 55.07 50.24 32.881977 46.75 46.23 44.63 42.07 39.94 30.331978 63.39 62.65 59.35 53.57 50.09 29.951979 75.05 73.45 67.66 59.35 54.68 34.721980 45.34 44.97 43.51 40.92 39.1 29.91981 78.04 76.5 70.75 60.44 50.04 26.91982 99.01 97.42 91.94 81.71 72.42 42.11983 87.18 85.6 81.66 74.35 71.71 49.361984 113 111 103 87.94 76.46 47.871985 83.06 82.22 78.99 72.8 68.64 50.21986 68.51 67.59 63.75 56.03 47.68 34.41987 117 115 108 101 93.25 43.821988 78.28 77.57 74.76 69.5 66.05 50.081989 50.14 49.24 46.55 42.68 40.27 31.981990 64.52 63.18 59.54 54.95 51.01 29.24
0.1 159 157.8 151.5 139.8 125.5 68.13Average of yearly averages:
43.0734
Inputs generated by pe4.pl - 8-August-2003
Data used for this run:Output File: FLpepperGMetfile: w12844.dvf

Page -156- Page 161 of239
PRZM scenario: FLpeppersC.txtEXAMS environment file: pond298.exvChemical Name: PBODescription Variable Name Value Units CommentsMolecular weight mwt 338.45 g/molHenry's Law Const. henry 1.56e-14 atm-m^3/molVapor Pressure vapr 5e-13 torrSolubility sol 143 mg/LKd Kd mg/LKoc Koc 399 mg/LPhotolysis half-life kdp 5.07 days Half-lifeAerobic Aquatic Metabolism kbacw 133 days HalfifeAnaerobic Aquatic Metabolism kbacs 0 days HalfifeAerobic Soil Metabolism asm 73 days HalfifeHydrolysis: pH 5 0 days Half-lifeHydrolysis: pH 7 0 days Half-lifeHydrolysis: pH 9 0 days Half-lifeMethod: CAM 2 integer See PRZM manualIncorporation Depth: DEPI 0 cmApplication Rate: TAPP 0.56 kg/haApplication Efficiency: APPEFF 0.99 fractionSpray Drift DRFT 0.01 fraction of application rate applied to pondApplication Date Date 15-09 dd/mm or dd/mmm or dd-mm ordd-mmmInterval 1 interval 3 days Set to 0 or delete line for singleapp.Interval 2 interval 3 days Set to 0 or delete line for singleapp.Interval 3 interval 3 days Set to 0 or delete line for singleapp.Interval 4 interval 3 days Set to 0 or delete line for singleapp.Interval 5 interval 3 days Set to 0 or delete line for singleapp.Interval 6 interval 3 days Set to 0 or delete line for singleapp.Interval 7 interval 3 days Set to 0 or delete line for singleapp.Interval 8 interval 3 days Set to 0 or delete line for singleapp.Interval 9 interval 3 days Set to 0 or delete line for singleapp.Record 17: FILTRA 0
IPSCND 1

Page -157- Page 162 of239
UPTKF 0Record 18: PLVKRT 0
PLDKRT 0FEXTRC 0.5
Flag for Index Res. Run IR PondFlag for runoff calc. RUNOFF none none, monthly or total(average ofentire run)
stored as FLstrawberry.outChemical: PBOPRZM environment: FLstrawberryC.txt modified Thuday, 23 September2004 at 07:50:23EXAMS environment: pond298.exv modified Thuday, 29 August 2002at 16:33:30Metfile: w12842.dvf modified Wedday, 3 July 2002 at 09:04:28Water segment concentrations (ppb)
Year Peak 96 hr 21 Day 60 Day 90 Day Yearly1961 79.61 77.88 74.14 66.16 47.8 11.791962 66.35 65.35 63.66 59.6 48.6 37.661963 121 119 115 98.94 75.32 44.341964 92.3 91.35 87.76 81.82 77.12 58.471965 88.16 86.87 84.79 79.43 65.16 51.211966 90.38 88.93 86.81 79.51 63.86 49.931967 95.42 93.82 91.45 82.41 66.62 50.211968 101 98.93 96.61 88.62 72.69 53.531969 86.62 85.33 83.33 75.45 69.47 53.751970 74 72.97 71.12 66.29 61.58 47.31971 70.55 69.77 68.04 62.38 52.7 41.921972 94.17 92.55 89.67 82.44 65.54 42.331973 99.65 97.86 95.05 87.76 69.24 50.541974 98.71 97.04 94.83 86.75 69.39 51.791975 106 105 102 93.97 75.25 53.081976 83.71 82.94 79.96 74.24 70.24 52.731977 87.13 85.66 82.62 75.25 61.03 46.361978 90.53 88.9 86.81 80.15 64.82 48.151979 86.87 85.45 83.14 76.41 62.43 48.521980 84.57 83.19 80.71 73.3 59.07 46.771981 90.46 88.96 87.18 80.8 65.14 47.911982 85.83 84.33 82.49 75.61 61.85 48.851983 78.8 77.55 74.23 68.78 58.45 46.251984 82.56 81.19 78.02 70.78 56.61 44.2

Page -158- Page 163 of239
1985 103 101 96.92 89.81 69.98 46.061986 96.53 94.68 91.82 84.34 69.15 53.31987 104 102 97.49 90.36 72.68 52.861988 97.2 95.5 90.42 81.74 67.83 53.61989 85.9 84.69 82.11 75.43 62.58 48.771990 69.31 68.55 65.62 60.15 56.68 36.86
0.1 103.9 101.9 97.433 90.305 74.994 53.593Average of yearly averages:
47.3013333333333
Inputs generated by pe4.pl - 8-August-2003
Data used for this run:Output File: FLstrawberryMetfile: w12842.dvfPRZM scenario: FLstrawberryC.txtEXAMS environment file: pond298.exvChemical Name: PBODescription Variable Name Value Units CommentsMolecular weight mwt 338.45 g/molHenry's Law Const. henry 1.56e-14 atm-m^3/molVapor Pressure vapr 5e-13 torrSolubility sol 143 mg/LKd Kd mg/LKoc Koc 399 mg/LPhotolysis half-life kdp 5.07 days Half-lifeAerobic Aquatic Metabolism kbacw 133 days HalfifeAnaerobic Aquatic Metabolism kbacs 0 days HalfifeAerobic Soil Metabolism asm 73 days HalfifeHydrolysis: pH 5 0 days Half-lifeHydrolysis: pH 7 0 days Half-lifeHydrolysis: pH 9 0 days Half-lifeMethod: CAM 2 integer See PRZM manualIncorporation Depth: DEPI 0 cmApplication Rate: TAPP 0.56 kg/haApplication Efficiency: APPEFF 0.95 fractionSpray Drift DRFT 0.05 fraction of application rate applied to pondApplication Date Date 15-10 dd/mm or dd/mmm or dd-mm ordd-mmmInterval 1 interval 3 days Set to 0 or delete line for singleapp.

Page -159- Page 164 of239
Interval 2 interval 3 days Set to 0 or delete line for singleapp.Interval 3 interval 3 days Set to 0 or delete line for singleapp.Interval 4 interval 3 days Set to 0 or delete line for singleapp.Interval 5 interval 3 days Set to 0 or delete line for singleapp.Interval 6 interval 3 days Set to 0 or delete line for singleapp.Interval 7 interval 3 days Set to 0 or delete line for singleapp.Interval 8 interval 3 days Set to 0 or delete line for singleapp.Interval 9 interval 3 days Set to 0 or delete line for singleapp.Record 17: FILTRA 0
IPSCND 1UPTKF 0
Record 18: PLVKRT 0PLDKRT 0FEXTRC 0.5
Flag for Index Res. Run IR PondFlag for runoff calc. RUNOFF none none, monthly or total(average ofentire run)
stored as FLstrawberryG.outChemical: PBOPRZM environment: FLstrawberryC.txt modified Thuday, 23 September2004 at 07:50:23EXAMS environment: pond298.exv modified Thuday, 29 August 2002at 16:33:30Metfile: w12842.dvf modified Wedday, 3 July 2002 at 09:04:28Water segment concentrations (ppb)
Year Peak 96 hr 21 Day 60 Day 90 Day Yearly1961 73.19 71.58 68.4 60.88 43.67 10.771962 57.73 56.87 55.78 51.98 43.95 34.261963 114 112 108 92.28 69.56 39.941964 86.76 85.85 82.43 76.29 72.31 54.261965 79.54 78.39 76.16 71.69 58.69 46.651966 82.28 81 78.93 71.73 57.3 45.181967 86.65 85.25 83.42 74.79 60.2 45.56

Page -160- Page 165 of239
1968 91.47 89.99 88.37 81.07 66.36 48.911969 77.86 76.69 74.98 67.35 63.96 48.991970 65.36 64.48 62.79 58.41 55.7 42.321971 62.13 61.46 59.75 54.09 46.75 36.921972 86.08 84.58 81.8 75.13 59.36 37.651973 92 90.33 87.52 80.75 63.26 46.181974 90.89 89.34 87.33 79.67 63.43 47.641975 99.18 97.49 95.01 87.33 69.67 49.041976 78.17 77.44 74.64 69.27 65.52 48.51977 78.29 76.96 74.1 67.44 54.49 41.61978 82.12 80.68 79.08 72.76 58.58 43.451979 78.92 77.62 75.39 68.88 56.15 44.071980 75.84 74.59 72.39 65.51 53.75 42.241981 81.36 80.07 78.94 73.13 58.69 43.181982 77.54 76.23 74.64 68 56.05 44.271983 70.05 68.93 66.15 60.74 53.1 41.621984 73.45 72.22 69.42 62.87 49.95 39.411985 94.97 93.09 89.81 83.07 64.19 41.581986 88.66 86.96 84.21 77.48 63.4 49.211987 96.27 94.61 90.28 83.46 66.89 48.781988 89.7 88.12 83.42 74.47 62.9 49.371989 77.84 76.76 74.27 67.94 57.65 44.541990 63.02 62.32 59.64 54.65 51.48 32.19
0.1 96.14 94.458 90.233 83.421 69.293 49.193Average of yearly averages:
42.9426666666667
Inputs generated by pe4.pl - 8-August-2003
Data used for this run:Output File: FLstrawberryGMetfile: w12842.dvfPRZM scenario: FLstrawberryC.txtEXAMS environment file: pond298.exvChemical Name: PBODescription Variable Name Value Units CommentsMolecular weight mwt 338.45 g/molHenry's Law Const. henry 1.56e-14 atm-m^3/molVapor Pressure vapr 5e-13 torrSolubility sol 143 mg/LKd Kd mg/L

Page -161- Page 166 of239
Koc Koc 399 mg/LPhotolysis half-life kdp 5.07 days Half-lifeAerobic Aquatic Metabolism kbacw 133 days HalfifeAnaerobic Aquatic Metabolism kbacs 0 days HalfifeAerobic Soil Metabolism asm 73 days HalfifeHydrolysis: pH 5 0 days Half-lifeHydrolysis: pH 7 0 days Half-lifeHydrolysis: pH 9 0 days Half-lifeMethod: CAM 2 integer See PRZM manualIncorporation Depth: DEPI 0 cmApplication Rate: TAPP 0.56 kg/haApplication Efficiency: APPEFF 0.99 fractionSpray Drift DRFT 0.01 fraction of application rate applied to pondApplication Date Date 15-10 dd/mm or dd/mmm or dd-mm ordd-mmmInterval 1 interval 3 days Set to 0 or delete line for singleapp.Interval 2 interval 3 days Set to 0 or delete line for singleapp.Interval 3 interval 3 days Set to 0 or delete line for singleapp.Interval 4 interval 3 days Set to 0 or delete line for singleapp.Interval 5 interval 3 days Set to 0 or delete line for singleapp.Interval 6 interval 3 days Set to 0 or delete line for singleapp.Interval 7 interval 3 days Set to 0 or delete line for singleapp.Interval 8 interval 3 days Set to 0 or delete line for singleapp.Interval 9 interval 3 days Set to 0 or delete line for singleapp.Record 17: FILTRA 0
IPSCND 1UPTKF 0
Record 18: PLVKRT 0PLDKRT 0FEXTRC 0.5
Flag for Index Res. Run IR PondFlag for runoff calc. RUNOFF none none, monthly or total(average ofentire run)

Page -162- Page 167 of239
stored as FLtomato.outChemical: PBOPRZM environment: FLtomatoC.txt modified Satday, 12 October 2002at 16:44:04EXAMS environment: pond298.exv modified Thuday, 29 August 2002at 16:33:30Metfile: w12844.dvf modified Wedday, 3 July 2002 at 09:04:30Water segment concentrations (ppb)
Year Peak 96 hr 21 Day 60 Day 90 Day Yearly1961 41.81 40.9 38.07 34.11 31.02 16.561962 57.6 56.46 53.07 47.25 43.39 25.551963 36.61 36.01 33.8 29.53 26.93 20.241964 44.24 43.77 42.87 39.38 38.06 24.981965 39.06 38.57 36.13 31.71 29.47 19.271966 129 127 117 102 92.2 49.971967 75.04 73.82 68.98 65.3 61.56 39.461968 52.87 52.11 49.13 44.3 41.29 26.961969 56.19 55.25 52.25 46.91 43.82 27.531970 103 102 97.07 88.37 80.46 45.251971 42.23 41.69 39.08 34.75 32.48 25.651972 39.22 38.62 37.48 35.95 34.07 22.781973 30.79 30.33 28.68 27.12 25.92 17.161974 44.89 43.96 40.52 35.57 32.59 19.941975 21.63 21.3 20.34 18.62 17.47 12.841976 69.72 68.21 65.53 56.4 51.35 28.611977 55.64 54.52 51.78 47.49 43.18 27.191978 31.94 31.57 31.03 29.43 27.85 18.441979 86.63 84.64 77.56 65.76 58.77 31.691980 81.75 80.26 74.69 66.87 61.66 37.71981 61.85 60.96 57.07 52.17 48.03 29.261982 79.83 78.36 72.68 67.35 62.36 36.151983 68.45 67.3 63.66 58.85 55.13 32.851984 84.97 83.53 79.73 72.92 72.13 43.961985 67.83 66.59 61.9 59.39 55.44 34.741986 50.23 49.61 48.24 44.95 41.79 26.711987 68.39 67.1 64.6 58.71 54.05 30.931988 43.12 42.45 41.06 37.92 36.51 23.681989 40.59 39.98 37.56 32.33 29.37 19.81990 33.45 32.82 30.48 26.8 25.01 16.04
0.1 86.464 84.529 79.513 72.363 71.153 43.51Average of yearly averages:
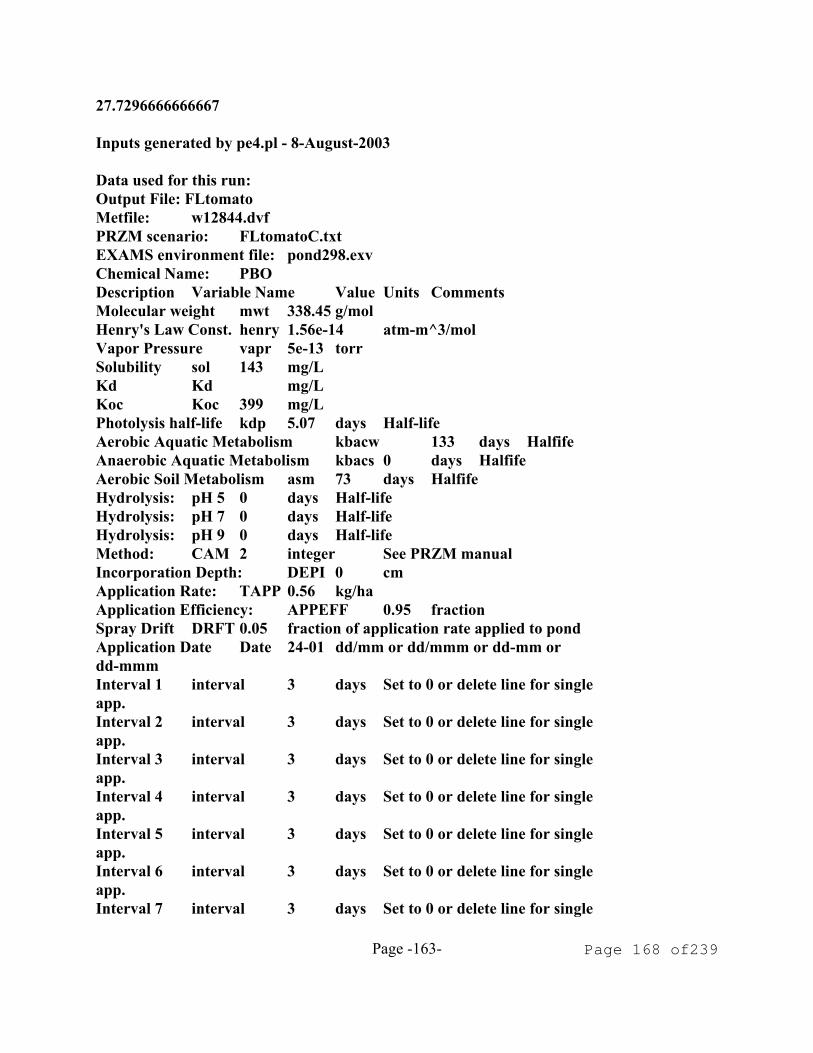
Page -163- Page 168 of239
27.7296666666667
Inputs generated by pe4.pl - 8-August-2003
Data used for this run:Output File: FLtomatoMetfile: w12844.dvfPRZM scenario: FLtomatoC.txtEXAMS environment file: pond298.exvChemical Name: PBODescription Variable Name Value Units CommentsMolecular weight mwt 338.45 g/molHenry's Law Const. henry 1.56e-14 atm-m^3/molVapor Pressure vapr 5e-13 torrSolubility sol 143 mg/LKd Kd mg/LKoc Koc 399 mg/LPhotolysis half-life kdp 5.07 days Half-lifeAerobic Aquatic Metabolism kbacw 133 days HalfifeAnaerobic Aquatic Metabolism kbacs 0 days HalfifeAerobic Soil Metabolism asm 73 days HalfifeHydrolysis: pH 5 0 days Half-lifeHydrolysis: pH 7 0 days Half-lifeHydrolysis: pH 9 0 days Half-lifeMethod: CAM 2 integer See PRZM manualIncorporation Depth: DEPI 0 cmApplication Rate: TAPP 0.56 kg/haApplication Efficiency: APPEFF 0.95 fractionSpray Drift DRFT 0.05 fraction of application rate applied to pondApplication Date Date 24-01 dd/mm or dd/mmm or dd-mm ordd-mmmInterval 1 interval 3 days Set to 0 or delete line for singleapp.Interval 2 interval 3 days Set to 0 or delete line for singleapp.Interval 3 interval 3 days Set to 0 or delete line for singleapp.Interval 4 interval 3 days Set to 0 or delete line for singleapp.Interval 5 interval 3 days Set to 0 or delete line for singleapp.Interval 6 interval 3 days Set to 0 or delete line for singleapp.Interval 7 interval 3 days Set to 0 or delete line for single

Page -164- Page 169 of239
app.Interval 8 interval 3 days Set to 0 or delete line for singleapp.Interval 9 interval 3 days Set to 0 or delete line for singleapp.Record 17: FILTRA 0
IPSCND 1UPTKF 0
Record 18: PLVKRT 0PLDKRT 0FEXTRC 0.5
Flag for Index Res. Run IR PondFlag for runoff calc. RUNOFF none none, monthly or total(average ofentire run)
stored as FLtomatoG.outChemical: PBOPRZM environment: FLtomatoC.txt modified Satday, 12 October 2002at 16:44:04EXAMS environment: pond298.exv modified Thuday, 29 August 2002at 16:33:30Metfile: w12844.dvf modified Wedday, 3 July 2002 at 09:04:30Water segment concentrations (ppb)
Year Peak 96 hr 21 Day 60 Day 90 Day Yearly1961 36.62 35.78 32.68 29.32 26.63 13.281962 51.08 50.01 46.97 41.79 38.3 21.411963 30.66 30.09 28.12 24.33 22.07 15.461964 36.01 35.57 34.01 30.48 29.85 20.241965 28.3 28 26.3 23.08 21.2 14.361966 122 120 110 95.81 86.8 46.211967 65.48 64.43 60.22 57.88 54.85 35.241968 42.37 41.78 39.45 35.77 33.34 22.041969 47.02 46.21 43.69 39.32 36.83 22.591970 96.99 95.77 90.72 82.63 75.16 41.171971 36.67 36.16 33.77 29.9 27.5 20.861972 32.65 32.12 31.31 29.69 27.66 18.081973 20.89 20.56 19.37 18.11 17.67 12.261974 36.44 35.64 32.68 28.63 26.18 15.181975 12.19 11.99 11.44 10.24 9.551 7.7581976 60.96 59.61 57.36 49.22 44.62 24.031977 50.6 49.52 46.97 42.94 38.9 22.51978 21.3 21.07 20.55 19.85 19.02 13.34

Page -165- Page 170 of239
1979 82.07 80.09 73.08 61.51 54.73 27.171980 73.21 71.86 66.82 59.57 54.97 33.421981 51.74 51.03 47.62 43.99 40.57 24.721982 73.92 72.51 67.05 61.54 56.75 32.091983 59.4 58.4 55.35 50.89 47.83 28.531984 78.63 77.26 73.83 67.1 65.46 401985 60.61 59.46 55.3 53.51 50.03 30.471986 42.74 42.23 40.33 37.87 35.04 22.121987 60.92 59.72 57.06 52.06 47.92 26.561988 34.38 33.84 32.98 30.34 29.12 18.971989 34.08 33.5 31.33 26.7 24.11 15.091990 22.77 22.35 20.76 18.38 17.26 11.26
0.1 81.726 79.807 73.755 66.544 64.589 39.524Average of yearly averages:
23.2136
Inputs generated by pe4.pl - 8-August-2003
Data used for this run:Output File: FLtomatoGMetfile: w12844.dvfPRZM scenario: FLtomatoC.txtEXAMS environment file: pond298.exvChemical Name: PBODescription Variable Name Value Units CommentsMolecular weight mwt 338.45 g/molHenry's Law Const. henry 1.56e-14 atm-m^3/molVapor Pressure vapr 5e-13 torrSolubility sol 143 mg/LKd Kd mg/LKoc Koc 399 mg/LPhotolysis half-life kdp 5.07 days Half-lifeAerobic Aquatic Metabolism kbacw 133 days HalfifeAnaerobic Aquatic Metabolism kbacs 0 days HalfifeAerobic Soil Metabolism asm 73 days HalfifeHydrolysis: pH 5 0 days Half-lifeHydrolysis: pH 7 0 days Half-lifeHydrolysis: pH 9 0 days Half-lifeMethod: CAM 2 integer See PRZM manualIncorporation Depth: DEPI 0 cmApplication Rate: TAPP 0.56 kg/haApplication Efficiency: APPEFF 0.99 fraction

Page -166- Page 171 of239
Spray Drift DRFT 0.01 fraction of application rate applied to pondApplication Date Date 24-01 dd/mm or dd/mmm or dd-mm ordd-mmmInterval 1 interval 3 days Set to 0 or delete line for singleapp.Interval 2 interval 3 days Set to 0 or delete line for singleapp.Interval 3 interval 3 days Set to 0 or delete line for singleapp.Interval 4 interval 3 days Set to 0 or delete line for singleapp.Interval 5 interval 3 days Set to 0 or delete line for singleapp.Interval 6 interval 3 days Set to 0 or delete line for singleapp.Interval 7 interval 3 days Set to 0 or delete line for singleapp.Interval 8 interval 3 days Set to 0 or delete line for singleapp.Interval 9 interval 3 days Set to 0 or delete line for singleapp.Record 17: FILTRA 0
IPSCND 1UPTKF 0
Record 18: PLVKRT 0PLDKRT 0FEXTRC 0.5
Flag for Index Res. Run IR PondFlag for runoff calc. RUNOFF none none, monthly or total(average ofentire run)
stored as FLturf.outChemical: PBOPRZM environment: FLturfC.txt modified Monday, 16 June 2003 at14:48:06EXAMS environment: pond298.exv modified Thuday, 29 August 2002at 16:33:30Metfile: w12834.dvf modified Wedday, 3 July 2002 at 09:04:28Water segment concentrations (ppb)
Year Peak 96 hr 21 Day 60 Day 90 Day Yearly1961 12.13 11.87 11.06 9.736 9.027 5.493

Page -167- Page 172 of239
1962 15.41 15.16 14.35 12.9 11.96 8.7021963 17.72 17.44 16.53 14.93 14.29 10.471964 23.18 22.78 21.8 19.37 18.85 12.591965 20.15 19.85 18.85 17.1 15.98 11.781966 30.35 29.82 27.83 26.23 25.08 16.621967 21.71 21.41 20.46 18.73 17.56 14.361968 23.38 22.97 21.7 19.17 17.76 14.011969 20.74 20.47 19.62 17.97 17.48 12.441970 22.34 21.98 20.99 19.89 18.56 11.551971 24.26 23.84 22.3 20.13 19.03 12.811972 45.43 44.53 41.08 35.5 32.49 19.351973 23.06 22.73 21.82 21.05 20 13.361974 25.41 24.97 23.3 20.56 19.22 12.541975 19.78 19.49 18.44 17.48 16.73 11.021976 43.66 42.77 39.49 35.03 32.23 18.921977 23.62 23.29 22.32 20.53 19.31 13.931978 32.53 31.94 29.71 26.28 24.63 16.531979 33.68 33.13 32.04 28.58 27.88 17.811980 21.81 21.51 20.57 19.82 19.01 12.811981 24.54 24.2 23.68 21.93 20.58 13.021982 33.89 33.33 31.15 27.41 25.64 16.181983 39.85 39.18 36.78 33.25 30.65 18.651984 39.49 38.9 36.38 32.68 31 20.321985 23.27 22.95 22.33 21.52 20.6 141986 19.22 18.94 18.06 16.48 15.42 10.551987 28.68 28.19 26.32 23.18 21.48 13.171988 23.03 22.68 21.65 19.41 18.03 11.491989 17.85 17.56 16.66 15.33 14.97 9.7411990 25.53 25.08 24.02 21.99 20.37 11.81
0.1 39.814 39.152 36.74 33.193 30.965 18.893Average of yearly averages:
13.5342
Inputs generated by pe4.pl - 8-August-2003
Data used for this run:Output File: FLturfMetfile: w12834.dvfPRZM scenario: FLturfC.txtEXAMS environment file: pond298.exvChemical Name: PBODescription Variable Name Value Units Comments

Page -168- Page 173 of239
Molecular weight mwt 338.45 g/molHenry's Law Const. henry 1.56e-14 atm-m^3/molVapor Pressure vapr 5e-13 torrSolubility sol 143 mg/LKd Kd mg/LKoc Koc 399 mg/LPhotolysis half-life kdp 5.07 days Half-lifeAerobic Aquatic Metabolism kbacw 133 days HalfifeAnaerobic Aquatic Metabolism kbacs 0 days HalfifeAerobic Soil Metabolism asm 73 days HalfifeHydrolysis: pH 5 0 days Half-lifeHydrolysis: pH 7 0 days Half-lifeHydrolysis: pH 9 0 days Half-lifeMethod: CAM 2 integer See PRZM manualIncorporation Depth: DEPI 0 cmApplication Rate: TAPP 0.56 kg/haApplication Efficiency: APPEFF 0.95 fractionSpray Drift DRFT 0.05 fraction of application rate applied to pondApplication Date Date 15-02 dd/mm or dd/mmm or dd-mm ordd-mmmInterval 1 interval 3 days Set to 0 or delete line for singleapp.Interval 2 interval 3 days Set to 0 or delete line for singleapp.Interval 3 interval 3 days Set to 0 or delete line for singleapp.Interval 4 interval 3 days Set to 0 or delete line for singleapp.Interval 5 interval 3 days Set to 0 or delete line for singleapp.Interval 6 interval 3 days Set to 0 or delete line for singleapp.Interval 7 interval 3 days Set to 0 or delete line for singleapp.Interval 8 interval 3 days Set to 0 or delete line for singleapp.Interval 9 interval 3 days Set to 0 or delete line for singleapp.Record 17: FILTRA 0
IPSCND 1UPTKF 0
Record 18: PLVKRT 0PLDKRT 0FEXTRC 0.5

Page -169- Page 174 of239
Flag for Index Res. Run IR PondFlag for runoff calc. RUNOFF none none, monthly or total(average ofentire run)
stored as FLturfG.outChemical: PBOPRZM environment: FLturfC.txt modified Monday, 16 June 2003 at14:48:06EXAMS environment: pond298.exv modified Thuday, 29 August 2002at 16:33:30Metfile: w12834.dvf modified Wedday, 3 July 2002 at 09:04:28Water segment concentrations (ppb)
Year Peak 96 hr 21 Day 60 Day 90 Day Yearly1961 3.334 3.269 3.097 2.707 2.471 1.6641962 6.784 6.648 6.153 5.87 5.431 3.4041963 8.551 8.387 7.833 7.129 6.841 4.7771964 14.7 14.41 13.64 11.76 10.73 6.8121965 10.2 10.02 9.36 8.269 7.628 5.8221966 20.15 19.79 18.44 17.59 17.11 10.741967 13.93 13.67 12.76 11.86 11.31 8.4741968 16.36 16.03 14.99 13.04 11.83 8.0581969 10.22 10.05 9.75 9.06 8.38 6.4051970 11.05 10.86 10.16 9.413 8.938 5.71971 13.86 13.59 12.6 11.47 10.85 6.9591972 35.62 34.86 31.95 27.35 24.94 13.851973 12.11 11.97 11.56 10.77 10.46 7.6381974 14.32 14.05 13.05 11.32 10.53 6.861975 9.917 9.753 9.229 8.086 7.553 5.2611976 34.46 33.69 30.86 27.29 25.04 13.391977 11.03 10.92 10.71 10.23 9.977 8.2131978 23.48 23.01 21.23 18.76 17.72 10.991979 22.48 22.22 21.19 18.75 18.93 12.391980 10.81 10.72 10.23 9.729 9.473 7.0971981 12.87 12.69 12.1 11.75 11.11 7.2451982 24.3 23.88 22.19 19.15 17.49 10.521983 28.25 27.75 25.88 23.59 21.76 12.91984 29.39 28.94 26.94 24.23 23.2 14.61985 13.16 13 12.37 11.34 11.03 8.2941986 6.645 6.576 6.377 5.986 5.705 4.7141987 17.98 17.64 16.34 14.13 12.85 7.3881988 10.52 10.39 10.04 8.968 8.349 5.6
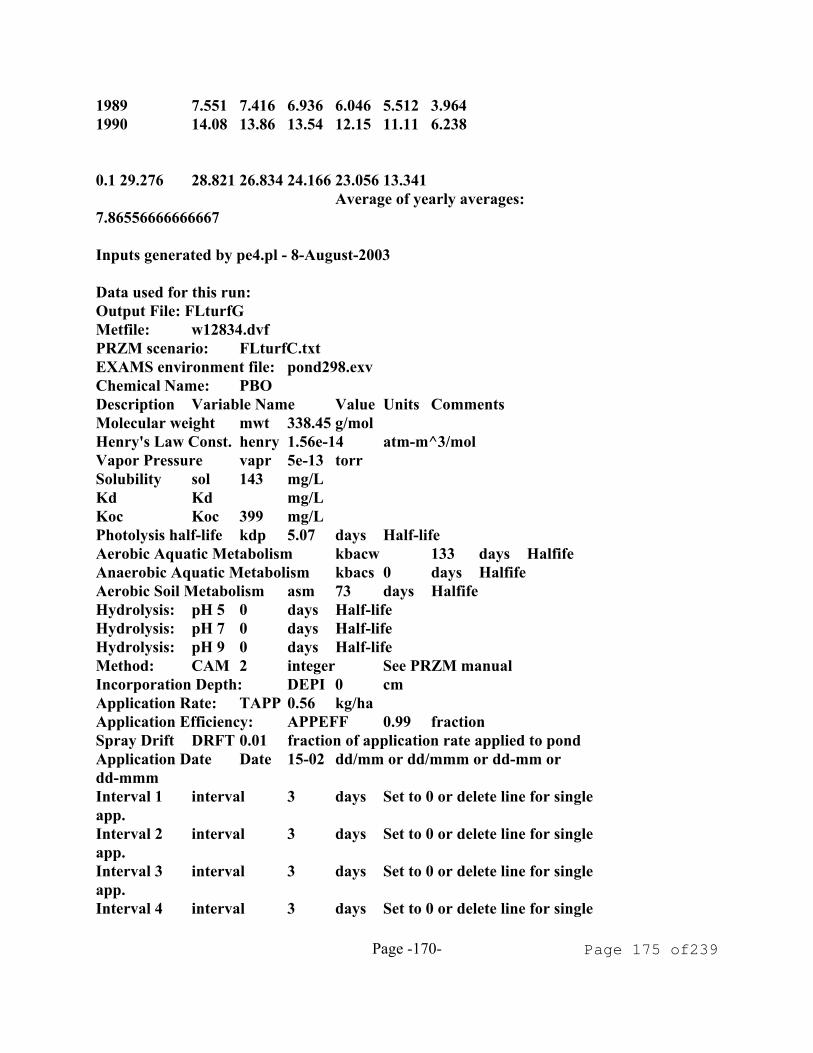
Page -170- Page 175 of239
1989 7.551 7.416 6.936 6.046 5.512 3.9641990 14.08 13.86 13.54 12.15 11.11 6.238
0.1 29.276 28.821 26.834 24.166 23.056 13.341Average of yearly averages:
7.86556666666667
Inputs generated by pe4.pl - 8-August-2003
Data used for this run:Output File: FLturfGMetfile: w12834.dvfPRZM scenario: FLturfC.txtEXAMS environment file: pond298.exvChemical Name: PBODescription Variable Name Value Units CommentsMolecular weight mwt 338.45 g/molHenry's Law Const. henry 1.56e-14 atm-m^3/molVapor Pressure vapr 5e-13 torrSolubility sol 143 mg/LKd Kd mg/LKoc Koc 399 mg/LPhotolysis half-life kdp 5.07 days Half-lifeAerobic Aquatic Metabolism kbacw 133 days HalfifeAnaerobic Aquatic Metabolism kbacs 0 days HalfifeAerobic Soil Metabolism asm 73 days HalfifeHydrolysis: pH 5 0 days Half-lifeHydrolysis: pH 7 0 days Half-lifeHydrolysis: pH 9 0 days Half-lifeMethod: CAM 2 integer See PRZM manualIncorporation Depth: DEPI 0 cmApplication Rate: TAPP 0.56 kg/haApplication Efficiency: APPEFF 0.99 fractionSpray Drift DRFT 0.01 fraction of application rate applied to pondApplication Date Date 15-02 dd/mm or dd/mmm or dd-mm ordd-mmmInterval 1 interval 3 days Set to 0 or delete line for singleapp.Interval 2 interval 3 days Set to 0 or delete line for singleapp.Interval 3 interval 3 days Set to 0 or delete line for singleapp.Interval 4 interval 3 days Set to 0 or delete line for single

Page -171- Page 176 of239
app.Interval 5 interval 3 days Set to 0 or delete line for singleapp.Interval 6 interval 3 days Set to 0 or delete line for singleapp.Interval 7 interval 3 days Set to 0 or delete line for singleapp.Interval 8 interval 3 days Set to 0 or delete line for singleapp.Interval 9 interval 3 days Set to 0 or delete line for singleapp.Record 17: FILTRA 0
IPSCND 1UPTKF 0
Record 18: PLVKRT 0PLDKRT 0FEXTRC 0.5
Flag for Index Res. Run IR PondFlag for runoff calc. RUNOFF none none, monthly or total(average ofentire run)
stored as IDpotato.outChemical: PBOPRZM environment: IDpotatoC.txt modified Satday, 12 October 2002at 17:00:44EXAMS environment: pond298.exv modified Thuday, 29 August 2002at 16:33:30Metfile: w24156.dvf modified Wedday, 3 July 2002 at 09:04:38Water segment concentrations (ppb)
Year Peak 96 hr 21 Day 60 Day 90 Day Yearly1961 12.37 12.21 11.61 11.36 11.09 5.6531962 19.86 19.57 18.65 17.13 16.54 12.271963 24.39 24.07 23.1 21.01 19.66 14.291964 28.08 27.69 26.49 23.58 21.98 16.191965 29.71 29.31 27.63 26.25 25.04 18.881966 26.67 26.35 25.38 23.37 22.07 18.261967 29.26 28.88 27.82 24.98 23.31 17.641968 26.42 26.09 25.11 23.06 22.14 17.841969 30.94 30.54 29.49 26.69 24.86 19.021970 30.62 30.21 29.15 26.62 24.78 19.131971 26.29 25.98 25.02 23.13 21.84 18.381972 25.75 25.44 24.48 22.62 22.23 18.59

Page -172- Page 177 of239
1973 27.23 26.88 25.88 24.38 23.33 19.031974 25.9 25.55 24.55 22.62 21.4 17.811975 25.14 24.83 23.87 21.88 20.64 16.711976 24.03 23.73 22.79 20.91 19.75 16.141977 24.46 24.11 23.11 21.19 19.94 15.781978 22.98 22.69 21.74 19.94 18.79 14.791979 23.24 22.95 22.01 20.37 19.33 15.171980 23.64 23.35 22.54 20.85 19.76 15.591981 24.03 23.73 22.78 20.94 19.7 15.711982 23.56 23.26 22.32 20.62 19.72 15.791983 28.3 27.92 26.9 24.74 23.42 17.781984 27.64 27.4 26.19 25.22 24.61 19.551985 28.7 28.33 27.07 25.04 23.72 19.491986 25.57 25.22 24.24 22.45 21.24 17.551987 23.86 23.54 22.58 21.34 20.45 16.341988 23.26 22.92 21.93 20.01 18.8 15.171989 23.26 22.96 22 20.11 18.92 14.971990 24.43 24.1 23.11 21.07 19.79 14.98
0.1 29.665 29.267 27.801 26.147 24.763 19.12Average of yearly averages:
16.4831
Inputs generated by pe4.pl - 8-August-2003
Data used for this run:Output File: IDpotatoMetfile: w24156.dvfPRZM scenario: IDpotatoC.txtEXAMS environment file: pond298.exvChemical Name: PBODescription Variable Name Value Units CommentsMolecular weight mwt 338.45 g/molHenry's Law Const. henry 1.56e-14 atm-m^3/molVapor Pressure vapr 5e-13 torrSolubility sol 143 mg/LKd Kd mg/LKoc Koc 399 mg/LPhotolysis half-life kdp 5.07 days Half-lifeAerobic Aquatic Metabolism kbacw 133 days HalfifeAnaerobic Aquatic Metabolism kbacs 0 days HalfifeAerobic Soil Metabolism asm 73 days HalfifeHydrolysis: pH 5 0 days Half-life

Page -173- Page 178 of239
Hydrolysis: pH 7 0 days Half-lifeHydrolysis: pH 9 0 days Half-lifeMethod: CAM 2 integer See PRZM manualIncorporation Depth: DEPI 0 cmApplication Rate: TAPP 0.56 kg/haApplication Efficiency: APPEFF 0.95 fractionSpray Drift DRFT 0.05 fraction of application rate applied to pondApplication Date Date 24-05 dd/mm or dd/mmm or dd-mm ordd-mmmInterval 1 interval 3 days Set to 0 or delete line for singleapp.Interval 2 interval 3 days Set to 0 or delete line for singleapp.Interval 3 interval 3 days Set to 0 or delete line for singleapp.Interval 4 interval 3 days Set to 0 or delete line for singleapp.Interval 5 interval 3 days Set to 0 or delete line for singleapp.Interval 6 interval 3 days Set to 0 or delete line for singleapp.Interval 7 interval 3 days Set to 0 or delete line for singleapp.Interval 8 interval 3 days Set to 0 or delete line for singleapp.Interval 9 interval 3 days Set to 0 or delete line for singleapp.Record 17: FILTRA 0
IPSCND 1UPTKF 0
Record 18: PLVKRT 0PLDKRT 0FEXTRC 0.5
Flag for Index Res. Run IR PondFlag for runoff calc. RUNOFF none none, monthly or total(average ofentire run)
stored as IDpotatoG.outChemical: PBOPRZM environment: IDpotatoC.txt modified Satday, 12 October 2002at 17:00:44EXAMS environment: pond298.exv modified Thuday, 29 August 2002at 16:33:30

Page -174- Page 179 of239
Metfile: w24156.dvf modified Wedday, 3 July 2002 at 09:04:38Water segment concentrations (ppb)
Year Peak 96 hr 21 Day 60 Day 90 Day Yearly1961 7.769 7.667 7.327 6.965 6.782 2.4211962 7.682 7.586 7.216 6.6 6.487 5.7511963 9.47 9.354 9.101 8.346 7.805 5.9231964 12.01 11.89 11.35 10.02 9.259 6.6711965 14.61 14.38 13.53 12.77 12.14 8.6021966 9.456 9.37 9.152 8.873 8.764 7.6561967 11.96 11.84 11.47 10.18 9.397 6.9721968 9.106 9.004 8.794 8.181 8.133 7.0491969 13.38 13.26 12.97 11.57 10.69 7.9811970 13.25 13.13 12.97 11.67 10.79 8.2691971 8.582 8.503 8.288 7.825 7.589 7.3071972 10.94 10.78 10.16 9.287 8.868 7.4081973 10.78 10.63 10.06 9.384 9.207 7.9291974 8.402 8.31 8.094 7.639 7.487 6.8551975 7.387 7.313 7.105 6.638 6.338 5.721976 6.424 6.371 6.166 5.822 5.658 5.1411977 7.071 6.978 6.764 6.236 5.891 4.9621978 5.694 5.629 5.432 5.034 4.775 4.0781979 5.58 5.517 5.324 5.029 4.841 4.0331980 5.915 5.833 5.627 5.329 5.113 4.2651981 6.008 5.941 5.743 5.336 5.055 4.4061982 5.68 5.615 5.421 5.179 5.13 4.4941983 10.41 10.28 10.04 9.274 8.972 6.4351984 13.69 13.52 12.73 11.47 10.82 8.2881985 11.62 11.47 10.86 9.825 9.362 8.2331986 7.989 7.902 7.684 7.268 7.035 6.4071987 7.636 7.536 7.156 6.519 6.375 5.4381988 6.19 6.111 5.9 5.472 5.183 4.6891989 6.231 6.16 5.957 5.526 5.239 4.5411990 7.33 7.229 7.019 6.371 5.994 4.483
0.1 13.367 13.247 12.946 11.56 10.78 8.2654Average of yearly averages:
6.08023333333333
Inputs generated by pe4.pl - 8-August-2003
Data used for this run:Output File: IDpotatoG

Page -175- Page 180 of239
Metfile: w24156.dvfPRZM scenario: IDpotatoC.txtEXAMS environment file: pond298.exvChemical Name: PBODescription Variable Name Value Units CommentsMolecular weight mwt 338.45 g/molHenry's Law Const. henry 1.56e-14 atm-m^3/molVapor Pressure vapr 5e-13 torrSolubility sol 143 mg/LKd Kd mg/LKoc Koc 399 mg/LPhotolysis half-life kdp 5.07 days Half-lifeAerobic Aquatic Metabolism kbacw 133 days HalfifeAnaerobic Aquatic Metabolism kbacs 0 days HalfifeAerobic Soil Metabolism asm 73 days HalfifeHydrolysis: pH 5 0 days Half-lifeHydrolysis: pH 7 0 days Half-lifeHydrolysis: pH 9 0 days Half-lifeMethod: CAM 2 integer See PRZM manualIncorporation Depth: DEPI 0 cmApplication Rate: TAPP 0.56 kg/haApplication Efficiency: APPEFF 0.99 fractionSpray Drift DRFT 0.01 fraction of application rate applied to pondApplication Date Date 24-05 dd/mm or dd/mmm or dd-mm ordd-mmmInterval 1 interval 3 days Set to 0 or delete line for singleapp.Interval 2 interval 3 days Set to 0 or delete line for singleapp.Interval 3 interval 3 days Set to 0 or delete line for singleapp.Interval 4 interval 3 days Set to 0 or delete line for singleapp.Interval 5 interval 3 days Set to 0 or delete line for singleapp.Interval 6 interval 3 days Set to 0 or delete line for singleapp.Interval 7 interval 3 days Set to 0 or delete line for singleapp.Interval 8 interval 3 days Set to 0 or delete line for singleapp.Interval 9 interval 3 days Set to 0 or delete line for singleapp.Record 17: FILTRA 0

Page -176- Page 181 of239
IPSCND 1UPTKF 0
Record 18: PLVKRT 0PLDKRT 0FEXTRC 0.5
Flag for Index Res. Run IR PondFlag for runoff calc. RUNOFF none none, monthly or total(average ofentire run)
stored as MEpotato.outChemical: PBOPRZM environment: MEpotatoC.txt modified Satday, 12 October 2002at 17:03:32EXAMS environment: pond298.exv modified Thuday, 29 August 2002at 16:33:30Metfile: w14607.dvf modified Wedday, 3 July 2002 at 09:05:36Water segment concentrations (ppb)
Year Peak 96 hr 21 Day 60 Day 90 Day Yearly1961 23.36 23.08 22.19 21.41 20.86 9.6241962 60.07 59.35 57.42 53.65 51.79 32.731963 54.37 53.95 53.52 52.06 51.39 46.141964 58.57 58.01 56.52 53.46 51.96 47.411965 51.15 50.86 49.62 48.1 47.43 45.061966 44.27 43.86 43 41.22 40.39 38.591967 58.06 57.41 55.12 52.56 52.46 42.791968 63.25 62.68 61.45 58.82 56.67 49.741969 65.04 64.56 62.75 60.1 59.51 53.171970 64.04 63.61 62.02 59.34 58.09 53.671971 56.61 56.12 55.04 53.83 53.34 49.631972 59.89 59.42 57.62 55.71 54.7 47.271973 75.08 74.38 71.67 66.93 64.31 53.791974 57.32 56.83 55.88 55.16 54.69 51.491975 53.96 53.44 52.06 50.02 48.79 45.041976 75.08 74.33 71.58 68.96 67.61 52.331977 75.07 74.32 73.04 69.97 68.65 60.931978 83.46 82.65 80.54 75.54 73.04 63.061979 65.52 65.07 64.03 62.49 61.9 59.111980 65.62 65.03 62.89 59.93 58.31 53.91981 101 99.35 94.49 87.23 84.06 61.71982 89.08 88.29 86.75 84.52 82.89 73.281983 92 91.21 88.89 86.88 84.37 74.71984 88.88 88.15 85.36 81.25 78.62 71.42

Page -177- Page 182 of239
1985 72.47 71.81 69.87 66.63 64.68 61.291986 64.14 63.61 61.85 60.73 59.7 55.11987 59.7 59.2 57.92 56.57 55.2 51.641988 52.09 51.59 50.6 49.8 49.34 46.711989 62.54 62.09 59.59 56.02 54.07 45.871990 69.5 68.84 67.05 63.4 62.58 53.69
0.1 89.06 88.276 86.611 84.193 82.463 70.584Average of yearly averages:
51.6958
Inputs generated by pe4.pl - 8-August-2003
Data used for this run:Output File: MEpotatoMetfile: w14607.dvfPRZM scenario: MEpotatoC.txtEXAMS environment file: pond298.exvChemical Name: PBODescription Variable Name Value Units CommentsMolecular weight mwt 338.45 g/molHenry's Law Const. henry 1.56e-14 atm-m^3/molVapor Pressure vapr 5e-13 torrSolubility sol 143 mg/LKd Kd mg/LKoc Koc 399 mg/LPhotolysis half-life kdp 5.07 days Half-lifeAerobic Aquatic Metabolism kbacw 133 days HalfifeAnaerobic Aquatic Metabolism kbacs 0 days HalfifeAerobic Soil Metabolism asm 73 days HalfifeHydrolysis: pH 5 0 days Half-lifeHydrolysis: pH 7 0 days Half-lifeHydrolysis: pH 9 0 days Half-lifeMethod: CAM 2 integer See PRZM manualIncorporation Depth: DEPI 0 cmApplication Rate: TAPP 0.56 kg/haApplication Efficiency: APPEFF 0.95 fractionSpray Drift DRFT 0.05 fraction of application rate applied to pondApplication Date Date 13-06 dd/mm or dd/mmm or dd-mm ordd-mmmInterval 1 interval 3 days Set to 0 or delete line for singleapp.Interval 2 interval 3 days Set to 0 or delete line for single

Page -178- Page 183 of239
app.Interval 3 interval 3 days Set to 0 or delete line for singleapp.Interval 4 interval 3 days Set to 0 or delete line for singleapp.Interval 5 interval 3 days Set to 0 or delete line for singleapp.Interval 6 interval 3 days Set to 0 or delete line for singleapp.Interval 7 interval 3 days Set to 0 or delete line for singleapp.Interval 8 interval 3 days Set to 0 or delete line for singleapp.Interval 9 interval 3 days Set to 0 or delete line for singleapp.Record 17: FILTRA 0
IPSCND 1UPTKF 0
Record 18: PLVKRT 0PLDKRT 0FEXTRC 0.5
Flag for Index Res. Run IR PondFlag for runoff calc. RUNOFF none none, monthly or total(average ofentire run)
stored as MEpotatoG.outChemical: PBOPRZM environment: MEpotatoC.txt modified Satday, 12 October 2002at 17:03:32EXAMS environment: pond298.exv modified Thuday, 29 August 2002at 16:33:30Metfile: w14607.dvf modified Wedday, 3 July 2002 at 09:05:36Water segment concentrations (ppb)
Year Peak 96 hr 21 Day 60 Day 90 Day Yearly1961 18.26 18.01 17.24 16.18 15.79 6.5271962 49.26 48.68 46.86 44.2 42.9 26.291963 43.72 43.44 42.99 42.05 41.48 37.511964 42.61 42.37 41.29 39.58 38.83 37.191965 38.05 37.99 37.74 37.21 36.84 33.611966 30.51 30.48 30.33 30.02 29.65 26.641967 41.81 41.49 40.66 39.58 39.08 30.65

Page -179- Page 184 of239
1968 47.7 47.34 46.38 44.2 42.71 37.61969 51.91 51.48 49.91 47.57 46.61 40.91970 52.03 51.63 50.18 47.75 46.6 41.51971 43.73 43.66 43.38 42.8 42.4 37.31972 46.15 45.75 44.22 42.5 41.75 34.581973 57.35 56.88 54.65 51.37 49.57 41.291974 44.6 44.54 44.26 43.69 43.32 38.851975 37.29 36.96 35.81 34.25 33.78 32.181976 60.47 59.85 57.58 54.85 53.9 39.891977 59.93 59.31 58.65 56.51 55.65 48.761978 65.86 65.44 64.05 60.59 58.9 51.021979 52.37 52.04 51.78 51.26 50.8 47.051980 48.62 48.22 46.84 44.43 43.53 41.651981 87.84 86.52 82.01 75.25 72.32 49.631982 73.96 73.33 71.8 70.76 69.76 61.61983 77.64 76.99 74.43 72.79 71.03 63.161984 72.17 71.65 69.52 66.07 64.24 59.851985 55.21 54.77 54.54 54.04 53.66 49.291986 49.74 49.31 47.91 46.73 45.91 42.581987 42.54 42.23 41.67 41.17 40.83 38.81988 37.22 37.18 36.98 36.62 36.32 33.751989 47.63 47.25 45.22 42.43 40.87 33.051990 53.33 52.85 51.51 50.18 49.7 41.27
0.1 73.781 73.162 71.572 70.291 69.208 58.967Average of yearly averages:
40.1322333333333
Inputs generated by pe4.pl - 8-August-2003
Data used for this run:Output File: MEpotatoGMetfile: w14607.dvfPRZM scenario: MEpotatoC.txtEXAMS environment file: pond298.exvChemical Name: PBODescription Variable Name Value Units CommentsMolecular weight mwt 338.45 g/molHenry's Law Const. henry 1.56e-14 atm-m^3/molVapor Pressure vapr 5e-13 torrSolubility sol 143 mg/LKd Kd mg/L

Page -180- Page 185 of239
Koc Koc 399 mg/LPhotolysis half-life kdp 5.07 days Half-lifeAerobic Aquatic Metabolism kbacw 133 days HalfifeAnaerobic Aquatic Metabolism kbacs 0 days HalfifeAerobic Soil Metabolism asm 73 days HalfifeHydrolysis: pH 5 0 days Half-lifeHydrolysis: pH 7 0 days Half-lifeHydrolysis: pH 9 0 days Half-lifeMethod: CAM 2 integer See PRZM manualIncorporation Depth: DEPI 0 cmApplication Rate: TAPP 0.56 kg/haApplication Efficiency: APPEFF 0.99 fractionSpray Drift DRFT 0.01 fraction of application rate applied to pondApplication Date Date 13-06 dd/mm or dd/mmm or dd-mm ordd-mmmInterval 1 interval 3 days Set to 0 or delete line for singleapp.Interval 2 interval 3 days Set to 0 or delete line for singleapp.Interval 3 interval 3 days Set to 0 or delete line for singleapp.Interval 4 interval 3 days Set to 0 or delete line for singleapp.Interval 5 interval 3 days Set to 0 or delete line for singleapp.Interval 6 interval 3 days Set to 0 or delete line for singleapp.Interval 7 interval 3 days Set to 0 or delete line for singleapp.Interval 8 interval 3 days Set to 0 or delete line for singleapp.Interval 9 interval 3 days Set to 0 or delete line for singleapp.Record 17: FILTRA 0
IPSCND 1UPTKF 0
Record 18: PLVKRT 0PLDKRT 0FEXTRC 0.5
Flag for Index Res. Run IR PondFlag for runoff calc. RUNOFF none none, monthly or total(average ofentire run)

Page -181- Page 186 of239
stored as MIbeans.outChemical: PBOPRZM environment: MIbeansC.txt modified Monday, 10 May 2004 at06:24:24EXAMS environment: pond298.exv modified Thuday, 29 August 2002at 16:33:30Metfile: w14607.dvf modified Wedday, 3 July 2002 at 09:05:36Water segment concentrations (ppb)
Year Peak 96 hr 21 Day 60 Day 90 Day Yearly1961 37.42 36.89 35.87 35.04 33.82 14.991962 85.42 84.26 80.78 77.14 74.81 47.761963 76.21 75.56 74.92 72.57 71.15 63.811964 70.86 70.23 69.07 67.75 66.76 62.741965 71.36 70.94 68.76 67.58 66.32 60.831966 62.05 61.48 60.08 57.38 56.67 54.221967 75.59 75 73.47 72.03 71.93 59.081968 97.34 96.39 93.93 88.51 84.95 70.221969 95.33 94.59 91.8 88.29 87.23 76.651970 94.6 93.98 91.68 87.95 86.22 78.431971 81.33 81.22 80.75 79.75 79.03 73.291972 87.39 86.67 83.94 80.97 79.29 68.911973 91.01 90.32 88.57 84.43 81.82 72.351974 72.3 72.2 71.78 70.88 70.25 66.291975 78.2 77.33 74.58 70.73 68.95 61.071976 112 111 106 102 99.27 74.321977 105 104 102 98.13 95.87 84.831978 106 105 103 98.79 96.19 84.521979 93.95 93.24 91.43 87.14 85.56 80.061980 92.77 91.86 88.98 83.68 81.72 75.341981 149 147 139 128 123 87.681982 137 136 133 129 126 1071983 134 133 128 125 122 1081984 117 116 112 105 103 97.161985 94.98 94.11 92.75 88.43 85.48 811986 93.45 92.58 89.85 88.26 86.48 75.521987 83.65 82.89 80.23 76.62 76.08 72.591988 75.95 75.29 73.42 72.29 70.9 66.481989 94.92 94.21 90.25 85.08 82 67.471990 97.64 96.57 93.97 89.55 88.22 75.81
0.1 132.3 131.3 126.4 123 120.1 96.212Average of yearly averages:

Page -182- Page 187 of239
72.2806666666666
Inputs generated by pe4.pl - 8-August-2003
Data used for this run:Output File: MIbeansMetfile: w14607.dvfPRZM scenario: MIbeansC.txtEXAMS environment file: pond298.exvChemical Name: PBODescription Variable Name Value Units CommentsMolecular weight mwt 338.45 g/molHenry's Law Const. henry 1.56e-14 atm-m^3/molVapor Pressure vapr 5e-13 torrSolubility sol 143 mg/LKd Kd mg/LKoc Koc 399 mg/LPhotolysis half-life kdp 5.07 days Half-lifeAerobic Aquatic Metabolism kbacw 133 days HalfifeAnaerobic Aquatic Metabolism kbacs 0 days HalfifeAerobic Soil Metabolism asm 73 days HalfifeHydrolysis: pH 5 0 days Half-lifeHydrolysis: pH 7 0 days Half-lifeHydrolysis: pH 9 0 days Half-lifeMethod: CAM 2 integer See PRZM manualIncorporation Depth: DEPI 0 cmApplication Rate: TAPP 0.56 kg/haApplication Efficiency: APPEFF 0.95 fractionSpray Drift DRFT 0.05 fraction of application rate applied to pondApplication Date Date 19-06 dd/mm or dd/mmm or dd-mm ordd-mmmInterval 1 interval 3 days Set to 0 or delete line for singleapp.Interval 2 interval 3 days Set to 0 or delete line for singleapp.Interval 3 interval 3 days Set to 0 or delete line for singleapp.Interval 4 interval 3 days Set to 0 or delete line for singleapp.Interval 5 interval 3 days Set to 0 or delete line for singleapp.Interval 6 interval 3 days Set to 0 or delete line for singleapp.Interval 7 interval 3 days Set to 0 or delete line for single

Page -183- Page 188 of239
app.Interval 8 interval 3 days Set to 0 or delete line for singleapp.Interval 9 interval 3 days Set to 0 or delete line for singleapp.Record 17: FILTRA 0
IPSCND 1UPTKF 0
Record 18: PLVKRT 0PLDKRT 0FEXTRC 0.5
Flag for Index Res. Run IR PondFlag for runoff calc. RUNOFF none none, monthly or total(average ofentire run)
stored as MIbeansG.outChemical: PBOPRZM environment: MIbeansC.txt modified Monday, 10 May 2004 at06:24:24EXAMS environment: pond298.exv modified Thuday, 29 August 2002at 16:33:30Metfile: w14607.dvf modified Wedday, 3 July 2002 at 09:05:36Water segment concentrations (ppb)
Year Peak 96 hr 21 Day 60 Day 90 Day Yearly1961 32.27 31.86 30.58 30.14 29.13 12.191962 75.11 74.1 71.2 68.29 66.56 41.971963 65.88 65.41 64.97 63.16 61.88 55.91964 56.79 56.71 56.4 55.72 55.21 53.121965 55.93 55.54 54.38 53.53 53.07 49.981966 47.82 47.77 47.54 47.03 46.44 42.871967 63.22 62.71 61.33 60.13 59.06 47.541968 82.75 81.93 79.72 74.7 71.78 58.861969 83.13 82.45 79.88 76.02 74.85 65.31970 83.58 82.99 80.81 77.16 75.58 67.211971 71.06 70.96 70.53 69.62 68.97 61.871972 74.45 73.79 71.29 68.48 67.07 57.051973 75.86 75.14 72.41 69.43 67.6 60.541974 61.11 61.02 60.65 59.87 59.33 54.181975 61.94 61.26 59.13 56 54.68 48.781976 98.77 97.59 93.39 88.8 86.69 62.711977 90.68 89.78 88.86 85.48 83.68 73.58

Page -184- Page 189 of239
1978 89.91 89.02 87.73 84.51 82.71 73.291979 81.64 80.99 79.47 75.62 73.75 68.791980 76.23 75.52 73.45 69.54 68.09 63.921981 137 135 128 118 113 76.611982 124 122 120 116 114 96.771983 121 120 115 112 109 97.81984 101 100 96.98 94.57 93.78 86.61985 79.21 78.54 76.91 75.35 74.8 69.741986 79.87 79.11 76.62 74.9 73.42 63.791987 66.87 66.3 65.24 64.44 63.87 60.551988 61.88 61.33 59.85 58.42 57.22 54.281989 80.91 80.25 76.77 72.37 69.67 55.481990 82.05 81.17 79.1 75.95 75.32 64.24
0.1 119 118 113.198 110.257 107.478 85.601Average of yearly averages: 61.517
Inputs generated by pe4.pl - 8-August-2003
Data used for this run:Output File: MIbeansGMetfile: w14607.dvfPRZM scenario: MIbeansC.txtEXAMS environment file: pond298.exvChemical Name: PBODescription Variable Name Value Units CommentsMolecular weight mwt 338.45 g/molHenry's Law Const. henry 1.56e-14 atm-m^3/molVapor Pressure vapr 5e-13 torrSolubility sol 143 mg/LKd Kd mg/LKoc Koc 399 mg/LPhotolysis half-life kdp 5.07 days Half-lifeAerobic Aquatic Metabolism kbacw 133 days HalfifeAnaerobic Aquatic Metabolism kbacs 0 days HalfifeAerobic Soil Metabolism asm 73 days HalfifeHydrolysis: pH 5 0 days Half-lifeHydrolysis: pH 7 0 days Half-lifeHydrolysis: pH 9 0 days Half-lifeMethod: CAM 2 integer See PRZM manualIncorporation Depth: DEPI 0 cmApplication Rate: TAPP 0.56 kg/haApplication Efficiency: APPEFF 0.99 fraction

Page -185- Page 190 of239
Spray Drift DRFT 0.01 fraction of application rate applied to pondApplication Date Date 19-06 dd/mm or dd/mmm or dd-mm ordd-mmmInterval 1 interval 3 days Set to 0 or delete line for singleapp.Interval 2 interval 3 days Set to 0 or delete line for singleapp.Interval 3 interval 3 days Set to 0 or delete line for singleapp.Interval 4 interval 3 days Set to 0 or delete line for singleapp.Interval 5 interval 3 days Set to 0 or delete line for singleapp.Interval 6 interval 3 days Set to 0 or delete line for singleapp.Interval 7 interval 3 days Set to 0 or delete line for singleapp.Interval 8 interval 3 days Set to 0 or delete line for singleapp.Interval 9 interval 3 days Set to 0 or delete line for singleapp.Record 17: FILTRA 0
IPSCND 1UPTKF 0
Record 18: PLVKRT 0PLDKRT 0FEXTRC 0.5
Flag for Index Res. Run IR PondFlag for runoff calc. RUNOFF none none, monthly or total(average ofentire run)
stored as MNsugarbeet.outChemical: PBOPRZM environment: MNsugarbeetC.txt modified Satday, 12 October 2002at 17:05:10EXAMS environment: pond298.exv modified Thuday, 29 August 2002at 16:33:30Metfile: w14914.dvf modified Wedday, 3 July 2002 at 09:05:52Water segment concentrations (ppb)
Year Peak 96 hr 21 Day 60 Day 90 Day Yearly1961 15.26 15.09 14.55 13.57 13.3 7.137

Page -186- Page 191 of239
1962 44.59 43.88 41.44 37.42 35 21.851963 42.76 42.14 39.83 36.19 34.29 28.391964 77.25 76.23 71.71 62.14 58.8 40.411965 48.53 48.07 47.3 46.59 45.6 41.641966 42.61 42.39 41.39 40.04 40.01 36.441967 40.84 40.43 39.35 37.01 35.32 31.191968 34.91 34.5 33.97 32.36 30.9 26.341969 63.5 62.43 58.72 52.93 49.51 34.031970 52.63 51.96 50.33 45.73 43.37 39.731971 44.49 44.02 43.56 41.94 40.38 37.711972 39.63 39.21 38 37.02 36.52 33.331973 36.1 35.7 34.71 34.16 33.49 30.361974 63.85 62.95 59.57 56.25 53.91 38.381975 114 113 105 92.75 86.78 59.851976 63 62.94 62.66 62 61.48 52.141977 82.52 81.09 75.77 67.44 63.65 48.71978 77.65 76.94 74.56 68.74 65.52 53.091979 65.12 64.29 61.61 59.8 57.8 50.411980 50.22 49.73 48.66 47 46.23 44.541981 47.13 46.58 44.53 43.42 42.14 38.211982 40.66 40.23 38.41 37.41 35.98 32.951983 50.96 50.2 48.11 45.12 42.97 35.221984 59.41 58.76 58.13 52.84 49.09 39.521985 54.11 53.42 51.64 48.37 47.4 41.621986 59.38 58.74 57.06 54.08 51.73 42.31987 47.97 47.33 45.01 42.38 41.85 38.461988 38.83 38.32 37.18 34.67 33.72 32.91989 39.27 38.92 37.84 35.71 34.92 32.151990 56.45 55.75 53.39 47.67 44.7 35.17
0.1 77.61 76.869 74.275 66.91 63.433 51.967Average of yearly averages:
37.4722333333333
Inputs generated by pe4.pl - 8-August-2003
Data used for this run:Output File: MNsugarbeetMetfile: w14914.dvfPRZM scenario: MNsugarbeetC.txtEXAMS environment file: pond298.exvChemical Name: PBODescription Variable Name Value Units Comments

Page -187- Page 192 of239
Molecular weight mwt 338.45 g/molHenry's Law Const. henry 1.56e-14 atm-m^3/molVapor Pressure vapr 5e-13 torrSolubility sol 143 mg/LKd Kd mg/LKoc Koc 399 mg/LPhotolysis half-life kdp 5.07 days Half-lifeAerobic Aquatic Metabolism kbacw 133 days HalfifeAnaerobic Aquatic Metabolism kbacs 0 days HalfifeAerobic Soil Metabolism asm 73 days HalfifeHydrolysis: pH 5 0 days Half-lifeHydrolysis: pH 7 0 days Half-lifeHydrolysis: pH 9 0 days Half-lifeMethod: CAM 2 integer See PRZM manualIncorporation Depth: DEPI 0 cmApplication Rate: TAPP 0.56 kg/haApplication Efficiency: APPEFF 0.95 fractionSpray Drift DRFT 0.05 fraction of application rate applied to pondApplication Date Date 25-05 dd/mm or dd/mmm or dd-mm ordd-mmmInterval 1 interval 3 days Set to 0 or delete line for singleapp.Interval 2 interval 3 days Set to 0 or delete line for singleapp.Interval 3 interval 3 days Set to 0 or delete line for singleapp.Interval 4 interval 3 days Set to 0 or delete line for singleapp.Interval 5 interval 3 days Set to 0 or delete line for singleapp.Interval 6 interval 3 days Set to 0 or delete line for singleapp.Interval 7 interval 3 days Set to 0 or delete line for singleapp.Interval 8 interval 3 days Set to 0 or delete line for singleapp.Interval 9 interval 3 days Set to 0 or delete line for singleapp.Record 17: FILTRA 0
IPSCND 1UPTKF 0
Record 18: PLVKRT 0PLDKRT 0FEXTRC 0.5
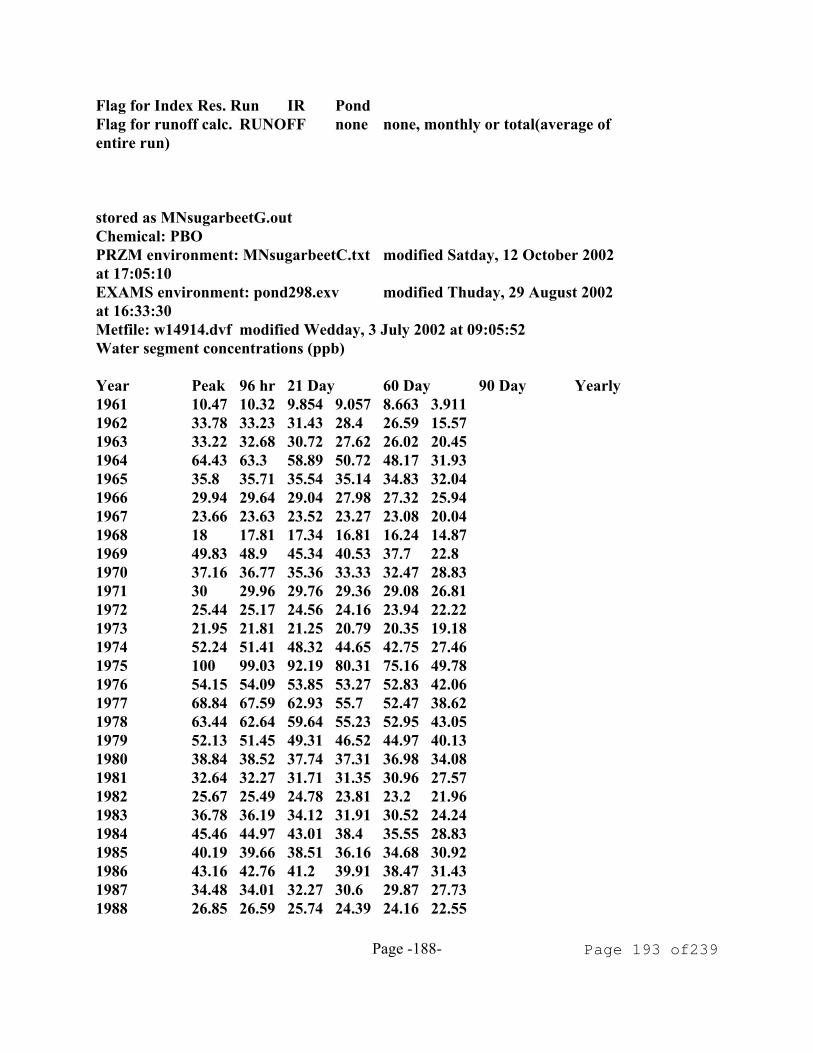
Page -188- Page 193 of239
Flag for Index Res. Run IR PondFlag for runoff calc. RUNOFF none none, monthly or total(average ofentire run)
stored as MNsugarbeetG.outChemical: PBOPRZM environment: MNsugarbeetC.txt modified Satday, 12 October 2002at 17:05:10EXAMS environment: pond298.exv modified Thuday, 29 August 2002at 16:33:30Metfile: w14914.dvf modified Wedday, 3 July 2002 at 09:05:52Water segment concentrations (ppb)
Year Peak 96 hr 21 Day 60 Day 90 Day Yearly1961 10.47 10.32 9.854 9.057 8.663 3.9111962 33.78 33.23 31.43 28.4 26.59 15.571963 33.22 32.68 30.72 27.62 26.02 20.451964 64.43 63.3 58.89 50.72 48.17 31.931965 35.8 35.71 35.54 35.14 34.83 32.041966 29.94 29.64 29.04 27.98 27.32 25.941967 23.66 23.63 23.52 23.27 23.08 20.041968 18 17.81 17.34 16.81 16.24 14.871969 49.83 48.9 45.34 40.53 37.7 22.81970 37.16 36.77 35.36 33.33 32.47 28.831971 30 29.96 29.76 29.36 29.08 26.811972 25.44 25.17 24.56 24.16 23.94 22.221973 21.95 21.81 21.25 20.79 20.35 19.181974 52.24 51.41 48.32 44.65 42.75 27.461975 100 99.03 92.19 80.31 75.16 49.781976 54.15 54.09 53.85 53.27 52.83 42.061977 68.84 67.59 62.93 55.7 52.47 38.621978 63.44 62.64 59.64 55.23 52.95 43.051979 52.13 51.45 49.31 46.52 44.97 40.131980 38.84 38.52 37.74 37.31 36.98 34.081981 32.64 32.27 31.71 31.35 30.96 27.571982 25.67 25.49 24.78 23.81 23.2 21.961983 36.78 36.19 34.12 31.91 30.52 24.241984 45.46 44.97 43.01 38.4 35.55 28.831985 40.19 39.66 38.51 36.16 34.68 30.921986 43.16 42.76 41.2 39.91 38.47 31.431987 34.48 34.01 32.27 30.6 29.87 27.731988 26.85 26.59 25.74 24.39 24.16 22.55

Page -189- Page 194 of239
1989 28.83 28.52 27.56 25.72 24.84 21.871990 40.44 39.98 38.08 33.93 31.57 24.83
0.1 64.331 63.234 59.565 55.034 52.794 41.867Average of yearly averages:
27.3900333333333
Inputs generated by pe4.pl - 8-August-2003
Data used for this run:Output File: MNsugarbeetGMetfile: w14914.dvfPRZM scenario: MNsugarbeetC.txtEXAMS environment file: pond298.exvChemical Name: PBODescription Variable Name Value Units CommentsMolecular weight mwt 338.45 g/molHenry's Law Const. henry 1.56e-14 atm-m^3/molVapor Pressure vapr 5e-13 torrSolubility sol 143 mg/LKd Kd mg/LKoc Koc 399 mg/LPhotolysis half-life kdp 5.07 days Half-lifeAerobic Aquatic Metabolism kbacw 133 days HalfifeAnaerobic Aquatic Metabolism kbacs 0 days HalfifeAerobic Soil Metabolism asm 73 days HalfifeHydrolysis: pH 5 0 days Half-lifeHydrolysis: pH 7 0 days Half-lifeHydrolysis: pH 9 0 days Half-lifeMethod: CAM 2 integer See PRZM manualIncorporation Depth: DEPI 0 cmApplication Rate: TAPP 0.56 kg/haApplication Efficiency: APPEFF 0.99 fractionSpray Drift DRFT 0.01 fraction of application rate applied to pondApplication Date Date 25-05 dd/mm or dd/mmm or dd-mm ordd-mmmInterval 1 interval 3 days Set to 0 or delete line for singleapp.Interval 2 interval 3 days Set to 0 or delete line for singleapp.Interval 3 interval 3 days Set to 0 or delete line for singleapp.Interval 4 interval 3 days Set to 0 or delete line for single

Page -190- Page 195 of239
app.Interval 5 interval 3 days Set to 0 or delete line for singleapp.Interval 6 interval 3 days Set to 0 or delete line for singleapp.Interval 7 interval 3 days Set to 0 or delete line for singleapp.Interval 8 interval 3 days Set to 0 or delete line for singleapp.Interval 9 interval 3 days Set to 0 or delete line for singleapp.Record 17: FILTRA 0
IPSCND 1UPTKF 0
Record 18: PLVKRT 0PLDKRT 0FEXTRC 0.5
Flag for Index Res. Run IR PondFlag for runoff calc. RUNOFF none none, monthly or total(average ofentire run)
stored as MScotton.outChemical: PBOPRZM environment: MScottonC.txt modified Wedday, 22 January2003 at 11:52:38EXAMS environment: pond298.exv modified Thuday, 29 August 2002at 16:33:30Metfile: w03940.dvf modified Wedday, 3 July 2002 at 09:05:46Water segment concentrations (ppb)
Year Peak 96 hr 21 Day 60 Day 90 Day Yearly1961 121 119 113 105 98.87 43.031962 70.08 69.85 68.89 66.42 64.43 50.031963 84.93 83.68 78.13 66.47 60.36 40.471964 100 98.35 94.02 89.27 86.89 57.631965 77.64 76.39 71.85 67.4 65.75 57.151966 62.55 61.82 58.22 52.38 49.49 43.91967 87.01 85.67 83.08 78.93 77.66 52.621968 64.42 64.22 63.43 61.63 60.12 47.211969 39.62 38.98 36.59 34.09 33.21 29.621970 71.65 70.72 68.99 65.73 63.75 37.561971 60.74 59.71 57.11 52.18 50.58 45.491972 38.32 38.19 37.64 36.44 35.44 29.16
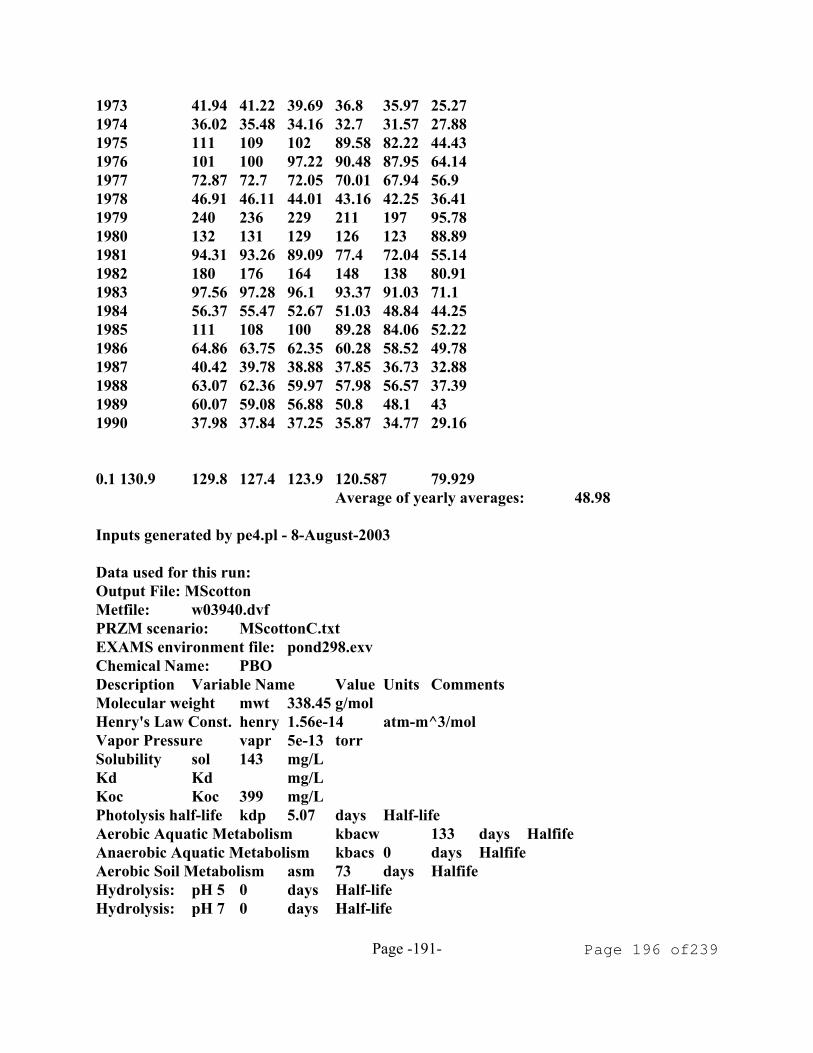
Page -191- Page 196 of239
1973 41.94 41.22 39.69 36.8 35.97 25.271974 36.02 35.48 34.16 32.7 31.57 27.881975 111 109 102 89.58 82.22 44.431976 101 100 97.22 90.48 87.95 64.141977 72.87 72.7 72.05 70.01 67.94 56.91978 46.91 46.11 44.01 43.16 42.25 36.411979 240 236 229 211 197 95.781980 132 131 129 126 123 88.891981 94.31 93.26 89.09 77.4 72.04 55.141982 180 176 164 148 138 80.911983 97.56 97.28 96.1 93.37 91.03 71.11984 56.37 55.47 52.67 51.03 48.84 44.251985 111 108 100 89.28 84.06 52.221986 64.86 63.75 62.35 60.28 58.52 49.781987 40.42 39.78 38.88 37.85 36.73 32.881988 63.07 62.36 59.97 57.98 56.57 37.391989 60.07 59.08 56.88 50.8 48.1 431990 37.98 37.84 37.25 35.87 34.77 29.16
0.1 130.9 129.8 127.4 123.9 120.587 79.929Average of yearly averages: 48.98
Inputs generated by pe4.pl - 8-August-2003
Data used for this run:Output File: MScottonMetfile: w03940.dvfPRZM scenario: MScottonC.txtEXAMS environment file: pond298.exvChemical Name: PBODescription Variable Name Value Units CommentsMolecular weight mwt 338.45 g/molHenry's Law Const. henry 1.56e-14 atm-m^3/molVapor Pressure vapr 5e-13 torrSolubility sol 143 mg/LKd Kd mg/LKoc Koc 399 mg/LPhotolysis half-life kdp 5.07 days Half-lifeAerobic Aquatic Metabolism kbacw 133 days HalfifeAnaerobic Aquatic Metabolism kbacs 0 days HalfifeAerobic Soil Metabolism asm 73 days HalfifeHydrolysis: pH 5 0 days Half-lifeHydrolysis: pH 7 0 days Half-life

Page -192- Page 197 of239
Hydrolysis: pH 9 0 days Half-lifeMethod: CAM 2 integer See PRZM manualIncorporation Depth: DEPI 0 cmApplication Rate: TAPP 0.56 kg/haApplication Efficiency: APPEFF 0.95 fractionSpray Drift DRFT 0.05 fraction of application rate applied to pondApplication Date Date 15-06 dd/mm or dd/mmm or dd-mm ordd-mmmInterval 1 interval 3 days Set to 0 or delete line for singleapp.Interval 2 interval 3 days Set to 0 or delete line for singleapp.Interval 3 interval 3 days Set to 0 or delete line for singleapp.Interval 4 interval 3 days Set to 0 or delete line for singleapp.Interval 5 interval 3 days Set to 0 or delete line for singleapp.Interval 6 interval 3 days Set to 0 or delete line for singleapp.Interval 7 interval 3 days Set to 0 or delete line for singleapp.Interval 8 interval 3 days Set to 0 or delete line for singleapp.Interval 9 interval 3 days Set to 0 or delete line for singleapp.Record 17: FILTRA 0
IPSCND 1UPTKF 0
Record 18: PLVKRT 0PLDKRT 0FEXTRC 0.5
Flag for Index Res. Run IR PondFlag for runoff calc. RUNOFF none none, monthly or total(average ofentire run)
stored as MScottonG.outChemical: PBOPRZM environment: MScottonC.txt modified Wedday, 22 January2003 at 11:52:38EXAMS environment: pond298.exv modified Thuday, 29 August 2002at 16:33:30Metfile: w03940.dvf modified Wedday, 3 July 2002 at 09:05:46

Page -193- Page 198 of239
Water segment concentrations (ppb)
Year Peak 96 hr 21 Day 60 Day 90 Day Yearly1961 118 116 110 102 96.41 41.861962 69.11 68.87 67.92 65.46 63.44 46.731963 76.98 75.53 69.63 59.16 53.72 35.971964 95.03 93.22 88.57 82.88 82.23 53.51965 72.63 71.41 67.03 64.59 62.99 52.751966 54.74 54.14 50.97 45.85 43.73 38.661967 80.9 79.63 77.36 72.09 70.89 47.511968 60.36 60.17 59.42 57.69 56.25 41.81969 31.49 30.96 29 27.78 27.15 23.681970 67.6 66.68 64.9 61.52 59.35 32.091971 51.75 50.89 49.41 47.47 46.08 40.441972 33.88 33.76 33.26 32.18 31.29 23.631973 35.73 35.06 33.44 31.05 30.52 19.61974 28.68 28.22 27.61 26.33 25.37 22.281975 104 102 95.15 83.77 76.77 39.291976 97.08 95.95 92.8 86.36 83.08 59.751977 69.41 69.25 68.62 66.65 64.67 52.261978 40.09 40.03 39.74 38.96 38.14 31.021979 237 233 226 209 195 92.781980 131 130 129 125 122 85.741981 87.99 86.86 80.95 69.98 65.32 50.741982 176 173 161 144 135 77.551983 95.64 95.36 94.18 91.48 89.18 67.21984 48.36 47.94 47.45 46.15 44.93 39.121985 105 103 95.14 84.71 79.73 47.461986 59.94 59.72 58.85 56.86 55.19 45.031987 34.55 34.46 34.09 33.16 32.32 27.431988 58.43 57.72 55.4 53.63 52.02 32.121989 49.15 48.39 46.77 44.09 42.77 37.881990 33.23 33.1 32.58 31.35 30.38 23.48
0.1 129.7 128.6 127.1 122.7 119.441 76.515Average of yearly averages:
44.3116666666667
Inputs generated by pe4.pl - 8-August-2003
Data used for this run:Output File: MScottonGMetfile: w03940.dvf
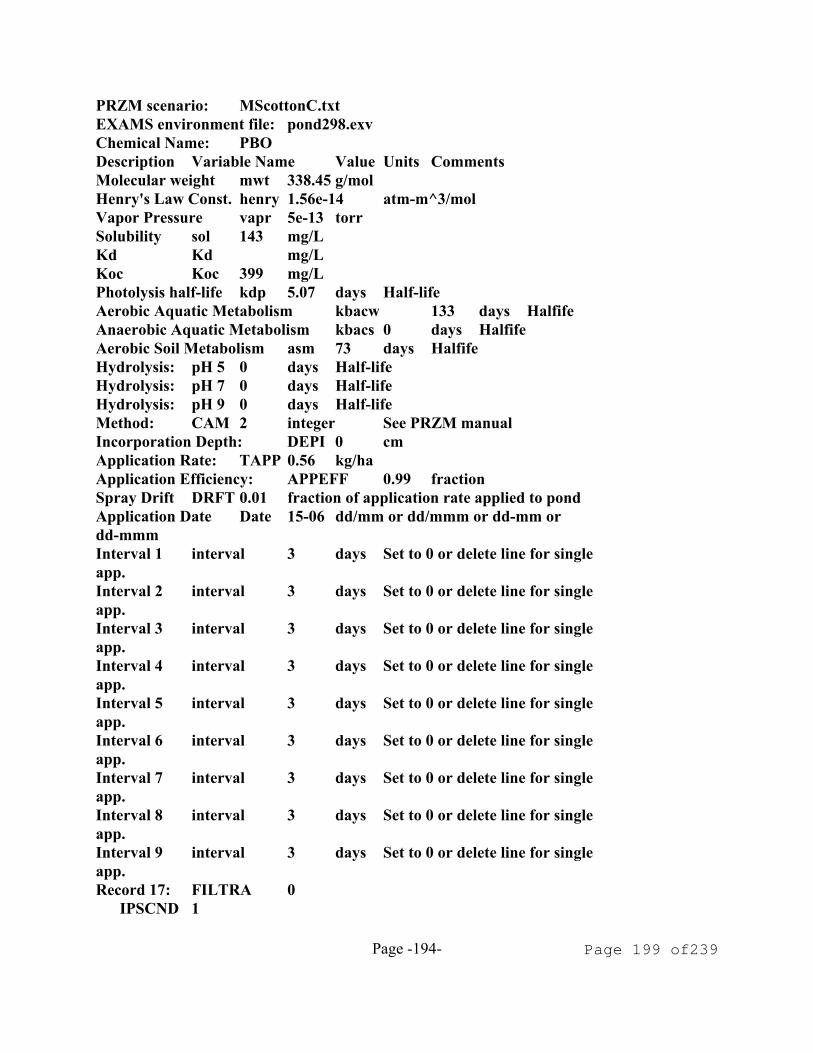
Page -194- Page 199 of239
PRZM scenario: MScottonC.txtEXAMS environment file: pond298.exvChemical Name: PBODescription Variable Name Value Units CommentsMolecular weight mwt 338.45 g/molHenry's Law Const. henry 1.56e-14 atm-m^3/molVapor Pressure vapr 5e-13 torrSolubility sol 143 mg/LKd Kd mg/LKoc Koc 399 mg/LPhotolysis half-life kdp 5.07 days Half-lifeAerobic Aquatic Metabolism kbacw 133 days HalfifeAnaerobic Aquatic Metabolism kbacs 0 days HalfifeAerobic Soil Metabolism asm 73 days HalfifeHydrolysis: pH 5 0 days Half-lifeHydrolysis: pH 7 0 days Half-lifeHydrolysis: pH 9 0 days Half-lifeMethod: CAM 2 integer See PRZM manualIncorporation Depth: DEPI 0 cmApplication Rate: TAPP 0.56 kg/haApplication Efficiency: APPEFF 0.99 fractionSpray Drift DRFT 0.01 fraction of application rate applied to pondApplication Date Date 15-06 dd/mm or dd/mmm or dd-mm ordd-mmmInterval 1 interval 3 days Set to 0 or delete line for singleapp.Interval 2 interval 3 days Set to 0 or delete line for singleapp.Interval 3 interval 3 days Set to 0 or delete line for singleapp.Interval 4 interval 3 days Set to 0 or delete line for singleapp.Interval 5 interval 3 days Set to 0 or delete line for singleapp.Interval 6 interval 3 days Set to 0 or delete line for singleapp.Interval 7 interval 3 days Set to 0 or delete line for singleapp.Interval 8 interval 3 days Set to 0 or delete line for singleapp.Interval 9 interval 3 days Set to 0 or delete line for singleapp.Record 17: FILTRA 0
IPSCND 1

Page -195- Page 200 of239
UPTKF 0Record 18: PLVKRT 0
PLDKRT 0FEXTRC 0.5
Flag for Index Res. Run IR PondFlag for runoff calc. RUNOFF none none, monthly or total(average ofentire run)
stored as NCcotton.outChemical: PBOPRZM environment: NCcottonC.txt modified Satday, 12 October 2002at 17:12:02EXAMS environment: pond298.exv modified Thuday, 29 August 2002at 16:33:30Metfile: w13722.dvf modified Wedday, 3 July 2002 at 09:05:50Water segment concentrations (ppb)
Year Peak 96 hr 21 Day 60 Day 90 Day Yearly1961 32.91 32.43 30.99 27.77 26.12 11.981962 76.41 75.06 72.96 66.11 62.59 38.311963 50.51 50.08 49.21 48.04 46.93 42.661964 68.46 67.85 65.72 63.49 61.94 47.211965 82.8 81.64 77.65 75.17 71.95 55.941966 84.42 83.16 78.62 73.52 71.19 56.781967 78.71 77.71 74.57 71.38 71.47 58.831968 81.19 80.34 76.47 70.62 67.55 57.031969 88.48 87.16 84.1 79.58 77.58 59.961970 84.63 83.47 80.91 78.94 75.57 61.61971 75.67 75.08 72.84 71.5 70.77 59.341972 96.89 96.09 92.5 87.57 84.98 65.091973 110 109 106 105 100 74.771974 85.32 84.16 79.81 75.76 72.92 65.241975 116 114 107 94.35 89.12 65.711976 74.03 73.04 69.36 66.85 65.26 57.651977 72.92 71.94 68.73 65.24 63.97 54.881978 85.1 83.8 78.93 71.33 67.06 55.491979 83.25 82.08 78.22 75.14 75.13 57.951980 73.43 72.77 72.38 67.14 65.25 57.71981 80.56 79.52 78.41 74.86 73.63 57.571982 62.99 62.9 62.33 60.8 59.38 52.341983 45.46 45.34 44.85 43.86 42.96 37.951984 98.21 96.5 93.19 83.51 77.96 50.29

Page -196- Page 201 of239
1985 76.79 76.15 72.22 69.41 65.83 54.641986 94.95 93.37 89.52 80.35 75.88 56.531987 75.73 74.66 71.26 66.85 64.03 54.631988 64.39 63.6 61.87 59.15 57.99 49.881989 70.27 69.27 65.72 61.27 60.2 50.031990 50.07 49.89 49.14 47.49 46.2 40.15
0.1 98.078 96.459 93.121 87.164 84.278 65.225Average of yearly averages:
53.6043333333333
Inputs generated by pe4.pl - 8-August-2003
Data used for this run:Output File: NCcottonMetfile: w13722.dvfPRZM scenario: NCcottonC.txtEXAMS environment file: pond298.exvChemical Name: PBODescription Variable Name Value Units CommentsMolecular weight mwt 338.45 g/molHenry's Law Const. henry 1.56e-14 atm-m^3/molVapor Pressure vapr 5e-13 torrSolubility sol 143 mg/LKd Kd mg/LKoc Koc 399 mg/LPhotolysis half-life kdp 5.07 days Half-lifeAerobic Aquatic Metabolism kbacw 133 days HalfifeAnaerobic Aquatic Metabolism kbacs 0 days HalfifeAerobic Soil Metabolism asm 73 days HalfifeHydrolysis: pH 5 0 days Half-lifeHydrolysis: pH 7 0 days Half-lifeHydrolysis: pH 9 0 days Half-lifeMethod: CAM 2 integer See PRZM manualIncorporation Depth: DEPI 0 cmApplication Rate: TAPP 0.56 kg/haApplication Efficiency: APPEFF 0.95 fractionSpray Drift DRFT 0.05 fraction of application rate applied to pondApplication Date Date 15-06 dd/mm or dd/mmm or dd-mm ordd-mmmInterval 1 interval 3 days Set to 0 or delete line for singleapp.Interval 2 interval 3 days Set to 0 or delete line for single

Page -197- Page 202 of239
app.Interval 3 interval 3 days Set to 0 or delete line for singleapp.Interval 4 interval 3 days Set to 0 or delete line for singleapp.Interval 5 interval 3 days Set to 0 or delete line for singleapp.Interval 6 interval 3 days Set to 0 or delete line for singleapp.Interval 7 interval 3 days Set to 0 or delete line for singleapp.Interval 8 interval 3 days Set to 0 or delete line for singleapp.Interval 9 interval 3 days Set to 0 or delete line for singleapp.Record 17: FILTRA 0
IPSCND 1UPTKF 0
Record 18: PLVKRT 0PLDKRT 0FEXTRC 0.5
Flag for Index Res. Run IR PondFlag for runoff calc. RUNOFF none none, monthly or total(average ofentire run)
stored as NCcottonG.outChemical: PBOPRZM environment: NCcottonC.txt modified Satday, 12 October 2002at 17:12:02EXAMS environment: pond298.exv modified Thuday, 29 August 2002at 16:33:30Metfile: w13722.dvf modified Wedday, 3 July 2002 at 09:05:50Water segment concentrations (ppb)
Year Peak 96 hr 21 Day 60 Day 90 Day Yearly1961 27.9 27.5 26.31 23.4 21.85 9.4211962 66.95 65.99 64.55 58.99 55.95 33.961963 45.89 45.75 45.22 44.13 43.1 37.131964 62.76 62.15 60.03 57.67 56.01 41.291965 74.01 72.99 69.28 66.06 63.66 50.11966 76.69 75.53 71.32 66.81 64.67 50.961967 71.53 70.61 67.76 64.15 63.06 53.061968 69.78 69.14 65.96 61.66 59.39 51.12

Page -198- Page 203 of239
1969 80.04 78.83 76.2 72.38 70.87 54.091970 74.63 73.63 71.63 69.96 67.4 55.621971 67.38 66.59 65.15 63.77 62.92 53.321972 88.15 87.32 84.33 79.68 77.47 59.381973 103 102 97.51 96.39 92.99 69.471974 76.84 75.81 71.9 68.7 66.2 59.681975 107 105 98.09 86.44 81.89 60.081976 67.75 66.81 63.28 61 59.57 51.881977 66.41 65.48 62.49 59.38 58.31 48.921978 74.46 73.37 69.27 63.04 59.45 49.681979 75.63 74.73 71.97 69.13 68.02 52.241980 66.54 65.83 63.22 57.93 56.85 52.071981 72.94 72.13 71.09 68.36 66.29 52.021982 58.29 58.21 57.67 56.22 54.9 46.441983 40.05 39.94 39.5 38.62 37.82 31.481984 88.37 86.82 84.07 75.57 70.49 44.261985 67.24 66.48 63.24 61.57 58.55 48.811986 88.53 87.01 83.48 74.65 70.25 50.981987 69.89 68.87 65.46 61.18 58.55 49.081988 57.83 57.09 55.42 53.13 52.09 44.071989 62.31 61.4 58.23 54.47 52.77 44.111990 44.76 44.59 43.91 42.42 41.27 33.94
0.1 88.514 87.289 84.304 79.269 76.81 59.65Average of yearly averages:
47.9553666666667
Inputs generated by pe4.pl - 8-August-2003
Data used for this run:Output File: NCcottonGMetfile: w13722.dvfPRZM scenario: NCcottonC.txtEXAMS environment file: pond298.exvChemical Name: PBODescription Variable Name Value Units CommentsMolecular weight mwt 338.45 g/molHenry's Law Const. henry 1.56e-14 atm-m^3/molVapor Pressure vapr 5e-13 torrSolubility sol 143 mg/LKd Kd mg/LKoc Koc 399 mg/LPhotolysis half-life kdp 5.07 days Half-life

Page -199- Page 204 of239
Aerobic Aquatic Metabolism kbacw 133 days HalfifeAnaerobic Aquatic Metabolism kbacs 0 days HalfifeAerobic Soil Metabolism asm 73 days HalfifeHydrolysis: pH 5 0 days Half-lifeHydrolysis: pH 7 0 days Half-lifeHydrolysis: pH 9 0 days Half-lifeMethod: CAM 2 integer See PRZM manualIncorporation Depth: DEPI 0 cmApplication Rate: TAPP 0.56 kg/haApplication Efficiency: APPEFF 0.99 fractionSpray Drift DRFT 0.01 fraction of application rate applied to pondApplication Date Date 15-06 dd/mm or dd/mmm or dd-mm ordd-mmmInterval 1 interval 3 days Set to 0 or delete line for singleapp.Interval 2 interval 3 days Set to 0 or delete line for singleapp.Interval 3 interval 3 days Set to 0 or delete line for singleapp.Interval 4 interval 3 days Set to 0 or delete line for singleapp.Interval 5 interval 3 days Set to 0 or delete line for singleapp.Interval 6 interval 3 days Set to 0 or delete line for singleapp.Interval 7 interval 3 days Set to 0 or delete line for singleapp.Interval 8 interval 3 days Set to 0 or delete line for singleapp.Interval 9 interval 3 days Set to 0 or delete line for singleapp.Record 17: FILTRA 0
IPSCND 1UPTKF 0
Record 18: PLVKRT 0PLDKRT 0FEXTRC 0.5
Flag for Index Res. Run IR PondFlag for runoff calc. RUNOFF none none, monthly or total(average ofentire run)
stored as ORberry.outChemical: PBO
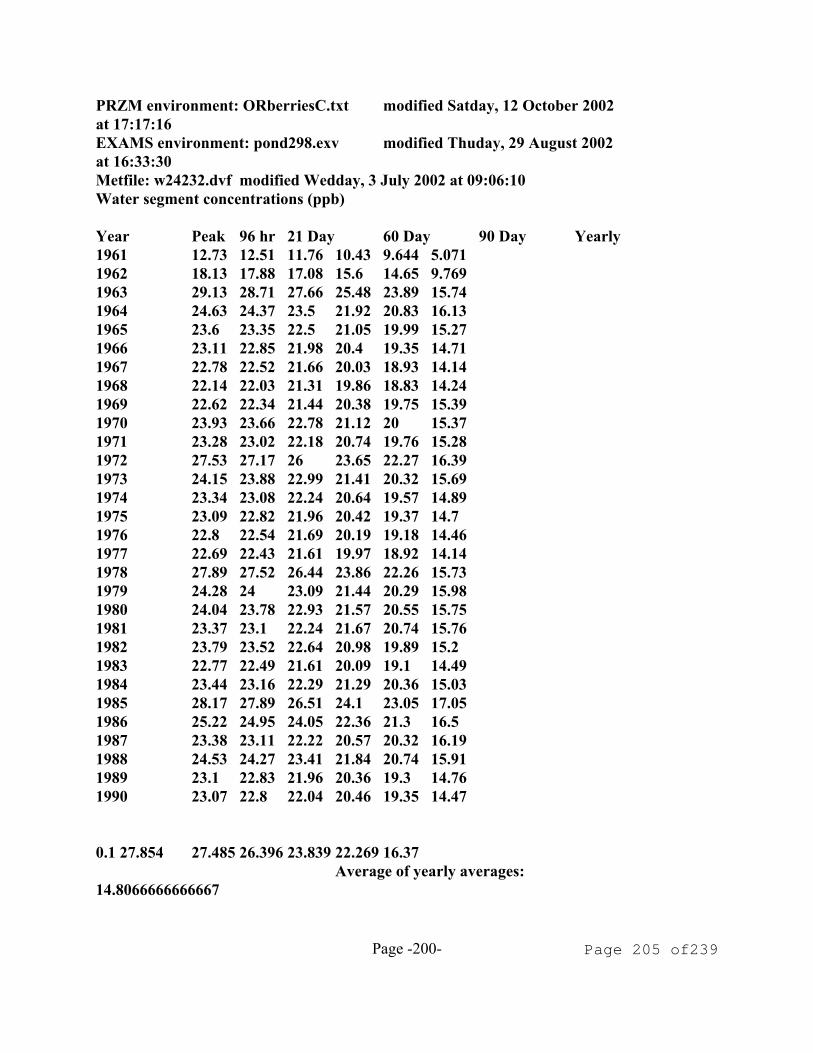
Page -200- Page 205 of239
PRZM environment: ORberriesC.txt modified Satday, 12 October 2002at 17:17:16EXAMS environment: pond298.exv modified Thuday, 29 August 2002at 16:33:30Metfile: w24232.dvf modified Wedday, 3 July 2002 at 09:06:10Water segment concentrations (ppb)
Year Peak 96 hr 21 Day 60 Day 90 Day Yearly1961 12.73 12.51 11.76 10.43 9.644 5.0711962 18.13 17.88 17.08 15.6 14.65 9.7691963 29.13 28.71 27.66 25.48 23.89 15.741964 24.63 24.37 23.5 21.92 20.83 16.131965 23.6 23.35 22.5 21.05 19.99 15.271966 23.11 22.85 21.98 20.4 19.35 14.711967 22.78 22.52 21.66 20.03 18.93 14.141968 22.14 22.03 21.31 19.86 18.83 14.241969 22.62 22.34 21.44 20.38 19.75 15.391970 23.93 23.66 22.78 21.12 20 15.371971 23.28 23.02 22.18 20.74 19.76 15.281972 27.53 27.17 26 23.65 22.27 16.391973 24.15 23.88 22.99 21.41 20.32 15.691974 23.34 23.08 22.24 20.64 19.57 14.891975 23.09 22.82 21.96 20.42 19.37 14.71976 22.8 22.54 21.69 20.19 19.18 14.461977 22.69 22.43 21.61 19.97 18.92 14.141978 27.89 27.52 26.44 23.86 22.26 15.731979 24.28 24 23.09 21.44 20.29 15.981980 24.04 23.78 22.93 21.57 20.55 15.751981 23.37 23.1 22.24 21.67 20.74 15.761982 23.79 23.52 22.64 20.98 19.89 15.21983 22.77 22.49 21.61 20.09 19.1 14.491984 23.44 23.16 22.29 21.29 20.36 15.031985 28.17 27.89 26.51 24.1 23.05 17.051986 25.22 24.95 24.05 22.36 21.3 16.51987 23.38 23.11 22.22 20.57 20.32 16.191988 24.53 24.27 23.41 21.84 20.74 15.911989 23.1 22.83 21.96 20.36 19.3 14.761990 23.07 22.8 22.04 20.46 19.35 14.47
0.1 27.854 27.485 26.396 23.839 22.269 16.37Average of yearly averages:
14.8066666666667

Page -201- Page 206 of239
Inputs generated by pe4.pl - 8-August-2003
Data used for this run:Output File: ORberryMetfile: w24232.dvfPRZM scenario: ORberriesC.txtEXAMS environment file: pond298.exvChemical Name: PBODescription Variable Name Value Units CommentsMolecular weight mwt 338.45 g/molHenry's Law Const. henry 1.56e-14 atm-m^3/molVapor Pressure vapr 5e-13 torrSolubility sol 143 mg/LKd Kd mg/LKoc Koc 399 mg/LPhotolysis half-life kdp 5.07 days Half-lifeAerobic Aquatic Metabolism kbacw 133 days HalfifeAnaerobic Aquatic Metabolism kbacs 0 days HalfifeAerobic Soil Metabolism asm 73 days HalfifeHydrolysis: pH 5 0 days Half-lifeHydrolysis: pH 7 0 days Half-lifeHydrolysis: pH 9 0 days Half-lifeMethod: CAM 2 integer See PRZM manualIncorporation Depth: DEPI 0 cmApplication Rate: TAPP 0.56 kg/haApplication Efficiency: APPEFF 0.95 fractionSpray Drift DRFT 0.05 fraction of application rate applied to pondApplication Date Date 21-04 dd/mm or dd/mmm or dd-mm ordd-mmmInterval 1 interval 3 days Set to 0 or delete line for singleapp.Interval 2 interval 3 days Set to 0 or delete line for singleapp.Interval 3 interval 3 days Set to 0 or delete line for singleapp.Interval 4 interval 3 days Set to 0 or delete line for singleapp.Interval 5 interval 3 days Set to 0 or delete line for singleapp.Interval 6 interval 3 days Set to 0 or delete line for singleapp.Interval 7 interval 3 days Set to 0 or delete line for singleapp.Interval 8 interval 3 days Set to 0 or delete line for single

Page -202- Page 207 of239
app.Interval 9 interval 3 days Set to 0 or delete line for singleapp.Record 17: FILTRA 0
IPSCND 1UPTKF 0
Record 18: PLVKRT 0PLDKRT 0FEXTRC 0.5
Flag for Index Res. Run IR PondFlag for runoff calc. RUNOFF none none, monthly or total(average ofentire run)
stored as ORberryG.outChemical: PBOPRZM environment: ORberriesC.txt modified Satday, 12 October 2002at 17:17:16EXAMS environment: pond298.exv modified Thuday, 29 August 2002at 16:33:30Metfile: w24232.dvf modified Wedday, 3 July 2002 at 09:06:10Water segment concentrations (ppb)
Year Peak 96 hr 21 Day 60 Day 90 Day Yearly1961 2.859 2.809 2.647 2.361 2.209 1.1991962 4.818 4.754 4.564 4.206 3.967 2.7081963 14.6 14.42 14.07 12.6 11.69 7.0721964 8.469 8.402 8.205 7.811 7.523 6.4851965 6.784 6.725 6.538 6.289 6.057 5.0851966 6.107 6.047 5.86 5.509 5.265 4.3581967 5.638 5.58 5.396 5.043 4.796 3.881968 5.601 5.537 5.393 5.111 4.87 3.9871969 7.413 7.312 6.921 6.26 5.977 4.9491970 6.755 6.693 6.502 6.12 5.847 4.9151971 5.921 5.864 5.681 5.434 5.257 4.6211972 10.34 10.2 9.745 8.75 8.136 5.7891973 6.887 6.823 6.631 6.268 6.005 5.0551974 5.916 5.86 5.68 5.328 5.087 4.2161975 5.79 5.731 5.545 5.207 4.969 4.0441976 5.374 5.319 5.141 4.824 4.603 3.6371977 5.155 5.1 4.922 4.545 4.313 3.3211978 10.75 10.63 10.18 8.995 8.293 5.2081979 7.088 7.016 6.815 6.402 6.085 5.49

Page -203- Page 208 of239
1980 6.909 6.848 6.66 6.478 6.261 5.2251981 7.913 7.817 7.487 6.803 6.485 5.2011982 6.527 6.466 6.275 5.898 5.637 4.661983 5.695 5.633 5.443 5.118 4.915 4.0111984 7.023 6.944 6.628 6.273 6.109 4.5421985 13.04 12.84 12.09 10.62 9.803 6.5721986 8.097 8.027 7.828 7.41 7.149 6.0551987 9.986 9.84 9.283 8.279 7.752 5.9241988 7.604 7.541 7.35 6.987 6.709 5.6621989 6.142 6.083 5.895 5.536 5.291 4.4261990 6.069 6.009 5.894 5.535 5.274 4.175
0.1 10.709 10.587 10.1365 8.9705 8.2773 6.442Average of yearly averages:
4.74906666666667
Inputs generated by pe4.pl - 8-August-2003
Data used for this run:Output File: ORberryGMetfile: w24232.dvfPRZM scenario: ORberriesC.txtEXAMS environment file: pond298.exvChemical Name: PBODescription Variable Name Value Units CommentsMolecular weight mwt 338.45 g/molHenry's Law Const. henry 1.56e-14 atm-m^3/molVapor Pressure vapr 5e-13 torrSolubility sol 143 mg/LKd Kd mg/LKoc Koc 399 mg/LPhotolysis half-life kdp 5.07 days Half-lifeAerobic Aquatic Metabolism kbacw 133 days HalfifeAnaerobic Aquatic Metabolism kbacs 0 days HalfifeAerobic Soil Metabolism asm 73 days HalfifeHydrolysis: pH 5 0 days Half-lifeHydrolysis: pH 7 0 days Half-lifeHydrolysis: pH 9 0 days Half-lifeMethod: CAM 2 integer See PRZM manualIncorporation Depth: DEPI 0 cmApplication Rate: TAPP 0.56 kg/haApplication Efficiency: APPEFF 0.99 fractionSpray Drift DRFT 0.01 fraction of application rate applied to pond

Page -204- Page 209 of239
Application Date Date 21-04 dd/mm or dd/mmm or dd-mm ordd-mmmInterval 1 interval 3 days Set to 0 or delete line for singleapp.Interval 2 interval 3 days Set to 0 or delete line for singleapp.Interval 3 interval 3 days Set to 0 or delete line for singleapp.Interval 4 interval 3 days Set to 0 or delete line for singleapp.Interval 5 interval 3 days Set to 0 or delete line for singleapp.Interval 6 interval 3 days Set to 0 or delete line for singleapp.Interval 7 interval 3 days Set to 0 or delete line for singleapp.Interval 8 interval 3 days Set to 0 or delete line for singleapp.Interval 9 interval 3 days Set to 0 or delete line for singleapp.Record 17: FILTRA 0
IPSCND 1UPTKF 0
Record 18: PLVKRT 0PLDKRT 0FEXTRC 0.5
Flag for Index Res. Run IR PondFlag for runoff calc. RUNOFF none none, monthly or total(average ofentire run)
stored as ORsnbeans.outChemical: PBOPRZM environment: ORsnbeansC.txt modified Satday, 12 October 2002at 17:20:58EXAMS environment: pond298.exv modified Thuday, 29 August 2002at 16:33:30Metfile: w24232.dvf modified Wedday, 3 July 2002 at 09:06:10Water segment concentrations (ppb)
Year Peak 96 hr 21 Day 60 Day 90 Day Yearly1961 21.07 20.89 19.95 18.02 16.01 6.5381962 43.05 42.59 41.16 40.36 39.11 23.08

Page -205- Page 210 of239
1963 52.3 51.95 50.65 48.71 44.68 35.721964 47.84 47.67 46.72 43.97 42.56 39.281965 49.86 49.45 48.48 46.01 42.44 39.371966 49.29 49.09 48.36 45.51 43.19 39.921967 54.06 53.83 52.69 50.37 47.62 40.631968 61.95 61.67 60.6 58.34 57.51 47.71969 85.49 84.85 82.51 80.25 79.52 55.571970 77.34 76.99 75.72 72.99 71.06 63.531971 76.37 75.57 73.01 72.64 72.3 62.121972 68.03 67.8 66.91 65.01 63.56 56.861973 64.07 63.79 62.81 59.94 57.66 53.071974 60.76 60.39 59.14 55.86 53.35 48.781975 55.77 55.56 54.54 52.52 51.18 46.291976 46.74 46.57 45.9 44.49 43.52 39.111977 41.09 40.93 40.54 39.09 37.71 33.161978 40.21 39.89 38.67 37.36 37.35 34.991979 61.97 61.59 60.28 58.71 55.56 39.841980 59.16 58.76 57.01 51.82 50.56 45.981981 81.57 80.91 79.4 76.59 75.57 53.931982 73.71 73.39 72.09 69.51 67.73 58.91983 57.79 57.6 56.74 54.81 53.43 50.111984 68.17 67.78 66.7 64.67 59.69 47.61985 60.77 60.51 59.47 57.44 56.04 50.11986 53.46 53.24 52.26 50.32 48.79 45.331987 66.88 66.21 63.92 57.72 54.33 47.391988 60.35 60.04 59.42 57.25 55.63 49.431989 55.61 55.37 54.58 52.7 51.43 46.311990 51.46 51.32 50.64 49.22 47.96 43.27
0.1 77.243 76.848 75.449 72.955 72.176 58.696Average of yearly averages:
44.7969333333333
Inputs generated by pe4.pl - 8-August-2003
Data used for this run:Output File: ORsnbeansMetfile: w24232.dvfPRZM scenario: ORsnbeansC.txtEXAMS environment file: pond298.exvChemical Name: PBODescription Variable Name Value Units CommentsMolecular weight mwt 338.45 g/mol

Page -206- Page 211 of239
Henry's Law Const. henry 1.56e-14 atm-m^3/molVapor Pressure vapr 5e-13 torrSolubility sol 143 mg/LKd Kd mg/LKoc Koc 399 mg/LPhotolysis half-life kdp 5.07 days Half-lifeAerobic Aquatic Metabolism kbacw 133 days HalfifeAnaerobic Aquatic Metabolism kbacs 0 days HalfifeAerobic Soil Metabolism asm 73 days HalfifeHydrolysis: pH 5 0 days Half-lifeHydrolysis: pH 7 0 days Half-lifeHydrolysis: pH 9 0 days Half-lifeMethod: CAM 2 integer See PRZM manualIncorporation Depth: DEPI 0 cmApplication Rate: TAPP 0.56 kg/haApplication Efficiency: APPEFF 0.95 fractionSpray Drift DRFT 0.05 fraction of application rate applied to pondApplication Date Date 25-06 dd/mm or dd/mmm or dd-mm ordd-mmmInterval 1 interval 3 days Set to 0 or delete line for singleapp.Interval 2 interval 3 days Set to 0 or delete line for singleapp.Interval 3 interval 3 days Set to 0 or delete line for singleapp.Interval 4 interval 3 days Set to 0 or delete line for singleapp.Interval 5 interval 3 days Set to 0 or delete line for singleapp.Interval 6 interval 3 days Set to 0 or delete line for singleapp.Interval 7 interval 3 days Set to 0 or delete line for singleapp.Interval 8 interval 3 days Set to 0 or delete line for singleapp.Interval 9 interval 3 days Set to 0 or delete line for singleapp.Record 17: FILTRA 0
IPSCND 1UPTKF 0
Record 18: PLVKRT 0PLDKRT 0FEXTRC 0.5
Flag for Index Res. Run IR Pond

Page -207- Page 212 of239
Flag for runoff calc. RUNOFF none none, monthly or total(average ofentire run)
stored as ORsnbeansG.outChemical: PBOPRZM environment: ORsnbeansC.txt modified Satday, 12 October 2002at 17:20:58EXAMS environment: pond298.exv modified Thuday, 29 August 2002at 16:33:30Metfile: w24232.dvf modified Wedday, 3 July 2002 at 09:06:10Water segment concentrations (ppb)
Year Peak 96 hr 21 Day 60 Day 90 Day Yearly1961 16.86 16.69 15.71 13.54 11.27 3.5651962 36.16 35.83 34.88 33.69 32.45 17.021963 44.66 44.33 43 41.15 36.7 28.11964 39.57 39.4 38.39 36.54 35.57 30.681965 40.93 40.54 39.65 37.18 34.6 30.221966 40.57 40.38 39.71 36.55 35.11 30.591967 45.82 45.59 44.49 41.87 38.79 31.441968 52.7 52.43 51.45 49.47 48.38 38.821969 77.44 76.81 74.51 72.18 71.38 46.671970 69.79 69.45 68.23 65.65 63.84 54.921971 65.99 65.49 64.25 63.44 63.05 53.31972 59.96 59.74 58.92 57.18 55.86 47.861973 55.19 54.92 54.01 51.15 49.73 43.881974 52.07 51.72 50.52 47.08 45.22 39.441975 47.4 47.2 46.25 44.38 43.17 36.881976 37.83 37.68 37.09 35.86 35.03 29.261977 31.71 31.56 31.11 29.44 27.71 23.091978 30.1 29.97 29.42 28.24 27.43 25.21979 52.92 52.55 51.3 49.88 46.54 30.211980 50.82 50.43 48.53 43.67 42.54 36.631981 73.63 72.98 71.54 68.66 67.33 44.931982 66.08 65.77 64.5 62.05 60.38 50.111983 49.49 49.31 48.53 46.78 45.54 41.021984 59.61 59.22 58.22 56.26 50.81 38.421985 52.57 52.31 51.32 49.43 48.16 40.931986 44.61 44.39 43.44 41.36 40.02 35.991987 56.48 56.08 54.7 46.11 42.66 38.291988 52.39 52.08 51.53 49.5 48.01 40.491989 47.51 47.28 46.56 44.81 43.65 37.19

Page -208- Page 213 of239
1990 43.13 42.99 42.31 41.06 39.95 34.1
0.1 69.419 69.082 67.857 65.429 63.761 49.885Average of yearly averages:
35.9748333333333
Inputs generated by pe4.pl - 8-August-2003
Data used for this run:Output File: ORsnbeansGMetfile: w24232.dvfPRZM scenario: ORsnbeansC.txtEXAMS environment file: pond298.exvChemical Name: PBODescription Variable Name Value Units CommentsMolecular weight mwt 338.45 g/molHenry's Law Const. henry 1.56e-14 atm-m^3/molVapor Pressure vapr 5e-13 torrSolubility sol 143 mg/LKd Kd mg/LKoc Koc 399 mg/LPhotolysis half-life kdp 5.07 days Half-lifeAerobic Aquatic Metabolism kbacw 133 days HalfifeAnaerobic Aquatic Metabolism kbacs 0 days HalfifeAerobic Soil Metabolism asm 73 days HalfifeHydrolysis: pH 5 0 days Half-lifeHydrolysis: pH 7 0 days Half-lifeHydrolysis: pH 9 0 days Half-lifeMethod: CAM 2 integer See PRZM manualIncorporation Depth: DEPI 0 cmApplication Rate: TAPP 0.56 kg/haApplication Efficiency: APPEFF 0.99 fractionSpray Drift DRFT 0.01 fraction of application rate applied to pondApplication Date Date 25-06 dd/mm or dd/mmm or dd-mm ordd-mmmInterval 1 interval 3 days Set to 0 or delete line for singleapp.Interval 2 interval 3 days Set to 0 or delete line for singleapp.Interval 3 interval 3 days Set to 0 or delete line for singleapp.Interval 4 interval 3 days Set to 0 or delete line for singleapp.

Page -209- Page 214 of239
Interval 5 interval 3 days Set to 0 or delete line for singleapp.Interval 6 interval 3 days Set to 0 or delete line for singleapp.Interval 7 interval 3 days Set to 0 or delete line for singleapp.Interval 8 interval 3 days Set to 0 or delete line for singleapp.Interval 9 interval 3 days Set to 0 or delete line for singleapp.Record 17: FILTRA 0
IPSCND 1UPTKF 0
Record 18: PLVKRT 0PLDKRT 0FEXTRC 0.5
Flag for Index Res. Run IR PondFlag for runoff calc. RUNOFF none none, monthly or total(average ofentire run)
stored as PAtomato.outChemical: PBOPRZM environment: PAtomatoC.txt modified Satday, 12 October 2002at 17:26:12EXAMS environment: pond298.exv modified Thuday, 29 August 2002at 16:33:30Metfile: w14737.dvf modified Wedday, 3 July 2002 at 09:06:12Water segment concentrations (ppb)
Year Peak 96 hr 21 Day 60 Day 90 Day Yearly1961 23.37 22.91 21.56 19.23 17.67 9.0731962 34.09 33.49 31.27 27.88 26.66 18.871963 28.21 27.91 26.9 24.93 23.75 20.211964 30.49 30.08 28.53 27.37 26.37 20.481965 27.38 27.02 26.31 24.55 23.26 19.011966 26.79 26.55 25.57 23.5 22.15 18.191967 57.73 56.68 54.16 49.32 45.93 29.971968 69.09 68.15 64.19 56.95 52.57 37.81969 41.49 41 39.29 37.48 37.39 33.111970 37.43 37.05 35.96 33.88 32.81 27.721971 42.19 41.78 40.01 37.07 35.3 26.941972 76.71 75.64 70.88 65.83 61.79 39.841973 65.66 64.73 61.19 58.85 56.04 43.71

Page -210- Page 215 of239
1974 52.83 52.24 50.71 49.64 47.93 39.221975 48.08 47.62 46.35 42.96 41.21 33.661976 35.1 34.77 33.68 32.18 30.82 27.141977 35.38 34.92 33.19 30.95 29.91 24.271978 44.9 44.3 42.53 39.4 37.25 26.91979 56.92 56.15 53.42 47.91 45.48 32.31980 39.65 39.18 38.6 36.49 34.46 27.881981 43.07 42.69 41.73 39.74 37.56 27.071982 66.24 65.25 61.68 57.51 53.98 36.271983 44.08 43.66 42.28 40.71 38.97 32.331984 81.84 80.59 74.91 66.93 61.87 40.351985 50.96 50.5 49.08 47.47 45.97 37.671986 47.81 47.21 45.88 42.2 39.97 32.261987 36.52 36.05 34.78 33.31 32.65 27.691988 64.72 64.03 62.03 54.59 51.18 34.371989 58.27 57.48 55.82 53.57 50.95 37.81990 72.34 71.32 67.22 60.2 56.59 40.87
0.1 72.015 71.003 66.917 60.065 56.535 40.299Average of yearly averages:
30.0991
Inputs generated by pe4.pl - 8-August-2003
Data used for this run:Output File: PAtomatoMetfile: w14737.dvfPRZM scenario: PAtomatoC.txtEXAMS environment file: pond298.exvChemical Name: PBODescription Variable Name Value Units CommentsMolecular weight mwt 338.45 g/molHenry's Law Const. henry 1.56e-14 atm-m^3/molVapor Pressure vapr 5e-13 torrSolubility sol 143 mg/LKd Kd mg/LKoc Koc 399 mg/LPhotolysis half-life kdp 5.07 days Half-lifeAerobic Aquatic Metabolism kbacw 133 days HalfifeAnaerobic Aquatic Metabolism kbacs 0 days HalfifeAerobic Soil Metabolism asm 73 days HalfifeHydrolysis: pH 5 0 days Half-lifeHydrolysis: pH 7 0 days Half-life

Page -211- Page 216 of239
Hydrolysis: pH 9 0 days Half-lifeMethod: CAM 2 integer See PRZM manualIncorporation Depth: DEPI 0 cmApplication Rate: TAPP 0.56 kg/haApplication Efficiency: APPEFF 0.95 fractionSpray Drift DRFT 0.05 fraction of application rate applied to pondApplication Date Date 29-04 dd/mm or dd/mmm or dd-mm ordd-mmmInterval 1 interval 3 days Set to 0 or delete line for singleapp.Interval 2 interval 3 days Set to 0 or delete line for singleapp.Interval 3 interval 3 days Set to 0 or delete line for singleapp.Interval 4 interval 3 days Set to 0 or delete line for singleapp.Interval 5 interval 3 days Set to 0 or delete line for singleapp.Interval 6 interval 3 days Set to 0 or delete line for singleapp.Interval 7 interval 3 days Set to 0 or delete line for singleapp.Interval 8 interval 3 days Set to 0 or delete line for singleapp.Interval 9 interval 3 days Set to 0 or delete line for singleapp.Record 17: FILTRA 0
IPSCND 1UPTKF 0
Record 18: PLVKRT 0PLDKRT 0FEXTRC 0.5
Flag for Index Res. Run IR PondFlag for runoff calc. RUNOFF none none, monthly or total(average ofentire run)
stored as PAtomatoG.outChemical: PBOPRZM environment: PAtomatoC.txt modified Satday, 12 October 2002at 17:26:12EXAMS environment: pond298.exv modified Thuday, 29 August 2002at 16:33:30Metfile: w14737.dvf modified Wedday, 3 July 2002 at 09:06:12

Page -212- Page 217 of239
Water segment concentrations (ppb)
Year Peak 96 hr 21 Day 60 Day 90 Day Yearly1961 18.05 17.64 16.21 14.4 13.12 5.6951962 23.91 23.47 21.81 19.43 18.8 12.811963 13.74 13.64 13.58 13.45 13.28 12.461964 17.45 17.21 16.3 15.19 14.44 11.921965 12.43 12.29 11.75 11.08 10.7 101966 10.71 10.62 10.25 9.961 9.775 8.951967 45.08 44.18 42.3 38.57 35.78 20.851968 54.58 53.81 50.61 44.69 41.14 28.881969 31.12 30.72 29.29 26.73 25.53 24.061970 21.23 21.09 20.86 20.6 20.38 18.41971 26.68 26.49 25.63 23.32 22.5 17.631972 65.11 64.15 59.88 54.34 51.14 31.121973 54.24 53.44 50.46 46.83 45 35.241974 39.88 39.45 38.56 36.72 35.9 30.631975 34.43 34 33.12 30.89 29.3 24.851976 21.26 21.04 20.2 19.97 19.65 18.181977 21.2 20.93 19.91 18.5 17.67 15.151978 29.48 29.22 28.08 26.15 24.93 17.881979 42.05 41.73 39.4 35.34 33.87 23.531980 25 24.75 24.01 23.22 22.23 19.161981 28.78 28.53 27.88 26.93 25.63 18.41982 53.94 53.09 49.87 45.66 42.99 27.61983 30.13 29.79 28.65 27.56 26.7 23.681984 68.32 67.23 62.32 55.81 51.47 32.131985 38.44 38.13 36.57 34.94 34.35 29.431986 33.06 32.79 31.8 29.65 28.32 23.651987 23.82 23.51 22.9 22.08 21.34 18.891988 52.08 51.4 48.48 42.25 39.83 25.891989 45.06 44.45 42.82 41.05 39.24 29.361990 58.49 57.64 54.33 48.75 46.02 32.62
0.1 58.099 57.257 53.958 48.558 45.918 32.029Average of yearly averages:
21.6348333333333
Inputs generated by pe4.pl - 8-August-2003
Data used for this run:Output File: PAtomatoGMetfile: w14737.dvf

Page -213- Page 218 of239
PRZM scenario: PAtomatoC.txtEXAMS environment file: pond298.exvChemical Name: PBODescription Variable Name Value Units CommentsMolecular weight mwt 338.45 g/molHenry's Law Const. henry 1.56e-14 atm-m^3/molVapor Pressure vapr 5e-13 torrSolubility sol 143 mg/LKd Kd mg/LKoc Koc 399 mg/LPhotolysis half-life kdp 5.07 days Half-lifeAerobic Aquatic Metabolism kbacw 133 days HalfifeAnaerobic Aquatic Metabolism kbacs 0 days HalfifeAerobic Soil Metabolism asm 73 days HalfifeHydrolysis: pH 5 0 days Half-lifeHydrolysis: pH 7 0 days Half-lifeHydrolysis: pH 9 0 days Half-lifeMethod: CAM 2 integer See PRZM manualIncorporation Depth: DEPI 0 cmApplication Rate: TAPP 0.56 kg/haApplication Efficiency: APPEFF 0.99 fractionSpray Drift DRFT 0.01 fraction of application rate applied to pondApplication Date Date 29-04 dd/mm or dd/mmm or dd-mm ordd-mmmInterval 1 interval 3 days Set to 0 or delete line for singleapp.Interval 2 interval 3 days Set to 0 or delete line for singleapp.Interval 3 interval 3 days Set to 0 or delete line for singleapp.Interval 4 interval 3 days Set to 0 or delete line for singleapp.Interval 5 interval 3 days Set to 0 or delete line for singleapp.Interval 6 interval 3 days Set to 0 or delete line for singleapp.Interval 7 interval 3 days Set to 0 or delete line for singleapp.Interval 8 interval 3 days Set to 0 or delete line for singleapp.Interval 9 interval 3 days Set to 0 or delete line for singleapp.Record 17: FILTRA 0
IPSCND 1

Page -214- Page 219 of239
UPTKF 0Record 18: PLVKRT 0
PLDKRT 0FEXTRC 0.5
Flag for Index Res. Run IR PondFlag for runoff calc. RUNOFF none none, monthly or total(average ofentire run)
stored as PAturf.outChemical: PBOPRZM environment: PAturfC.txt modified Satday, 12 October 2002 at17:27:02EXAMS environment: pond298.exv modified Thuday, 29 August 2002at 16:33:30Metfile: w14737.dvf modified Wedday, 3 July 2002 at 09:06:12Water segment concentrations (ppb)
Year Peak 96 hr 21 Day 60 Day 90 Day Yearly1961 14.42 14.16 13.65 12.2 11.28 6.7751962 22.6 22.24 20.88 18.68 18.21 13.261963 23.27 22.98 22.08 20.39 19.21 14.71964 24.86 24.52 23.54 21.81 20.56 15.011965 22.97 22.65 21.71 20 18.84 14.11966 22.47 22.19 21.32 19.62 18.41 13.661967 32.14 31.62 29.99 27.04 26.2 18.711968 39.56 39.06 36.9 33.73 32.25 23.131969 29.31 28.97 27.99 26.11 24.8 20.81970 27.47 27.16 26.2 24.41 23.14 18.171971 28.41 28.06 26.87 24.81 23.39 17.491972 39.09 38.53 36.26 34.42 32.23 22.421973 34.67 34.2 32.4 31.46 30.63 23.91974 36.81 36.34 34.56 31.7 29.96 22.831975 28.57 28.23 27.25 26.08 24.98 19.61976 25.39 25.1 24.18 22.43 21.19 17.071977 24.66 24.34 23.38 21.91 20.81 15.911978 31.4 31.02 29.4 26.11 24.4 17.31979 32.67 32.22 30.56 27.38 26.06 19.121980 27.34 27 25.85 23.95 22.6 17.021981 30.18 29.75 28.54 25.63 23.89 16.991982 34.35 33.87 32.13 30.28 28.48 20.681983 28.76 28.44 27.54 25.88 24.74 19.051984 39.52 38.96 36.4 32.61 30.72 21.321985 34.53 34.06 33 30.66 28.89 21.47

Page -215- Page 220 of239
1986 30.26 29.88 28.64 27.07 25.71 19.681987 25.93 25.62 24.67 23.05 22.18 17.541988 48.4 47.6 44.52 38.78 35.52 23.221989 40.59 40.08 38.75 35.81 33.55 24.621990 39.33 38.83 36.59 32.98 31.55 23.89
0.1 39.556 39.05 36.869 34.351 32.248 23.823Average of yearly averages:
18.6478333333333
Inputs generated by pe4.pl - 8-August-2003
Data used for this run:Output File: PAturfMetfile: w14737.dvfPRZM scenario: PAturfC.txtEXAMS environment file: pond298.exvChemical Name: PBODescription Variable Name Value Units CommentsMolecular weight mwt 338.45 g/molHenry's Law Const. henry 1.56e-14 atm-m^3/molVapor Pressure vapr 5e-13 torrSolubility sol 143 mg/LKd Kd mg/LKoc Koc 399 mg/LPhotolysis half-life kdp 5.07 days Half-lifeAerobic Aquatic Metabolism kbacw 133 days HalfifeAnaerobic Aquatic Metabolism kbacs 0 days HalfifeAerobic Soil Metabolism asm 73 days HalfifeHydrolysis: pH 5 0 days Half-lifeHydrolysis: pH 7 0 days Half-lifeHydrolysis: pH 9 0 days Half-lifeMethod: CAM 2 integer See PRZM manualIncorporation Depth: DEPI 0 cmApplication Rate: TAPP 0.56 kg/haApplication Efficiency: APPEFF 0.95 fractionSpray Drift DRFT 0.05 fraction of application rate applied to pondApplication Date Date 15-04 dd/mm or dd/mmm or dd-mm ordd-mmmInterval 1 interval 3 days Set to 0 or delete line for singleapp.Interval 2 interval 3 days Set to 0 or delete line for singleapp.

Page -216- Page 221 of239
Interval 3 interval 3 days Set to 0 or delete line for singleapp.Interval 4 interval 3 days Set to 0 or delete line for singleapp.Interval 5 interval 3 days Set to 0 or delete line for singleapp.Interval 6 interval 3 days Set to 0 or delete line for singleapp.Interval 7 interval 3 days Set to 0 or delete line for singleapp.Interval 8 interval 3 days Set to 0 or delete line for singleapp.Interval 9 interval 3 days Set to 0 or delete line for singleapp.Record 17: FILTRA 0
IPSCND 1UPTKF 0
Record 18: PLVKRT 0PLDKRT 0FEXTRC 0.5
Flag for Index Res. Run IR PondFlag for runoff calc. RUNOFF none none, monthly or total(average ofentire run)
stored as PAturfG.outChemical: PBOPRZM environment: PAturfC.txt modified Satday, 12 October 2002 at17:27:02EXAMS environment: pond298.exv modified Thuday, 29 August 2002at 16:33:30Metfile: w14737.dvf modified Wedday, 3 July 2002 at 09:06:12Water segment concentrations (ppb)
Year Peak 96 hr 21 Day 60 Day 90 Day Yearly1961 9.071 8.873 8.313 7.328 6.681 3.0961962 12.81 12.58 11.7 10.37 9.907 6.8321963 8.489 8.413 8.207 7.777 7.447 6.6261964 9.205 9.092 8.891 8.38 7.987 6.1511965 6.796 6.72 6.515 6.112 5.822 4.8381966 5.887 5.826 5.637 5.258 4.971 4.1651967 19.24 18.87 17.81 15.88 14.68 9.0371968 25.01 24.66 23.16 20.5 18.96 13.51
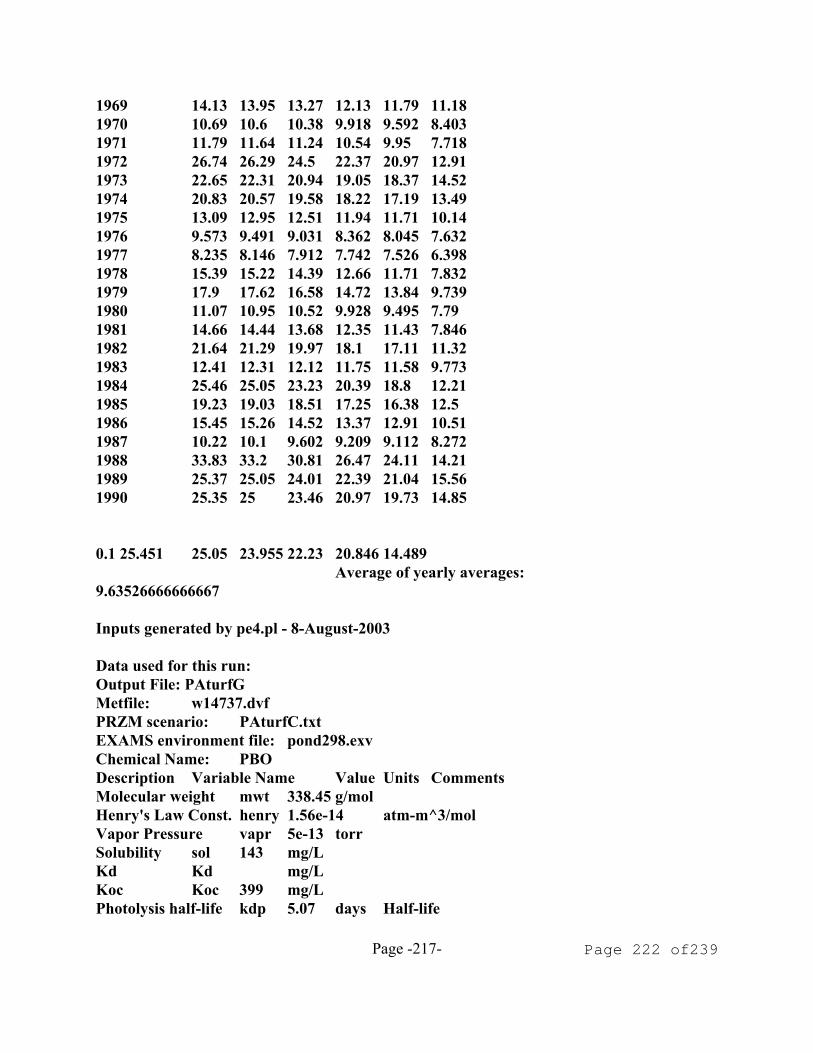
Page -217- Page 222 of239
1969 14.13 13.95 13.27 12.13 11.79 11.181970 10.69 10.6 10.38 9.918 9.592 8.4031971 11.79 11.64 11.24 10.54 9.95 7.7181972 26.74 26.29 24.5 22.37 20.97 12.911973 22.65 22.31 20.94 19.05 18.37 14.521974 20.83 20.57 19.58 18.22 17.19 13.491975 13.09 12.95 12.51 11.94 11.71 10.141976 9.573 9.491 9.031 8.362 8.045 7.6321977 8.235 8.146 7.912 7.742 7.526 6.3981978 15.39 15.22 14.39 12.66 11.71 7.8321979 17.9 17.62 16.58 14.72 13.84 9.7391980 11.07 10.95 10.52 9.928 9.495 7.791981 14.66 14.44 13.68 12.35 11.43 7.8461982 21.64 21.29 19.97 18.1 17.11 11.321983 12.41 12.31 12.12 11.75 11.58 9.7731984 25.46 25.05 23.23 20.39 18.8 12.211985 19.23 19.03 18.51 17.25 16.38 12.51986 15.45 15.26 14.52 13.37 12.91 10.511987 10.22 10.1 9.602 9.209 9.112 8.2721988 33.83 33.2 30.81 26.47 24.11 14.211989 25.37 25.05 24.01 22.39 21.04 15.561990 25.35 25 23.46 20.97 19.73 14.85
0.1 25.451 25.05 23.955 22.23 20.846 14.489Average of yearly averages:
9.63526666666667
Inputs generated by pe4.pl - 8-August-2003
Data used for this run:Output File: PAturfGMetfile: w14737.dvfPRZM scenario: PAturfC.txtEXAMS environment file: pond298.exvChemical Name: PBODescription Variable Name Value Units CommentsMolecular weight mwt 338.45 g/molHenry's Law Const. henry 1.56e-14 atm-m^3/molVapor Pressure vapr 5e-13 torrSolubility sol 143 mg/LKd Kd mg/LKoc Koc 399 mg/LPhotolysis half-life kdp 5.07 days Half-life

Page -218- Page 223 of239
Aerobic Aquatic Metabolism kbacw 133 days HalfifeAnaerobic Aquatic Metabolism kbacs 0 days HalfifeAerobic Soil Metabolism asm 73 days HalfifeHydrolysis: pH 5 0 days Half-lifeHydrolysis: pH 7 0 days Half-lifeHydrolysis: pH 9 0 days Half-lifeMethod: CAM 2 integer See PRZM manualIncorporation Depth: DEPI 0 cmApplication Rate: TAPP 0.56 kg/haApplication Efficiency: APPEFF 0.99 fractionSpray Drift DRFT 0.01 fraction of application rate applied to pondApplication Date Date 15-04 dd/mm or dd/mmm or dd-mm ordd-mmmInterval 1 interval 3 days Set to 0 or delete line for singleapp.Interval 2 interval 3 days Set to 0 or delete line for singleapp.Interval 3 interval 3 days Set to 0 or delete line for singleapp.Interval 4 interval 3 days Set to 0 or delete line for singleapp.Interval 5 interval 3 days Set to 0 or delete line for singleapp.Interval 6 interval 3 days Set to 0 or delete line for singleapp.Interval 7 interval 3 days Set to 0 or delete line for singleapp.Interval 8 interval 3 days Set to 0 or delete line for singleapp.Interval 9 interval 3 days Set to 0 or delete line for singleapp.Record 17: FILTRA 0
IPSCND 1UPTKF 0
Record 18: PLVKRT 0PLDKRT 0FEXTRC 0.5
Flag for Index Res. Run IR PondFlag for runoff calc. RUNOFF none none, monthly or total(average ofentire run)
stored as TXcotton.out

Page -219- Page 224 of239
Chemical: PBOPRZM environment: TXcottonC.txt modified Satday, 12 October 2002at 17:29:08EXAMS environment: pond298.exv modified Thuday, 29 August 2002at 16:33:30Metfile: w13958.dvf modified Wedday, 3 July 2002 at 09:06:24Water segment concentrations (ppb)
Year Peak 96 hr 21 Day 60 Day 90 Day Yearly1961 80.78 78.68 71.36 61.73 55.09 23.951962 80.31 78.62 74.42 64.85 58.44 36.871963 34.43 33.87 31.98 30.54 29.35 24.191964 138 135 121 98.44 86.77 42.91965 78.48 77.63 75.23 68.13 62.13 45.571966 42.05 41.57 38.92 35.6 34.19 31.541967 36.34 35.64 34.37 31.05 28.74 23.821968 49.6 48.63 44.99 42 40.51 27.141969 38.81 38.25 36.23 33.13 32.53 26.011970 79.04 78.23 74.6 65.15 59.28 35.71971 41.96 41.58 38.99 34.44 34.08 28.191972 53.45 52.28 47.94 41.56 37.84 26.071973 48.78 47.79 45.28 42.93 39.48 27.071974 49.18 48.18 44.58 40.69 37.87 27.971975 97.05 94.97 90.19 84.31 78.9 46.031976 67.03 65.82 63.8 57.05 53.34 40.721977 35.74 35.17 34.1 32.08 31.14 26.261978 58.18 56.83 51.82 44.67 41.5 26.271979 96.26 94.34 89.85 79.14 80.38 48.61980 48.11 47.45 46.57 45.15 43.89 35.751981 164 162 150 126 115 60.481982 65.89 65.1 64.55 62 57.56 44.991983 58.45 57.34 53.76 48.31 45.53 31.871984 31.48 31.06 29.1 26.42 24.54 20.561985 65.5 64 59.01 52.26 47.34 27.021986 40.6 39.93 38.14 34.86 31.94 24.461987 101 98.42 93.61 81.39 73.3 39.181988 52.78 52.11 49.16 43.16 40 30.491989 54.81 53.65 49.65 43.07 40.31 26.581990 37.69 36.91 33.97 31.28 29.62 22.21
0.1 100.605 98.075 93.268 84.018 80.232 45.984Average of yearly averages:
32.6153333333333

Page -220- Page 225 of239
Inputs generated by pe4.pl - 8-August-2003
Data used for this run:Output File: TXcottonMetfile: w13958.dvfPRZM scenario: TXcottonC.txtEXAMS environment file: pond298.exvChemical Name: PBODescription Variable Name Value Units CommentsMolecular weight mwt 338.45 g/molHenry's Law Const. henry 1.56e-14 atm-m^3/molVapor Pressure vapr 5e-13 torrSolubility sol 143 mg/LKd Kd mg/LKoc Koc 399 mg/LPhotolysis half-life kdp 5.07 days Half-lifeAerobic Aquatic Metabolism kbacw 133 days HalfifeAnaerobic Aquatic Metabolism kbacs 0 days HalfifeAerobic Soil Metabolism asm 73 days HalfifeHydrolysis: pH 5 0 days Half-lifeHydrolysis: pH 7 0 days Half-lifeHydrolysis: pH 9 0 days Half-lifeMethod: CAM 2 integer See PRZM manualIncorporation Depth: DEPI 0 cmApplication Rate: TAPP 0.56 kg/haApplication Efficiency: APPEFF 0.95 fractionSpray Drift DRFT 0.05 fraction of application rate applied to pondApplication Date Date 09-05 dd/mm or dd/mmm or dd-mm ordd-mmmInterval 1 interval 3 days Set to 0 or delete line for singleapp.Interval 2 interval 3 days Set to 0 or delete line for singleapp.Interval 3 interval 3 days Set to 0 or delete line for singleapp.Interval 4 interval 3 days Set to 0 or delete line for singleapp.Interval 5 interval 3 days Set to 0 or delete line for singleapp.Interval 6 interval 3 days Set to 0 or delete line for singleapp.Interval 7 interval 3 days Set to 0 or delete line for singleapp.Interval 8 interval 3 days Set to 0 or delete line for single

Page -221- Page 226 of239
app.Interval 9 interval 3 days Set to 0 or delete line for singleapp.Record 17: FILTRA 0
IPSCND 1UPTKF 0
Record 18: PLVKRT 0PLDKRT 0FEXTRC 0.5
Flag for Index Res. Run IR PondFlag for runoff calc. RUNOFF none none, monthly or total(average ofentire run)
stored as TXcottonG.outChemical: PBOPRZM environment: TXcottonC.txt modified Satday, 12 October 2002at 17:29:08EXAMS environment: pond298.exv modified Thuday, 29 August 2002at 16:33:30Metfile: w13958.dvf modified Wedday, 3 July 2002 at 09:06:24Water segment concentrations (ppb)
Year Peak 96 hr 21 Day 60 Day 90 Day Yearly1961 75.63 73.64 66.63 57.75 51.51 21.781962 72.24 70.72 66.58 58.34 52.63 33.391963 28.58 28.53 28.3 27.6 26.81 19.741964 133 129 116 93.83 82.47 39.021965 70.6 70.02 68.01 60.59 55.16 41.551966 36.49 36.04 33.62 32.1 31.27 26.761967 25.54 25.27 23.92 21.96 20.49 18.811968 41.97 41.12 37.93 33.12 32.51 22.041969 33.78 33.28 31.05 28.41 26.55 20.931970 71.61 70.37 65.71 57.27 51.94 31.041971 36.21 35.91 33.57 29.42 27.69 23.361972 44.12 43.14 39.48 34.29 31.23 21.181973 40.74 39.89 36.72 35.05 32.34 22.011974 43.77 42.82 39.43 35.94 33.32 23.011975 88.56 87.13 82.39 77.04 72.36 41.671976 59.66 58.57 56.48 50.7 46.51 36.091977 29.57 29.51 29.25 28.44 27.61 21.111978 47.66 46.54 42.38 36.13 33.9 21.41979 91.94 90.06 85.4 74.84 73.95 44.47

Page -222- Page 227 of239
1980 44.39 44.26 43.71 42.39 41.21 31.311981 159 157 145 122 111 57.151982 59.76 59.07 57.62 54.45 50.59 41.091983 47.93 47.04 44.13 39.74 37.78 27.221984 20.69 20.65 20.45 19.85 19.25 15.491985 57.33 55.97 51.55 44.66 40.55 22.251986 29.8 29.35 28.15 26.07 23.96 19.641987 92.95 90.78 85.72 74.42 67.03 34.861988 42.37 41.94 39.25 34.53 32.1 25.841989 45.4 44.43 41.04 34.73 32.6 21.871990 27.49 26.97 25.09 23 22.2 17.41
0.1 92.849 90.708 85.688 76.82 73.791 41.658Average of yearly averages:
28.1163333333333
Inputs generated by pe4.pl - 8-August-2003
Data used for this run:Output File: TXcottonGMetfile: w13958.dvfPRZM scenario: TXcottonC.txtEXAMS environment file: pond298.exvChemical Name: PBODescription Variable Name Value Units CommentsMolecular weight mwt 338.45 g/molHenry's Law Const. henry 1.56e-14 atm-m^3/molVapor Pressure vapr 5e-13 torrSolubility sol 143 mg/LKd Kd mg/LKoc Koc 399 mg/LPhotolysis half-life kdp 5.07 days Half-lifeAerobic Aquatic Metabolism kbacw 133 days HalfifeAnaerobic Aquatic Metabolism kbacs 0 days HalfifeAerobic Soil Metabolism asm 73 days HalfifeHydrolysis: pH 5 0 days Half-lifeHydrolysis: pH 7 0 days Half-lifeHydrolysis: pH 9 0 days Half-lifeMethod: CAM 2 integer See PRZM manualIncorporation Depth: DEPI 0 cmApplication Rate: TAPP 0.56 kg/haApplication Efficiency: APPEFF 0.99 fractionSpray Drift DRFT 0.01 fraction of application rate applied to pond

Page -223- Page 228 of239
Application Date Date 09-05 dd/mm or dd/mmm or dd-mm ordd-mmmInterval 1 interval 3 days Set to 0 or delete line for singleapp.Interval 2 interval 3 days Set to 0 or delete line for singleapp.Interval 3 interval 3 days Set to 0 or delete line for singleapp.Interval 4 interval 3 days Set to 0 or delete line for singleapp.Interval 5 interval 3 days Set to 0 or delete line for singleapp.Interval 6 interval 3 days Set to 0 or delete line for singleapp.Interval 7 interval 3 days Set to 0 or delete line for singleapp.Interval 8 interval 3 days Set to 0 or delete line for singleapp.Interval 9 interval 3 days Set to 0 or delete line for singleapp.Record 17: FILTRA 0
IPSCND 1UPTKF 0
Record 18: PLVKRT 0PLDKRT 0FEXTRC 0.5
Flag for Index Res. Run IR PondFlag for runoff calc. RUNOFF none none, monthly or total(average ofentire run)

Page -224- Page 229 of239
Appendix I. Agricultural Usage Information from USDA Regional IPMCenters
(www.ipmcenters.org/datasources/nass/output/NASS.cfm)
crop state year %treatedacres
no. appl ai per yrlb/ac
ai perappllb/ac
All Veg.Crops
Arizona 1990 1 0 0 0
Cauliflower
California 1994 1 1.2 0.42 0.36
Celery California 1994 2 1.1 0.37 0.34Celery California 1996 3 1.2 0.37 0.31Eggplant New Jersey 1992 25 5.1 2.89 0.57Eggplant New Jersey 1994 26 4.4 2.4 0.55FallPotatoes
Michigan 1992 45 2.3 1 0.44
FallPotatoes
New York 1992 41 1 0.34 0.32
FallPotatoes
Pennsylvania
1992 46 1.8 0.94 0.52
FallPotatoes
Maine 1993 4 1.5 0.6 0.4
FallPotatoes
Michigan 1993 48 2.8 1.39 0.5
FallPotatoes
New York 1993 36 1.8 0.74 0.42
FallPotatoes
Pennsylvania
1993 51 2.3 1.11 0.48
FallPotatoes
Maine 1994 7 1 0.4 0.4
FallPotatoes
Michigan 1994 70 2.9 1.6 0.56
FallPotatoes
New York 1994 22 2.8 2.24 0.79
FallPotatoes
Pennsylvania
1994 75 2.3 1.12 0.5
FallPotatoes
Wisconsin 1995 17 1 0.21 0.2
FallPotatoes
Pennsylvania
1995 7 1.3 0.64 0.51

crop state year %treatedacres
no. appl ai per yrlb/ac
ai perappllb/ac
Page -225- Page 230 of239
FallPotatoes
Wisconsin 1997 23 1.2 0.38 0.33
FallPotatoes
Pennsylvania
1998 1 1.1 0.56 0.51
FallPotatoes
Wisconsin 1998 33 1.6 0.5 0.3
FallPotatoes
Wisconsin 1999 30 1.8 0.72 0.39
FallPotatoes
Wisconsin 2001 22 1.3 0.51 0.39
crop state year %treatedacres
no. appl ai per yrlb/ac
ai perappllb/ac
HeadLettuce
California 1992 4 1.2 0.34 0.28
HeadLettuce
California 1994 12 1.1 0.29 0.27
HeadLettuce
California 1996 5 1.1 0.36 0.32
HeadLettuce
California 1998 3 1 0.47 0.44
HeadLettuce
California 2000 3 1.1 0.58 0.53
Lettuce,Other
California 1992 12 1.4 0.46 0.33
Lettuce,Other
California 1994 13 1.2 0.35 0.29
Lettuce,Other
California 1996 12 1 0.27 0.26
Lettuce,Other
California 2000 4 1 0.08 0.08
Spinach,FM
California 1992 13 1.1 0.28 0.25
Spinach,FM
California 1994 20 1.2 0.3 0.26
Spinach,FM
California 1996 24 2.4 0.55 0.23
Tomatoes,FM
New Jersey 1992 25 5.3 2.47 0.46

Page -226- Page 231 of239
Tomatoes,FM
New Jersey 1994 21 3.5 1.89 0.55
Tomatoes,PR
Michigan 1992 23 1.1 0.39 0.34

Page -227- Page 232 of239
Crystal Ball ReportSim ulat ion started on 6/ 16/ 05 at 12:00:15Sim ulat ion stopped on 6/ 16/ 05 at 12:04:27
Forecast: Short range grass distribution
Stat ist ics: ValueTrials 10000Mean 84.40EFED est im ated m ean for r isk assessm ent 85.00Median 69.20Mode ---Standard Deviat ion 59.57Variance 3,548.77Skewness 2.38Kurtosis 13.29Coeff. of Variability 0.71Range Minim um 3.04Range Maxim um 699.53Range Width 696.49Mean Std. Error 0.60
Forecast: Short range grass distribution (cont'd)
Percent iles:
Percent ile m g/ kg0% 3.045% 24.22
10% 30.5915% 35.3720% 39.7925% 44.4830% 49.1635% 53.7240% 58.9245% 63.7650% 69.2055% 75.3460% 81.70
EFED est im ated m ean for r isk assessm ent 85.0065% 88.4170% 96.0675% 105.6280% 116.9985% 132.6590% 154.9695% 198.72
EFED est im ated upper bound for r isk assessm ent 240.00100% 699.53
End of Forecast
Frequency Chart
mg/kg
.000
.007
.014
.021
.028
0
70.75
141.5
212.2
283
0.00 62.50 125.00 187.50 250.00
10,000 Trials 215 Outliers
Forecast: Short range grass distribution
Appendix J Terrestrial Residue Distribution

Page -228- Page 233 of239
Forecast: long grass distribution
Stat ist ics: ValueTrials 10000Mean 35.48EFED est im ated m ean for r isk assessm ent 36.00Median 23.76Mode ---Standard Deviat ion 40.41Variance 1,633.21Skewness 5.16Kurtosis 60.07Coeff. of Var iability 1.14Range Minim um 0.73Range Maxim um 918.61Range Width 917.89Mean Std. Error 0.40
Forecast: long grass distribution (cont.)Percent iles:
Percent ile m g/ kg0% 0.735% 5.29
10% 7.3415% 9.2420% 11.0225% 12.8230% 14.7235% 16.7840% 18.8945% 21.1650% 23.7655% 26.5560% 29.9065% 33.59
EFED est im ated m ean for r isk assessm ent 36.0070% 38.0775% 43.1980% 50.1285% 59.9190% 74.7895% 104.94
EFED est im ated upper bound for r isk assessm ent 110.00100% 918.61
End of Forecast
Frequency Chart
mg/kg
.000
.011
.021
.032
.042
0
105.2
210.5
315.7
421
0.00 37.50 75.00 112.50 150.00
10,000 Trials 191 Outliers
Forecast: long grass distribution

Page -229- Page 234 of239
Forecast: leaves,leafy crops distribution
Stat ist ics: ValueTrials 10000Mean 34.23EFED est im ated m ean for r isk assessm ent 45.00Median 21.15Mode ---Standard Deviat ion 43.12Variance 1,859.51Skewness 5.07Kurtosis 51.49Coeff. of Var iability 1.26Range Minim um 0.54Range Maxim um 845.60Range Width 845.06Mean Std. Error 0.43
Forecast: leaves,leafy crops distribution (cont.)Percent iles:
Percent ile m g/ kg0% 0.545% 4.32
10% 6.0515% 7.6420% 9.2925% 10.9630% 12.6935% 14.4340% 16.4145% 18.7150% 21.1555% 24.0660% 27.3265% 30.9870% 35.2675% 41.13
EFED est im ated m ean for r isk assessm ent 45.0080% 48.4585% 58.1790% 74.7795% 106.10
EFED est im ated upper bound for r isk assessm ent 135.00100% 845.60
End of Forecast
Frequency Chart
mg/kg
.000
.012
.024
.036
.048
0
119.2
238.5
357.7
477
0.00 37.50 75.00 112.50 150.00
10,000 Trials 223 Outliers
Forecast: leaves,leafy crops distribution

Page -230- Page 235 of239
Forecast: forage (legumes) distribution
Stat ist ics: ValueTrials 10000Mean 45.54EFED est im ated m ean for r isk assessm ent 45.00Median 28.28Mode ---Standard Deviat ion 57.97Variance 3,360.48Skewness 5.43Kurtosis 59.64Coeff. of Var iability 1.27Range Minim um 1.02Range Maxim um 1,247.08Range Width 1,246.06Mean Std. Error 0.58
Forecast: forage (legumes) distribution (cont.)Percent iles:
Percent ile m g/ kg0% 1.025% 5.53
10% 7.9015% 10.2020% 12.3425% 14.4630% 16.9535% 19.4540% 22.2045% 25.0750% 28.2855% 31.9760% 36.4665% 41.44
EFED est im ated m ean for r isk assessm ent 45.0070% 47.3275% 54.9180% 64.4685% 77.6190% 97.18
EFED est im ated upper bound for r isk assessm ent 135.0095% 142.26
100% 1,247.08
End of Forecast
Frequency Chart
mg/kg
.000
.012
.024
.036
.048
0
120.5
241
361.5
482
0.00 50.00 100.00 150.00 200.00
10,000 Trials 225 Outliers
Forecast: forage (legumes) distribution
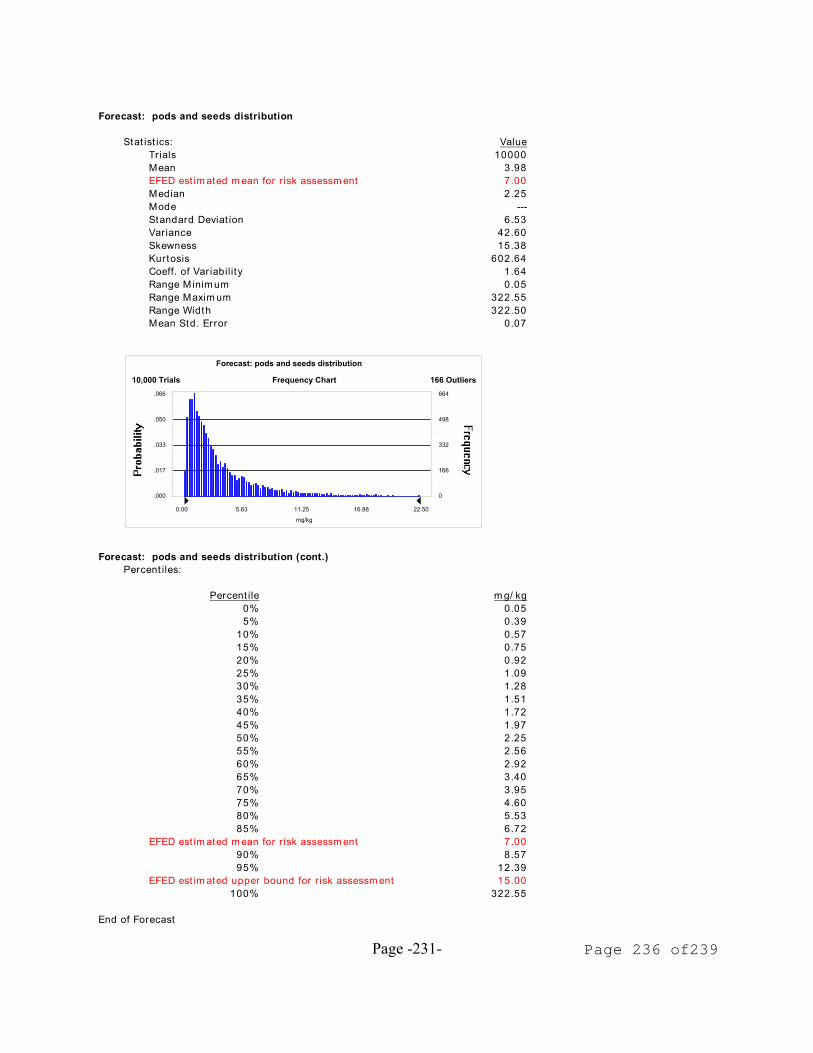
Page -231- Page 236 of239
Forecast: pods and seeds distribution
Stat ist ics: ValueTrials 10000Mean 3.98EFED est im ated m ean for r isk assessm ent 7.00Median 2.25Mode ---Standard Deviat ion 6.53Variance 42.60Skewness 15.38Kurtosis 602.64Coeff. of Var iability 1.64Range Minim um 0.05Range Maxim um 322.55Range Width 322.50Mean Std. Error 0.07
Forecast: pods and seeds distribution (cont.)Percent iles:
Percent ile m g/ kg0% 0.055% 0.39
10% 0.5715% 0.7520% 0.9225% 1.0930% 1.2835% 1.5140% 1.7245% 1.9750% 2.2555% 2.5660% 2.9265% 3.4070% 3.9575% 4.6080% 5.5385% 6.72
EFED est im ated m ean for r isk assessm ent 7.0090% 8.5795% 12.39
EFED est im ated upper bound for r isk assessm ent 15.00100% 322.55
End of Forecast
Frequency Chart
mg/kg
.000
.017
.033
.050
.066
0
166
332
498
664
0.00 5.63 11.25 16.88 22.50
10,000 Trials 166 Outliers
Forecast: pods and seeds distribution

Page -232- Page 237 of239
Forecast: fruit distribution
Stat ist ics: ValueTrials 10000Mean 5.60EFED est im ated m ean for r isk assessm ent 7.00Median 2.63Mode ---Standard Deviat ion 10.38Variance 107.83Skewness 8.93Kurtosis 154.26Coeff. of Var iability 1.85Range Minim um 0.04Range Maxim um 309.87Range Width 309.83Mean Std. Error 0.10
Forecast: fruit distribution (cont.)Percent iles:
Percent ile m g/ kg0% 0.045% 0.35
10% 0.5515% 0.7520% 0.9525% 1.1530% 1.3835% 1.6440% 1.9245% 2.2450% 2.6355% 3.0660% 3.5965% 4.2370% 5.0975% 6.11
EFED est im ated m ean for r isk assessm ent 7.0080% 7.4485% 9.4590% 12.43
EFED est im ated upper bound for r isk assessm ent 15.0095% 20.02
100% 309.87
End of Forecast
Frequency Chart
mg/kg
.000
.022
.044
.067
.089
0
221.7
443.5
665.2
887
0.00 8.75 17.50 26.25 35.00
10,000 Trials 173 Outliers
Forecast: fruit distribution

Page -233- Page 238 of239
Forecast: woody fruit distribution
Stat ist ics: ValueTrials 10000Mean 6.58EFED est im ated m ean for r isk assessm ent 7.00Median 3.14Mode ---Standard Deviat ion 11.87Variance 140.91Skewness 10.29Kurtosis 222.42Coeff. of Var iability 1.81Range Minim um 0.03Range Maxim um 381.81Range Width 381.79Mean Std. Error 0.12
Forecast: woody fruit distribution (cont.)Percent iles:
Percent ile m g/ kg0% 0.035% 0.44
10% 0.6815% 0.9220% 1.1625% 1.3930% 1.6435% 1.9740% 2.3045% 2.6750% 3.1455% 3.6660% 4.2765% 5.0870% 6.02
EFED est im ated m ean for r isk assessm ent 7.0075% 7.2580% 8.7985% 11.20
EFED est im ated upper bound for r isk assessm ent 15.0090% 15.2895% 23.10
100% 381.81
End of Forecast
Frequency Chart
mg/kg
.000
.021
.042
.064
.085
0
211.7
423.5
635.2
847
0.00 10.00 20.00 30.00 40.00
10,000 Trials 175 Outliers
Forecast: woody fruit distribution

Page -234- Page 239 of239
Forecast: herbaceous fruit
Stat ist ics: ValueTrials 10000Mean 3.65EFED est im ated m ean for r isk assessm ent 7.00Median 2.33Mode ---Standard Deviat ion 4.36Variance 19.05Skewness 5.11Kurtosis 60.56Coeff. of Var iability 1.20Range Minim um 0.06Range Maxim um 98.83Range Width 98.77Mean Std. Error 0.04
Forecast: herbaceous fruit (cont.)Percent iles:
Percent ile m g/ kg0% 0.065% 0.49
10% 0.6815% 0.8720% 1.0625% 1.2430% 1.4235% 1.6240% 1.8345% 2.0850% 2.3355% 2.6260% 2.9665% 3.3670% 3.8275% 4.4280% 5.2185% 6.25
EFED est im ated m ean for r isk assessm ent 7.0090% 7.8195% 11.21
EFED est im ated upper bound for r isk assessm ent 15.00100% 98.83
End of Forecast
Frequency Chart
mg/kg
.000
.012
.024
.036
.048
0
120.5
241
361.5
482
0.00 4.38 8.75 13.13 17.50
10,000 Trials 176 Outliers
Forecast: herbaceous fruit