pisa 2012 data tables, figures, and exhibits
TRANSCRIPT

PISA 2012 Data Tables, Figures, and Exhibits
Page
Exhibit M1 Description of PISA proficiency levels on mathematics literacy scale: 2012........................................................... 1
Table M1 Percentage distribution of 15-year-old students on PISA mathematics literacy scale, by proficiency level and education system: 2012 .......................................................................................................................................... 2
Figure M1a Percentage of 15-year-old students performing at PISA mathematics literacy proficiency levels 5 and above and below level 2, by education system: 2012 ........................................................................................................ 3
Table M1b Percentage of 15-year-old students performing at PISA mathematics literacy proficiency levels 5 and above and below level 2, by education system: 2012 ........................................................................................................ 4
Table M2 Percentage distribution of 15-year-old students on PISA mathematics literacy content subscales, by proficiency level and education system: 2012 ......................................................................................................... 5
Table M3 Percentage distribution of 15-year-old students on PISA mathematics literacy process subscales, by proficiency level and education system: 2012 ......................................................................................................... 9
Table M4 Average scores of 15-year-old students on PISA mathematics literacy scale, by education system: 2012 ........... 12
Table M5 Average scores of 15-year-old students on PISA mathematics literacy content subscales, by education system: 2012 ........................................................................................................................................................... 13
Table M6 Average scores of 15-year-old students on PISA mathematics literacy process subscales, by education system: 2012 ........................................................................................................................................................... 14
Table M7 Cut scores of 15-year-old students on PISA mathematics literacy scale at selected percentiles and percentile cut score gaps, by education system: 2012 ............................................................................................................ 15
Figure M2a Difference in average scores of 15-year-old female and male students on PISA mathematics literacy scale, by education system: 2012 ..................................................................................................................................... 16
Table M2b Difference in average scores of 15-year-old female and male students on PISA mathematics literacy scale, by education system: 2012 ..................................................................................................................................... 17
Table M8 Average scores of 15-year-old students on PISA mathematics literacy scale, by national quarters of the PISA index of economic, social and cultural status (ESCS) and education system: 2012 ............................................... 18
Table M9 Percentage distribution of U.S. 15-year-old public school students on PISA mathematics literacy scale, by proficiency level and percentage of students in enrolled schools eligible for free or reduced-price lunch, based on principals' reports: 2012 .......................................................................................................................... 19
Table M10 Average scores of U.S. 15-year-old public school students on PISA mathematics literacy scale, by percentage of students in enrolled schools eligible for free or reduced-price lunch, based on principals' reports: 2012 ........................................................................................................................................................... 20
Table M11 Percentage distribution of U.S. 15-year-old students on PISA mathematics literacy scale, by proficiency level and race/ethnicity: 2012 .......................................................................................................................................... 21
Table M12 Average scores of U.S. 15-year-old students on PISA mathematics literacy scale, by race/ethnicity: 2012 .......... 22
i
PISA 2012 Data Tables, Figures, and Exhibits
Page
Exhibit S1 Description of PISA proficiency levels on science literacy scale: 2012 ................................................................... 23
Table S1 Percentage distribution of 15-year-old students on PISA science literacy scale, by proficiency level and education system: 2012 .......................................................................................................................................... 24
Figure S1a Percentage of 15-year-old students performing at PISA science literacy proficiency levels 5 and above and below level 2, by education system: 2012 ............................................................................................................... 25
Table S1b Percentage of 15-year-old students performing at PISA science literacy proficiency levels 5 and above and below level 2, by education system: 2012 ............................................................................................................... 26
Table S2 Average scores of 15-year-old students on PISA science literacy scale, by education system: 2012 ................... 27
Table S3 Cut scores of 15-year-old students on PISA science literacy scale at selected percentiles and percentile cut score gaps, by education system: 2012 .................................................................................................................. 28
Figure S2a Difference in average scores of 15-year-old female and male students on PISA science literacy scale, by education system: 2012 .......................................................................................................................................... 29
Table S2b Difference in average scores of 15-year-old female and male students on PISA science literacy scale, by education system: 2012 .......................................................................................................................................... 30
Table S4 Percentage distribution of U.S. 15-year-old public school students on PISA science literacy scale, by proficiency level and percentage of students in enrolled schools eligible for free or reduced-price lunch, based on principals' reports: 2012 .......................................................................................................................... 31
Table S5 Average scores of U.S. 15-year-old public school students on PISA science literacy scale, by percentage of students in enrolled schools eligible for free or reduced-price lunch, based on principals' reports: 2012 ............... 32
Table S6 Percentage distribution of U.S. 15-year-old students on PISA science literacy scale, by proficiency level and race/ethnicity: 2012 ................................................................................................................................................. 33
Table S7 Average scores of U.S. 15-year-old students on PISA science literacy scale, by race/ethnicity: 2012 .................. 34
Exhibit R1 Description of PISA proficiency levels on reading literacy scale: 2012 ................................................................... 35
Table R1 Percentage distribution of 15-year-old students on PISA reading literacy scale, by proficiency level and education system: 2012 .......................................................................................................................................... 36
Figure R1a Percentage of 15-year-old students performing at PISA reading literacy proficiency levels 5 and above and below level 2, by education system: 2012 ............................................................................................................... 37
Table R1b Percentage of 15-year-old students performing at PISA reading literacy proficiency levels 5 and above and below level 2, by education system: 2012 ............................................................................................................... 38
Table R2 Average scores of 15-year-old students on PISA reading literacy scale, by education system: 2012 .................... 39
Table R3 Cut scores of 15-year-old students on PISA reading literacy scale at selected percentiles and percentile cut score gaps, by education system: 2012 .................................................................................................................. 40
ii
PISA 2012 Data Tables, Figures, and Exhibits
Page
Figure R2a Difference in average scores of 15-year-old female and male students on PISA reading literacy scale, by education system: 2012 .......................................................................................................................................... 41
Table R2b Difference in average scores of 15-year-old female and male students on PISA reading literacy scale, by education system: 2012 .......................................................................................................................................... 42
Table R4 Percentage distribution of U.S. 15-year-old public school students on PISA reading literacy scale, by proficiency level and percentage of students in enrolled schools eligible for free or reduced-price lunch, based on principals' reports: 2012 .......................................................................................................................... 43
Table R5 Average scores of U.S. 15-year-old public school students on PISA reading literacy scale, by percentage of students in enrolled schools eligible for free or reduced-price lunch, based on principals' reports: 2012 ............... 44
Table R6 Percentage distribution of U.S. 15-year-old students on PISA reading literacy scale, by proficiency level and race/ethnicity: 2012 ................................................................................................................................................. 45
Table R7 Average scores of U.S. 15-year-old students on PISA reading literacy scale, by race/ethnicity: 2012 ................ 46
Table T1 Average scores and changes in average scores of U.S. 15-year-old students on PISA mathematics, science, and reading literacy scales: 2000, 2003, 2006, 2009, and 2012 ............................................................................. 47
Figure T1a Cut scores of U.S. 15-year-old students on PISA mathematics literacy scale at selected percentiles: 2003, 2006, 2009, and 2012 ............................................................................................................................................. 48
Table T1b Cut scores of U.S. 15-year-old students on PISA mathematics literacy scale at selected percentiles: 2003, 2006, 2009, and 2012 ............................................................................................................................................. 49
Figure T2a Cut scores of U.S. 15-year-old students on PISA science literacy scale at selected percentiles: 2006, 2009, and 2012 ................................................................................................................................................................. 50
Table T2b Cut scores of U.S. 15-year-old students on PISA science literacy scale at selected percentiles: 2006, 2009, and 2012 ................................................................................................................................................................. 51
Figure T3a Cut scores of U.S. 15-year-old students on PISA reading literacy scale at selected percentiles: 2000, 2003, 2006, 2009, and 2012 ............................................................................................................................................. 52
Table T3b Cut scores of U.S. 15-year-old students on PISA reading literacy scale at selected percentiles: 2000, 2003, 2009, and 2012 ....................................................................................................................................................... 53
Table T2 Average scores and changes in average scores of 15-year-old students on PISA mathematics literacy scale, by education system: 2003, 2006, 2009, and 2012 ................................................................................................ 54
Table T3 Average scores and changes in average scores of 15-year-old students on PISA science literacy scale, by education system: 2006, 2009, and 2012 ............................................................................................................... 55
Table T4 Average scores and changes in average scores of 15-year-old students on PISA reading literacy scale, by education system: 2000, 2003, 2006, 2009, and 2012 ........................................................................................... 56
iii
PISA 2012 Data Tables, Figures, and Exhibits
Page
Table CM1 Percentage distribution of 15-year-old students on PISA computer-based mathematics literacy scale, by proficiency level and education system: 2012 ......................................................................................................... 57
Table CM2 Average scores of 15-year-old students on PISA computer-based mathematics literacy scale, by education system: 2012 ........................................................................................................................................................... 58
Figure CM1a Difference in average scores of 15-year-old female and male students on PISA computer-based mathematics literacy scale, by education system: 2012 ......................................................................................... 59
Table CM1b Difference in average scores of 15-year-old female and male students on PISA computer-based mathematics literacy scale, by education system: 2012 ......................................................................................... 60
Exhibit CR1 Description of PISA proficiency levels on computer-based reading literacy scale: 2012 ........................................ 61
Table CR1 Percentage distribution of 15-year-old students on PISA computer-based reading literacy scale, by proficiency level and education system: 2012 ......................................................................................................... 62
Table CR2 Average scores of 15-year-old students on PISA computer-based reading literacy scale, by education system: 2012 ........................................................................................................................................................... 63
Figure CR1a Difference in average scores of 15-year-old female and male students on PISA computer-based reading literacy scale, by education system: 2012 ............................................................................................................... 64
Table CR1b Difference in average scores of 15-year-old female and male students on PISA computer-based reading literacy scale, by education system: 2012 ............................................................................................................... 65
Table A1 Average scores of 15-year-old students on PISA mathematics literacy scale in Connecticut public schools compared with other participating education systems: 2012 .................................................................................. 66
Table A2 Average scores of 15-year-old students on PISA mathematics literacy scale in Connecticut public schools, by various subgroups: 2012 ......................................................................................................................................... 67
Table A3 Average scores of 15-year-old students on PISA science literacy scale in Connecticut public schools compared with other participating education systems: 2012 .................................................................................. 68
Table A4 Average scores of 15-year-old students on PISA science literacy scale in Connecticut public schools, by various subgroups: 2012 ......................................................................................................................................... 69
Table A5 Average scores of 15-year-old students on PISA reading literacy scale in Connecticut public schools compared with other participating education systems: 2012 .................................................................................. 70
Table A6 Average scores of 15-year-old students on PISA reading literacy scale in Connecticut public schools, by various subgroups: 2012 ......................................................................................................................................... 71
Table A7 Average scores of 15-year-old students on PISA mathematics literacy scale in Florida public schools compared with other participating education systems: 2012 .................................................................................. 72
Table A8 Average scores of 15-year-old students on PISA mathematics literacy scale in Florida public schools, by various subgroups: 2012 ......................................................................................................................................... 73
iv
PISA 2012 Data Tables, Figures, and Exhibits
Page
Table A9 Average scores of 15-year-old students on PISA science literacy scale in Florida public schools compared with other participating education systems: 2012 ................................................................................................... 74
Table A10 Average scores of 15-year-old students on PISA science literacy scale in Florida public schools, by various subgroups: 2012 ..................................................................................................................................................... 75
Table A11 Average scores of 15-year-old students on PISA reading literacy scale in Florida public schools compared with other participating education systems: 2012 ................................................................................................... 76
Table A12 Average scores of 15-year-old students on PISA reading literacy scale in Florida public schools, by various subgroups: 2012 ..................................................................................................................................................... 77
Table A13 Average scores of 15-year-old students on PISA mathematics literacy scale in Massachusetts public schools compared with other participating education systems: 2012 .................................................................................. 78
Table A14 Average scores of 15-year-old students on PISA mathematics literacy scale in Massachusetts public schools, by various subgroups: 2012 .................................................................................................................................... 79
Table A15 Average scores of 15-year-old students on PISA science literacy scale in Massachusetts public schools compared with other participating education systems: 2012 .................................................................................. 80
Table A16 Average scores of 15-year-old students on PISA science literacy scale in Massachusetts public schools, by various subgroups: 2012 ......................................................................................................................................... 81
Table A17 Average scores of 15-year-old students on PISA reading literacy scale in Massachusetts public schools compared with other participating education systems: 2012 .................................................................................. 82
Table A18 Average scores of 15-year-old students on PISA reading literacy scale in Massachusetts public schools, by various subgroups: 2012 ......................................................................................................................................... 83
Table AA1 Percentage distribution of U.S. 15-year-old students, by grade level: 2012 ........................................................... 84
Table AA2 Cut scores for proficiency levels for mathematics, science, and reading literacy: 2012 ......................................... 85
Table AB1 Number of schools and weighted participation rates, by education system: 2012 .................................................. 86
Table AB2 Coverage of target population, student exclusion and weighted participation rates, and number of students, by education system: 2012 ..................................................................................................................................... 87
v
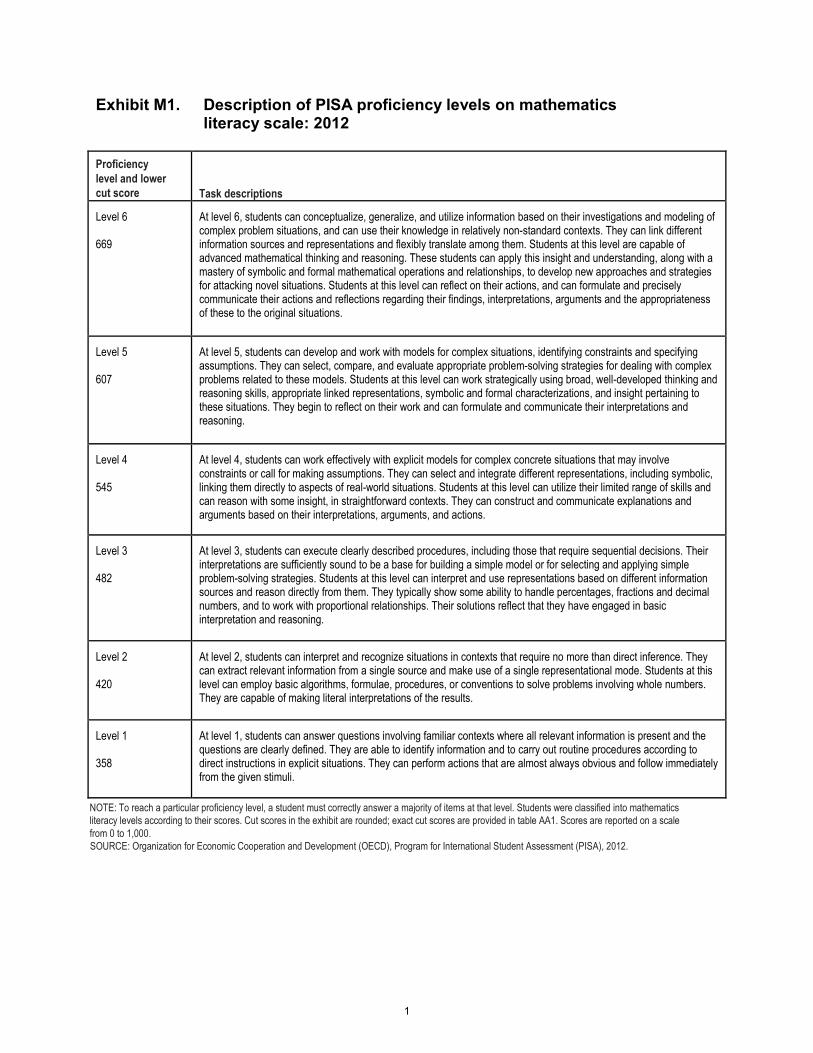
Exhibit M1. Description of PISA proficiency levels on mathematics literacy scale: 2012
Proficiency level and lower cut score Task descriptions
Level 6
669
At level 6, students can conceptualize, generalize, and utilize information based on their investigations and modeling of complex problem situations, and can use their knowledge in relatively non-standard contexts. They can link different information sources and representations and flexibly translate among them. Students at this level are capable of advanced mathematical thinking and reasoning. These students can apply this insight and understanding, along with a mastery of symbolic and formal mathematical operations and relationships, to develop new approaches and strategies for attacking novel situations. Students at this level can reflect on their actions, and can formulate and precisely communicate their actions and reflections regarding their findings, interpretations, arguments and the appropriateness of these to the original situations.
Level 5
607
At level 5, students can develop and work with models for complex situations, identifying constraints and specifying assumptions. They can select, compare, and evaluate appropriate problem-solving strategies for dealing with complex problems related to these models. Students at this level can work strategically using broad, well-developed thinking and reasoning skills, appropriate linked representations, symbolic and formal characterizations, and insight pertaining to these situations. They begin to reflect on their work and can formulate and communicate their interpretations and reasoning.
Level 4
545
At level 4, students can work effectively with explicit models for complex concrete situations that may involve constraints or call for making assumptions. They can select and integrate different representations, including symbolic, linking them directly to aspects of real-world situations. Students at this level can utilize their limited range of skills and can reason with some insight, in straightforward contexts. They can construct and communicate explanations and arguments based on their interpretations, arguments, and actions.
Level 3
482
At level 3, students can execute clearly described procedures, including those that require sequential decisions. Their interpretations are sufficiently sound to be a base for building a simple model or for selecting and applying simple problem-solving strategies. Students at this level can interpret and use representations based on different information sources and reason directly from them. They typically show some ability to handle percentages, fractions and decimal numbers, and to work with proportional relationships. Their solutions reflect that they have engaged in basic interpretation and reasoning.
Level 2
420
At level 2, students can interpret and recognize situations in contexts that require no more than direct inference. They can extract relevant information from a single source and make use of a single representational mode. Students at this level can employ basic algorithms, formulae, procedures, or conventions to solve problems involving whole numbers. They are capable of making literal interpretations of the results.
Level 1
358
At level 1, students can answer questions involving familiar contexts where all relevant information is present and the questions are clearly defined. They are able to identify information and to carry out routine procedures according to direct instructions in explicit situations. They can perform actions that are almost always obvious and follow immediately from the given stimuli.
NOTE: To reach a particular proficiency level, a student must correctly answer a majority of items at that level. Students were classified into mathematics literacy levels according to their scores. Cut scores in the exhibit are rounded; exact cut scores are provided in table AA1. Scores are reported on a scale from 0 to 1,000. SOURCE: Organization for Economic Cooperation and Development (OECD), Program for International Student Assessment (PISA), 2012.
1
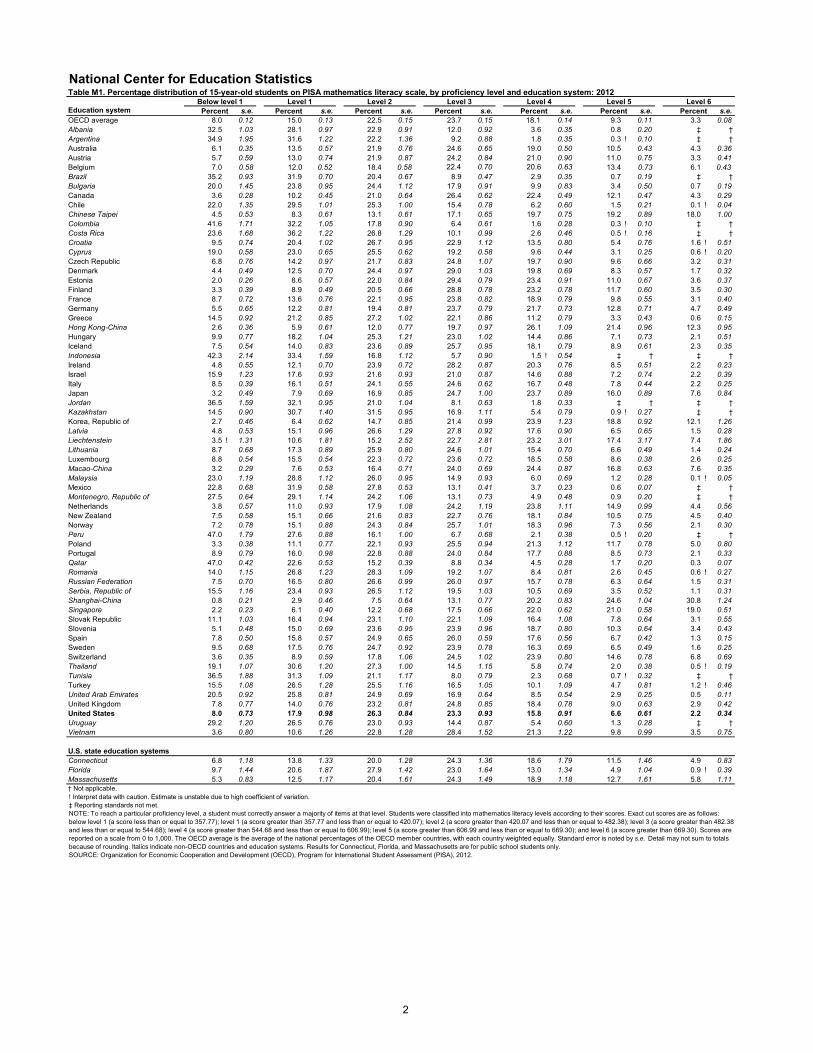
National Center for Education StatisticsTable M1. Percentage distribution of 15-year-old students on PISA mathematics literacy scale, by proficiency level and education system: 2012
Education systemBelow level 1 Level 1 Level 2 Level 3 Level 4 Level 5 Level 6Percent s.e. Percent s.e. Percent s.e. Percent s.e. Percent s.e. Percent s.e. Percent s.e.
OECD average 8.0 0.12 15.0 0.13 22.5 0.15 23.7 0.15 18.1 0.14 9.3 0.11 3.3 0.08Albania 32.5 1.03 28.1 0.97 22.9 0.91 12.0 0.92 3.6 0.35 0.8 0.20 ‡ †Argentina 34.9 1.95 31.6 1.22 22.2 1.36 9.2 0.88 1.8 0.35 0.3 ! 0.10 ‡ †Australia 6.1 0.35 13.5 0.57 21.9 0.76 24.6 0.65 19.0 0.50 10.5 0.43 4.3 0.36Austria 5.7 0.59 13.0 0.74 21.9 0.87 24.2 0.84 21.0 0.90 11.0 0.75 3.3 0.41Belgium 7.0 0.58 12.0 0.52 18.4 0.58 22.4 0.70 20.6 0.63 13.4 0.73 6.1 0.43 Brazil 35.2 0.93 31.9 0.70 20.4 0.67 8.9 0.47 2.9 0.35 0.7 0.19 ‡ †Bulgaria 20.0 1.45 23.8 0.95 24.4 1.12 17.9 0.91 9.9 0.83 3.4 0.50 0.7 0.19Canada 3.6 0.28 10.2 0.45 21.0 0.64 26.4 0.62 22.4 0.49 12.1 0.47 4.3 0.29Chile 22.0 1.35 29.5 1.01 25.3 1.00 15.4 0.78 6.2 0.60 1.5 0.21 0.1 ! 0.04Chinese Taipei 4.5 0.53 8.3 0.61 13.1 0.61 17.1 0.65 19.7 0.75 19.2 0.89 18.0 1.00Colombia 41.6 1.71 32.2 1.05 17.8 0.90 6.4 0.61 1.6 0.28 0.3 ! 0.10 ‡ †Costa Rica 23.6 1.68 36.2 1.22 26.8 1.29 10.1 0.99 2.6 0.46 0.5 ! 0.16 ‡ †Croatia 9.5 0.74 20.4 1.02 26.7 0.95 22.9 1.12 13.5 0.80 5.4 0.76 1.6 ! 0.51Cyprus 19.0 0.58 23.0 0.65 25.5 0.62 19.2 0.58 9.6 0.44 3.1 0.25 0.6 ! 0.20Czech Republic 6.8 0.76 14.2 0.97 21.7 0.83 24.8 1.07 19.7 0.90 9.6 0.66 3.2 0.31Denmark 4.4 0.49 12.5 0.70 24.4 0.97 29.0 1.03 19.8 0.69 8.3 0.57 1.7 0.32Estonia 2.0 0.26 8.6 0.57 22.0 0.84 29.4 0.79 23.4 0.91 11.0 0.67 3.6 0.37Finland 3.3 0.39 8.9 0.49 20.5 0.66 28.8 0.78 23.2 0.78 11.7 0.60 3.5 0.30France 8.7 0.72 13.6 0.76 22.1 0.95 23.8 0.82 18.9 0.79 9.8 0.55 3.1 0.40Germany 5.5 0.65 12.2 0.81 19.4 0.81 23.7 0.79 21.7 0.73 12.8 0.71 4.7 0.49Greece 14.5 0.92 21.2 0.85 27.2 1.02 22.1 0.86 11.2 0.79 3.3 0.43 0.6 0.15Hong Kong-China 2.6 0.36 5.9 0.61 12.0 0.77 19.7 0.97 26.1 1.09 21.4 0.96 12.3 0.95Hungary 9.9 0.77 18.2 1.04 25.3 1.21 23.0 1.02 14.4 0.86 7.1 0.73 2.1 0.51Iceland 7.5 0.54 14.0 0.83 23.6 0.89 25.7 0.95 18.1 0.79 8.9 0.61 2.3 0.35Indonesia 42.3 2.14 33.4 1.59 16.8 1.12 5.7 0.90 1.5 ! 0.54 ‡ † ‡ †Ireland 4.8 0.55 12.1 0.70 23.9 0.72 28.2 0.87 20.3 0.76 8.5 0.51 2.2 0.23Israel 15.9 1.23 17.6 0.93 21.6 0.93 21.0 0.87 14.6 0.88 7.2 0.74 2.2 0.39Italy 8.5 0.39 16.1 0.51 24.1 0.55 24.6 0.62 16.7 0.48 7.8 0.44 2.2 0.25Japan 3.2 0.49 7.9 0.69 16.9 0.85 24.7 1.00 23.7 0.89 16.0 0.89 7.6 0.84Jordan 36.5 1.59 32.1 0.95 21.0 1.04 8.1 0.63 1.8 0.33 ‡ † ‡ †Kazakhstan 14.5 0.90 30.7 1.40 31.5 0.95 16.9 1.11 5.4 0.79 0.9 ! 0.27 ‡ †Korea, Republic of 2.7 0.46 6.4 0.62 14.7 0.85 21.4 0.99 23.9 1.23 18.8 0.92 12.1 1.26Latvia 4.8 0.53 15.1 0.96 26.6 1.29 27.8 0.92 17.6 0.90 6.5 0.65 1.5 0.28Liechtenstein 3.5 ! 1.31 10.6 1.81 15.2 2.52 22.7 2.81 23.2 3.01 17.4 3.17 7.4 1.86Lithuania 8.7 0.68 17.3 0.89 25.9 0.80 24.6 1.01 15.4 0.70 6.6 0.49 1.4 0.24Luxembourg 8.8 0.54 15.5 0.54 22.3 0.72 23.6 0.72 18.5 0.58 8.6 0.38 2.6 0.25Macao-China 3.2 0.29 7.6 0.53 16.4 0.71 24.0 0.69 24.4 0.87 16.8 0.63 7.6 0.35Malaysia 23.0 1.19 28.8 1.12 26.0 0.95 14.9 0.93 6.0 0.69 1.2 0.28 0.1 ! 0.05Mexico 22.8 0.68 31.9 0.58 27.8 0.53 13.1 0.41 3.7 0.23 0.6 0.07 ‡ †Montenegro, Republic of 27.5 0.64 29.1 1.14 24.2 1.06 13.1 0.73 4.9 0.48 0.9 0.20 ‡ †Netherlands 3.8 0.57 11.0 0.93 17.9 1.08 24.2 1.19 23.8 1.11 14.9 0.99 4.4 0.56New Zealand 7.5 0.58 15.1 0.66 21.6 0.83 22.7 0.76 18.1 0.84 10.5 0.75 4.5 0.40Norway 7.2 0.78 15.1 0.88 24.3 0.84 25.7 1.01 18.3 0.96 7.3 0.56 2.1 0.30Peru 47.0 1.79 27.6 0.88 16.1 1.00 6.7 0.68 2.1 0.38 0.5 ! 0.20 ‡ †Poland 3.3 0.38 11.1 0.77 22.1 0.93 25.5 0.94 21.3 1.12 11.7 0.78 5.0 0.80Portugal 8.9 0.79 16.0 0.98 22.8 0.88 24.0 0.84 17.7 0.88 8.5 0.73 2.1 0.33Qatar 47.0 0.42 22.6 0.53 15.2 0.39 8.8 0.34 4.5 0.28 1.7 0.20 0.3 0.07Romania 14.0 1.15 26.8 1.23 28.3 1.09 19.2 1.07 8.4 0.81 2.6 0.45 0.6 ! 0.27Russian Federation 7.5 0.70 16.5 0.80 26.6 0.99 26.0 0.97 15.7 0.78 6.3 0.64 1.5 0.31Serbia, Republic of 15.5 1.16 23.4 0.93 26.5 1.12 19.5 1.03 10.5 0.69 3.5 0.52 1.1 0.31Shanghai-China 0.8 0.21 2.9 0.46 7.5 0.64 13.1 0.77 20.2 0.83 24.6 1.04 30.8 1.24Singapore 2.2 0.23 6.1 0.40 12.2 0.68 17.5 0.66 22.0 0.62 21.0 0.58 19.0 0.51Slovak Republic 11.1 1.03 16.4 0.94 23.1 1.10 22.1 1.09 16.4 1.08 7.8 0.64 3.1 0.55Slovenia 5.1 0.48 15.0 0.69 23.6 0.95 23.9 0.96 18.7 0.80 10.3 0.64 3.4 0.43Spain 7.8 0.50 15.8 0.57 24.9 0.65 26.0 0.59 17.6 0.56 6.7 0.42 1.3 0.15Sweden 9.5 0.68 17.5 0.76 24.7 0.92 23.9 0.78 16.3 0.69 6.5 0.49 1.6 0.25Switzerland 3.6 0.35 8.9 0.59 17.8 1.06 24.5 1.02 23.9 0.80 14.6 0.78 6.8 0.69Thailand 19.1 1.07 30.6 1.20 27.3 1.00 14.5 1.15 5.8 0.74 2.0 0.38 0.5 ! 0.19Tunisia 36.5 1.88 31.3 1.09 21.1 1.17 8.0 0.79 2.3 0.68 0.7 ! 0.32 ‡ †Turkey 15.5 1.08 26.5 1.28 25.5 1.16 16.5 1.05 10.1 1.09 4.7 0.81 1.2 ! 0.46United Arab Emirates 20.5 0.92 25.8 0.81 24.9 0.69 16.9 0.64 8.5 0.54 2.9 0.25 0.5 0.11United Kingdom 7.8 0.77 14.0 0.76 23.2 0.81 24.8 0.85 18.4 0.78 9.0 0.63 2.9 0.42United States 8.0 0.73 17.9 0.98 26.3 0.84 23.3 0.93 15.8 0.91 6.6 0.61 2.2 0.34Uruguay 29.2 1.20 26.5 0.76 23.0 0.93 14.4 0.87 5.4 0.60 1.3 0.28 ‡ †Vietnam 3.6 0.80 10.6 1.26 22.8 1.28 28.4 1.52 21.3 1.22 9.8 0.99 3.5 0.75
U.S. state education systemsConnecticut 6.8 1.18 13.8 1.33 20.0 1.28 24.3 1.36 18.6 1.79 11.5 1.46 4.9 0.83Florida 9.7 1.44 20.6 1.87 27.9 1.42 23.0 1.64 13.0 1.34 4.9 1.04 0.9 ! 0.39Massachusetts 5.3 0.83 12.5 1.17 20.4 1.61 24.3 1.49 18.9 1.18 12.7 1.61 5.8 1.11† Not applicable.! Interpret data with caution. Estimate is unstable due to high coefficient of variation.‡ Reporting standards not met.NOTE: To reach a particular proficiency level, a student must correctly answer a majority of items at that level. Students were classified into mathematics literacy levels according to their scores. Exact cut scores are as follows: below level 1 (a score less than or equal to 357.77); level 1 (a score greater than 357.77 and less than or equal to 420.07); level 2 (a score greater than 420.07 and less than or equal to 482.38); level 3 (a score greater than 482.38 and less than or equal to 544.68); level 4 (a score greater than 544.68 and less than or equal to 606.99); level 5 (a score greater than 606.99 and less than or equal to 669.30); and level 6 (a score greater than 669.30). Scores are reported on a scale from 0 to 1,000. The OECD average is the average of the national percentages of the OECD member countries, with each country weighted equally. Standard error is noted by s.e. Detail may not sum to totals because of rounding. Italics indicate non-OECD countries and education systems. Results for Connecticut, Florida, and Massachusetts are for public school students only. SOURCE: Organization for Economic Cooperation and Development (OECD), Program for International Student Assessment (PISA), 2012.
2

National Center for Education StatisticsFigure M1a. Percentage of 15-year-old students performing at PISA mathematics literacy proficiency levels 5 and above and below level 2, by education system: 2012
Education systemBelow level 2
Levels 5 and above
OECD average 23* is below level 2 13* is level 5 and above
Shanghai-China 4* is below level 2 55* is level 5 and above
Singapore
8* is below level 2 40* is level 5 and above
Chinese Taipei
13* is below level 2 37* is level 5 and above
Hong Kong-China 9* is below level 2 34* is level 5 and above
Korea, Republic of 9* is below level 2 31* is level 5 and above
Liechtenstein
14* is below level 2 25* is level 5 and above
Macao-China
11* is below level 2 24* is level 5 and above
Japan 11* is below level 2 24* is level 5 and above
Switzerland 12* is below level 2 21* is level 5 and above
Belgium 19* is below level 2 20* is level 5 and above
Netherlands 15* is below level 2 19* is level 5 and above
Germany 18* is below level 2 17* is level 5 and above
Poland 14* is below level 2 17* is level 5 and above
Canada 14* is below level 2 16* is level 5 and above
Finland 12* is below level 2 15* is level 5 and above
New Zealand 23* is below level 2 15* is level 5 and above
Australia 20* is below level 2 15* is level 5 and above
Estonia 11* is below level 2 15* is level 5 and above
Austria 19* is below level 2 14* is level 5 and above
Slovenia 20* is below level 2 14* is level 5 and above
Vietnam
14* is below level 2 13* is level 5 and above
France 22* is below level 2 13* is level 5 and above
Czech Republic 21* is below level 2 13* is level 5 and above
United Kingdom 22* is below level 2 12* is level 5 and above
Luxembourg 24 is below level 2 11* is level 5 and above
Iceland 21* is below level 2 11* is level 5 and above
Slovak Republic 27 is below level 2 11 is level 5 and above
Ireland 17* is below level 2 11* is level 5 and above
Portugal 25 is below level 2 11 is level 5 and above
Denmark 17* is below level 2 10 is level 5 and above
Italy 25 is below level 2 10 is level 5 and above
Norway 22* is below level 2 9 is level 5 and above
Israel 34* is below level 2 9 is level 5 and above
Hungary 28 is below level 2 9 is level 5 and above
United States 26 is below level 2 9 is level 5 and above
Lithuania 26 is below level 2 8 is level 5 and above
Education systemBelow level 2
Levels 5 and above
Sweden 27 is below level 2 8 is level 5 and above
Spain 24 is below level 2 8 is level 5 and above
Latvia
20* is below level 2 8 is level 5 and above
Russian Federation
24 is below level 2 8 is level 5 and above
Croatia
30* is below level 2 7 is level 5 and above
Turkey 42* is below level 2 6* is level 5 and above
Serbia, Republic of 39* is below level 2 5* is level 5 and above
Bulgaria
44* is below level 2 4* is level 5 and above
Greece 36* is below level 2 4* is level 5 and above
Cyprus
42* is below level 2 4* is level 5 and above
United Arab Emirates
46* is below level 2 3* is level 5 and above
Romania
41* is below level 2 3* is level 5 and above
Thailand
50* is below level 2 3* is level 5 and above
Qatar
70* is below level 2 2* is level 5 and above
Chile 52* is below level 2 2* is level 5 and above
Uruguay
56* is below level 2 1* is level 5 and above
Malaysia
52* is below level 2 1* is level 5 and above
Montenegro, Republic of
57* is below level 2 1* is level 5 and above
Kazakhstan
45* is below level 2 1 !* is level 5 and above
Albania
61* is below level 2 1* is level 5 and above
Tunisia
68* is below level 2 1!* is level 5 and above
Brazil
67* is below level 2 1* is level 5 and above
Mexico 55* is below level 2 1* is level 5 and above
Peru
75* is below level 2 1 ! * is level 5 and above
Costa Rica
60* is below level 2 1 ! * is level 5 and above
Jordan
69* is below level 2 1‡ is level 5 and above
Colombia
74* is below level 2 #! * is above level 5
Indonesia
76* is below level 2 ‡ is above level 5
Argentina
66* is below level 2 #! * is above level 5
U.S. state education systems
Massachusetts 18* is below level 2 19* is level 5 and above
Connecticut 21* is below level 2 16* is level 5 and above
Florida 30 is below level 2 6* is level 5 and above
Below level 2 Levels 5 and above
# Rounds to zero.! Interpret with caution. Estimate is unstable due to high coefficient of variation.‡ Reporting standards not met.* p < .05. Significantly different from the U.S. percentage at the .05 level of significance.NOTE: Education systems are ordered by 2012 percentages of 15-year-olds in levels 5 and above. To reach a particular proficiency level, a student must correctly answer a majority of items at that level. Students were classified into mathematics proficiency levels according to their scores. Cut scores for each proficiency level can be found in table A-1 in appendix A. The OECD average is the average of the national percentages of the OECD member countries, with each country weighted equally. Italics indicate non-OECD countries and education systems. Results for Connecticut, Florida, and Massachusetts are for public school students only. The standard errors of the estimates are shown in table M1b available at http://nces.ed.gov/pubsearch/pubsinfo.asp?pubid=2014024.SOURCE: Organization for Economic Cooperation and Development (OECD), Program for International Student Assessment (PISA), 2012.
0 20 40 60 80 100 0 20 40 60 80 100Percent Percent
Percent0 20 40 60 80 100
23 134 *
*55
8 * 4013 * 379 * 349 * 31
14 * 2511 * 2411 * 2412 * 2119 * 2015 * 1918 * 1714 * 1714 * 1612 * 1523 * 1520 * 1511 * 1519 * 1420 * 1414 * 1322 * 1321 *
*
*
1322 1224 1121 1127 1117 1125 1117 1025 1022 *
*
*
*9
34 928 926 926 8
888876 *5 *4 *4 *4 *3 *3 *3 *2 *2 *1 *1 *1 *1 !*1 *1 !*1 *1 *1 !*1 !*‡# !*‡# !*
19 *16 *
6 *
2724202430 *42 *39 *44 *36 *42 *46 *41 *50 *70 *52 *56 *52 *57 *45 *61 *68 *67 *55 *75 *60 *
****
69747666
18 *21 *30
**
***********************
*
*
*
*
3
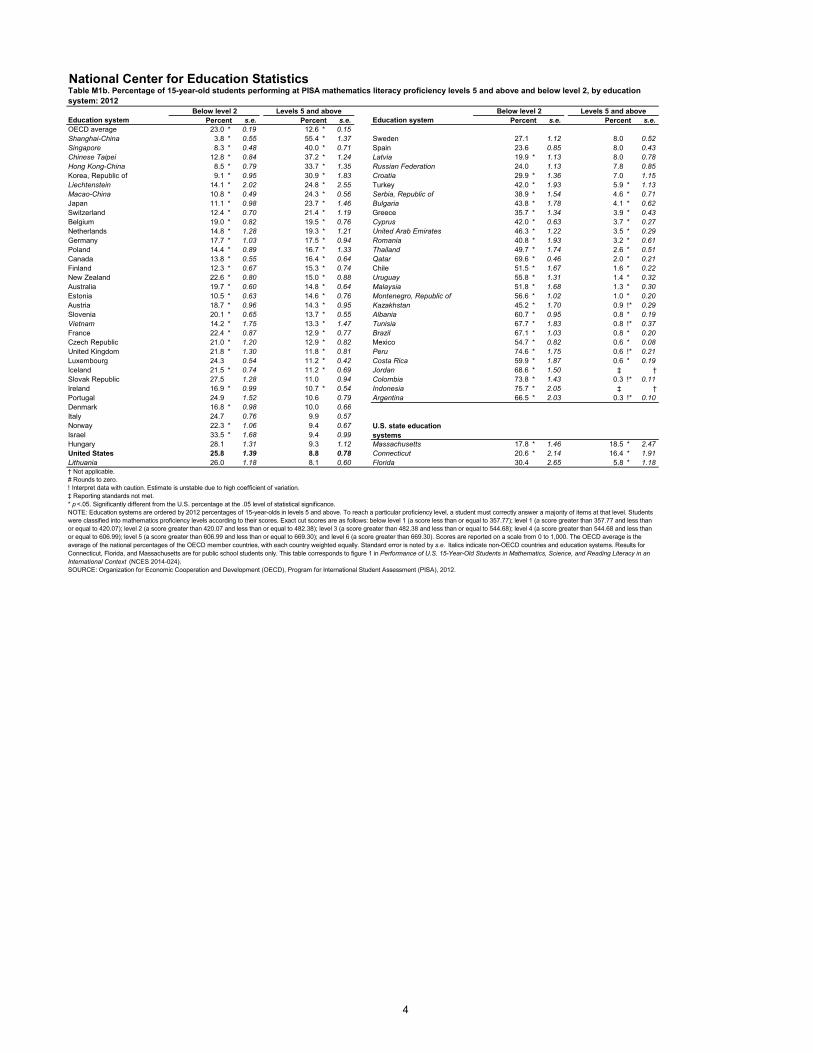
National Center for Education StatisticsTable M1b. Percentage of 15-year-old students performing at PISA mathematics literacy proficiency levels 5 and above and below level 2, by education system: 2012
Education systemBelow level 2 Levels 5 and above Below level 2 Levels 5 and above
Percent s.e. Percent s.e. Education system Percent s.e. Percent s.e.OECD average 23.0 * 0.19 12.6 * 0.15Shanghai-China 3.8 * 0.55 55.4 * 1.37Singapore 8.3 * 0.48 40.0 * 0.71Chinese Taipei 12.8 * 0.84 37.2 * 1.24Hong Kong-China 8.5 * 0.79 33.7 * 1.35Korea, Republic of 9.1 * 0.95 30.9 * 1.83Liechtenstein 14.1 * 2.02 24.8 * 2.55Macao-China 10.8 * 0.49 24.3 * 0.56Japan 11.1 * 0.98 23.7 * 1.46Switzerland 12.4 * 0.70 21.4 * 1.19Belgium 19.0 * 0.82 19.5 * 0.76Netherlands 14.8 * 1.28 19.3 * 1.21Germany 17.7 * 1.03 17.5 * 0.94Poland 14.4 * 0.89 16.7 * 1.33Canada 13.8 * 0.55 16.4 * 0.64Finland 12.3 * 0.67 15.3 * 0.74New Zealand 22.6 * 0.80 15.0 * 0.88Australia 19.7 * 0.60 14.8 * 0.64Estonia 10.5 * 0.63 14.6 * 0.76Austria 18.7 * 0.96 14.3 * 0.95Slovenia 20.1 * 0.65 13.7 * 0.55Vietnam 14.2 * 1.75 13.3 * 1.47France 22.4 * 0.87 12.9 * 0.77Czech Republic 21.0 * 1.20 12.9 * 0.82United Kingdom 21.8 * 1.30 11.8 * 0.81Luxembourg 24.3 0.54 11.2 * 0.42Iceland 21.5 * 0.74 11.2 * 0.69Slovak Republic 27.5 1.28 11.0 0.94Ireland 16.9 * 0.99 10.7 * 0.54Portugal 24.9 1.52 10.6 0.79Denmark 16.8 * 0.98 10.0 0.66Italy 24.7 0.76 9.9 0.57Norway 22.3 * 1.06 9.4 0.67Israel 33.5 * 1.68 9.4 0.99Hungary 28.1 1.31 9.3 1.12United States 25.8 1.39 8.8 0.78Lithuania 26.0 1.18 8.1 0.60
Sweden 27.1 1.12 8.0 0.52Spain 23.6 0.85 8.0 0.43Latvia 19.9 * 1.13 8.0 0.78Russian Federation 24.0 1.13 7.8 0.85Croatia 29.9 * 1.36 7.0 1.15Turkey 42.0 * 1.93 5.9 * 1.13Serbia, Republic of 38.9 * 1.54 4.6 * 0.71Bulgaria 43.8 * 1.78 4.1 * 0.62Greece 35.7 * 1.34 3.9 * 0.43Cyprus 42.0 * 0.63 3.7 * 0.27United Arab Emirates 46.3 * 1.22 3.5 * 0.29Romania 40.8 * 1.93 3.2 * 0.61Thailand 49.7 * 1.74 2.6 * 0.51Qatar 69.6 * 0.46 2.0 * 0.21Chile 51.5 * 1.67 1.6 * 0.22Uruguay 55.8 * 1.31 1.4 * 0.32Malaysia 51.8 * 1.68 1.3 * 0.30Montenegro, Republic of 56.6 * 1.02 1.0 * 0.20Kazakhstan 45.2 * 1.70 0.9 !* 0.29Albania 60.7 * 0.95 0.8 * 0.19Tunisia 67.7 * 1.83 0.8 !* 0.37Brazil 67.1 * 1.03 0.8 * 0.20Mexico 54.7 * 0.82 0.6 * 0.08Peru 74.6 * 1.75 0.6 !* 0.21Costa Rica 59.9 * 1.87 0.6 * 0.19Jordan 68.6 * 1.50 ‡ †Colombia 73.8 * 1.43 0.3 !* 0.11Indonesia 75.7 * 2.05 ‡ †Argentina 66.5 * 2.03 0.3 !* 0.10
U.S. state education systemsMassachusetts 17.8 * 1.46 18.5 * 2.47Connecticut 20.6 * 2.14 16.4 * 1.91Florida 30.4 2.65 5.8 * 1.18
† Not applicable.# Rounds to zero.! Interpret data with caution. Estimate is unstable due to high coefficient of variation.‡ Reporting standards not met.* p <.05. Significantly different from the U.S. percentage at the .05 level of statistical significance.NOTE: Education systems are ordered by 2012 percentages of 15-year-olds in levels 5 and above. To reach a particular proficiency level, a student must correctly answer a majority of items at that level. Students were classified into mathematics proficiency levels according to their scores. Exact cut scores are as follows: below level 1 (a score less than or equal to 357.77); level 1 (a score greater than 357.77 and less than or equal to 420.07); level 2 (a score greater than 420.07 and less than or equal to 482.38); level 3 (a score greater than 482.38 and less than or equal to 544.68); level 4 (a score greater than 544.68 and less than or equal to 606.99); level 5 (a score greater than 606.99 and less than or equal to 669.30); and level 6 (a score greater than 669.30). Scores are reported on a scale from 0 to 1,000. The OECD average is the average of the national percentages of the OECD member countries, with each country weighted equally. Standard error is noted by s.e. Italics indicate non-OECD countries and education systems. Results for Connecticut, Florida, and Massachusetts are for public school students only. This table corresponds to figure 1 in Performance of U.S. 15-Year-Old Students in Mathematics, Science, and Reading Literacy in an International Context (NCES 2014-024).SOURCE: Organization for Economic Cooperation and Development (OECD), Program for International Student Assessment (PISA), 2012.
4
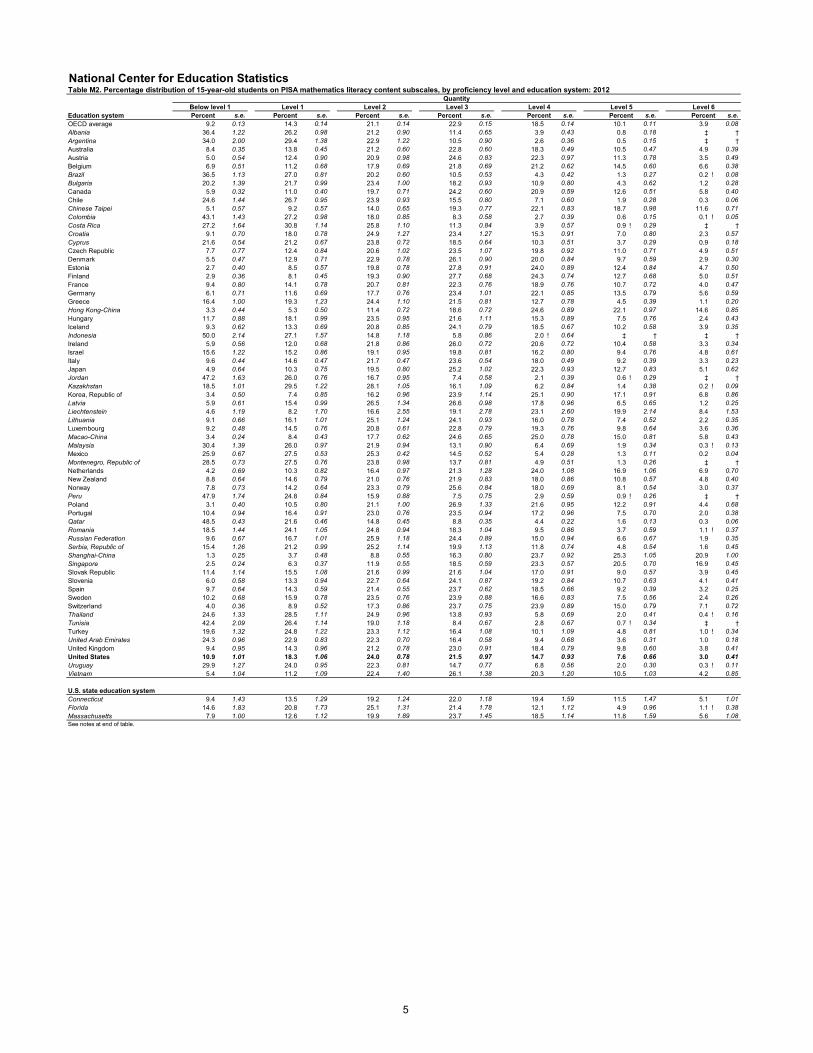
National Center for Education StatisticsTable M2. Percentage distribution of 15-year-old students on PISA mathematics literacy content subscales, by proficiency level and education system: 2012
Education system
QuantityBelow level 1 Level 1 Level 2 Level 3 Level 4 Level 5 Level 6Percent s.e. Percent s.e. Percent s.e. Percent s.e. Percent s.e. Percent s.e. Percent s.e.
OECD average 9.2 0.13 14.3 0.14 21.1 0.14 22.9 0.15 18.5 0.14 10.1 0.11 3.9 0.08Albania 36.4 1.22 26.2 0.98 21.2 0.90 11.4 0.65 3.9 0.43 0.8 0.18 ‡ †Argentina 34.0 2.00 29.4 1.38 22.9 1.22 10.5 0.90 2.6 0.36 0.5 0.15 ‡ †Australia 8.4 0.35 13.8 0.45 21.2 0.60 22.8 0.60 18.3 0.49 10.5 0.47 4.9 0.39Austria 5.0 0.54 12.4 0.90 20.9 0.98 24.6 0.83 22.3 0.97 11.3 0.78 3.5 0.49Belgium 6.9 0.51 11.2 0.68 17.9 0.69 21.8 0.69 21.2 0.62 14.5 0.60 6.6 0.38Brazil 36.5 1.13 27.0 0.81 20.2 0.60 10.5 0.53 4.3 0.42 1.3 0.27 0.2 ! 0.08Bulgaria 20.2 1.39 21.7 0.99 23.4 1.00 18.2 0.93 10.9 0.80 4.3 0.62 1.2 0.28Canada 5.9 0.32 11.0 0.40 19.7 0.71 24.2 0.60 20.9 0.59 12.6 0.51 5.8 0.40Chile 24.6 1.44 26.7 0.95 23.9 0.93 15.5 0.80 7.1 0.60 1.9 0.28 0.3 0.06Chinese Taipei 5.1 0.57 9.2 0.57 14.0 0.65 19.3 0.77 22.1 0.83 18.7 0.98 11.6 0.71Colombia 43.1 1.43 27.2 0.98 18.0 0.85 8.3 0.58 2.7 0.39 0.6 0.15 0.1 ! 0.05Costa Rica 27.2 1.64 30.8 1.14 25.8 1.10 11.3 0.84 3.9 0.57 0.9 ! 0.29 ‡ †Croatia 9.1 0.70 18.0 0.78 24.9 1.27 23.4 1.27 15.3 0.91 7.0 0.80 2.3 0.57Cyprus 21.6 0.54 21.2 0.67 23.8 0.72 18.5 0.64 10.3 0.51 3.7 0.29 0.9 0.18Czech Republic 7.7 0.77 12.4 0.84 20.6 1.02 23.5 1.07 19.8 0.92 11.0 0.71 4.9 0.51Denmark 5.5 0.47 12.9 0.71 22.9 0.78 26.1 0.90 20.0 0.84 9.7 0.59 2.9 0.30Estonia 2.7 0.40 8.5 0.57 19.8 0.78 27.8 0.91 24.0 0.89 12.4 0.84 4.7 0.50Finland 2.9 0.36 8.1 0.45 19.3 0.90 27.7 0.68 24.3 0.74 12.7 0.68 5.0 0.51France 9.4 0.80 14.1 0.78 20.7 0.81 22.3 0.76 18.9 0.76 10.7 0.72 4.0 0.47Germany 6.1 0.71 11.6 0.69 17.7 0.76 23.4 1.01 22.1 0.85 13.5 0.79 5.6 0.59Greece 16.4 1.00 19.3 1.23 24.4 1.10 21.5 0.81 12.7 0.78 4.5 0.39 1.1 0.20Hong Kong-China 3.3 0.44 5.3 0.50 11.4 0.72 18.6 0.72 24.6 0.89 22.1 0.97 14.6 0.85Hungary 11.7 0.88 18.1 0.99 23.5 0.95 21.6 1.11 15.3 0.89 7.5 0.76 2.4 0.43Iceland 9.3 0.62 13.3 0.69 20.8 0.85 24.1 0.79 18.5 0.67 10.2 0.58 3.9 0.35Indonesia 50.0 2.14 27.1 1.57 14.8 1.18 5.8 0.86 2.0 ! 0.64 ‡ † ‡ †Ireland 5.9 0.56 12.0 0.68 21.8 0.86 26.0 0.72 20.6 0.72 10.4 0.58 3.3 0.34Israel 15.6 1.22 15.2 0.86 19.1 0.95 19.8 0.81 16.2 0.80 9.4 0.76 4.8 0.61Italy 9.6 0.44 14.6 0.47 21.7 0.47 23.6 0.54 18.0 0.49 9.2 0.39 3.3 0.23Japan 4.9 0.64 10.3 0.75 19.5 0.80 25.2 1.02 22.3 0.93 12.7 0.83 5.1 0.62Jordan 47.2 1.63 26.0 0.76 16.7 0.95 7.4 0.58 2.1 0.39 0.6 ! 0.29 ‡ †Kazakhstan 18.5 1.01 29.5 1.22 28.1 1.05 16.1 1.09 6.2 0.84 1.4 0.38 0.2 ! 0.09Korea, Republic of 3.4 0.50 7.4 0.85 16.2 0.96 23.9 1.14 25.1 0.90 17.1 0.91 6.8 0.86Latvia 5.9 0.61 15.4 0.99 26.5 1.34 26.6 0.98 17.8 0.96 6.5 0.65 1.2 0.25Liechtenstein 4.6 1.19 8.2 1.70 16.6 2.55 19.1 2.78 23.1 2.60 19.9 2.14 8.4 1.53Lithuania 9.1 0.66 16.1 1.01 25.1 1.24 24.1 0.93 16.0 0.78 7.4 0.52 2.2 0.35Luxembourg 9.2 0.48 14.5 0.76 20.8 0.61 22.8 0.79 19.3 0.76 9.8 0.64 3.6 0.36Macao-China 3.4 0.24 8.4 0.43 17.7 0.62 24.6 0.65 25.0 0.78 15.0 0.81 5.8 0.43Malaysia 30.4 1.39 26.0 0.97 21.9 0.94 13.1 0.90 6.4 0.69 1.9 0.34 0.3 ! 0.13Mexico 25.9 0.67 27.5 0.53 25.3 0.42 14.5 0.52 5.4 0.28 1.3 0.11 0.2 0.04Montenegro, Republic of 28.5 0.73 27.5 0.76 23.8 0.98 13.7 0.81 4.9 0.51 1.3 0.26 ‡ †Netherlands 4.2 0.69 10.3 0.82 16.4 0.97 21.3 1.28 24.0 1.08 16.9 1.06 6.9 0.70New Zealand 8.8 0.64 14.6 0.79 21.0 0.76 21.9 0.83 18.0 0.86 10.8 0.57 4.8 0.40Norway 7.8 0.73 14.2 0.64 23.3 0.79 25.6 0.84 18.0 0.69 8.1 0.54 3.0 0.37Peru 47.9 1.74 24.8 0.84 15.9 0.88 7.5 0.75 2.9 0.59 0.9 ! 0.26 ‡ †Poland 3.1 0.40 10.5 0.80 21.1 1.00 26.9 1.33 21.6 0.95 12.2 0.91 4.4 0.68Portugal 10.4 0.94 16.4 0.91 23.0 0.76 23.5 0.94 17.2 0.96 7.5 0.70 2.0 0.38Qatar 48.5 0.43 21.6 0.46 14.8 0.45 8.8 0.35 4.4 0.22 1.6 0.13 0.3 0.06Romania 18.5 1.44 24.1 1.05 24.8 0.94 18.3 1.04 9.5 0.86 3.7 0.59 1.1 ! 0.37Russian Federation 9.6 0.67 16.7 1.01 25.9 1.18 24.4 0.89 15.0 0.94 6.6 0.67 1.9 0.35Serbia, Republic of 15.4 1.26 21.2 0.99 25.2 1.14 19.9 1.13 11.8 0.74 4.8 0.54 1.6 0.45Shanghai-China 1.3 0.25 3.7 0.48 8.8 0.55 16.3 0.80 23.7 0.92 25.3 1.05 20.9 1.00Singapore 2.5 0.24 6.3 0.37 11.9 0.55 18.5 0.59 23.3 0.57 20.5 0.70 16.9 0.45Slovak Republic 11.4 1.14 15.5 1.08 21.6 0.99 21.6 1.04 17.0 0.91 9.0 0.57 3.9 0.45Slovenia 6.0 0.58 13.3 0.94 22.7 0.64 24.1 0.87 19.2 0.84 10.7 0.63 4.1 0.41Spain 9.7 0.64 14.3 0.59 21.4 0.55 23.7 0.62 18.5 0.66 9.2 0.39 3.2 0.25Sweden 10.2 0.68 15.9 0.78 23.5 0.76 23.9 0.88 16.6 0.83 7.5 0.56 2.4 0.26Switzerland 4.0 0.36 8.9 0.52 17.3 0.86 23.7 0.75 23.9 0.89 15.0 0.79 7.1 0.72Thailand 24.6 1.33 28.5 1.11 24.9 0.96 13.8 0.93 5.8 0.69 2.0 0.41 0.4 ! 0.16Tunisia 42.4 2.09 26.4 1.14 19.0 1.18 8.4 0.67 2.8 0.67 0.7 ! 0.34 ‡ †Turkey 19.6 1.32 24.8 1.22 23.3 1.12 16.4 1.08 10.1 1.09 4.8 0.81 1.0 ! 0.34United Arab Emirates 24.3 0.96 22.9 0.83 22.3 0.70 16.4 0.58 9.4 0.68 3.6 0.31 1.0 0.18United Kingdom 9.4 0.95 14.3 0.96 21.2 0.78 23.0 0.91 18.4 0.79 9.8 0.60 3.8 0.41United States 10.9 1.01 18.3 1.06 24.0 0.78 21.5 0.97 14.7 0.93 7.6 0.66 3.0 0.41Uruguay 29.9 1.27 24.0 0.95 22.3 0.81 14.7 0.77 6.8 0.56 2.0 0.30 0.3 ! 0.11Vietnam 5.4 1.04 11.2 1.09 22.4 1.40 26.1 1.38 20.3 1.20 10.5 1.03 4.2 0.85
U.S. state education systemConnecticut 9.4 1.43 13.5 1.29 19.2 1.24 22.0 1.18 19.4 1.59 11.5 1.47 5.1 1.01Florida 14.6 1.83 20.8 1.73 25.1 1.31 21.4 1.78 12.1 1.12 4.9 0.96 1.1 ! 0.38Massachusetts 7.9 1.00 12.6 1.12 19.9 1.89 23.7 1.45 18.5 1.14 11.8 1.59 5.6 1.08See notes at end of table.
5
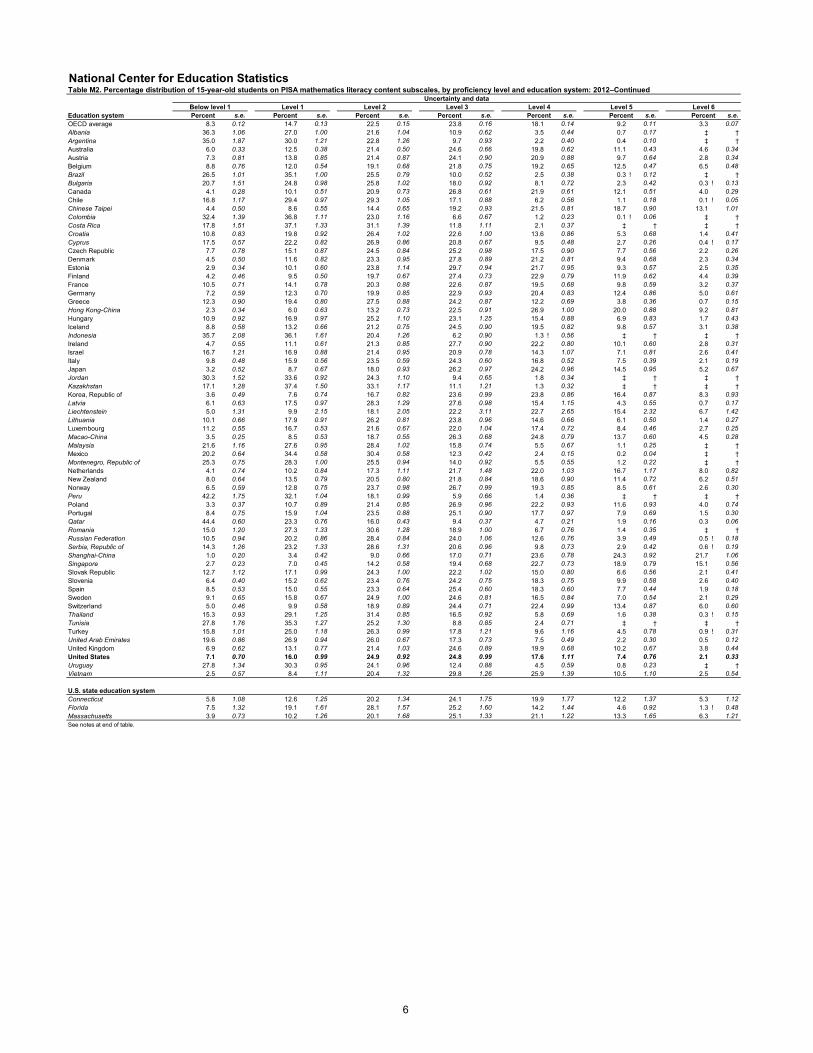
National Center for Education StatisticsTable M2. Percentage distribution of 15-year-old students on PISA mathematics literacy content subscales, by proficiency level and education system: 2012–Continued
Education system
Uncertainty and dataBelow level 1 Level 1 Level 2 Level 3 Level 4 Level 5 Level 6Percent s.e. Percent s.e. Percent s.e. Percent s.e. Percent s.e. Percent s.e. Percent s.e.
OECD average 8.3 0.12 14.7 0.13 22.5 0.15 23.8 0.16 18.1 0.14 9.2 0.11 3.3 0.07Albania 36.3 1.06 27.0 1.00 21.6 1.04 10.9 0.62 3.5 0.44 0.7 0.17 ‡ †Argentina 35.0 1.87 30.0 1.21 22.8 1.26 9.7 0.93 2.2 0.40 0.4 0.10 ‡ †Australia 6.0 0.33 12.5 0.38 21.4 0.50 24.6 0.66 19.8 0.62 11.1 0.43 4.6 0.34Austria 7.3 0.81 13.8 0.85 21.4 0.87 24.1 0.90 20.9 0.88 9.7 0.64 2.8 0.34Belgium 8.8 0.76 12.0 0.54 19.1 0.68 21.8 0.75 19.2 0.65 12.5 0.47 6.5 0.48Brazil 26.5 1.01 35.1 1.00 25.5 0.79 10.0 0.52 2.5 0.38 0.3 ! 0.12 ‡ †Bulgaria 20.7 1.51 24.8 0.98 25.8 1.02 18.0 0.92 8.1 0.72 2.3 0.42 0.3 ! 0.13Canada 4.1 0.28 10.1 0.51 20.9 0.73 26.8 0.61 21.9 0.61 12.1 0.51 4.0 0.29Chile 16.8 1.17 29.4 0.97 29.3 1.05 17.1 0.88 6.2 0.56 1.1 0.18 0.1 ! 0.05Chinese Taipei 4.4 0.50 8.6 0.55 14.4 0.65 19.2 0.93 21.5 0.81 18.7 0.90 13.1 1.01Colombia 32.4 1.39 36.8 1.11 23.0 1.16 6.6 0.67 1.2 0.23 0.1 ! 0.06 ‡ †Costa Rica 17.8 1.51 37.1 1.33 31.1 1.39 11.8 1.11 2.1 0.37 ‡ † ‡ †Croatia 10.8 0.83 19.8 0.92 26.4 1.02 22.6 1.00 13.6 0.86 5.3 0.68 1.4 0.41Cyprus 17.5 0.57 22.2 0.82 26.9 0.86 20.8 0.67 9.5 0.48 2.7 0.26 0.4 ! 0.17Czech Republic 7.7 0.78 15.1 0.87 24.5 0.84 25.2 0.98 17.5 0.90 7.7 0.56 2.2 0.26Denmark 4.5 0.50 11.6 0.82 23.3 0.95 27.8 0.89 21.2 0.81 9.4 0.68 2.3 0.34Estonia 2.9 0.34 10.1 0.60 23.8 1.14 29.7 0.94 21.7 0.95 9.3 0.57 2.5 0.35Finland 4.2 0.46 9.5 0.50 19.7 0.67 27.4 0.73 22.9 0.79 11.9 0.62 4.4 0.39France 10.5 0.71 14.1 0.78 20.3 0.88 22.6 0.87 19.5 0.68 9.8 0.59 3.2 0.37Germany 7.2 0.59 12.3 0.70 19.9 0.85 22.9 0.93 20.4 0.83 12.4 0.86 5.0 0.61Greece 12.3 0.90 19.4 0.80 27.5 0.88 24.2 0.87 12.2 0.69 3.8 0.36 0.7 0.15Hong Kong-China 2.3 0.34 6.0 0.63 13.2 0.73 22.5 0.91 26.9 1.00 20.0 0.88 9.2 0.81Hungary 10.9 0.92 16.9 0.97 25.2 1.10 23.1 1.25 15.4 0.88 6.9 0.83 1.7 0.43Iceland 8.8 0.58 13.2 0.66 21.2 0.75 24.5 0.90 19.5 0.82 9.8 0.57 3.1 0.38Indonesia 35.7 2.08 36.1 1.61 20.4 1.26 6.2 0.90 1.3 ! 0.56 ‡ † ‡ †Ireland 4.7 0.55 11.1 0.61 21.3 0.85 27.7 0.90 22.2 0.80 10.1 0.60 2.8 0.31Israel 16.7 1.21 16.9 0.88 21.4 0.95 20.9 0.78 14.3 1.07 7.1 0.81 2.6 0.41Italy 9.8 0.48 15.9 0.56 23.5 0.59 24.3 0.60 16.8 0.52 7.5 0.39 2.1 0.19Japan 3.2 0.52 8.7 0.67 18.0 0.93 26.2 0.97 24.2 0.96 14.5 0.95 5.2 0.67Jordan 30.3 1.52 33.6 0.92 24.3 1.10 9.4 0.65 1.8 0.34 ‡ † ‡ †Kazakhstan 17.1 1.28 37.4 1.50 33.1 1.17 11.1 1.21 1.3 0.32 ‡ † ‡ †Korea, Republic of 3.6 0.49 7.6 0.74 16.7 0.82 23.6 0.99 23.8 0.86 16.4 0.87 8.3 0.93Latvia 6.1 0.63 17.5 0.97 28.3 1.29 27.6 0.98 15.4 1.15 4.3 0.55 0.7 0.17Liechtenstein 5.0 1.31 9.9 2.15 18.1 2.05 22.2 3.11 22.7 2.65 15.4 2.32 6.7 1.42Lithuania 10.1 0.66 17.9 0.91 26.2 0.81 23.8 0.96 14.6 0.66 6.1 0.50 1.4 0.27Luxembourg 11.2 0.55 16.7 0.53 21.6 0.67 22.0 1.04 17.4 0.72 8.4 0.46 2.7 0.25Macao-China 3.5 0.25 8.5 0.53 18.7 0.55 26.3 0.68 24.8 0.79 13.7 0.60 4.5 0.28Malaysia 21.6 1.16 27.6 0.95 28.4 1.02 15.8 0.74 5.5 0.67 1.1 0.25 ‡ †Mexico 20.2 0.64 34.4 0.58 30.4 0.58 12.3 0.42 2.4 0.15 0.2 0.04 ‡ †Montenegro, Republic of 25.3 0.75 28.3 1.00 25.5 0.94 14.0 0.92 5.5 0.55 1.2 0.22 ‡ †Netherlands 4.1 0.74 10.2 0.84 17.3 1.11 21.7 1.48 22.0 1.03 16.7 1.17 8.0 0.82New Zealand 8.0 0.64 13.5 0.79 20.5 0.80 21.8 0.84 18.6 0.90 11.4 0.72 6.2 0.51Norway 6.5 0.59 12.8 0.75 23.7 0.98 26.7 0.99 19.3 0.85 8.5 0.61 2.6 0.30Peru 42.2 1.75 32.1 1.04 18.1 0.99 5.9 0.66 1.4 0.36 ‡ † ‡ †Poland 3.3 0.37 10.7 0.89 21.4 0.85 26.9 0.96 22.2 0.93 11.6 0.93 4.0 0.74Portugal 8.4 0.75 15.9 1.04 23.5 0.88 25.1 0.90 17.7 0.97 7.9 0.69 1.5 0.30Qatar 44.4 0.60 23.3 0.76 16.0 0.43 9.4 0.37 4.7 0.21 1.9 0.16 0.3 0.06Romania 15.0 1.20 27.3 1.33 30.6 1.28 18.9 1.00 6.7 0.76 1.4 0.35 ‡ †Russian Federation 10.5 0.94 20.2 0.86 28.4 0.84 24.0 1.06 12.6 0.76 3.9 0.49 0.5 ! 0.18Serbia, Republic of 14.3 1.26 23.2 1.33 28.6 1.31 20.6 0.96 9.8 0.73 2.9 0.42 0.6 ! 0.19Shanghai-China 1.0 0.20 3.4 0.42 9.0 0.66 17.0 0.71 23.6 0.78 24.3 0.92 21.7 1.06Singapore 2.7 0.23 7.0 0.45 14.2 0.58 19.4 0.68 22.7 0.73 18.9 0.79 15.1 0.56Slovak Republic 12.7 1.12 17.1 0.99 24.3 1.00 22.2 1.02 15.0 0.80 6.6 0.56 2.1 0.41Slovenia 6.4 0.40 15.2 0.62 23.4 0.76 24.2 0.75 18.3 0.75 9.9 0.58 2.6 0.40Spain 8.5 0.53 15.0 0.55 23.3 0.64 25.4 0.60 18.3 0.60 7.7 0.44 1.9 0.18Sweden 9.1 0.65 15.8 0.67 24.9 1.00 24.6 0.81 16.5 0.84 7.0 0.54 2.1 0.29Switzerland 5.0 0.46 9.9 0.58 18.9 0.89 24.4 0.71 22.4 0.99 13.4 0.87 6.0 0.60Thailand 15.3 0.93 29.1 1.25 31.4 0.85 16.5 0.92 5.8 0.69 1.6 0.38 0.3 ! 0.15Tunisia 27.8 1.76 35.3 1.27 25.2 1.30 8.8 0.85 2.4 0.71 ‡ † ‡ †Turkey 15.8 1.01 25.0 1.18 26.3 0.99 17.8 1.21 9.6 1.16 4.5 0.78 0.9 ! 0.31United Arab Emirates 19.6 0.86 26.9 0.94 26.0 0.67 17.3 0.73 7.5 0.49 2.2 0.30 0.5 0.12United Kingdom 6.9 0.62 13.1 0.77 21.4 1.03 24.6 0.89 19.9 0.68 10.2 0.67 3.8 0.44United States 7.1 0.70 16.0 0.99 24.9 0.92 24.8 0.99 17.6 1.11 7.4 0.76 2.1 0.33Uruguay 27.8 1.34 30.3 0.95 24.1 0.96 12.4 0.88 4.5 0.59 0.8 0.23 ‡ †Vietnam 2.5 0.57 8.4 1.11 20.4 1.32 29.8 1.26 25.9 1.39 10.5 1.10 2.5 0.54
U.S. state education systemConnecticut 5.8 1.08 12.6 1.25 20.2 1.34 24.1 1.75 19.9 1.77 12.2 1.37 5.3 1.12Florida 7.5 1.32 19.1 1.61 28.1 1.57 25.2 1.60 14.2 1.44 4.6 0.92 1.3 ! 0.48Massachusetts 3.9 0.73 10.2 1.26 20.1 1.68 25.1 1.33 21.1 1.22 13.3 1.65 6.3 1.21See notes at end of table.
6
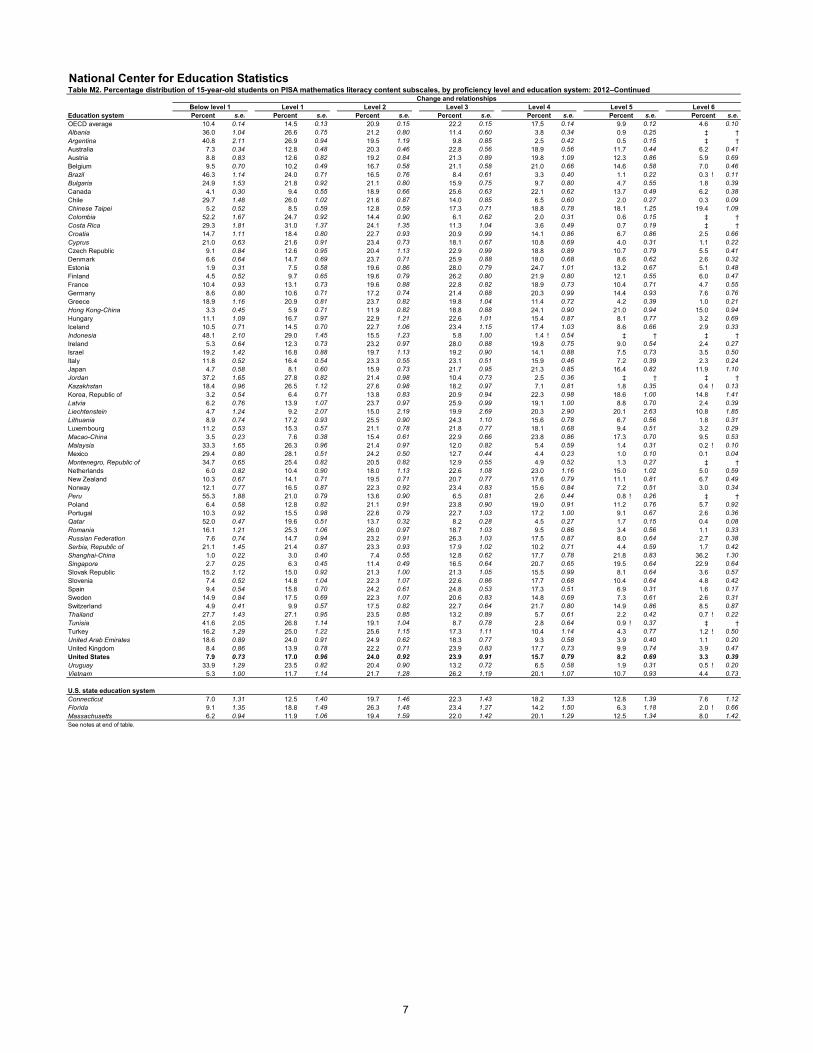
National Center for Education StatisticsTable M2. Percentage distribution of 15-year-old students on PISA mathematics literacy content subscales, by proficiency level and education system: 2012–Continued
Education system
Change and relationshipsBelow level 1 Level 1 Level 2 Level 3 Level 4 Level 5 Level 6Percent s.e. Percent s.e. Percent s.e. Percent s.e. Percent s.e. Percent s.e. Percent s.e.
OECD average 10.4 0.14 14.5 0.13 20.9 0.15 22.2 0.15 17.5 0.14 9.9 0.12 4.6 0.10Albania 36.0 1.04 26.6 0.75 21.2 0.80 11.4 0.60 3.8 0.34 0.9 0.25 ‡ †Argentina 40.8 2.11 26.9 0.94 19.5 1.19 9.8 0.85 2.5 0.42 0.5 0.15 ‡ †Australia 7.3 0.34 12.8 0.48 20.3 0.46 22.8 0.56 18.9 0.56 11.7 0.44 6.2 0.41Austria 8.8 0.83 12.6 0.82 19.2 0.84 21.3 0.89 19.8 1.09 12.3 0.86 5.9 0.69Belgium 9.5 0.70 10.2 0.49 16.7 0.58 21.1 0.58 21.0 0.66 14.6 0.58 7.0 0.46Brazil 46.3 1.14 24.0 0.71 16.5 0.76 8.4 0.61 3.3 0.40 1.1 0.22 0.3 ! 0.11Bulgaria 24.9 1.53 21.8 0.92 21.1 0.80 15.9 0.75 9.7 0.80 4.7 0.55 1.8 0.39Canada 4.1 0.30 9.4 0.55 18.9 0.66 25.6 0.63 22.1 0.62 13.7 0.49 6.2 0.38Chile 29.7 1.48 26.0 1.02 21.6 0.87 14.0 0.85 6.5 0.60 2.0 0.27 0.3 0.09Chinese Taipei 5.2 0.52 8.5 0.59 12.8 0.59 17.3 0.71 18.8 0.78 18.1 1.25 19.4 1.09Colombia 52.2 1.67 24.7 0.92 14.4 0.90 6.1 0.62 2.0 0.31 0.6 0.15 ‡ †Costa Rica 29.3 1.81 31.0 1.37 24.1 1.35 11.3 1.04 3.6 0.49 0.7 0.19 ‡ †Croatia 14.7 1.11 18.4 0.80 22.7 0.93 20.9 0.99 14.1 0.86 6.7 0.86 2.5 0.66Cyprus 21.0 0.63 21.6 0.91 23.4 0.73 18.1 0.67 10.8 0.69 4.0 0.31 1.1 0.22Czech Republic 9.1 0.84 12.6 0.95 20.4 1.13 22.9 0.99 18.8 0.89 10.7 0.79 5.5 0.41Denmark 6.6 0.64 14.7 0.69 23.7 0.71 25.9 0.88 18.0 0.68 8.6 0.62 2.6 0.32Estonia 1.9 0.31 7.5 0.58 19.6 0.86 28.0 0.79 24.7 1.01 13.2 0.67 5.1 0.48Finland 4.5 0.52 9.7 0.65 19.6 0.79 26.2 0.80 21.9 0.80 12.1 0.55 6.0 0.47France 10.4 0.93 13.1 0.73 19.6 0.88 22.8 0.82 18.9 0.73 10.4 0.71 4.7 0.55Germany 8.6 0.80 10.6 0.71 17.2 0.74 21.4 0.88 20.3 0.99 14.4 0.93 7.6 0.76Greece 18.9 1.16 20.9 0.81 23.7 0.82 19.8 1.04 11.4 0.72 4.2 0.39 1.0 0.21Hong Kong-China 3.3 0.45 5.9 0.71 11.9 0.82 18.8 0.88 24.1 0.90 21.0 0.94 15.0 0.94Hungary 11.1 1.09 16.7 0.97 22.9 1.21 22.6 1.01 15.4 0.87 8.1 0.77 3.2 0.69Iceland 10.5 0.71 14.5 0.70 22.7 1.06 23.4 1.15 17.4 1.03 8.6 0.66 2.9 0.33Indonesia 48.1 2.10 29.0 1.45 15.5 1.23 5.8 1.00 1.4 ! 0.54 ‡ † ‡ †Ireland 5.3 0.64 12.3 0.73 23.2 0.97 28.0 0.88 19.8 0.75 9.0 0.54 2.4 0.27Israel 19.2 1.42 16.8 0.88 19.7 1.13 19.2 0.90 14.1 0.88 7.5 0.73 3.5 0.50Italy 11.8 0.52 16.4 0.54 23.3 0.55 23.1 0.51 15.9 0.46 7.2 0.39 2.3 0.24Japan 4.7 0.58 8.1 0.60 15.9 0.73 21.7 0.95 21.3 0.85 16.4 0.82 11.9 1.10Jordan 37.2 1.65 27.8 0.82 21.4 0.98 10.4 0.73 2.5 0.36 ‡ † ‡ †Kazakhstan 18.4 0.96 26.5 1.12 27.6 0.98 18.2 0.97 7.1 0.81 1.8 0.35 0.4 ! 0.13Korea, Republic of 3.2 0.54 6.4 0.71 13.8 0.83 20.9 0.94 22.3 0.98 18.6 1.00 14.8 1.41Latvia 6.2 0.76 13.9 1.07 23.7 0.97 25.9 0.99 19.1 1.00 8.8 0.70 2.4 0.39Liechtenstein 4.7 1.24 9.2 2.07 15.0 2.19 19.9 2.69 20.3 2.90 20.1 2.63 10.8 1.85Lithuania 8.9 0.74 17.2 0.93 25.5 0.90 24.3 1.10 15.6 0.78 6.7 0.56 1.8 0.31Luxembourg 11.2 0.53 15.3 0.57 21.1 0.78 21.8 0.77 18.1 0.68 9.4 0.51 3.2 0.29Macao-China 3.5 0.23 7.6 0.38 15.4 0.61 22.9 0.66 23.8 0.86 17.3 0.70 9.5 0.53Malaysia 33.3 1.65 26.3 0.96 21.4 0.97 12.0 0.82 5.4 0.59 1.4 0.31 0.2 ! 0.10Mexico 29.4 0.80 28.1 0.51 24.2 0.50 12.7 0.44 4.4 0.23 1.0 0.10 0.1 0.04Montenegro, Republic of 34.7 0.65 25.4 0.82 20.5 0.82 12.9 0.55 4.9 0.52 1.3 0.27 ‡ †Netherlands 6.0 0.82 10.4 0.90 18.0 1.13 22.6 1.08 23.0 1.16 15.0 1.02 5.0 0.59New Zealand 10.3 0.67 14.1 0.71 19.5 0.71 20.7 0.77 17.6 0.79 11.1 0.81 6.7 0.49Norway 12.1 0.77 16.5 0.87 22.3 0.92 23.4 0.83 15.6 0.84 7.2 0.51 3.0 0.34Peru 55.3 1.88 21.0 0.79 13.6 0.90 6.5 0.81 2.6 0.44 0.8 ! 0.26 ‡ †Poland 6.4 0.58 12.8 0.82 21.1 0.91 23.8 0.90 19.0 0.91 11.2 0.76 5.7 0.92Portugal 10.3 0.92 15.5 0.98 22.6 0.79 22.7 1.03 17.2 1.00 9.1 0.67 2.6 0.36Qatar 52.0 0.47 19.6 0.51 13.7 0.32 8.2 0.28 4.5 0.27 1.7 0.15 0.4 0.08Romania 16.1 1.21 25.3 1.06 26.0 0.97 18.7 1.03 9.5 0.86 3.4 0.56 1.1 0.33Russian Federation 7.6 0.74 14.7 0.94 23.2 0.91 26.3 1.03 17.5 0.87 8.0 0.64 2.7 0.38Serbia, Republic of 21.1 1.45 21.4 0.87 23.3 0.93 17.9 1.02 10.2 0.71 4.4 0.59 1.7 0.42Shanghai-China 1.0 0.22 3.0 0.40 7.4 0.55 12.8 0.62 17.7 0.78 21.8 0.83 36.2 1.30Singapore 2.7 0.25 6.3 0.45 11.4 0.49 16.5 0.64 20.7 0.65 19.5 0.64 22.9 0.64Slovak Republic 15.2 1.12 15.0 0.92 21.3 1.00 21.3 1.05 15.5 0.99 8.1 0.64 3.6 0.57Slovenia 7.4 0.52 14.8 1.04 22.3 1.07 22.6 0.86 17.7 0.68 10.4 0.64 4.8 0.42Spain 9.4 0.54 15.8 0.70 24.2 0.61 24.8 0.53 17.3 0.51 6.9 0.31 1.6 0.17Sweden 14.9 0.84 17.5 0.69 22.3 1.07 20.6 0.83 14.8 0.69 7.3 0.61 2.6 0.31Switzerland 4.9 0.41 9.9 0.57 17.5 0.82 22.7 0.64 21.7 0.80 14.9 0.86 8.5 0.87Thailand 27.7 1.43 27.1 0.95 23.5 0.85 13.2 0.89 5.7 0.61 2.2 0.42 0.7 ! 0.22Tunisia 41.6 2.05 26.8 1.14 19.1 1.04 8.7 0.78 2.8 0.64 0.9 ! 0.37 ‡ †Turkey 16.2 1.29 25.0 1.22 25.6 1.15 17.3 1.11 10.4 1.14 4.3 0.77 1.2 ! 0.50United Arab Emirates 18.6 0.89 24.0 0.91 24.9 0.62 18.3 0.77 9.3 0.58 3.9 0.40 1.1 0.20United Kingdom 8.4 0.86 13.9 0.78 22.2 0.71 23.9 0.83 17.7 0.73 9.9 0.74 3.9 0.47United States 7.9 0.73 17.0 0.96 24.0 0.92 23.9 0.91 15.7 0.79 8.2 0.69 3.3 0.39Uruguay 33.9 1.29 23.5 0.82 20.4 0.90 13.2 0.72 6.5 0.58 1.9 0.31 0.5 ! 0.20Vietnam 5.3 1.00 11.7 1.14 21.7 1.28 26.2 1.19 20.1 1.07 10.7 0.93 4.4 0.73
U.S. state education systemConnecticut 7.0 1.31 12.5 1.40 19.7 1.46 22.3 1.43 18.2 1.33 12.8 1.39 7.6 1.12Florida 9.1 1.35 18.8 1.49 26.3 1.48 23.4 1.27 14.2 1.50 6.3 1.18 2.0 ! 0.66Massachusetts 6.2 0.94 11.9 1.06 19.4 1.59 22.0 1.42 20.1 1.29 12.5 1.34 8.0 1.42See notes at end of table.
7

National Center for Education StatisticsTable M2. Percentage distribution of 15-year-old students on PISA mathematics literacy content subscales, by proficiency level and education system: 2012–Continued
Education system
Space and shapeBelow level 1 Level 1 Level 2 Level 3 Level 4 Level 5 Level 6
Percent s.e. Percent s.e. Percent s.e. Percent s.e. Percent s.e. Percent s.e. Percent s.e.OECD average 10.0 0.13 15.8 0.14 22.3 0.15 22.2 0.16 16.3 0.14 8.9 0.11 4.5 0.10Albania 27.0 0.98 23.9 1.06 22.8 0.86 15.3 0.85 7.3 0.54 2.6 0.28 1.0 0.21Argentina 36.5 2.04 31.6 1.10 21.4 1.29 8.4 0.75 1.9 0.30 0.3 ! 0.09 ‡ †Australia 8.1 0.39 15.3 0.50 21.9 0.55 23.5 0.49 16.9 0.53 9.3 0.46 5.0 0.42Austria 7.3 0.69 13.7 0.85 21.8 0.88 23.7 0.98 19.0 0.85 10.2 0.69 4.3 0.68Belgium 8.4 0.67 12.7 0.71 19.4 0.90 21.7 0.99 18.4 0.75 12.4 0.48 6.9 0.42Brazil 40.3 1.02 30.6 0.71 18.8 0.63 7.3 0.42 2.4 0.34 0.6 ! 0.18 0.1 ! 0.05Bulgaria 19.1 1.46 23.2 1.00 24.9 1.00 18.0 0.95 10.1 0.79 3.8 0.52 0.9 0.24Canada 5.3 0.33 12.0 0.50 22.0 0.57 24.7 0.58 19.9 0.61 11.0 0.49 5.1 0.38Chile 25.0 1.35 28.4 0.90 24.1 0.97 14.3 0.80 6.2 0.53 1.7 0.23 0.3 0.08Chinese Taipei 4.6 0.47 7.2 0.50 10.9 0.57 13.3 0.72 16.0 0.66 16.9 0.68 31.1 1.14Colombia 45.7 1.79 29.3 0.92 16.5 1.13 6.3 0.70 1.8 0.27 0.2 ! 0.11 ‡ †Costa Rica 29.9 1.75 34.9 1.04 23.4 1.22 8.5 0.91 2.5 0.58 0.6 ! 0.23 ‡ †Croatia 11.2 0.81 23.2 0.97 28.2 0.95 20.8 0.97 10.9 0.68 4.1 0.66 1.7 ! 0.67Cyprus 19.8 0.88 24.4 1.03 25.8 0.73 17.9 0.65 8.7 0.71 2.9 0.32 0.6 0.15Czech Republic 8.3 0.77 14.2 1.04 21.4 1.06 23.2 1.01 18.1 0.93 10.2 0.77 4.7 0.48Denmark 5.1 0.54 13.1 0.65 24.3 0.73 29.0 0.80 18.9 0.71 7.6 0.60 1.9 0.28Estonia 4.3 0.44 11.6 0.79 22.0 0.87 25.9 0.99 20.1 1.13 10.8 0.80 5.2 0.48Finland 4.7 0.44 12.0 0.59 23.1 0.69 27.1 0.75 19.5 0.65 10.0 0.50 3.8 0.35France 9.5 0.67 15.9 0.98 22.1 0.92 23.1 0.89 17.0 0.91 8.8 0.56 3.4 0.49Germany 6.5 0.66 12.6 0.73 20.8 0.96 24.2 1.01 20.1 0.78 11.2 0.70 4.7 0.52Greece 18.9 1.04 24.2 1.02 26.6 0.82 18.7 0.71 8.7 0.62 2.5 0.32 0.4 0.11Hong Kong-China 3.2 0.47 6.4 0.65 12.2 0.80 18.1 1.13 22.6 0.97 20.3 0.86 17.1 1.23Hungary 10.8 0.91 19.2 1.25 25.7 1.24 21.9 1.09 13.0 0.81 6.5 0.80 2.9 0.67Iceland 7.4 0.50 14.4 0.76 24.8 0.90 26.9 0.96 17.3 0.91 7.7 0.66 1.6 0.32Indonesia 38.8 1.92 30.4 1.26 19.8 1.00 7.8 0.89 2.8 0.69 0.4 ! 0.18 ‡ †Ireland 10.2 0.79 16.5 0.66 24.7 1.03 24.5 0.99 15.7 0.73 6.5 0.46 1.8 0.27Israel 19.4 1.39 20.1 0.93 22.4 0.84 19.5 0.85 11.8 0.86 5.1 0.54 1.6 0.34Italy 10.7 0.46 15.9 0.50 22.4 0.57 21.7 0.65 15.7 0.51 9.0 0.45 4.6 0.37Japan 2.3 0.40 6.1 0.58 14.4 0.90 22.4 0.94 23.1 0.90 17.9 0.86 13.8 1.14Jordan 37.4 1.43 30.8 0.92 20.6 1.00 8.5 0.68 2.1 0.44 ‡ † ‡ †Kazakhstan 13.6 1.02 24.2 1.27 28.6 1.15 19.8 0.96 10.0 1.12 3.1 0.58 0.7 ! 0.33Korea, Republic of 2.8 0.46 5.9 0.54 12.7 0.81 18.6 1.03 20.9 0.90 18.5 0.89 20.6 1.62Latvia 5.2 0.63 13.7 0.95 25.4 1.18 26.7 0.89 18.2 1.06 8.0 0.72 2.8 0.39Liechtenstein 3.9 ! 1.22 7.6 1.83 16.2 2.12 23.9 2.71 21.7 2.69 16.9 2.25 9.8 2.40Lithuania 12.2 0.85 18.3 0.89 24.1 1.09 22.0 0.89 14.6 0.78 6.5 0.53 2.2 0.37Luxembourg 8.7 0.49 16.9 0.50 23.5 0.78 22.9 0.79 17.0 0.59 8.2 0.42 2.7 0.24Macao-China 3.7 0.28 7.0 0.35 13.8 0.60 19.9 0.76 21.8 0.67 18.2 0.59 15.6 0.56Malaysia 19.1 1.26 26.4 1.04 26.1 0.85 17.5 0.94 8.2 0.75 2.4 0.36 0.3 ! 0.15Mexico 25.0 0.72 29.4 0.51 26.2 0.49 13.7 0.50 4.6 0.25 1.0 0.10 0.1 0.02Montenegro, Republic of 25.2 0.71 30.8 1.04 25.2 0.92 13.0 0.68 4.8 0.46 0.9 0.17 ‡ †Netherlands 5.8 0.76 12.5 0.82 20.9 1.14 25.1 1.39 21.1 1.41 10.6 0.90 4.1 0.66New Zealand 8.5 0.73 16.3 0.78 23.4 1.00 22.8 1.06 15.8 1.07 8.6 0.94 4.4 0.44Norway 11.1 0.79 16.5 0.73 23.4 0.69 23.0 1.06 15.4 0.85 7.5 0.51 3.2 0.42Peru 45.4 1.87 26.5 0.98 17.0 0.95 7.5 0.71 2.7 0.46 0.8 ! 0.26 ‡ †Poland 3.7 0.50 11.7 0.82 21.1 0.91 23.2 0.78 19.0 0.74 12.9 0.86 8.5 1.06Portugal 11.1 0.98 15.9 0.91 20.7 0.83 20.2 1.05 17.2 0.81 10.0 0.71 5.0 0.50Qatar 44.7 0.52 23.4 0.41 16.0 0.53 9.2 0.36 4.5 0.20 1.8 0.14 0.3 0.08Romania 16.2 1.19 24.0 1.12 26.9 1.01 18.5 1.15 9.4 0.94 3.8 0.57 1.2 ! 0.39Russian Federation 6.9 0.60 14.8 0.89 23.9 0.82 24.2 1.24 17.3 1.01 9.0 0.72 3.8 0.70Serbia, Republic of 18.6 1.32 22.7 1.08 24.4 1.08 18.3 1.04 10.1 1.08 4.2 0.62 1.7 0.41Shanghai-China 0.7 0.18 2.4 0.36 5.5 0.55 9.8 0.72 14.9 0.79 20.8 0.87 45.9 1.37Singapore 3.2 0.30 6.4 0.36 11.2 0.48 16.7 0.59 19.7 0.63 19.4 0.90 23.4 0.74Slovak Republic 11.2 1.01 15.1 0.89 21.6 1.00 21.4 0.94 16.0 1.01 9.6 0.74 5.1 0.70Slovenia 6.5 0.45 14.0 0.70 22.8 0.96 22.8 0.97 17.9 0.79 10.7 0.62 5.2 0.42Spain 10.1 0.52 17.7 0.65 24.7 0.75 23.4 0.80 15.6 0.54 6.6 0.36 2.0 0.16Sweden 12.0 0.73 18.4 0.86 25.4 1.01 22.8 0.75 14.3 0.81 5.4 0.50 1.6 0.25Switzerland 3.5 0.44 7.9 0.64 16.0 0.76 22.3 0.79 23.1 0.76 16.1 0.80 11.1 0.86Thailand 21.7 1.20 25.8 1.10 25.1 1.05 15.5 1.02 7.4 0.76 3.3 0.49 1.4 0.36Tunisia 40.8 1.84 28.4 1.19 18.9 1.01 8.2 0.67 2.6 0.59 0.8 ! 0.35 ‡ †Turkey 22.5 1.32 23.0 1.18 21.6 1.15 14.9 1.02 9.4 0.84 5.7 0.84 2.9 0.74United Arab Emirates 25.5 0.99 24.7 0.62 22.5 0.68 15.9 0.68 7.9 0.48 2.8 0.28 0.7 0.13United Kingdom 12.0 0.95 17.5 0.75 23.8 0.65 22.5 0.95 14.5 0.79 7.0 0.64 2.7 0.41United States 13.5 1.02 20.9 0.98 25.0 0.87 20.6 0.91 12.4 0.84 5.4 0.54 2.2 0.36Uruguay 28.5 1.24 25.5 1.08 22.6 0.86 14.8 0.81 6.7 0.60 1.6 0.32 ‡ †Vietnam 6.4 0.94 12.8 1.02 21.8 1.10 24.2 1.14 18.6 0.99 10.7 0.89 5.5 0.87
U.S. state education systemsConnecticut 11.6 1.55 16.7 1.31 20.4 1.42 21.1 1.48 15.8 1.21 9.6 1.19 4.7 0.83Florida 16.4 1.90 22.5 2.02 26.5 1.38 20.5 1.62 9.6 1.07 3.9 0.88 ‡ †Massachusetts 9.2 0.90 15.3 1.44 21.2 1.54 21.4 1.57 16.4 1.31 10.5 1.69 6.0 1.43† Not applicable.! Interpret data with caution. Estimate is unstable due to high coefficient of variation.‡ Reporting standards not met.NOTE: To reach a particular proficiency level, a student must correctly answer a majority of items at that level. Students were classified into mathematics literacy levels according to their content subscale scores. Exact cut scores are as follows: below level 1 (a score less than or equal to 357.77); level 1 (a score greater than 357.77 and less than or equal to 420.07); level 2 (a score greater than 420.07 and less than or equal to 482.38); level 3 (a score greater than 482.38 and less than or equal to 544.68); level 4 (a score greater than 544.68 and less than or equal to 606.99); level 5 (a score greater than 606.99 and less than or equal to 669.30); and level 6 (a score greater than 669.30). Scores are reported on a scale from 0 to 1,000. The OECD average is the average of the national percentages of the OECD member countries, with each country weighted equally. Standard error is noted by s.e. Detail may not sum to totals because of rounding. Italics indicate non-OECD countries and education systems. Results for Connecticut, Florida, and Massachusetts are for public school students only. SOURCE: Organization for Economic Cooperation and Development (OECD), Program for International Student Assessment (PISA), 2012.
8

National Center for Education StatisticsTable M3. Percentage distribution of 15-year-old students on PISA mathematics literacy process subscales, by proficiency level and education system: 2012
Education system
FormulatingBelow level 1 Level 1 Level 2 Level 3 Level 4 Level 5 Level 6
Percent s.e. Percent s.e. Percent s.e. Percent s.e. Percent s.e. Percent s.e. Percent s.e.OECD average 10.3 0.13 15.6 0.13 21.3 0.15 21.6 0.15 16.6 0.14 9.5 0.11 5.0 0.10Albania 31.5 1.03 27.6 0.85 23.3 1.03 12.3 0.87 4.2 0.37 0.9 0.20 ‡ †Argentina 37.2 1.87 30.7 1.13 21.3 1.35 8.5 0.81 1.9 0.33 0.3 ! 0.11 ‡ †Australia 9.7 0.47 15.1 0.51 20.7 0.42 21.2 0.45 16.7 0.59 10.1 0.53 6.4 0.48Austria 8.7 0.72 14.7 0.79 20.7 0.80 21.3 0.80 18.5 0.74 11.1 0.67 4.9 0.62Belgium 8.6 0.57 12.6 0.60 18.3 0.56 20.9 0.62 19.1 0.77 12.8 0.59 7.9 0.46Brazil 43.1 1.04 28.1 0.64 17.6 0.59 7.5 0.45 2.7 0.33 0.8 0.22 0.2 ! 0.06Bulgaria 21.8 1.43 23.3 1.02 23.3 0.91 17.4 1.06 9.2 0.78 3.8 0.58 1.2 0.31Canada 5.9 0.33 11.7 0.47 20.3 0.73 23.1 0.71 19.8 0.53 12.4 0.46 6.8 0.41Chile 24.6 1.37 27.9 0.85 24.3 0.92 14.7 0.79 6.3 0.60 1.8 0.24 0.4 0.10Chinese Taipei 6.1 0.56 7.8 0.54 11.1 0.61 14.2 0.59 16.4 0.73 17.1 1.00 27.3 1.13Colombia 43.2 1.75 29.2 0.98 17.6 0.89 7.2 0.63 2.2 0.33 0.4 0.12 ‡ †Costa Rica 30.0 1.63 33.0 1.20 23.3 1.18 9.9 0.91 3.0 0.54 0.7 ! 0.24 ‡ †Croatia 16.5 0.96 22.3 1.01 24.5 1.04 19.9 0.92 10.3 0.73 4.5 0.64 1.9 ! 0.63Cyprus 20.2 0.62 24.0 0.86 25.6 1.20 17.4 0.72 8.9 0.43 3.3 0.28 0.7 0.15Czech Republic 8.7 0.86 14.6 0.83 21.7 0.88 22.9 1.02 18.2 1.06 9.5 0.75 4.3 0.43Denmark 5.3 0.55 13.1 0.63 22.8 0.93 26.3 0.83 20.2 0.73 9.6 0.66 2.8 0.36Estonia 3.6 0.41 10.4 0.66 22.0 0.83 26.7 0.70 20.7 0.92 11.2 0.62 5.4 0.41Finland 4.9 0.52 10.7 0.57 19.8 0.78 25.1 0.92 21.1 0.92 12.5 0.80 6.1 0.47France 12.1 0.77 15.8 0.72 21.8 0.95 21.3 0.96 16.6 0.69 8.6 0.62 3.8 0.47Germany 7.7 0.66 12.7 0.70 19.5 0.81 21.9 1.17 19.4 0.76 12.4 0.74 6.5 0.59Greece 15.7 0.94 22.3 0.97 27.7 1.32 20.6 0.83 10.0 0.69 3.1 0.30 0.7 0.15Hong Kong-China 4.2 0.51 6.5 0.59 11.9 0.70 16.8 0.81 21.5 1.02 19.9 0.79 19.2 1.07Hungary 12.9 0.89 19.9 1.08 24.4 1.07 20.2 0.92 12.8 0.73 6.7 0.70 3.1 0.68Iceland 6.7 0.50 13.3 0.64 22.1 0.79 25.8 0.95 18.7 0.79 9.9 0.68 3.4 0.44Indonesia 46.8 2.09 27.5 1.24 15.9 1.08 6.9 0.86 2.3 0.61 0.5 ! 0.24 ‡ †Ireland 7.9 0.71 14.8 0.88 22.8 1.17 25.2 1.07 17.8 0.66 8.6 0.55 3.0 0.34Israel 17.1 1.27 17.4 0.81 20.9 0.81 20.7 0.85 14.3 0.86 6.8 0.67 2.8 0.47Italy 12.4 0.52 17.1 0.52 23.6 0.60 21.9 0.54 14.8 0.43 7.3 0.39 2.9 0.25Japan 4.0 0.58 7.6 0.66 13.6 0.83 20.7 0.91 21.5 1.02 17.1 0.90 15.3 1.27Jordan 34.8 1.69 32.4 1.19 21.0 1.09 8.8 0.65 2.1 0.30 ‡ † ‡ †Kazakhstan 14.9 1.11 26.0 1.13 28.9 1.08 19.5 1.16 8.0 0.85 2.3 0.44 0.5 ! 0.24Korea, Republic of 3.5 0.53 7.1 0.81 13.4 0.88 19.2 0.92 21.5 0.88 18.1 0.74 17.4 1.55Latvia 7.3 0.85 15.6 1.16 25.7 1.13 25.0 1.08 16.7 1.08 7.1 0.80 2.6 0.32Liechtenstein 4.5 ! 1.86 9.5 2.06 16.9 2.52 21.1 2.58 23.1 2.87 15.7 2.49 9.2 1.66Lithuania 11.9 0.83 17.5 0.81 23.4 0.82 21.5 0.84 14.7 0.80 7.7 0.50 3.3 0.45Luxembourg 11.7 0.49 17.0 0.84 21.8 0.69 21.5 0.62 16.5 0.58 8.2 0.41 3.3 0.25Macao-China 4.8 0.27 8.7 0.47 14.9 0.53 20.3 0.62 21.3 0.66 16.9 0.67 13.0 0.43Malaysia 32.4 1.46 25.4 0.98 20.7 0.77 12.9 0.82 6.4 0.59 1.8 0.32 0.4 ! 0.13Mexico 27.6 0.77 28.2 0.58 24.5 0.60 13.4 0.48 4.9 0.25 1.2 0.12 0.2 0.04Montenegro, Republic of 30.9 0.77 28.2 1.00 22.2 0.81 12.7 0.69 4.6 0.38 1.2 0.22 ‡ †Netherlands 4.9 0.67 10.7 0.81 17.4 0.97 22.5 1.19 21.6 0.89 15.1 1.09 7.6 0.81New Zealand 9.9 0.71 16.0 0.70 20.8 0.92 20.6 0.88 16.3 0.85 10.1 0.70 6.3 0.60Norway 9.2 0.71 15.6 0.82 22.8 0.82 23.3 1.11 16.9 0.79 8.6 0.52 3.7 0.43Peru 45.9 1.68 26.6 0.83 16.5 0.94 7.5 0.81 2.7 0.40 0.6 0.19 ‡ †Poland 5.5 0.53 12.5 0.84 20.9 0.94 23.0 0.82 19.0 0.93 12.1 0.95 7.1 0.94Portugal 13.5 0.96 17.1 0.96 20.5 0.92 20.9 0.83 15.8 0.99 8.5 0.60 3.6 0.40Qatar 45.8 0.48 23.1 0.52 15.3 0.40 8.8 0.36 4.6 0.27 1.9 0.17 0.5 0.10Romania 17.4 1.22 23.7 1.05 26.2 0.98 18.2 1.15 9.8 0.82 3.6 0.56 1.2 ! 0.40Russian Federation 9.9 0.66 16.4 0.90 24.3 0.93 24.0 0.80 15.8 0.85 7.0 0.68 2.5 0.53Serbia, Republic of 17.9 1.20 23.1 1.29 24.7 1.33 18.4 0.96 9.9 0.77 4.2 0.48 1.8 0.41Shanghai-China 1.8 0.32 3.7 0.47 7.0 0.56 11.9 0.65 17.2 0.78 20.5 0.98 37.9 1.29Singapore 3.7 0.29 6.5 0.38 11.6 0.53 15.6 0.51 18.5 0.64 18.8 0.61 25.3 0.63Slovak Republic 13.0 1.14 17.0 0.91 21.5 1.03 20.5 1.14 15.3 0.98 8.3 0.64 4.5 0.59Slovenia 9.5 0.58 16.2 0.69 21.8 1.11 21.6 0.87 16.4 0.62 9.7 0.54 4.8 0.42Spain 12.0 0.62 16.8 0.60 22.6 0.63 22.8 0.58 15.9 0.48 7.5 0.45 2.5 0.19Sweden 11.8 0.80 17.3 0.91 22.3 0.74 21.9 0.89 15.9 0.93 8.0 0.69 3.0 0.33Switzerland 4.7 0.41 8.5 0.48 16.0 0.76 22.1 0.86 22.5 0.75 15.6 0.80 10.5 0.83Thailand 28.2 1.27 26.6 1.12 22.1 0.79 13.0 0.87 6.1 0.74 2.8 0.45 1.1 0.30Tunisia 45.7 1.71 26.9 1.06 16.9 0.97 6.9 0.68 2.5 0.53 0.8 ! 0.38 ‡ †Turkey 16.7 1.24 24.8 1.34 24.5 1.09 16.6 1.13 10.6 1.14 5.1 0.93 1.5 ! 0.50United Arab Emirates 26.1 1.04 23.8 0.62 21.7 0.72 15.9 0.66 8.3 0.57 3.2 0.29 1.1 0.18United Kingdom 10.6 1.11 15.5 0.70 22.3 0.84 22.0 0.73 16.2 0.78 9.2 0.66 4.3 0.50United States 11.1 1.03 19.1 0.96 24.5 1.02 21.5 1.16 13.8 1.17 6.9 0.62 3.1 0.43Uruguay 31.4 1.28 25.0 0.85 21.8 1.14 13.6 0.82 6.1 0.55 1.8 0.33 0.3 ! 0.13Vietnam 7.6 1.10 13.7 1.03 22.6 1.13 25.3 1.33 17.6 1.18 8.9 0.82 4.2 0.74
U.S. state education systemConnecticut 9.6 1.40 14.6 1.37 19.0 1.25 21.0 1.18 17.1 1.19 11.5 1.45 7.2 1.06Florida 14.5 1.79 21.1 1.77 25.4 1.77 21.5 2.13 11.5 1.50 4.9 0.86 1.1 0.32Massachusetts 8.0 1.04 12.3 1.25 19.7 1.96 22.1 1.56 17.9 1.71 12.1 1.30 8.0 1.84See notes at end of table.
9
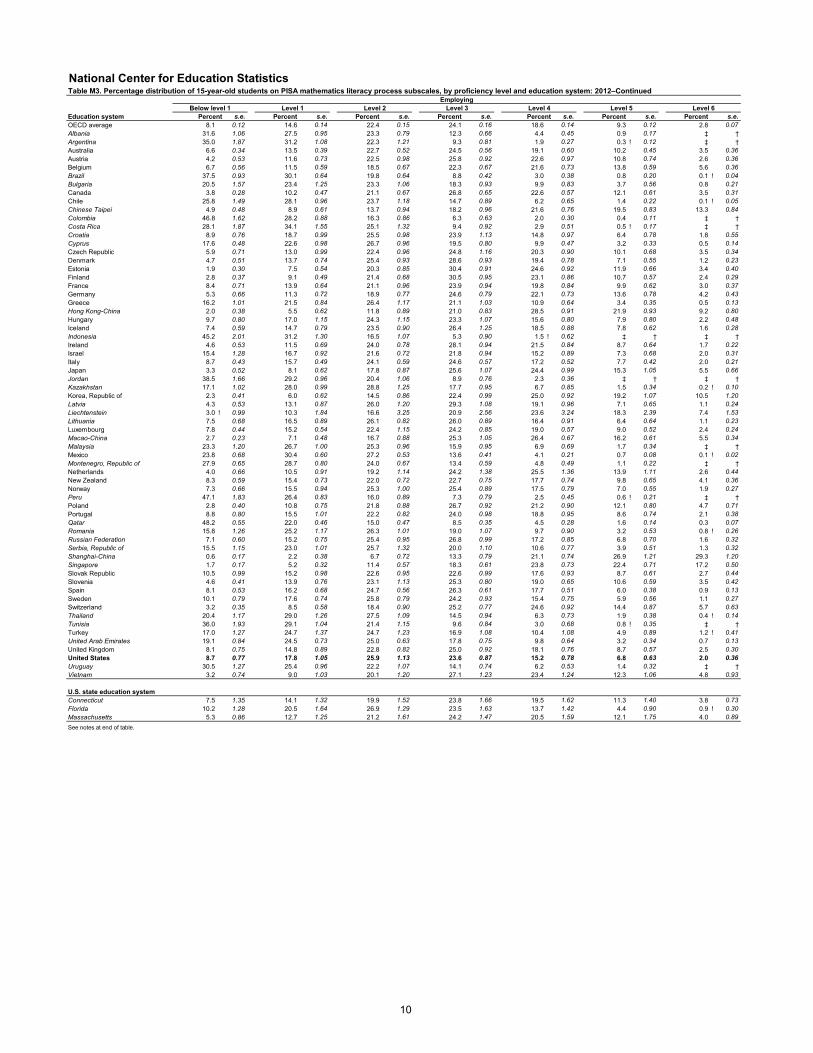
National Center for Education StatisticsTable M3. Percentage distribution of 15-year-old students on PISA mathematics literacy process subscales, by proficiency level and education system: 2012–Continued
Education system
EmployingBelow level 1 Level 1 Level 2 Level 3 Level 4 Level 5 Level 6
Percent s.e. Percent s.e. Percent s.e. Percent s.e. Percent s.e. Percent s.e. Percent s.e.OECD average 8.1 0.12 14.6 0.14 22.4 0.15 24.1 0.16 18.6 0.14 9.3 0.12 2.8 0.07Albania 31.6 1.06 27.5 0.95 23.3 0.79 12.3 0.66 4.4 0.45 0.9 0.17 ‡ †Argentina 35.0 1.87 31.2 1.08 22.3 1.21 9.3 0.81 1.9 0.27 0.3 ! 0.12 ‡ †Australia 6.6 0.34 13.5 0.39 22.7 0.52 24.5 0.56 19.1 0.60 10.2 0.45 3.5 0.36Austria 4.2 0.53 11.6 0.73 22.5 0.98 25.8 0.92 22.6 0.97 10.8 0.74 2.6 0.36Belgium 6.7 0.56 11.5 0.59 18.5 0.67 22.3 0.67 21.6 0.73 13.8 0.59 5.6 0.36Brazil 37.5 0.93 30.1 0.64 19.8 0.64 8.8 0.42 3.0 0.38 0.8 0.20 0.1 ! 0.04Bulgaria 20.5 1.57 23.4 1.25 23.3 1.06 18.3 0.93 9.9 0.83 3.7 0.56 0.8 0.21Canada 3.8 0.28 10.2 0.47 21.1 0.67 26.8 0.65 22.6 0.57 12.1 0.61 3.5 0.31Chile 25.8 1.49 28.1 0.96 23.7 1.18 14.7 0.89 6.2 0.65 1.4 0.22 0.1 ! 0.05Chinese Taipei 4.9 0.48 8.9 0.61 13.7 0.94 18.2 0.96 21.6 0.76 19.5 0.83 13.3 0.84Colombia 46.8 1.62 28.2 0.88 16.3 0.86 6.3 0.63 2.0 0.30 0.4 0.11 ‡ †Costa Rica 28.1 1.87 34.1 1.55 25.1 1.32 9.4 0.92 2.9 0.51 0.5 ! 0.17 ‡ †Croatia 8.9 0.76 18.7 0.99 25.5 0.98 23.9 1.13 14.8 0.97 6.4 0.78 1.8 0.55Cyprus 17.6 0.48 22.6 0.98 26.7 0.96 19.5 0.80 9.9 0.47 3.2 0.33 0.5 0.14Czech Republic 5.9 0.71 13.0 0.99 22.4 0.96 24.8 1.16 20.3 0.90 10.1 0.68 3.5 0.34Denmark 4.7 0.51 13.7 0.74 25.4 0.93 28.6 0.93 19.4 0.78 7.1 0.55 1.2 0.23Estonia 1.9 0.30 7.5 0.54 20.3 0.85 30.4 0.91 24.6 0.92 11.9 0.66 3.4 0.40Finland 2.8 0.37 9.1 0.49 21.4 0.68 30.5 0.95 23.1 0.86 10.7 0.57 2.4 0.29France 8.4 0.71 13.9 0.64 21.1 0.96 23.9 0.94 19.8 0.84 9.9 0.62 3.0 0.37Germany 5.3 0.66 11.3 0.72 18.9 0.77 24.6 0.79 22.1 0.73 13.6 0.78 4.2 0.43Greece 16.2 1.01 21.5 0.84 26.4 1.17 21.1 1.03 10.9 0.64 3.4 0.35 0.5 0.13Hong Kong-China 2.0 0.38 5.5 0.62 11.8 0.89 21.0 0.83 28.5 0.91 21.9 0.93 9.2 0.80Hungary 9.7 0.80 17.0 1.15 24.3 1.15 23.3 1.07 15.6 0.80 7.9 0.80 2.2 0.48Iceland 7.4 0.59 14.7 0.79 23.5 0.90 26.4 1.25 18.5 0.88 7.8 0.62 1.6 0.28Indonesia 45.2 2.01 31.2 1.30 16.5 1.07 5.3 0.90 1.5 ! 0.62 ‡ † ‡ †Ireland 4.6 0.53 11.5 0.69 24.0 0.78 28.1 0.94 21.5 0.84 8.7 0.64 1.7 0.22Israel 15.4 1.28 16.7 0.92 21.6 0.72 21.8 0.94 15.2 0.89 7.3 0.68 2.0 0.31Italy 8.7 0.43 15.7 0.49 24.1 0.59 24.6 0.57 17.2 0.52 7.7 0.42 2.0 0.21Japan 3.3 0.52 8.1 0.62 17.8 0.87 25.6 1.07 24.4 0.99 15.3 1.05 5.5 0.66Jordan 38.5 1.66 29.2 0.96 20.4 1.06 8.9 0.76 2.3 0.36 ‡ † ‡ †Kazakhstan 17.1 1.02 28.0 0.99 28.8 1.25 17.7 0.95 6.7 0.85 1.5 0.34 0.2 ! 0.10Korea, Republic of 2.3 0.41 6.0 0.62 14.5 0.86 22.4 0.99 25.0 0.92 19.2 1.07 10.5 1.20Latvia 4.3 0.53 13.1 0.87 26.0 1.20 29.3 1.08 19.1 0.96 7.1 0.65 1.1 0.24Liechtenstein 3.0 ! 0.99 10.3 1.84 16.6 3.25 20.9 2.56 23.6 3.24 18.3 2.39 7.4 1.53Lithuania 7.5 0.68 16.5 0.89 26.1 0.82 26.0 0.89 16.4 0.91 6.4 0.64 1.1 0.23Luxembourg 7.8 0.44 15.2 0.54 22.4 1.15 24.2 0.85 19.0 0.57 9.0 0.52 2.4 0.24Macao-China 2.7 0.23 7.1 0.48 16.7 0.88 25.3 1.05 26.4 0.67 16.2 0.61 5.5 0.34Malaysia 23.3 1.20 26.7 1.00 25.3 0.96 15.9 0.95 6.9 0.69 1.7 0.34 ‡ †Mexico 23.8 0.68 30.4 0.60 27.2 0.53 13.6 0.41 4.1 0.21 0.7 0.08 0.1 ! 0.02Montenegro, Republic of 27.9 0.65 28.7 0.80 24.0 0.67 13.4 0.59 4.8 0.49 1.1 0.22 ‡ †Netherlands 4.0 0.66 10.5 0.91 19.2 1.14 24.2 1.38 25.5 1.36 13.9 1.11 2.6 0.44New Zealand 8.3 0.59 15.4 0.73 22.0 0.72 22.7 0.75 17.7 0.74 9.8 0.65 4.1 0.36Norway 7.3 0.66 15.5 0.94 25.3 1.00 25.4 0.89 17.5 0.79 7.0 0.55 1.9 0.27Peru 47.1 1.83 26.4 0.83 16.0 0.89 7.3 0.79 2.5 0.45 0.6 ! 0.21 ‡ †Poland 2.8 0.40 10.8 0.75 21.8 0.88 26.7 0.92 21.2 0.90 12.1 0.80 4.7 0.71Portugal 8.8 0.80 15.5 1.01 22.2 0.82 24.0 0.98 18.8 0.95 8.6 0.74 2.1 0.38Qatar 48.2 0.55 22.0 0.46 15.0 0.47 8.5 0.35 4.5 0.28 1.6 0.14 0.3 0.07Romania 15.8 1.26 25.2 1.17 26.3 1.01 19.0 1.07 9.7 0.90 3.2 0.53 0.8 ! 0.26Russian Federation 7.1 0.60 15.2 0.75 25.4 0.95 26.8 0.99 17.2 0.85 6.8 0.70 1.6 0.32Serbia, Republic of 15.5 1.15 23.0 1.01 25.7 1.32 20.0 1.10 10.6 0.77 3.9 0.51 1.3 0.32Shanghai-China 0.6 0.17 2.2 0.38 6.7 0.72 13.3 0.79 21.1 0.74 26.9 1.21 29.3 1.20Singapore 1.7 0.17 5.2 0.32 11.4 0.57 18.3 0.61 23.8 0.73 22.4 0.71 17.2 0.50Slovak Republic 10.5 0.99 15.2 0.98 22.6 0.95 22.6 0.99 17.6 0.93 8.7 0.61 2.7 0.44Slovenia 4.6 0.41 13.9 0.76 23.1 1.13 25.3 0.80 19.0 0.65 10.6 0.59 3.5 0.42Spain 8.1 0.53 16.2 0.68 24.7 0.56 26.3 0.61 17.7 0.51 6.0 0.38 0.9 0.13Sweden 10.1 0.79 17.6 0.74 25.8 0.79 24.2 0.93 15.4 0.75 5.9 0.56 1.1 0.27Switzerland 3.2 0.35 8.5 0.58 18.4 0.90 25.2 0.77 24.6 0.92 14.4 0.87 5.7 0.63Thailand 20.4 1.17 29.0 1.26 27.5 1.09 14.5 0.94 6.3 0.73 1.9 0.38 0.4 ! 0.14Tunisia 36.0 1.93 29.1 1.04 21.4 1.15 9.6 0.84 3.0 0.68 0.8 ! 0.35 ‡ †Turkey 17.0 1.27 24.7 1.37 24.7 1.23 16.9 1.08 10.4 1.08 4.9 0.89 1.2 ! 0.41United Arab Emirates 19.1 0.84 24.5 0.73 25.0 0.63 17.8 0.75 9.8 0.64 3.2 0.34 0.7 0.13United Kingdom 8.1 0.75 14.8 0.89 22.8 0.82 25.0 0.92 18.1 0.76 8.7 0.57 2.5 0.30United States 8.7 0.77 17.8 1.05 25.9 1.13 23.6 0.87 15.2 0.78 6.8 0.63 2.0 0.36Uruguay 30.5 1.27 25.4 0.96 22.2 1.07 14.1 0.74 6.2 0.53 1.4 0.32 ‡ †Vietnam 3.2 0.74 9.0 1.03 20.1 1.20 27.1 1.23 23.4 1.24 12.3 1.06 4.8 0.93
U.S. state education systemConnecticut 7.5 1.35 14.1 1.32 19.9 1.52 23.8 1.66 19.5 1.62 11.3 1.40 3.8 0.73Florida 10.2 1.28 20.5 1.64 26.9 1.29 23.5 1.63 13.7 1.42 4.4 0.90 0.9 ! 0.30Massachusetts 5.3 0.86 12.7 1.25 21.2 1.61 24.2 1.47 20.5 1.59 12.1 1.75 4.0 0.89See notes at end of table.
10

National Center for Education StatisticsTable M3. Percentage distribution of 15-year-old students on PISA mathematics literacy process subscales, by proficiency level and education system: 2012–Continued
Education system
InterpretingBelow level 1 Level 1 Level 2 Level 3 Level 4 Level 5 Level 6Percent s.e. Percent s.e. Percent s.e. Percent s.e. Percent s.e. Percent s.e. Percent s.e.
OECD average 8.8 0.12 14.3 0.13 21.1 0.15 22.9 0.15 18.5 0.14 10.2 0.11 4.2 0.08Albania 39.5 1.18 26.6 1.33 19.3 1.05 10.4 0.95 3.3 0.49 0.7 0.18 ‡ †Argentina 35.3 2.02 28.9 1.37 22.4 1.29 10.2 0.92 2.6 0.44 0.5 ! 0.17 ‡ †Australia 6.0 0.38 11.8 0.49 20.2 0.68 23.5 0.62 20.4 0.43 11.9 0.39 6.3 0.40Austria 8.3 0.76 13.0 0.81 19.1 0.79 20.6 0.80 20.0 0.82 12.9 0.75 6.0 0.62Belgium 7.6 0.55 12.4 0.59 18.4 0.58 21.4 0.65 20.4 0.65 13.2 0.49 6.6 0.41Brazil 30.0 0.95 31.0 0.74 23.3 0.77 11.3 0.56 3.6 0.44 0.7 0.16 0.1 ! 0.03Bulgaria 20.6 1.54 21.7 0.99 23.1 1.02 19.3 0.85 10.6 0.79 3.9 0.51 0.8 ! 0.24Canada 4.2 0.28 9.8 0.41 19.7 0.60 26.0 0.58 22.2 0.51 12.8 0.69 5.3 0.39Chile 17.9 1.24 28.0 0.93 27.2 1.02 17.7 0.88 7.3 0.67 1.8 0.26 0.2 ! 0.06Chinese Taipei 4.2 0.46 7.9 0.62 14.2 0.70 19.6 0.69 22.9 0.76 18.9 0.92 12.3 0.90Colombia 34.7 1.41 32.8 1.03 22.2 0.91 7.8 0.62 2.1 0.28 0.3 0.08 ‡ †Costa Rica 19.7 1.41 32.3 1.13 30.5 1.18 13.7 1.01 3.3 0.50 0.5 ! 0.14 ‡ †Croatia 9.9 0.78 18.1 1.03 25.1 1.02 23.1 0.98 14.9 0.81 6.8 0.69 2.1 0.47Cyprus 22.4 0.63 21.2 0.81 23.4 0.69 18.8 0.74 9.8 0.51 3.5 0.28 0.9 0.16Czech Republic 8.6 0.78 14.3 0.83 21.4 0.92 24.1 1.02 18.4 1.00 9.5 0.66 3.7 0.34Denmark 4.8 0.49 11.9 0.71 22.1 0.80 26.7 0.81 20.4 0.86 10.8 0.69 3.3 0.42Estonia 3.5 0.38 10.8 0.68 22.3 0.83 28.0 0.95 21.4 1.04 10.3 0.62 3.7 0.36Finland 3.2 0.34 7.7 0.53 18.2 0.71 27.8 0.79 24.5 0.67 13.6 0.59 5.0 0.44France 8.2 0.73 11.7 0.89 18.7 0.90 22.0 0.87 20.0 1.11 13.1 0.87 6.2 0.58Germany 7.1 0.74 11.6 0.78 17.6 1.07 21.8 0.86 21.7 0.91 13.5 0.88 6.7 0.65Greece 13.3 1.02 18.6 0.76 23.6 0.85 22.5 0.91 14.4 0.93 6.0 0.59 1.6 0.24Hong Kong-China 2.7 0.39 6.4 0.70 13.2 0.83 21.7 0.94 27.4 1.10 19.2 0.90 9.4 0.91Hungary 12.4 0.93 15.9 0.94 23.5 0.93 22.6 0.94 16.0 0.83 7.3 0.66 2.2 0.40Iceland 9.7 0.53 14.1 0.77 20.7 0.99 24.2 1.18 18.6 0.84 9.3 0.72 3.4 0.34Indonesia 39.3 2.07 34.0 1.45 19.2 1.29 6.0 0.94 1.3 ! 0.47 ‡ † ‡ †Ireland 5.5 0.61 11.3 0.76 22.2 0.96 26.3 0.87 21.2 0.79 10.0 0.56 3.5 0.32Israel 19.3 1.32 17.1 0.78 19.9 1.14 19.2 0.87 13.9 0.77 7.4 0.70 3.2 0.62Italy 9.7 0.45 13.6 0.52 20.3 0.47 22.3 0.53 18.2 0.48 10.6 0.42 5.2 0.34Japan 3.4 0.49 8.5 0.71 17.6 0.95 25.1 1.07 24.3 1.06 15.0 0.83 6.1 0.70Jordan 36.6 1.53 32.3 0.84 21.8 1.14 7.3 0.58 1.7 0.43 ‡ † ‡ †Kazakhstan 16.1 0.96 34.7 1.26 32.3 1.00 14.0 1.27 2.7 0.49 ‡ † ‡ †Korea, Republic of 3.7 0.49 7.6 0.64 15.7 0.82 22.9 0.88 24.6 0.87 17.0 0.93 8.6 0.97Latvia 7.0 0.70 16.0 0.89 25.2 1.12 26.0 0.99 17.1 0.84 6.9 0.62 1.8 0.37Liechtenstein 5.2 1.47 9.4 2.00 15.1 2.72 19.3 3.40 21.2 2.78 19.1 2.48 10.6 1.72Lithuania 10.7 0.73 18.6 0.86 26.1 1.02 23.3 0.84 14.3 0.82 5.7 0.50 1.3 0.27Luxembourg 10.4 0.52 14.7 0.70 19.9 0.70 21.6 0.61 18.2 0.57 10.7 0.49 4.6 0.27Macao-China 3.6 0.40 8.4 0.63 17.7 0.70 25.1 0.87 25.0 0.66 14.7 0.72 5.6 0.36Malaysia 21.5 1.33 30.2 1.06 28.6 0.98 14.8 0.92 4.4 0.65 0.5 ! 0.18 ‡ †Mexico 22.0 0.66 32.1 0.62 29.2 0.55 13.1 0.46 3.2 0.21 0.4 0.07 ‡ †Montenegro, Republic of 27.7 0.88 26.6 1.08 23.5 1.19 14.4 0.87 5.9 0.55 1.5 0.37 0.3 ! 0.10Netherlands 5.1 0.83 11.1 0.83 17.2 1.01 21.8 1.23 22.8 1.21 15.2 1.00 6.9 0.62New Zealand 7.9 0.58 13.0 0.65 19.2 0.96 21.1 0.93 19.3 0.68 12.5 0.76 7.0 0.52Norway 7.6 0.65 13.3 0.84 21.7 0.82 24.8 0.94 19.2 0.78 9.3 0.63 3.9 0.44Peru 46.6 1.82 27.4 1.04 16.2 1.09 7.1 0.83 2.1 0.36 0.5 ! 0.16 ‡ †Poland 3.9 0.36 10.9 0.74 21.5 0.90 26.2 0.78 22.2 0.84 11.1 0.72 4.2 0.75Portugal 8.2 0.90 15.1 0.97 23.0 0.86 24.4 1.00 18.4 0.89 8.7 0.59 2.3 0.32Qatar 46.7 0.45 22.0 0.54 15.3 0.48 9.2 0.32 4.6 0.23 1.8 0.13 0.4 0.08Romania 13.9 1.29 27.3 1.40 31.8 1.06 19.1 1.07 6.6 0.78 1.2 0.30 ‡ †Russian Federation 10.1 0.78 18.1 0.90 26.9 0.97 24.2 1.04 14.2 0.83 5.2 0.47 1.2 0.20Serbia, Republic of 17.0 1.34 22.7 1.14 26.4 0.97 19.6 1.08 10.3 0.84 3.3 0.51 0.8 0.22Shanghai-China 1.5 0.30 4.3 0.48 10.9 0.64 18.4 1.01 24.4 1.44 22.8 0.96 17.7 1.02Singapore 3.3 0.28 7.7 0.46 14.0 0.62 19.8 0.75 22.7 0.97 18.6 0.99 14.0 0.55Slovak Republic 13.6 0.98 16.8 0.88 22.3 1.08 22.0 0.87 15.4 0.86 7.3 0.54 2.5 0.40Slovenia 6.6 0.47 14.9 0.64 23.5 1.02 23.0 0.96 18.6 0.73 10.2 0.55 3.3 0.42Spain 8.5 0.43 13.6 0.63 21.8 0.83 24.4 0.65 18.9 0.60 9.6 0.41 3.1 0.22Sweden 10.1 0.71 15.7 0.63 22.7 0.78 23.6 0.98 17.0 0.88 8.2 0.51 2.8 0.34Switzerland 5.0 0.43 9.4 0.58 16.8 0.82 23.3 0.76 22.8 0.65 15.2 0.80 7.5 0.81Thailand 16.9 1.11 28.5 1.11 30.0 1.04 16.3 0.97 6.0 0.66 1.9 0.38 0.4 ! 0.15Tunisia 36.8 1.90 31.5 1.26 21.3 1.37 7.7 0.78 2.2 0.58 ‡ † ‡ †Turkey 17.1 1.08 25.2 1.30 25.4 1.15 16.6 1.00 9.9 1.17 4.2 0.73 1.7 ! 0.54United Arab Emirates 22.3 0.90 26.3 0.84 24.7 0.63 16.2 0.71 7.5 0.48 2.5 0.28 0.5 0.13United Kingdom 8.2 0.82 13.2 0.80 20.7 0.76 23.6 0.99 19.2 0.82 10.4 0.62 4.7 0.45United States 8.1 0.83 16.3 0.88 24.0 0.97 23.0 0.90 17.0 1.02 8.4 0.62 3.2 0.43Uruguay 28.5 1.19 27.4 0.83 24.0 1.13 13.2 0.73 5.6 0.58 1.3 0.34 ‡ †Vietnam 4.5 0.82 13.0 1.28 25.3 1.18 29.7 1.22 18.8 1.21 7.0 0.82 1.8 0.43
U.S. state education systemsConnecticut 7.2 1.29 11.6 1.18 18.2 1.35 23.1 1.64 20.4 1.73 12.7 1.39 6.7 1.05Florida 10.0 1.43 18.8 1.59 25.1 1.70 23.7 1.84 13.9 1.29 6.3 1.09 2.2 ! 0.81Massachusetts 5.7 0.73 11.2 0.97 18.7 1.53 22.0 1.59 20.3 1.49 13.6 1.39 8.6 1.54† Not applicable.! Interpret data with caution. Estimate is unstable due to high coefficient of variation.‡ Reporting standards not met.NOTE: To reach a particular proficiency level, a student must correctly answer a majority of items at that level. Students were classified into mathematics literacy levels according to their process subscale scores. Exact cut scores are as follows: below level 1 (a score less than or equal to 357.77); level 1 (a score greater than 357.77 and less than or equal to 420.07); level 2 (a score greater than 420.07 and less than or equal to 482.38); level 3 (a score greater than 482.38 and less than or equal to 544.68); level 4 (a score greater than 544.68 and less than or equal to 606.99); level 5 (a score greater than 606.99 and less than or equal to 669.30); and level 6 (a score greater than 669.30). Scores are reported on a scale from 0 to 1,000. The OECD average is the average of the national percentages of the OECD member countries, with each country weighted equally. Standard error is noted by s.e. Detail may not sum to totals because of rounding. Italics indicate non-OECD countries and education systems. Results for Connecticut, Florida, and Massachusetts are for public school students only.SOURCE: Organization for Economic Cooperation and Development (OECD), Program for International Student Assessment (PISA), 2012.
11

National Center for Education StatisticsTable M4. Average scores of 15-year-old students on PISA mathematics literacy scale, by education system: 2012Education system Average score s.e. Education system Average score s.e.OECD average 494 0.5Shanghai-China 613 3.3Singapore 573 1.3Hong Kong-China 561 3.2Chinese Taipei 560 3.3Korea, Republic of 554 4.6Macao-China 538 1.0Japan 536 3.6Liechtenstein 535 4.0Switzerland 531 3.0Netherlands 523 3.5Estonia 521 2.0Finland 519 1.9Canada 518 1.8Poland 518 3.6Belgium 515 2.1Germany 514 2.9Vietnam 511 4.8Austria 506 2.7Australia 504 1.6Ireland 501 2.2Slovenia 501 1.2Denmark 500 2.3New Zealand 500 2.2Czech Republic 499 2.9France 495 2.5United Kingdom 494 3.3Iceland 493 1.7Latvia 491 2.8Luxembourg 490 1.1Norway 489 2.7Portugal 487 3.8Italy 485 2.0Spain 484 1.9Russian Federation 482 3.0Slovak Republic 482 3.4United States 481 3.6
Lithuania 479 2.6Sweden 478 2.3Hungary 477 3.2Croatia 471 3.5Israel 466 4.7Greece 453 2.5Serbia, Republic of 449 3.4Turkey 448 4.8Romania 445 3.8Cyprus 440 1.1Bulgaria 439 4.0United Arab Emirates 434 2.4Kazakhstan 432 3.0Thailand 427 3.4Chile 423 3.1Malaysia 421 3.2Mexico 413 1.4Montenegro, Republic of 410 1.1Uruguay 409 2.8Costa Rica 407 3.0Albania 394 2.0Brazil 391 2.1Argentina 388 3.5Tunisia 388 3.9Jordan 386 3.1Colombia 376 2.9Qatar 376 0.8Indonesia 375 4.0Peru 368 3.7
U.S. state education systemsMassachusetts 514 6.2Connecticut 506 6.2Florida 467 5.8
Average score is higher than U.S. average score. Average score is lower than U.S. average score.NOTE: Education systems are ordered by 2012 average score. The OECD average is the average of the national averages of the OECD member countries, with each country weighted equally. Scores are reported on a scale from 0 to 1,000. All average scores reported as higher or lower than the U.S. average score are different at the .05 level of statistical significance. Standard error is noted by s.e. Italics indicate non-OECD countries and education systems. Results for Connecticut, Florida, and Massachusetts are for public school students only. This table corresponds to table 1 in Performance of U.S. 15-Year-Old Students in Mathematics, Science, and Reading Literacy in an International Context (NCES 2014-024).SOURCE: Organization for Economic Cooperation and Development (OECD), Program for International Student Assessment (PISA), 2012.
12
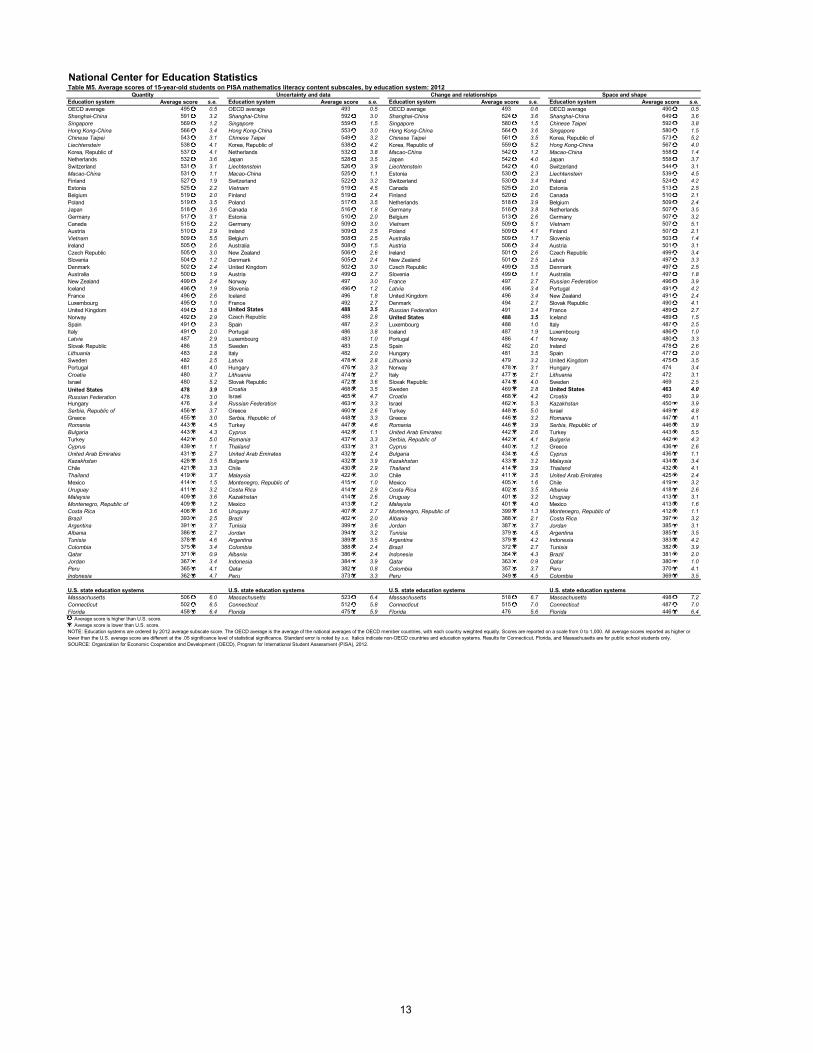
Average score is higher than U.S. score. Average score is lower than U.S. score.
National Center for Education StatisticsTable M5. Average scores of 15-year-old students on PISA mathematics literacy content subscales, by education system: 2012
QuantityEducation system Average score s.e.OECD average 495 0.5Shanghai-China 591 3.2Singapore 569 1.2Hong Kong-China 566 3.4Chinese Taipei 543 3.1Liechtenstein 538 4.1Korea, Republic of 537 4.1Netherlands 532 3.6Switzerland 531 3.1Macao-China 531 1.1Finland 527 1.9Estonia 525 2.2Belgium 519 2.0Poland 519 3.5Japan 518 3.6Germany 517 3.1Canada 515 2.2Austria 510 2.9Vietnam 509 5.5Ireland 505 2.6Czech Republic 505 3.0Slovenia 504 1.2Denmark 502 2.4Australia 500 1.9New Zealand 499 2.4Iceland 496 1.9France 496 2.6Luxembourg 495 1.0United Kingdom 494 3.8Norway 492 2.9Spain 491 2.3Italy 491 2.0Latvia 487 2.9Slovak Republic 486 3.5Lithuania 483 2.8Sweden 482 2.5Portugal 481 4.0Croatia 480 3.7Israel 480 5.2United States 478 3.9Russian Federation 478 3.0Hungary 476 3.4Serbia, Republic of 456 3.7Greece 455 3.0Romania 443 4.5Bulgaria 443 4.3Turkey 442 5.0Cyprus 439 1.1United Arab Emirates 431 2.7Kazakhstan 428 3.5Chile 421 3.3Thailand 419 3.7Mexico 414 1.5Uruguay 411 3.2Malaysia 409 3.6Montenegro, Republic of 409 1.2Costa Rica 406 3.6Brazil 393 2.5Argentina 391 3.7Albania 386 2.7Tunisia 378 4.6Colombia 375 3.4Qatar 371 0.9Jordan 367 3.4Peru 365 4.1Indonesia 362 4.7
U.S. state education systemsMassachusetts 506 6.0Connecticut 502 6.5Florida 458 6.4
Uncertainty and dataEducation system Average score s.e.OECD average 493 0.5Shanghai-China 592 3.0Singapore 559 1.5Hong Kong-China 553 3.0Chinese Taipei 549 3.2Korea, Republic of 538 4.2Netherlands 532 3.8Japan 528 3.5Liechtenstein 526 3.9Macao-China 525 1.1Switzerland 522 3.2Vietnam 519 4.5Finland 519 2.4Poland 517 3.5Canada 516 1.8Estonia 510 2.0Germany 509 3.0Ireland 509 2.5Belgium 508 2.5Australia 508 1.5New Zealand 506 2.6Denmark 505 2.4United Kingdom 502 3.0Austria 499 2.7Norway 497 3.0Slovenia 496 1.2Iceland 496 1.8France 492 2.7United States 488 3.5Czech Republic 488 2.8Spain 487 2.3Portugal 486 3.8Luxembourg 483 1.0Sweden 483 2.5Italy 482 2.0Latvia 478 2.8Hungary 476 3.3Lithuania 474 2.7Slovak Republic 472 3.6Croatia 468 3.5Israel 465 4.7Russian Federation 463 3.3Greece 460 2.6Serbia, Republic of 448 3.3Turkey 447 4.6Cyprus 442 1.1Romania 437 3.3Thailand 433 3.1United Arab Emirates 432 2.4Bulgaria 432 3.9Chile 430 2.9Malaysia 422 3.0Montenegro, Republic of 415 1.0Costa Rica 414 2.9Kazakhstan 414 2.6Mexico 413 1.2Uruguay 407 2.7Brazil 402 2.0Tunisia 399 3.6Jordan 394 3.2Argentina 389 3.5Colombia 388 2.4Albania 386 2.4Indonesia 384 3.9Qatar 382 0.8Peru 373 3.3
U.S. state education systemsMassachusetts 523 6.4Connecticut 512 5.8Florida 475 5.9
Change and relationshipsEducation system Average score s.e.OECD average 493 0.6Shanghai-China 624 3.6Singapore 580 1.5Hong Kong-China 564 3.6Chinese Taipei 561 3.5Korea, Republic of 559 5.2Macao-China 542 1.2Japan 542 4.0Liechtenstein 542 4.0Estonia 530 2.3Switzerland 530 3.4Canada 525 2.0Finland 520 2.6Netherlands 518 3.9Germany 516 3.8Belgium 513 2.6Vietnam 509 5.1Poland 509 4.1Australia 509 1.7Austria 506 3.4Ireland 501 2.6New Zealand 501 2.5Czech Republic 499 3.5Slovenia 499 1.1France 497 2.7Latvia 496 3.4United Kingdom 496 3.4Denmark 494 2.7Russian Federation 491 3.4United States 488 3.5Luxembourg 488 1.0Iceland 487 1.9Portugal 486 4.1Spain 482 2.0Hungary 481 3.5Lithuania 479 3.2Norway 478 3.1Italy 477 2.1Slovak Republic 474 4.0Sweden 469 2.8Croatia 468 4.2Israel 462 5.3Turkey 448 5.0Greece 446 3.2Romania 446 3.9United Arab Emirates 442 2.6Serbia, Republic of 442 4.1Cyprus 440 1.2Bulgaria 434 4.5Kazakhstan 433 3.2Thailand 414 3.9Chile 411 3.5Mexico 405 1.6Costa Rica 402 3.5Uruguay 401 3.2Malaysia 401 4.0Montenegro, Republic of 399 1.3Albania 388 2.1Jordan 387 3.7Tunisia 379 4.5Argentina 379 4.2Brazil 372 2.7Indonesia 364 4.3Qatar 363 0.9Colombia 357 3.7Peru 349 4.5
U.S. state education systemsMassachusetts 518 6.7Connecticut 515 7.0Florida 476 5.6
Space and shapeEducation system Average score s.e.OECD average 490 0.5Shanghai-China 649 3.6Chinese Taipei 592 3.8Singapore 580 1.5Korea, Republic of 573 5.2Hong Kong-China 567 4.0Macao-China 558 1.4Japan 558 3.7Switzerland 544 3.1Liechtenstein 539 4.5Poland 524 4.2Estonia 513 2.5Canada 510 2.1Belgium 509 2.4Netherlands 507 3.5Germany 507 3.2Vietnam 507 5.1Finland 507 2.1Slovenia 503 1.4Austria 501 3.1Czech Republic 499 3.4Latvia 497 3.3Denmark 497 2.5Australia 497 1.8Russian Federation 496 3.9Portugal 491 4.2New Zealand 491 2.4Slovak Republic 490 4.1France 489 2.7Iceland 489 1.5Italy 487 2.5Luxembourg 486 1.0Norway 480 3.3Ireland 478 2.6Spain 477 2.0United Kingdom 475 3.5Hungary 474 3.4Lithuania 472 3.1Sweden 469 2.5United States 463 4.0Croatia 460 3.9Kazakhstan 450 3.9Israel 449 4.8Romania 447 4.1Serbia, Republic of 446 3.9Turkey 443 5.5Bulgaria 442 4.3Greece 436 2.6Cyprus 436 1.1Malaysia 434 3.4Thailand 432 4.1United Arab Emirates 425 2.4Chile 419 3.2Albania 418 2.6Uruguay 413 3.1Mexico 413 1.6Montenegro, Republic of 412 1.1Costa Rica 397 3.2Jordan 385 3.1Argentina 385 3.5Indonesia 383 4.2Tunisia 382 3.9Brazil 381 2.0Qatar 380 1.0Peru 370 4.1Colombia 369 3.5
U.S. state education systemsMassachusetts 498 7.2Connecticut 487 7.0Florida 446 6.4
NOTE: Education systems are ordered by 2012 average subscale score. The OECD average is the average of the national averages of the OECD member countries, with each country weighted equally. Scores are reported on a scale from 0 to 1,000. All average scores reported as higher or lower than the U.S. average score are different at the .05 significance level of statistical significance. Standard error is noted by s.e. Italics indicate non-OECD countries and education systems. Results for Connecticut, Florida, and Massachusetts are for public school students only.SOURCE: Organization for Economic Cooperation and Development (OECD), Program for International Student Assessment (PISA), 2012.
13
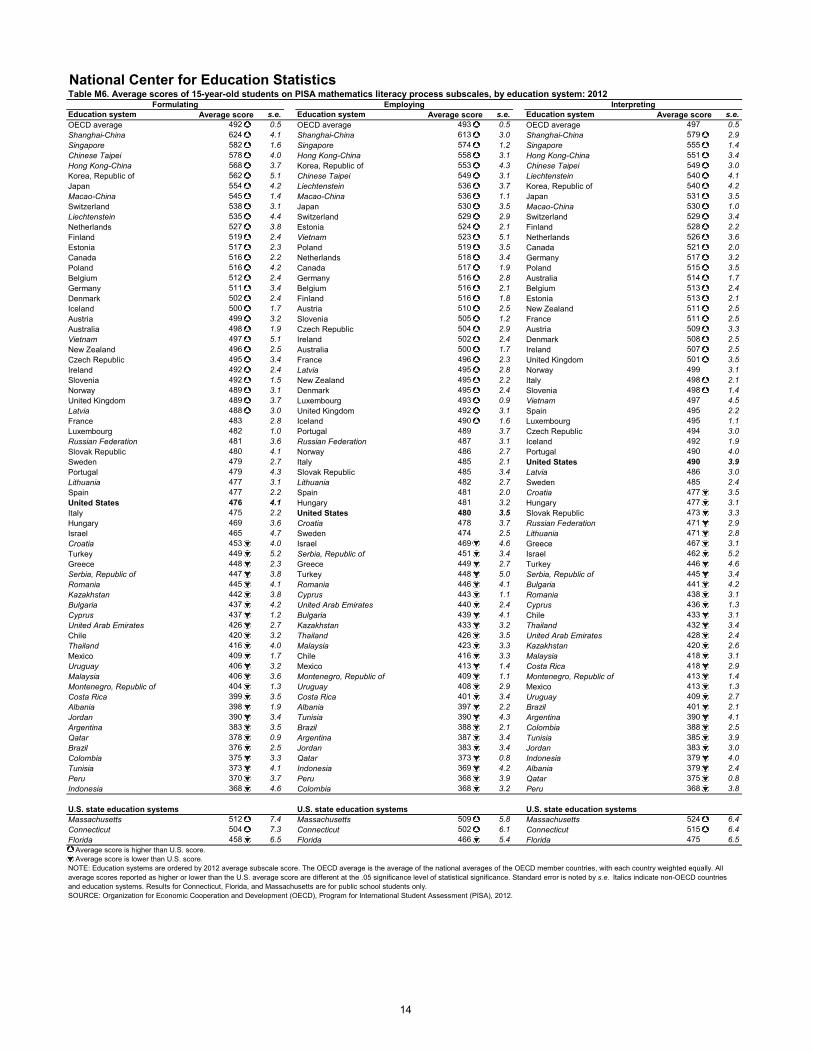
National Center for Education StatisticsTable M6. Average scores of 15-year-old students on PISA mathematics literacy process subscales, by education system: 2012
FormulatingEducation system Average score s.e.OECD average 492 0.5Shanghai-China 624 4.1Singapore 582 1.6Chinese Taipei 578 4.0Hong Kong-China 568 3.7Korea, Republic of 562 5.1Japan 554 4.2Macao-China 545 1.4Switzerland 538 3.1Liechtenstein 535 4.4Netherlands 527 3.8Finland 519 2.4Estonia 517 2.3Canada 516 2.2Poland 516 4.2Belgium 512 2.4Germany 511 3.4Denmark 502 2.4Iceland 500 1.7Austria 499 3.2Australia 498 1.9Vietnam 497 5.1New Zealand 496 2.5Czech Republic 495 3.4Ireland 492 2.4Slovenia 492 1.5Norway 489 3.1United Kingdom 489 3.7Latvia 488 3.0France 483 2.8Luxembourg 482 1.0Russian Federation 481 3.6Slovak Republic 480 4.1Sweden 479 2.7Portugal 479 4.3Lithuania 477 3.1Spain 477 2.2United States 476 4.1Italy 475 2.2Hungary 469 3.6Israel 465 4.7Croatia 453 4.0Turkey 449 5.2Greece 448 2.3Serbia, Republic of 447 3.8Romania 445 4.1Kazakhstan 442 3.8Bulgaria 437 4.2Cyprus 437 1.2United Arab Emirates 426 2.7Chile 420 3.2Thailand 416 4.0Mexico 409 1.7Uruguay 406 3.2Malaysia 406 3.6Montenegro, Republic of 404 1.3Costa Rica 399 3.5Albania 398 1.9Jordan 390 3.4Argentina 383 3.5Qatar 378 0.9Brazil 376 2.5Colombia 375 3.3Tunisia 373 4.1Peru 370 3.7Indonesia 368 4.6
U.S. state education systemsMassachusetts 512 7.4Connecticut 504 7.3Florida 458 6.5
EmployingEducation system Average score s.e.OECD average 493 0.5Shanghai-China 613 3.0Singapore 574 1.2Hong Kong-China 558 3.1Korea, Republic of 553 4.3Chinese Taipei 549 3.1Liechtenstein 536 3.7Macao-China 536 1.1Japan 530 3.5Switzerland 529 2.9Estonia 524 2.1Vietnam 523 5.1Poland 519 3.5Netherlands 518 3.4Canada 517 1.9Germany 516 2.8Belgium 516 2.1Finland 516 1.8Austria 510 2.5Slovenia 505 1.2Czech Republic 504 2.9Ireland 502 2.4Australia 500 1.7France 496 2.3Latvia 495 2.8New Zealand 495 2.2Denmark 495 2.4Luxembourg 493 0.9United Kingdom 492 3.1Iceland 490 1.6Portugal 489 3.7Russian Federation 487 3.1Norway 486 2.7Italy 485 2.1Slovak Republic 485 3.4Lithuania 482 2.7Spain 481 2.0Hungary 481 3.2United States 480 3.5Croatia 478 3.7Sweden 474 2.5Israel 469 4.6Serbia, Republic of 451 3.4Greece 449 2.7Turkey 448 5.0Romania 446 4.1Cyprus 443 1.1United Arab Emirates 440 2.4Bulgaria 439 4.1Kazakhstan 433 3.2Thailand 426 3.5Malaysia 423 3.3Chile 416 3.3Mexico 413 1.4Montenegro, Republic of 409 1.1Uruguay 408 2.9Costa Rica 401 3.4Albania 397 2.2Tunisia 390 4.3Brazil 388 2.1Argentina 387 3.4Jordan 383 3.4Qatar 373 0.8Indonesia 369 4.2Peru 368 3.9Colombia 368 3.2
U.S. state education systemsMassachusetts 509 5.8Connecticut 502 6.1Florida 466 5.4
InterpretingEducation system Average score s.e.OECD average 497 0.5Shanghai-China 579 2.9Singapore 555 1.4Hong Kong-China 551 3.4Chinese Taipei 549 3.0Liechtenstein 540 4.1Korea, Republic of 540 4.2Japan 531 3.5Macao-China 530 1.0Switzerland 529 3.4Finland 528 2.2Netherlands 526 3.6Canada 521 2.0Germany 517 3.2Poland 515 3.5Australia 514 1.7Belgium 513 2.4Estonia 513 2.1New Zealand 511 2.5France 511 2.5Austria 509 3.3Denmark 508 2.5Ireland 507 2.5United Kingdom 501 3.5Norway 499 3.1Italy 498 2.1Slovenia 498 1.4Vietnam 497 4.5Spain 495 2.2Luxembourg 495 1.1Czech Republic 494 3.0Iceland 492 1.9Portugal 490 4.0United States 490 3.9Latvia 486 3.0Sweden 485 2.4Croatia 477 3.5Hungary 477 3.1Slovak Republic 473 3.3Russian Federation 471 2.9Lithuania 471 2.8Greece 467 3.1Israel 462 5.2Turkey 446 4.6Serbia, Republic of 445 3.4Bulgaria 441 4.2Romania 438 3.1Cyprus 436 1.3Chile 433 3.1Thailand 432 3.4United Arab Emirates 428 2.4Kazakhstan 420 2.6Malaysia 418 3.1Costa Rica 418 2.9Montenegro, Republic of 413 1.4Mexico 413 1.3Uruguay 409 2.7Brazil 401 2.1Argentina 390 4.1Colombia 388 2.5Tunisia 385 3.9Jordan 383 3.0Indonesia 379 4.0Albania 379 2.4Qatar 375 0.8Peru 368 3.8
U.S. state education systemsMassachusetts 524 6.4Connecticut 515 6.4Florida 475 6.5
Average score is higher than U.S. score. Average score is lower than U.S. score.NOTE: Education systems are ordered by 2012 average subscale score. The OECD average is the average of the national averages of the OECD member countries, with each country weighted equally. All average scores reported as higher or lower than the U.S. average score are different at the .05 significance level of statistical significance. Standard error is noted by s.e. Italics indicate non-OECD countries and education systems. Results for Connecticut, Florida, and Massachusetts are for public school students only.SOURCE: Organization for Economic Cooperation and Development (OECD), Program for International Student Assessment (PISA), 2012.
14

National Center for Education StatisticsTable M7. Cut scores of 15-year-old students on PISA mathematics literacy scale at selected percentiles and percentile cut score gaps, by education system: 2012
Education system
Percentile10th 25th 50th 75th 90th 90th to 10th
Cut score s.e. Cut score s.e. Cut score s.e. Cut score s.e. Cut score s.e. Cut score gap s.e.OECD average 375 0.7 430 0.6 494 0.6 558 0.6 614 0.7 239 1.0Costa Rica 323 3.8 361 3.6 403 3.1 449 3.9 496 5.1 172 6.4Indonesia 288 4.2 327 3.8 370 3.6 418 5.2 469 7.8 181 8.8Kazakhstan 343 2.5 383 2.8 429 3.1 478 4.4 527 5.7 183 6.2Colombia 285 4.0 326 2.8 373 2.9 423 3.6 474 4.8 189 6.3Mexico 320 1.9 362 1.6 411 1.6 462 1.7 510 2.0 191 2.7Jordan 290 4.0 335 3.2 383 3.1 435 3.3 485 4.3 195 5.8Argentina 292 4.6 337 3.8 388 4.2 440 4.5 488 4.1 196 6.2Tunisia 292 4.3 334 3.7 384 3.8 437 4.5 488 7.3 196 8.5Brazil 298 2.0 337 1.9 385 2.0 440 2.7 495 4.5 197 4.9Thailand 328 3.1 372 2.6 421 3.3 476 4.8 535 7.3 207 7.9Estonia 417 3.0 465 2.7 519 2.6 576 2.7 626 3.2 209 4.4Romania 344 3.5 386 3.8 439 4.0 497 4.8 553 6.1 209 7.1Chile 323 3.7 365 3.5 417 3.4 476 4.2 532 4.2 209 5.6Malaysia 319 3.2 363 3.1 417 3.4 474 4.3 530 4.9 211 5.9Latvia 387 4.4 434 3.3 489 3.4 546 3.8 597 3.7 211 5.8Denmark 393 4.0 444 3.3 501 2.7 556 2.7 607 3.1 214 5.1Montenegro, Republic of 306 2.0 352 1.7 406 2.1 465 2.0 520 2.7 214 3.4Peru 264 3.4 311 3.6 364 3.8 421 4.9 478 6.7 214 7.5Ireland 391 3.6 445 3.2 503 2.9 559 2.4 610 2.5 219 4.4Finland 409 3.3 463 2.5 520 2.4 577 2.4 629 3.1 219 4.5Vietnam 401 7.4 454 5.3 510 5.0 568 5.5 623 6.8 222 10.1Russian Federation 371 3.9 423 3.1 481 3.3 540 3.6 595 4.7 224 6.1Spain 370 3.1 424 2.6 486 2.3 546 2.1 597 2.4 228 3.9Greece 338 3.8 393 3.6 453 3.2 513 2.8 567 3.1 228 4.9Uruguay 297 4.1 347 3.0 407 3.2 470 3.6 526 3.8 228 5.6Croatia 360 3.3 408 3.6 468 3.5 531 4.5 589 7.3 229 8.0Norway 373 3.9 428 2.9 490 2.9 552 3.3 604 3.4 231 5.2Canada 402 2.4 457 2.1 518 2.2 580 2.3 633 2.3 231 3.3Albania 278 4.8 338 3.0 397 2.3 454 2.4 510 3.5 231 5.9United Arab Emirates 323 2.5 370 2.9 429 2.8 494 2.9 555 3.9 232 4.6Lithuania 364 3.5 418 3.1 478 3.2 540 3.3 596 3.5 232 4.9Serbia, Republic of 335 4.1 386 3.7 445 3.6 508 4.4 567 5.8 233 7.1United States 368 3.9 418 3.7 477 4.0 543 4.4 600 4.3 233 5.8Poland 402 2.8 454 3.3 514 3.8 580 4.9 636 6.0 234 6.7Sweden 360 3.5 415 2.9 478 2.6 543 2.7 596 2.9 236 4.6Turkey 339 3.3 382 3.6 438 4.8 507 8.0 577 9.7 238 10.3Iceland 372 2.8 431 2.6 494 2.3 557 3.0 612 3.3 239 4.3Austria 384 3.9 440 3.2 506 3.3 572 3.5 624 3.8 240 5.5Cyprus 320 2.6 376 1.6 439 1.7 503 2.0 561 2.1 240 3.3Slovenia 384 2.5 434 2.0 498 2.2 566 2.1 624 2.9 240 3.8Italy 366 2.2 421 2.3 485 2.4 550 2.7 607 3.0 241 3.7Macao-China 415 2.8 476 1.7 542 1.7 605 1.7 657 2.3 242 3.7Netherlands 397 5.5 457 5.1 529 4.7 591 4.3 638 3.7 242 6.6Japan 415 5.1 473 4.2 538 3.9 603 4.4 657 5.1 242 7.2Switzerland 408 3.3 466 3.4 534 3.5 597 3.6 651 4.3 243 5.4Czech Republic 377 4.9 432 3.9 500 3.4 566 3.3 621 3.6 244 6.1Hungary 358 4.2 411 3.3 474 3.6 540 4.8 603 6.4 245 7.6United Kingdom 371 5.0 429 4.2 495 3.5 560 3.7 616 4.1 245 6.5Bulgaria 320 4.8 372 4.7 436 4.4 503 5.2 565 5.6 245 7.4Portugal 363 4.2 421 5.0 488 4.7 554 4.3 610 3.9 247 5.8Australia 382 2.3 437 2.0 503 1.9 571 2.3 630 3.0 249 3.8Hong Kong-China 430 6.2 499 4.7 569 3.8 629 3.5 679 4.2 249 7.5Luxembourg 363 3.0 422 1.5 491 1.7 558 1.6 613 2.2 250 3.7Germany 385 4.7 447 3.6 516 3.3 583 3.6 637 3.8 252 6.0Liechtenstein 403 11.2 470 8.0 540 5.9 606 5.0 656 9.2 253 14.5Korea, Republic of 425 5.8 486 4.8 557 4.8 624 5.1 679 6.0 254 8.3France 365 4.7 429 2.7 497 2.9 565 3.4 621 3.5 256 5.8Qatar 257 1.7 306 1.3 365 1.1 440 1.7 514 1.9 257 2.5New Zealand 371 3.6 428 3.2 499 2.8 570 2.8 632 3.0 261 4.7Slovak Republic 352 6.2 413 4.2 481 3.8 553 4.7 613 5.3 261 8.1Shanghai-China 475 5.8 546 4.4 622 3.7 685 3.5 737 3.5 262 6.7Belgium 378 3.9 443 3.4 518 2.6 589 2.8 646 2.5 268 4.6Israel 328 5.7 393 5.1 468 5.2 541 5.3 603 6.0 275 8.2Singapore 432 3.6 501 2.7 579 2.5 650 1.9 707 2.3 275 4.3Chinese Taipei 402 4.8 478 4.8 567 4.2 645 3.4 703 4.9 301 6.9
U.S. state education systemsFlorida 359 7.3 406 6.2 464 7.0 524 6.8 581 8.9 222 11.5Massachusetts 387 4.8 445 6.3 512 7.1 583 9.7 643 9.4 255 10.6Connecticut 376 7.1 435 9.0 506 6.8 577 8.0 636 8.3 260 10.9 Cut score gap is larger than the U.S. percentile cut score gap. Cut score gap is smaller than the U.S. percentile cut score gap.NOTE: This table shows the threshold (or cut) scores for the following: (a) 10th percentile- the bottom 10 percent of students; (b) 25th percentile- the bottom 25 percent of students; (c) 50th percentile- the median (half the students scored below the cut score and half scored above it); (d) 75th percentile- the top 25 percent of students; (e) 90th percentile- the top 10 percent of students. The percentile ranges are specific to each education system's distribution of scores, enabling users to compare cut scores across education systems. Education systems are ordered by cut score gap. The OECD average is the average of the national averages of the OECD member countries, with each country weighted equally. Scores are reported on a scale from 0 to 1,000. Standard error is noted by s.e . Italics indicate non-OECD countries and education systems. Results for Connecticut, Florida, and Massachusetts are for public school students only. SOURCE: Organization for Economic Cooperation and Development (OECD), Program for International Student Assessment (PISA), 2012.
15
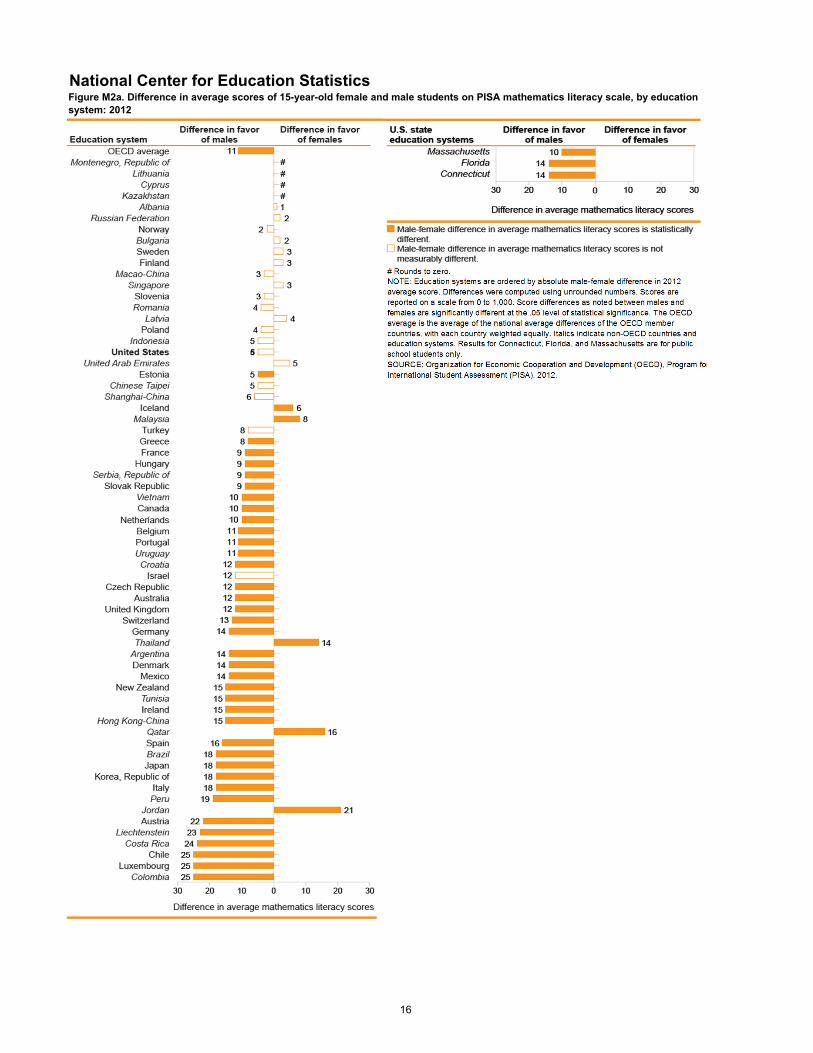
National Center for Education StatisticsFigure M2a. Difference in average scores of 15-year-old female and male students on PISA mathematics literacy scale, by education system: 2012
16

National Center for Education StatisticsTable M2b. Difference in average scores of 15-year-old female and male students on PISA mathematics literacy scale, by education system: 2012Education system Male-female difference s.e.OECD average 11 * 0.6Montenegro, Republic of # †Lithuania # †Cyprus # †Kazakhstan # †Albania -1 3.3Russian Federation -2 3.0Norway 2 3.0Bulgaria -2 4.1Sweden -3 3.0Finland -3 2.9Macao-China 3 1.9Singapore -3 2.5Slovenia 3 3.1Romania 4 3.6Latvia -4 3.6Poland 4 3.4Indonesia 5 3.4United States 5 2.8United Arab Emirates -5 4.7Estonia 5 * 2.6Chinese Taipei 5 8.9Shanghai-China 6 3.3Iceland -6 * 3.0Malaysia -8 * 3.8Turkey 8 4.7Greece 8 * 3.2France 9 * 3.4Hungary 9 * 3.7Serbia, Republic of 9 * 3.9Slovak Republic 9 * 4.5Vietnam 10 * 3.0Canada 10 * 2.0Netherlands 10 * 2.8Belgium 11 * 3.4Portugal 11 * 2.5Uruguay 11 * 3.1Croatia 12 * 4.1Israel 12 7.6Czech Republic 12 * 4.6Australia 12 * 3.1United Kingdom 12 * 4.7Switzerland 13 * 2.7Germany 14 * 2.8Thailand -14 * 3.6Argentina 14 * 2.9Denmark 14 * 2.3Mexico 14 * 1.2New Zealand 15 * 4.3Tunisia 15 * 2.7Ireland 15 * 3.8Hong Kong-China 15 * 5.7Qatar -16 * 1.4Spain 16 * 2.2Brazil 18 * 1.8Japan 18 * 4.3Korea, Republic of 18 * 6.2Italy 18 * 2.5Peru 19 * 3.9Jordan -21 * 6.3Austria 22 * 4.9Liechtenstein 23 * 8.8Costa Rica 24 * 2.4Chile 25 * 3.6Luxembourg 25 * 2.0Colombia 25 * 3.2
U.S. state education systemsMassachusetts 10 * 4.9Florida 14 * 4.1Connecticut 14 * 4.4† Not applicable.# Rounds to zero.* p <.05. All differences between males and females are significantly different at the .05 level of statistical significance. NOTE: Education systems are ordered by absolute male-female difference in 2012 average score. Differences were computed using unrounded numbers. Scores are reported on a scale from 0 to 1,000. The OECD average is the average of the national average differences of the OECD member countries, with each country weighted equally. Standard error is noted by s.e. Italics indicate non-OECD countries and education systems. Results for Connecticut, Florida, and Massachusetts are for public school students only. SOURCE: Organization for Economic Cooperation and Development (OECD), Program for International Student Assessment (PISA), 2012.
17

National Center for Education StatisticsTable M8. Average scores of 15-year-old students on PISA mathematics literacy scale, by national quarters of the PISA index of economic, social and cultural status (ESCS) and education system: 2012
Education system
National quarters of the ESCS indexAll studentsBottom quarter Second quarter Third quarter Top quarter
Average score s.e. Average score s.e. Average score s.e. Average score s.e. Average score s.e.OECD average 452 0.7 482 0.6 506 0.7 542 0.8 494 0.5Albania ― † ― † ― † ― † 394 2.0Argentina 355 4.1 379 4.4 394 4.6 433 4.3 388 3.5Australia 463 2.2 492 2.0 521 2.9 550 2.6 504 1.6Austria 458 4.2 495 4.2 519 3.8 552 4.2 506 2.7Belgium 468 4.0 497 3.2 534 3.0 567 2.9 515 2.1Brazil 360 2.0 377 2.1 395 2.9 437 5.2 391 2.1Bulgaria 384 5.1 424 4.1 449 6.1 501 5.9 439 4.0Canada 486 2.3 509 2.5 529 2.5 558 2.9 518 1.8Chile 378 4.0 409 3.8 429 3.6 477 5.4 423 3.1Chinese Taipei 497 5.2 546 4.5 572 4.0 626 5.2 560 3.3Colombia 343 4.1 365 3.7 382 3.2 417 5.2 376 2.9Costa Rica 373 4.0 394 3.7 412 3.8 450 5.4 407 3.0Croatia 438 3.5 459 3.9 471 4.9 517 5.9 471 3.5Cyprus 398 2.5 428 2.5 448 2.8 492 2.8 440 1.1Czech Republic 450 4.4 486 4.6 508 4.3 552 4.0 499 2.9Denmark 460 3.4 489 3.5 513 2.9 545 3.4 500 2.3Estonia 496 3.0 508 3.2 523 3.6 559 2.9 521 2.0Finland 488 3.1 509 2.5 529 3.2 555 2.6 519 1.9France 442 3.5 476 3.1 511 4.1 561 4.0 495 2.5Germany 467 5.1 502 3.9 540 3.8 569 4.3 514 2.9Greece 413 4.0 439 3.9 460 3.5 502 3.7 453 2.5Hong Kong-China 532 4.8 554 3.7 567 4.4 600 5.8 561 3.2Hungary 422 4.8 464 3.6 486 4.6 539 6.6 477 3.2Iceland 464 2.9 481 3.1 508 3.2 526 3.7 493 1.7Indonesia 356 4.3 363 3.9 374 4.5 408 9.7 375 4.0Ireland 462 4.3 489 3.1 512 2.9 545 3.3 501 2.2Israel 409 5.3 452 5.6 490 6.3 524 5.7 466 4.7Italy 447 2.4 475 2.7 498 2.6 522 2.8 485 2.0Japan 500 5.2 528 4.1 551 4.3 575 5.9 536 3.6Jordan 361 3.0 375 2.9 395 3.9 419 5.8 386 3.1Kazakhstan 405 4.0 427 3.4 437 3.7 458 5.2 432 3.0Korea, Republic of 516 4.9 538 4.8 567 6.2 595 6.6 554 4.6Latvia 453 4.5 472 3.4 508 4.6 532 4.8 491 2.8Liechtenstein 490 9.6 552 11.7 542 12.0 564 11.5 535 4.0Lithuania 439 3.8 465 3.6 491 4.2 522 3.4 479 2.6Luxembourg 438 2.9 470 2.7 508 2.5 546 2.7 490 1.1Macao-China 521 2.6 535 2.6 543 2.3 558 2.4 538 1.0Malaysia 388 3.1 406 3.7 425 4.7 465 5.4 421 3.2Mexico 385 1.9 407 1.9 417 1.9 447 2.4 413 1.4Montenegro, Republic of 375 2.0 401 2.8 413 2.6 453 2.8 410 1.1Netherlands 484 5.3 513 3.8 537 4.8 565 5.1 523 3.5New Zealand 444 3.2 493 4.0 514 3.9 559 3.6 500 2.2Norway 459 4.2 479 3.7 504 3.9 522 3.6 489 2.7Peru 317 3.3 352 3.8 382 5.3 421 7.4 368 3.7Poland 473 3.6 501 4.2 526 5.3 571 6.3 518 3.6Portugal 441 4.5 474 5.0 495 4.8 548 5.2 487 3.8Qatar 338 1.8 377 1.8 399 2.1 401 2.2 376 0.8Romania 407 4.5 428 3.9 444 4.0 501 7.8 445 3.8Russian Federation 445 4.9 468 4.3 496 3.6 521 5.1 482 3.0Serbia, Republic of 416 4.4 436 3.8 450 4.7 495 5.0 449 3.4Shanghai-China 562 6.3 602 4.8 627 3.8 660 5.3 613 3.3Singapore 523 2.9 557 3.3 588 3.2 627 2.8 573 1.3Slovak Republic 416 6.5 473 3.7 496 4.3 545 6.2 482 3.4Slovenia 458 2.6 486 3.1 511 3.1 552 3.2 501 1.2Spain 442 2.8 471 2.4 495 2.8 533 2.5 484 1.9Sweden 443 2.9 470 4.0 495 3.4 518 3.9 478 2.3Switzerland 488 4.0 519 4.0 543 3.9 576 4.6 531 3.0Thailand 407 4.7 412 3.0 421 3.9 468 7.1 427 3.4Tunisia 362 3.8 370 4.7 393 4.1 430 8.9 388 3.9Turkey 412 4.5 436 4.2 447 6.0 498 8.3 448 4.8United Arab Emirates 391 3.2 427 2.4 454 3.6 466 4.2 434 2.4United Kingdom 458 4.1 477 4.1 508 4.1 545 4.0 494 3.3United States 442 3.9 462 4.6 494 5.4 532 4.6 481 3.6Uruguay 364 3.3 390 3.8 414 4.1 472 5.5 409 2.8Vietnam 473 6.1 499 4.9 518 5.8 555 8.2 511 4.8
U.S. state education systemsConnecticut 450 6.1 482 6.5 529 5.6 570 5.6 506 6.2Florida 430 4.8 455 6.7 465 7.0 521 7.1 467 5.8Massachusetts 459 6.0 491 5.3 533 6.6 576 8.8 514 6.2― Not available. † Not applicable.NOTE: The PISA index of economic, social and cultural status (ESCS) was created using student reports on parental occupation, the highest level of parental education, and an index of home possessions related to family wealth, home educational resources and possessions related to “classical” culture in the family home. The home possessions relating to "classical" culture in the family home included possessions such as works of classical literature, books of poetry, and works of art (e.g. paintings). The OECD average is the average of the national averages of the OECD member countries, with each country weighted equally. Standard error is noted by s.e. Italics indicate non-OECD countries and education systems. Results for Connecticut, Florida, and Massachusetts are for public school students only. SOURCE: Organization for Economic Cooperation and Development (OECD), Program for International Student Assessment (PISA), 2012.
18

National Center for Education StatisticsTable M9. Percentage distribution of U.S. 15-year-old public school students on PISA mathematics literacy scale, by proficiency level and percentage of students in enrolled schools eligible for free or reduced-price lunch, based on principals' reports: 2012Percent of students eligible for free or reduced-price lunch
Below level 1 Level 1 Level 2 Level 3 Level 4 Level 5 Level 6Percent s.e. Percent s.e. Percent s.e. Percent s.e. Percent s.e. Percent s.e. Percent s.e.
U.S. average 8.0 0.73 17.9 ** 0.98 26.3 ** 0.84 23.3 0.93 15.8 ** 0.91 6.6 ** 0.61 2.2 ** 0.34Less than 10 percent ‡ † 4.8 !* 2.01 18.9 3.92 27.2 4.07 25.8 * 3.20 15.3 * 3.01 6.4 ! 2.6910 to 24.9 percent 3.1 !* 0.96 11.6 * 1.59 22.3 *** 1.86 26.0 2.31 23.2 * 1.97 10.2 *** 1.48 3.6 0.9825 to 49.9 percent 3.9 * 0.87 12.8 *** 1.46 23.9 1.87 26.1 1.55 19.7 *** 2.10 10.1 *** 1.31 3.6 0.9450 to 74.9 percent 9.3 1.30 22.2 * 1.69 28.8 * 1.47 22.3 1.68 13.0 * 1.38 3.5 * 0.96 ‡ †75 percent or more 17.9 * 2.43 28.0 * 2.48 28.9 ** 2.36 16.8 * 2.07 6.4 * 1.34 1.6 !* 0.78 ‡ † OECD average 8.0 0.12 15.0 *** 0.13 22.5 *** 0.15 23.7 0.15 18.1 *** 0.14 9.3 *** 0.11 3.3 *** 0.08† Not applicable.! Interpret data with caution. Estimate is unstable due to high coefficient of variation.‡ Reporting standards not met.* p <.05. Significantly different from both the U.S. and OECD averages at the .05 level of statistical significance.** p <.05. Significantly different from the OECD average at the .05 level of statistical significance.*** p <.05. Significantly different from the U.S. average at the .05 level of statistical significance.NOTE: To reach a particular proficiency level, a student must correctly answer a majority of items at that level. Students were classified into mathematics literacy levels according to their scores. Exact cut scores are as follows: below level 1 (a score less than or equal to 357.77); level 1 (a score greater than 357.77 and less than or equal to 420.07); level 2 (a score greater than 420.07 and less than or equal to 482.38); level 3 (a score greater than 482.38 and less than or equal to 544.68); level 4 (a score greater than 544.68 and less than or equal to 606.99); level 5 (a score greater than 606.99 and less than or equal to 669.30); and level 6 (a score greater than 669.30). Scores are reported on a scale from 0 to 1,000. The National School Lunch Program provides free or reduced-price lunch for students meeting certain income guidelines. The percentage of students receiving such lunch is an indicator of the socioeconomic level of families served by the school. Data in this table are based on principals' responses to a question in the school questionnaire that asked the approximate percentage of eligible students in the school during the previous school year. The OECD average is the average of the national percentages of the OECD member countries, with each country weighted equally. Standard error is noted by s.e. Free or reduced price-lunch data are for public schools only. Detail may not sum to totals because of rounding. SOURCE: Organization for Economic Cooperation and Development (OECD), Program for International Student Assessment (PISA), 2012.
19
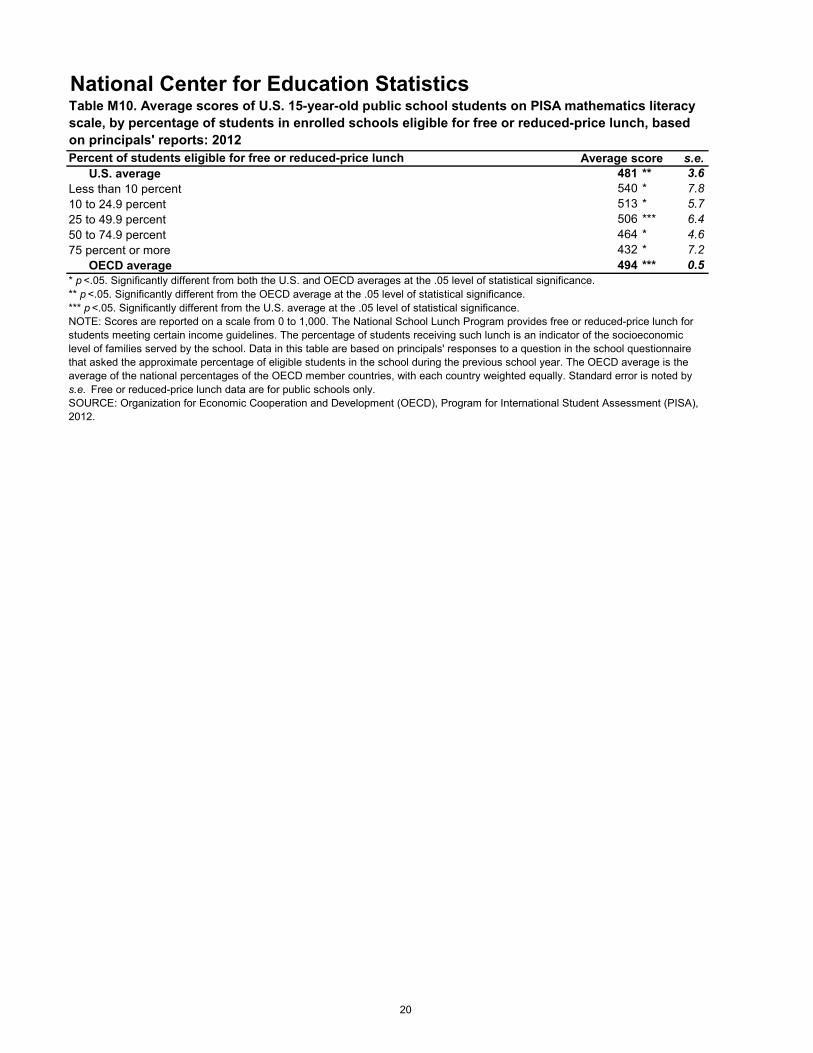
National Center for Education StatisticsTable M10. Average scores of U.S. 15-year-old public school students on PISA mathematics literacy scale, by percentage of students in enrolled schools eligible for free or reduced-price lunch, based on principals' reports: 2012Percent of students eligible for free or reduced-price lunch Average score s.e.
U.S. average 481 ** 3.6Less than 10 percent 540 * 7.810 to 24.9 percent 513 * 5.725 to 49.9 percent 506 *** 6.450 to 74.9 percent 464 * 4.675 percent or more 432 * 7.2
OECD average 494 *** 0.5* p <.05. Significantly different from both the U.S. and OECD averages at the .05 level of statistical significance.** p <.05. Significantly different from the OECD average at the .05 level of statistical significance.*** p <.05. Significantly different from the U.S. average at the .05 level of statistical significance.NOTE: Scores are reported on a scale from 0 to 1,000. The National School Lunch Program provides free or reduced-price lunch for students meeting certain income guidelines. The percentage of students receiving such lunch is an indicator of the socioeconomic level of families served by the school. Data in this table are based on principals' responses to a question in the school questionnaire that asked the approximate percentage of eligible students in the school during the previous school year. The OECD average is the average of the national percentages of the OECD member countries, with each country weighted equally. Standard error is noted by s.e. Free or reduced-price lunch data are for public schools only. SOURCE: Organization for Economic Cooperation and Development (OECD), Program for International Student Assessment (PISA), 2012.
20
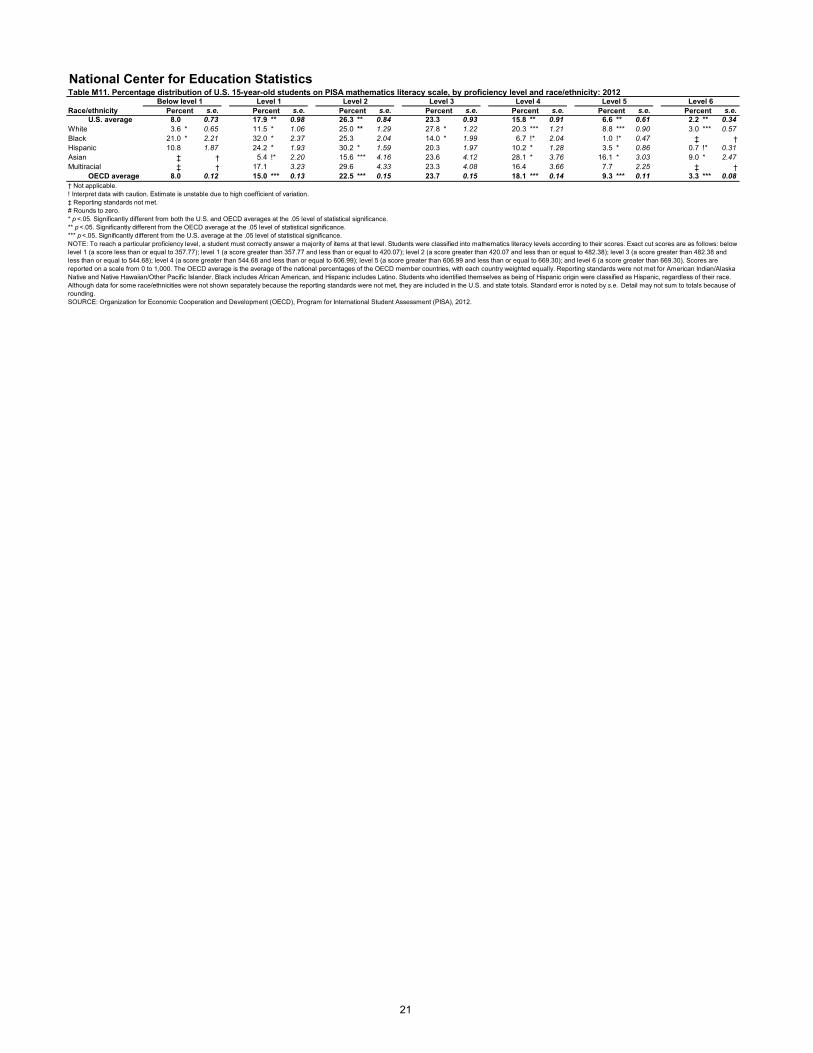
National Center for Education StatisticsTable M11. Percentage distribution of U.S. 15-year-old students on PISA mathematics literacy scale, by proficiency level and race/ethnicity: 2012
Race/ethnicityBelow level 1 Level 1 Level 2 Level 3 Level 4 Level 5 Level 6
Percent s.e. Percent s.e. Percent s.e. Percent s.e. Percent s.e. Percent s.e. Percent s.e.U.S. average 8.0 0.73 17.9 ** 0.98 26.3 ** 0.84 23.3 0.93 15.8 ** 0.91 6.6 ** 0.61 2.2 ** 0.34
White 3.6 * 0.65 11.5 * 1.06 25.0 ** 1.29 27.8 * 1.22 20.3 *** 1.21 8.8 *** 0.90 3.0 *** 0.57Black 21.0 * 2.21 32.0 * 2.37 25.3 2.04 14.0 * 1.99 6.7 !* 2.04 1.0 !* 0.47 ‡ †Hispanic 10.8 1.87 24.2 * 1.93 30.2 * 1.59 20.3 1.97 10.2 * 1.28 3.5 * 0.86 0.7 !* 0.31Asian ‡ † 5.4 !* 2.20 15.6 *** 4.16 23.6 4.12 28.1 * 3.76 16.1 * 3.03 9.0 * 2.47Multiracial ‡ † 17.1 3.23 29.6 4.33 23.3 4.08 16.4 3.66 7.7 2.25 ‡ †
OECD average 8.0 0.12 15.0 *** 0.13 22.5 *** 0.15 23.7 0.15 18.1 *** 0.14 9.3 *** 0.11 3.3 *** 0.08† Not applicable.! Interpret data with caution. Estimate is unstable due to high coefficient of variation.‡ Reporting standards not met.# Rounds to zero.* p <.05. Significantly different from both the U.S. and OECD averages at the .05 level of statistical significance.** p <.05. Significantly different from the OECD average at the .05 level of statistical significance.*** p <.05. Significantly different from the U.S. average at the .05 level of statistical significance.NOTE: To reach a particular proficiency level, a student must correctly answer a majority of items at that level. Students were classified into mathematics literacy levels according to their scores. Exact cut scores are as follows: below level 1 (a score less than or equal to 357.77); level 1 (a score greater than 357.77 and less than or equal to 420.07); level 2 (a score greater than 420.07 and less than or equal to 482.38); level 3 (a score greater than 482.38 and less than or equal to 544.68); level 4 (a score greater than 544.68 and less than or equal to 606.99); level 5 (a score greater than 606.99 and less than or equal to 669.30); and level 6 (a score greater than 669.30). Scores are reported on a scale from 0 to 1,000. The OECD average is the average of the national percentages of the OECD member countries, with each country weighted equally. Reporting standards were not met for American Indian/Alaska Native and Native Hawaiian/Other Pacific Islander. Black includes African American, and Hispanic includes Latino. Students who identified themselves as being of Hispanic origin were classified as Hispanic, regardless of their race. Although data for some race/ethnicities were not shown separately because the reporting standards were not met, they are included in the U.S. and state totals. Standard error is noted by s.e. Detail may not sum to totals because of rounding. SOURCE: Organization for Economic Cooperation and Development (OECD), Program for International Student Assessment (PISA), 2012.
21
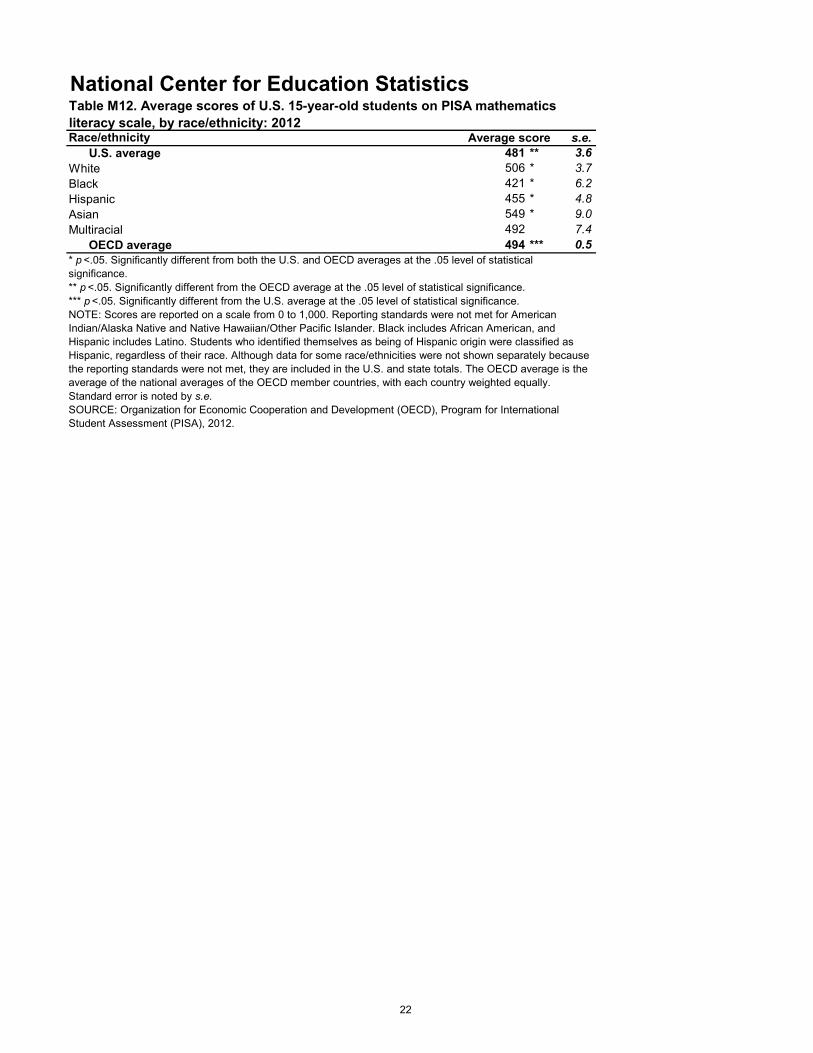
National Center for Education StatisticsTable M12. Average scores of U.S. 15-year-old students on PISA mathematics literacy scale, by race/ethnicity: 2012 Race/ethnicity Average score s.e.
U.S. average 481 ** 3.6White 506 * 3.7Black 421 * 6.2Hispanic 455 * 4.8Asian 549 * 9.0Multiracial 492 7.4
OECD average 494 *** 0.5* p <.05. Significantly different from both the U.S. and OECD averages at the .05 level of statistical significance.** p <.05. Significantly different from the OECD average at the .05 level of statistical significance.*** p <.05. Significantly different from the U.S. average at the .05 level of statistical significance.NOTE: Scores are reported on a scale from 0 to 1,000. Reporting standards were not met for American Indian/Alaska Native and Native Hawaiian/Other Pacific Islander. Black includes African American, and Hispanic includes Latino. Students who identified themselves as being of Hispanic origin were classified as Hispanic, regardless of their race. Although data for some race/ethnicities were not shown separately because the reporting standards were not met, they are included in the U.S. and state totals. The OECD average is the average of the national averages of the OECD member countries, with each country weighted equally. Standard error is noted by s.e. SOURCE: Organization for Economic Cooperation and Development (OECD), Program for International Student Assessment (PISA), 2012.
22
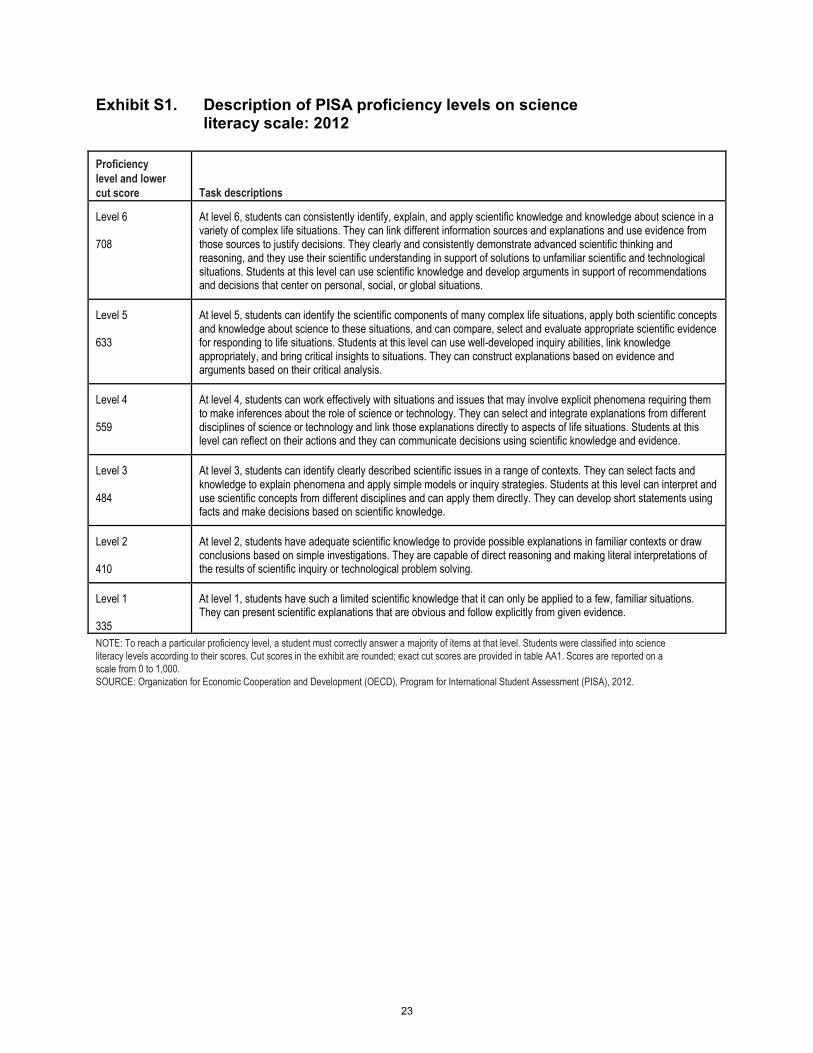
Exhibit S1. Description of PISA proficiency levels on science literacy scale: 2012
Proficiency level and lower cut score Task descriptions
Level 6
708
At level 6, students can consistently identify, explain, and apply scientific knowledge and knowledge about science in a variety of complex life situations. They can link different information sources and explanations and use evidence from those sources to justify decisions. They clearly and consistently demonstrate advanced scientific thinking and reasoning, and they use their scientific understanding in support of solutions to unfamiliar scientific and technological situations. Students at this level can use scientific knowledge and develop arguments in support of recommendations and decisions that center on personal, social, or global situations.
Level 5
633
At level 5, students can identify the scientific components of many complex life situations, apply both scientific concepts and knowledge about science to these situations, and can compare, select and evaluate appropriate scientific evidence for responding to life situations. Students at this level can use well-developed inquiry abilities, link knowledge appropriately, and bring critical insights to situations. They can construct explanations based on evidence and arguments based on their critical analysis.
Level 4
559
At level 4, students can work effectively with situations and issues that may involve explicit phenomena requiring them to make inferences about the role of science or technology. They can select and integrate explanations from different disciplines of science or technology and link those explanations directly to aspects of life situations. Students at this level can reflect on their actions and they can communicate decisions using scientific knowledge and evidence.
Level 3
484
At level 3, students can identify clearly described scientific issues in a range of contexts. They can select facts and knowledge to explain phenomena and apply simple models or inquiry strategies. Students at this level can interpret and use scientific concepts from different disciplines and can apply them directly. They can develop short statements using facts and make decisions based on scientific knowledge.
Level 2
410
At level 2, students have adequate scientific knowledge to provide possible explanations in familiar contexts or draw conclusions based on simple investigations. They are capable of direct reasoning and making literal interpretations of the results of scientific inquiry or technological problem solving.
Level 1
335
At level 1, students have such a limited scientific knowledge that it can only be applied to a few, familiar situations. They can present scientific explanations that are obvious and follow explicitly from given evidence.
NOTE: To reach a particular proficiency level, a student must correctly answer a majority of items at that level. Students were classified into science literacy levels according to their scores. Cut scores in the exhibit are rounded; exact cut scores are provided in table AA1. Scores are reported on a scale from 0 to 1,000. SOURCE: Organization for Economic Cooperation and Development (OECD), Program for International Student Assessment (PISA), 2012.
23

National Center for Education StatisticsTable S1. Percentage distribution of 15-year-old students on PISA science literacy scale, by proficiency level and education system: 2012
Education systemBelow level 1 Level 1 Level 2 Level 3 Level 4 Level 5 Level 6Percent s.e. Percent s.e. Percent s.e. Percent s.e. Percent s.e. Percent s.e. Percent s.e.
OECD average 4.8 0.09 13.0 0.14 24.5 0.16 28.8 0.17 20.5 0.15 7.2 0.10 1.1 0.04Albania 23.5 1.04 29.6 0.94 28.5 1.19 14.4 0.78 3.6 0.41 0.4 ! 0.14 ‡ †Argentina 19.8 1.39 31.0 1.46 31.1 1.33 14.8 1.20 3.0 0.43 0.2 ! 0.10 ‡ †Australia 3.4 0.25 10.2 0.41 21.5 0.47 28.5 0.68 22.8 0.63 10.9 0.47 2.6 0.25Austria 3.6 0.54 12.2 0.92 24.3 1.05 30.1 0.85 21.9 0.81 7.0 0.62 0.8 0.20Belgium 5.9 0.53 11.8 0.58 21.5 0.63 28.7 0.71 23.0 0.66 8.1 0.42 0.9 0.16Brazil 18.6 0.78 35.1 0.79 30.7 0.78 12.5 0.68 2.8 0.37 0.3 ! 0.10 ‡ †Bulgaria 14.4 1.34 22.5 1.15 26.3 1.07 22.5 1.09 11.2 0.84 2.8 0.50 0.3 ! 0.12Canada 2.4 0.24 8.0 0.38 21.0 0.65 32.0 0.54 25.3 0.58 9.5 0.47 1.8 0.20Chile 8.1 0.80 26.3 1.11 34.6 1.06 22.4 0.96 7.5 0.60 1.0 0.15 # ! †Chinese Taipei 1.6 0.25 8.2 0.64 20.8 0.89 33.7 0.97 27.3 1.00 7.8 0.56 0.6 0.13Colombia 19.8 1.36 36.3 1.10 30.8 1.08 11.0 0.83 1.9 0.25 ‡ † ‡ †Costa Rica 8.6 0.79 30.7 1.30 39.2 1.25 17.8 1.12 3.4 0.57 0.2 ! 0.11 ‡ †Croatia 3.2 0.38 14.0 0.74 29.1 0.99 31.4 1.19 17.6 1.16 4.3 0.75 ‡ †Cyprus 14.4 0.47 23.7 0.66 30.3 0.89 21.3 0.73 8.4 0.43 1.8 0.29 0.2 ! 0.08Czech Republic 3.3 0.62 10.5 1.03 24.7 0.99 31.7 1.23 22.2 0.96 6.7 0.53 0.9 0.18Denmark 4.7 0.55 12.0 0.69 25.7 0.80 31.3 0.90 19.6 0.79 6.1 0.67 0.7 0.17Estonia 0.5 0.14 4.5 0.43 19.0 0.87 34.5 0.87 28.7 0.96 11.1 0.66 1.7 0.25Finland 1.8 0.28 5.9 0.48 16.8 0.69 29.6 0.77 28.8 0.73 13.9 0.62 3.2 0.38France 6.1 0.67 12.6 0.71 22.9 1.08 29.2 1.12 21.3 0.87 6.9 0.68 1.0 0.21Germany 2.9 0.46 9.3 0.73 20.5 0.82 28.9 0.89 26.2 1.05 10.6 0.80 1.6 0.28Greece 7.4 0.70 18.1 1.14 31.0 1.10 28.8 1.02 12.2 0.81 2.3 0.40 ‡ †Hong Kong-China 1.2 0.23 4.4 0.52 13.0 0.72 29.8 1.06 34.9 0.99 14.9 0.91 1.8 0.36Hungary 4.1 0.61 14.0 1.04 26.4 1.08 30.9 1.16 18.7 0.98 5.5 0.73 0.5 ! 0.18Iceland 8.0 0.56 16.0 0.72 27.5 0.87 27.2 0.86 16.2 0.74 4.6 0.60 0.6 0.17Indonesia 24.7 1.96 41.9 1.42 26.3 1.54 6.5 1.02 ‡ † ‡ † ‡ †Ireland 2.6 0.40 8.5 0.76 22.0 1.15 31.1 1.03 25.0 0.94 9.3 0.63 1.5 0.25Israel 11.2 1.08 17.7 0.93 24.8 0.93 24.4 1.19 16.1 1.12 5.2 0.58 0.6 ! 0.22Italy 4.9 0.35 13.8 0.52 26.0 0.58 30.1 0.66 19.1 0.59 5.5 0.37 0.6 0.08Japan 2.0 0.39 6.4 0.61 16.3 0.79 27.5 0.92 29.5 1.06 14.8 0.93 3.4 0.49Jordan 18.2 1.21 31.4 0.96 32.2 1.04 15.0 0.86 3.0 0.57 ‡ † ‡ †Kazakhstan 11.3 0.99 30.7 1.49 36.8 1.16 17.8 1.19 3.3 0.45 0.2 ! 0.09 ‡ †Korea, Republic of 1.2 0.25 5.5 0.60 18.0 1.02 33.6 1.11 30.1 1.24 10.6 0.93 1.1 ! 0.39Latvia 1.8 0.39 10.5 0.90 28.2 1.20 35.1 1.02 20.0 1.05 4.0 0.47 0.3 ! 0.13Liechtenstein ‡ † 9.6 1.94 22.0 3.94 30.8 3.79 26.7 2.58 9.1 1.47 ‡ †Lithuania 3.4 0.48 12.7 0.84 27.6 1.00 32.9 1.08 18.3 0.88 4.7 0.47 0.4 0.09Luxembourg 7.2 0.42 15.1 0.67 24.2 0.63 26.2 0.60 19.2 0.53 7.0 0.49 1.2 0.17Macao-China 1.4 0.20 7.4 0.49 22.2 0.60 36.2 0.81 26.2 0.73 6.2 0.35 0.4 0.10Malaysia 14.5 1.13 31.0 1.21 33.9 1.10 16.5 1.07 3.7 0.54 0.3 ! 0.13 ‡ †Mexico 12.6 0.52 34.4 0.58 37.0 0.59 13.8 0.52 2.1 0.16 0.1 ! 0.04 ‡ †Montenegro, Republic of 18.7 0.74 32.0 0.98 29.7 0.94 15.4 0.76 3.8 0.47 0.4 ! 0.14 ‡ †Netherlands 3.1 0.53 10.1 0.83 20.1 1.35 29.1 1.28 25.8 1.24 10.5 0.98 1.3 0.28New Zealand 4.7 0.39 11.6 0.76 21.7 0.94 26.4 0.95 22.3 0.85 10.7 0.62 2.7 0.25Norway 6.0 0.63 13.6 0.71 24.8 0.80 28.9 0.91 19.0 0.79 6.4 0.56 1.1 0.24Peru 31.5 1.61 37.0 1.26 23.5 1.29 7.0 0.85 1.0 0.28 ‡ † ‡ †Poland 1.3 0.32 7.7 0.70 22.5 0.98 33.1 0.92 24.5 0.96 9.1 0.76 1.7 0.35Portugal 4.7 0.66 14.3 1.09 27.3 0.96 31.4 1.25 17.8 1.06 4.2 0.55 0.3 ! 0.11Qatar 34.6 0.38 28.0 0.58 19.6 0.71 11.2 0.39 5.1 0.40 1.3 0.11 0.1 0.04Romania 8.7 0.77 28.7 1.32 34.6 1.23 21.0 1.12 6.2 0.77 0.9 0.26 ‡ †Russian Federation 3.6 0.39 15.1 0.96 30.1 1.08 31.2 0.89 15.7 0.98 3.9 0.51 0.3 ! 0.16Serbia, Republic of 10.3 0.99 24.7 1.15 32.4 1.21 22.8 1.06 8.1 0.63 1.6 0.35 ‡ †Shanghai-China 0.3 ! 0.11 2.4 0.36 10.0 0.86 24.6 0.87 35.5 1.11 23.0 1.09 4.2 0.57Singapore 2.2 0.27 7.4 0.48 16.7 0.73 24.0 0.73 27.0 0.87 16.9 0.94 5.8 0.41Slovak Republic 9.2 0.95 17.6 1.14 27.0 1.30 26.2 1.62 15.0 1.02 4.3 0.58 0.6 ! 0.25Slovenia 2.4 0.19 10.4 0.55 24.5 1.00 30.0 1.02 23.0 0.92 8.4 0.71 1.2 0.24Spain 3.7 0.33 12.0 0.51 27.3 0.64 32.8 0.60 19.4 0.53 4.5 0.26 0.3 0.08Sweden 7.3 0.62 15.0 0.80 26.2 0.84 28.0 0.84 17.2 0.77 5.6 0.45 0.7 0.14Switzerland 3.0 0.31 9.8 0.62 22.8 0.82 31.3 0.74 23.7 0.86 8.3 0.70 1.0 0.22Thailand 7.0 0.64 26.6 1.33 37.5 1.07 21.6 1.14 6.4 0.74 0.9 ! 0.27 ‡ †Tunisia 21.3 1.45 34.0 1.07 31.1 1.36 11.7 1.00 1.8 0.49 ‡ † ‡ †Turkey 4.4 0.50 21.9 1.27 35.4 1.43 25.1 1.28 11.3 1.28 1.8 0.34 ‡ †United Arab Emirates 11.3 0.76 23.8 0.99 29.9 0.83 22.3 0.88 10.1 0.60 2.3 0.25 0.3 0.07United Kingdom 4.3 0.48 10.7 0.86 22.4 1.00 28.4 0.98 23.0 0.91 9.3 0.70 1.8 0.34United States 4.2 0.54 14.0 1.08 26.7 1.08 28.9 1.07 18.8 1.07 6.3 0.64 1.1 0.20Uruguay 19.7 1.06 27.2 0.92 29.3 1.00 17.1 0.95 5.6 0.53 1.0 0.24 ‡ †Vietnam 0.9 ! 0.26 5.8 0.90 20.7 1.40 37.5 1.48 27.0 1.50 7.1 0.90 1.0 ! 0.32
U.S. state education systemsConnecticut 3.3 0.82 10.2 1.36 21.4 1.58 29.4 1.69 22.8 1.46 10.7 1.13 2.2 0.60Florida 5.1 0.96 16.1 1.61 28.4 1.61 28.2 2.00 16.6 1.64 4.9 1.01 ‡ †Massachusetts 2.6 0.65 8.9 1.03 21.2 1.96 29.4 1.50 23.8 1.84 11.3 1.48 2.9 0.73† Not applicable.# Rounds to zero.! Interpret data with caution. Estimate is unstable due to high coefficient of variation.‡ Reporting standards not met.NOTE: To reach a particular proficiency level, a student must correctly answer a majority of items at that level. Students were classified into science literacy levels according to their scores. Exact cut scores are as follows: below level 1 (a score less than or equal to 334.94); level 1 (a score greater than 334.94 and less than or equal to 409.54); level 2 (a score greater than 409.54 and less than or equal to 484.14); level 3 (a score greater than 484.14 and less than or equal to 558.73); level 4 (a score greater than 558.73 and less than or equal to 633.33); level 5 (a score greater than 633.33 and less than or equal to 707.93); and level 6 (a score greater than 707.93). Scores are reported on a scale from 0 to 1,000. The OECD average is the average of the national percentages of the OECD member countries, with each country weighted equally. Standard error is noted by s.e. Detail may not sum to totals because of rounding. Italics indicate non-OECD countries and education systems. Results for Connecticut, Florida, and Massachusetts are for public school students only. SOURCE: Organization for Economic Cooperation and Development (OECD), Program for International Student Assessment (PISA), 2012.
24

National Center for Education StatisticsFigure S1a. Percentage of 15-year-old students performing at PISA science literacy proficiency levels 5 and above and below level 2, by education system: 2012
Education systemBelow level 2
Levels 5 and above
OECD average 18 is below level 2 8 is level 5 and above
Shanghai-China 3* is below level 2 27* is level 5 and above
Singapore 10* is below level 2 23* is level 5 and above
Japan 8* is below level 2 18* is level 5 and above
Finland 8* is below level 2 17* is level 5 and above
Hong Kong-China 6* is below level 2 17* is level 5 and above
Australia 14* is below level 2 14* is level 5 and above
New Zealand 16 is below level 2 13* is level 5 and above
Estonia 5* is below level 2 13* is level 5 and above
Germany 12* is below level 2 12* is level 5 and above
Netherlands 13* is below level 2 12* is level 5 and above
Korea, Republic of 7* is below level 2 12* is level 5 and above
Canada 10* is below level 2 11* is level 5 and above
United Kingdom 15 is below level 2 11* is level 5 and above
Poland 9* is below level 2 11* is level 5 and above
Ireland 11* is below level 2 11* is level 5 and above
Liechtenstein 10* is below level 2 10 is level 5 and above
Slovenia 13* is below level 2 10* is level 5 and above
Switzerland 13* is below level 2 9 is level 5 and above
Belgium 18 is below level 2 9 is level 5 and above
Chinese Taipei 10* is below level 2 8 is level 5 and above
Luxembourg 22* is below level 2 8 is level 5 and above
Vietnam 7* is below level 2 8 is level 5 and above
France 19 is below level 2 8 is level 5 and above
Austria 16 is below level 2 8 is level 5 and above
Czech Republic 14* is below level 2 8 is level 5 and above
Norway 20 is below level 2 8 is level 5 and above
United States 18 is below level 2 7 is level 5 and above
Denmark 17 is below level 2 7 is level 5 and above
Macao-China 9* is below level 2 7 is level 5 and above
Sweden 22* is below level 2 6 is level 5 and above
Italy 19 is below level 2 6 is level 5 and above
Hungary 18 is below level 2 6 is level 5 and above
Israel 29* is below level 2 6 is level 5 and above
Iceland 24* is below level 2 5* is level 5 and above
Lithuania 16 is below level 2 5* is level 5 and above
Slovak Republic 27* is below level 2 5* is level 5 and above
Education systemBelow level 2
Levels 5 and above
Spain 16 is below level 2 5* is level 5 and above
Croatia 17 is below level 2 5* is level 5 and above
Portugal 19 is below level 2 5* is level 5 and above
Latvia 12* is below level 2 4* is level 5 and above
Russian Federation 19 is below level 2 4* is level 5 and above
Bulgaria 37* is below level 2 3* is level 5 and above
United Arab Emirates 35* is below level 2 3* is level 5 and above
Greece 26* is below level 2 2* is level 5 and above
Cyprus 38* is below level 2 2* is level 5 and above
Turkey 26* is below level 2 2* is level 5 and above
Serbia, Republic of 35* is below level 2 2* is level 5 and above
Qatar 63* is below level 2 1* is level 5 and above
Uruguay 47* is below level 2 1* is level 5 and above
Chile 34* is below level 2 1* is level 5 and above
Thailand 34* is below level 2 1* is level 5 and above
Romania 37* is below level 2 1!* is level 5 and above
Albania 53* is below level 2 #!* is level 5 and above
Montenegro, Republic of 51* is below level 2 #!* is level 5 and above
Malaysia 46* is below level 2 #!* is level 5 and above
Brazil 54* is below level 2 #!* is level 5 and above
Jordan 50* is below level 2 ‡ is level 5 and above
Argentina 51* is below level 2 #!* is level 5 and above
Costa Rica 39* is below level 2 #!* is level 5 and above
Kazakhstan 42* is below level 2 #!* is level 5 and above
Mexico 47* is below level 2 #!* is level 5 and above
Colombia 56* is below level 2 ‡ is level 5 and above
Tunisia 55* is below level 2 ‡ is level 5 and above
Indonesia 67* is below level 2 ‡ is level 5 and above
Peru 68* is below level 2 ‡ is level 5 and above
U.S. state education systems
Massachusetts 11* is below level 2 14* is level 5 and above
Connecticut 13* is below level 2 13* is level 5 and above
Florida 21 is below level 2 5 is level 5 and above
Below level 2 Levels 5 and above
# Rounds to zero.! Interpret with caution. Estimate is unstable due to high coefficient of variation.‡ Reporting standards not met.* p < .05. Significantly different from the U.S. percentage at the .05 level of significance.NOTE: Education systems are ordered by 2012 percentages of 15-year-olds in levels 5 and above. To reach a particular proficiency level, a student must correctly answer a majority of items at that level. Students were classified into science proficiency levels according to their scores. Cut scores for each proficiency level can be found in table A-1 in appendix A. The OECD average is the average of the national percentages of the OECD member countries, with each country weighted equally. Italics indicate non-OECD countries and education systems. Results for Connecticut, Florida, and Massachusetts are for public school students only. The standard errors of the estimates are shown in table S1b available at http://nces.ed.gov/pubsearch/pubsinfo.asp?pubid=2014024.SOURCE: Organization for Economic Cooperation and Development (OECD), Program for International Student Assessment (PISA), 2012.
0 20 40 60 80 100 0 20 40 60 80 100Percent Percent
Percent0 20 40 60 80 100
18 83 27 *
10 23 *8 * 18 *8 17 *6 17 *
14 14 *16 13 *5
***
* 13 *12 12 *13 12 *7 12 *
10 11 *15 11 *9 11 *
11
****
** 11 *
10 * 1013 10 *13 918 9 10 822 87
**
*** 8
19 816 814 * 820 818 717 79 * 7
22 * 619 618 6
* 624 5 *
**
16 527
29*
* 5
16 5 *17 5 *19 5 *12 * 4 *19 4 *37 * 3 *35 * 3 *26 * 2 *38 * 2 *26 * 2 *35 * 2 *63 * 1 *47 * 1 *34 * 1 *34 * 1 *37 * 1 !*53 * # !*51 * # !*46 * # !*54 * # !*50 * ‡51 * # !*39 * # !*42 * # !*47 * # !*56 * ‡55 * ‡67 * ‡68 * ‡
11 * 14 *13 * 13 *21 5
**
25
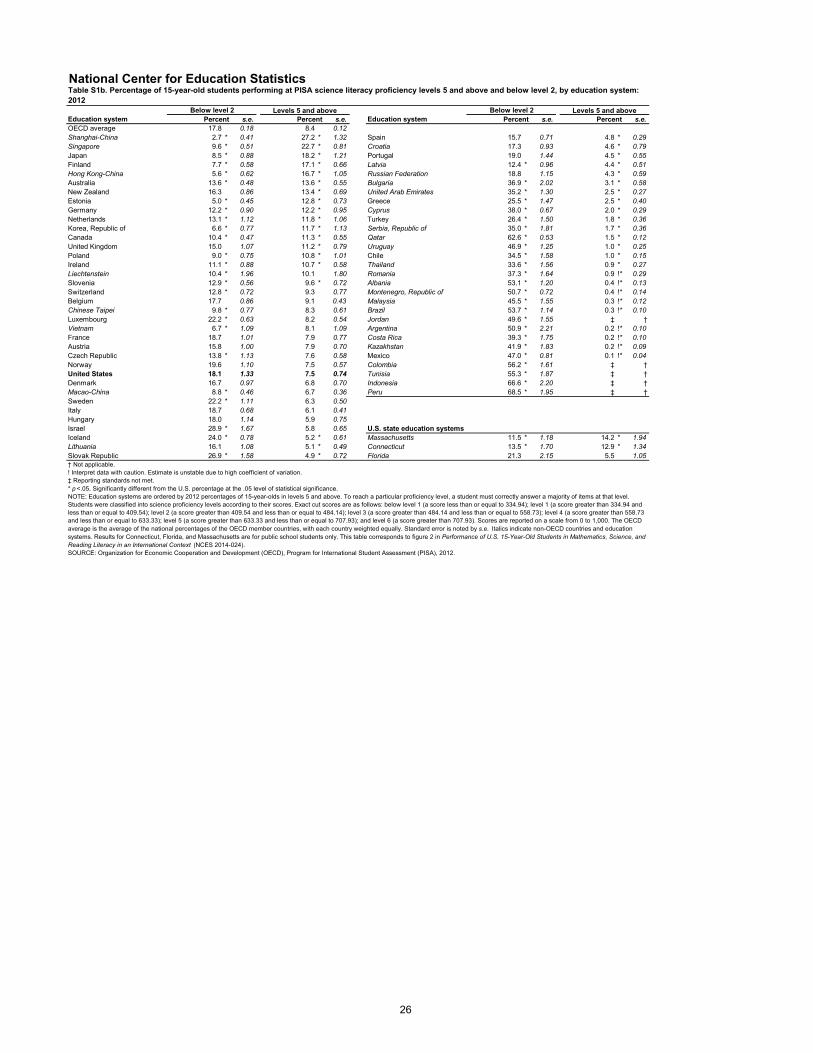
National Center for Education StatisticsTable S1b. Percentage of 15-year-old students performing at PISA science literacy proficiency levels 5 and above and below level 2, by education system: 2012
Education systemBelow level 2 Levels 5 and above
Percent s.e. Percent s.e. Education systemBelow level 2 Levels 5 and above
Percent s.e. Percent s.e.OECD average 17.8 0.18 8.4 0.12Shanghai-China 2.7 * 0.41 27.2 * 1.32Singapore 9.6 * 0.51 22.7 * 0.81Japan 8.5 * 0.88 18.2 * 1.21Finland 7.7 * 0.58 17.1 * 0.66Hong Kong-China 5.6 * 0.62 16.7 * 1.05Australia 13.6 * 0.48 13.6 * 0.55New Zealand 16.3 0.86 13.4 * 0.69Estonia 5.0 * 0.45 12.8 * 0.73Germany 12.2 * 0.90 12.2 * 0.95Netherlands 13.1 * 1.12 11.8 * 1.06Korea, Republic of 6.6 * 0.77 11.7 * 1.13Canada 10.4 * 0.47 11.3 * 0.55United Kingdom 15.0 1.07 11.2 * 0.79Poland 9.0 * 0.75 10.8 * 1.01Ireland 11.1 * 0.88 10.7 * 0.58Liechtenstein 10.4 * 1.96 10.1 1.80Slovenia 12.9 * 0.56 9.6 * 0.72Switzerland 12.8 * 0.72 9.3 0.77Belgium 17.7 0.86 9.1 0.43Chinese Taipei 9.8 * 0.77 8.3 0.61Luxembourg 22.2 * 0.63 8.2 0.54Vietnam 6.7 * 1.09 8.1 1.09France 18.7 1.01 7.9 0.77Austria 15.8 1.00 7.9 0.70Czech Republic 13.8 * 1.13 7.6 0.58Norway 19.6 1.10 7.5 0.57United States 18.1 1.33 7.5 0.74Denmark 16.7 0.97 6.8 0.70Macao-China 8.8 * 0.46 6.7 0.36Sweden 22.2 * 1.11 6.3 0.50Italy 18.7 0.68 6.1 0.41Hungary 18.0 1.14 5.9 0.75Israel 28.9 * 1.67 5.8 0.65Iceland 24.0 * 0.78 5.2 * 0.61Lithuania 16.1 1.08 5.1 * 0.49Slovak Republic 26.9 * 1.58 4.9 * 0.72
Spain 15.7 0.71 4.8 * 0.29Croatia 17.3 0.93 4.6 * 0.79Portugal 19.0 1.44 4.5 * 0.55Latvia 12.4 * 0.96 4.4 * 0.51Russian Federation 18.8 1.15 4.3 * 0.59Bulgaria 36.9 * 2.02 3.1 * 0.58United Arab Emirates 35.2 * 1.30 2.5 * 0.27Greece 25.5 * 1.47 2.5 * 0.40Cyprus 38.0 * 0.67 2.0 * 0.29Turkey 26.4 * 1.50 1.8 * 0.36Serbia, Republic of 35.0 * 1.81 1.7 * 0.36Qatar 62.6 * 0.53 1.5 * 0.12Uruguay 46.9 * 1.25 1.0 * 0.25Chile 34.5 * 1.58 1.0 * 0.15Thailand 33.6 * 1.56 0.9 * 0.27Romania 37.3 * 1.64 0.9 !* 0.29Albania 53.1 * 1.20 0.4 !* 0.13Montenegro, Republic of 50.7 * 0.72 0.4 !* 0.14Malaysia 45.5 * 1.55 0.3 !* 0.12Brazil 53.7 * 1.14 0.3 !* 0.10Jordan 49.6 * 1.55 ‡ †Argentina 50.9 * 2.21 0.2 !* 0.10Costa Rica 39.3 * 1.75 0.2 !* 0.10Kazakhstan 41.9 * 1.83 0.2 !* 0.09Mexico 47.0 * 0.81 0.1 !* 0.04Colombia 56.2 * 1.61 ‡ †Tunisia 55.3 * 1.87 ‡ †Indonesia 66.6 * 2.20 ‡ †Peru 68.5 * 1.95 ‡ †
U.S. state education systemsMassachusetts 11.5 * 1.18 14.2 * 1.94Connecticut 13.5 * 1.70 12.9 * 1.34Florida 21.3 2.15 5.5 1.05
† Not applicable.! Interpret data with caution. Estimate is unstable due to high coefficient of variation.‡ Reporting standards not met.* p <.05. Significantly different from the U.S. percentage at the .05 level of statistical significance.NOTE: Education systems are ordered by 2012 percentages of 15-year-olds in levels 5 and above. To reach a particular proficiency level, a student must correctly answer a majority of items at that level. Students were classified into science proficiency levels according to their scores. Exact cut scores are as follows: below level 1 (a score less than or equal to 334.94); level 1 (a score greater than 334.94 and less than or equal to 409.54); level 2 (a score greater than 409.54 and less than or equal to 484.14); level 3 (a score greater than 484.14 and less than or equal to 558.73); level 4 (a score greater than 558.73 and less than or equal to 633.33); level 5 (a score greater than 633.33 and less than or equal to 707.93); and level 6 (a score greater than 707.93). Scores are reported on a scale from 0 to 1,000. The OECD average is the average of the national percentages of the OECD member countries, with each country weighted equally. Standard error is noted by s.e. Italics indicate non-OECD countries and education systems. Results for Connecticut, Florida, and Massachusetts are for public school students only. This table corresponds to figure 2 in Performance of U.S. 15-Year-Old Students in Mathematics, Science, and Reading Literacy in an International Context (NCES 2014-024).SOURCE: Organization for Economic Cooperation and Development (OECD), Program for International Student Assessment (PISA), 2012.
26
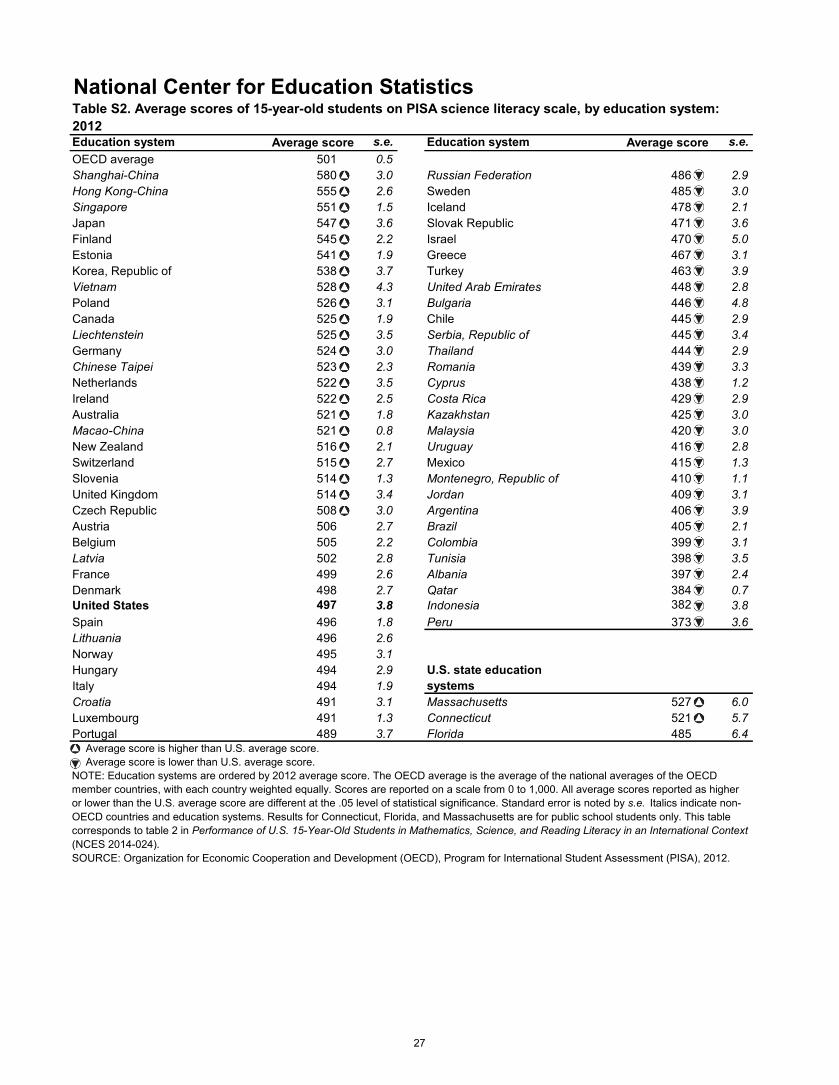
National Center for Education StatisticsTable S2. Average scores of 15-year-old students on PISA science literacy scale, by education system: 2012Education system Average score s.e. Education system Average score s.e.OECD average 501 0.5Shanghai-China 580 3.0Hong Kong-China 555 2.6Singapore 551 1.5Japan 547 3.6Finland 545 2.2Estonia 541 1.9Korea, Republic of 538 3.7Vietnam 528 4.3Poland 526 3.1Canada 525 1.9Liechtenstein 525 3.5Germany 524 3.0Chinese Taipei 523 2.3Netherlands 522 3.5Ireland 522 2.5Australia 521 1.8Macao-China 521 0.8New Zealand 516 2.1Switzerland 515 2.7Slovenia 514 1.3United Kingdom 514 3.4Czech Republic 508 3.0Austria 506 2.7Belgium 505 2.2Latvia 502 2.8France 499 2.6Denmark 498 2.7United States 497 3.8Spain 496 1.8Lithuania 496 2.6Norway 495 3.1Hungary 494 2.9Italy 494 1.9Croatia 491 3.1Luxembourg 491 1.3Portugal 489 3.7
Russian Federation 486 2.9Sweden 485 3.0Iceland 478 2.1Slovak Republic 471 3.6Israel 470 5.0Greece 467 3.1Turkey 463 3.9United Arab Emirates 448 2.8Bulgaria 446 4.8Chile 445 2.9Serbia, Republic of 445 3.4Thailand 444 2.9Romania 439 3.3Cyprus 438 1.2Costa Rica 429 2.9Kazakhstan 425 3.0Malaysia 420 3.0Uruguay 416 2.8Mexico 415 1.3Montenegro, Republic of 410 1.1Jordan 409 3.1Argentina 406 3.9Brazil 405 2.1Colombia 399 3.1Tunisia 398 3.5Albania 397 2.4Qatar 384 0.7Indonesia 382 3.8Peru 373 3.6
U.S. state education systemsMassachusetts 527 6.0Connecticut 521 5.7Florida 485 6.4
Average score is higher than U.S. average score. Average score is lower than U.S. average score.NOTE: Education systems are ordered by 2012 average score. The OECD average is the average of the national averages of the OECD member countries, with each country weighted equally. Scores are reported on a scale from 0 to 1,000. All average scores reported as higher or lower than the U.S. average score are different at the .05 level of statistical significance. Standard error is noted by s.e. Italics indicate non-OECD countries and education systems. Results for Connecticut, Florida, and Massachusetts are for public school students only. This table corresponds to table 2 in Performance of U.S. 15-Year-Old Students in Mathematics, Science, and Reading Literacy in an International Context (NCES 2014-024).SOURCE: Organization for Economic Cooperation and Development (OECD), Program for International Student Assessment (PISA), 2012.
27
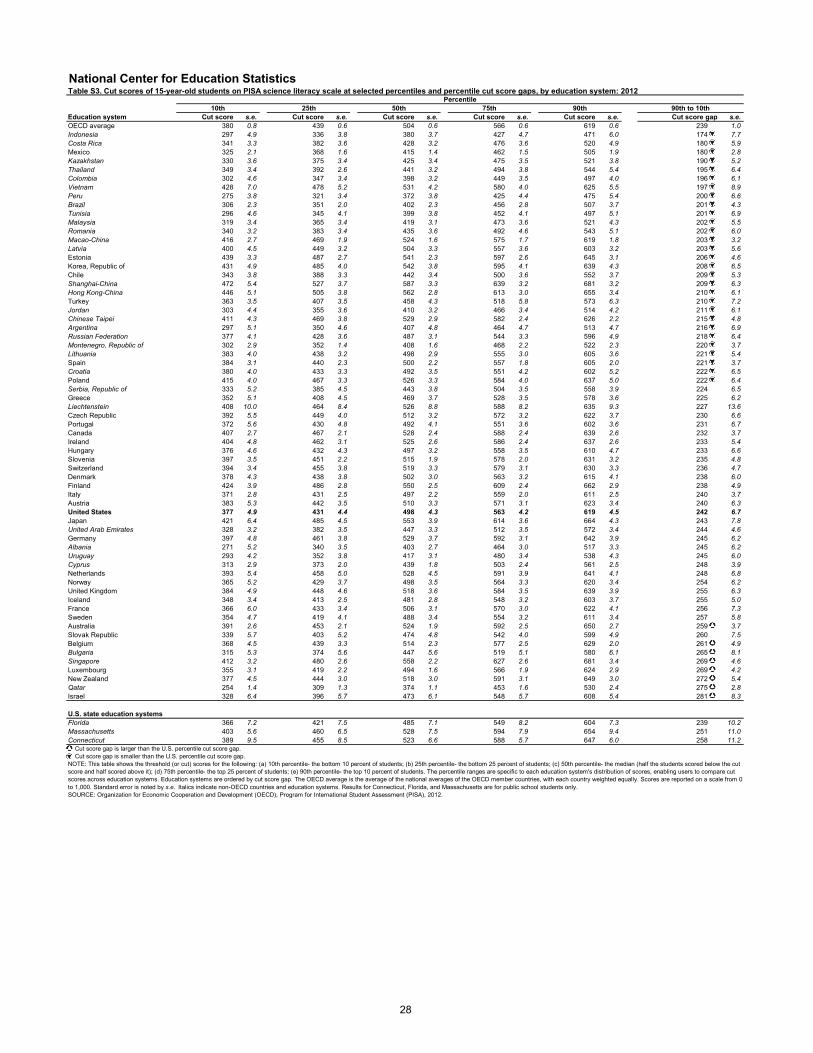
National Center for Education StatisticsTable S3. Cut scores of 15-year-old students on PISA science literacy scale at selected percentiles and percentile cut score gaps, by education system: 2012
Education system
Percentile10th 25th 50th 75th 90th 90th to 10th
Cut score s.e. Cut score s.e. Cut score s.e. Cut score s.e. Cut score s.e. Cut score gap s.e.OECD average 380 0.8 439 0.6 504 0.6 566 0.6 619 0.6 239 1.0Indonesia 297 4.9 336 3.8 380 3.7 427 4.7 471 6.0 174 7.7Costa Rica 341 3.3 382 3.6 428 3.2 476 3.6 520 4.9 180 5.9Mexico 325 2.1 368 1.6 415 1.4 462 1.5 505 1.9 180 2.8Kazakhstan 330 3.6 375 3.4 425 3.4 475 3.5 521 3.8 190 5.2Thailand 349 3.4 392 2.6 441 3.2 494 3.8 544 5.4 195 6.4Colombia 302 4.6 347 3.4 398 3.2 449 3.5 497 4.0 196 6.1Vietnam 428 7.0 478 5.2 531 4.2 580 4.0 625 5.5 197 8.9Peru 275 3.8 321 3.4 372 3.8 425 4.4 475 5.4 200 6.6Brazil 306 2.3 351 2.0 402 2.3 456 2.8 507 3.7 201 4.3Tunisia 296 4.6 345 4.1 399 3.8 452 4.1 497 5.1 201 6.9Malaysia 319 3.4 365 3.4 419 3.1 473 3.6 521 4.3 202 5.5Romania 340 3.2 383 3.4 435 3.6 492 4.6 543 5.1 202 6.0Macao-China 416 2.7 469 1.9 524 1.6 575 1.7 619 1.8 203 3.2Latvia 400 4.5 449 3.2 504 3.3 557 3.6 603 3.2 203 5.6Estonia 439 3.3 487 2.7 541 2.3 597 2.6 645 3.1 206 4.6Korea, Republic of 431 4.9 485 4.0 542 3.8 595 4.1 639 4.3 208 6.5Chile 343 3.8 388 3.3 442 3.4 500 3.6 552 3.7 209 5.3Shanghai-China 472 5.4 527 3.7 587 3.3 639 3.2 681 3.2 209 6.3Hong Kong-China 446 5.1 505 3.8 562 2.8 613 3.0 655 3.4 210 6.1Turkey 363 3.5 407 3.5 458 4.3 518 5.8 573 6.3 210 7.2Jordan 303 4.4 355 3.6 410 3.2 466 3.4 514 4.2 211 6.1Chinese Taipei 411 4.3 469 3.8 529 2.9 582 2.4 626 2.2 215 4.8Argentina 297 5.1 350 4.6 407 4.8 464 4.7 513 4.7 216 6.9Russian Federation 377 4.1 428 3.6 487 3.1 544 3.3 596 4.9 218 6.4Montenegro, Republic of 302 2.9 352 1.4 408 1.6 468 2.2 522 2.3 220 3.7Lithuania 383 4.0 438 3.2 498 2.9 555 3.0 605 3.6 221 5.4Spain 384 3.1 440 2.3 500 2.2 557 1.8 605 2.0 221 3.7Croatia 380 4.0 433 3.3 492 3.5 551 4.2 602 5.2 222 6.5Poland 415 4.0 467 3.3 526 3.3 584 4.0 637 5.0 222 6.4Serbia, Republic of 333 5.2 385 4.5 443 3.8 504 3.5 558 3.9 224 6.5Greece 352 5.1 408 4.5 469 3.7 528 3.5 578 3.6 225 6.2Liechtenstein 408 10.0 464 8.4 526 8.8 588 8.2 635 9.3 227 13.6Czech Republic 392 5.5 449 4.0 512 3.2 572 3.2 622 3.7 230 6.6Portugal 372 5.6 430 4.8 492 4.1 551 3.6 602 3.6 231 6.7Canada 407 2.7 467 2.1 528 2.4 588 2.4 639 2.6 232 3.7Ireland 404 4.8 462 3.1 525 2.6 586 2.4 637 2.6 233 5.4Hungary 376 4.6 432 4.3 497 3.2 558 3.5 610 4.7 233 6.6Slovenia 397 3.5 451 2.2 515 1.9 578 2.0 631 3.2 235 4.8Switzerland 394 3.4 455 3.8 519 3.3 579 3.1 630 3.3 236 4.7Denmark 378 4.3 438 3.8 502 3.0 563 3.2 615 4.1 238 6.0Finland 424 3.9 486 2.8 550 2.5 609 2.4 662 2.9 238 4.9Italy 371 2.8 431 2.5 497 2.2 559 2.0 611 2.5 240 3.7Austria 383 5.3 442 3.5 510 3.3 571 3.1 623 3.4 240 6.3United States 377 4.9 431 4.4 498 4.3 563 4.2 619 4.5 242 6.7Japan 421 6.4 485 4.5 553 3.9 614 3.6 664 4.3 243 7.8United Arab Emirates 328 3.2 382 3.5 447 3.3 512 3.5 572 3.4 244 4.6Germany 397 4.8 461 3.8 529 3.7 592 3.1 642 3.9 245 6.2Albania 271 5.2 340 3.5 403 2.7 464 3.0 517 3.3 245 6.2Uruguay 293 4.2 352 3.8 417 3.1 480 3.4 538 4.3 245 6.0Cyprus 313 2.9 373 2.0 439 1.8 503 2.4 561 2.5 248 3.9Netherlands 393 5.4 458 5.0 528 4.5 591 3.9 641 4.1 248 6.8Norway 365 5.2 429 3.7 498 3.5 564 3.3 620 3.4 254 6.2United Kingdom 384 4.9 448 4.6 518 3.6 584 3.5 639 3.9 255 6.3Iceland 348 3.4 413 2.5 481 2.8 548 3.2 603 3.7 255 5.0France 366 6.0 433 3.4 506 3.1 570 3.0 622 4.1 256 7.3Sweden 354 4.7 419 4.1 488 3.4 554 3.2 611 3.4 257 5.8Australia 391 2.6 453 2.1 524 1.9 592 2.5 650 2.7 259 3.7Slovak Republic 339 5.7 403 5.2 474 4.8 542 4.0 599 4.9 260 7.5Belgium 368 4.5 439 3.3 514 2.3 577 2.5 629 2.0 261 4.9Bulgaria 315 5.3 374 5.6 447 5.6 519 5.1 580 6.1 265 8.1Singapore 412 3.2 480 2.6 558 2.2 627 2.6 681 3.4 269 4.6Luxembourg 355 3.1 419 2.2 494 1.6 566 1.9 624 2.9 269 4.2New Zealand 377 4.5 444 3.0 518 3.0 591 3.1 649 3.0 272 5.4Qatar 254 1.4 309 1.3 374 1.1 453 1.6 530 2.4 275 2.8Israel 328 6.4 396 5.7 473 6.1 548 5.7 608 5.4 281 8.3
U.S. state education systemsFlorida 366 7.2 421 7.5 485 7.1 549 8.2 604 7.3 239 10.2Massachusetts 403 5.6 460 6.5 528 7.5 594 7.9 654 9.4 251 11.0Connecticut 389 9.5 455 8.5 523 6.6 588 5.7 647 6.0 258 11.2 Cut score gap is larger than the U.S. percentile cut score gap. Cut score gap is smaller than the U.S. percentile cut score gap.NOTE: This table shows the threshold (or cut) scores for the following: (a) 10th percentile- the bottom 10 percent of students; (b) 25th percentile- the bottom 25 percent of students; (c) 50th percentile- the median (half the students scored below the cut score and half scored above it); (d) 75th percentile- the top 25 percent of students; (e) 90th percentile- the top 10 percent of students. The percentile ranges are specific to each education system's distribution of scores, enabling users to compare cut scores across education systems. Education systems are ordered by cut score gap. The OECD average is the average of the national averages of the OECD member countries, with each country weighted equally. Scores are reported on a scale from 0 to 1,000. Standard error is noted by s.e. Italics indicate non-OECD countries and education systems. Results for Connecticut, Florida, and Massachusetts are for public school students only. SOURCE: Organization for Economic Cooperation and Development (OECD), Program for International Student Assessment (PISA), 2012.
28
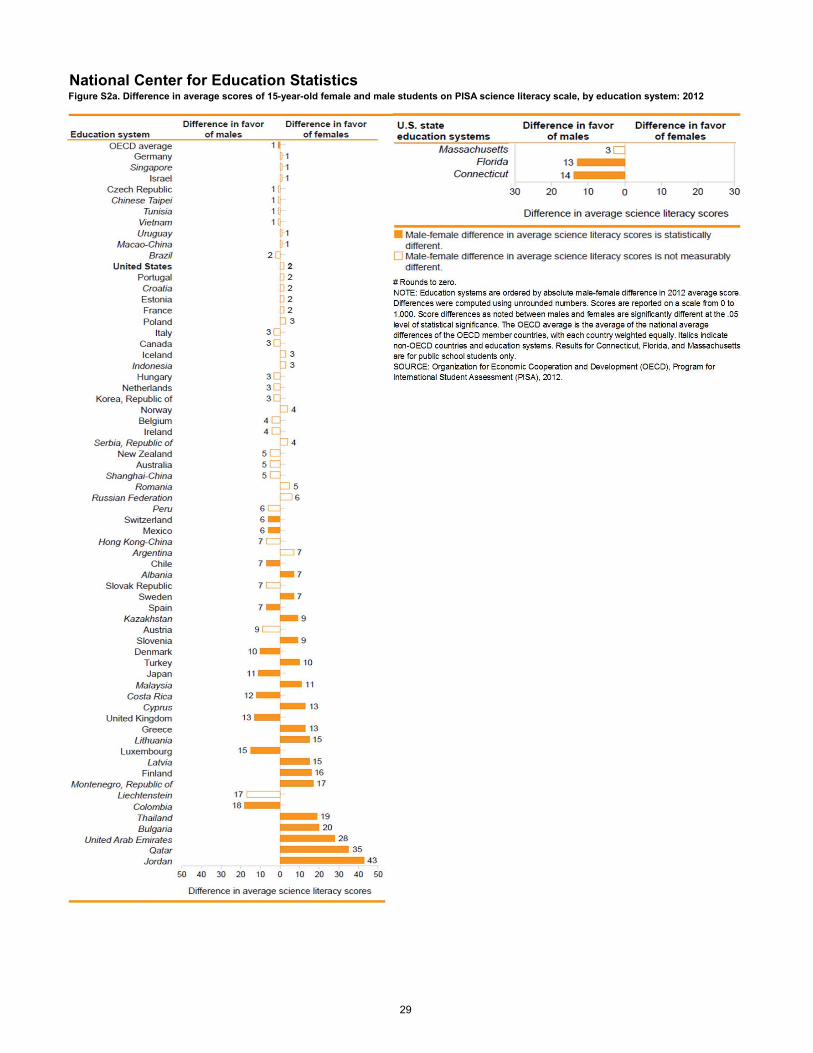
National Center for Education StatisticsFigure S2a. Difference in average scores of 15-year-old female and male students on PISA science literacy scale, by education system: 2012
29

National Center for Education StatisticsTable S2b. Difference in average scores of 15-year-old female and male students on PISA science literacy scale, by education system: 2012Education system Male-female difference s.e.OECD average 1 * 0.6Germany -1 3.0Singapore -1 2.6Israel -1 7.6Czech Republic 1 4.0Chinese Taipei 1 6.4Tunisia 1 2.9Vietnam 1 2.8Uruguay -1 3.4Macao-China -1 1.7Brazil 2 1.7United States -2 2.7Portugal -2 2.6Croatia -2 3.8Estonia -2 2.7France -2 3.7Poland -3 3.0Italy 3 2.5Canada 3 2.1Iceland -3 3.6Indonesia -3 3.1Hungary 3 3.3Netherlands 3 2.9Korea, Republic of 3 5.1Norway -4 3.2Belgium 4 3.6Ireland 4 4.4Serbia, Republic of -4 3.9New Zealand 5 4.9Australia 5 3.0Shanghai-China 5 2.7Romania -5 3.2Russian Federation -6 2.9Peru 6 4.0Switzerland 6 * 2.6Mexico 6 * 1.1Hong Kong-China 7 4.2Argentina -7 3.4Chile 7 * 3.3Albania -7 * 3.2Slovak Republic 7 4.5Sweden -7 * 3.3Spain 7 * 2.1Kazakhstan -9 * 2.9Austria 9 5.0Slovenia -9 * 2.8Denmark 10 * 2.7Turkey -10 * 4.2Japan 11 * 4.3Malaysia -11 * 3.5Costa Rica 12 * 3.2Cyprus -13 * 2.5United Kingdom 13 * 4.7Greece -13 * 3.1Lithuania -15 * 2.3Luxembourg 15 * 2.2Latvia -15 * 3.6Finland -16 * 3.0Montenegro, Republic of -17 * 2.4Liechtenstein 17 9.1Colombia 18 * 3.4Thailand -19 * 3.4Bulgaria -20 * 4.5United Arab Emirates -28 * 5.1Qatar -35 * 1.7Jordan -43 * 6.4
U.S. state education systemsMassachusetts 3 4.6Florida 13 * 4.8Connecticut 14 * 4.5* p <.05. All differences between males and females are significantly different at the .05 level of statistical significance. NOTE: Education systems are ordered by absolute male-female difference in 2012 average score. Differences were computed using unrounded numbers. Scores are reported on a scale from 0 to 1,000. The OECD average is the average of the national average differences of the OECD member countries, with each country weighted equally. Standard error is noted by s.e. Italics indicate non-OECD countries and education systems. Results for Connecticut, Florida, and Massachusetts are for public school students only. SOURCE: Organization for Economic Cooperation and Development (OECD), Program for International Student Assessment (PISA), 2012.
30
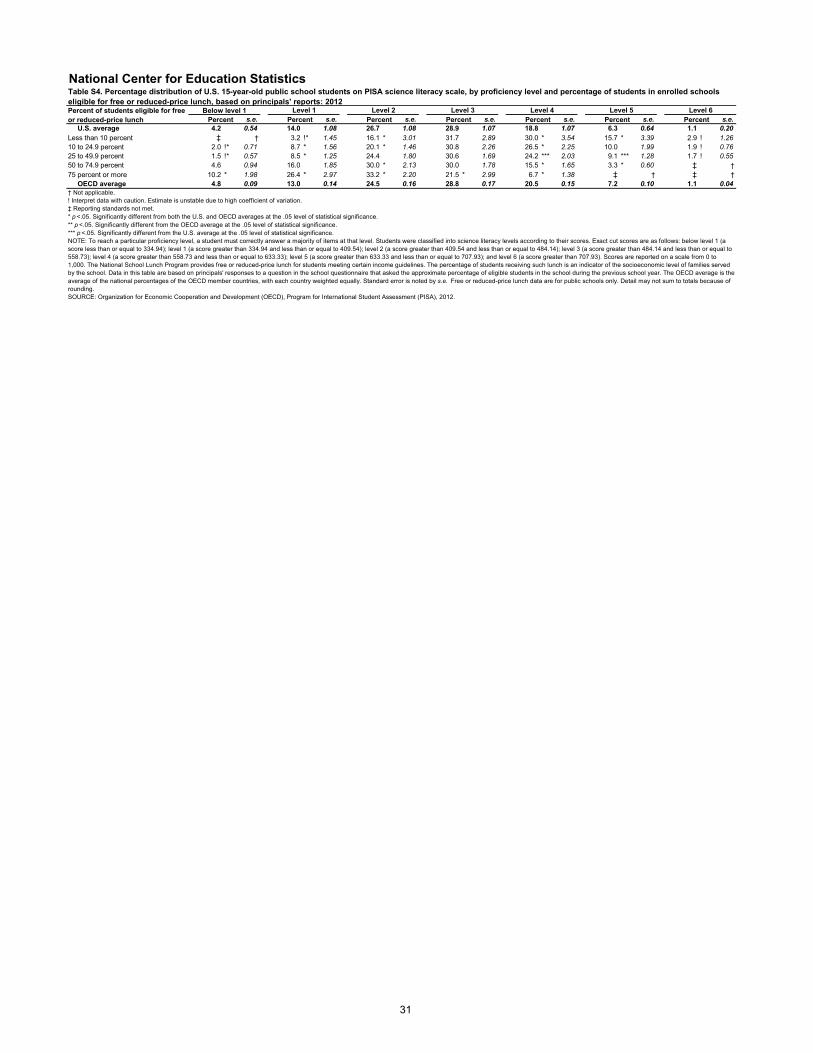
National Center for Education StatisticsTable S4. Percentage distribution of U.S. 15-year-old public school students on PISA science literacy scale, by proficiency level and percentage of students in enrolled schools eligible for free or reduced-price lunch, based on principals' reports: 2012Percent of students eligible for free or reduced-price lunch
Below level 1 Level 1 Level 2 Level 3 Level 4 Level 5 Level 6Percent s.e. Percent s.e. Percent s.e. Percent s.e. Percent s.e. Percent s.e. Percent s.e.
U.S. average 4.2 0.54 14.0 1.08 26.7 1.08 28.9 1.07 18.8 1.07 6.3 0.64 1.1 0.20Less than 10 percent ‡ † 3.2 !* 1.45 16.1 * 3.01 31.7 2.89 30.0 * 3.54 15.7 * 3.39 2.9 ! 1.2610 to 24.9 percent 2.0 !* 0.71 8.7 * 1.56 20.1 * 1.46 30.8 2.26 26.5 * 2.25 10.0 1.99 1.9 ! 0.7625 to 49.9 percent 1.5 !* 0.57 8.5 * 1.25 24.4 1.80 30.6 1.69 24.2 *** 2.03 9.1 *** 1.28 1.7 ! 0.5550 to 74.9 percent 4.6 0.94 16.0 1.85 30.0 * 2.13 30.0 1.78 15.5 * 1.65 3.3 * 0.60 ‡ †75 percent or more 10.2 * 1.98 26.4 * 2.97 33.2 * 2.20 21.5 * 2.99 6.7 * 1.38 ‡ † ‡ † OECD average 4.8 0.09 13.0 0.14 24.5 0.16 28.8 0.17 20.5 0.15 7.2 0.10 1.1 0.04† Not applicable.! Interpret data with caution. Estimate is unstable due to high coefficient of variation.‡ Reporting standards not met.* p <.05. Significantly different from both the U.S. and OECD averages at the .05 level of statistical significance.** p <.05. Significantly different from the OECD average at the .05 level of statistical significance.*** p <.05. Significantly different from the U.S. average at the .05 level of statistical significance.NOTE: To reach a particular proficiency level, a student must correctly answer a majority of items at that level. Students were classified into science literacy levels according to their scores. Exact cut scores are as follows: below level 1 (a score less than or equal to 334.94); level 1 (a score greater than 334.94 and less than or equal to 409.54); level 2 (a score greater than 409.54 and less than or equal to 484.14); level 3 (a score greater than 484.14 and less than or equal to 558.73); level 4 (a score greater than 558.73 and less than or equal to 633.33); level 5 (a score greater than 633.33 and less than or equal to 707.93); and level 6 (a score greater than 707.93). Scores are reported on a scale from 0 to 1,000. The National School Lunch Program provides free or reduced-price lunch for students meeting certain income guidelines. The percentage of students receiving such lunch is an indicator of the socioeconomic level of families served by the school. Data in this table are based on principals' responses to a question in the school questionnaire that asked the approximate percentage of eligible students in the school during the previous school year. The OECD average is the average of the national percentages of the OECD member countries, with each country weighted equally. Standard error is noted by s.e. Free or reduced-price lunch data are for public schools only. Detail may not sum to totals because of rounding. SOURCE: Organization for Economic Cooperation and Development (OECD), Program for International Student Assessment (PISA), 2012.
31

National Center for Education StatisticsTable S5. Average scores of U.S. 15-year-old public school students on PISA science literacy scale, by percentage of students in enrolled schools eligible for free or reduced-price lunch, based on principals' reports: 2012Percent of students eligible for free or reduced-price lunch Average score s.e.
U.S. average 497 3.8Less than 10 percent 556 * 7.010 to 24.9 percent 528 * 6.525 to 49.9 percent 523 * 5.650 to 74.9 percent 483 * 5.075 percent or more 442 * 8.1
OECD average 501 0.5* p <.05. Significantly different from both the U.S. and OECD averages at the .05 level of statistical significance.NOTE: Scores are reported on a scale from 0 to 1,000. The National School Lunch Program provides free or reduced-price lunch for students meeting certain income guidelines. The percentage of students receiving such lunch is an indicator of the socioeconomic level of families served by the school. Data in this table are based on principals' responses to a question in the school questionnaire that asked the approximate percentage of eligible students in the school during the previous school year. The OECD average is the average of the national percentages of the OECD member countries, with each country weighted equally. Standard error is noted by s.e. Free or reduced-price lunch data are for public schools only. SOURCE: Organization for Economic Cooperation and Development (OECD), Program for International Student Assessment (PISA), 2012.
32
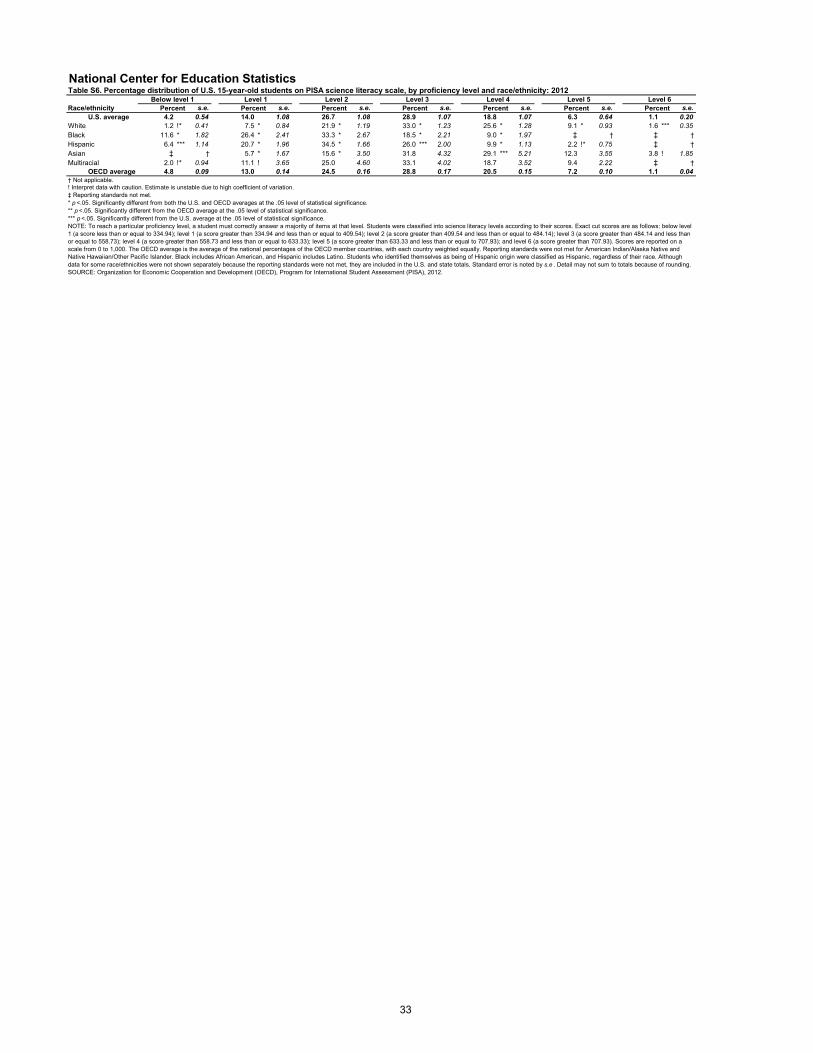
National Center for Education StatisticsTable S6. Percentage distribution of U.S. 15-year-old students on PISA science literacy scale, by proficiency level and race/ethnicity: 2012
Race/ethnicityBelow level 1 Level 1 Level 2 Level 3 Level 4 Level 5 Level 6
Percent s.e. Percent s.e. Percent s.e. Percent s.e. Percent s.e. Percent s.e. Percent s.e.U.S. average 4.2 0.54 14.0 1.08 26.7 1.08 28.9 1.07 18.8 1.07 6.3 0.64 1.1 0.20
White 1.2 !* 0.41 7.5 * 0.84 21.9 * 1.19 33.0 * 1.23 25.6 * 1.28 9.1 * 0.93 1.6 *** 0.35Black 11.6 * 1.82 26.4 * 2.41 33.3 * 2.67 18.5 * 2.21 9.0 * 1.97 ‡ † ‡ †Hispanic 6.4 *** 1.14 20.7 * 1.96 34.5 * 1.66 26.0 *** 2.00 9.9 * 1.13 2.2 !* 0.75 ‡ †Asian ‡ † 5.7 * 1.67 15.6 * 3.50 31.8 4.32 29.1 *** 5.21 12.3 3.55 3.8 ! 1.85Multiracial 2.0 !* 0.94 11.1 ! 3.65 25.0 4.60 33.1 4.02 18.7 3.52 9.4 2.22 ‡ †
OECD average 4.8 0.09 13.0 0.14 24.5 0.16 28.8 0.17 20.5 0.15 7.2 0.10 1.1 0.04† Not applicable.! Interpret data with caution. Estimate is unstable due to high coefficient of variation.‡ Reporting standards not met.* p <.05. Significantly different from both the U.S. and OECD averages at the .05 level of statistical significance.** p <.05. Significantly different from the OECD average at the .05 level of statistical significance.*** p <.05. Significantly different from the U.S. average at the .05 level of statistical significance.NOTE: To reach a particular proficiency level, a student must correctly answer a majority of items at that level. Students were classified into science literacy levels according to their scores. Exact cut scores are as follows: below level 1 (a score less than or equal to 334.94); level 1 (a score greater than 334.94 and less than or equal to 409.54); level 2 (a score greater than 409.54 and less than or equal to 484.14); level 3 (a score greater than 484.14 and less than or equal to 558.73); level 4 (a score greater than 558.73 and less than or equal to 633.33); level 5 (a score greater than 633.33 and less than or equal to 707.93); and level 6 (a score greater than 707.93). Scores are reported on a scale from 0 to 1,000. The OECD average is the average of the national percentages of the OECD member countries, with each country weighted equally. Reporting standards were not met for American Indian/Alaska Native and Native Hawaiian/Other Pacific Islander. Black includes African American, and Hispanic includes Latino. Students who identified themselves as being of Hispanic origin were classified as Hispanic, regardless of their race. Although data for some race/ethnicities were not shown separately because the reporting standards were not met, they are included in the U.S. and state totals. Standard error is noted by s.e . Detail may not sum to totals because of rounding. SOURCE: Organization for Economic Cooperation and Development (OECD), Program for International Student Assessment (PISA), 2012.
33
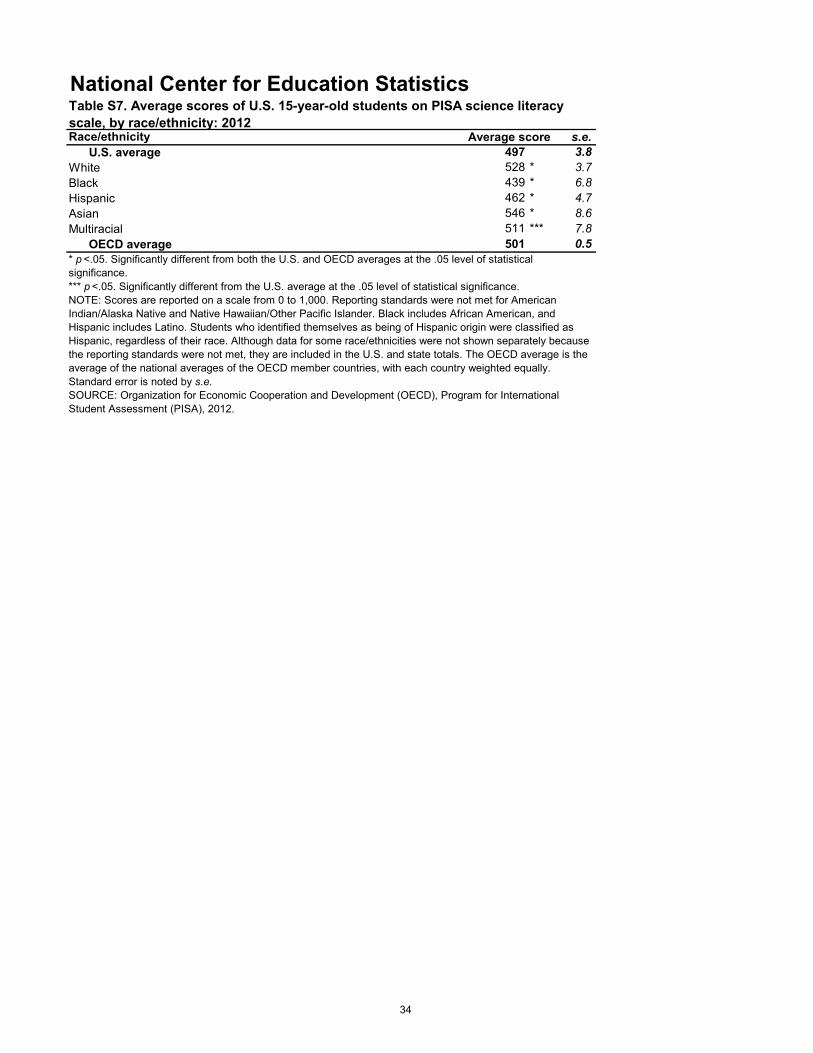
National Center for Education StatisticsTable S7. Average scores of U.S. 15-year-old students on PISA science literacy scale, by race/ethnicity: 2012 Race/ethnicity Average score s.e.
U.S. average 497 3.8White 528 * 3.7Black 439 * 6.8Hispanic 462 * 4.7Asian 546 * 8.6Multiracial 511 *** 7.8
OECD average 501 0.5* p <.05. Significantly different from both the U.S. and OECD averages at the .05 level of statistical significance.*** p <.05. Significantly different from the U.S. average at the .05 level of statistical significance.NOTE: Scores are reported on a scale from 0 to 1,000. Reporting standards were not met for American Indian/Alaska Native and Native Hawaiian/Other Pacific Islander. Black includes African American, and Hispanic includes Latino. Students who identified themselves as being of Hispanic origin were classified as Hispanic, regardless of their race. Although data for some race/ethnicities were not shown separately because the reporting standards were not met, they are included in the U.S. and state totals. The OECD average is the average of the national averages of the OECD member countries, with each country weighted equally. Standard error is noted by s.e. SOURCE: Organization for Economic Cooperation and Development (OECD), Program for International Student Assessment (PISA), 2012.
34

Exhibit R1. Description of PISA proficiency levels on reading literacy scale: 2012
Proficiency level and lower cut score Task descriptions
Level 6
698
At level 6, tasks typically require the reader to make multiple inferences, comparisons, and contrasts that are both detailed and precise. They require demonstration of a full and detailed understanding of one or more texts and may involve integrating information from more than one text. Tasks may require the reader to deal with unfamiliar ideas, in the presence of prominent competing information, and to generate abstract categories for interpretations. Reflect and evaluate tasks may require the reader to hypothesize about or critically evaluate a complex text on an unfamiliar topic, taking into account multiple criteria or perspectives, and applying sophisticated understandings from beyond the text. A salient condition for access and retrieve tasks at this level is precision of analysis and fine attention to detail that is inconspicuous in the texts.
Level 5
626
At level 5, tasks that involve retrieving information require the reader to locate and organize several pieces of deeply embedded information, inferring which information in the text is relevant. Reflective tasks require critical evaluation or hypothesis, drawing on specialized knowledge. Both interpretative and reflective tasks require a full and detailed understanding of a text whose content or form is unfamiliar. For all aspects of reading, tasks at this level typically involve dealing with concepts that are contrary to expectations.
Level 4
553
At level 4, tasks that involve retrieving information require the reader to locate and organize several pieces of embedded information. Some tasks at this level require interpreting the meaning of nuances of language in a section of text by taking into account the text as a whole. Other interpretative tasks require understanding and applying categories in an unfamiliar context. Reflective tasks at this level require readers to use formal or public knowledge to hypothesize about or critically evaluate a text. Readers must demonstrate an accurate understanding of long or complex texts whose content or form may be unfamiliar.
Level 3
480
At level 3, tasks require the reader to locate, and in some cases recognize the relationship between, several pieces of information that must meet multiple conditions. Interpretative tasks at this level require the reader to integrate several parts of a text in order to identify a main idea, understand a relationship, or construe the meaning of a word or phrase. They need to take into account many features in comparing, contrasting or categorizing. Often the required information is not prominent or there is much competing information; or there are other text obstacles, such as ideas that are contrary to expectation or negatively worded. Reflective tasks at this level may require connections, comparisons, and explanations, or they may require the reader to evaluate a feature of the text. Some reflective tasks require readers to demonstrate a fine understanding of the text in relation to familiar, everyday knowledge. Other tasks do not require detailed text comprehension but require the reader to draw on less common knowledge.
Level 2
407
At level 2, some tasks require the reader to locate one or more pieces of information, which may need to be inferred and may need to meet several conditions. Others require recognizing the main idea in a text, understanding relationships, or construing meaning within a limited part of the text when the information is not prominent and the reader must make low level inferences. Tasks at this level may involve comparisons or contrasts based on a single feature in the text. Typical reflective tasks at this level require readers to make a comparison or several connections between the text and outside knowledge, by drawing on personal experience and attitudes.
Level 1a
335
At level 1a, tasks require the reader to locate one or more independent pieces of explicitly stated information; to recognize the main theme or author’s purpose in a text about a familiar topic, or to make a simple connection between information in the text and common, everyday knowledge. Typically, the required information in the text is prominent and there is little, if any, competing information. The reader is explicitly directed to consider relevant factors in the task and in the text.
Level 1b
262
At level 1b, tasks require the reader to locate a single piece of explicitly stated information in a prominent position in a short, syntactically simple text with a familiar context and text type, such as a narrative or a simple list. The text typically provides support to the reader, such as repetition of information, pictures, or familiar symbols. There is minimal competing information. In tasks requiring interpretation the reader may need to make simple connections between adjacent pieces of information.
NOTE: To reach a particular proficiency level, a student must correctly answer a majority of items at that level. Students were classified into reading literacy levels according to their scores. Cut scores in the exhibit are rounded; exact cut scores are provided in table AA1. Scores are reported on a scale from 0 to 1,000. SOURCE: Organization for Economic Cooperation and Development (OECD), Program for International Student Assessment (PISA), 2012.
35
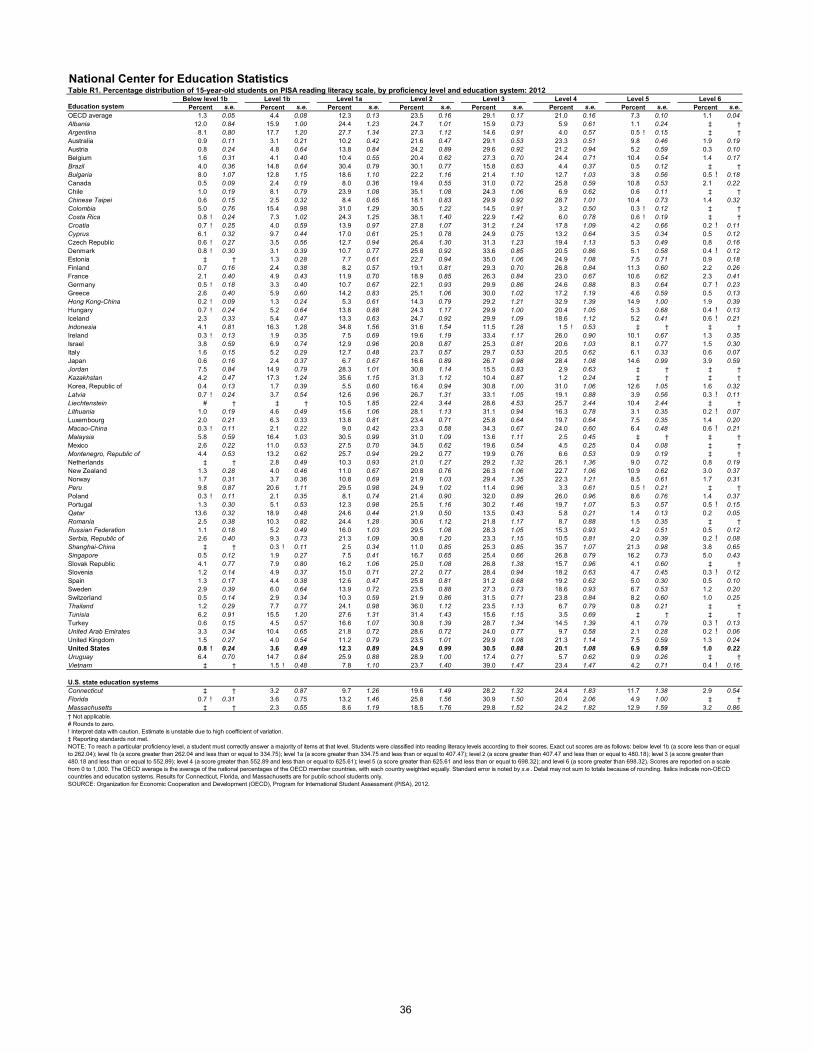
National Center for Education StatisticsTable R1. Percentage distribution of 15-year-old students on PISA reading literacy scale, by proficiency level and education system: 2012
Education systemBelow level 1b Level 1b Level 1a Level 2 Level 3 Level 4 Level 5 Level 6
Percent s.e. Percent s.e. Percent s.e. Percent s.e. Percent s.e. Percent s.e. Percent s.e. Percent s.e.OECD average 1.3 0.05 4.4 0.08 12.3 0.13 23.5 0.16 29.1 0.17 21.0 0.16 7.3 0.10 1.1 0.04Albania 12.0 0.84 15.9 1.00 24.4 1.23 24.7 1.01 15.9 0.73 5.9 0.61 1.1 0.24 ‡ †Argentina 8.1 0.80 17.7 1.20 27.7 1.34 27.3 1.12 14.6 0.91 4.0 0.57 0.5 ! 0.15 ‡ †Australia 0.9 0.11 3.1 0.21 10.2 0.42 21.6 0.47 29.1 0.53 23.3 0.51 9.8 0.46 1.9 0.19Austria 0.8 0.24 4.8 0.64 13.8 0.84 24.2 0.89 29.6 0.92 21.2 0.94 5.2 0.59 0.3 0.10Belgium 1.6 0.31 4.1 0.40 10.4 0.55 20.4 0.62 27.3 0.70 24.4 0.71 10.4 0.54 1.4 0.17Brazil 4.0 0.36 14.8 0.64 30.4 0.79 30.1 0.77 15.8 0.63 4.4 0.37 0.5 0.12 ‡ †Bulgaria 8.0 1.07 12.8 1.15 18.6 1.10 22.2 1.16 21.4 1.10 12.7 1.03 3.8 0.56 0.5 ! 0.18Canada 0.5 0.09 2.4 0.19 8.0 0.36 19.4 0.55 31.0 0.72 25.8 0.59 10.8 0.53 2.1 0.22Chile 1.0 0.19 8.1 0.79 23.9 1.08 35.1 1.08 24.3 1.06 6.9 0.62 0.6 0.11 ‡ †Chinese Taipei 0.6 0.15 2.5 0.32 8.4 0.65 18.1 0.83 29.9 0.92 28.7 1.01 10.4 0.73 1.4 0.32Colombia 5.0 0.76 15.4 0.98 31.0 1.29 30.5 1.22 14.5 0.91 3.2 0.50 0.3 ! 0.12 ‡ †Costa Rica 0.8 ! 0.24 7.3 1.02 24.3 1.25 38.1 1.40 22.9 1.42 6.0 0.78 0.6 ! 0.19 ‡ †Croatia 0.7 ! 0.25 4.0 0.59 13.9 0.97 27.8 1.07 31.2 1.24 17.8 1.09 4.2 0.66 0.2 ! 0.11Cyprus 6.1 0.32 9.7 0.44 17.0 0.61 25.1 0.78 24.9 0.75 13.2 0.64 3.5 0.34 0.5 0.12Czech Republic 0.6 ! 0.27 3.5 0.56 12.7 0.94 26.4 1.30 31.3 1.23 19.4 1.13 5.3 0.49 0.8 0.16Denmark 0.8 ! 0.30 3.1 0.39 10.7 0.77 25.8 0.92 33.6 0.85 20.5 0.86 5.1 0.58 0.4 ! 0.12Estonia ‡ † 1.3 0.28 7.7 0.61 22.7 0.94 35.0 1.06 24.9 1.08 7.5 0.71 0.9 0.18Finland 0.7 0.16 2.4 0.38 8.2 0.57 19.1 0.81 29.3 0.70 26.8 0.84 11.3 0.60 2.2 0.26France 2.1 0.40 4.9 0.43 11.9 0.70 18.9 0.85 26.3 0.84 23.0 0.67 10.6 0.62 2.3 0.41Germany 0.5 ! 0.18 3.3 0.40 10.7 0.67 22.1 0.93 29.9 0.86 24.6 0.88 8.3 0.64 0.7 ! 0.23Greece 2.6 0.40 5.9 0.60 14.2 0.83 25.1 1.06 30.0 1.02 17.2 1.19 4.6 0.59 0.5 0.13Hong Kong-China 0.2 ! 0.09 1.3 0.24 5.3 0.61 14.3 0.79 29.2 1.21 32.9 1.39 14.9 1.00 1.9 0.39Hungary 0.7 ! 0.24 5.2 0.64 13.8 0.88 24.3 1.17 29.9 1.00 20.4 1.05 5.3 0.68 0.4 ! 0.13Iceland 2.3 0.33 5.4 0.47 13.3 0.63 24.7 0.92 29.9 1.09 18.6 1.12 5.2 0.41 0.6 ! 0.21Indonesia 4.1 0.81 16.3 1.28 34.8 1.56 31.6 1.54 11.5 1.28 1.5 ! 0.53 ‡ † ‡ †Ireland 0.3 ! 0.13 1.9 0.35 7.5 0.69 19.6 1.19 33.4 1.17 26.0 0.90 10.1 0.67 1.3 0.35Israel 3.8 0.59 6.9 0.74 12.9 0.96 20.8 0.87 25.3 0.81 20.6 1.03 8.1 0.77 1.5 0.30Italy 1.6 0.15 5.2 0.29 12.7 0.48 23.7 0.57 29.7 0.53 20.5 0.62 6.1 0.33 0.6 0.07Japan 0.6 0.16 2.4 0.37 6.7 0.67 16.6 0.89 26.7 0.98 28.4 1.08 14.6 0.99 3.9 0.59Jordan 7.5 0.84 14.9 0.79 28.3 1.01 30.8 1.14 15.5 0.83 2.9 0.63 ‡ † ‡ †Kazakhstan 4.2 0.47 17.3 1.24 35.6 1.15 31.3 1.12 10.4 0.87 1.2 0.24 ‡ † ‡ †Korea, Republic of 0.4 0.13 1.7 0.39 5.5 0.60 16.4 0.94 30.8 1.00 31.0 1.06 12.6 1.05 1.6 0.32Latvia 0.7 ! 0.24 3.7 0.54 12.6 0.96 26.7 1.31 33.1 1.05 19.1 0.88 3.9 0.56 0.3 ! 0.11Liechtenstein # † ‡ † 10.5 1.85 22.4 3.44 28.6 4.53 25.7 2.44 10.4 2.44 ‡ †Lithuania 1.0 0.19 4.6 0.49 15.6 1.06 28.1 1.13 31.1 0.94 16.3 0.78 3.1 0.35 0.2 ! 0.07Luxembourg 2.0 0.21 6.3 0.33 13.8 0.81 23.4 0.71 25.8 0.64 19.7 0.64 7.5 0.35 1.4 0.20Macao-China 0.3 ! 0.11 2.1 0.22 9.0 0.42 23.3 0.58 34.3 0.67 24.0 0.60 6.4 0.48 0.6 ! 0.21Malaysia 5.8 0.59 16.4 1.03 30.5 0.99 31.0 1.09 13.6 1.11 2.5 0.45 ‡ † ‡ †Mexico 2.6 0.22 11.0 0.53 27.5 0.70 34.5 0.62 19.6 0.54 4.5 0.25 0.4 0.08 ‡ †Montenegro, Republic of 4.4 0.53 13.2 0.62 25.7 0.94 29.2 0.77 19.9 0.76 6.6 0.53 0.9 0.19 ‡ †Netherlands ‡ † 2.8 0.49 10.3 0.93 21.0 1.27 29.2 1.32 26.1 1.36 9.0 0.72 0.8 0.19New Zealand 1.3 0.28 4.0 0.46 11.0 0.67 20.8 0.76 26.3 1.06 22.7 1.06 10.9 0.62 3.0 0.37Norway 1.7 0.31 3.7 0.36 10.8 0.69 21.9 1.03 29.4 1.35 22.3 1.21 8.5 0.61 1.7 0.31Peru 9.8 0.87 20.6 1.11 29.5 0.98 24.9 1.02 11.4 0.96 3.3 0.61 0.5 ! 0.21 ‡ †Poland 0.3 ! 0.11 2.1 0.35 8.1 0.74 21.4 0.90 32.0 0.89 26.0 0.96 8.6 0.76 1.4 0.37Portugal 1.3 0.30 5.1 0.53 12.3 0.98 25.5 1.16 30.2 1.46 19.7 1.07 5.3 0.57 0.5 ! 0.15Qatar 13.6 0.32 18.9 0.48 24.6 0.44 21.9 0.50 13.5 0.43 5.8 0.21 1.4 0.13 0.2 0.05Romania 2.5 0.38 10.3 0.82 24.4 1.28 30.6 1.12 21.8 1.17 8.7 0.88 1.5 0.35 ‡ †Russian Federation 1.1 0.18 5.2 0.49 16.0 1.03 29.5 1.08 28.3 1.05 15.3 0.93 4.2 0.51 0.5 0.12Serbia, Republic of 2.6 0.40 9.3 0.73 21.3 1.09 30.8 1.20 23.3 1.15 10.5 0.81 2.0 0.39 0.2 ! 0.08Shanghai-China ‡ † 0.3 ! 0.11 2.5 0.34 11.0 0.85 25.3 0.85 35.7 1.07 21.3 0.98 3.8 0.65Singapore 0.5 0.12 1.9 0.27 7.5 0.41 16.7 0.65 25.4 0.66 26.8 0.79 16.2 0.73 5.0 0.43Slovak Republic 4.1 0.77 7.9 0.80 16.2 1.06 25.0 1.08 26.8 1.38 15.7 0.96 4.1 0.60 ‡ †Slovenia 1.2 0.14 4.9 0.37 15.0 0.71 27.2 0.77 28.4 0.94 18.2 0.63 4.7 0.45 0.3 ! 0.12Spain 1.3 0.17 4.4 0.38 12.6 0.47 25.8 0.81 31.2 0.68 19.2 0.62 5.0 0.30 0.5 0.10Sweden 2.9 0.39 6.0 0.64 13.9 0.72 23.5 0.88 27.3 0.73 18.6 0.93 6.7 0.53 1.2 0.20Switzerland 0.5 0.14 2.9 0.34 10.3 0.59 21.9 0.86 31.5 0.71 23.8 0.84 8.2 0.60 1.0 0.25Thailand 1.2 0.29 7.7 0.77 24.1 0.98 36.0 1.12 23.5 1.13 6.7 0.79 0.8 0.21 ‡ †Tunisia 6.2 0.91 15.5 1.20 27.6 1.31 31.4 1.43 15.6 1.15 3.5 0.69 ‡ † ‡ †Turkey 0.6 0.15 4.5 0.57 16.6 1.07 30.8 1.39 28.7 1.34 14.5 1.39 4.1 0.79 0.3 ! 0.13United Arab Emirates 3.3 0.34 10.4 0.65 21.8 0.72 28.6 0.72 24.0 0.77 9.7 0.58 2.1 0.28 0.2 ! 0.06United Kingdom 1.5 0.27 4.0 0.54 11.2 0.79 23.5 1.01 29.9 1.08 21.3 1.14 7.5 0.59 1.3 0.24United States 0.8 ! 0.24 3.6 0.49 12.3 0.89 24.9 0.99 30.5 0.88 20.1 1.08 6.9 0.59 1.0 0.22Uruguay 6.4 0.70 14.7 0.84 25.9 0.88 28.9 1.00 17.4 0.71 5.7 0.62 0.9 0.26 ‡ †Vietnam ‡ † 1.5 ! 0.48 7.8 1.10 23.7 1.40 39.0 1.47 23.4 1.47 4.2 0.71 0.4 ! 0.16
U.S. state education systemsConnecticut ‡ † 3.2 0.87 9.7 1.26 19.6 1.49 28.2 1.32 24.4 1.83 11.7 1.38 2.9 0.54Florida 0.7 ! 0.31 3.6 0.75 13.2 1.46 25.8 1.56 30.9 1.50 20.4 2.06 4.9 1.00 ‡ †Massachusetts ‡ † 2.3 0.55 8.6 1.19 18.5 1.76 29.8 1.52 24.2 1.82 12.9 1.59 3.2 0.86† Not applicable.# Rounds to zero.! Interpret data with caution. Estimate is unstable due to high coefficient of variation.‡ Reporting standards not met.NOTE: To reach a particular proficiency level, a student must correctly answer a majority of items at that level. Students were classified into reading literacy levels according to their scores. Exact cut scores are as follows: below level 1b (a score less than or equal to 262.04); level 1b (a score greater than 262.04 and less than or equal to 334.75); level 1a (a score greater than 334.75 and less than or equal to 407.47); level 2 (a score greater than 407.47 and less than or equal to 480.18); level 3 (a score greater than 480.18 and less than or equal to 552.89); level 4 (a score greater than 552.89 and less than or equal to 625.61); level 5 (a score greater than 625.61 and less than or equal to 698.32); and level 6 (a score greater than 698.32). Scores are reported on a scale from 0 to 1,000. The OECD average is the average of the national percentages of the OECD member countries, with each country weighted equally. Standard error is noted by s.e . Detail may not sum to totals because of rounding. Italics indicate non-OECD countries and education systems. Results for Connecticut, Florida, and Massachusetts are for public school students only.SOURCE: Organization for Economic Cooperation and Development (OECD), Program for International Student Assessment (PISA), 2012.
36
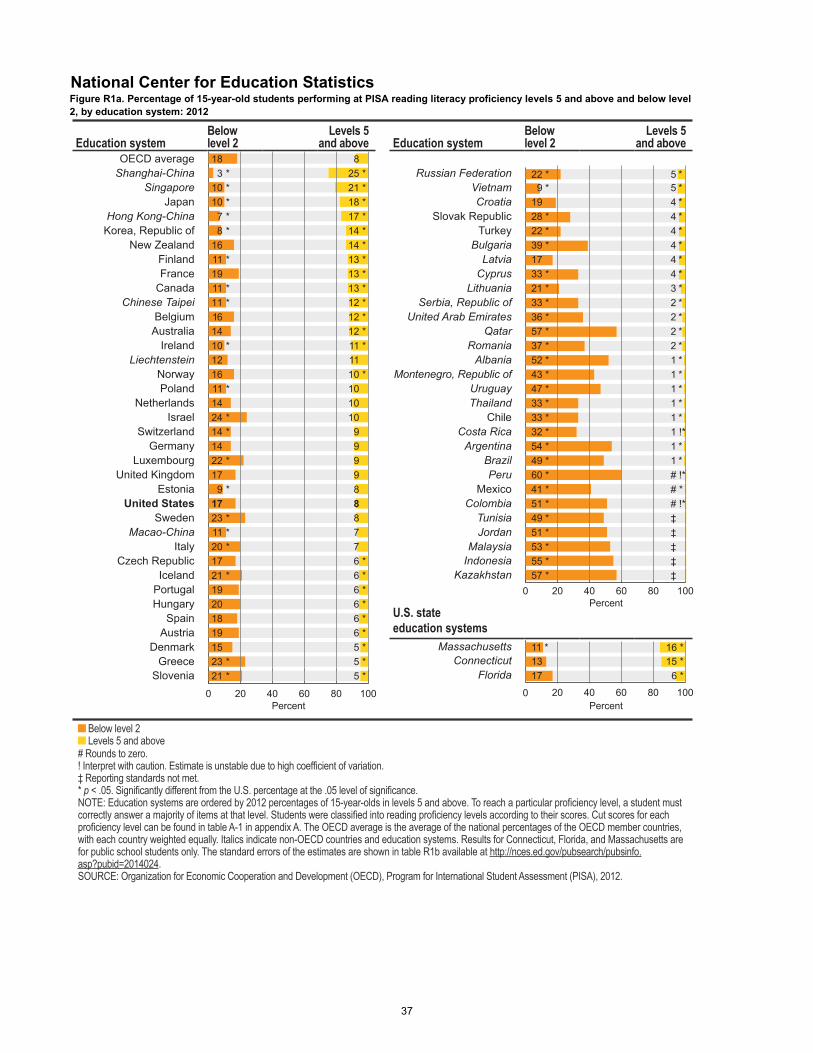
National Center for Education StatisticsFigure R1a. Percentage of 15-year-old students performing at PISA reading literacy proficiency levels 5 and above and below level 2, by education system: 2012
Education systemBelow level 2
Levels 5 and above
OECD average 18 is below level 2 8 is level 5 and above
Shanghai-China 3* is below level 2 25* is level 5 and above
Singapore
10* is below level 2 21* is level 5 and above
Japan 10* is below level 2 18* is level 5 and above
Hong Kong-China
7* is below level 2 17* is level 5 and above
Korea, Republic of 8* is below level 2 14* is level 5 and above
New Zealand 16 is below level 2 14* is level 5 and above
Finland 11* is below level 2 13* is level 5 and above
France 19 is below level 2 13* is level 5 and above
Canada 11* is below level 2 13* is level 5 and above
Chinese Taipei
11* is below level 2 12* is level 5 and above
Belgium 16 is below level 2 12* is level 5 and above
Australia 14 is below level 2 12* is level 5 and above
Ireland 10* is below level 2 11* is level 5 and above
Liechtenstein 12 is below level 2 11 is level 5 and above
Norway 16 is below level 2 10* is level 5 and above
Poland 11* is below level 2 10 is level 5 and above
Netherlands 14 is below level 2 10 is level 5 and above
Israel 24* is below level 2 10 is level 5 and above
Switzerland 14* is below level 2 9 is level 5 and above
Germany 14 is below level 2 9 is level 5 and above
Luxembourg 22* is below level 2 9 is level 5 and above
United Kingdom 17 is below level 2 9 is level 5 and above
Estonia 9* is below level 2 8 is level 5 and above
United States 17 is below level 2 8 is level 5 and above
Sweden 23* is below level 2 8 is level 5 and above
Macao-China
11* is below level 2 7 is level 5 and above
Italy 20* is below level 2 7 is level 5 and above
Czech Republic 17 is below level 2 6* is level 5 and above
Iceland 21* is below level 2 6* is level 5 and above
Portugal 19 is below level 2 6* is level 5 and above
Hungary 20 is below level 2 6* is level 5 and above
Spain 18 is below level 2 6* is level 5 and above
Austria 19 is below level 2 6* is level 5 and above
Denmark 15 is below level 2 5* is level 5 and above
Greece 23* is below level 2 5* is level 5 and above
Slovenia 21* is below level 2 5* is level 5 and above
Education systemBelow level 2
Levels 5 and above
Russian Federation
22* is below level 2 5* is level 5 and above
Vietnam
9* is below level 2 5* is level 5 and above
Croatia
19 is below level 2 4* is level 5 and above
Slovak Republic 28* is below level 2 4* is level 5 and above
Turkey 22* is below level 2 4* is level 5 and above
Bulgaria
39* is below level 2 4* is level 5 and above
Latvia
17 is below level 2 4* is level 5 and above
Cyprus
33* is below level 2 4* is level 5 and above
Lithuania
21* is below level 2 3* is level 5 and above
Serbia, Republic of 33* is below level 2 2* is level 5 and above
United Arab Emirates 36* is below level 2 2* is level 5 and above
Qatar 57* is below level 2 2* is level 5 and above
Romania
37* is below level 2 2* is level 5 and above
Albania
52* is below level 2 1* is level 5 and above
Montenegro, Republic of 43* is below level 2 1* is level 5 and above
Uruguay
47* is below level 2 1* is level 5 and above
Thailand
33* is below level 2 1* is level 5 and above
Chile 33* is below level 2 1* is level 5 and above
Costa Rica
32* is below level 2 1!* is level 5 and above
Argentina
54* is below level 2 1* is level 5 and above
Brazil
49* is below level 2 1* is level 5 and above
Peru
60* is below level 2 #!* is level 5 and above
Mexico 41* is below level 2 * is level 5 and above
Colombia
51* is below level 2 #!* is level 5 and above
Tunisia
49* is below level 2 ‡ is level 5 and above
Jordan
51* is below level 2 ‡ is level 5 and above
Malaysia
53* is below level 2 ‡ is level 5 and above
Indonesia 55* is below level 2 ‡ is level 5 and above
Kazakhstan 57* is below level 2 ‡ is level 5 and above
U.S. state education systems
Massachusetts 11* is below level 2 16* is level 5 and above
Connecticut 13 is below level 2 15* is level 5 and above
Florida 17 is below level 2 6* is level 5 and above
Below level 2 Levels 5 and above
# Rounds to zero.! Interpret with caution. Estimate is unstable due to high coefficient of variation.‡ Reporting standards not met.* p < .05. Significantly different from the U.S. percentage at the .05 level of significance.NOTE: Education systems are ordered by 2012 percentages of 15-year-olds in levels 5 and above. To reach a particular proficiency level, a student must correctly answer a majority of items at that level. Students were classified into reading proficiency levels according to their scores. Cut scores for each proficiency level can be found in table A-1 in appendix A. The OECD average is the average of the national percentages of the OECD member countries, with each country weighted equally. Italics indicate non-OECD countries and education systems. Results for Connecticut, Florida, and Massachusetts are for public school students only. The standard errors of the estimates are shown in table R1b available at http://nces.ed.gov/pubsearch/pubsinfo.asp?pubid=2014024.SOURCE: Organization for Economic Cooperation and Development (OECD), Program for International Student Assessment (PISA), 2012.
0 20 40 60 80 100 0 20 40 60 80 100Percent Percent
Percent0 20 40 60 80 100
18 83 25 *
10 21 *10 18 *
7 17 *8 14 *
16 14 *11 13 *19 13 *11 13 *11 12 *16 12 *14 12 *10
*****
*
**
* 11 *12 1116 10 *11 1014 1024 1014 914 922 917 9
9 817 823 811 720 717 6 *21 6 *19 6 *
*20 618 6 *19 6 *15 5 *23 5 *21
*
**
*
*
***
*
** 5 *
22 * 5 *9 * 5 *
19 4 *28 * 4 *22 * 4 *39 * 4 *17 4 *33 * 4 *21 * 3 *33 * 2 *36 * 2 *57 * 2 *37 * 2 *52 * 1 *43 * 1 *47 * 1 *33 * 1 *33 * 1 *32 * 1 !*54 * 1 *49 * 1 *60 * # !*41 * # *51 * # !*49 * ‡51 * ‡53 * ‡55 * ‡57 * ‡
11 * 16 *13 15 *17 6 *
37

National Center for Education StatisticsTable R1b. Percentage of 15-year-old students performing at PISA reading literacy proficiency levels 5 and above and below level 2, by education system: 2012
Education systemBelow level 2 Levels 5 and above
Percent s.e. Percent s.e. Education systemBelow level 2 Levels 5 and above
Percent s.e. Percent s.e.OECD average 18.0 0.18 8.4 0.12Shanghai-China 2.9 * 0.39 25.1 * 1.19Singapore 9.9 * 0.42 21.2 * 0.60Japan 9.8 * 0.92 18.5 * 1.27Hong Kong-China 6.8 * 0.72 16.8 * 1.16Korea, Republic of 7.6 * 0.89 14.1 * 1.24New Zealand 16.3 0.83 14.0 * 0.77Finland 11.3 * 0.71 13.5 * 0.64France 18.9 0.98 12.9 * 0.85Canada 10.9 * 0.45 12.9 * 0.62Chinese Taipei 11.5 * 0.87 11.8 * 0.84Belgium 16.1 0.81 11.8 * 0.60Australia 14.2 0.46 11.7 * 0.54Ireland 9.6 * 0.88 11.4 * 0.65Liechtenstein 12.4 1.88 10.9 2.89Norway 16.2 1.03 10.2 * 0.74Poland 10.6 * 0.80 10.0 0.93Netherlands 14.0 1.23 9.8 0.82Israel 23.6 * 1.64 9.6 0.84Switzerland 13.7 * 0.76 9.1 0.68Germany 14.5 0.91 8.9 0.70Luxembourg 22.2 * 0.74 8.9 0.39United Kingdom 16.6 1.30 8.8 0.74Estonia 9.1 * 0.65 8.3 0.72United States 16.6 1.26 7.9 0.67Sweden 22.7 * 1.15 7.9 0.64Macao-China 11.5 * 0.42 7.0 0.41Italy 19.5 * 0.67 6.7 0.35Czech Republic 16.9 1.21 6.1 * 0.55Iceland 21.0 * 0.72 5.8 * 0.51Portugal 18.8 1.42 5.8 * 0.61Hungary 19.7 1.22 5.6 * 0.75Spain 18.3 0.76 5.5 * 0.30Austria 19.5 1.07 5.5 * 0.61Denmark 14.6 1.07 5.4 * 0.62Greece 22.6 * 1.24 5.1 * 0.61Slovenia 21.1 * 0.68 5.0 * 0.43
Russian Federation 22.3 * 1.29 4.6 * 0.58Vietnam 9.4 * 1.43 4.5 * 0.81Croatia 18.7 1.29 4.4 * 0.69Slovak Republic 28.2 * 1.78 4.4 * 0.68Turkey 21.6 * 1.43 4.3 * 0.85Bulgaria 39.4 * 2.21 4.3 * 0.64Latvia 17.0 1.14 4.2 * 0.55Cyprus 32.8 * 0.67 4.0 * 0.32Lithuania 21.2 * 1.18 3.3 * 0.37Serbia, Republic of 33.1 * 1.66 2.2 * 0.41United Arab Emirates 35.5 * 1.08 2.2 * 0.29Qatar 57.1 * 0.42 1.6 * 0.14Romania 37.3 * 1.87 1.6 * 0.38Albania 52.3 * 1.28 1.2 * 0.25Montenegro, Republic of 43.3 * 0.75 1.0 * 0.19Uruguay 47.0 * 1.42 0.9 * 0.27Thailand 33.0 * 1.40 0.8 * 0.22Chile 33.0 * 1.67 0.6 * 0.10Costa Rica 32.4 * 1.81 0.6 !* 0.19Argentina 53.6 * 1.73 0.5 * 0.14Brazil 49.2 * 1.13 0.5 * 0.12Peru 59.9 * 1.95 0.5 !* 0.21Mexico 41.1 * 0.90 0.4 * 0.09Colombia 51.4 * 1.78 0.3 !* 0.13Tunisia 49.3 * 2.24 ‡ †Jordan 50.7 * 1.57 ‡ †Malaysia 52.7 * 1.71 ‡ †Indonesia 55.2 * 2.18 ‡ †Kazakhstan 57.1 * 1.56 ‡ †
U.S. state education systemsMassachusetts 11.5 * 1.37 16.1 * 1.98Connecticut 13.2 1.76 14.5 * 1.68Florida 17.5 2.00 5.5 * 1.02
† Not applicable.! Interpret data with caution. Estimate is unstable due to high coefficient of variation.‡ Reporting standards not met.* p <.05. Significantly different from the U.S. percentage at the .05 level of statistical significance.NOTE: Education systems are ordered by 2012 percentages of 15-year-olds in levels 5 and above. To reach a particular proficiency level, a student must correctly answer a majority of items at that level. Students were classified into reading proficiency levels according to their scores. Exact cut scores are as follows: below level 1b (a score less than or equal to 262.04); level 1b (a score greater than 262.04 and less than or equal to 334.75); level 1a (a score greater than 334.75 and less than or equal to 407.47); level 2 (a score greater than 407.47 and less than or equal to 480.18); level 3 (a score greater than 480.18 and less than or equal to 552.89); level 4 (a score greater than 552.89 and less than or equal to 625.61); level 5 (a score greater than 625.61 and less than or equal to 698.32); and level 6 (a score greater than 698.32). Scores are reported on a scale from 0 to 1,000. The OECD average is the average of the national percentages of the OECD member countries, with each country weighted equally. Standard error is noted by s.e. Italics indicate non-OECD countries and education systems. Results for Connecticut, Florida, and Massachusetts are for public school students only. This table corresponds to figure 3 in Performance of U.S. 15-Year-Old Students in Mathematics, Science, and Reading Literacy in an International Context (NCES 2014-024).SOURCE: Organization for Economic Cooperation and Development (OECD), Program for International Student Assessment (PISA), 2012.
38
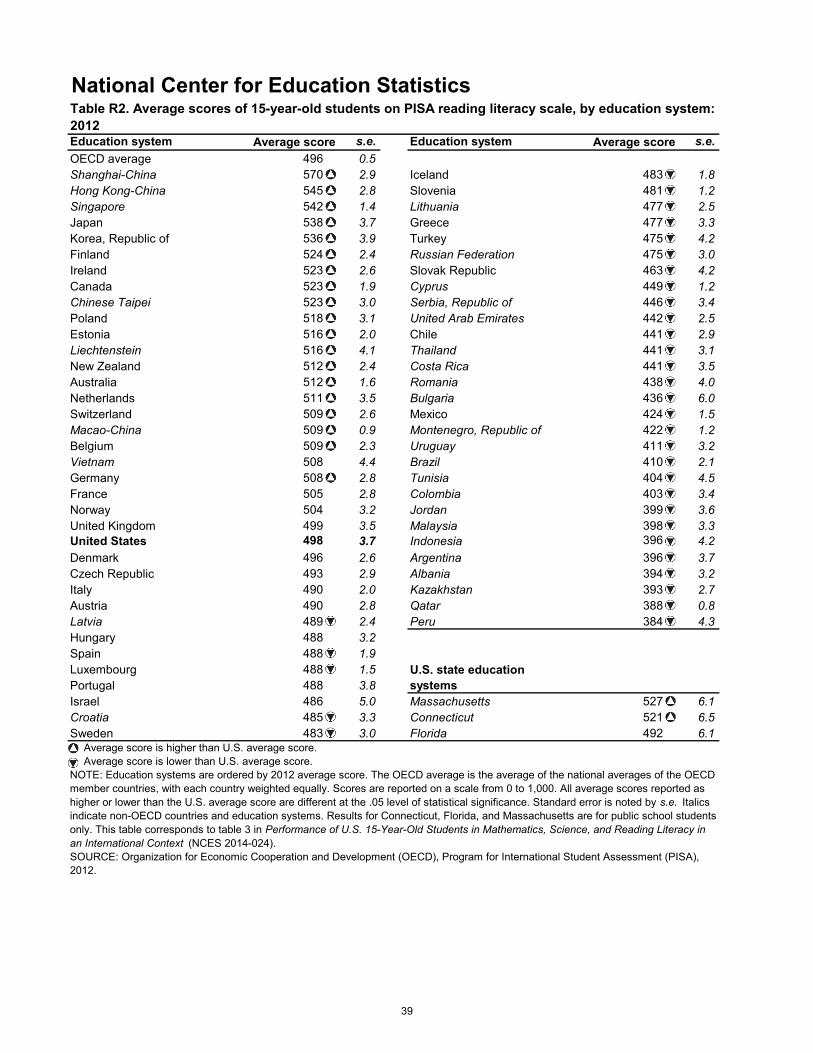
National Center for Education StatisticsTable R2. Average scores of 15-year-old students on PISA reading literacy scale, by education system: 2012Education system Average score s.e.OECD average 496 0.5Shanghai-China 570 2.9Hong Kong-China 545 2.8Singapore 542 1.4Japan 538 3.7Korea, Republic of 536 3.9Finland 524 2.4Ireland 523 2.6Canada 523 1.9Chinese Taipei 523 3.0Poland 518 3.1Estonia 516 2.0Liechtenstein 516 4.1New Zealand 512 2.4Australia 512 1.6Netherlands 511 3.5Switzerland 509 2.6Macao-China 509 0.9Belgium 509 2.3Vietnam 508 4.4Germany 508 2.8France 505 2.8Norway 504 3.2United Kingdom 499 3.5United States 498 3.7Denmark 496 2.6Czech Republic 493 2.9Italy 490 2.0Austria 490 2.8Latvia 489 2.4Hungary 488 3.2Spain 488 1.9Luxembourg 488 1.5Portugal 488 3.8Israel 486 5.0Croatia 485 3.3Sweden 483 3.0
Education system Average score s.e.
Iceland 483 1.8Slovenia 481 1.2Lithuania 477 2.5Greece 477 3.3Turkey 475 4.2Russian Federation 475 3.0Slovak Republic 463 4.2Cyprus 449 1.2Serbia, Republic of 446 3.4United Arab Emirates 442 2.5Chile 441 2.9Thailand 441 3.1Costa Rica 441 3.5Romania 438 4.0Bulgaria 436 6.0Mexico 424 1.5Montenegro, Republic of 422 1.2Uruguay 411 3.2Brazil 410 2.1Tunisia 404 4.5Colombia 403 3.4Jordan 399 3.6Malaysia 398 3.3Indonesia 396 4.2Argentina 396 3.7Albania 394 3.2Kazakhstan 393 2.7Qatar 388 0.8Peru 384 4.3
U.S. state education systemsMassachusetts 527 6.1Connecticut 521 6.5Florida 492 6.1
Average score is higher than U.S. average score. Average score is lower than U.S. average score.NOTE: Education systems are ordered by 2012 average score. The OECD average is the average of the national averages of the OECD member countries, with each country weighted equally. Scores are reported on a scale from 0 to 1,000. All average scores reported as higher or lower than the U.S. average score are different at the .05 level of statistical significance. Standard error is noted by s.e. Italics indicate non-OECD countries and education systems. Results for Connecticut, Florida, and Massachusetts are for public school students only. This table corresponds to table 3 in Performance of U.S. 15-Year-Old Students in Mathematics, Science, and Reading Literacy in an International Context (NCES 2014-024).SOURCE: Organization for Economic Cooperation and Development (OECD), Program for International Student Assessment (PISA), 2012.
39

National Center for Education StatisticsTable R3. Cut scores of 15-year-old students on PISA reading literacy scale at selected percentiles and percentile cut score gaps, by education system: 2012
Education system
Percentile10th 25th 50th 75th 90th 90th to 10th
Cut score s.e. Cut score s.e. Cut score s.e. Cut score s.e. Cut score s.e. Cut score gap s.e.OECD average 372 0.9 435 0.7 502 0.6 563 0.5 613 0.6 242 1.1Vietnam 411 8.2 462 5.4 512 4.1 559 3.9 599 5.0 189 9.6Kazakhstan 297 4.4 344 3.1 394 3.1 444 3.4 487 3.5 189 5.7Costa Rica 344 5.4 391 4.3 441 3.8 490 4.2 536 5.0 191 7.4Indonesia 299 6.1 346 4.7 397 4.4 447 4.6 492 6.1 193 8.6Thailand 341 4.4 389 3.5 442 3.4 494 3.7 541 4.4 201 6.3Chile 339 4.2 388 3.8 443 3.3 496 3.3 541 3.3 202 5.3Shanghai-China 463 4.6 518 3.6 576 2.9 626 2.8 667 3.5 204 5.8Mexico 319 2.5 370 1.9 425 1.8 479 1.8 525 1.9 206 3.1Estonia 412 3.4 463 3.0 519 2.3 571 2.4 618 2.8 206 4.4Macao-China 400 2.4 457 1.8 513 1.2 566 1.4 611 1.6 211 2.9Colombia 295 5.4 348 4.0 404 3.7 460 3.7 509 4.5 215 7.0Malaysia 288 4.4 343 3.7 402 3.6 457 3.9 503 4.3 215 6.1Korea, Republic of 424 6.2 483 4.3 543 4.4 596 4.1 640 4.0 216 7.4Denmark 385 5.1 442 3.5 501 2.5 555 2.4 602 2.8 216 5.8Hong Kong-China 430 5.4 493 4.4 552 3.2 604 3.0 648 3.4 218 6.4Brazil 302 2.8 353 2.4 409 2.4 468 2.7 520 3.0 218 4.1Latvia 375 5.6 434 3.0 495 2.8 548 2.9 593 2.8 219 6.2Ireland 410 5.7 469 3.6 526 2.9 582 2.7 631 3.2 221 6.5Lithuania 363 4.0 419 3.9 482 2.8 538 2.8 585 3.1 222 5.1Poland 404 4.6 461 3.2 522 3.5 579 3.6 626 4.8 222 6.6Turkey 365 4.6 417 4.0 475 4.6 534 5.6 588 6.8 223 8.3Croatia 370 5.1 427 4.4 487 3.6 546 3.8 593 4.9 223 7.1Czech Republic 378 4.7 434 3.7 496 3.7 554 3.6 604 3.8 226 6.0Tunisia 286 7.1 346 5.9 409 5.0 466 4.5 515 5.6 229 9.0Jordan 280 6.4 343 4.5 406 3.4 462 3.2 510 4.6 230 7.9Romania 322 4.4 375 4.4 437 4.6 501 5.5 555 5.3 232 6.9Russian Federation 359 4.5 415 4.0 476 3.4 537 3.9 592 4.2 233 6.1Switzerland 388 3.9 451 3.3 514 2.8 573 2.8 622 3.2 233 5.1Spain 367 3.6 430 2.6 494 2.2 552 2.1 601 2.3 234 4.3Chinese Taipei 399 5.2 467 4.4 532 3.3 587 2.8 633 3.6 235 6.3Canada 403 2.8 464 2.2 528 2.2 587 2.2 638 2.6 235 3.8United States 378 4.8 436 4.5 500 3.9 561 3.9 614 4.0 235 6.3Slovenia 362 2.5 420 1.9 484 1.9 548 2.1 598 2.5 237 3.5Germany 384 4.8 447 3.6 514 3.4 574 3.1 621 3.2 237 5.8Montenegro, Republic of 301 3.0 360 2.5 423 2.2 487 1.8 540 3.4 238 4.5Austria 365 5.1 427 3.9 496 3.4 557 3.0 603 2.5 238 5.7Netherlands 386 6.6 451 5.1 519 4.3 579 3.7 625 3.6 239 7.5Liechtenstein 391 9.5 452 7.8 518 5.5 584 6.9 630 10.6 239 14.2Finland 399 4.3 463 3.5 530 3.1 590 2.3 639 2.5 240 5.0Hungary 363 5.2 427 4.6 494 3.7 555 3.3 603 3.9 240 6.5Serbia, Republic of 325 5.5 384 4.4 448 4.0 509 4.1 566 4.6 241 7.2Peru 263 5.1 319 4.7 385 4.7 447 5.2 504 6.4 241 8.2Portugal 362 6.0 429 4.9 493 4.2 554 3.5 604 3.5 242 6.9Argentina 274 5.4 332 4.5 399 4.1 462 4.1 516 4.4 243 7.0United Arab Emirates 316 3.7 376 3.1 445 3.1 508 2.8 562 3.1 246 4.8United Kingdom 372 7.0 438 4.8 504 3.8 567 3.4 619 3.8 247 8.0Uruguay 285 5.3 348 4.3 414 3.4 477 3.0 534 4.1 248 6.7Australia 386 2.4 448 2.2 516 1.8 579 1.9 634 2.3 249 3.3Japan 409 6.5 475 4.8 545 4.1 607 3.8 658 4.4 249 7.9Italy 359 2.9 427 2.6 497 2.5 559 2.1 609 2.2 250 3.6Iceland 352 4.1 422 2.9 490 2.0 551 2.9 602 2.4 250 4.7Greece 346 6.0 416 4.5 486 3.4 545 3.4 597 3.9 251 7.1Norway 375 4.8 442 4.0 510 3.4 573 3.4 627 3.9 252 6.2Belgium 373 4.3 444 3.2 517 2.6 583 2.2 633 2.3 260 4.8Singapore 408 2.9 475 2.1 548 2.2 614 2.1 668 3.2 260 4.3Slovak Republic 321 8.4 396 6.8 472 4.5 538 4.1 591 5.2 270 9.9New Zealand 374 4.9 443 3.2 516 2.9 586 3.1 645 4.0 271 6.3Sweden 343 5.4 416 4.3 490 3.3 558 3.3 614 4.2 272 6.8Luxembourg 347 2.7 418 2.4 492 2.2 564 2.2 620 2.3 273 3.6France 358 5.4 435 4.3 515 2.9 584 3.6 639 3.9 281 6.6Cyprus 297 3.3 378 2.4 459 2.1 528 2.1 583 2.6 286 4.2Albania 247 7.2 325 4.8 402 3.4 473 3.2 536 3.4 289 7.9Qatar 242 2.0 310 1.7 386 1.2 465 1.9 535 2.3 293 3.1Israel 329 7.5 414 6.8 497 5.4 568 4.5 624 4.5 295 8.7Bulgaria 275 8.0 353 8.2 443 7.2 523 6.0 585 6.1 310 10.0
U.S. state education systemsFlorida 377 7.2 433 7.1 496 6.6 555 7.0 602 7.4 225 10.4Massachusetts 399 7.7 464 7.1 529 7.2 595 7.7 652 7.3 253 10.7Connecticut 388 9.6 456 7.5 526 6.2 590 6.0 645 7.3 257 12.1
Cut score gap is larger than the U.S. percentile cut score gap.Cut score gap is smaller than the U.S. percentile cut score gap.
NOTE: This table shows the threshold (or cut) scores for the following: (a) 10th percentile- the bottom 10 percent of students; (b) 25th percentile- the bottom 25 percent of students; (c) 50th percentile- the median (half the students scored below the cut score and half scored above it); (d) 75th percentile- the top 25 percent of students; (e) 90th percentile- the top 10 percent of students. The percentile ranges are specific to each education system's distribution of scores, enabling users to compare cut scores across education systems. Education systems are ordered by cut score gap. The OECD average is the average of the national averages of the OECD member countries, with each country weighted equally. Scores are reported on a scale from 0 to 1,000. Standard error is noted by s.e . Italics indicate non-OECD countries and education systems. Results for Connecticut, Florida, and Massachusetts are for public school students only. SOURCE: Organization for Economic Cooperation and Development (OECD), Program for International Student Assessment (PISA), 2012.
40
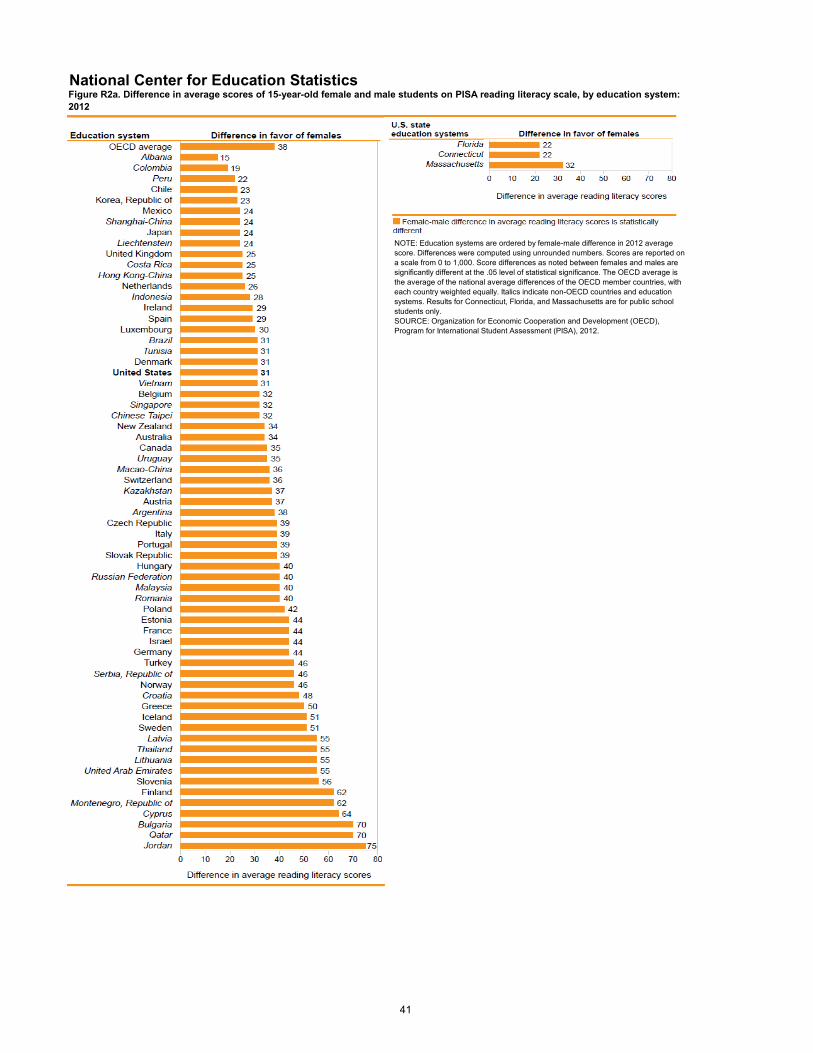
National Center for Education StatisticsFigure R2a. Difference in average scores of 15-year-old female and male students on PISA reading literacy scale, by education system: 2012
NOTE: Education systems are ordered by female-male difference in 2012 average score. Differences were computed using unrounded numbers. Scores are reported on a scale from 0 to 1,000. Score differences as noted between females and males are significantly different at the .05 level of statistical significance. The OECD average is the average of the national average differences of the OECD member countries, with each country weighted equally. Italics indicate non-OECD countries and education systems. Results for Connecticut, Florida, and Massachusetts are for public school students only. SOURCE: Organization for Economic Cooperation and Development (OECD), Program for International Student Assessment (PISA), 2012.
41
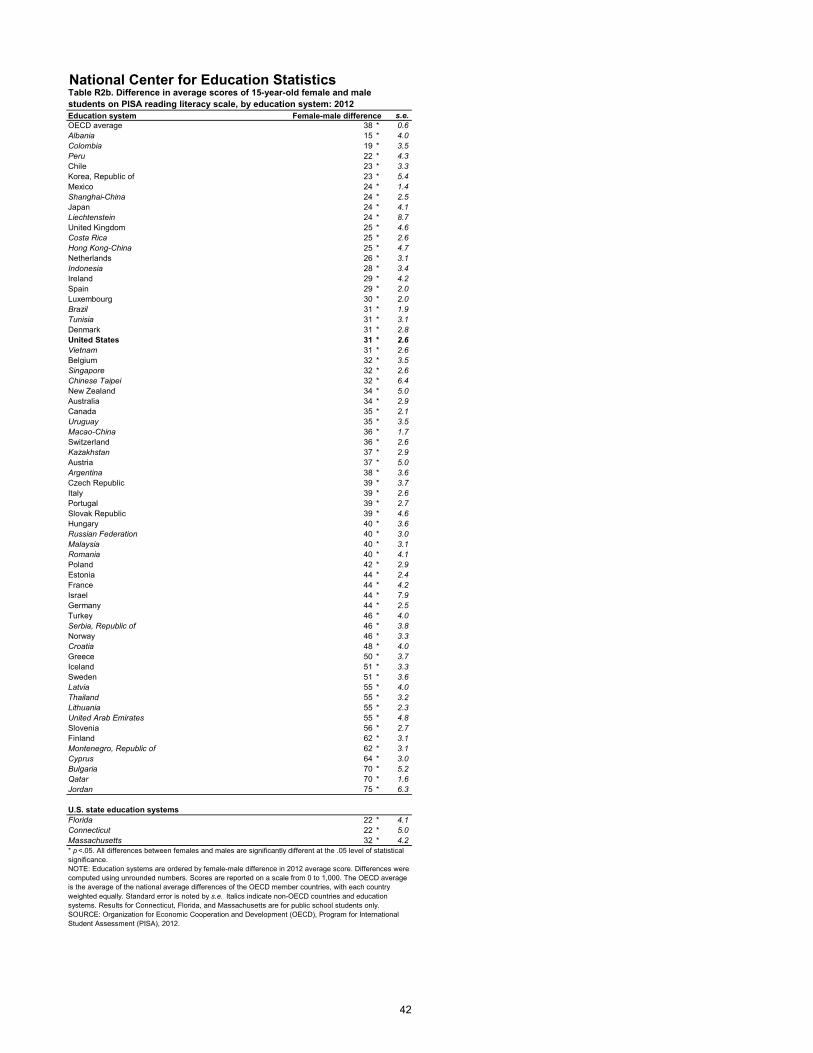
National Center for Education StatisticsTable R2b. Difference in average scores of 15-year-old female and male students on PISA reading literacy scale, by education system: 2012Education system Female-male difference s.e.OECD average 38 * 0.6Albania 15 * 4.0Colombia 19 * 3.5Peru 22 * 4.3Chile 23 * 3.3Korea, Republic of 23 * 5.4Mexico 24 * 1.4Shanghai-China 24 * 2.5Japan 24 * 4.1Liechtenstein 24 * 8.7United Kingdom 25 * 4.6Costa Rica 25 * 2.6Hong Kong-China 25 * 4.7Netherlands 26 * 3.1Indonesia 28 * 3.4Ireland 29 * 4.2Spain 29 * 2.0Luxembourg 30 * 2.0Brazil 31 * 1.9Tunisia 31 * 3.1Denmark 31 * 2.8United States 31 * 2.6Vietnam 31 * 2.6Belgium 32 * 3.5Singapore 32 * 2.6Chinese Taipei 32 * 6.4New Zealand 34 * 5.0Australia 34 * 2.9Canada 35 * 2.1Uruguay 35 * 3.5Macao-China 36 * 1.7Switzerland 36 * 2.6Kazakhstan 37 * 2.9Austria 37 * 5.0Argentina 38 * 3.6Czech Republic 39 * 3.7Italy 39 * 2.6Portugal 39 * 2.7Slovak Republic 39 * 4.6Hungary 40 * 3.6Russian Federation 40 * 3.0Malaysia 40 * 3.1Romania 40 * 4.1Poland 42 * 2.9Estonia 44 * 2.4France 44 * 4.2Israel 44 * 7.9Germany 44 * 2.5Turkey 46 * 4.0Serbia, Republic of 46 * 3.8Norway 46 * 3.3Croatia 48 * 4.0Greece 50 * 3.7Iceland 51 * 3.3Sweden 51 * 3.6Latvia 55 * 4.0Thailand 55 * 3.2Lithuania 55 * 2.3United Arab Emirates 55 * 4.8Slovenia 56 * 2.7Finland 62 * 3.1Montenegro, Republic of 62 * 3.1Cyprus 64 * 3.0Bulgaria 70 * 5.2Qatar 70 * 1.6Jordan 75 * 6.3
U.S. state education systemsFlorida 22 * 4.1Connecticut 22 * 5.0Massachusetts 32 * 4.2* p <.05. All differences between females and males are significantly different at the .05 level of statistical significance. NOTE: Education systems are ordered by female-male difference in 2012 average score. Differences were computed using unrounded numbers. Scores are reported on a scale from 0 to 1,000. The OECD average is the average of the national average differences of the OECD member countries, with each country weighted equally. Standard error is noted by s.e. Italics indicate non-OECD countries and education systems. Results for Connecticut, Florida, and Massachusetts are for public school students only. SOURCE: Organization for Economic Cooperation and Development (OECD), Program for International Student Assessment (PISA), 2012.
42

Table R4. Percentage distribution of U.S. 15-year-old public school students on PISA reading literacy scale, by proficiency level and percentage of students in enrolled schools eligible for free or reduced-price lunch, based on principals' reports: 2012Percent of students eligible for free or reduced-price lunch
Below level 1b Level 1b Level 1a Level 2 Level 3 Level 4 Level 5 Level 6Percent
National Center for Education Statistics
s.e. Percent s.e. Percent s.e. Percent s.e. Percent s.e. Percent s.e. Percent s.e. Percent s.e. U.S. average 0.8 !** 0.24 3.6 0.49 12.3 0.89 24.9 0.99 30.5 0.88 20.1 1.08 6.9 0.59 1.0 0.22Less than 10 percent ‡ † ‡ † ‡ † 12.9 * 2.64 29.2 *** 3.22 33.2 * 4.24 17.2 * 2.99 ‡ †10 to 24.9 percent ‡ † 2.1 !* 0.69 6.9 * 1.12 21.1 *** 2.22 32.2 *** 1.96 25.8 * 1.75 10.2 *** 1.50 1.7 !*** 0.7625 to 49.9 percent ‡ † 1.8 !* 0.57 8.7 * 1.34 22.1 *** 2.14 30.9 *** 1.60 24.9 *** 2.29 9.9 *** 1.34 1.4 !*** 0.5850 to 74.9 percent 0.8 !*** 0.31 4.7 *** 1.04 15.0 *** 1.70 28.1 * 1.55 32.2 *** 1.71 15.7 * 1.60 3.1 * 0.62 ‡ †75 percent or more 2.4 !*** 1.06 6.7 *** 1.32 21.1 * 2.59 31.8 * 2.51 25.6 *** 2.42 10.3 * 2.03 2.0 !* 0.98 ‡ † OECD average 1.3 *** 0.05 4.4 0.08 12.3 0.13 23.5 0.16 29.1 0.17 21.0 0.16 7.3 0.10 1.1 0.04† Not applicable.! Interpret data with caution. Estimate is unstable due to high coefficient of variation.‡ Reporting standards not met.* p <.05. Significantly different from both the U.S. and OECD averages at the .05 level of statistical significance.** p <.05. Significantly different from the OECD average at the .05 level of statistical significance.*** p <.05. Significantly different from the U.S. average at the .05 level of statistical significance.NOTE: To reach a particular proficiency level, a student must correctly answer a majority of items at that level. Students were classified into reading literacy levels according to their scores. Exact cut scores are as follows: below level 1b (a score less than or equal to 262.04); level 1b (a score greater than 262.04 and less than or equal to 334.75); level 1a (a score greater than 334.75 and less than or equal to 407.47); level 2 (a score greater than 407.47 and less than or equal to 480.18); level 3 (a score greater than 480.18 and less than or equal to 552.89); level 4 (a score greater than 552.89 and less than or equal to 625.61); level 5 (a score greater than 625.61 and less than or equal to 698.32); and level 6 (a score greater than 698.32). Scores are reported on a scale from 0 to 1,000. The National School Lunch Program provides free or reduced-price lunch for students meeting certain income guidelines. The percentage of students receiving such lunch is an indicator of the socioeconomic level of families served by the school. Data in this table are based on principals' responses to a question in the school questionnaire that asked the approximate percentage of eligible students in the school during the previous school year. The OECD average is the average of the national percentages of the OECD member countries, with each country weighted equally. Standard error is noted by s.e. Free or reduced-price lunch data are for public schools only. Detail may not sum to totals because of rounding.SOURCE: Organization for Economic Cooperation and Development (OECD), Program for International Student Assessment (PISA), 2012.
43
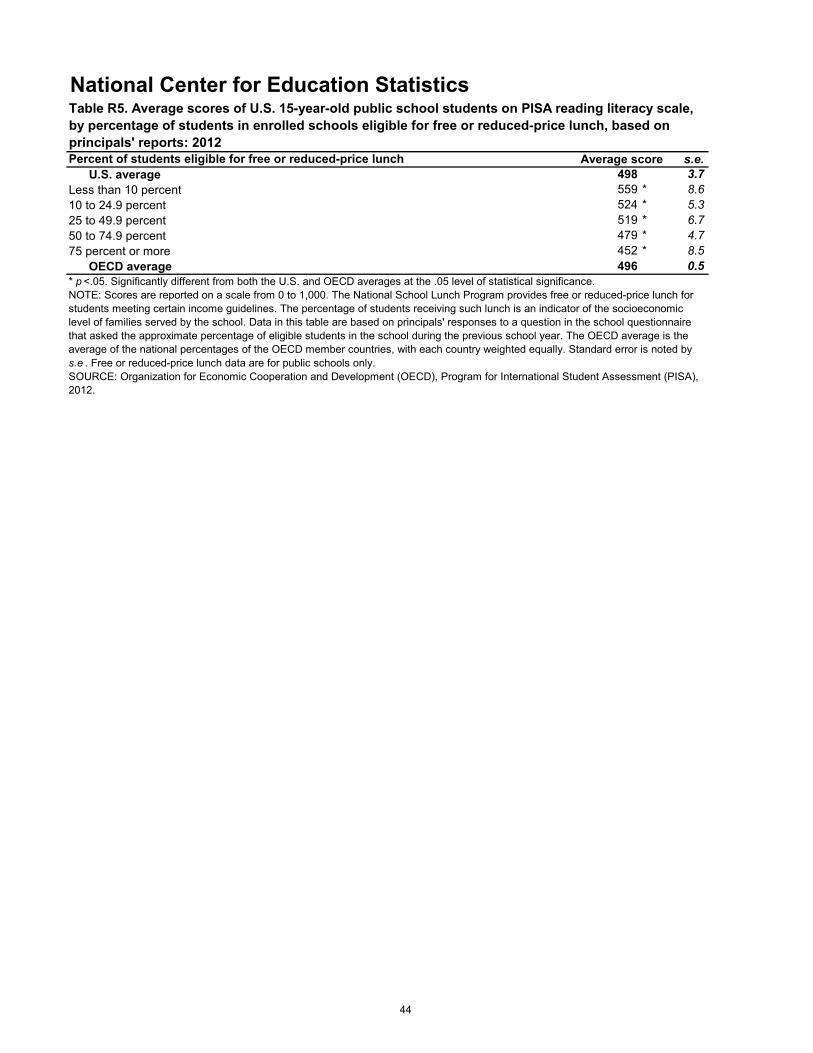
National Center for Education StatisticsTable R5. Average scores of U.S. 15-year-old public school students on PISA reading literacy scale, by percentage of students in enrolled schools eligible for free or reduced-price lunch, based on principals' reports: 2012Percent of students eligible for free or reduced-price lunch Average score s.e.
U.S. average 498 3.7Less than 10 percent 559 * 8.610 to 24.9 percent 524 * 5.325 to 49.9 percent 519 * 6.750 to 74.9 percent 479 * 4.775 percent or more 452 * 8.5
OECD average 496 0.5* p <.05. Significantly different from both the U.S. and OECD averages at the .05 level of statistical significance.NOTE: Scores are reported on a scale from 0 to 1,000. The National School Lunch Program provides free or reduced-price lunch for students meeting certain income guidelines. The percentage of students receiving such lunch is an indicator of the socioeconomic level of families served by the school. Data in this table are based on principals' responses to a question in the school questionnaire that asked the approximate percentage of eligible students in the school during the previous school year. The OECD average is the average of the national percentages of the OECD member countries, with each country weighted equally. Standard error is noted by s.e . Free or reduced-price lunch data are for public schools only. SOURCE: Organization for Economic Cooperation and Development (OECD), Program for International Student Assessment (PISA), 2012.
44
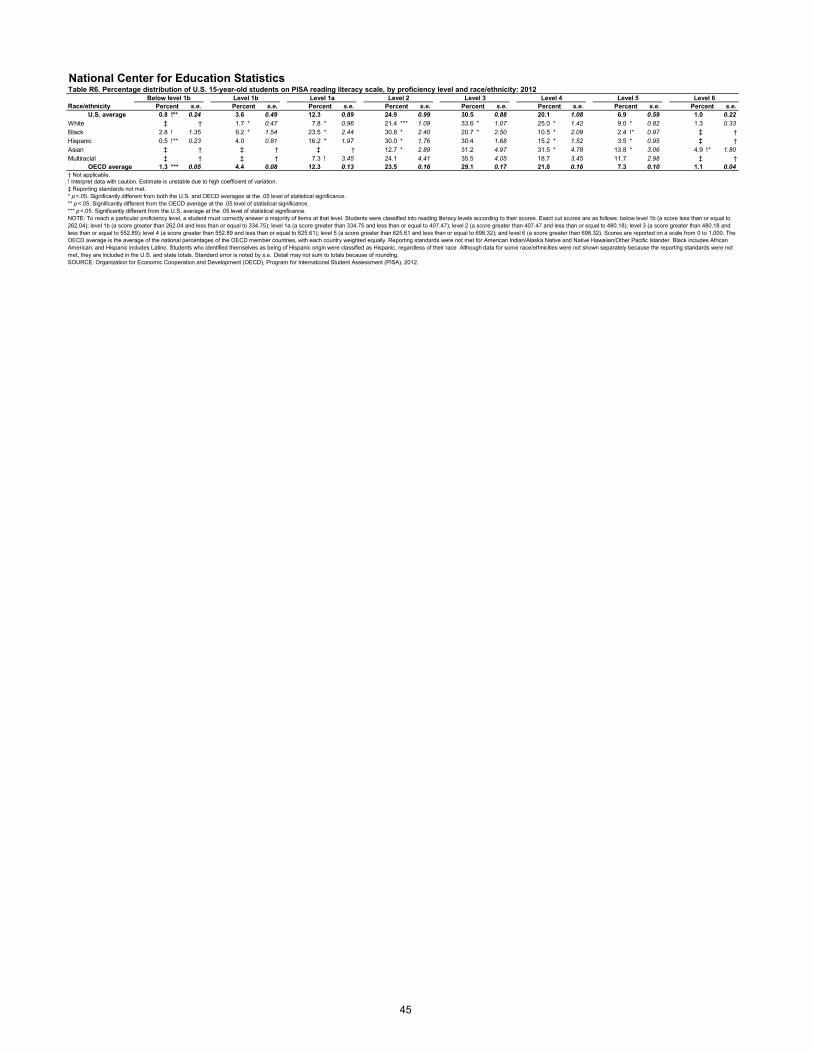
National Center for Education StatisticsTable R6. Percentage distribution of U.S. 15-year-old students on PISA reading literacy scale, by proficiency level and race/ethnicity: 2012
Race/ethnicityBelow level 1b Level 1b Level 1a Level 2 Level 3 Level 4 Level 5 Level 6
Percent s.e. Percent s.e. Percent s.e. Percent s.e. Percent s.e. Percent s.e. Percent s.e. Percent s.e.U.S. average 0.8 !** 0.24 3.6 0.49 12.3 0.89 24.9 0.99 30.5 0.88 20.1 1.08 6.9 0.59 1.0 0.22
White ‡ † 1.7 * 0.47 7.8 * 0.96 21.4 *** 1.09 33.6 * 1.07 25.0 * 1.42 9.0 * 0.82 1.3 0.33Black 2.8 ! 1.35 9.2 * 1.54 23.5 * 2.44 30.8 * 2.40 20.7 * 2.50 10.5 * 2.09 2.4 !* 0.97 ‡ †Hispanic 0.5 !** 0.23 4.0 0.81 16.2 * 1.97 30.0 * 1.76 30.4 1.68 15.2 * 1.52 3.5 * 0.95 ‡ †Asian ‡ † ‡ † ‡ † 12.7 * 2.89 31.2 4.97 31.5 * 4.78 13.8 * 3.06 4.9 !* 1.80Multiracial ‡ † ‡ † 7.3 ! 3.45 24.1 4.41 35.5 4.05 18.7 3.45 11.7 2.98 ‡ †
OECD average 1.3 *** 0.05 4.4 0.08 12.3 0.13 23.5 0.16 29.1 0.17 21.0 0.16 7.3 0.10 1.1 0.04† Not applicable.! Interpret data with caution. Estimate is unstable due to high coefficient of variation.‡ Reporting standards not met.* p <.05. Significantly different from both the U.S. and OECD averages at the .05 level of statistical significance.** p <.05. Significantly different from the OECD average at the .05 level of statistical significance.*** p <.05. Significantly different from the U.S. average at the .05 level of statistical significance.NOTE: To reach a particular proficiency level, a student must correctly answer a majority of items at that level. Students were classified into reading literacy levels according to their scores. Exact cut scores are as follows: below level 1b (a score less than or equal to 262.04); level 1b (a score greater than 262.04 and less than or equal to 334.75); level 1a (a score greater than 334.75 and less than or equal to 407.47); level 2 (a score greater than 407.47 and less than or equal to 480.18); level 3 (a score greater than 480.18 and less than or equal to 552.89); level 4 (a score greater than 552.89 and less than or equal to 625.61); level 5 (a score greater than 625.61 and less than or equal to 698.32); and level 6 (a score greater than 698.32). Scores are reported on a scale from 0 to 1,000. The OECD average is the average of the national percentages of the OECD member countries, with each country weighted equally. Reporting standards were not met for American Indian/Alaska Native and Native Hawaiian/Other Pacific Islander. Black includes African American, and Hispanic includes Latino. Students who identified themselves as being of Hispanic origin were classified as Hispanic, regardless of their race. Although data for some race/ethnicities were not shown separately because the reporting standards were not met, they are included in the U.S. and state totals. Standard error is noted by s.e. Detail may not sum to totals because of rounding. SOURCE: Organization for Economic Cooperation and Development (OECD), Program for International Student Assessment (PISA), 2012.
45
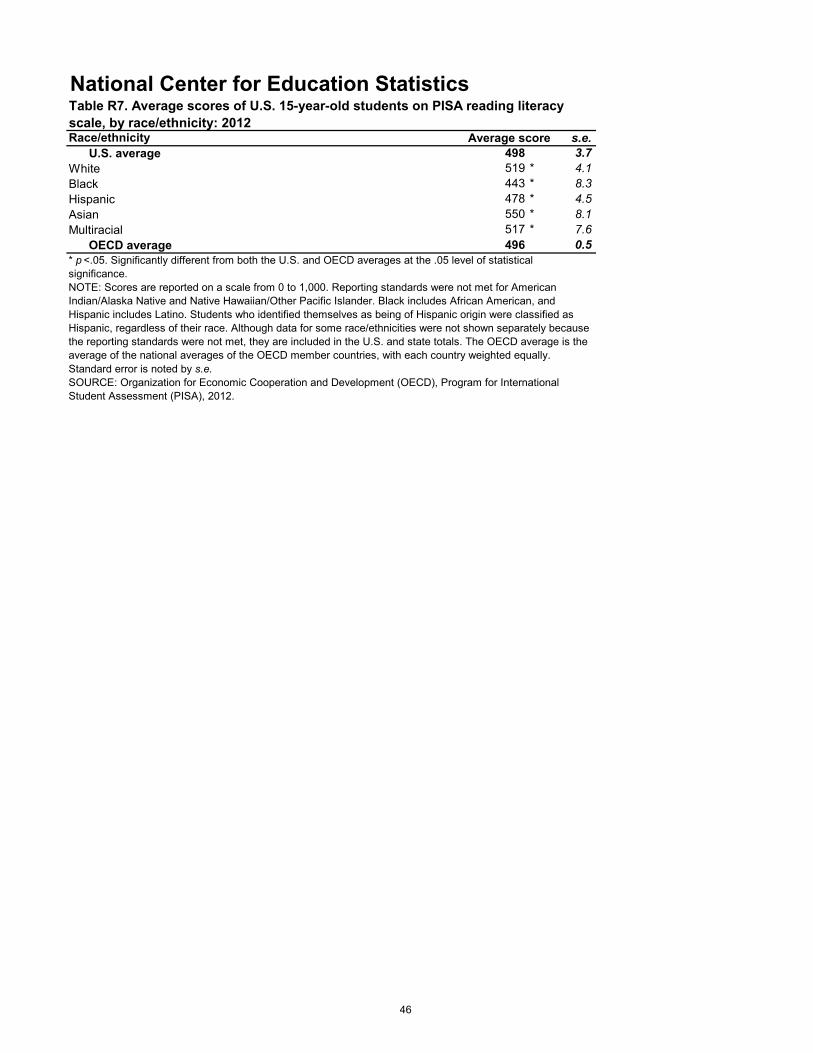
National Center for Education StatisticsTable R7. Average scores of U.S. 15-year-old students on PISA reading literacy scale, by race/ethnicity: 2012 Race/ethnicity Average score s.e.
U.S. average 498 3.7White 519 * 4.1Black 443 * 8.3Hispanic 478 * 4.5Asian 550 * 8.1Multiracial 517 * 7.6
OECD average 496 0.5* p <.05. Significantly different from both the U.S. and OECD averages at the .05 level of statistical significance.NOTE: Scores are reported on a scale from 0 to 1,000. Reporting standards were not met for American Indian/Alaska Native and Native Hawaiian/Other Pacific Islander. Black includes African American, and Hispanic includes Latino. Students who identified themselves as being of Hispanic origin were classified as Hispanic, regardless of their race. Although data for some race/ethnicities were not shown separately because the reporting standards were not met, they are included in the U.S. and state totals. The OECD average is the average of the national averages of the OECD member countries, with each country weighted equally. Standard error is noted by s.e. SOURCE: Organization for Economic Cooperation and Development (OECD), Program for International Student Assessment (PISA), 2012.
46

National Center for Education StatisticsTable T1. Average scores and changes in average scores of U.S. 15-year-old students on PISA mathematics, science, and reading literacy scales: 2000, 2003, 2006, 2009, and 2012
Subject
2000 2003 2006 2009 2012 Change in average scoreAverage
score s.e.Average
score s.e.Average
score s.e.Average
score s.e.Average
score s.e.2000–2012
2003–2012
2006–2012
2009–2012
Mathematics † † 483 2.9 474 4.0 487 3.6 481 3.6 †Science † † † † 489 4.2 502 3.6 497 3.8 † †Reading 504 7.0 495 3.2 ― † 500 3.7 498 3.7 — Average score in 2012 is not measurably different than in comparison year.— Not available. PISA 2006 reading literacy results are not reported for the United States because of an error in printing the test booklets and comparisons are not possible. † Not applicable. Although mathematics was assessed in 2000 and science was assessed in 2000 and 2003, because the mathematics framework was revised for PISA 2003 and the science framework was revised for 2006, it is possible to look at changes in mathematics only from 2003 forward and in science only from 2006 forward.NOTE: All average scores reported as higher or lower than the comparison year are different at the .05 level of statistical significance. Standard error is noted by s.e. This table corresponds to table 4 in Performance of U.S. 15-Year-Old Students in Mathematics, Science, and Reading Literacy in an International Context (NCES 2014-024).SOURCE: Organization for Economic Cooperation and Development (OECD), Program for International Student Assessment (PISA), 2000, 2003, 2006, 2009, 2012.
47
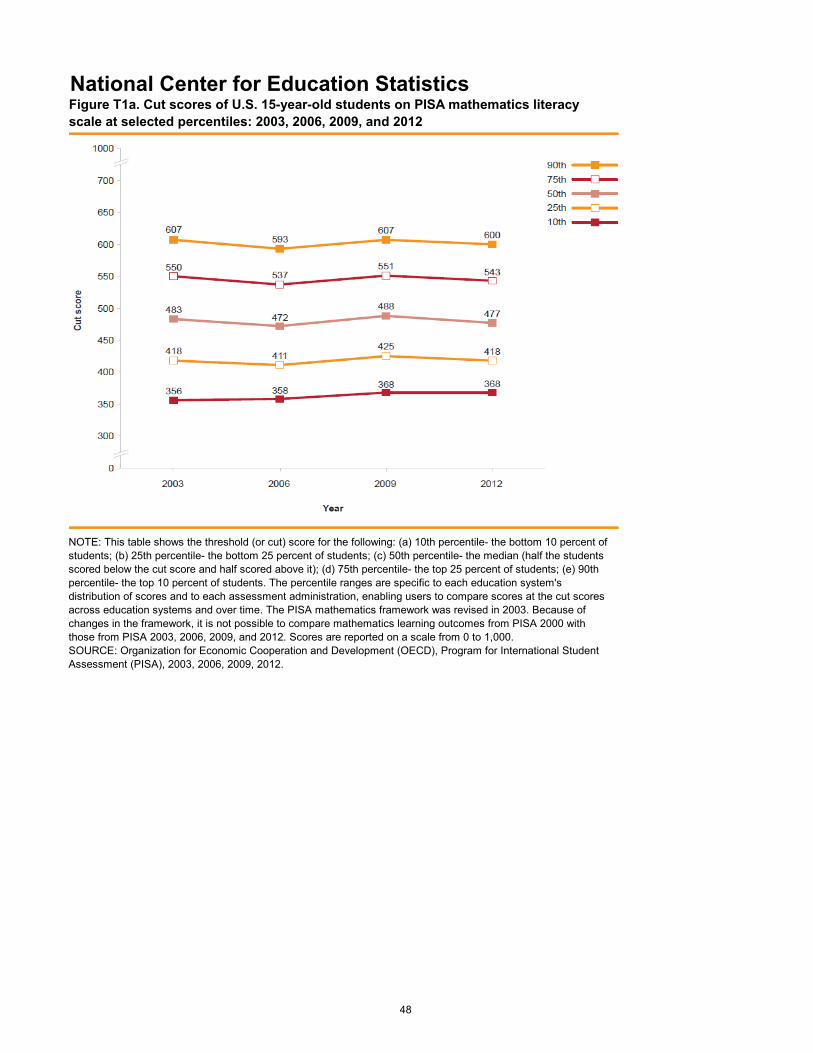
National Center for Education StatisticsFigure T1a. Cut scores of U.S. 15-year-old students on PISA mathematics literacy scale at selected percentiles: 2003, 2006, 2009, and 2012
NOTE: This table shows the threshold (or cut) score for the following: (a) 10th percentile- the bottom 10 percent of students; (b) 25th percentile- the bottom 25 percent of students; (c) 50th percentile- the median (half the students scored below the cut score and half scored above it); (d) 75th percentile- the top 25 percent of students; (e) 90th percentile- the top 10 percent of students. The percentile ranges are specific to each education system's distribution of scores and to each assessment administration, enabling users to compare scores at the cut scores across education systems and over time. The PISA mathematics framework was revised in 2003. Because of changes in the framework, it is not possible to compare mathematics learning outcomes from PISA 2000 with those from PISA 2003, 2006, 2009, and 2012. Scores are reported on a scale from 0 to 1,000. SOURCE: Organization for Economic Cooperation and Development (OECD), Program for International Student Assessment (PISA), 2003, 2006, 2009, 2012.
48
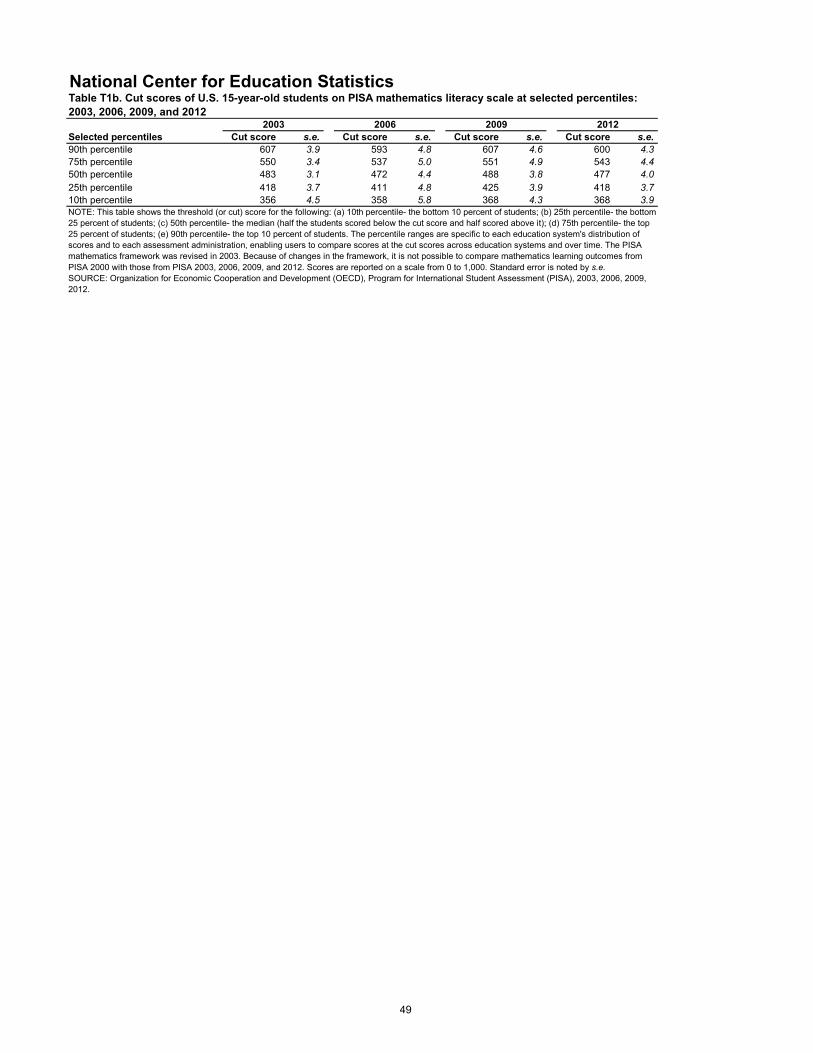
National Center for Education StatisticsTable T1b. Cut scores of U.S. 15-year-old students on PISA mathematics literacy scale at selected percentiles: 2003, 2006, 2009, and 2012
Selected percentiles2003 2006 2009 2012
Cut score s.e. Cut score s.e. Cut score s.e. Cut score s.e.90th percentile 607 3.9 593 4.8 607 4.6 600 4.375th percentile 550 3.4 537 5.0 551 4.9 543 4.450th percentile 483 3.1 472 4.4 488 3.8 477 4.025th percentile 418 3.7 411 4.8 425 3.9 418 3.710th percentile 356 4.5 358 5.8 368 4.3 368 3.9NOTE: This table shows the threshold (or cut) score for the following: (a) 10th percentile- the bottom 10 percent of students; (b) 25th percentile- the bottom 25 percent of students; (c) 50th percentile- the median (half the students scored below the cut score and half scored above it); (d) 75th percentile- the top 25 percent of students; (e) 90th percentile- the top 10 percent of students. The percentile ranges are specific to each education system's distribution of scores and to each assessment administration, enabling users to compare scores at the cut scores across education systems and over time. The PISA mathematics framework was revised in 2003. Because of changes in the framework, it is not possible to compare mathematics learning outcomes from PISA 2000 with those from PISA 2003, 2006, 2009, and 2012. Scores are reported on a scale from 0 to 1,000. Standard error is noted by s.e. SOURCE: Organization for Economic Cooperation and Development (OECD), Program for International Student Assessment (PISA), 2003, 2006, 2009, 2012.
49
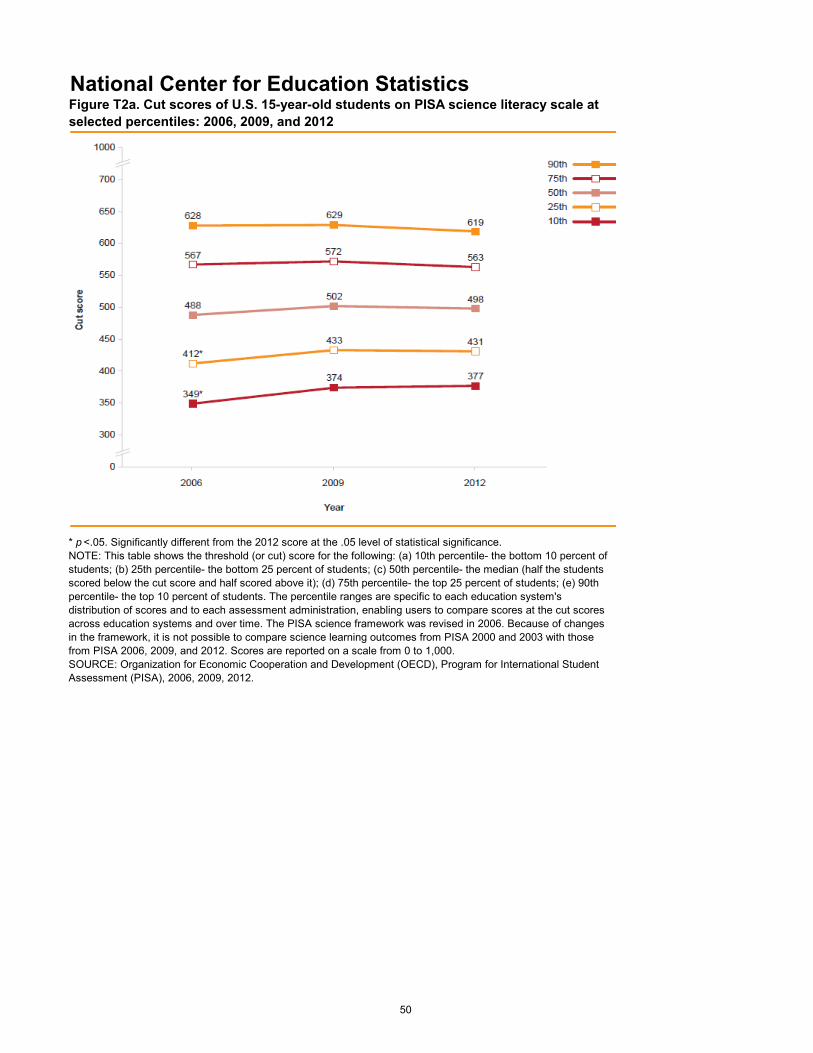
National Center for Education StatisticsFigure T2a. Cut scores of U.S. 15-year-old students on PISA science literacy scale at selected percentiles: 2006, 2009, and 2012
* p <.05. Significantly different from the 2012 score at the .05 level of statistical significance.NOTE: This table shows the threshold (or cut) score for the following: (a) 10th percentile- the bottom 10 percent of students; (b) 25th percentile- the bottom 25 percent of students; (c) 50th percentile- the median (half the students scored below the cut score and half scored above it); (d) 75th percentile- the top 25 percent of students; (e) 90th percentile- the top 10 percent of students. The percentile ranges are specific to each education system's distribution of scores and to each assessment administration, enabling users to compare scores at the cut scores across education systems and over time. The PISA science framework was revised in 2006. Because of changes in the framework, it is not possible to compare science learning outcomes from PISA 2000 and 2003 with those from PISA 2006, 2009, and 2012. Scores are reported on a scale from 0 to 1,000. SOURCE: Organization for Economic Cooperation and Development (OECD), Program for International Student Assessment (PISA), 2006, 2009, 2012.
50
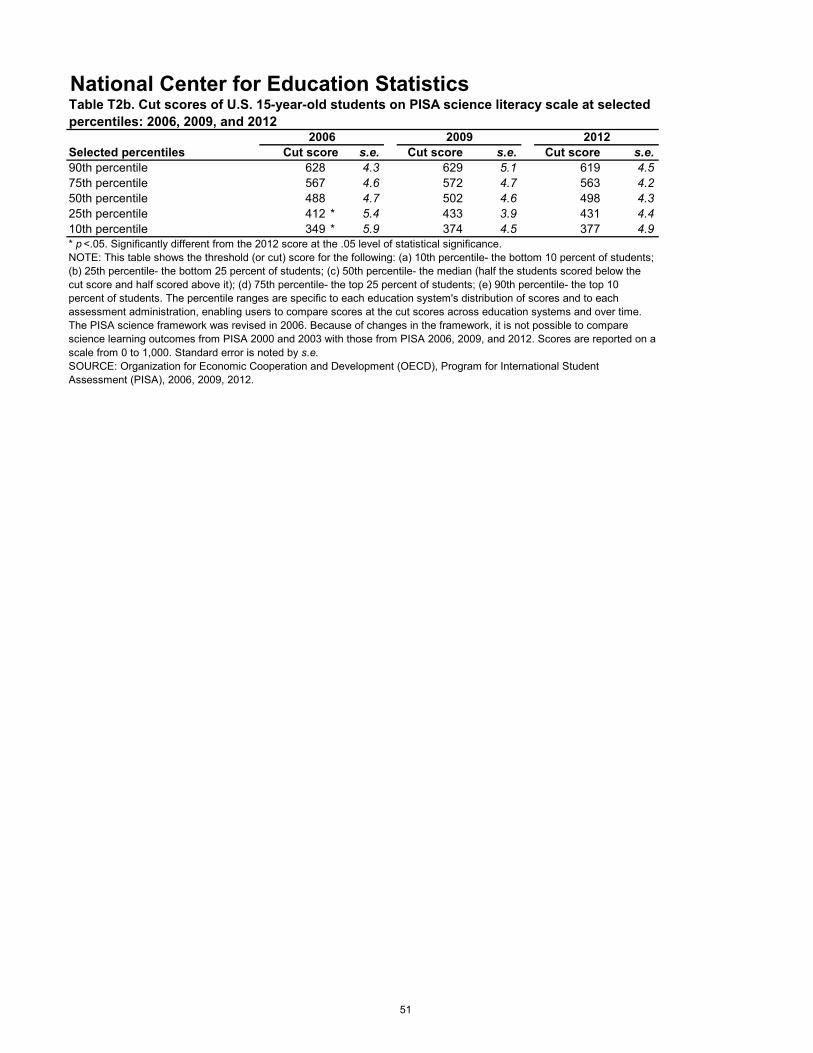
National Center for Education StatisticsTable T2b. Cut scores of U.S. 15-year-old students on PISA science literacy scale at selected percentiles: 2006, 2009, and 2012
Selected percentiles2006 2009 2012
Cut score s.e. Cut score s.e. Cut score s.e.90th percentile 628 4.3 629 5.1 619 4.575th percentile 567 4.6 572 4.7 563 4.250th percentile 488 4.7 502 4.6 498 4.325th percentile 412 * 5.4 433 3.9 431 4.410th percentile 349 * 5.9 374 4.5 377 4.9* p <.05. Significantly different from the 2012 score at the .05 level of statistical significance.NOTE: This table shows the threshold (or cut) score for the following: (a) 10th percentile- the bottom 10 percent of students; (b) 25th percentile- the bottom 25 percent of students; (c) 50th percentile- the median (half the students scored below the cut score and half scored above it); (d) 75th percentile- the top 25 percent of students; (e) 90th percentile- the top 10 percent of students. The percentile ranges are specific to each education system's distribution of scores and to each assessment administration, enabling users to compare scores at the cut scores across education systems and over time. The PISA science framework was revised in 2006. Because of changes in the framework, it is not possible to compare science learning outcomes from PISA 2000 and 2003 with those from PISA 2006, 2009, and 2012. Scores are reported on a scale from 0 to 1,000. Standard error is noted by s.e. SOURCE: Organization for Economic Cooperation and Development (OECD), Program for International Student Assessment (PISA), 2006, 2009, 2012.
51
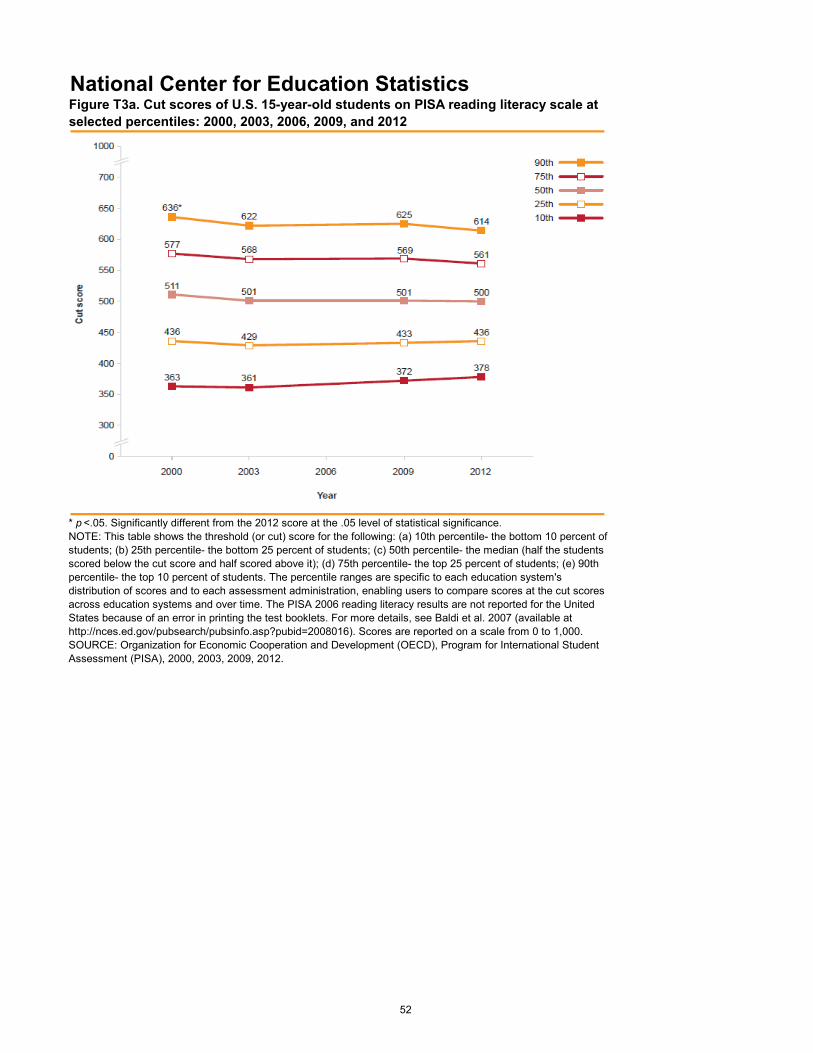
National Center for Education StatisticsFigure T3a. Cut scores of U.S. 15-year-old students on PISA reading literacy scale at selected percentiles: 2000, 2003, 2006, 2009, and 2012
* p <.05. Significantly different from the 2012 score at the .05 level of statistical significance.NOTE: This table shows the threshold (or cut) score for the following: (a) 10th percentile- the bottom 10 percent of students; (b) 25th percentile- the bottom 25 percent of students; (c) 50th percentile- the median (half the students scored below the cut score and half scored above it); (d) 75th percentile- the top 25 percent of students; (e) 90th percentile- the top 10 percent of students. The percentile ranges are specific to each education system's distribution of scores and to each assessment administration, enabling users to compare scores at the cut scores across education systems and over time. The PISA 2006 reading literacy results are not reported for the United States because of an error in printing the test booklets. For more details, see Baldi et al. 2007 (available at http://nces.ed.gov/pubsearch/pubsinfo.asp?pubid=2008016). Scores are reported on a scale from 0 to 1,000. SOURCE: Organization for Economic Cooperation and Development (OECD), Program for International Student Assessment (PISA), 2000, 2003, 2009, 2012.
52

National Center for Education StatisticsTable T3b. Cut scores of U.S. 15-year-old students on PISA reading literacy scale at selected percentiles: 2000, 2003, 2009, and 2012
Selected percentiles2000 2003 2009 2012
Cut score s.e. Cut score s.e. Cut score s.e. Cut score s.e.90th percentile 636 * 6.5 622 3.5 625 5.0 614 4.075th percentile 577 6.8 568 3.6 569 4.6 561 3.950th percentile 511 7.0 501 3.6 501 4.2 500 3.925th percentile 436 8.8 429 4.1 433 4.0 436 4.510th percentile 363 11.4 361 5.2 372 3.9 378 4.8* p <.05. Significantly different from the 2012 score at the .05 level of statistical significance.NOTE: This table shows the threshold (or cut) score for the following: (a) 10th percentile- the bottom 10 percent of students; (b) 25th percentile- the bottom 25 percent of students; (c) 50th percentile- the median (half the students scored below the cut score and half scored above it); (d) 75th percentile- the top 25 percent of students; (e) 90th percentile- the top 10 percent of students. The percentile ranges are specific to each education system's distribution of scores and to each assessment administration, enabling users to compare scores at the cut scores across education systems and over time. The PISA 2006 reading literacy results are not reported for the United States because of an error in printing the test booklets. For more details, see Baldi et al. 2007 (available at http://nces.ed.gov/pubsearch/pubsinfo.asp?pubid=2008016). Scores are reported on a scale from 0 to 1,000. Standard error is noted by s.e. SOURCE: Organization for Economic Cooperation and Development (OECD), Program for International Student Assessment (PISA), 2000, 2003, 2009, 2012.
53
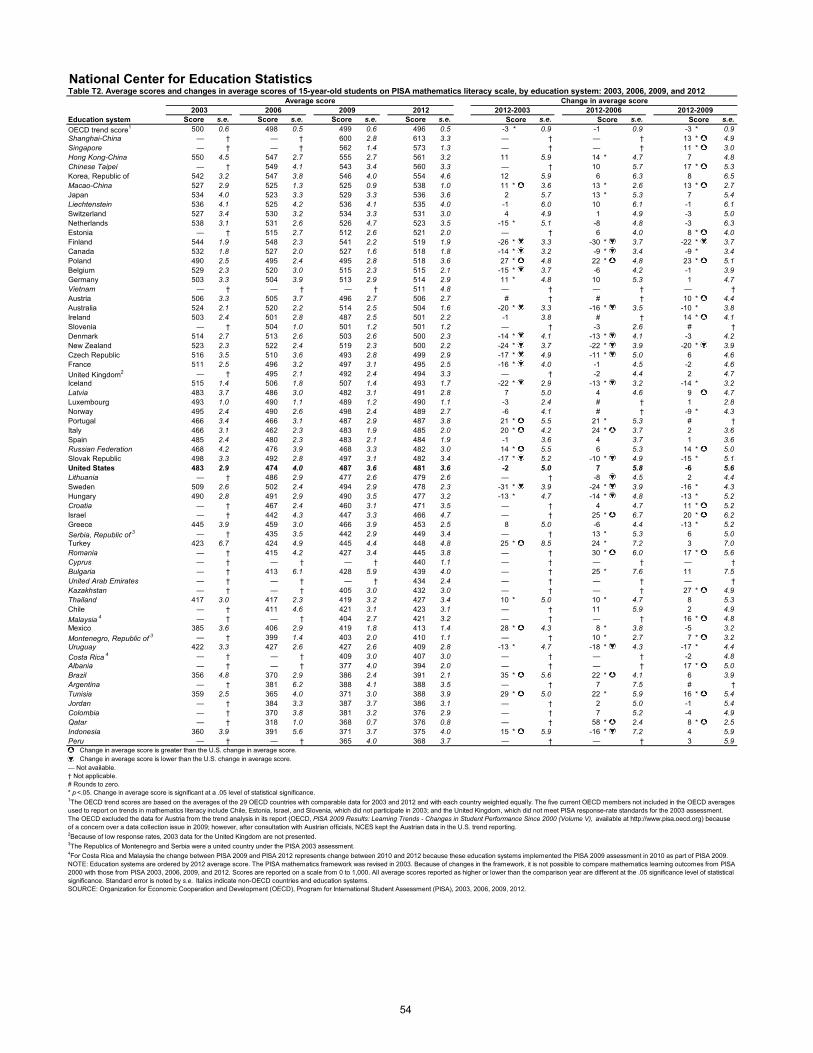
National Center for Education StatisticsTable T2. Average scores and changes in average scores of 15-year-old students on PISA mathematics literacy scale, by education system: 2003, 2006, 2009, and 2012
Education system
Average score Change in average score2003 2006 2009 2012 2012-2003 2012-2006 2012-2009
Score s.e. Score s.e. Score s.e. Score s.e. Score s.e. Score s.e. Score s.e.OECD trend score1 500 0.6 498 0.5 499 0.6 496 0.5 -3 * 0.9 -1 0.9 -3 * 0.9Shanghai-China — † — † 600 2.8 613 3.3 — † — † 13 * 4.9Singapore — † — † 562 1.4 573 1.3 — † — † 11 * 3.0Hong Kong-China 550 4.5 547 2.7 555 2.7 561 3.2 11 5.9 14 * 4.7 7 4.8Chinese Taipei — † 549 4.1 543 3.4 560 3.3 — † 10 5.7 17 * 5.3Korea, Republic of 542 3.2 547 3.8 546 4.0 554 4.6 12 5.9 6 6.3 8 6.5Macao-China 527 2.9 525 1.3 525 0.9 538 1.0 11 * 3.6 13 * 2.6 13 * 2.7Japan 534 4.0 523 3.3 529 3.3 536 3.6 2 5.7 13 * 5.3 7 5.4Liechtenstein 536 4.1 525 4.2 536 4.1 535 4.0 -1 6.0 10 6.1 -1 6.1Switzerland 527 3.4 530 3.2 534 3.3 531 3.0 4 4.9 1 4.9 -3 5.0Netherlands 538 3.1 531 2.6 526 4.7 523 3.5 -15 * 5.1 -8 4.8 -3 6.3Estonia — † 515 2.7 512 2.6 521 2.0 — † 6 4.0 8 * 4.0Finland 544 1.9 548 2.3 541 2.2 519 1.9 -26 * 3.3 -30 * 3.7 -22 * 3.7Canada 532 1.8 527 2.0 527 1.6 518 1.8 -14 * 3.2 -9 * 3.4 -9 * 3.4Poland 490 2.5 495 2.4 495 2.8 518 3.6 27 * 4.8 22 * 4.8 23 * 5.1Belgium 529 2.3 520 3.0 515 2.3 515 2.1 -15 * 3.7 -6 4.2 -1 3.9Germany 503 3.3 504 3.9 513 2.9 514 2.9 11 * 4.8 10 5.3 1 4.7Vietnam — † — † — † 511 4.8 — † — † — †Austria 506 3.3 505 3.7 496 2.7 506 2.7 # † # † 10 * 4.4Australia 524 2.1 520 2.2 514 2.5 504 1.6 -20 * 3.3 -16 * 3.5 -10 * 3.8Ireland 503 2.4 501 2.8 487 2.5 501 2.2 -1 3.8 # † 14 * 4.1Slovenia — † 504 1.0 501 1.2 501 1.2 — † -3 2.6 # †Denmark 514 2.7 513 2.6 503 2.6 500 2.3 -14 * 4.1 -13 * 4.1 -3 4.2New Zealand 523 2.3 522 2.4 519 2.3 500 2.2 -24 * 3.7 -22 * 3.9 -20 * 3.9Czech Republic 516 3.5 510 3.6 493 2.8 499 2.9 -17 * 4.9 -11 * 5.0 6 4.6France 511 2.5 496 3.2 497 3.1 495 2.5 -16 * 4.0 -1 4.5 -2 4.6United Kingdom2 — † 495 2.1 492 2.4 494 3.3 — † -2 4.4 2 4.7Iceland 515 1.4 506 1.8 507 1.4 493 1.7 -22 * 2.9 -13 * 3.2 -14 * 3.2Latvia 483 3.7 486 3.0 482 3.1 491 2.8 7 5.0 4 4.6 9 4.7Luxembourg 493 1.0 490 1.1 489 1.2 490 1.1 -3 2.4 # † 1 2.8Norway 495 2.4 490 2.6 498 2.4 489 2.7 -6 4.1 # † -9 * 4.3Portugal 466 3.4 466 3.1 487 2.9 487 3.8 21 * 5.5 21 * 5.3 # †Italy 466 3.1 462 2.3 483 1.9 485 2.0 20 * 4.2 24 * 3.7 2 3.6Spain 485 2.4 480 2.3 483 2.1 484 1.9 -1 3.6 4 3.7 1 3.6Russian Federation 468 4.2 476 3.9 468 3.3 482 3.0 14 * 5.5 6 5.3 14 * 5.0Slovak Republic 498 3.3 492 2.8 497 3.1 482 3.4 -17 * 5.2 -10 * 4.9 -15 * 5.1United States 483 2.9 474 4.0 487 3.6 481 3.6 -2 5.0 7 5.8 -6 5.6Lithuania — † 486 2.9 477 2.6 479 2.6 — † -8 4.5 2 4.4Sweden 509 2.6 502 2.4 494 2.9 478 2.3 -31 * 3.9 -24 * 3.9 -16 * 4.3Hungary 490 2.8 491 2.9 490 3.5 477 3.2 -13 * 4.7 -14 * 4.8 -13 * 5.2Croatia — † 467 2.4 460 3.1 471 3.5 — † 4 4.7 11 * 5.2Israel — † 442 4.3 447 3.3 466 4.7 — † 25 * 6.7 20 * 6.2Greece 445 3.9 459 3.0 466 3.9 453 2.5 8 5.0 -6 4.4 -13 * 5.2Serbia, Republic of 3 — † 435 3.5 442 2.9 449 3.4 — † 13 * 5.3 6 5.0Turkey 423 6.7 424 4.9 445 4.4 448 4.8 25 * 8.5 24 * 7.2 3 7.0Romania — † 415 4.2 427 3.4 445 3.8 — † 30 * 6.0 17 * 5.6Cyprus — † — † — † 440 1.1 — † — † — †Bulgaria — † 413 6.1 428 5.9 439 4.0 — † 25 * 7.6 11 7.5United Arab Emirates — † — † — † 434 2.4 — † — † — †Kazakhstan — † — † 405 3.0 432 3.0 — † — † 27 * 4.9Thailand 417 3.0 417 2.3 419 3.2 427 3.4 10 * 5.0 10 * 4.7 8 5.3Chile — † 411 4.6 421 3.1 423 3.1 — † 11 5.9 2 4.9Malaysia 4 — † — † 404 2.7 421 3.2 — † — † 16 * 4.8Mexico 385 3.6 406 2.9 419 1.8 413 1.4 28 * 4.3 8 * 3.8 -5 3.2Montenegro, Republic of 3 — † 399 1.4 403 2.0 410 1.1 — † 10 * 2.7 7 * 3.2Uruguay 422 3.3 427 2.6 427 2.6 409 2.8 -13 * 4.7 -18 * 4.3 -17 * 4.4Costa Rica 4 — † — † 409 3.0 407 3.0 — † — † -2 4.8Albania — † — † 377 4.0 394 2.0 — † — † 17 * 5.0Brazil 356 4.8 370 2.9 386 2.4 391 2.1 35 * 5.6 22 * 4.1 6 3.9Argentina — † 381 6.2 388 4.1 388 3.5 — † 7 7.5 # †Tunisia 359 2.5 365 4.0 371 3.0 388 3.9 29 * 5.0 22 * 5.9 16 * 5.4Jordan — † 384 3.3 387 3.7 386 3.1 — † 2 5.0 -1 5.4Colombia — † 370 3.8 381 3.2 376 2.9 — † 7 5.2 -4 4.9Qatar — † 318 1.0 368 0.7 376 0.8 — † 58 * 2.4 8 * 2.5Indonesia 360 3.9 391 5.6 371 3.7 375 4.0 15 * 5.9 -16 * 7.2 4 5.9Peru — † — † 365 4.0 368 3.7 — † — † 3 5.9
Change in average score is greater than the U.S. change in average score. Change in average score is lower than the U.S. change in average score.
— Not available.† Not applicable.# Rounds to zero.* p <.05. Change in average score is significant at a .05 level of statistical significance.1The OECD trend scores are based on the averages of the 29 OECD countries with comparable data for 2003 and 2012 and with each country weighted equally. The five current OECD members not included in the OECD averages used to report on trends in mathematics literacy include Chile, Estonia, Israel, and Slovenia, which did not participate in 2003; and the United Kingdom, which did not meet PISA response-rate standards for the 2003 assessment. The OECD excluded the data for Austria from the trend analysis in its report (OECD, PISA 2009 Results: Learning Trends - Changes in Student Performance Since 2000 (Volume V), available at http://www.pisa.oecd.org) because of a concern over a data collection issue in 2009; however, after consultation with Austrian officials, NCES kept the Austrian data in the U.S. trend reporting.2Because of low response rates, 2003 data for the United Kingdom are not presented.3The Republics of Montenegro and Serbia were a united country under the PISA 2003 assessment.4For Costa Rica and Malaysia the change between PISA 2009 and PISA 2012 represents change between 2010 and 2012 because these education systems implemented the PISA 2009 assessment in 2010 as part of PISA 2009.NOTE: Education systems are ordered by 2012 average score. The PISA mathematics framework was revised in 2003. Because of changes in the framework, it is not possible to compare mathematics learning outcomes from PISA 2000 with those from PISA 2003, 2006, 2009, and 2012. Scores are reported on a scale from 0 to 1,000. All average scores reported as higher or lower than the comparison year are different at the .05 significance level of statistical significance. Standard error is noted by s.e. Italics indicate non-OECD countries and education systems. SOURCE: Organization for Economic Cooperation and Development (OECD), Program for International Student Assessment (PISA), 2003, 2006, 2009, 2012.
54
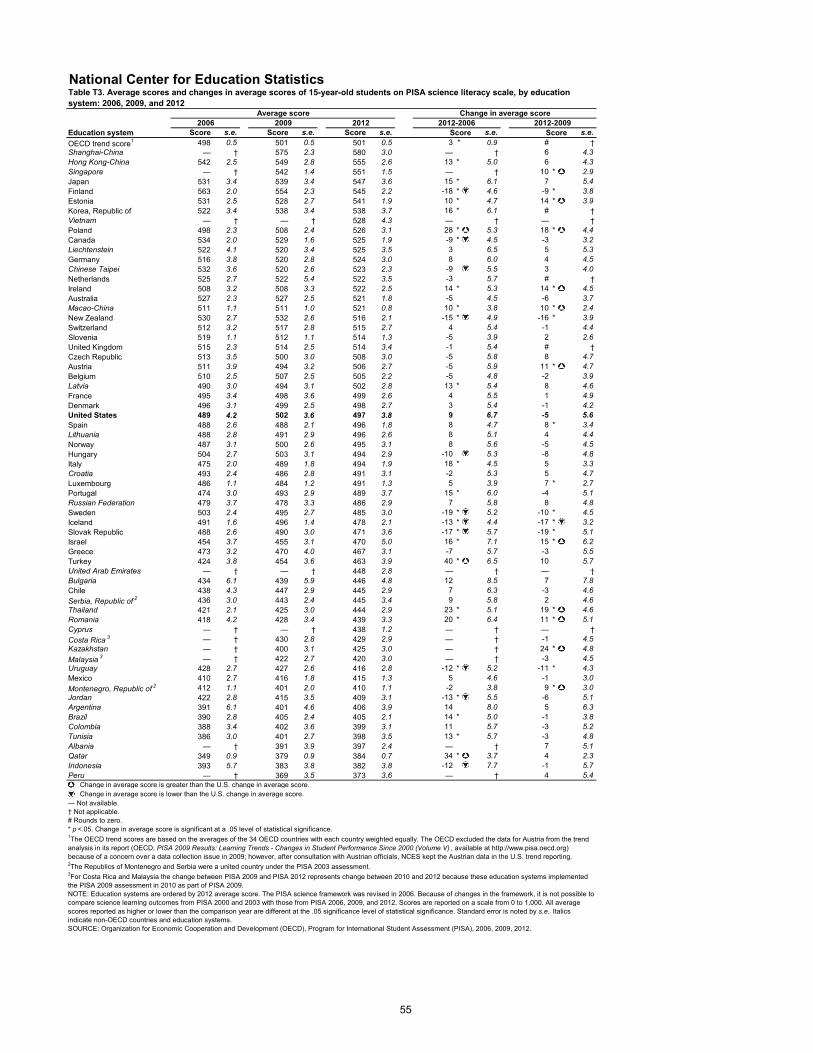
National Center for Education StatisticsTable T3. Average scores and changes in average scores of 15-year-old students on PISA science literacy scale, by education system: 2006, 2009, and 2012
Education system
Average score Change in average score2006 2009 2012 2012-2006 2012-2009
Score s.e. Score s.e. Score s.e. Score s.e. Score s.e.OECD trend score1 498 0.5 501 0.5 501 0.5 3 * 0.9 # †Shanghai-China — † 575 2.3 580 3.0 — † 6 4.3Hong Kong-China 542 2.5 549 2.8 555 2.6 13 * 5.0 6 4.3Singapore — † 542 1.4 551 1.5 — † 10 * 2.9Japan 531 3.4 539 3.4 547 3.6 15 * 6.1 7 5.4Finland 563 2.0 554 2.3 545 2.2 -18 * 4.6 -9 * 3.8Estonia 531 2.5 528 2.7 541 1.9 10 * 4.7 14 * 3.9Korea, Republic of 522 3.4 538 3.4 538 3.7 16 * 6.1 # †Vietnam — † — † 528 4.3 — † — †Poland 498 2.3 508 2.4 526 3.1 28 * 5.3 18 * 4.4Canada 534 2.0 529 1.6 525 1.9 -9 * 4.5 -3 3.2Liechtenstein 522 4.1 520 3.4 525 3.5 3 6.5 5 5.3Germany 516 3.8 520 2.8 524 3.0 8 6.0 4 4.5Chinese Taipei 532 3.6 520 2.6 523 2.3 -9 5.5 3 4.0Netherlands 525 2.7 522 5.4 522 3.5 -3 5.7 # †Ireland 508 3.2 508 3.3 522 2.5 14 * 5.3 14 * 4.5Australia 527 2.3 527 2.5 521 1.8 -5 4.5 -6 3.7Macao-China 511 1.1 511 1.0 521 0.8 10 * 3.8 10 * 2.4New Zealand 530 2.7 532 2.6 516 2.1 -15 * 4.9 -16 * 3.9Switzerland 512 3.2 517 2.8 515 2.7 4 5.4 -1 4.4Slovenia 519 1.1 512 1.1 514 1.3 -5 3.9 2 2.6United Kingdom 515 2.3 514 2.5 514 3.4 -1 5.4 # †Czech Republic 513 3.5 500 3.0 508 3.0 -5 5.8 8 4.7Austria 511 3.9 494 3.2 506 2.7 -5 5.9 11 * 4.7Belgium 510 2.5 507 2.5 505 2.2 -5 4.8 -2 3.9Latvia 490 3.0 494 3.1 502 2.8 13 * 5.4 8 4.6France 495 3.4 498 3.6 499 2.6 4 5.5 1 4.9Denmark 496 3.1 499 2.5 498 2.7 3 5.4 -1 4.2United States 489 4.2 502 3.6 497 3.8 9 6.7 -5 5.6Spain 488 2.6 488 2.1 496 1.8 8 4.7 8 * 3.4Lithuania 488 2.8 491 2.9 496 2.6 8 5.1 4 4.4Norway 487 3.1 500 2.6 495 3.1 8 5.6 -5 4.5Hungary 504 2.7 503 3.1 494 2.9 -10 5.3 -8 4.8Italy 475 2.0 489 1.8 494 1.9 18 * 4.5 5 3.3Croatia 493 2.4 486 2.8 491 3.1 -2 5.3 5 4.7Luxembourg 486 1.1 484 1.2 491 1.3 5 3.9 7 * 2.7Portugal 474 3.0 493 2.9 489 3.7 15 * 6.0 -4 5.1Russian Federation 479 3.7 478 3.3 486 2.9 7 5.8 8 4.8Sweden 503 2.4 495 2.7 485 3.0 -19 * 5.2 -10 * 4.5Iceland 491 1.6 496 1.4 478 2.1 -13 * 4.4 -17 * 3.2Slovak Republic 488 2.6 490 3.0 471 3.6 -17 * 5.7 -19 * 5.1Israel 454 3.7 455 3.1 470 5.0 16 * 7.1 15 * 6.2Greece 473 3.2 470 4.0 467 3.1 -7 5.7 -3 5.5Turkey 424 3.8 454 3.6 463 3.9 40 * 6.5 10 5.7United Arab Emirates — † — † 448 2.8 — † — †Bulgaria 434 6.1 439 5.9 446 4.8 12 8.5 7 7.8Chile 438 4.3 447 2.9 445 2.9 7 6.3 -3 4.6Serbia, Republic of 2 436 3.0 443 2.4 445 3.4 9 5.8 2 4.6Thailand 421 2.1 425 3.0 444 2.9 23 * 5.1 19 * 4.6Romania 418 4.2 428 3.4 439 3.3 20 * 6.4 11 * 5.1Cyprus — † — † 438 1.2 — † — †Costa Rica 3 — † 430 2.8 429 2.9 — † -1 4.5Kazakhstan — † 400 3.1 425 3.0 — † 24 * 4.8Malaysia 3 — † 422 2.7 420 3.0 — † -3 4.5Uruguay 428 2.7 427 2.6 416 2.8 -12 * 5.2 -11 * 4.3Mexico 410 2.7 416 1.8 415 1.3 5 4.6 -1 3.0Montenegro, Republic of 2 412 1.1 401 2.0 410 1.1 -2 3.8 9 * 3.0Jordan 422 2.8 415 3.5 409 3.1 -13 * 5.5 -6 5.1Argentina 391 6.1 401 4.6 406 3.9 14 8.0 5 6.3Brazil 390 2.8 405 2.4 405 2.1 14 * 5.0 -1 3.8Colombia 388 3.4 402 3.6 399 3.1 11 5.7 -3 5.2Tunisia 386 3.0 401 2.7 398 3.5 13 * 5.7 -3 4.8Albania — † 391 3.9 397 2.4 — † 7 5.1Qatar 349 0.9 379 0.9 384 0.7 34 * 3.7 4 2.3Indonesia 393 5.7 383 3.8 382 3.8 -12 7.7 -1 5.7Peru — † 369 3.5 373 3.6 — † 4 5.4
55
Change in average score is greater than the U.S. change in average score. Change in average score is lower than the U.S. change in average score.
— Not available.† Not applicable.# Rounds to zero.* p <.05. Change in average score is significant at a .05 level of statistical significance.1The OECD trend scores are based on the averages of the 34 OECD countries with each country weighted equally. The OECD excluded the data for Austria from the trend analysis in its report (OECD, PISA 2009 Results: Learning Trends - Changes in Student Performance Since 2000 (Volume V) , available at http://www.pisa.oecd.org) because of a concern over a data collection issue in 2009; however, after consultation with Austrian officials, NCES kept the Austrian data in the U.S. trend reporting.2The Republics of Montenegro and Serbia were a united country under the PISA 2003 assessment.3For Costa Rica and Malaysia the change between PISA 2009 and PISA 2012 represents change between 2010 and 2012 because these education systems implemented the PISA 2009 assessment in 2010 as part of PISA 2009.NOTE: Education systems are ordered by 2012 average score. The PISA science framework was revised in 2006. Because of changes in the framework, it is not possible to compare science learning outcomes from PISA 2000 and 2003 with those from PISA 2006, 2009, and 2012. Scores are reported on a scale from 0 to 1,000. All average scores reported as higher or lower than the comparison year are different at the .05 significance level of statistical significance. Standard error is noted by s.e. Italics indicate non-OECD countries and education systems. SOURCE: Organization for Economic Cooperation and Development (OECD), Program for International Student Assessment (PISA), 2006, 2009, 2012.
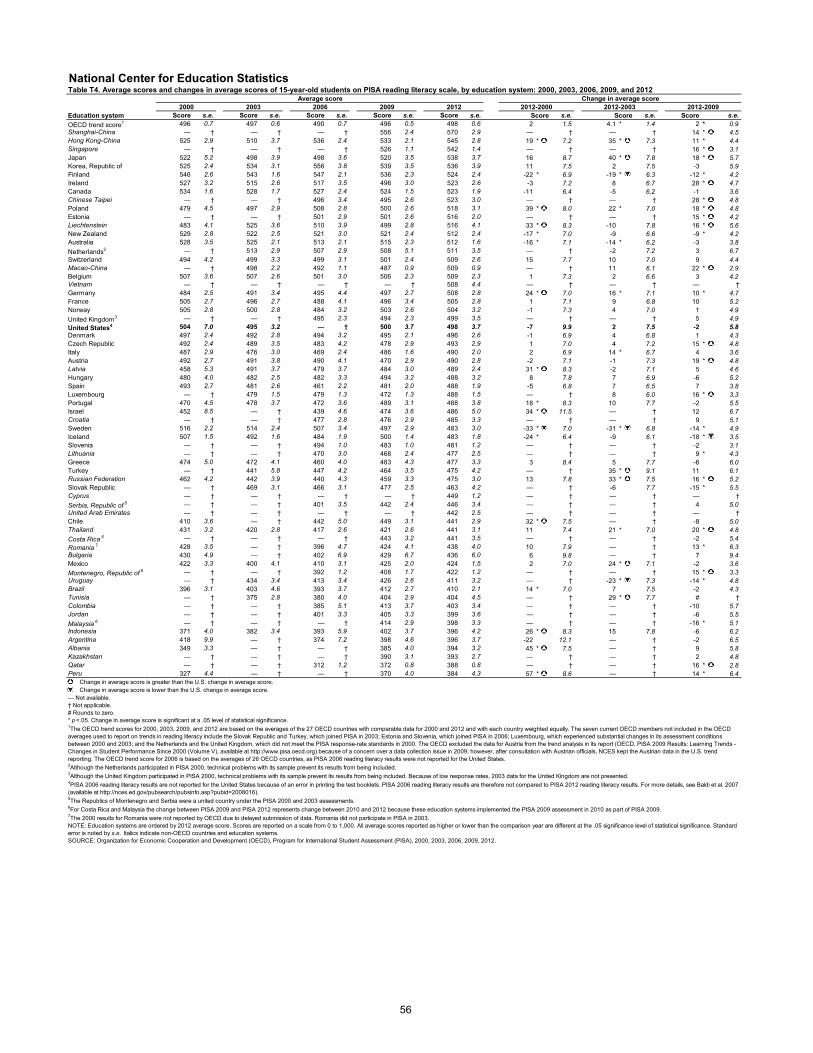
National Center for Education StatisticsTable T4. Average scores and changes in average scores of 15-year-old students on PISA reading literacy scale, by education system: 2000, 2003, 2006, 2009, and 2012
Education system
Average score Change in average score2000 2003 2006 2009 2012 2012-2000 2012-2003 2012-2009
Score s.e. Score s.e. Score s.e. Score s.e. Score s.e. Score s.e. Score s.e. Score s.e.OECD trend score1 496 0.7 497 0.6 490 0.7 496 0.5 498 0.6 2 1.5 4.1 * 1.4 2 * 0.9Shanghai-China — † — † — † 556 2.4 570 2.9 — † — † 14 * 4.5Hong Kong-China 525 2.9 510 3.7 536 2.4 533 2.1 545 2.8 19 * 7.2 35 * 7.3 11 * 4.4Singapore — † — † — † 526 1.1 542 1.4 — † — † 16 * 3.1Japan 522 5.2 498 3.9 498 3.6 520 3.5 538 3.7 16 8.7 40 * 7.8 18 * 5.7Korea, Republic of 525 2.4 534 3.1 556 3.8 539 3.5 536 3.9 11 7.5 2 7.5 -3 5.9Finland 546 2.6 543 1.6 547 2.1 536 2.3 524 2.4 -22 * 6.9 -19 * 6.3 -12 * 4.2Ireland 527 3.2 515 2.6 517 3.5 496 3.0 523 2.6 -3 7.2 8 6.7 28 * 4.7Canada 534 1.6 528 1.7 527 2.4 524 1.5 523 1.9 -11 6.4 -5 6.2 -1 3.6Chinese Taipei — † — † 496 3.4 495 2.6 523 3.0 — † — † 28 * 4.8Poland 479 4.5 497 2.9 508 2.8 500 2.6 518 3.1 39 * 8.0 22 * 7.0 18 * 4.8Estonia — † — † 501 2.9 501 2.6 516 2.0 — † — † 15 * 4.2Liechtenstein 483 4.1 525 3.6 510 3.9 499 2.8 516 4.1 33 * 8.3 -10 7.8 16 * 5.6New Zealand 529 2.8 522 2.5 521 3.0 521 2.4 512 2.4 -17 * 7.0 -9 6.6 -9 * 4.2Australia 528 3.5 525 2.1 513 2.1 515 2.3 512 1.6 -16 * 7.1 -14 * 6.2 -3 3.8Netherlands2 — † 513 2.9 507 2.9 508 5.1 511 3.5 — † -2 7.2 3 6.7Switzerland 494 4.2 499 3.3 499 3.1 501 2.4 509 2.6 15 7.7 10 7.0 9 4.4Macao-China — † 498 2.2 492 1.1 487 0.9 509 0.9 — † 11 6.1 22 * 2.9Belgium 507 3.6 507 2.6 501 3.0 506 2.3 509 2.3 1 7.3 2 6.6 3 4.2Vietnam — † — † — † — † 508 4.4 — † — † — †Germany 484 2.5 491 3.4 495 4.4 497 2.7 508 2.8 24 * 7.0 16 * 7.1 10 * 4.7France 505 2.7 496 2.7 488 4.1 496 3.4 505 2.8 1 7.1 9 6.8 10 5.2Norway 505 2.8 500 2.8 484 3.2 503 2.6 504 3.2 -1 7.3 4 7.0 1 4.9United Kingdom3 — † — † 495 2.3 494 2.3 499 3.5 — † — † 5 4.9United States4 504 7.0 495 3.2 — † 500 3.7 498 3.7 -7 9.9 2 7.5 -2 5.8Denmark 497 2.4 492 2.8 494 3.2 495 2.1 496 2.6 -1 6.9 4 6.8 1 4.3Czech Republic 492 2.4 489 3.5 483 4.2 478 2.9 493 2.9 1 7.0 4 7.2 15 * 4.8Italy 487 2.9 476 3.0 469 2.4 486 1.6 490 2.0 2 6.9 14 * 6.7 4 3.6Austria 492 2.7 491 3.8 490 4.1 470 2.9 490 2.8 -2 7.1 -1 7.3 19 * 4.8Latvia 458 5.3 491 3.7 479 3.7 484 3.0 489 2.4 31 * 8.3 -2 7.1 5 4.6Hungary 480 4.0 482 2.5 482 3.3 494 3.2 488 3.2 8 7.8 7 6.9 -6 5.2Spain 493 2.7 481 2.6 461 2.2 481 2.0 488 1.9 -5 6.8 7 6.5 7 3.8Luxembourg — † 479 1.5 479 1.3 472 1.3 488 1.5 — † 8 6.0 16 * 3.3Portugal 470 4.5 478 3.7 472 3.6 489 3.1 488 3.8 18 * 8.3 10 7.7 -2 5.5Israel 452 8.5 — † 439 4.6 474 3.6 486 5.0 34 * 11.5 — † 12 6.7Croatia — † — † 477 2.8 476 2.9 485 3.3 — † — † 9 5.1Sweden 516 2.2 514 2.4 507 3.4 497 2.9 483 3.0 -33 * 7.0 -31 * 6.8 -14 * 4.9Iceland 507 1.5 492 1.6 484 1.9 500 1.4 483 1.8 -24 * 6.4 -9 6.1 -18 * 3.5Slovenia — † — † 494 1.0 483 1.0 481 1.2 — † — † -2 3.1Lithuania — † — † 470 3.0 468 2.4 477 2.5 — † — † 9 * 4.3Greece 474 5.0 472 4.1 460 4.0 483 4.3 477 3.3 3 8.4 5 7.7 -6 6.0Turkey — † 441 5.8 447 4.2 464 3.5 475 4.2 — † 35 * 9.1 11 6.1Russian Federation 462 4.2 442 3.9 440 4.3 459 3.3 475 3.0 13 7.8 33 * 7.5 16 * 5.2Slovak Republic — † 469 3.1 466 3.1 477 2.5 463 4.2 — † -6 7.7 -15 * 5.5Cyprus — † — † — † — † 449 1.2 — † — † — †Serbia, Republic of 5 — † — † 401 3.5 442 2.4 446 3.4 — † — † 4 5.0United Arab Emirates — † — † — † — † 442 2.5 — † — † — †Chile 410 3.6 — † 442 5.0 449 3.1 441 2.9 32 * 7.5 — † -8 5.0Thailand 431 3.2 420 2.8 417 2.6 421 2.6 441 3.1 11 7.4 21 * 7.0 20 * 4.8Costa Rica 6 — † — † — † 443 3.2 441 3.5 — † — † -2 5.4Romania 7 428 3.5 — † 396 4.7 424 4.1 438 4.0 10 7.9 — † 13 * 6.3Bulgaria 430 4.9 — † 402 6.9 429 6.7 436 6.0 6 9.8 — † 7 9.4Mexico 422 3.3 400 4.1 410 3.1 425 2.0 424 1.5 2 7.0 24 * 7.1 -2 3.6Montenegro, Republic of 5 — † — † 392 1.2 408 1.7 422 1.2 — † — † 15 * 3.3Uruguay — † 434 3.4 413 3.4 426 2.6 411 3.2 — † -23 * 7.3 -14 * 4.8Brazil 396 3.1 403 4.6 393 3.7 412 2.7 410 2.1 14 * 7.0 7 7.5 -2 4.3Tunisia — † 375 2.8 380 4.0 404 2.9 404 4.5 — † 29 * 7.7 # †Colombia — † — † 385 5.1 413 3.7 403 3.4 — † — † -10 5.7Jordan — † — † 401 3.3 405 3.3 399 3.6 — † — † -6 5.5Malaysia 6 — † — † — † 414 2.9 398 3.3 — † — † -16 * 5.1Indonesia 371 4.0 382 3.4 393 5.9 402 3.7 396 4.2 26 * 8.3 15 7.8 -6 6.2Argentina 418 9.9 — † 374 7.2 398 4.6 396 3.7 -22 12.1 — † -2 6.5Albania 349 3.3 — † — † 385 4.0 394 3.2 45 * 7.5 — † 9 5.8Kazakhstan — † — † — † 390 3.1 393 2.7 — † — † 2 4.8Qatar — † — † 312 1.2 372 0.8 388 0.8 — † — † 16 * 2.8Peru 327 4.4 — † — † 370 4.0 384 4.3 57 * 8.6 — † 14 * 6.4
Change in average score is greater than the U.S. change in average score. Change in average score is lower than the U.S. change in average score.
— Not available.† Not applicable.# Rounds to zero.* p <.05. Change in average score is significant at a .05 level of statistical significance.1The OECD trend scores for 2000, 2003, 2009, and 2012 are based on the averages of the 27 OECD countries with comparable data for 2000 and 2012 and with each country weighted equally. The seven current OECD members not included in the OECD averages used to report on trends in reading literacy include the Slovak Republic and Turkey, which joined PISA in 2003; Estonia and Slovenia, which joined PISA in 2006; Luxembourg, which experienced substantial changes in its assessment conditions between 2000 and 2003; and the Netherlands and the United Kingdom, which did not meet the PISA response-rate standards in 2000. The OECD excluded the data for Austria from the trend analysis in its report (OECD, PISA 2009 Results: Learning Trends - Changes in Student Performance Since 2000 (Volume V), available at http://www.pisa.oecd.org) because of a concern over a data collection issue in 2009; however, after consultation with Austrian officials, NCES kept the Austrian data in the U.S. trend reporting. The OECD trend score for 2006 is based on the averages of 26 OECD countries, as PISA 2006 reading literacy results were not reported for the United States.2Although the Netherlands participated in PISA 2000, technical problems with its sample prevent its results from being included.3Although the United Kingdom participated in PISA 2000, technical problems with its sample prevent its results from being included. Because of low response rates, 2003 data for the United Kingdom are not presented.4PISA 2006 reading literacy results are not reported for the United States because of an error in printing the test booklets. PISA 2006 reading literacy results are therefore not compared to PISA 2012 reading literacy results. For more details, see Baldi et al. 2007 (available at http://nces.ed.gov/pubsearch/pubsinfo.asp?pubid=2008016).5The Republics of Montenegro and Serbia were a united country under the PISA 2000 and 2003 assessments.6For Costa Rica and Malaysia the change between PISA 2009 and PISA 2012 represents change between 2010 and 2012 because these education systems implemented the PISA 2009 assessment in 2010 as part of PISA 2009.7The 2000 results for Romania were not reported by OECD due to delayed submission of data. Romania did not participate in PISA in 2003.NOTE: Education systems are ordered by 2012 average score. Scores are reported on a scale from 0 to 1,000. All average scores reported as higher or lower than the comparison year are different at the .05 significance level of statistical significance. Standard error is noted by s.e. Italics indicate non-OECD countries and education systems. SOURCE: Organization for Economic Cooperation and Development (OECD), Program for International Student Assessment (PISA), 2000, 2003, 2006, 2009, 2012.
56
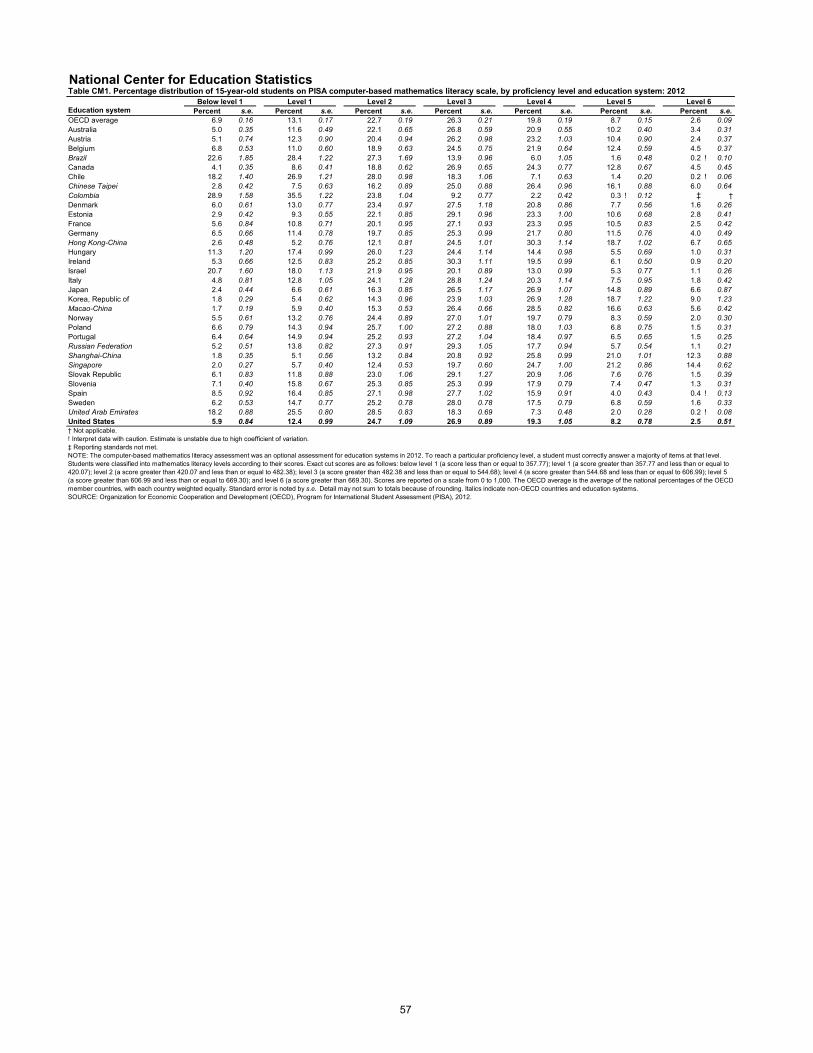
National Center for Education StatisticsTable CM1. Percentage distribution of 15-year-old students on PISA computer-based mathematics literacy scale, by proficiency level and education system: 2012
Education systemBelow level 1 Level 1 Level 2 Level 3 Level 4 Level 5 Level 6
Percent s.e. Percent s.e. Percent s.e. Percent s.e. Percent s.e. Percent s.e. Percent s.e.OECD average 6.9 0.16 13.1 0.17 22.7 0.19 26.3 0.21 19.8 0.19 8.7 0.15 2.6 0.09Australia 5.0 0.35 11.6 0.49 22.1 0.65 26.8 0.59 20.9 0.55 10.2 0.40 3.4 0.31Austria 5.1 0.74 12.3 0.90 20.4 0.94 26.2 0.98 23.2 1.03 10.4 0.90 2.4 0.37Belgium 6.8 0.53 11.0 0.60 18.9 0.63 24.5 0.75 21.9 0.64 12.4 0.59 4.5 0.37Brazil 22.6 1.85 28.4 1.22 27.3 1.69 13.9 0.96 6.0 1.05 1.6 0.48 0.2 ! 0.10Canada 4.1 0.35 8.6 0.41 18.8 0.62 26.9 0.65 24.3 0.77 12.8 0.67 4.5 0.45Chile 18.2 1.40 26.9 1.21 28.0 0.98 18.3 1.06 7.1 0.63 1.4 0.20 0.2 ! 0.06Chinese Taipei 2.8 0.42 7.5 0.63 16.2 0.89 25.0 0.88 26.4 0.96 16.1 0.88 6.0 0.64Colombia 28.9 1.58 35.5 1.22 23.8 1.04 9.2 0.77 2.2 0.42 0.3 ! 0.12 ‡ †Denmark 6.0 0.61 13.0 0.77 23.4 0.97 27.5 1.18 20.8 0.86 7.7 0.56 1.6 0.26Estonia 2.9 0.42 9.3 0.55 22.1 0.85 29.1 0.96 23.3 1.00 10.6 0.68 2.8 0.41France 5.6 0.84 10.8 0.71 20.1 0.95 27.1 0.93 23.3 0.95 10.5 0.83 2.5 0.42Germany 6.5 0.66 11.4 0.78 19.7 0.85 25.3 0.99 21.7 0.80 11.5 0.76 4.0 0.49Hong Kong-China 2.6 0.48 5.2 0.76 12.1 0.81 24.5 1.01 30.3 1.14 18.7 1.02 6.7 0.65Hungary 11.3 1.20 17.4 0.99 26.0 1.23 24.4 1.14 14.4 0.98 5.5 0.69 1.0 0.31Ireland 5.3 0.66 12.5 0.83 25.2 0.85 30.3 1.11 19.5 0.99 6.1 0.50 0.9 0.20Israel 20.7 1.60 18.0 1.13 21.9 0.95 20.1 0.89 13.0 0.99 5.3 0.77 1.1 0.26Italy 4.8 0.81 12.8 1.05 24.1 1.28 28.8 1.24 20.3 1.14 7.5 0.95 1.8 0.42Japan 2.4 0.44 6.6 0.61 16.3 0.85 26.5 1.17 26.9 1.07 14.8 0.89 6.6 0.87Korea, Republic of 1.8 0.29 5.4 0.62 14.3 0.96 23.9 1.03 26.9 1.28 18.7 1.22 9.0 1.23Macao-China 1.7 0.19 5.9 0.40 15.3 0.53 26.4 0.66 28.5 0.82 16.6 0.63 5.6 0.42Norway 5.5 0.61 13.2 0.76 24.4 0.89 27.0 1.01 19.7 0.79 8.3 0.59 2.0 0.30Poland 6.6 0.79 14.3 0.94 25.7 1.00 27.2 0.88 18.0 1.03 6.8 0.75 1.5 0.31Portugal 6.4 0.64 14.9 0.94 25.2 0.93 27.2 1.04 18.4 0.97 6.5 0.65 1.5 0.25Russian Federation 5.2 0.51 13.8 0.82 27.3 0.91 29.3 1.05 17.7 0.94 5.7 0.54 1.1 0.21Shanghai-China 1.8 0.35 5.1 0.56 13.2 0.84 20.8 0.92 25.8 0.99 21.0 1.01 12.3 0.88Singapore 2.0 0.27 5.7 0.40 12.4 0.53 19.7 0.60 24.7 1.00 21.2 0.86 14.4 0.62Slovak Republic 6.1 0.83 11.8 0.88 23.0 1.06 29.1 1.27 20.9 1.06 7.6 0.76 1.5 0.39Slovenia 7.1 0.40 15.8 0.67 25.3 0.85 25.3 0.99 17.9 0.79 7.4 0.47 1.3 0.31Spain 8.5 0.92 16.4 0.85 27.1 0.98 27.7 1.02 15.9 0.91 4.0 0.43 0.4 ! 0.13Sweden 6.2 0.53 14.7 0.77 25.2 0.78 28.0 0.78 17.5 0.79 6.8 0.59 1.6 0.33United Arab Emirates 18.2 0.88 25.5 0.80 28.5 0.83 18.3 0.69 7.3 0.48 2.0 0.28 0.2 ! 0.08United States 5.9 0.84 12.4 0.99 24.7 1.09 26.9 0.89 19.3 1.05 8.2 0.78 2.5 0.51† Not applicable.! Interpret data with caution. Estimate is unstable due to high coefficient of variation.‡ Reporting standards not met.NOTE: The computer-based mathematics literacy assessment was an optional assessment for education systems in 2012. To reach a particular proficiency level, a student must correctly answer a majority of items at that level. Students were classified into mathematics literacy levels according to their scores. Exact cut scores are as follows: below level 1 (a score less than or equal to 357.77); level 1 (a score greater than 357.77 and less than or equal to 420.07); level 2 (a score greater than 420.07 and less than or equal to 482.38); level 3 (a score greater than 482.38 and less than or equal to 544.68); level 4 (a score greater than 544.68 and less than or equal to 606.99); level 5 (a score greater than 606.99 and less than or equal to 669.30); and level 6 (a score greater than 669.30). Scores are reported on a scale from 0 to 1,000. The OECD average is the average of the national percentages of the OECD member countries, with each country weighted equally. Standard error is noted by s.e. Detail may not sum to totals because of rounding. Italics indicate non-OECD countries and education systems. SOURCE: Organization for Economic Cooperation and Development (OECD), Program for International Student Assessment (PISA), 2012.
57
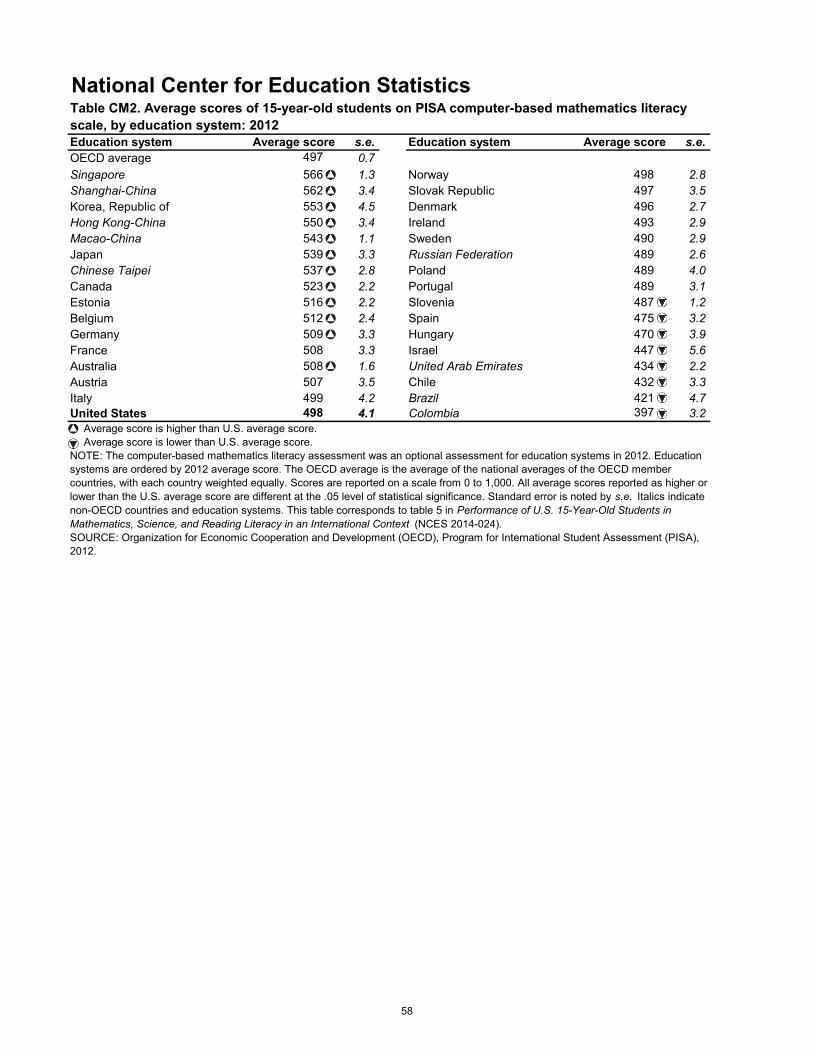
National Center for Education StatisticsTable CM2. Average scores of 15-year-old students on PISA computer-based mathematics literacy scale, by education system: 2012Education system Average score s.e.OECD average 497 0.7Singapore 566 1.3Shanghai-China 562 3.4Korea, Republic of 553 4.5Hong Kong-China 550 3.4Macao-China 543 1.1Japan 539 3.3Chinese Taipei 537 2.8Canada 523 2.2Estonia 516 2.2Belgium 512 2.4Germany 509 3.3France 508 3.3Australia 508 1.6Austria 507 3.5Italy 499 4.2United States 498 4.1
Education system Average score s.e.
Norway 498 2.8Slovak Republic 497 3.5Denmark 496 2.7Ireland 493 2.9Sweden 490 2.9Russian Federation 489 2.6Poland 489 4.0Portugal 489 3.1Slovenia 487 1.2Spain 475 3.2Hungary 470 3.9Israel 447 5.6United Arab Emirates 434 2.2Chile 432 3.3Brazil 421 4.7Colombia 397 3.2
Average score is higher than U.S. average score. Average score is lower than U.S. average score.NOTE: The computer-based mathematics literacy assessment was an optional assessment for education systems in 2012. Education systems are ordered by 2012 average score. The OECD average is the average of the national averages of the OECD member countries, with each country weighted equally. Scores are reported on a scale from 0 to 1,000. All average scores reported as higher or lower than the U.S. average score are different at the .05 level of statistical significance. Standard error is noted by s.e. Italics indicate non-OECD countries and education systems. This table corresponds to table 5 in Performance of U.S. 15-Year-Old Students in Mathematics, Science, and Reading Literacy in an International Context (NCES 2014-024).SOURCE: Organization for Economic Cooperation and Development (OECD), Program for International Student Assessment (PISA), 2012.
58

National Center for Education StatisticsFigure CM1a. Difference in average scores of 15-year-old female and male students on PISA computer-based mathematics literacy scale, by education system: 2012
NOTE: The computer-based mathematics literacy assessment was an optional assessment for education systems in 2012. Education systems are ordered by absolute male-female difference in 2012 average score. Differences were computed using unrounded numbers. Scores are reported on a scale from 0 to 1,000. Score differences as noted between males and females are significantly different at the .05 level of statistical significance. The OECD average is the average of the national averages of the OECD member countries, with each country weighted equally. Italics indicate non-OECD countries and education systems. SOURCE: Organization for Economic Cooperation and Development (OECD), Program for International Student Assessment (PISA), 2012.
59

National Center for Education StatisticsTable CM1b. Difference in average scores of 15-year-old female and male students on PISA computer-based mathematics literacy scale, by education system: 2012Education system Male-female difference s.e.OECD average 13 * 0.8United States # †Singapore 1 2.3Slovenia 3 3.0Israel 3 8.9Norway 3 2.8Estonia 9 * 2.5Australia 9 * 2.8Germany 10 * 2.7Poland 11 * 3.2Slovak Republic 11 * 3.9Hungary 12 * 3.8Colombia 12 * 3.3Spain 12 * 2.5United Arab Emirates -13 * 4.4Macao-China 13 * 2.0Sweden 13 * 2.8Russian Federation 14 * 2.8Belgium 14 * 3.1Japan 15 * 3.8France 15 * 3.0Chinese Taipei 15 * 6.7Hong Kong-China 17 * 4.3Canada 17 * 1.9Korea, Republic of 18 * 6.7Shanghai-China 18 * 2.9Italy 18 * 5.0Ireland 19 * 3.7Chile 19 * 3.9Denmark 20 * 2.5Portugal 20 * 2.3Austria 21 * 4.9Brazil 22 * 2.4† Not applicable.# Rounds to zero.* p <.05. Differences between males and females are significantly different at the .05 level of statistical significance. NOTE: The computer-based mathematics literacy assessment was an optional assessment for education systems in 2012. Education systems are ordered by absolute male-female difference in 2012 average score. Differences were computed using unrounded numbers. Scores are reported on a scale from 0 to 1,000. The OECD average is the average of the national averages of the OECD member countries, with each country weighted equally. Standard error is noted by s.e. Italics indicate non-OECD countries and education systems. SOURCE: Organization for Economic Cooperation and Development (OECD), Program for International Student Assessment (PISA), 2012.
60
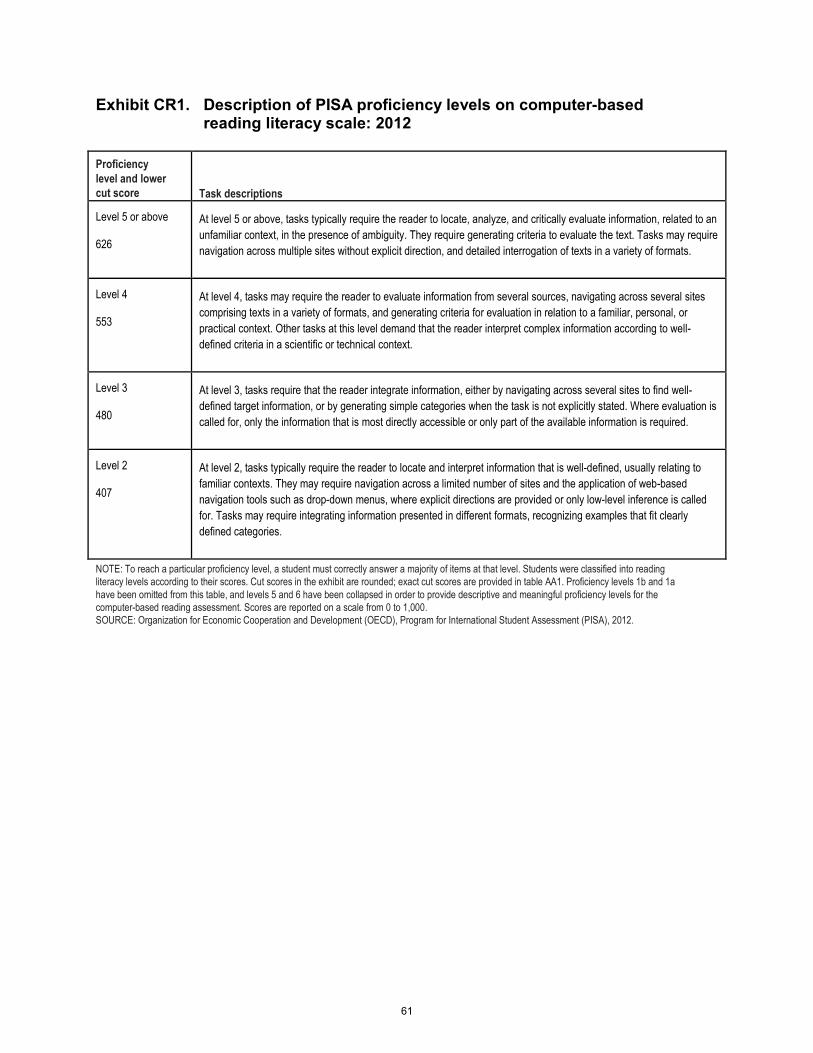
Exhibit CR1. Description of PISA proficiency levels on computer-based reading literacy scale: 2012
Proficiency level and lower cut score Task descriptions
Level 5 or above
626
At level 5 or above, tasks typically require the reader to locate, analyze, and critically evaluate information, related to an unfamiliar context, in the presence of ambiguity. They require generating criteria to evaluate the text. Tasks may require navigation across multiple sites without explicit direction, and detailed interrogation of texts in a variety of formats.
Level 4
553
At level 4, tasks may require the reader to evaluate information from several sources, navigating across several sites comprising texts in a variety of formats, and generating criteria for evaluation in relation to a familiar, personal, or practical context. Other tasks at this level demand that the reader interpret complex information according to well-defined criteria in a scientific or technical context.
Level 3
480
At level 3, tasks require that the reader integrate information, either by navigating across several sites to find well-defined target information, or by generating simple categories when the task is not explicitly stated. Where evaluation is called for, only the information that is most directly accessible or only part of the available information is required.
Level 2
407
At level 2, tasks typically require the reader to locate and interpret information that is well-defined, usually relating to familiar contexts. They may require navigation across a limited number of sites and the application of web-based navigation tools such as drop-down menus, where explicit directions are provided or only low-level inference is called for. Tasks may require integrating information presented in different formats, recognizing examples that fit clearly defined categories.
NOTE: To reach a particular proficiency level, a student must correctly answer a majority of items at that level. Students were classified into reading literacy levels according to their scores. Cut scores in the exhibit are rounded; exact cut scores are provided in table AA1. Proficiency levels 1b and 1a have been omitted from this table, and levels 5 and 6 have been collapsed in order to provide descriptive and meaningful proficiency levels for the computer-based reading assessment. Scores are reported on a scale from 0 to 1,000. SOURCE: Organization for Economic Cooperation and Development (OECD), Program for International Student Assessment (PISA), 2012.
61
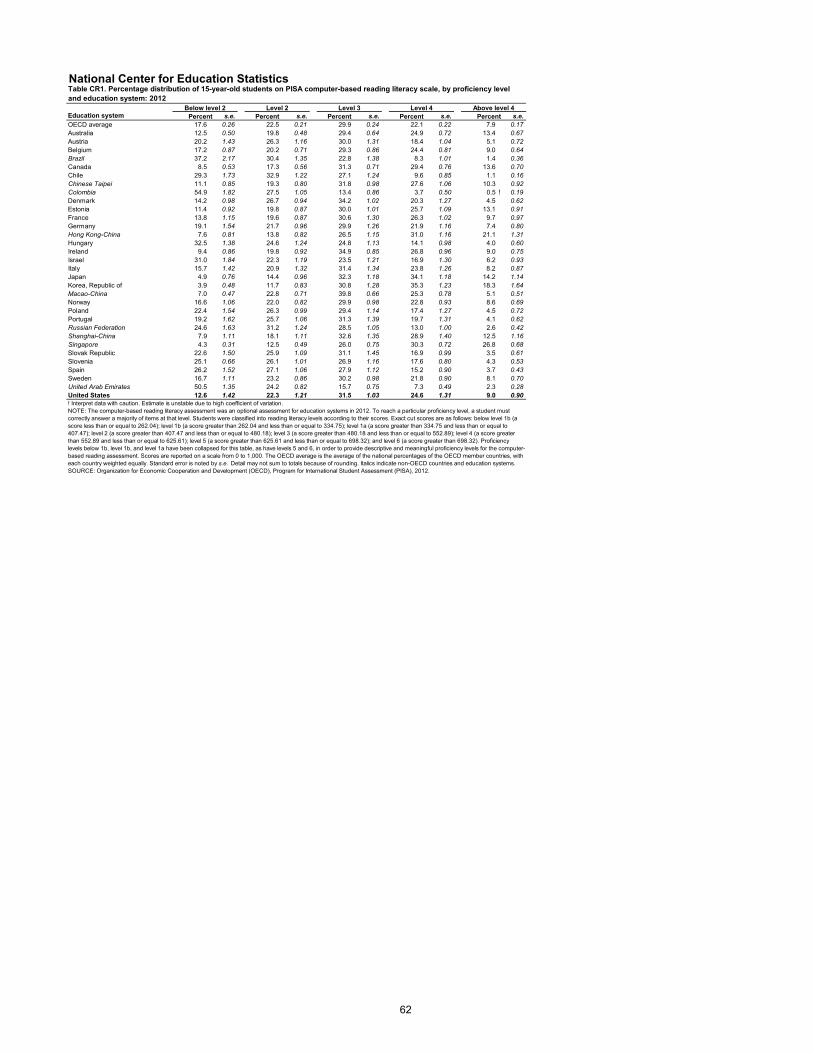
National Center for Education StatisticsTable CR1. Percentage distribution of 15-year-old students on PISA computer-based reading literacy scale, by proficiency level and education system: 2012
Education systemBelow level 2 Level 2 Level 3 Level 4 Above level 4
Percent s.e. Percent s.e. Percent s.e. Percent s.e. Percent s.e.OECD average 17.6 0.26 22.5 0.21 29.9 0.24 22.1 0.22 7.9 0.17Australia 12.5 0.50 19.8 0.48 29.4 0.64 24.9 0.72 13.4 0.67Austria 20.2 1.43 26.3 1.16 30.0 1.31 18.4 1.04 5.1 0.72Belgium 17.2 0.87 20.2 0.71 29.3 0.86 24.4 0.81 9.0 0.64Brazil 37.2 2.17 30.4 1.35 22.8 1.38 8.3 1.01 1.4 0.36Canada 8.5 0.53 17.3 0.56 31.3 0.71 29.4 0.76 13.6 0.70Chile 29.3 1.73 32.9 1.22 27.1 1.24 9.6 0.85 1.1 0.16Chinese Taipei 11.1 0.85 19.3 0.80 31.8 0.98 27.6 1.06 10.3 0.92Colombia 54.9 1.82 27.5 1.05 13.4 0.86 3.7 0.50 0.5 ! 0.19Denmark 14.2 0.98 26.7 0.94 34.2 1.02 20.3 1.27 4.5 0.62Estonia 11.4 0.92 19.8 0.87 30.0 1.01 25.7 1.09 13.1 0.91France 13.8 1.15 19.6 0.87 30.6 1.30 26.3 1.02 9.7 0.97Germany 19.1 1.54 21.7 0.96 29.9 1.26 21.9 1.16 7.4 0.80Hong Kong-China 7.6 0.81 13.8 0.82 26.5 1.15 31.0 1.16 21.1 1.31Hungary 32.5 1.38 24.6 1.24 24.8 1.13 14.1 0.98 4.0 0.60Ireland 9.4 0.86 19.8 0.92 34.9 0.85 26.8 0.96 9.0 0.75Israel 31.0 1.84 22.3 1.19 23.5 1.21 16.9 1.30 6.2 0.93Italy 15.7 1.42 20.9 1.32 31.4 1.34 23.8 1.26 8.2 0.87Japan 4.9 0.76 14.4 0.96 32.3 1.18 34.1 1.18 14.2 1.14Korea, Republic of 3.9 0.48 11.7 0.83 30.8 1.28 35.3 1.23 18.3 1.64Macao-China 7.0 0.47 22.8 0.71 39.8 0.66 25.3 0.78 5.1 0.51Norway 16.6 1.06 22.0 0.82 29.9 0.98 22.8 0.93 8.6 0.69Poland 22.4 1.54 26.3 0.99 29.4 1.14 17.4 1.27 4.5 0.72Portugal 19.2 1.62 25.7 1.06 31.3 1.39 19.7 1.31 4.1 0.62Russian Federation 24.6 1.63 31.2 1.24 28.5 1.05 13.0 1.00 2.6 0.42Shanghai-China 7.9 1.11 18.1 1.11 32.6 1.35 28.9 1.40 12.5 1.16Singapore 4.3 0.31 12.5 0.49 26.0 0.75 30.3 0.72 26.8 0.68Slovak Republic 22.6 1.50 25.9 1.09 31.1 1.45 16.9 0.99 3.5 0.61Slovenia 25.1 0.66 26.1 1.01 26.9 1.16 17.6 0.80 4.3 0.53Spain 26.2 1.52 27.1 1.06 27.9 1.12 15.2 0.90 3.7 0.43Sweden 16.7 1.11 23.2 0.86 30.2 0.98 21.8 0.90 8.1 0.70United Arab Emirates 50.5 1.35 24.2 0.82 15.7 0.75 7.3 0.49 2.3 0.28United States 12.6 1.42 22.3 1.21 31.5 1.03 24.6 1.31 9.0 0.90! Interpret data with caution. Estimate is unstable due to high coefficient of variation.NOTE: The computer-based reading literacy assessment was an optional assessment for education systems in 2012. To reach a particular proficiency level, a student must correctly answer a majority of items at that level. Students were classified into reading literacy levels according to their scores. Exact cut scores are as follows: below level 1b (a score less than or equal to 262.04); level 1b (a score greater than 262.04 and less than or equal to 334.75); level 1a (a score greater than 334.75 and less than or equal to 407.47); level 2 (a score greater than 407.47 and less than or equal to 480.18); level 3 (a score greater than 480.18 and less than or equal to 552.89); level 4 (a score greater than 552.89 and less than or equal to 625.61); level 5 (a score greater than 625.61 and less than or equal to 698.32); and level 6 (a score greater than 698.32). Proficiency levels below 1b, level 1b, and level 1a have been collapsed for this table, as have levels 5 and 6, in order to provide descriptive and meaningful proficiency levels for the computer-based reading assessment. Scores are reported on a scale from 0 to 1,000. The OECD average is the average of the national percentages of the OECD member countries, with each country weighted equally. Standard error is noted by s.e. Detail may not sum to totals because of rounding. Italics indicate non-OECD countries and education systems. SOURCE: Organization for Economic Cooperation and Development (OECD), Program for International Student Assessment (PISA), 2012.
62
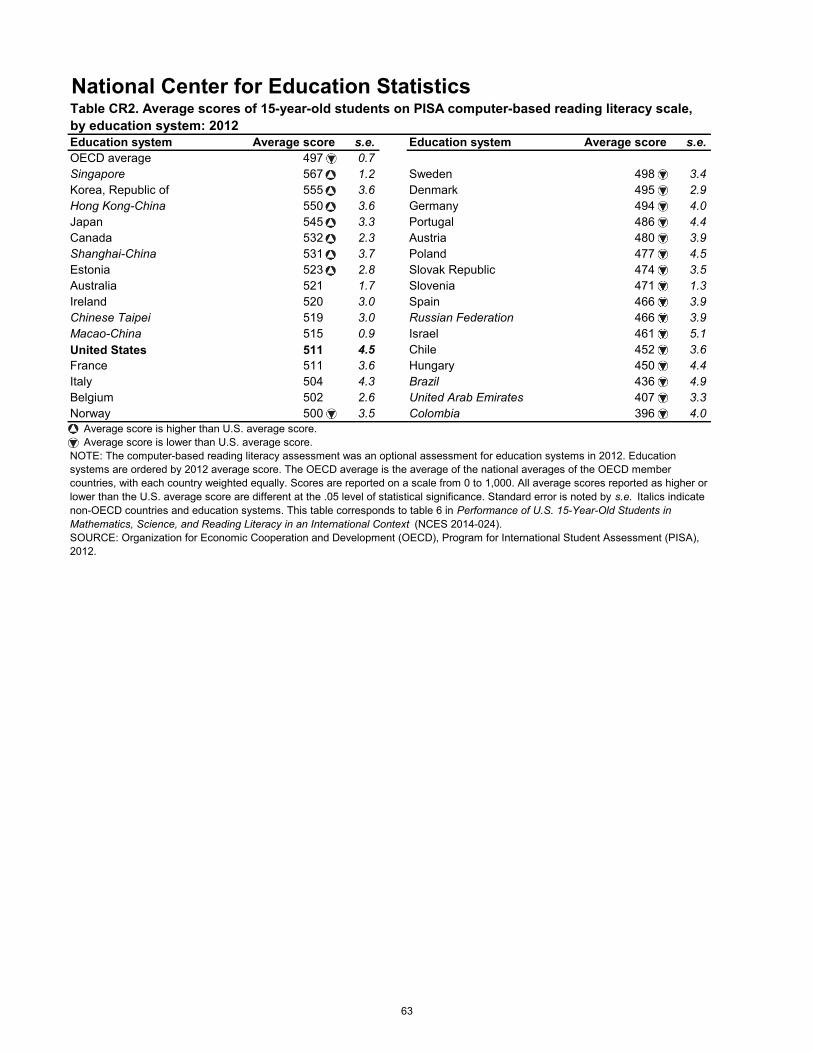
National Center for Education StatisticsTable CR2. Average scores of 15-year-old students on PISA computer-based reading literacy scale, by education system: 2012Education system Average score s.e.OECD average 497 0.7Singapore 567 1.2Korea, Republic of 555 3.6Hong Kong-China 550 3.6Japan 545 3.3Canada 532 2.3Shanghai-China 531 3.7Estonia 523 2.8Australia 521 1.7Ireland 520 3.0Chinese Taipei 519 3.0Macao-China 515 0.9United States 511 4.5France 511 3.6Italy 504 4.3Belgium 502 2.6Norway 500 3.5
Education system Average score s.e.
Sweden 498 3.4Denmark 495 2.9Germany 494 4.0Portugal 486 4.4Austria 480 3.9Poland 477 4.5Slovak Republic 474 3.5Slovenia 471 1.3Spain 466 3.9Russian Federation 466 3.9Israel 461 5.1Chile 452 3.6Hungary 450 4.4Brazil 436 4.9United Arab Emirates 407 3.3Colombia 396 4.0
Average score is higher than U.S. average score. Average score is lower than U.S. average score.NOTE: The computer-based reading literacy assessment was an optional assessment for education systems in 2012. Education systems are ordered by 2012 average score. The OECD average is the average of the national averages of the OECD member countries, with each country weighted equally. Scores are reported on a scale from 0 to 1,000. All average scores reported as higher or lower than the U.S. average score are different at the .05 level of statistical significance. Standard error is noted by s.e. Italics indicate non-OECD countries and education systems. This table corresponds to table 6 in Performance of U.S. 15-Year-Old Students in Mathematics, Science, and Reading Literacy in an International Context (NCES 2014-024).SOURCE: Organization for Economic Cooperation and Development (OECD), Program for International Student Assessment (PISA), 2012.
63

National Center for Education StatisticsFigure CR1a. Difference in average scores of 15-year-old female and male students on PISA computer-based reading literacy scale, by education system: 2012
NOTE: The computer-based reading literacy assessment was an optional assessment for education systems in 2012. Education systems are ordered by female-male difference in 2012 average score. Differences were computed using unrounded numbers. Scores are reported on a scale from 0 to 1,000. Score differences as noted between males and females are significantly different at the .05 level of statistical significance. The OECD average is the average of the national averages of the OECD member countries, with each country weighted equally. Italics indicate non-OECD countries and education systems.SOURCE: Organization for Economic Cooperation and Development (OECD), Program for International Student Assessment (PISA), 2012.
64

National Center for Education StatisticsTable CR1b. Difference in average scores of 15-year-old female and male students on PISA computer-based reading literacy scale, by education system: 2012Education system Female-male difference s.e.OECD average 26 * 0.8Colombia 4 4.3Korea, Republic of 7 5.1Chile 9 * 4.4Shanghai-China 10 * 2.8Japan 16 * 3.8Chinese Taipei 17 * 5.3Portugal 17 * 3.0Singapore 18 * 2.2Russian Federation 18 * 3.0Macao-China 18 * 1.7Slovak Republic 19 * 4.3Hong Kong-China 19 * 5.0Brazil 19 * 3.2Canada 21 * 1.8Italy 21 * 6.0France 22 * 3.6Denmark 23 * 2.4Ireland 25 * 4.3Belgium 25 * 4.0Austria 27 * 6.1Spain 27 * 3.1Israel 27 * 6.4United States 28 * 2.6Germany 30 * 3.0Australia 31 * 2.9Hungary 33 * 4.9Sweden 33 * 3.3Poland 34 * 3.4Estonia 37 * 2.8Slovenia 39 * 2.7Norway 46 * 3.1United Arab Emirates 50 * 6.5* p <.05. Differences between males and females are significantly different at the .05 level of statistical significance. NOTE: The computer-based reading literacy assessment was an optional assessment for education systems in 2012. Education systems are ordered by female-male difference in 2012 average score. Differences were computed using unrounded numbers. Scores are reported on a scale from 0 to 1,000. The OECD average is the average of the national averages of the OECD member countries, with each country weighted equally. Standard error is noted by s.e. Italics indicate non-OECD countries and education systems.SOURCE: Organization for Economic Cooperation and Development (OECD), Program for International Student Assessment (PISA), 2012.
65

National Center for Education StatisticsTable A1. Average scores of 15-year-old students on PISA mathematics literacy scale in Connecticut public schools compared with other participating education systems: 2012
Education systems higher than ConnecticutShanghai-China Japan Singapore Liechtenstein Hong Kong-China Switzerland Chinese Taipei Netherlands Korea, Republic of Estonia Macao-China Finland
Education systems not measurably different from ConnecticutCanada Ireland Poland Slovenia Belgium Denmark Germany New Zealand Massachusetts Czech Republic Vietnam France Austria OECD average Australia United Kingdom
Education systems lower than ConnecticutIceland Cyprus Latvia Bulgaria Luxembourg United Arab Emirates Norway Kazakhstan Portugal Thailand Italy Chile Spain Malaysia Russian Federation Mexico Slovak Republic Montenegro, Republic of United States Uruguay Lithuania Costa Rica Sweden Albania Hungary Brazil Croatia Argentina Florida Tunisia Israel Jordan Greece Colombia Serbia, Republic of Qatar Turkey Indonesia Romania Peru NOTE: All average scores reported as higher or lower than the Connecticut average score are different at the .05 level of statistical significance. The OECD average is the average of the national averages of the OECD member countries, with each country weighted equally. Italics indicate non-OECD countries and education systems. SOURCE: Organization for Economic Cooperation and Development (OECD), Program for International Student Assessment (PISA), 2012.
66

National Center for Education StatisticsTable A2. Average scores of 15-year-old students on PISA mathematics literacy scale in Connecticut public schools, by various subgroups: 2012Reporting groups Average score s.e.
Connecticut average 506 *** 6.2U.S. average 481 ** 3.6OECD average 494 *** 0.5
SexFemale 499 *** 6.3Male 513 * 6.9
Race/ethnicityWhite 534 * 5.5Black 421 * 7.3Hispanic 442 * 8.3Asian 534 * 11.8Multiracial 496 11.8
Percentage of students in enrolled schools eligible for free or reduced-price lunchLess than 10 percent 567 * 7.010 to 24.9 percent 526 * 6.725 to 49.9 percent 491 5.150 to 74.9 percent 440 * 15.075 percent or more 427 * 13.9
* p <.05. Significantly different from both the U.S. and OECD averages at the .05 level of statistical significance.** p <.05. Significantly different from the OECD average at the .05 level of statistical significance.*** p <.05. Significantly different from the U.S. average at the .05 level of statistical significance.NOTE: The OECD average is the average of the national averages of the OECD member countries, with each country weighted equally. Reporting standards were not met for American Indian/Alaska Native and Native Hawaiian/Other Pacific Islander. Black includes African American, and Hispanic includes Latino. Students who identified themselves as being of Hispanic origin were classified as Hispanic, regardless of their race. Although data for some race/ethnicities were not shown separately because the reporting standards were not met, they are included in the U.S. and state totals. Data on free or reduced-price lunch are based on principals' responses to a question in the school questionnaire that asked the approximate percentage of eligible students in the school during the previous school year. Standard error is noted by s.e. SOURCE: Organization for Economic Cooperation and Development (OECD), Program for International Student Assessment (PISA), 2012.
67
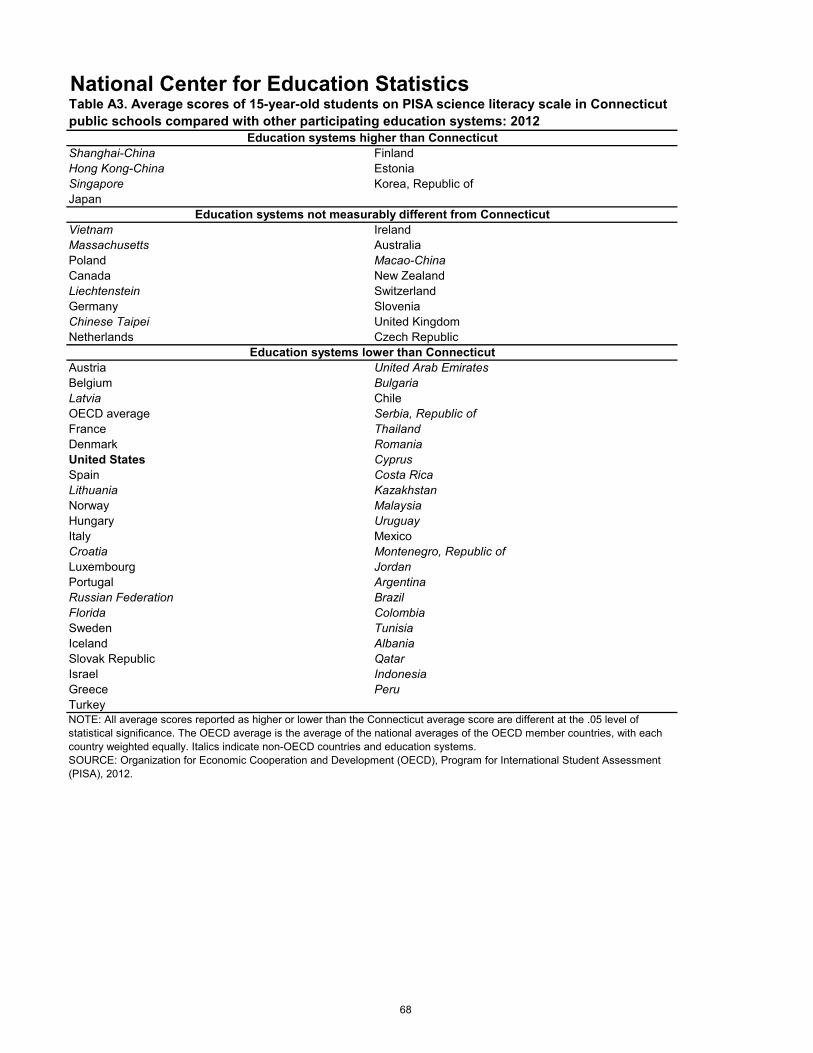
National Center for Education StatisticsTable A3. Average scores of 15-year-old students on PISA science literacy scale in Connecticut public schools compared with other participating education systems: 2012
Education systems higher than ConnecticutShanghai-China Finland Hong Kong-China Estonia Singapore Korea, Republic of Japan
Education systems not measurably different from ConnecticutVietnam Ireland Massachusetts Australia Poland Macao-China Canada New Zealand Liechtenstein Switzerland Germany Slovenia Chinese Taipei United Kingdom Netherlands Czech Republic
Education systems lower than ConnecticutAustria United Arab Emirates Belgium Bulgaria Latvia Chile OECD average Serbia, Republic of France Thailand Denmark Romania United States Cyprus Spain Costa Rica Lithuania Kazakhstan Norway Malaysia Hungary Uruguay Italy Mexico Croatia Montenegro, Republic of Luxembourg Jordan Portugal Argentina Russian Federation Brazil Florida Colombia Sweden Tunisia Iceland Albania Slovak Republic Qatar Israel Indonesia Greece Peru Turkey NOTE: All average scores reported as higher or lower than the Connecticut average score are different at the .05 level of statistical significance. The OECD average is the average of the national averages of the OECD member countries, with each country weighted equally. Italics indicate non-OECD countries and education systems.SOURCE: Organization for Economic Cooperation and Development (OECD), Program for International Student Assessment (PISA), 2012.
68

National Center for Education StatisticsTable A4. Average scores of 15-year-old students on PISA science literacy scale in Connecticut public schools, by various subgroups: 2012Reporting groups Average score s.e.
Connecticut average 521 * 5.7U.S. average 497 3.8OECD average 501 0.5
SexFemale 514 * 6.1Male 528 * 6.2
Race/ethnicityWhite 547 * 4.5Black 433 * 9.5Hispanic 463 * 9.3Asian 553 * 11.6Multiracial 520 10.8
Percentage of students in enrolled schools eligible for free or reduced-price lunchLess than 10 percent 575 * 8.310 to 24.9 percent 539 * 7.125 to 49.9 percent 511 6.050 to 74.9 percent 465 ** 16.775 percent or more 435 * 9.6
* p <.05. Significantly different from both the U.S. and OECD averages at the .05 level of statistical significance.** p <.05. Significantly different from the OECD average at the .05 level of statistical significance.NOTE: The OECD average is the average of the national averages of the OECD member countries, with each country weighted equally. Reporting standards were not met for American Indian/Alaska Native and Native Hawaiian/Other Pacific Islander. Black includes African American, and Hispanic includes Latino. Students who identified themselves as being of Hispanic origin were classified as Hispanic, regardless of their race. Although data for some race/ethnicities were not shown separately because the reporting standards were not met, they are included in the U.S. and state totals. Data on free or reduced-price lunch are based on principals' responses to a question in the school questionnaire that asked the approximate percentage of eligible students in the school during the previous school year. Standard error is noted by s.e. SOURCE: Organization for Economic Cooperation and Development (OECD), Program for International Student Assessment (PISA), 2012.
69
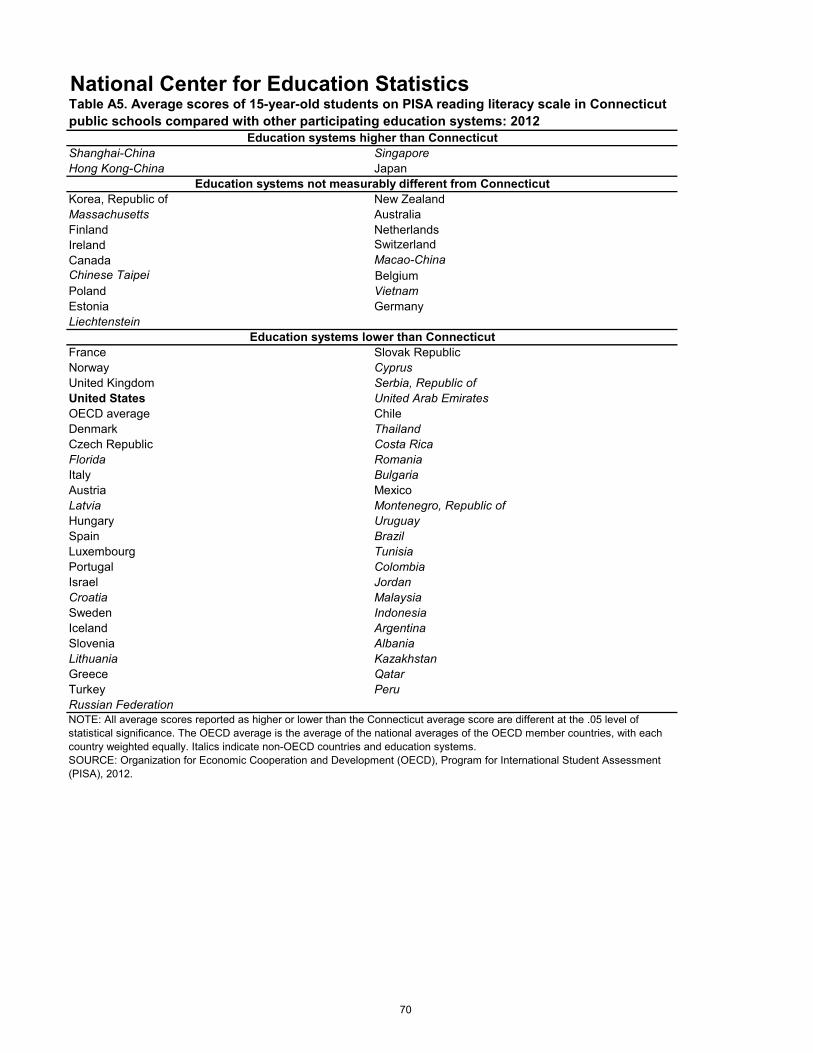
National Center for Education StatisticsTable A5. Average scores of 15-year-old students on PISA reading literacy scale in Connecticut public schools compared with other participating education systems: 2012
Education systems higher than ConnecticutShanghai-China Singapore Hong Kong-China Japan
Education systems not measurably different from ConnecticutKorea, Republic of New Zealand Massachusetts Australia Finland Netherlands Ireland Switzerland Canada Macao-China Chinese Taipei Belgium Poland Vietnam Estonia Germany Liechtenstein
Education systems lower than ConnecticutFrance Slovak Republic Norway Cyprus United Kingdom Serbia, Republic of United States United Arab Emirates OECD average Chile Denmark Thailand Czech Republic Costa Rica Florida Romania Italy Bulgaria Austria Mexico Latvia Montenegro, Republic of Hungary Uruguay Spain Brazil Luxembourg Tunisia Portugal Colombia Israel Jordan Croatia Malaysia Sweden Indonesia Iceland Argentina Slovenia Albania Lithuania Kazakhstan Greece Qatar Turkey Peru Russian Federation NOTE: All average scores reported as higher or lower than the Connecticut average score are different at the .05 level of statistical significance. The OECD average is the average of the national averages of the OECD member countries, with each country weighted equally. Italics indicate non-OECD countries and education systems.SOURCE: Organization for Economic Cooperation and Development (OECD), Program for International Student Assessment (PISA), 2012.
70

National Center for Education StatisticsTable A6. Average scores of 15-year-old students on PISA reading literacy scale in Connecticut public schools, by various subgroups: 2012Reporting groups Average score s.e.
Connecticut average 521 * 6.5U.S. average 498 3.7OECD average 496 0.5
SexFemale 532 * 6.7Male 510 7.1
Race/ethnicityWhite 546 * 5.5Black 447 * 10.2Hispanic 463 * 9.8Asian 558 * 12.9Multiracial 521 ** 11.9
Percentage of students in enrolled schools eligible for free or reduced-price lunchLess than 10 percent 578 * 9.710 to 24.9 percent 542 * 7.125 to 49.9 percent 508 6.150 to 74.9 percent 459 * 13.775 percent or more 443 * 12.1
* p <.05. Significantly different from both the U.S. and OECD averages at the .05 level of statistical significance.** p <.05. Significantly different from the OECD average at the .05 level of statistical significance.NOTE: The OECD average is the average of the national averages of the OECD member countries, with each country weighted equally. Reporting standards were not met for American Indian/Alaska Native and Native Hawaiian/Other Pacific Islander. Black includes African American, and Hispanic includes Latino. Students who identified themselves as being of Hispanic origin were classified as Hispanic, regardless of their race. Although data for some race/ethnicities were not shown separately because the reporting standards were not met, they are included in the U.S. and state totals. Data on free or reduced-price lunch are based on principals' responses to a question in the school questionnaire that asked the approximate percentage of eligible students in the school during the previous school year. Standard error is noted by s.e. SOURCE: Organization for Economic Cooperation and Development (OECD), Program for International Student Assessment (PISA), 2012.
71
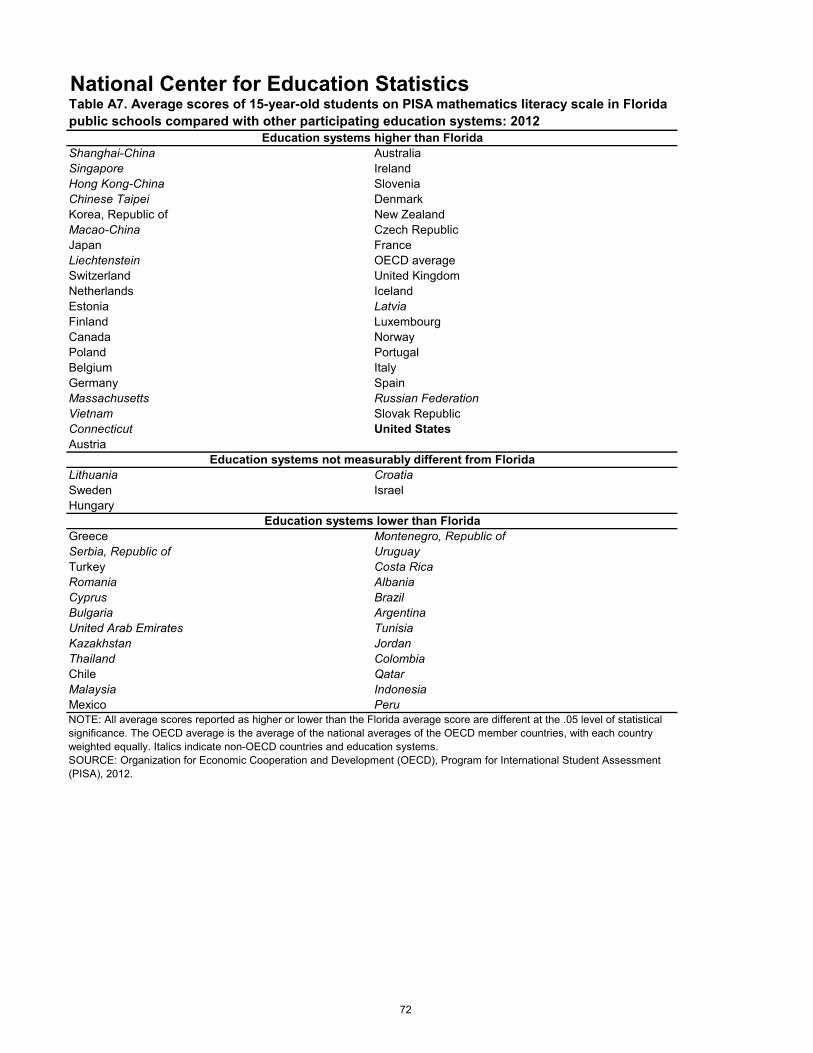
National Center for Education StatisticsTable A7. Average scores of 15-year-old students on PISA mathematics literacy scale in Florida public schools compared with other participating education systems: 2012
Education systems higher than FloridaShanghai-China Australia Singapore Ireland Hong Kong-China Slovenia Chinese Taipei Denmark Korea, Republic of New Zealand Macao-China Czech Republic Japan France Liechtenstein OECD average Switzerland United Kingdom Netherlands Iceland Estonia Latvia Finland Luxembourg Canada Norway Poland Portugal Belgium Italy Germany Spain Massachusetts Russian Federation Vietnam Slovak Republic Connecticut United States Austria
Education systems not measurably different from FloridaLithuania Croatia Sweden Israel Hungary
Education systems lower than FloridaGreece Montenegro, Republic of Serbia, Republic of Uruguay Turkey Costa Rica Romania Albania Cyprus Brazil Bulgaria Argentina United Arab Emirates Tunisia Kazakhstan Jordan Thailand Colombia Chile Qatar Malaysia Indonesia Mexico Peru NOTE: All average scores reported as higher or lower than the Florida average score are different at the .05 level of statistical significance. The OECD average is the average of the national averages of the OECD member countries, with each country weighted equally. Italics indicate non-OECD countries and education systems.SOURCE: Organization for Economic Cooperation and Development (OECD), Program for International Student Assessment (PISA), 2012.
72

National Center for Education StatisticsTable A8. Average scores of 15-year-old students on PISA mathematics literacy scale in Florida public schools, by various subgroups: 2012Reporting groups Average score s.e.
Florida average 467 * 5.8U.S. average 481 ** 3.6OECD average 494 *** 0.5
SexFemale 460 * 6.0Male 474 ** 6.3
Race/ethnicityWhite 499 *** 5.7Black 413 * 5.7Hispanic 458 * 5.7Asian ‡ †Multiracial 467 ** 6.4
Percentage of students in enrolled schools eligible for free or reduced-price lunchLess than 10 percent 548 * 23.910 to 24.9 percent 533 * 15.325 to 49.9 percent 481 ** 6.050 to 74.9 percent 453 * 4.975 percent or more 417 * 9.0
‡ Reporting standards not met.† Not applicable.* p <.05. Significantly different from both the U.S. and OECD averages at the .05 level of statistical significance.** p <.05. Significantly different from the OECD average at the .05 level of statistical significance.*** p <.05. Significantly different from the U.S. average at the .05 level of statistical significance.NOTE: The OECD average is the average of the national averages of the OECD member countries, with each country weighted equally. Reporting standards were not met for American Indian/Alaska Native and Native Hawaiian/Other Pacific Islander. Black includes African American, and Hispanic includes Latino. Students who identified themselves as being of Hispanic origin were classified as Hispanic, regardless of their race. Although data for some race/ethnicities were not shown separately because the reporting standards were not met, they are included in the U.S. and state totals. Data on free or reduced-price lunch are based on principals' responses to a question in the school questionnaire that asked the approximate percentage of eligible students in the school during the previous school year. Standard error is noted by s.e. SOURCE: Organization for Economic Cooperation and Development (OECD), Program for International Student Assessment (PISA), 2012.
73

National Center for Education StatisticsTable A9. Average scores of 15-year-old students on PISA science literacy scale in Florida public schools compared with other participating education systems: 2012
Education systems higher than FloridaShanghai-China Ireland Hong Kong-China Australia Singapore Connecticut Japan Macao-China Finland New Zealand Estonia Switzerland Korea, Republic of Slovenia Vietnam United Kingdom Massachusetts Czech Republic Poland Austria Canada Belgium Liechtenstein Latvia Germany OECD average Chinese Taipei France Netherlands
Education systems not measurably different from FloridaDenmark Luxembourg United States Portugal Spain Russian Federation Lithuania Sweden Norway Iceland Hungary Slovak Republic Italy Israel Croatia
Education systems lower than FloridaGreece Uruguay Turkey Mexico United Arab Emirates Montenegro, Republic of Bulgaria Jordan Chile Argentina Serbia, Republic of Brazil Thailand Colombia Romania Tunisia Cyprus Albania Costa Rica Qatar Kazakhstan Indonesia Malaysia Peru NOTE: All average scores reported as higher or lower than the Florida average score are different at the .05 level of statistical significance. The OECD average is the average of the national averages of the OECD member countries, with each country weighted equally. Italics indicate non-OECD countries and education systems. SOURCE: Organization for Economic Cooperation and Development (OECD), Program for International Student Assessment (PISA), 2012.
74

National Center for Education StatisticsTable A10. Average scores of 15-year-old students on PISA science literacy scale in Florida public schools, by various subgroups: 2012Reporting groups Average score s.e.
Florida average 485 ** 6.4U.S. average 497 3.8OECD average 501 0.5
SexFemale 478 * 6.2Male 491 7.4
Race/ethnicityWhite 520 * 6.6Black 425 * 5.9Hispanic 475 * 6.3Asian ‡ †Multiracial 500 8.5
Percentage of students in enrolled schools eligible for free or reduced-price lunchLess than 10 percent 573 * 15.010 to 24.9 percent 545 * 19.125 to 49.9 percent 499 7.650 to 74.9 percent 474 * 5.275 percent or more 429 * 8.2
‡ Reporting standards not met.† Not applicable.* p <.05. Significantly different from both the U.S. and OECD averages at the .05 level of statistical significance.** p <.05. Significantly different from the OECD average at the .05 level of statistical significance.NOTE: The OECD average is the average of the national averages of the OECD member countries, with each country weighted equally. Reporting standards were not met for American Indian/Alaska Native and Native Hawaiian/Other Pacific Islander. Black includes African American, and Hispanic includes Latino. Students who identified themselves as being of Hispanic origin were classified as Hispanic, regardless of their race. Although data for some race/ethnicities were not shown separately because the reporting standards were not met, they are included in the U.S. and state totals. Data on free or reduced-price lunch are based on principals' responses to a question in the school questionnaire that asked the approximate percentage of eligible students in the school during the previous school year. Standard error is noted by s.e. SOURCE: Organization for Economic Cooperation and Development (OECD), Program for International Student Assessment (PISA), 2012.
75

National Center for Education StatisticsTable A11. Average scores of 15-year-old students on PISA reading literacy scale in Florida public schools compared with other participating education systems: 2012
Education systems higher than FloridaShanghai-China Estonia Hong Kong-China Liechtenstein Singapore New Zealand Japan Australia Korea, Republic of Netherlands Massachusetts Switzerland Finland Macao-China Ireland Belgium Canada Vietnam Chinese Taipei Germany Connecticut France Poland
Education systems not measurably different from FloridaNorway Hungary United Kingdom Spain United States Luxembourg OECD average Portugal Denmark Israel Czech Republic Croatia Italy Sweden Austria Iceland Latvia Slovenia
Education systems lower than FloridaLithuania Montenegro, Republic of Greece Uruguay Turkey Brazil Russian Federation Tunisia Slovak Republic Colombia Cyprus Jordan Serbia, Republic of Malaysia United Arab Emirates Indonesia Chile Argentina Thailand Albania Costa Rica Kazakhstan Romania Qatar Bulgaria Peru Mexico NOTE: All average scores reported as higher or lower than the Florida average score are different at the .05 level of statistical significance. The OECD average is the average of the national averages of the OECD member countries, with each country weighted equally. Italics indicate non-OECD countries and education systems. SOURCE: Organization for Economic Cooperation and Development (OECD), Program for International Student Assessment (PISA), 2012.
76

National Center for Education StatisticsTable A12. Average scores of 15-year-old students on PISA reading literacy scale in Florida public schools, by various subgroups: 2012Reporting groups Average score s.e.
Florida average 492 6.1U.S. average 498 3.7OECD average 496 0.5
SexFemale 503 5.9Male 481 * 7.0
Race/ethnicityWhite 518 * 6.7Black 449 * 6.7Hispanic 489 7.2Asian ‡ †Multiracial 492 8.1
Percentage of students in enrolled schools eligible for free or reduced-price lunchLess than 10 percent 568 * 17.610 to 24.9 percent 555 * 25.625 to 49.9 percent 500 7.750 to 74.9 percent 484 * 5.475 percent or more 449 * 8.5
‡ Reporting standards not met.† Not applicable.* p <.05. Significantly different from both the U.S. and OECD averages at the .05 level of statistical significance.NOTE: The OECD average is the average of the national averages of the OECD member countries, with each country weighted equally. Reporting standards were not met for American Indian/Alaska Native and Native Hawaiian/Other Pacific Islander. Black includes African American, and Hispanic includes Latino. Students who identified themselves as being of Hispanic origin were classified as Hispanic, regardless of their race. Although data for some race/ethnicities were not shown separately because the reporting standards were not met, they are included in the U.S. and state totals. Data on free or reduced-price lunch are based on principals' responses to a question in the school questionnaire that asked the approximate percentage of eligible students in the school during the previous school year. Standard error is noted by s.e. SOURCE: Organization for Economic Cooperation and Development (OECD), Program for International Student Assessment (PISA), 2012.
77

National Center for Education StatisticsTable A13. Average scores of 15-year-old students on PISA mathematics literacy scale in Massachusetts public schools compared with other participating education systems: 2012
Education systems higher than MassachusettsShanghai-China Macao-China Singapore Japan Hong Kong-China Liechtenstein Chinese Taipei Switzerland Korea, Republic of
Education systems not measurably different from MassachusettsNetherlands Vietnam Estonia Connecticut Finland Austria Canada Australia Poland Ireland Belgium Slovenia Germany
Education systems lower than MassachusettsDenmark Serbia, Republic of New Zealand Turkey Czech Republic Romania France Cyprus OECD average Bulgaria United Kingdom United Arab Emirates Iceland Kazakhstan Latvia Thailand Luxembourg Chile Norway Malaysia Portugal Mexico Italy Montenegro, Republic of Spain Uruguay Russian Federation Costa Rica Slovak Republic Albania United States Brazil Lithuania Argentina Sweden Tunisia Hungary Jordan Croatia Colombia Florida Qatar Israel Indonesia Greece Peru NOTE: All average scores reported as higher or lower than the Massachusetts average score are different at the .05 level of statistical significance. The OECD average is the average of the national averages of the OECD member countries, with each country weighted equally. Italics indicate non-OECD countries and education systems. SOURCE: Organization for Economic Cooperation and Development (OECD), Program for International Student Assessment (PISA), 2012.
78
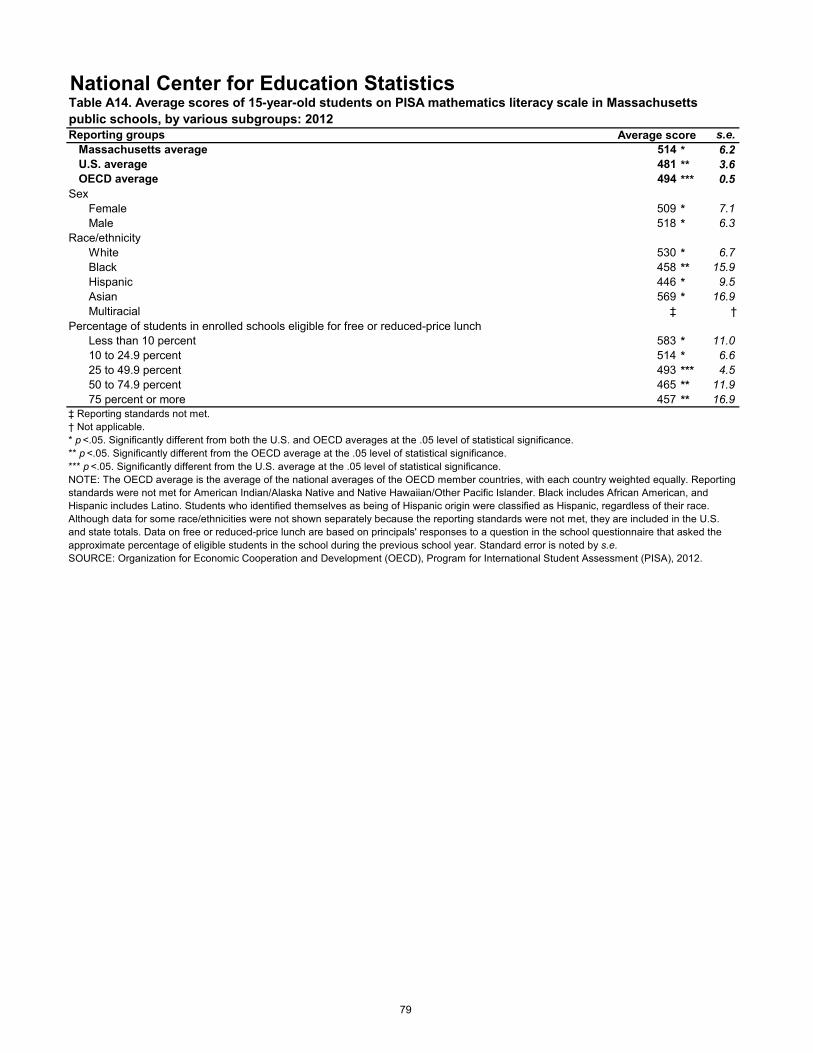
National Center for Education StatisticsTable A14. Average scores of 15-year-old students on PISA mathematics literacy scale in Massachusetts public schools, by various subgroups: 2012Reporting groups Average score s.e.
Massachusetts average 514 * 6.2U.S. average 481 ** 3.6OECD average 494 *** 0.5
SexFemale 509 * 7.1Male 518 * 6.3
Race/ethnicityWhite 530 * 6.7Black 458 ** 15.9Hispanic 446 * 9.5Asian 569 * 16.9Multiracial ‡ †
Percentage of students in enrolled schools eligible for free or reduced-price lunchLess than 10 percent 583 * 11.010 to 24.9 percent 514 * 6.625 to 49.9 percent 493 *** 4.550 to 74.9 percent 465 ** 11.975 percent or more 457 ** 16.9
‡ Reporting standards not met.† Not applicable.* p <.05. Significantly different from both the U.S. and OECD averages at the .05 level of statistical significance.** p <.05. Significantly different from the OECD average at the .05 level of statistical significance.*** p <.05. Significantly different from the U.S. average at the .05 level of statistical significance.NOTE: The OECD average is the average of the national averages of the OECD member countries, with each country weighted equally. Reporting standards were not met for American Indian/Alaska Native and Native Hawaiian/Other Pacific Islander. Black includes African American, and Hispanic includes Latino. Students who identified themselves as being of Hispanic origin were classified as Hispanic, regardless of their race. Although data for some race/ethnicities were not shown separately because the reporting standards were not met, they are included in the U.S. and state totals. Data on free or reduced-price lunch are based on principals' responses to a question in the school questionnaire that asked the approximate percentage of eligible students in the school during the previous school year. Standard error is noted by s.e. SOURCE: Organization for Economic Cooperation and Development (OECD), Program for International Student Assessment (PISA), 2012.
79

National Center for Education StatisticsTable A15. Average scores of 15-year-old students on PISA science literacy scale in Massachusetts public schools compared with other participating education systems: 2012
Education systems higher than MassachusettsShanghai-China Japan Hong Kong-China Finland Singapore Estonia
Education systems not measurably different from MassachusettsKorea, Republic of Ireland Vietnam Australia Poland Connecticut Canada Macao-China Liechtenstein New Zealand Germany Switzerland Chinese Taipei United Kingdom Netherlands
Education systems lower than MassachusettsSlovenia Turkey Czech Republic United Arab Emirates Austria Bulgaria Belgium Chile Latvia Serbia, Republic of OECD average Thailand France Romania Denmark Cyprus United States Costa Rica Spain Kazakhstan Lithuania Malaysia Norway Uruguay Hungary Mexico Italy Montenegro, Republic of Croatia Jordan Luxembourg Argentina Portugal Brazil Russian Federation Colombia Florida Tunisia Sweden Albania Iceland Qatar Slovak Republic Indonesia Israel Peru Greece NOTE: All average scores reported as higher or lower than the Massachusetts average score are different at the .05 level of statistical significance. The OECD average is the average of the national averages of the OECD member countries, with each country weighted equally. Italics indicate non-OECD countries and education systems. SOURCE: Organization for Economic Cooperation and Development (OECD), Program for International Student Assessment (PISA), 2012.
80
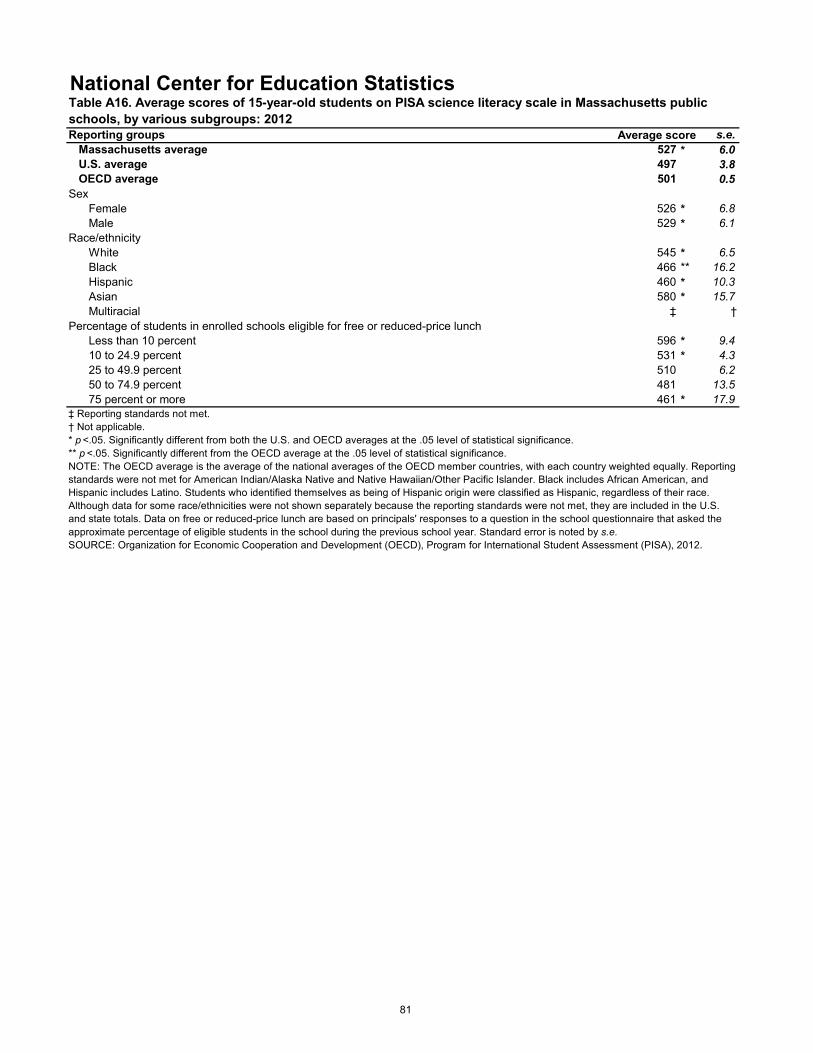
National Center for Education StatisticsTable A16. Average scores of 15-year-old students on PISA science literacy scale in Massachusetts public schools, by various subgroups: 2012Reporting groups Average score s.e.
Massachusetts average 527 * 6.0U.S. average 497 3.8OECD average 501 0.5
SexFemale 526 * 6.8Male 529 * 6.1
Race/ethnicityWhite 545 * 6.5Black 466 ** 16.2Hispanic 460 * 10.3Asian 580 * 15.7Multiracial ‡ †
Percentage of students in enrolled schools eligible for free or reduced-price lunchLess than 10 percent 596 * 9.410 to 24.9 percent 531 * 4.325 to 49.9 percent 510 6.250 to 74.9 percent 481 13.575 percent or more 461 * 17.9
‡ Reporting standards not met.† Not applicable.* p <.05. Significantly different from both the U.S. and OECD averages at the .05 level of statistical significance.** p <.05. Significantly different from the OECD average at the .05 level of statistical significance.NOTE: The OECD average is the average of the national averages of the OECD member countries, with each country weighted equally. Reporting standards were not met for American Indian/Alaska Native and Native Hawaiian/Other Pacific Islander. Black includes African American, and Hispanic includes Latino. Students who identified themselves as being of Hispanic origin were classified as Hispanic, regardless of their race. Although data for some race/ethnicities were not shown separately because the reporting standards were not met, they are included in the U.S. and state totals. Data on free or reduced-price lunch are based on principals' responses to a question in the school questionnaire that asked the approximate percentage of eligible students in the school during the previous school year. Standard error is noted by s.e. SOURCE: Organization for Economic Cooperation and Development (OECD), Program for International Student Assessment (PISA), 2012.
81
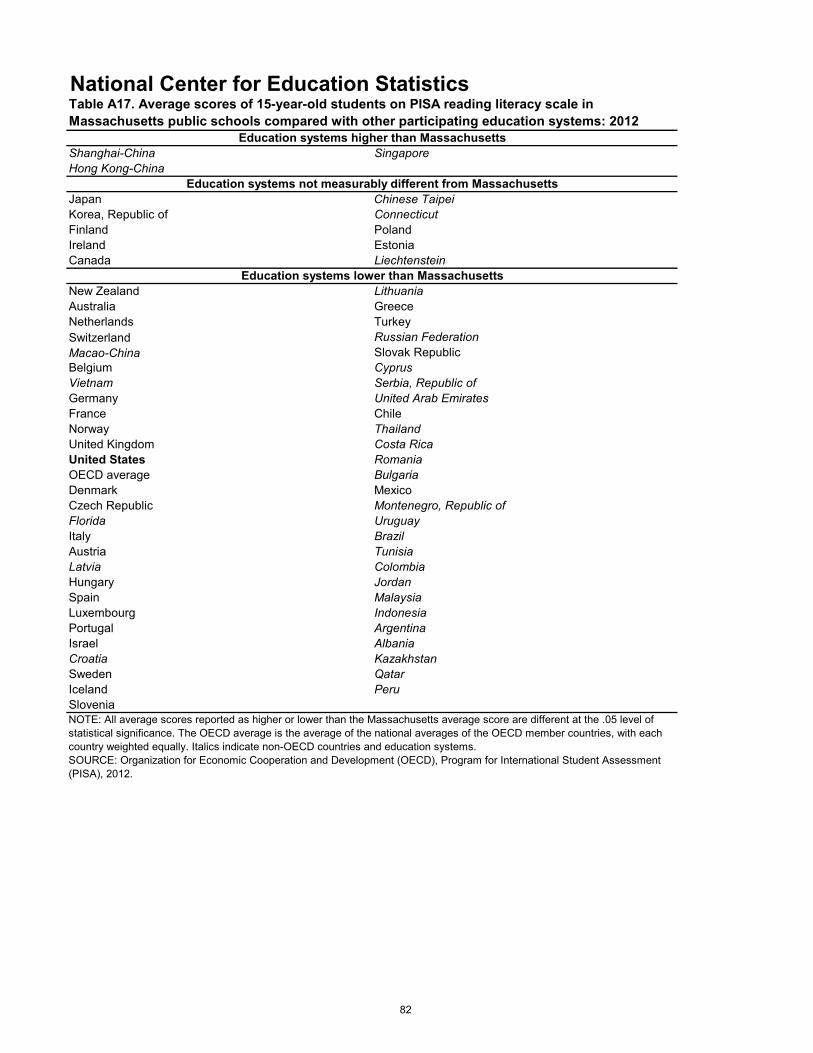
National Center for Education StatisticsTable A17. Average scores of 15-year-old students on PISA reading literacy scale in Massachusetts public schools compared with other participating education systems: 2012
Education systems higher than MassachusettsShanghai-China Singapore Hong Kong-China
Education systems not measurably different from MassachusettsJapan Chinese Taipei Korea, Republic of Connecticut Finland Poland Ireland Estonia Canada Liechtenstein
Education systems lower than MassachusettsNew Zealand Lithuania Australia Greece Netherlands Turkey Switzerland Russian Federation Macao-China Slovak Republic Belgium Cyprus Vietnam Serbia, Republic of Germany United Arab Emirates France Chile Norway Thailand United Kingdom Costa Rica United States Romania OECD average Bulgaria Denmark Mexico Czech Republic Montenegro, Republic of Florida Uruguay Italy Brazil Austria Tunisia Latvia Colombia Hungary Jordan Spain Malaysia Luxembourg Indonesia Portugal Argentina Israel Albania Croatia Kazakhstan Sweden Qatar Iceland Peru Slovenia NOTE: All average scores reported as higher or lower than the Massachusetts average score are different at the .05 level of statistical significance. The OECD average is the average of the national averages of the OECD member countries, with each country weighted equally. Italics indicate non-OECD countries and education systems. SOURCE: Organization for Economic Cooperation and Development (OECD), Program for International Student Assessment (PISA), 2012.
82

National Center for Education StatisticsTable A18. Average scores of 15-year-old students on PISA reading literacy scale in Massachusetts public schools, by various subgroups: 2012Reporting groups Average score s.e.
Massachusetts average 527 * 6.1U.S. average 498 3.7OECD average 496 0.5
SexFemale 542 * 6.6Male 511 ** 6.2
Race/ethnicityWhite 540 * 6.8Black 476 16.7Hispanic 475 12.1Asian 584 * 13.5Multiracial ‡ †
Percentage of students in enrolled schools eligible for free or reduced-price lunchLess than 10 percent 590 * 8.810 to 24.9 percent 527 * 7.725 to 49.9 percent 507 6.750 to 74.9 percent 488 11.375 percent or more 477 19.0
‡ Reporting standards not met.† Not applicable.* p <.05. Significantly different from both the U.S. and OECD averages at the .05 level of statistical significance.** p <.05. Significantly different from the OECD average at the .05 level of statistical significance.NOTE: The OECD average is the average of the national averages of the OECD member countries, with each country weighted equally. Reporting standards were not met for American Indian/Alaska Native and Native Hawaiian/Other Pacific Islander. Black includes African American, and Hispanic includes Latino. Students who identified themselves as being of Hispanic origin were classified as Hispanic, regardless of their race. Although data for some race/ethnicities were not shown separately because the reporting standards were not met, they are included in the U.S. and state totals. Data on free or reduced-price lunch are based on principals' responses to a question in the school questionnaire that asked the approximate percentage of eligible students in the school during the previous school year. Standard error is noted by s.e. SOURCE: Organization for Economic Cooperation and Development (OECD), Program for International Student Assessment (PISA), 2012.
83
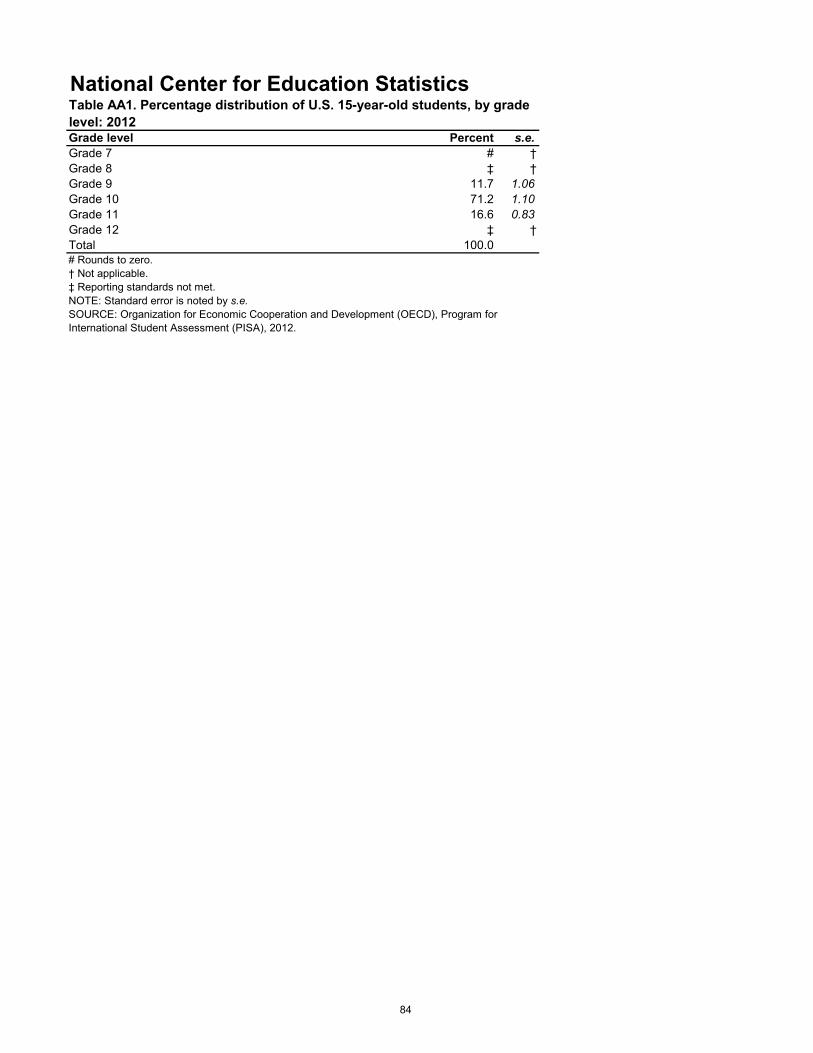
National Center for Education StatisticsTable AA1. Percentage distribution of U.S. 15-year-old students, by grade level: 2012Grade level Percent s.e.Grade 7 # †Grade 8 ‡ †Grade 9 11.7 1.06Grade 10 71.2 1.10Grade 11 16.6 0.83Grade 12 ‡ †Total 100.0# Rounds to zero.† Not applicable.‡ Reporting standards not met.NOTE: Standard error is noted by s.e. SOURCE: Organization for Economic Cooperation and Development (OECD), Program for International Student Assessment (PISA), 2012.
84
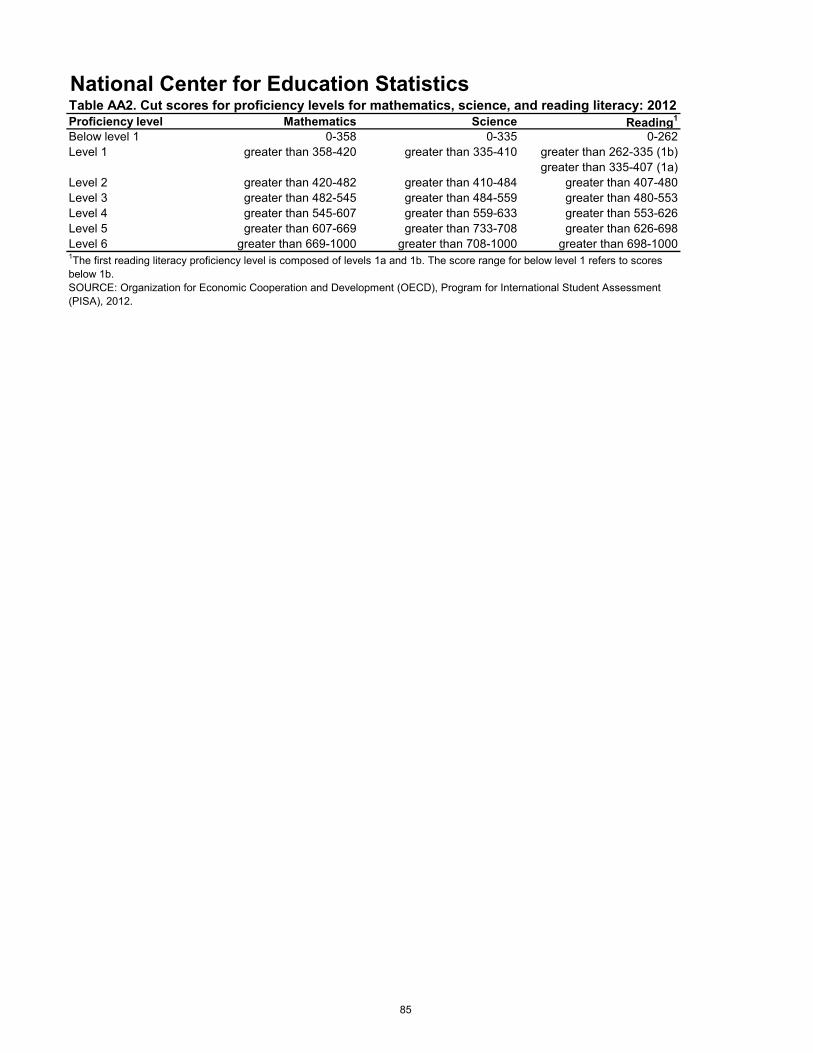
National Center for Education StatisticsTable AA2. Cut scores for proficiency levels for mathematics, science, and reading literacy: 2012 Proficiency level Mathematics Science Reading1
Below level 1 0-358 0-335 0-262Level 1 greater than 358-420 greater than 335-410 greater than 262-335 (1b)
greater than 335-407 (1a)Level 2 greater than 420-482 greater than 410-484 greater than 407-480Level 3 greater than 482-545 greater than 484-559 greater than 480-553Level 4 greater than 545-607 greater than 559-633 greater than 553-626Level 5 greater than 607-669 greater than 733-708 greater than 626-698Level 6 greater than 669-1000 greater than 708-1000 greater than 698-10001The first reading literacy proficiency level is composed of levels 1a and 1b. The score range for below level 1 refers to scores below 1b.SOURCE: Organization for Economic Cooperation and Development (OECD), Program for International Student Assessment (PISA), 2012.
85
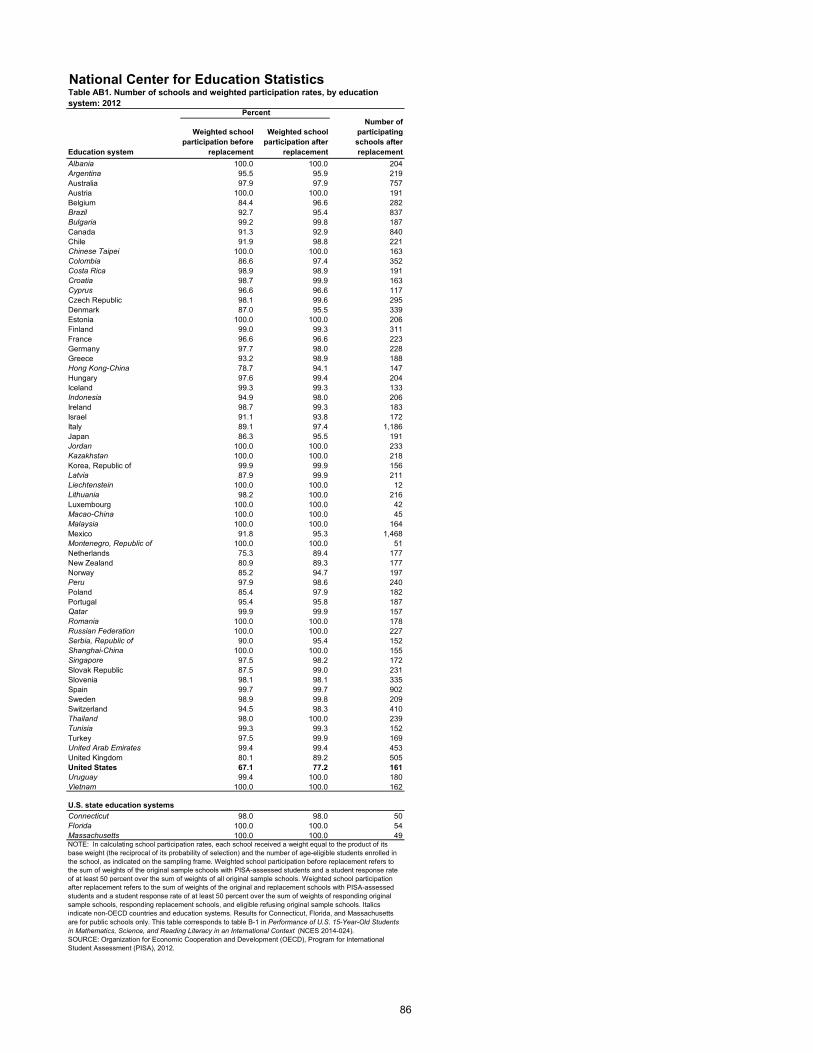
National Center for Education StatisticsTable AB1. Number of schools and weighted participation rates, by education system: 2012
Education system
Percent Number of
participating schools after replacement
Weighted school participation before
replacement
Weighted school participation after
replacementAlbania 100.0 100.0 204Argentina 95.5 95.9 219Australia 97.9 97.9 757Austria 100.0 100.0 191Belgium 84.4 96.6 282Brazil 92.7 95.4 837Bulgaria 99.2 99.8 187Canada 91.3 92.9 840Chile 91.9 98.8 221Chinese Taipei 100.0 100.0 163Colombia 86.6 97.4 352Costa Rica 98.9 98.9 191Croatia 98.7 99.9 163Cyprus 96.6 96.6 117Czech Republic 98.1 99.6 295Denmark 87.0 95.5 339Estonia 100.0 100.0 206Finland 99.0 99.3 311France 96.6 96.6 223Germany 97.7 98.0 228Greece 93.2 98.9 188Hong Kong-China 78.7 94.1 147Hungary 97.6 99.4 204Iceland 99.3 99.3 133Indonesia 94.9 98.0 206Ireland 98.7 99.3 183Israel 91.1 93.8 172Italy 89.1 97.4 1,186Japan 86.3 95.5 191Jordan 100.0 100.0 233Kazakhstan 100.0 100.0 218Korea, Republic of 99.9 99.9 156Latvia 87.9 99.9 211Liechtenstein 100.0 100.0 12Lithuania 98.2 100.0 216Luxembourg 100.0 100.0 42Macao-China 100.0 100.0 45Malaysia 100.0 100.0 164Mexico 91.8 95.3 1,468Montenegro, Republic of 100.0 100.0 51Netherlands 75.3 89.4 177New Zealand 80.9 89.3 177Norway 85.2 94.7 197Peru 97.9 98.6 240Poland 85.4 97.9 182Portugal 95.4 95.8 187Qatar 99.9 99.9 157Romania 100.0 100.0 178Russian Federation 100.0 100.0 227Serbia, Republic of 90.0 95.4 152Shanghai-China 100.0 100.0 155Singapore 97.5 98.2 172Slovak Republic 87.5 99.0 231Slovenia 98.1 98.1 335Spain 99.7 99.7 902Sweden 98.9 99.8 209Switzerland 94.5 98.3 410Thailand 98.0 100.0 239Tunisia 99.3 99.3 152Turkey 97.5 99.9 169United Arab Emirates 99.4 99.4 453United Kingdom 80.1 89.2 505United States 67.1 77.2 161Uruguay 99.4 100.0 180Vietnam 100.0 100.0 162
U.S. state education systemsConnecticut 98.0 98.0 50Florida 100.0 100.0 54Massachusetts 100.0 100.0 49NOTE: In calculating school participation rates, each school received a weight equal to the product of its base weight (the reciprocal of its probability of selection) and the number of age-eligible students enrolled in the school, as indicated on the sampling frame. Weighted school participation before replacement refers to the sum of weights of the original sample schools with PISA-assessed students and a student response rate of at least 50 percent over the sum of weights of all original sample schools. Weighted school participation after replacement refers to the sum of weights of the original and replacement schools with PISA-assessed students and a student response rate of at least 50 percent over the sum of weights of responding original sample schools, responding replacement schools, and eligible refusing original sample schools. Italics indicate non-OECD countries and education systems. Results for Connecticut, Florida, and Massachusetts are for public schools only. This table corresponds to table B-1 in Performance of U.S. 15-Year-Old Students in Mathematics, Science, and Reading Literacy in an International Context (NCES 2014-024).SOURCE: Organization for Economic Cooperation and Development (OECD), Program for International Student Assessment (PISA), 2012.
86

National Center for Education StatisticsTable AB2. Coverage of target population, student exclusion and weighted participation rates, and number of students, by education system: 2012
Education system
Total population of 15-year-olds
(number)
Percent Number of
participating students
Coverage of 15-year-old
population
Coverage of national desired
population
Overall student exclusion rate
Weighted student participation after
replacementAlbania 76,910 55.2 99.9 0.1 92.5 4,743Argentina 684,879 79.7 99.3 0.7 88.0 5,908Australia 291,967 85.9 96.0 4.0 86.8 17,774Austria 93,537 87.9 98.7 1.3 91.7 4,756Belgium 123,469 95.5 98.6 1.4 90.9 9,690Brazil 3,574,928 69.1 98.6 1.4 90.1 20,091Bulgaria 70,188 77.3 97.4 2.6 95.7 5,282Canada 417,873 83.3 93.6 6.4 80.8 21,548Chile 274,803 83.4 98.7 1.3 94.6 6,857Chinese Taipei 328,356 89.1 98.8 1.2 96.3 6,046Colombia 889,729 63.0 99.9 0.1 93.1 11,173Costa Rica 81,489 49.6 100.0 0.0 89.0 4,602Croatia 48,155 94.5 97.8 2.2 92.2 6,153Cyprus 9,956 96.9 96.7 3.3 93.3 5,078Czech Republic 96,946 84.7 98.2 1.8 90.1 6,535Denmark 72,310 90.8 93.8 6.2 89.1 7,481Estonia 12,649 92.0 94.2 5.8 92.9 5,867Finland 62,523 96.0 98.1 1.9 90.7 8,829France 792,983 88.5 95.6 4.4 89.5 5,682Germany 798,136 94.8 98.5 1.5 93.2 5,001Greece 110,521 87.4 96.4 3.6 96.7 5,125Hong Kong-China 84,200 83.9 98.2 1.8 93.1 4,670Hungary 111,761 81.6 97.4 2.6 92.7 4,810Iceland 4,505 92.5 96.2 3.8 84.7 3,508Indonesia 4,174,217 63.4 99.7 0.3 95.2 5,622Ireland 59,296 91.1 95.5 4.5 84.1 5,016Israel 118,953 90.6 95.9 4.1 90.0 6,061Italy 605,490 86.1 96.7 3.3 92.8 38,142Japan 1,241,786 90.9 97.9 2.1 96.1 6,351Jordan 129,492 85.8 99.6 0.4 95.0 7,038Kazakhstan 258,716 80.6 96.6 3.4 98.9 5,808Korea, Republic of 687,104 87.9 99.2 0.8 98.7 5,033Latvia 18,789 85.4 96.0 4.0 90.9 5,276Liechtenstein 417 75.3 95.8 4.2 93.3 293Lithuania 38,524 85.8 96.0 4.0 92.1 4,618Luxembourg 6,187 89.3 87.2 8.4 95.2 5,260Macao-China 6,600 81.3 99.8 0.2 99.4 5,335Malaysia 544,302 79.4 99.8 0.2 94.0 5,197Mexico 2,114,745 62.7 99.3 0.7 93.9 33,806Montenegro, Republic of 8,600 89.7 99.7 0.3 93.8 4,744Netherlands 194,000 101.2 95.6 4.4 85.0 4,460New Zealand 60,940 87.6 95.4 4.6 84.7 5,248Norway 64,917 91.6 93.9 6.1 90.9 4,686Peru 584,294 71.9 99.8 0.2 96.0 6,035Poland 425,597 89.1 95.4 4.6 87.6 5,662Portugal 108,728 88.3 98.4 1.6 87.4 5,722Qatar 11,667 94.3 97.5 2.5 99.7 10,966Romania 146,243 96.4 96.5 3.5 97.8 5,074Russian Federation 1,272,632 92.1 97.6 2.4 97.3 6,418Serbia, Republic of 80,089 84.8 97.1 2.9 93.4 4,684Shanghai-China 108,056 78.8 98.5 1.5 98.5 6,374Singapore 53,637 95.2 98.8 1.2 94.3 5,546Slovak Republic 59,723 91.2 97.1 2.9 93.8 5,737Slovenia 19,471 94.0 98.4 1.6 90.5 7,229Spain 423,444 88.4 95.7 4.3 89.9 25,335Sweden 102,087 93.0 94.6 5.4 92.2 4,739Switzerland 87,200 91.4 95.8 4.2 92.0 11,234Thailand 982,080 71.6 98.7 1.3 98.9 6,606Tunisia 132,313 91.3 99.8 0.2 90.3 4,407Turkey 1,266,638 68.4 98.5 1.5 98.2 4,848United Arab Emirates 48,824 83.2 97.9 2.1 94.7 11,500United Kingdom 738,066 93.2 94.6 5.4 86.1 12,659United States 3,985,714 88.7 94.6 5.4 88.9 6,111Uruguay 54,638 72.8 99.7 0.3 90.0 5,315Vietnam 1,717,996 55.7 99.3 0.7 99.9 4,959
U.S. state education systemsConnecticut 48,970 75.7 95.9 4.1 87.5 1,697Florida 226,434 77.0 91.7 8.3 90.0 1,896Massachusetts 81,580 69.9 95.6 4.4 90.0 1,723NOTE: In calculating student participation rates, each student received a weight (student base weight) equal to the product of the school base weight—for the school in which the student was enrolled—and the reciprocal of the student selection probability within the school. Coverage of 15-year-old population refers to the extent to which the weighted participants covered the target population of all enrolled students in grades 7 and above. Coverage of national desired population refers to the extent to which the weighted participants covered the national population of 15-year-olds under the nonexcluded portion of the student sample. Overall student exclusion rate is the percentage of students excluded for intellectual or functional disabilities, or insufficient assessment language experience at either the school level or within schools. Weighted student participation after replacement refers to the sum of weights of students in original and replacement schools with PISA-assessed students and a student response rate of at least 50 percent over the sum of weights of students in responding original sample schools, responding replacement schools, and eligible refusing original sample schools. Italics indicate non-OECD countries and education systems. Results for Connecticut, Florida, and Massachusetts are for public school students only. This table is an expanded version of table B-2 in Performance of U.S. 15-Year-Old Students in Mathematics, Science, and Reading Literacy in an International Context (NCES 2014-024).SOURCE: Organization for Economic Cooperation and Development (OECD), Program for International Student Assessment (PISA), 2012.
87