pisa in focus 35: who are the school truants? - oecdeng... · in focus pisa in focus – / (anuary)...
TRANSCRIPT

1PISA in Focus – 2014/01 (January) © OECD 2014
Who are the school truants?
Teenagers will be teenagers; and in that uncertain territory between childhood and adulthood, rules will inevitably be broken. In many countries, this translates into student truancy. In others, however, 15-year-old students choose not to skip classes or days of school because they understand the importance of education, because their parents and teachers have nurtured their engagement with and at school, or because their school system ensures that truancy is not tolerated.
Students who took part in PISA 2012 were asked to report how many times they skipped classes or days of school without authorisation in the two weeks prior to the PISA assessment. Across OECD countries, 18% of students skipped at least one class and 15% skipped at least an entire day of school without authorisation in the two weeks before the PISA test. In Argentina, Italy, Jordan and Turkey, 40% of students or more skipped at least one day of school, while in Argentina, Costa Rica, Greece, Latvia, Romania and Turkey, 40% of students or more skipped at least one class. In Argentina, Greece, Latvia, Romania and Turkey, 4% of students or more reported that they had skipped a class five times or more in the previous two weeks; and in Argentina and Turkey, more than 7% of students reported that they had skipped five or more days of school during that period. In most countries, there is very little difference in the incidence of truancy between advantaged and disadvantaged students. For example, across OECD countries, 19% of disadvantaged students reported that they had skipped classes, compared with 17% of advantaged students; and 18% of disadvantaged students reported that they had skipped days of school, compared with 12% of advantaged students.
•Across OECD countries, 18% of students skipped classes at least once in the two weeks prior to the PISA test, and 15% of students skipped a day of school or more over the same period.
•Few students in high-performing school systems skip classes or days of school.
•For students in OECD countries, skipping classes is associated with a 32-point lower score in mathematics, while skipping days of school is associated with a 52-point lower score.
•Truancy is observed among all students, whether advantaged or disadvantaged.
In FOCuS 35education data education evidence education policy education analysis education statistics education data education evidence education policy

in Focus
2 © OECD 2014 PISA in Focus – 2014/01 (January)
Truancy is associated with poorer student performance in mathematics…
Students who reported that they had skipped classes or days of school at least once in the two weeks prior to the PISA test have lower scores than students who reported that they had not skipped classes or days of school. Across OECD countries, skipping classes is associated with a 32-point lower score in mathematics and skipping days of school is associated with a 52-point lower score. In Japan, Korea and Chinese Taipei, the score-point difference associated with having skipped classes is larger than 80 points, and in Hungary, Japan, Korea, new Zealand, Shanghai-China and Chinese Taipei, the score-point difference associated with having skipped days of school is also larger than 80-score points. In every country except Brazil, Colombia and Israel, students who reported that they had skipped classes or days of school perform worse than students who reported that they had not done so.
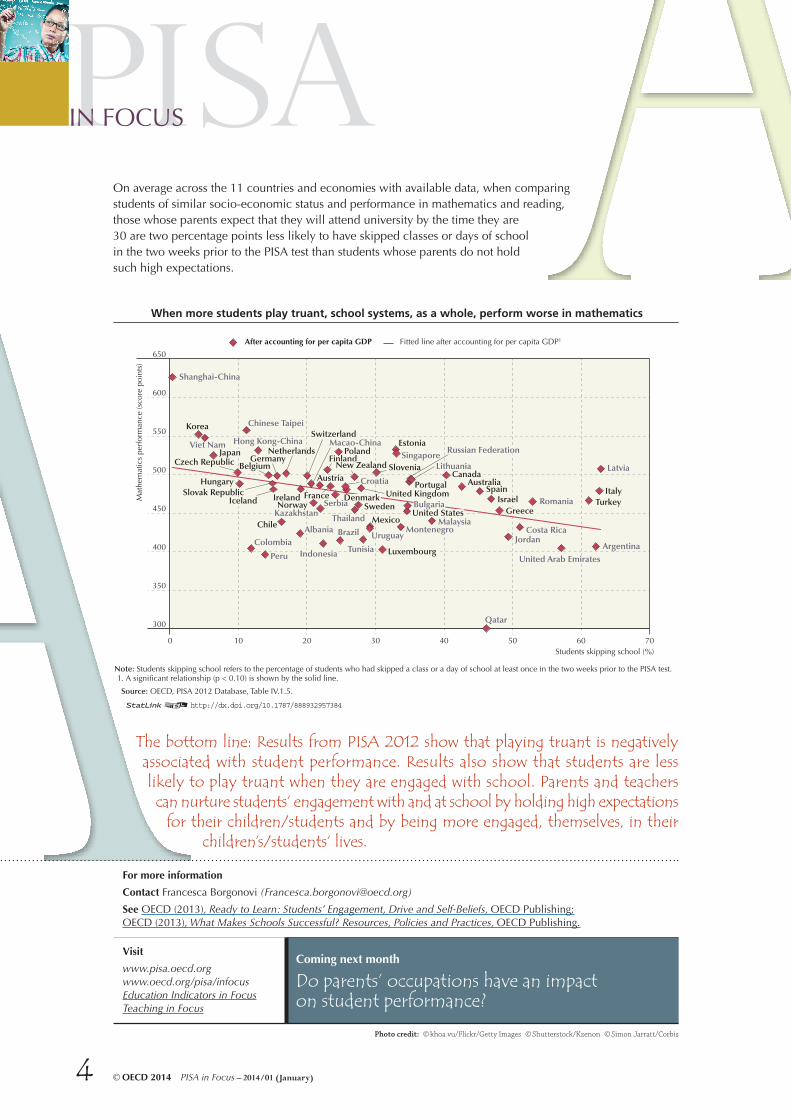
…and a high incidence of truancy has repercussions on schools’ and school systems’ performance.
Student truancy is negatively related to a school system’s overall performance. Among OECD countries, after accounting for per capita GDP, school systems with larger percentages of students who play truant tend to score lower in mathematics. After accounting for differences in the level of economic development, measured by per capita GDP, 16% of the variation in mathematics performance across OECD countries can be explained by differences in the proportions of students who skip school. (By contrast, in most high-performing school systems, such as Hong Kong-China, Japan, Korea and Shanghai-China, virtually no student skips classes or days of school.)
Countries and economies are ranked in descending order of the percentage of students who reported that they had skipped classes in the two weeks prior to the PISA test.
Disadvanatged students are those in the bottom quarter of the PISA index of economic, social and cultural status and advanatged students are those in the top quarter of that index.
Note: An asterix next to the country name denotes countries where socio-economic disparities are statistically significant.
Source: OECD, PISA 2012 Database, Table III.2.2a.
12http://dx.doi.org/10.1787/888932963920
All students Disadvantaged students Advantaged students
Too many students,from all backgrounds, skip classes
Percentage of students who skipped classes at least once in the two weeks prior to the PISA test
Percentage of students
Score-point difference associated with skipping classes shown in parentheses
0 10 20 30 40 50 60 70 80 90 100
LatviaTurkey
ArgentinaRomania
Costa RicaGreece
ItalyBulgaria*
Lithuania*Spain*
MontenegroIsrael*
Russian Federation*Estonia*Jordan*
Portugal*Serbia
ThailandSlovenia*
Tunisia*Malaysia*Indonesia
Canada*Uruguay*
CroatiaUnited Arab Emirates
Mexico*Sweden*
PolandQatar
AlbaniaBrazil*
OECD average*Kazakhstan*
FranceDenmark*Colombia
Finland*Chile*
New Zealand*Australia*
United States*Austria*
SingaporeIreland
Peru*United Kingdom
NorwaySlovak Republic*
Iceland*Netherlands*Switzerland*
GermanyChinese Taipei*
Hungary*Belgium*
Czech RepublicLuxembourg
Viet NamMacao-China*
Shanghai-ChinaHong Kong-China
Korea*Japan
(5)(-9)(21)(11)(-1)(11)(19)(39)(34)(27)(7)
(-12)(21)(32)(-5)(28)(21)(18)(35)(1)
(13)(18)(28)(19)(35)(8)
(-1)(43)(27)(31)(-8)(3)
(32)(22)(25)(34)(1)
(33)(24)(67)(29)(16)(6)(2)
(10)(39)(31)(52)(43)(48)(2)
(17)(15)(87)(55)(72)(24)(44)(29)(23)(30)(74)
(121)(92)
in Focus
3PISA in Focus – 2014/01 (January) © OECD 2014
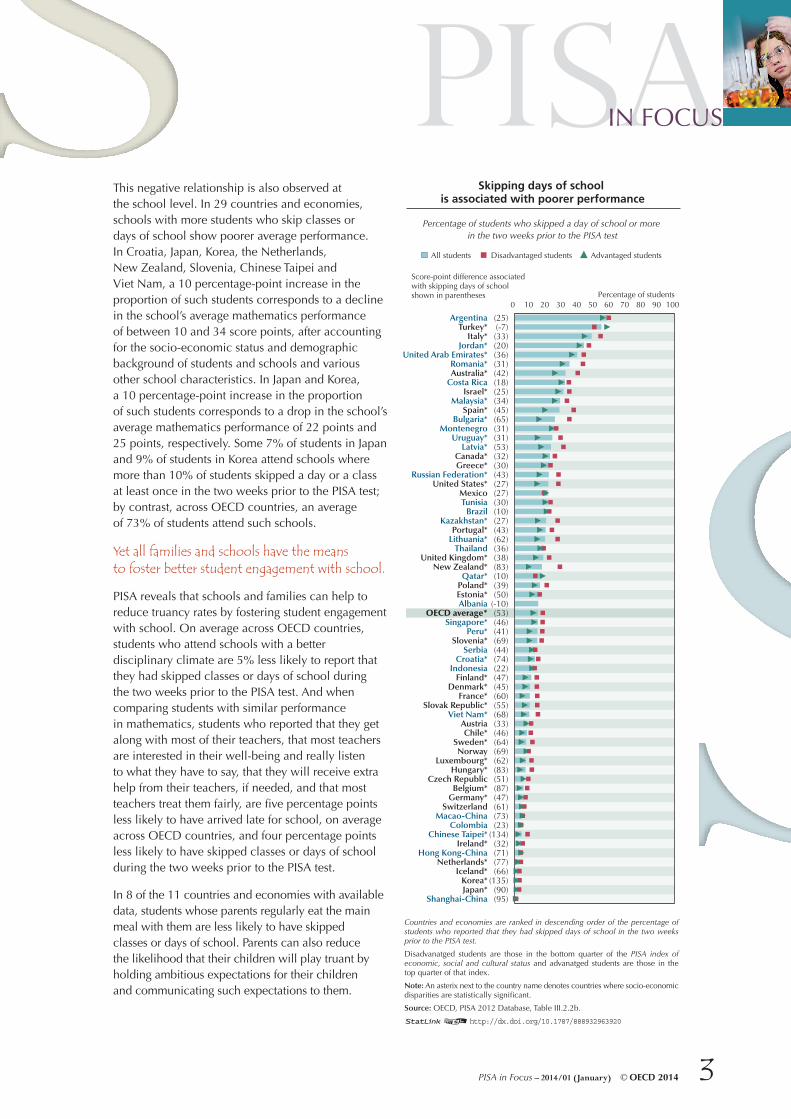
This negative relationship is also observed at the school level. In 29 countries and economies, schools with more students who skip classes or days of school show poorer average performance. In Croatia, Japan, Korea, the netherlands, new Zealand, Slovenia, Chinese Taipei and Viet nam, a 10 percentage-point increase in the proportion of such students corresponds to a decline in the school’s average mathematics performance of between 10 and 34 score points, after accounting for the socio-economic status and demographic background of students and schools and various other school characteristics. In Japan and Korea, a 10 percentage-point increase in the proportion of such students corresponds to a drop in the school’s average mathematics performance of 22 points and 25 points, respectively. Some 7% of students in Japan and 9% of students in Korea attend schools where more than 10% of students skipped a day or a class at least once in the two weeks prior to the PISA test; by contrast, across OECD countries, an average of 73% of students attend such schools.
Yet all families and schools have the means to foster better student engagement with school.
PISA reveals that schools and families can help to reduce truancy rates by fostering student engagement with school. On average across OECD countries, students who attend schools with a better disciplinary climate are 5% less likely to report that they had skipped classes or days of school during the two weeks prior to the PISA test. And when comparing students with similar performance in mathematics, students who reported that they get along with most of their teachers, that most teachers are interested in their well-being and really listen to what they have to say, that they will receive extra help from their teachers, if needed, and that most teachers treat them fairly, are five percentage points less likely to have arrived late for school, on average across OECD countries, and four percentage points less likely to have skipped classes or days of school during the two weeks prior to the PISA test.
In 8 of the 11 countries and economies with available data, students whose parents regularly eat the main meal with them are less likely to have skipped classes or days of school. Parents can also reduce the likelihood that their children will play truant by holding ambitious expectations for their children and communicating such expectations to them.
Countries and economies are ranked in descending order of the percentage of students who reported that they had skipped days of school in the two weeks prior to the PISA test.
Disadvanatged students are those in the bottom quarter of the PISA index of economic, social and cultural status and advanatged students are those in the top quarter of that index.
Note: An asterix next to the country name denotes countries where socio-economic disparities are statistically significant.
Source: OECD, PISA 2012 Database, Table III.2.2b.
12http://dx.doi.org/10.1787/888932963920
All students Disadvantaged students Advantaged students
Skipping days of school is associated with poorer performance
Percentage of students who skipped a day of school or more in the two weeks prior to the PISA test
Percentage of students
Score-point difference associated with skipping days of school shown in parentheses
0 10 20 30 40 50 60 70 80 90 100
ArgentinaTurkey*
Italy*Jordan*
United Arab Emirates*Romania*Australia*
Costa RicaIsrael*
Malaysia*Spain*
Bulgaria*Montenegro
Uruguay*Latvia*
Canada*Greece*
Russian Federation*United States*
MexicoTunisia
BrazilKazakhstan*
Portugal*Lithuania*
ThailandUnited Kingdom*
New Zealand*Qatar*
Poland*Estonia*Albania
OECD average*Singapore*
Peru*Slovenia*
SerbiaCroatia*
IndonesiaFinland*
Denmark*France*
Slovak Republic*Viet Nam*
AustriaChile*
Sweden*Norway
Luxembourg*Hungary*
Czech RepublicBelgium*
Germany*Switzerland
Macao-ChinaColombia
Chinese Taipei*Ireland*
Hong Kong-ChinaNetherlands*
Iceland*Korea*Japan*
Shanghai-China
(25)(-7)(33)(20)(36)(31)(42)(18)(25)(34)(45)(65)(31)(31)(53)(32)(30)(43)(27)(27)(30)(10)(27)(43)(62)(36)(38)(83)(10)(39)(50)
(-10)(53)(46)(41)(69)(44)(74)(22)(47)(45)(60)(55)(68)(33)(46)(64)(69)(62)(83)(51)(87)(47)(61)(73)(23)
(134)(32)(71)(77)(66)
(135)(90)(95)
in Focus
4 © OECD 2014 PISA in Focus – 2014/01 (January)
The bottom line: Results from PISA 2012 show that playing truant is negatively associated with student performance. Results also show that students are less likely to play truant when they are engaged with school. Parents and teachers can nurture students’ engagement with and at school by holding high expectations
for their children/students and by being more engaged, themselves, in their children’s/students’ lives.
On average across the 11 countries and economies with available data, when comparing students of similar socio-economic status and performance in mathematics and reading, those whose parents expect that they will attend university by the time they are 30 are two percentage points less likely to have skipped classes or days of school in the two weeks prior to the PISA test than students whose parents do not hold such high expectations.
Photo credit: © khoa vu/Flickr/Getty Images © Shutterstock/Kzenon © Simon Jarratt/Corbis
When more students play truant, school systems, as a whole, perform worse in mathematics
After accounting for per capita GDP Fitted line after accounting for per capita GDP1
300
350
400
450
500
550
600
650
Mat
hem
atic
s pe
rfor
man
ce (s
core
poi
nts)
0 10 20 30 40 50 60 70Students skipping school (%)
Slovenia
Malaysia Montenegro
Tunisia
France Iceland
Mexico
Sweden United States
Hong Kong-China
Brazil
Croatia
Latvia
Chinese Taipei
Thailand
Jordan Argentina
Peru
Costa Rica
Singapore
Colombia
Serbia Romania
Viet Nam Poland
Estonia
Finland
Slovak Republic
Germany
Austria
Czech Republic
Turkey
Hungary Australia
Israel Ireland
Chile
Netherlands
Spain
Korea
Italy
Qatar
Switzerland Macao-China
Russian Federation
Lithuania
Portugal United Kingdom
New Zealand
United Arab EmiratesLuxembourg
Uruguay
Indonesia
Albania
Shanghai-China
Kazakhstan Norway
Belgium
Japan
Denmark Bulgaria
Greece
Canada
For more information
Contact Francesca Borgonovi ([email protected])
See OECD (2013), Ready to Learn: Students’ Engagement, Drive and Self-Beliefs, OECD Publishing;OECD (2013), What Makes Schools Successful? Resources, Policies and Practices, OECD Publishing.
Visit
www.pisa.oecd.orgwww.oecd.org/pisa/infocusEducation Indicators in FocusTeaching in Focus
Coming next month
Do parents’ occupations have an impact on student performance?
Note: Students skipping school refers to the percentage of students who had skipped a class or a day of school at least once in the two weeks prior to the PISA test. 1. A significant relationship (p < 0.10) is shown by the solid line.
Source: OECD, PISA 2012 Database, Table IV.1.5.
12http://dx.doi.org/10.1787/888932957384