pitchbook a4us template - investor relations - todayir.com · 2011-08-15 · do not refresh this...
TRANSCRIPT

Do not refresh this file
Agenda
Page
K:\Share\Design\For Presentations Use\Template Design_Stylesheet.ppt
2011 Interim Results Announcement
August 2011

Do not refresh this file
1
JP
M c
olo
r 1
R1
00
.G1
44
.B20
3
JP
M c
olo
r 2
R9
5.G
163
.B10
0
JP
M c
olo
r 3
R2
14
.G1
88
.B5
6
JP
M c
olo
r 4
R1
49
.G1
21
.B1
61
JP
M c
olo
r 5
R2
13
.G1
39
.B70
JP
M c
olo
r 7
R1
71
.G1
31
.B65
JP
M c
olo
r 6
R9
1.G
165
.B16
3
JP
M c
olo
r 8
Co
nc
lus
ion
R1
50
.G15
0.B
150
Hig
hlig
ht
R153.G
0.B
0
White
R2
55
.G2
55
.B25
5
2nd, 3
rd&
4th
leve
l Bulle
t
Lt. d
ivid
er lin
e
R1
92
.G1
92
.B19
2
Text
R0
.G0
.B0
1st le
vel b
ulle
t
R1
00
.G1
44
.B20
3
Ta
ble
co
lum
n
he
ad
ing
sh
ad
ing
R2
34
.G2
34
.B2
34
Connecto
r lines
Dk. d
ivid
er lin
e
128.G
128
.B12
8
Object Foundation
Ta
ble
hig
hlig
ht
R2
14
.G2
24
.B2
36
Slid
e title
s
R1
51
.G1
6.B
13
Obje
ct T
itles
Age
nd
a h
ighlig
ht
R6
0.G
92.B
17
0
Disclaimers
These materials and the subsequent discussion are not an offer for sale of any securities of China Hongqiao Group Limited (the
“Company”). The distribution of these materials in certain jurisdictions may be restricted by law and therefore persons into whose
possession of these should inform themselves about and observe any such restrictions. Any failure to comply with these
restrictions may constitute a violation of the securities laws of such jurisdiction.
Certain financial information contained herein has not been audited, comforted, confirmed or otherwise covered by a report by
independent accountants. In addition, past performance of the Company cannot be relied on as a guide to future performance.
These materials and the subsequent discussion contain statements about future events, projections, forecasts and expectations
that are forward-looking statements. Any statement in these materials that is not a statement of historical fact is a forward-looking
statement that involves known and unknown risks, uncertainties and other factors which may cause our actual results,
performance or achievements to be materially different from any future results, performance or achievements expressed or
implied by such forward-looking statements. The Company makes no representation on the accuracy and completeness of any
of the forward-looking statements, and, except as may be required by applicable law, assumes no obligations to supplement,
amend, update or revise any such statements or any opinion expressed to reflect actual results, changes in assumptions or in
the Company‟s expectations, or changes in factors affecting these statements. Accordingly, any reliance you place on such
forward-looking statements will be at your sole risk.

Do not refresh this file
2
JP
M c
olo
r 1
R1
00
.G1
44
.B20
3
JP
M c
olo
r 2
R9
5.G
163
.B10
0
JP
M c
olo
r 3
R2
14
.G1
88
.B5
6
JP
M c
olo
r 4
R1
49
.G1
21
.B1
61
JP
M c
olo
r 5
R2
13
.G1
39
.B70
JP
M c
olo
r 7
R1
71
.G1
31
.B65
JP
M c
olo
r 6
R9
1.G
165
.B16
3
JP
M c
olo
r 8
Co
nc
lus
ion
R1
50
.G15
0.B
150
Hig
hlig
ht
R153.G
0.B
0
White
R2
55
.G2
55
.B25
5
2nd, 3
rd&
4th
leve
l Bulle
t
Lt. d
ivid
er lin
e
R1
92
.G1
92
.B19
2
Text
R0
.G0
.B0
1st le
vel b
ulle
t
R1
00
.G1
44
.B20
3
Ta
ble
co
lum
n
he
ad
ing
sh
ad
ing
R2
34
.G2
34
.B2
34
Connecto
r lines
Dk. d
ivid
er lin
e
128.G
128
.B12
8
Object Foundation
Ta
ble
hig
hlig
ht
R2
14
.G2
24
.B2
36
Slid
e title
s
R1
51
.G1
6.B
13
Obje
ct T
itles
Age
nd
a h
ighlig
ht
R6
0.G
92.B
17
0
2. Financial Review
4. Operations Review
5. Future Plans
1. Major Achievements
6. Q&A
3. Industry Overview

Do not refresh this file
3
JP
M c
olo
r 1
R1
00
.G1
44
.B20
3
JP
M c
olo
r 2
R9
5.G
163
.B10
0
JP
M c
olo
r 3
R2
14
.G1
88
.B5
6
JP
M c
olo
r 4
R1
49
.G1
21
.B1
61
JP
M c
olo
r 5
R2
13
.G1
39
.B70
JP
M c
olo
r 7
R1
71
.G1
31
.B65
JP
M c
olo
r 6
R9
1.G
165
.B16
3
JP
M c
olo
r 8
Co
nc
lus
ion
R1
50
.G15
0.B
150
Hig
hlig
ht
R153.G
0.B
0
White
R2
55
.G2
55
.B25
5
2nd, 3
rd&
4th
leve
l Bulle
t
Lt. d
ivid
er lin
e
R1
92
.G1
92
.B19
2
Text
R0
.G0
.B0
1st le
vel b
ulle
t
R1
00
.G1
44
.B20
3
Ta
ble
co
lum
n
he
ad
ing
sh
ad
ing
R2
34
.G2
34
.B2
34
Connecto
r lines
Dk. d
ivid
er lin
e
128.G
128
.B12
8
Object Foundation
Ta
ble
hig
hlig
ht
R2
14
.G2
24
.B2
36
Slid
e title
s
R1
51
.G1
6.B
13
Obje
ct T
itles
Age
nd
a h
ighlig
ht
R6
0.G
92.B
17
0
Major achievements
Significant growth in
revenue and profits
2
Strengthened production
capacity and market position
3
Successful listing on SEHK
1

Do not refresh this file
4
JP
M c
olo
r 1
R1
00
.G1
44
.B20
3
JP
M c
olo
r 2
R9
5.G
163
.B10
0
JP
M c
olo
r 3
R2
14
.G1
88
.B5
6
JP
M c
olo
r 4
R1
49
.G1
21
.B1
61
JP
M c
olo
r 5
R2
13
.G1
39
.B70
JP
M c
olo
r 7
R1
71
.G1
31
.B65
JP
M c
olo
r 6
R9
1.G
165
.B16
3
JP
M c
olo
r 8
Co
nc
lus
ion
R1
50
.G15
0.B
150
Hig
hlig
ht
R153.G
0.B
0
White
R2
55
.G2
55
.B25
5
2nd, 3
rd&
4th
leve
l Bulle
t
Lt. d
ivid
er lin
e
R1
92
.G1
92
.B19
2
Text
R0
.G0
.B0
1st le
vel b
ulle
t
R1
00
.G1
44
.B20
3
Ta
ble
co
lum
n
he
ad
ing
sh
ad
ing
R2
34
.G2
34
.B2
34
Connecto
r lines
Dk. d
ivid
er lin
e
128.G
128
.B12
8
Object Foundation
Ta
ble
hig
hlig
ht
R2
14
.G2
24
.B2
36
Slid
e title
s
R1
51
.G1
6.B
13
Obje
ct T
itles
Age
nd
a h
ighlig
ht
R6
0.G
92.B
17
0
Successful listing on SEHK
China Hongqiao (―CHQ‖) was successfully listed on
the Main Board of SEHK on 24 March 2011
Market cap*:HKD 35.6 billion
Enhanced international profile and market position
Strengthened financial position to accommodate
future expansion
Optimized shareholder base
* Based on closing price on 12 August 2011

Do not refresh this file
5
JP
M c
olo
r 1
R1
00
.G1
44
.B20
3
JP
M c
olo
r 2
R9
5.G
163
.B10
0
JP
M c
olo
r 3
R2
14
.G1
88
.B5
6
JP
M c
olo
r 4
R1
49
.G1
21
.B1
61
JP
M c
olo
r 5
R2
13
.G1
39
.B70
JP
M c
olo
r 7
R1
71
.G1
31
.B65
JP
M c
olo
r 6
R9
1.G
165
.B16
3
JP
M c
olo
r 8
Co
nc
lus
ion
R1
50
.G15
0.B
150
Hig
hlig
ht
R153.G
0.B
0
White
R2
55
.G2
55
.B25
5
2nd, 3
rd&
4th
leve
l Bulle
t
Lt. d
ivid
er lin
e
R1
92
.G1
92
.B19
2
Text
R0
.G0
.B0
1st le
vel b
ulle
t
R1
00
.G1
44
.B20
3
Ta
ble
co
lum
n
he
ad
ing
sh
ad
ing
R2
34
.G2
34
.B2
34
Connecto
r lines
Dk. d
ivid
er lin
e
128.G
128
.B12
8
Object Foundation
Ta
ble
hig
hlig
ht
R2
14
.G2
24
.B2
36
Slid
e title
s
R1
51
.G1
6.B
13
Obje
ct T
itles
Age
nd
a h
ighlig
ht
R6
0.G
92.B
17
0
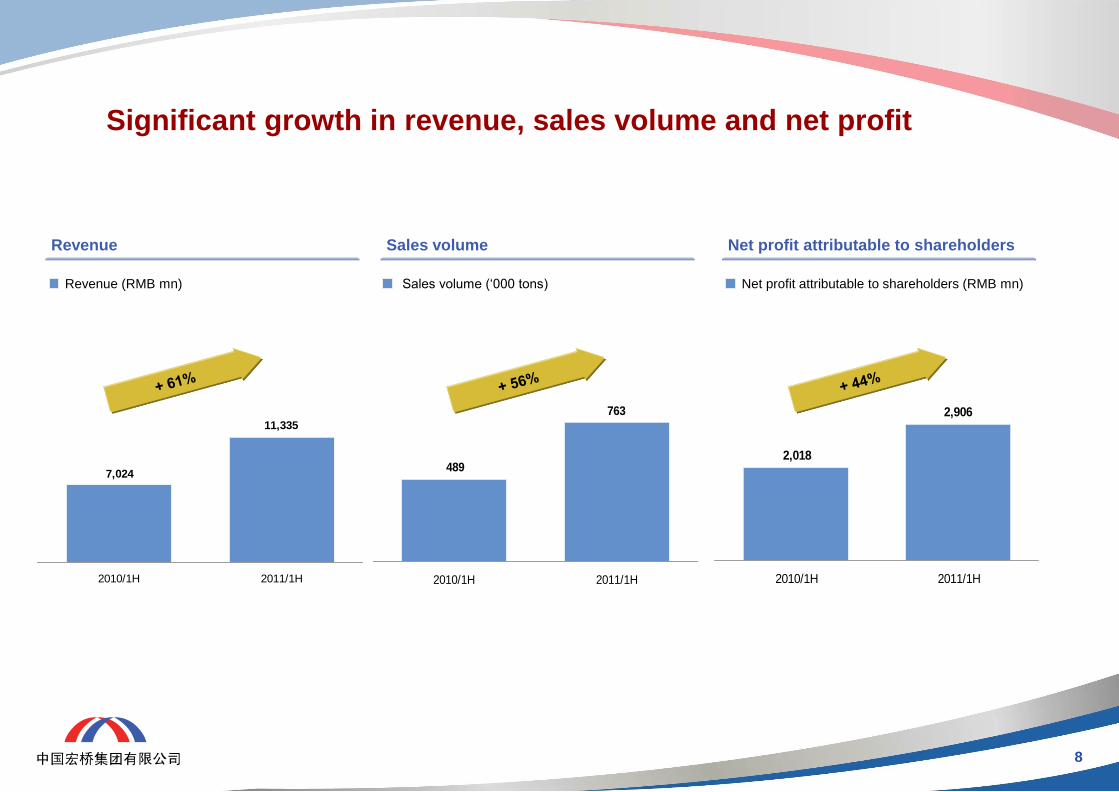
Significant growth in revenue, sales volume and profits
Major reasons:
Strategically located within an end-to-end
aluminum industry cluster, resulting in
overall cost savings
Proven cost structure advantage with large
scale, highly efficient captive power plant
and self-constructed power grid, as well as
cost-competitive and stable alumina supply
Significant increase in sales volume and
average selling price (ASP) driven by
vigorous industry demand
Expanded production capacity to
successfully capture market opportunities
Revenue
+ 61%
Volume
+ 56%
Net profit
attributable to
shareholders
+ 44%

Do not refresh this file
6
JP
M c
olo
r 1
R1
00
.G1
44
.B20
3
JP
M c
olo
r 2
R9
5.G
163
.B10
0
JP
M c
olo
r 3
R2
14
.G1
88
.B5
6
JP
M c
olo
r 4
R1
49
.G1
21
.B1
61
JP
M c
olo
r 5
R2
13
.G1
39
.B70
JP
M c
olo
r 7
R1
71
.G1
31
.B65
JP
M c
olo
r 6
R9
1.G
165
.B16
3
JP
M c
olo
r 8
Co
nc
lus
ion
R1
50
.G15
0.B
150
Hig
hlig
ht
R153.G
0.B
0
White
R2
55
.G2
55
.B25
5
2nd, 3
rd&
4th
leve
l Bulle
t
Lt. d
ivid
er lin
e
R1
92
.G1
92
.B19
2
Text
R0
.G0
.B0
1st le
vel b
ulle
t
R1
00
.G1
44
.B20
3
Ta
ble
co
lum
n
he
ad
ing
sh
ad
ing
R2
34
.G2
34
.B2
34
Connecto
r lines
Dk. d
ivid
er lin
e
128.G
128
.B12
8
Object Foundation
Ta
ble
hig
hlig
ht
R2
14
.G2
24
.B2
36
Slid
e title
s
R1
51
.G1
6.B
13
Obje
ct T
itles
Age
nd
a h
ighlig
ht
R6
0.G
92.B
17
0
Strengthened production capacity and market position
CHQ has successfully become the 4th largest aluminum producer in China
Source: Antaike
Chinese aluminum producers by capacity as of 30 June 2011
4 China Hongqiao Group Ltd 1481 Private company
Rank C ompany Capacity (ktpa) Ownership background
1 CHALCO 4,560 State owned enterprise
2 China Power Investment Corp. 2,135 State owned enterprise
3 Shandong Xinfa 1,800 Private company
4 China Hongqiao Group Ltd 1,481 Private company
5 He nan Shenhuo Group 900 Local state owned enterprise
6 Henan Yulian Energy Group 850 Private company
7 Yichuan Power Industry Group 840 Local state owned enterprise
8 East Hope Baotou Rare Earth 800 Local state owned enterprise

Do not refresh this file
7
JP
M c
olo
r 1
R1
00
.G1
44
.B20
3
JP
M c
olo
r 2
R9
5.G
163
.B10
0
JP
M c
olo
r 3
R2
14
.G1
88
.B5
6
JP
M c
olo
r 4
R1
49
.G1
21
.B1
61
JP
M c
olo
r 5
R2
13
.G1
39
.B70
JP
M c
olo
r 7
R1
71
.G1
31
.B65
JP
M c
olo
r 6
R9
1.G
165
.B16
3
JP
M c
olo
r 8
Co
nc
lus
ion
R1
50
.G15
0.B
150
Hig
hlig
ht
R153.G
0.B
0
White
R2
55
.G2
55
.B25
5
2nd, 3
rd&
4th
leve
l Bulle
t
Lt. d
ivid
er lin
e
R1
92
.G1
92
.B19
2
Text
R0
.G0
.B0
1st le
vel b
ulle
t
R1
00
.G1
44
.B20
3
Ta
ble
co
lum
n
he
ad
ing
sh
ad
ing
R2
34
.G2
34
.B2
34
Connecto
r lines
Dk. d
ivid
er lin
e
128.G
128
.B12
8
Object Foundation
Ta
ble
hig
hlig
ht
R2
14
.G2
24
.B2
36
Slid
e title
s
R1
51
.G1
6.B
13
Obje
ct T
itles
Age
nd
a h
ighlig
ht
R6
0.G
92.B
17
0
2. Financial Review
4. Operations Review
5. Future Plans
1. Major Achievements
6. Q&A
3. Industry Overview
Do not refresh this file
8
JP
M c
olo
r 1
R1
00
.G1
44
.B20
3
JP
M c
olo
r 2
R9
5.G
163
.B10
0
JP
M c
olo
r 3
R2
14
.G1
88
.B5
6
JP
M c
olo
r 4
R1
49
.G1
21
.B1
61
JP
M c
olo
r 5
R2
13
.G1
39
.B70
JP
M c
olo
r 7
R1
71
.G1
31
.B65
JP
M c
olo
r 6
R9
1.G
165
.B16
3
JP
M c
olo
r 8
Co
nc
lus
ion
R1
50
.G15
0.B
150
Hig
hlig
ht
R153.G
0.B
0
White
R2
55
.G2
55
.B25
5
2nd, 3
rd&
4th
leve
l Bulle
t
Lt. d
ivid
er lin
e
R1
92
.G1
92
.B19
2
Text
R0
.G0
.B0
1st le
vel b
ulle
t
R1
00
.G1
44
.B20
3
Ta
ble
co
lum
n
he
ad
ing
sh
ad
ing
R2
34
.G2
34
.B2
34
Connecto
r lines
Dk. d
ivid
er lin
e
128.G
128
.B12
8
Object Foundation
Ta
ble
hig
hlig
ht
R2
14
.G2
24
.B2
36
Slid
e title
s
R1
51
.G1
6.B
13
Obje
ct T
itles
Age
nd
a h
ighlig
ht
R6
0.G
92.B
17
0
Significant growth in revenue, sales volume and net profit
11,335
7,024
2010/1H 2011/1H
Revenue (RMB mn)
Revenue
763
489
2010/1H 2011/1H
Sales volume („000 tons)
Sales volume
2,906
2,018
2010/1H 2011/1H
Net profit attributable to shareholders (RMB mn)
Net profit attributable to shareholders

Do not refresh this file
9
JP
M c
olo
r 1
R1
00
.G1
44
.B20
3
JP
M c
olo
r 2
R9
5.G
163
.B10
0
JP
M c
olo
r 3
R2
14
.G1
88
.B5
6
JP
M c
olo
r 4
R1
49
.G1
21
.B1
61
JP
M c
olo
r 5
R2
13
.G1
39
.B70
JP
M c
olo
r 7
R1
71
.G1
31
.B65
JP
M c
olo
r 6
R9
1.G
165
.B16
3
JP
M c
olo
r 8
Co
nc
lus
ion
R1
50
.G15
0.B
150
Hig
hlig
ht
R153.G
0.B
0
White
R2
55
.G2
55
.B25
5
2nd, 3
rd&
4th
leve
l Bulle
t
Lt. d
ivid
er lin
e
R1
92
.G1
92
.B19
2
Text
R0
.G0
.B0
1st le
vel b
ulle
t
R1
00
.G1
44
.B20
3
Ta
ble
co
lum
n
he
ad
ing
sh
ad
ing
R2
34
.G2
34
.B2
34
Connecto
r lines
Dk. d
ivid
er lin
e
128.G
128
.B12
8
Object Foundation
Ta
ble
hig
hlig
ht
R2
14
.G2
24
.B2
36
Slid
e title
s
R1
51
.G1
6.B
13
Obje
ct T
itles
Age
nd
a h
ighlig
ht
R6
0.G
92.B
17
0
2,735
4,049
38.9%35.7%
2010/1H 2011/1H
3,032
4,454
43.2%39.3%
2010/1H 2011/1H
2,751
4,073
39.2% 35.9%
2010/1H 2011/1H
2,011
2,906
28.6% 25.6%
2010/1H 2011/1H
Profitability
¹ From continuing operations
Gross profit¹ EBITDA¹
EBIT¹ Net profit¹
EBIT margin EBIT (RMB mn)
Gross margin Gross profit (RMB mn) EBITDA margin EBITDA (RMB mn)
Net margin Net profit (RMB mn)
Do not refresh this file
10
JP
M c
olo
r 1
R1
00
.G1
44
.B20
3
JP
M c
olo
r 2
R9
5.G
163
.B10
0
JP
M c
olo
r 3
R2
14
.G1
88
.B5
6
JP
M c
olo
r 4
R1
49
.G1
21
.B1
61
JP
M c
olo
r 5
R2
13
.G1
39
.B70
JP
M c
olo
r 7
R1
71
.G1
31
.B65
JP
M c
olo
r 6
R9
1.G
165
.B16
3
JP
M c
olo
r 8
Co
nc
lus
ion
R1
50
.G15
0.B
150
Hig
hlig
ht
R153.G
0.B
0
White
R2
55
.G2
55
.B25
5
2nd, 3
rd&
4th
leve
l Bulle
t
Lt. d
ivid
er lin
e
R1
92
.G1
92
.B19
2
Text
R0
.G0
.B0
1st le
vel b
ulle
t
R1
00
.G1
44
.B20
3
Ta
ble
co
lum
n
he
ad
ing
sh
ad
ing
R2
34
.G2
34
.B2
34
Connecto
r lines
Dk. d
ivid
er lin
e
128.G
128
.B12
8
Object Foundation
Ta
ble
hig
hlig
ht
R2
14
.G2
24
.B2
36
Slid
e title
s
R1
51
.G1
6.B
13
Obje
ct T
itles
Age
nd
a h
ighlig
ht
R6
0.G
92.B
17
0
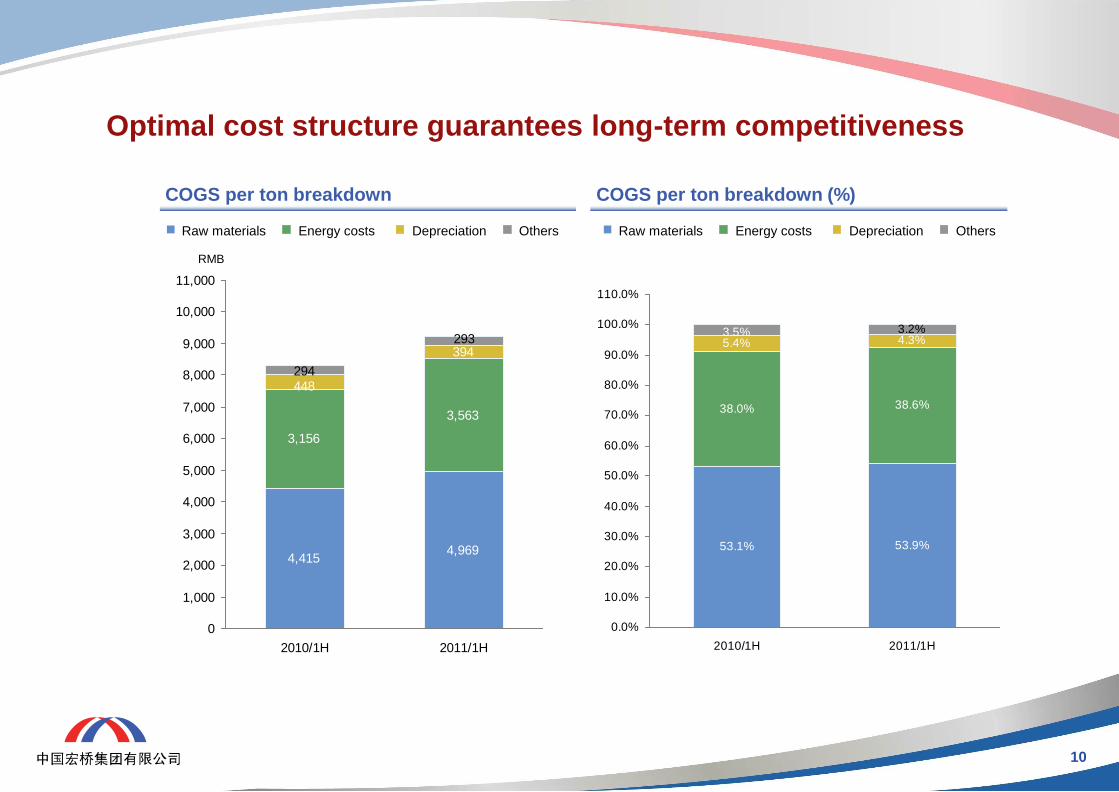
Optimal cost structure guarantees long-term competitiveness
Depreciation
COGS per ton breakdown COGS per ton breakdown (%)
Raw materials Energy costs Depreciation Others Others Raw materials Energy costs
4,4154,969
3,156
3,563
394
448294
293
0
1,000
2,000
3,000
4,000
5,000
6,000
7,000
8,000
9,000
10,000
11,000
2010/1H 2011/1H
53.1% 53.9%
38.0% 38.6%
5.4% 4.3%3.2%3.5%
0.0%
10.0%
20.0%
30.0%
40.0%
50.0%
60.0%
70.0%
80.0%
90.0%
100.0%
110.0%
2010/1H 2011/1H
RMB

Do not refresh this file
11
JP
M c
olo
r 1
R1
00
.G1
44
.B20
3
JP
M c
olo
r 2
R9
5.G
163
.B10
0
JP
M c
olo
r 3
R2
14
.G1
88
.B5
6
JP
M c
olo
r 4
R1
49
.G1
21
.B1
61
JP
M c
olo
r 5
R2
13
.G1
39
.B70
JP
M c
olo
r 7
R1
71
.G1
31
.B65
JP
M c
olo
r 6
R9
1.G
165
.B16
3
JP
M c
olo
r 8
Co
nc
lus
ion
R1
50
.G15
0.B
150
Hig
hlig
ht
R153.G
0.B
0
White
R2
55
.G2
55
.B25
5
2nd, 3
rd&
4th
leve
l Bulle
t
Lt. d
ivid
er lin
e
R1
92
.G1
92
.B19
2
Text
R0
.G0
.B0
1st le
vel b
ulle
t
R1
00
.G1
44
.B20
3
Ta
ble
co
lum
n
he
ad
ing
sh
ad
ing
R2
34
.G2
34
.B2
34
Connecto
r lines
Dk. d
ivid
er lin
e
128.G
128
.B12
8
Object Foundation
Ta
ble
hig
hlig
ht
R2
14
.G2
24
.B2
36
Slid
e title
s
R1
51
.G1
6.B
13
Obje
ct T
itles
Age
nd
a h
ighlig
ht
R6
0.G
92.B
17
0
Prudent financial management
As of 30 Jun 30 2011
RMB mn 2011 2010 Change (%)
Cash & cash equivalents 7,575 1,039 + 629.1
Total capital (equity book value + total
debt)
20,089 9,586 + 109.6
EBITDA / Interest expense (times) 30.9 43.3 - 12.4 times
Debt / EBITDA (times) 0.52 0.74 - 0.22 times
Debt / Total capital 23% 47% - 24 p.p.
Trade receivables turnover days (day) 0.1 0.6 - 0.5 day
Trade payables turnover days (day) 30 14 + 16 days
Inventory turnover days (day) 33 31 + 2 days
Do not refresh this file
12
JP
M c
olo
r 1
R1
00
.G1
44
.B20
3
JP
M c
olo
r 2
R9
5.G
163
.B10
0
JP
M c
olo
r 3
R2
14
.G1
88
.B5
6
JP
M c
olo
r 4
R1
49
.G1
21
.B1
61
JP
M c
olo
r 5
R2
13
.G1
39
.B70
JP
M c
olo
r 7
R1
71
.G1
31
.B65
JP
M c
olo
r 6
R9
1.G
165
.B16
3
JP
M c
olo
r 8
Co
nc
lus
ion
R1
50
.G15
0.B
150
Hig
hlig
ht
R153.G
0.B
0
White
R2
55
.G2
55
.B25
5
2nd, 3
rd&
4th
leve
l Bulle
t
Lt. d
ivid
er lin
e
R1
92
.G1
92
.B19
2
Text
R0
.G0
.B0
1st le
vel b
ulle
t
R1
00
.G1
44
.B20
3
Ta
ble
co
lum
n
he
ad
ing
sh
ad
ing
R2
34
.G2
34
.B2
34
Connecto
r lines
Dk. d
ivid
er lin
e
128.G
128
.B12
8
Object Foundation
Ta
ble
hig
hlig
ht
R2
14
.G2
24
.B2
36
Slid
e title
s
R1
51
.G1
6.B
13
Obje
ct T
itles
Age
nd
a h
ighlig
ht
R6
0.G
92.B
17
0
2. Financial Review
4. Operations Review
5. Future Plans
1. Major Achievements
6. Q&A
3. Industry Overview

Do not refresh this file
13
JP
M c
olo
r 1
R1
00
.G1
44
.B20
3
JP
M c
olo
r 2
R9
5.G
163
.B10
0
JP
M c
olo
r 3
R2
14
.G1
88
.B5
6
JP
M c
olo
r 4
R1
49
.G1
21
.B1
61
JP
M c
olo
r 5
R2
13
.G1
39
.B70
JP
M c
olo
r 7
R1
71
.G1
31
.B65
JP
M c
olo
r 6
R9
1.G
165
.B16
3
JP
M c
olo
r 8
Co
nc
lus
ion
R1
50
.G15
0.B
150
Hig
hlig
ht
R153.G
0.B
0
White
R2
55
.G2
55
.B25
5
2nd, 3
rd&
4th
leve
l Bulle
t
Lt. d
ivid
er lin
e
R1
92
.G1
92
.B19
2
Text
R0
.G0
.B0
1st le
vel b
ulle
t
R1
00
.G1
44
.B20
3
Ta
ble
co
lum
n
he
ad
ing
sh
ad
ing
R2
34
.G2
34
.B2
34
Connecto
r lines
Dk. d
ivid
er lin
e
128.G
128
.B12
8
Object Foundation
Ta
ble
hig
hlig
ht
R2
14
.G2
24
.B2
36
Slid
e title
s
R1
51
.G1
6.B
13
Obje
ct T
itles
Age
nd
a h
ighlig
ht
R6
0.G
92.B
17
0 Current gap between production and consumption of
primary aluminum in China and the world
Source: Antaike
„000 tons
Production volume
Consumption volume
Production volume
Consumption volume „000 tons
Global production & consumption of primary aluminum China‘s production & consumption of primary aluminum
3,8603,905
3,7573,793
3,372
3,699
4,0073,979
3,8513,849
3,339
3,599
2,500
3,000
3,500
4,000
Jan-11 Feb-11 Mar-11 Apr-11 May-11 Jun-11
1,494
1,357
1,571 1,5901,662 1,660
1,496
1,379
1,6611,731
1,800
1,897
500
1,000
1,500
2,000
Jan-11 Feb-11 Mar-11 Apr-11 May-11 Jun-11
+100
+33
-56 -94
-74 -147
-2 -22
-90 -141
-138 -237
Production / consumption gap Production / consumption gap

Do not refresh this file
14
JP
M c
olo
r 1
R1
00
.G1
44
.B20
3
JP
M c
olo
r 2
R9
5.G
163
.B10
0
JP
M c
olo
r 3
R2
14
.G1
88
.B5
6
JP
M c
olo
r 4
R1
49
.G1
21
.B1
61
JP
M c
olo
r 5
R2
13
.G1
39
.B70
JP
M c
olo
r 7
R1
71
.G1
31
.B65
JP
M c
olo
r 6
R9
1.G
165
.B16
3
JP
M c
olo
r 8
Co
nc
lus
ion
R1
50
.G15
0.B
150
Hig
hlig
ht
R153.G
0.B
0
White
R2
55
.G2
55
.B25
5
2nd, 3
rd&
4th
leve
l Bulle
t
Lt. d
ivid
er lin
e
R1
92
.G1
92
.B19
2
Text
R0
.G0
.B0
1st le
vel b
ulle
t
R1
00
.G1
44
.B20
3
Ta
ble
co
lum
n
he
ad
ing
sh
ad
ing
R2
34
.G2
34
.B2
34
Connecto
r lines
Dk. d
ivid
er lin
e
128.G
128
.B12
8
Object Foundation
Ta
ble
hig
hlig
ht
R2
14
.G2
24
.B2
36
Slid
e title
s
R1
51
.G1
6.B
13
Obje
ct T
itles
Age
nd
a h
ighlig
ht
R6
0.G
92.B
17
0
London Metal Exchange (LME)
Shanghai Futures Exchange (SHFE)
Source: LME, SHFE, Antaike
Aluminum prices in 1H 2011
Aluminum prices have remained strong since 2H 2010 as a result of the vigorous market demand
ASP of CHQ‟s aluminum products increased by 5.5%, from RMB13,655 / ton in 1H 2010 to
RMB14,405 / ton in 1H 2011
1,500
1,700
1,900
2,100
2,300
2,500
2,700
2,900
Jul-
10
Aug-
10
Sep-
10
Oct-
10
Nov-
10
Dec-
10
Jan-
11
Feb-
11
Mar-
11
Apr-
11
May-
11
Jun-
11
13,500
14,000
14,500
15,000
15,500
16,000
16,500
17,000
Jul-
10
Aug-
10
Sep-
10
Oct-
10
Nov-
10
Dec-
10
Jan-
11
Feb-
11
Mar-
11
Apr-
11
May-
11
Jun-
11
USD/ton RMB/ton

Do not refresh this file
15
JP
M c
olo
r 1
R1
00
.G1
44
.B20
3
JP
M c
olo
r 2
R9
5.G
163
.B10
0
JP
M c
olo
r 3
R2
14
.G1
88
.B5
6
JP
M c
olo
r 4
R1
49
.G1
21
.B1
61
JP
M c
olo
r 5
R2
13
.G1
39
.B70
JP
M c
olo
r 7
R1
71
.G1
31
.B65
JP
M c
olo
r 6
R9
1.G
165
.B16
3
JP
M c
olo
r 8
Co
nc
lus
ion
R1
50
.G15
0.B
150
Hig
hlig
ht
R153.G
0.B
0
White
R2
55
.G2
55
.B25
5
2nd, 3
rd&
4th
leve
l Bulle
t
Lt. d
ivid
er lin
e
R1
92
.G1
92
.B19
2
Text
R0
.G0
.B0
1st le
vel b
ulle
t
R1
00
.G1
44
.B20
3
Ta
ble
co
lum
n
he
ad
ing
sh
ad
ing
R2
34
.G2
34
.B2
34
Connecto
r lines
Dk. d
ivid
er lin
e
128.G
128
.B12
8
Object Foundation
Ta
ble
hig
hlig
ht
R2
14
.G2
24
.B2
36
Slid
e title
s
R1
51
.G1
6.B
13
Obje
ct T
itles
Age
nd
a h
ighlig
ht
R6
0.G
92.B
17
0
China continues to drive world consumption
China‘s primary aluminum consumption
breakdown – by industry (2010) Global primary aluminum consumption (2010)
Construction
40.0%
Transportation
15.5%
Electrical
15.5%
Durables
12.0%
Machineries
4.9%
Others
8.0%
China
41%
Japan
5% Other Asia
12%
Germany
5%
Other Europe
16%
Mid East & Africa
5%
U.S.
10%
Other N. America
& S. America
6%
Packaging
4.1%
Source: Antaike

Do not refresh this file
16
JP
M c
olo
r 1
R1
00
.G1
44
.B20
3
JP
M c
olo
r 2
R9
5.G
163
.B10
0
JP
M c
olo
r 3
R2
14
.G1
88
.B5
6
JP
M c
olo
r 4
R1
49
.G1
21
.B1
61
JP
M c
olo
r 5
R2
13
.G1
39
.B70
JP
M c
olo
r 7
R1
71
.G1
31
.B65
JP
M c
olo
r 6
R9
1.G
165
.B16
3
JP
M c
olo
r 8
Co
nc
lus
ion
R1
50
.G15
0.B
150
Hig
hlig
ht
R153.G
0.B
0
White
R2
55
.G2
55
.B25
5
2nd, 3
rd&
4th
leve
l Bulle
t
Lt. d
ivid
er lin
e
R1
92
.G1
92
.B19
2
Text
R0
.G0
.B0
1st le
vel b
ulle
t
R1
00
.G1
44
.B20
3
Ta
ble
co
lum
n
he
ad
ing
sh
ad
ing
R2
34
.G2
34
.B2
34
Connecto
r lines
Dk. d
ivid
er lin
e
128.G
128
.B12
8
Object Foundation
Ta
ble
hig
hlig
ht
R2
14
.G2
24
.B2
36
Slid
e title
s
R1
51
.G1
6.B
13
Obje
ct T
itles
Age
nd
a h
ighlig
ht
R6
0.G
92.B
17
0
Widening gap between supply and demand
Ex-China supply growing ahead of demand
The unbalanced supply and demand in China
Source: China Zhongjing
Global supply & demand balance (‗000 tons)
Ex-China global supply & demand balance (‗000 tons)
China‘s supply & demand balance (‗000 tons)
8,000
6,000
4,000
2,000
0
-2,000
2,000
0
-2,000
-4,000
-6,000
-8,000
-10,000

Do not refresh this file
17
JP
M c
olo
r 1
R1
00
.G1
44
.B20
3
JP
M c
olo
r 2
R9
5.G
163
.B10
0
JP
M c
olo
r 3
R2
14
.G1
88
.B5
6
JP
M c
olo
r 4
R1
49
.G1
21
.B1
61
JP
M c
olo
r 5
R2
13
.G1
39
.B70
JP
M c
olo
r 7
R1
71
.G1
31
.B65
JP
M c
olo
r 6
R9
1.G
165
.B16
3
JP
M c
olo
r 8
Co
nc
lus
ion
R1
50
.G15
0.B
150
Hig
hlig
ht
R153.G
0.B
0
White
R2
55
.G2
55
.B25
5
2nd, 3
rd&
4th
leve
l Bulle
t
Lt. d
ivid
er lin
e
R1
92
.G1
92
.B19
2
Text
R0
.G0
.B0
1st le
vel b
ulle
t
R1
00
.G1
44
.B20
3
Ta
ble
co
lum
n
he
ad
ing
sh
ad
ing
R2
34
.G2
34
.B2
34
Connecto
r lines
Dk. d
ivid
er lin
e
128.G
128
.B12
8
Object Foundation
Ta
ble
hig
hlig
ht
R2
14
.G2
24
.B2
36
Slid
e title
s
R1
51
.G1
6.B
13
Obje
ct T
itles
Age
nd
a h
ighlig
ht
R6
0.G
92.B
17
0
2. Financial Review
4. Operations Review
5. Future Plans
1. Major Achievements
6. Q&A
3. Industry Overview

Do not refresh this file
18
JP
M c
olo
r 1
R1
00
.G1
44
.B20
3
JP
M c
olo
r 2
R9
5.G
163
.B10
0
JP
M c
olo
r 3
R2
14
.G1
88
.B5
6
JP
M c
olo
r 4
R1
49
.G1
21
.B1
61
JP
M c
olo
r 5
R2
13
.G1
39
.B70
JP
M c
olo
r 7
R1
71
.G1
31
.B65
JP
M c
olo
r 6
R9
1.G
165
.B16
3
JP
M c
olo
r 8
Co
nc
lus
ion
R1
50
.G15
0.B
150
Hig
hlig
ht
R153.G
0.B
0
White
R2
55
.G2
55
.B25
5
2nd, 3
rd&
4th
leve
l Bulle
t
Lt. d
ivid
er lin
e
R1
92
.G1
92
.B19
2
Text
R0
.G0
.B0
1st le
vel b
ulle
t
R1
00
.G1
44
.B20
3
Ta
ble
co
lum
n
he
ad
ing
sh
ad
ing
R2
34
.G2
34
.B2
34
Connecto
r lines
Dk. d
ivid
er lin
e
128.G
128
.B12
8
Object Foundation
Ta
ble
hig
hlig
ht
R2
14
.G2
24
.B2
36
Slid
e title
s
R1
51
.G1
6.B
13
Obje
ct T
itles
Age
nd
a h
ighlig
ht
R6
0.G
92.B
17
0
Revenue breakdown – by product
Aluminum
products
Steam TOTAL
Revenue (RMB mn) 1H 2011 10,987 348 11,335
1H 2010 6,673 351 7,024
% of total revenue 1H 2011 96.9 3.1 100
1H 2010 95.0 5.0 100
Volume (ton) 1H 2011
766,019 2,623,080
1H 2010 496,973 2,645,040
GP margin (%) 1H 2011
36.0 26.7 35.7
1H 2010 39.1 35.3 38.9
Do not refresh this file
19
JP
M c
olo
r 1
R1
00
.G1
44
.B20
3
JP
M c
olo
r 2
R9
5.G
163
.B10
0
JP
M c
olo
r 3
R2
14
.G1
88
.B5
6
JP
M c
olo
r 4
R1
49
.G1
21
.B1
61
JP
M c
olo
r 5
R2
13
.G1
39
.B70
JP
M c
olo
r 7
R1
71
.G1
31
.B65
JP
M c
olo
r 6
R9
1.G
165
.B16
3
JP
M c
olo
r 8
Co
nc
lus
ion
R1
50
.G15
0.B
150
Hig
hlig
ht
R153.G
0.B
0
White
R2
55
.G2
55
.B25
5
2nd, 3
rd&
4th
leve
l Bulle
t
Lt. d
ivid
er lin
e
R1
92
.G1
92
.B19
2
Text
R0
.G0
.B0
1st le
vel b
ulle
t
R1
00
.G1
44
.B20
3
Ta
ble
co
lum
n
he
ad
ing
sh
ad
ing
R2
34
.G2
34
.B2
34
Connecto
r lines
Dk. d
ivid
er lin
e
128.G
128
.B12
8
Object Foundation
Ta
ble
hig
hlig
ht
R2
14
.G2
24
.B2
36
Slid
e title
s
R1
51
.G1
6.B
13
Obje
ct T
itles
Age
nd
a h
ighlig
ht
R6
0.G
92.B
17
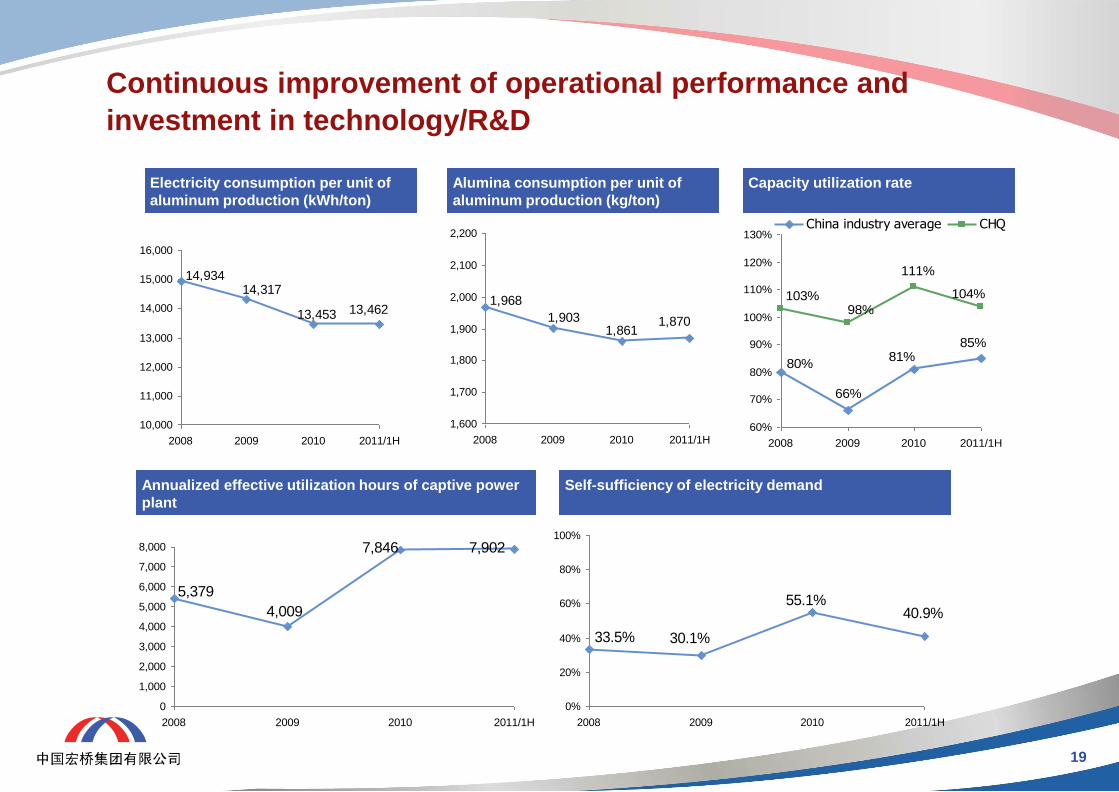
0 Continuous improvement of operational performance and
investment in technology/R&D
13,46213,453
14,31714,934
10,000
11,000
12,000
13,000
14,000
15,000
16,000
2008 2009 2010 2011/1H
1,8701,861
1,903
1,968
1,600
1,700
1,800
1,900
2,000
2,100
2,200
2008 2009 2010 2011/1H
5,379
4,009
7,846 7,902
0
1,000
2,000
3,000
4,000
5,000
6,000
7,000
8,000
2008 2009 2010 2011/1H
40.9%55.1%
30.1%33.5%
0%
20%
40%
60%
80%
100%
2008 2009 2010 2011/1H
Electricity consumption per unit of
aluminum production (kWh/ton)
Alumina consumption per unit of
aluminum production (kg/ton)
Capacity utilization rate
Annualized effective utilization hours of captive power
plant
Self-sufficiency of electricity demand
80%
66%
81%85%
103%98%
111%
104%
60%
70%
80%
90%
100%
110%
120%
130%
2008 2009 2010 2011/1H
China industry average CHQ

Do not refresh this file
20
JP
M c
olo
r 1
R1
00
.G1
44
.B20
3
JP
M c
olo
r 2
R9
5.G
163
.B10
0
JP
M c
olo
r 3
R2
14
.G1
88
.B5
6
JP
M c
olo
r 4
R1
49
.G1
21
.B1
61
JP
M c
olo
r 5
R2
13
.G1
39
.B70
JP
M c
olo
r 7
R1
71
.G1
31
.B65
JP
M c
olo
r 6
R9
1.G
165
.B16
3
JP
M c
olo
r 8
Co
nc
lus
ion
R1
50
.G15
0.B
150
Hig
hlig
ht
R153.G
0.B
0
White
R2
55
.G2
55
.B25
5
2nd, 3
rd&
4th
leve
l Bulle
t
Lt. d
ivid
er lin
e
R1
92
.G1
92
.B19
2
Text
R0
.G0
.B0
1st le
vel b
ulle
t
R1
00
.G1
44
.B20
3
Ta
ble
co
lum
n
he
ad
ing
sh
ad
ing
R2
34
.G2
34
.B2
34
Connecto
r lines
Dk. d
ivid
er lin
e
128.G
128
.B12
8
Object Foundation
Ta
ble
hig
hlig
ht
R2
14
.G2
24
.B2
36
Slid
e title
s
R1
51
.G1
6.B
13
Obje
ct T
itles
Age
nd
a h
ighlig
ht
R6
0.G
92.B
17
0 Low cost electricity supply – large scale, highly efficient
captive power plant & self-constructed power grid
Self-generated electricity in 1H 2011 ~RMB0.22/kWh,
significantly cheaper than procured from state grid
40.9% energy self-sufficient for 1H 2011
Capex planned to further increase self-sufficiency
Connects CHQ‟s three manufacturing facilities with external
supplier, Gaoxin
Long term contract @ RMB0.29/kWh1
Purchased 88% of Gaoxin‟s output in 1H 2011
1 Assuming that the base price of coal with a heat value of 5,000 kilocalorie per kilogram is RMB700 per ton (inclusive of VAT), which is subject to adjustment through negotiation
if the price fluctuation of coal exceeds 20% 2 Source: Antaike; 2011 data
Captive power plant External electricity supply from Gaoxin
1,080 MW thermal power plant Private self-constructed power grid
20
Resulting in electricity cost saving of RMB2,150 / ton at RMB26 cents/kWh (excluding VAT),
16 cents/kWh2 lower than China average

Do not refresh this file
21
JP
M c
olo
r 1
R1
00
.G1
44
.B20
3
JP
M c
olo
r 2
R9
5.G
163
.B10
0
JP
M c
olo
r 3
R2
14
.G1
88
.B5
6
JP
M c
olo
r 4
R1
49
.G1
21
.B1
61
JP
M c
olo
r 5
R2
13
.G1
39
.B70
JP
M c
olo
r 7
R1
71
.G1
31
.B65
JP
M c
olo
r 6
R9
1.G
165
.B16
3
JP
M c
olo
r 8
Co
nc
lus
ion
R1
50
.G15
0.B
150
Hig
hlig
ht
R153.G
0.B
0
White
R2
55
.G2
55
.B25
5
2nd, 3
rd&
4th
leve
l Bulle
t
Lt. d
ivid
er lin
e
R1
92
.G1
92
.B19
2
Text
R0
.G0
.B0
1st le
vel b
ulle
t
R1
00
.G1
44
.B20
3
Ta
ble
co
lum
n
he
ad
ing
sh
ad
ing
R2
34
.G2
34
.B2
34
Connecto
r lines
Dk. d
ivid
er lin
e
128.G
128
.B12
8
Object Foundation
Ta
ble
hig
hlig
ht
R2
14
.G2
24
.B2
36
Slid
e title
s
R1
51
.G1
6.B
13
Obje
ct T
itles
Age
nd
a h
ighlig
ht
R6
0.G
92.B
17
0
Method of external
electricity purchase
On-grid electricity charge Direct supply agreement + Wheeling
charge to state grid
Direct supply agreement + Self-owned
power grid
Direct electricity
supply agreement
No Yes Yes
Self-owned power
grid
No No Yes
Features Direct purchase from state grid in
accordance with stipulated pricing
policies
Have large scale power generating
companies nearby with abundant
supply
Have large scale power generating
companies nearby with abundant
supply
Private power grid and electricity
supply network
Entry barrier Low Medium High
Price Minimum price ~ RMB0.55/kWh1; price controlled by government Over RMB0.405/kWh1 (wheeling cost of
RMB0.15-0.20/kWh1 required)
~ RMB0.25-0.30/kWh1; price mainly
determined by electricity cost & mutual
business agreement; relatively low policy
risks
1. Directly purchase from state grid
Primary aluminum
producers
Electricity
supply
company 1
Electricity
supply
company 2
Electricity
supply
company
N
…
On-grid charge
2. Direct supply agreement +
wheeling charge to state grid
Direct electricity
supply companies
Wheeling
charge
3. Direct supply agreement +
Self-owned power grid
Primary aluminum
producers
Direct electricity
supply companies
Off-grid
electricity
charge Self-constructed
power grid
CHQ‘s unique
power supply
model
Off-grid
electricity
charge
Primary aluminum
producers
CHQ‘s unique external power supply model
1Forecasts of management

Do not refresh this file
22
JP
M c
olo
r 1
R1
00
.G1
44
.B20
3
JP
M c
olo
r 2
R9
5.G
163
.B10
0
JP
M c
olo
r 3
R2
14
.G1
88
.B5
6
JP
M c
olo
r 4
R1
49
.G1
21
.B1
61
JP
M c
olo
r 5
R2
13
.G1
39
.B70
JP
M c
olo
r 7
R1
71
.G1
31
.B65
JP
M c
olo
r 6
R9
1.G
165
.B16
3
JP
M c
olo
r 8
Co
nc
lus
ion
R1
50
.G15
0.B
150
Hig
hlig
ht
R153.G
0.B
0
White
R2
55
.G2
55
.B25
5
2nd, 3
rd&
4th
leve
l Bulle
t
Lt. d
ivid
er lin
e
R1
92
.G1
92
.B19
2
Text
R0
.G0
.B0
1st le
vel b
ulle
t
R1
00
.G1
44
.B20
3
Ta
ble
co
lum
n
he
ad
ing
sh
ad
ing
R2
34
.G2
34
.B2
34
Connecto
r lines
Dk. d
ivid
er lin
e
128.G
128
.B12
8
Object Foundation
Ta
ble
hig
hlig
ht
R2
14
.G2
24
.B2
36
Slid
e title
s
R1
51
.G1
6.B
13
Obje
ct T
itles
Age
nd
a h
ighlig
ht
R6
0.G
92.B
17
0
Reliable and cost-competitive alumina supply
Alumina cost comparison (RMB/t)¹
¹ Average market price based on Antaike data; VAT excluded
Strong partnership with key alumina
supplier — Binzhou Gaoxin
Consumes 60% of its alumina output
Purchased 1,449kt alumina in 1H 2011
Long-term contract
Competitive costs
Approx. RMB500/t below the price at
which Gaoxin sells to others
Geographic proximity
Saves freight, packaging, loading and
offloading costs
Reliable alumina supply
Gaoxin‟s long-term contract for importing
bauxite
CHQ‟s well-planned policy to secure
stable alumina supply in long-term
1,795
1,6211,712
2,4952,379
3,148
2,885
2,332
2,350
2,0002,106
1,982
2,752
2,980
2,345
1,000
1,500
2,000
2,500
3,000
3,500
2007 2008 2009 2010 2011/1H
CHQ (long-term agreement)
Industry average
Gaoxin selling to others

Do not refresh this file
23
JP
M c
olo
r 1
R1
00
.G1
44
.B20
3
JP
M c
olo
r 2
R9
5.G
163
.B10
0
JP
M c
olo
r 3
R2
14
.G1
88
.B5
6
JP
M c
olo
r 4
R1
49
.G1
21
.B1
61
JP
M c
olo
r 5
R2
13
.G1
39
.B70
JP
M c
olo
r 7
R1
71
.G1
31
.B65
JP
M c
olo
r 6
R9
1.G
165
.B16
3
JP
M c
olo
r 8
Co
nc
lus
ion
R1
50
.G15
0.B
150
Hig
hlig
ht
R153.G
0.B
0
White
R2
55
.G2
55
.B25
5
2nd, 3
rd&
4th
leve
l Bulle
t
Lt. d
ivid
er lin
e
R1
92
.G1
92
.B19
2
Text
R0
.G0
.B0
1st le
vel b
ulle
t
R1
00
.G1
44
.B20
3
Ta
ble
co
lum
n
he
ad
ing
sh
ad
ing
R2
34
.G2
34
.B2
34
Connecto
r lines
Dk. d
ivid
er lin
e
128.G
128
.B12
8
Object Foundation
Ta
ble
hig
hlig
ht
R2
14
.G2
24
.B2
36
Slid
e title
s
R1
51
.G1
6.B
13
Obje
ct T
itles
Age
nd
a h
ighlig
ht
R6
0.G
92.B
17
0
2. Financial Review
4. Operations Review
5. Future Plans
1. Major Achievements
6. Q&A
3. Industry Overview

Do not refresh this file
24
JP
M c
olo
r 1
R1
00
.G1
44
.B20
3
JP
M c
olo
r 2
R9
5.G
163
.B10
0
JP
M c
olo
r 3
R2
14
.G1
88
.B5
6
JP
M c
olo
r 4
R1
49
.G1
21
.B1
61
JP
M c
olo
r 5
R2
13
.G1
39
.B70
JP
M c
olo
r 7
R1
71
.G1
31
.B65
JP
M c
olo
r 6
R9
1.G
165
.B16
3
JP
M c
olo
r 8
Co
nc
lus
ion
R1
50
.G15
0.B
150
Hig
hlig
ht
R153.G
0.B
0
White
R2
55
.G2
55
.B25
5
2nd, 3
rd&
4th
leve
l Bulle
t
Lt. d
ivid
er lin
e
R1
92
.G1
92
.B19
2
Text
R0
.G0
.B0
1st le
vel b
ulle
t
R1
00
.G1
44
.B20
3
Ta
ble
co
lum
n
he
ad
ing
sh
ad
ing
R2
34
.G2
34
.B2
34
Connecto
r lines
Dk. d
ivid
er lin
e
128.G
128
.B12
8
Object Foundation
Ta
ble
hig
hlig
ht
R2
14
.G2
24
.B2
36
Slid
e title
s
R1
51
.G1
6.B
13
Obje
ct T
itles
Age
nd
a h
ighlig
ht
R6
0.G
92.B
17
0
Urbanization &
Infrastructure
Development
Critical stage for China‟s rapid urbanization to reach the level of moderately developed
countries. Increase in per capital income will lead to rapid domestic consumption growth.
Urbanization rate in China is expected to reach 54.7% by 2015. Growing at an average of
18.87mn, newly added urban population amounts to 94.35mn. Urbanization will drive an
increase in average living area by 566mn sq.m annually, creating a demand of 370,000
tons of aluminum for housing construction (assuming 30 sq.m of living area per capita);
350mn people will migrate to the cities by 2025.
China‟s total construction area amounts to 50bn sq.m, of which 10% needs to be
refurbished each year, demanding 3.3mn tons of aluminum products p.a.
36mn units of affordable housing to be developed in 5 years (10mn to be started in 2011),
generating a demand of 1.66mn tons of aluminum (assuming each unit is 70 sq.m. in size)
Transportation
Largest auto and rail transportation market in the world.
Auto production reached 18.26mn tons in 2010, with aluminum usage per vehicle of
127.5kg, which is 12% lower than that in US (145kg), and 13% lower than Japan and
Germany.
Auto production is expected to reach over 30mn vehicles by 2020. Assuming China‟s
aluminum usage per vehicle will reach the current level of developed countries (i.e. 150kg),
aluminum consumption of China‟s auto industry will amount to 4.5mn tons, almost doubling
that in 2010 (2.35mn tons).
Key industry trends in China
Substitute for
other metals
Aluminum replacing copper in the power industry and appliance production.
Replacing steel due to lighter weight (e.g. components in cars).
Solid underlying fundamentals to drive growth
Source: China Zhongjing
Others Growing aluminum demand by packaging industry (e.g. beverage packaging), accounting
for 4% of total processed aluminum in downstream markets.

Do not refresh this file
25
JP
M c
olo
r 1
R1
00
.G1
44
.B20
3
JP
M c
olo
r 2
R9
5.G
163
.B10
0
JP
M c
olo
r 3
R2
14
.G1
88
.B5
6
JP
M c
olo
r 4
R1
49
.G1
21
.B1
61
JP
M c
olo
r 5
R2
13
.G1
39
.B70
JP
M c
olo
r 7
R1
71
.G1
31
.B65
JP
M c
olo
r 6
R9
1.G
165
.B16
3
JP
M c
olo
r 8
Co
nc
lus
ion
R1
50
.G15
0.B
150
Hig
hlig
ht
R153.G
0.B
0
White
R2
55
.G2
55
.B25
5
2nd, 3
rd&
4th
leve
l Bulle
t
Lt. d
ivid
er lin
e
R1
92
.G1
92
.B19
2
Text
R0
.G0
.B0
1st le
vel b
ulle
t
R1
00
.G1
44
.B20
3
Ta
ble
co
lum
n
he
ad
ing
sh
ad
ing
R2
34
.G2
34
.B2
34
Connecto
r lines
Dk. d
ivid
er lin
e
128.G
128
.B12
8
Object Foundation
Ta
ble
hig
hlig
ht
R2
14
.G2
24
.B2
36
Slid
e title
s
R1
51
.G1
6.B
13
Obje
ct T
itles
Age
nd
a h
ighlig
ht
R6
0.G
92.B
17
0
Expanding production capacity and electricity production facilities
to further enhance market penetration and cost structure
产能扩张(万吨) Captive power plant production capacity expansion (MW)
New captive thermal power plant with capacity 1,320 (4 x 330) MW
Capex: approximately RMB4.6bn
Expected to increase self-sufficiency to approx. 65-70% based on
estimated electricity consumption requirement of 1,776ktpa aluminum
production capacity
New primary aluminum capacity of 300ktpa at Zoupin and Weiqiao
production base in 2H 2011
Aluminum downstream processing with capacity of 30ktpa at Binzhou
production base
Capex: approximately RMB3.8bn
Production capacity expansion (ktpa)
1,776
1,481
Jun 2011 End of 2011
2,400
1,740
1,080
Jun 2011. 2H 2011 2H 2012

Do not refresh this file
26
JP
M c
olo
r 1
R1
00
.G1
44
.B20
3
JP
M c
olo
r 2
R9
5.G
163
.B10
0
JP
M c
olo
r 3
R2
14
.G1
88
.B5
6
JP
M c
olo
r 4
R1
49
.G1
21
.B1
61
JP
M c
olo
r 5
R2
13
.G1
39
.B70
JP
M c
olo
r 7
R1
71
.G1
31
.B65
JP
M c
olo
r 6
R9
1.G
165
.B16
3
JP
M c
olo
r 8
Co
nc
lus
ion
R1
50
.G15
0.B
150
Hig
hlig
ht
R153.G
0.B
0
White
R2
55
.G2
55
.B25
5
2nd, 3
rd&
4th
leve
l Bulle
t
Lt. d
ivid
er lin
e
R1
92
.G1
92
.B19
2
Text
R0
.G0
.B0
1st le
vel b
ulle
t
R1
00
.G1
44
.B20
3
Ta
ble
co
lum
n
he
ad
ing
sh
ad
ing
R2
34
.G2
34
.B2
34
Connecto
r lines
Dk. d
ivid
er lin
e
128.G
128
.B12
8
Object Foundation
Ta
ble
hig
hlig
ht
R2
14
.G2
24
.B2
36
Slid
e title
s
R1
51
.G1
6.B
13
Obje
ct T
itles
Age
nd
a h
ighlig
ht
R6
0.G
92.B
17
0
Extending its reach into upstream and downstream markets
Generate plans to enter the upstream resources market (e.g. bauxite, alumina and coal), in
order to secure stable supply of raw materials
Further enhance profitability and market competitiveness by prudently extending into the
downstream market
Aluminum downstream processing is expected to commence in 2H 2012, with an aggregate
designed annual production capacity of 30,000 tons
Coal Alumina Bauxite Feedstock for
aluminum foil

Do not refresh this file
27
JP
M c
olo
r 1
R1
00
.G1
44
.B20
3
JP
M c
olo
r 2
R9
5.G
163
.B10
0
JP
M c
olo
r 3
R2
14
.G1
88
.B5
6
JP
M c
olo
r 4
R1
49
.G1
21
.B1
61
JP
M c
olo
r 5
R2
13
.G1
39
.B70
JP
M c
olo
r 7
R1
71
.G1
31
.B65
JP
M c
olo
r 6
R9
1.G
165
.B16
3
JP
M c
olo
r 8
Co
nc
lus
ion
R1
50
.G15
0.B
150
Hig
hlig
ht
R153.G
0.B
0
White
R2
55
.G2
55
.B25
5
2nd, 3
rd&
4th
leve
l Bulle
t
Lt. d
ivid
er lin
e
R1
92
.G1
92
.B19
2
Text
R0
.G0
.B0
1st le
vel b
ulle
t
R1
00
.G1
44
.B20
3
Ta
ble
co
lum
n
he
ad
ing
sh
ad
ing
R2
34
.G2
34
.B2
34
Connecto
r lines
Dk. d
ivid
er lin
e
128.G
128
.B12
8
Object Foundation
Ta
ble
hig
hlig
ht
R2
14
.G2
24
.B2
36
Slid
e title
s
R1
51
.G1
6.B
13
Obje
ct T
itles
Age
nd
a h
ighlig
ht
R6
0.G
92.B
17
0
Strategies
Increase market penetration
through capacity expansion
Optimize cost structure via
continuous R&D improvements
Extend into upstream and
downstream markets
1
3
4
CHQ mission:
To become the
strongest
manufacturer of
integrated
aluminum
products in China
Expand captive power plant to
enhance self-sufficiency and
stability of electricity
2

Do not refresh this file
28
JP
M c
olo
r 1
R1
00
.G1
44
.B20
3
JP
M c
olo
r 2
R9
5.G
163
.B10
0
JP
M c
olo
r 3
R2
14
.G1
88
.B5
6
JP
M c
olo
r 4
R1
49
.G1
21
.B1
61
JP
M c
olo
r 5
R2
13
.G1
39
.B70
JP
M c
olo
r 7
R1
71
.G1
31
.B65
JP
M c
olo
r 6
R9
1.G
165
.B16
3
JP
M c
olo
r 8
Co
nc
lus
ion
R1
50
.G15
0.B
150
Hig
hlig
ht
R153.G
0.B
0
White
R2
55
.G2
55
.B25
5
2nd, 3
rd&
4th
leve
l Bulle
t
Lt. d
ivid
er lin
e
R1
92
.G1
92
.B19
2
Text
R0
.G0
.B0
1st le
vel b
ulle
t
R1
00
.G1
44
.B20
3
Ta
ble
co
lum
n
he
ad
ing
sh
ad
ing
R2
34
.G2
34
.B2
34
Connecto
r lines
Dk. d
ivid
er lin
e
128.G
128
.B12
8
Object Foundation
Ta
ble
hig
hlig
ht
R2
14
.G2
24
.B2
36
Slid
e title
s
R1
51
.G1
6.B
13
Obje
ct T
itles
Age
nd
a h
ighlig
ht
R6
0.G
92.B
17
0
2. Financial Review
4. Operations Review
5. Future Plans
1. Major Achievements
6. Q&A
3. Industry Overview