pitt, c; grollman, c; martnez-lvarez, m; arregoces, l...
TRANSCRIPT
Pitt, C; Grollman, C; Martnez-lvarez, M; Arregoces, L; Lawn, JE;Borghi, J (2017) Countdown to 2015: an analysis of donor fundingfor prenatal and neonatal health, 2003-2013. BMJ global health, 2(2). e000205. ISSN 2059-7908 DOI: https://doi.org/10.1136/bmjgh-2016-000205
Downloaded from: http://researchonline.lshtm.ac.uk/3962273/
DOI: 10.1136/bmjgh-2016-000205
Usage Guidelines
Please refer to usage guidelines at http://researchonline.lshtm.ac.uk/policies.html or alterna-tively contact [email protected].
Available under license: http://creativecommons.org/licenses/by/2.5/

Countdown to 2015: an analysisof donor funding for prenataland neonatal health, 2003–2013
Catherine Pitt,1 Christopher Grollman,1 Melisa Martínez-Álvarez,1
Leonardo Arregoces,1 Joy E Lawn,2 Josephine Borghi1
To cite: Pitt C, Grollman C,Martínez-Álvarez M, et al.Countdown to 2015: ananalysis of donor funding forprenatal and neonatal health,2003–2013. BMJ GlobalHealth 2017;2:e000205.doi:10.1136/bmjgh-2016-000205
▸ Additional material ispublished online only. Toview please visit the journalonline (http://dx.doi.org/10.1136/bmjgh-2016-000205).
Received 5 October 2016Revised 5 January 2017Accepted 11 January 2017
1Department of Global Healthand Development, LondonSchool of Hygiene & TropicalMedicine, London, UK2Maternal, Adolescent,Reproductive, and ChildHealth (MARCH) Centre,London School of Hygiene &Tropical Medicine, London,UK
Correspondence toCatherine Pitt; [email protected]
ABSTRACTBackground: In 2015, 5.3 million babies died in thethird trimester of pregnancy and first month followingbirth. Progress in reducing neonatal mortality andstillbirth rates has lagged behind the substantialprogress in reducing postneonatal and maternalmortality rates. The benefits to prenatal and neonatalhealth (PNH) from maternal and child healthinvestments cannot be assumed.Methods: We analysed donor funding for PNH overthe period 2003–2013. We used an exhaustive keyterm search followed by manual review andclassification to identify official developmentassistance and private grant (ODA+)disbursement records in the Countdown to 2015ODA+ Database.Results: The value of ODA+ mentioning PNH or anactivity that would directly benefit PNH increasedfrom $105 million in 2003 to $1465 million in 2013,but this included a 3% decline between 2012 and2013. Projects exclusively benefitting PNH reachedjust $6 million in 2013. Records mentioning PNHaccounted for 3% of the $2708 million disbursed in2003 for maternal, newborn and child health(MNCH) and increased to 13% of the $9287 milliondisbursed for MNCH in 2013. In 11 years, only ninerecords ($6 million) mentioned stillbirth,miscarriage, or the fetus, although the two leadinginfectious causes of stillbirth were mentioned inrecords worth $832 million. The USA disbursed themost ODA+ mentioning PNH ($2848 million, 40% ofthe total) and Unicef disbursed the most ODA+exclusively benefitting PNH ($18 million, 30%).We found evidence that funding mentioning andexclusively benefitting PNH was targeted tocountries with greater economic needs, but theevidence of targeting to health needs was weak andinconsistent.Conclusions: Newborn health rose substantially onthe global agenda between 2003 and 2013, butprenatal health received minimal attention in donorfunding decisions. Declines in 2013 andpersistently low funding exclusively benefittingPNH indicate a need for caution andcontinued monitoring of donors’ support fornewborn health.
Key questions
What is already known about this topic?▸ Progress has been made in reducing the global
stillbirth rate and the neonatal mortality rate, buttheir average annual rates of reduction havelagged behind those for maternal mortality andfor under-5 child mortality.
▸ Previous analyses tracked donor funding fornewborns and stillbirth up to 2010 and brieflyreported on the 75 Countdown priority countriesup to 2012 and on stillbirths globally up to2013. They found increasing attention fornewborn health, but not stillbirths.
What are the new findings?▸ Using updated data sources and methods, we
found that funding mentioning prenatal and neo-natal health (PNH) from 52 donors to 156 recipi-ent countries increased substantially between2003 and 2013 in absolute terms and relative tofunding for maternal, newborn and child health(MNCH) as a whole. However, funding mention-ing PNH and exclusively benefitting PNHdecreased in 2013, even though funding forMNCH increased substantially. Funding exclu-sively benefitting PNH remained extremely low.
▸ The USA disbursed the most funding mention-ing PNH over the 11-year period ($2848 million,40%), followed by Canada ($1198 million, 17%)and the International Development Association(World Bank, $585 million, 8%). Unicef dis-bursed the most funding exclusively benefittingPNH ($18 million), followed by the USA ($15million) and Japan ($5 million).
▸ There was some evidence that funding was tar-geted to countries with greater health and eco-nomic need; however, other factors explainmuch of the substantial variation in fundingbetween recipient countries.
▸ Babies’ prenatal health was rarely mentioned infunding descriptions. Malaria in pregnancy andsyphilis were mentioned in funding worth $832million, but these projects rarely mentioned still-birth, even though programmes addressingthese diseases may make their greatest impactthrough stillbirth prevention.
Pitt C, et al. BMJ Glob Health 2017;2:e000205. doi:10.1136/bmjgh-2016-000205 1
Research
group.bmj.com on October 23, 2017 - Published by http://gh.bmj.com/Downloaded from

INTRODUCTIONIn 2015, 2.6 million babies were stillborn1 and a further2.7 million died as newborns in their first 28 days afterbirth.2 While progress has been made in reducing theglobal stillbirth rate (SBR) and the neonatal mortalityrate (NMR), their average annual rates of reductionhave lagged behind those for maternal mortality and forunder-5 child mortality, which were targeted in theMillennium Development Goals (MDGs). Between 2000and 2015, the maternal mortality ratio fell by 37%3 whilethe SBR, which is rarely measured in national statisticsand was omitted from the MDGs,4 is estimated to havefallen by a more modest 26%.1 Over the same period,the postneonatal mortality rate fell by 50%, while theNMR fell by 38%.2 By 2015, newborns accounted for45% of all deaths in children under 5.2 Beyond survival,the growing research field of life course epidemiologyhighlights proliferating evidence on the degree to whichfetal and neonatal health affects lifelong health out-comes, notably preventing disability, improving childdevelopment and reducing the risk of adult-onset non-communicable diseases.5 Promoting the health of babiesbefore, during, and in the first month after birth is there-fore an urgent global health challenge, which requiresspecific attention within the continuum of care andthe broader reproductive, maternal, and child healthagenda throughout the Sustainability Development Goals(SDG) era.4 6
Donor funding and attention may have been amongthe factors that contributed to the substantial declines inchild and maternal mortality.7 Between 2003 and 2013,donor funding for child health and for maternal andnewborn health increased by 286% and 164%, respect-ively.8 In many low-income and lower-middle-incomecountries, donor funding constitutes a substantialproportion of overall health spending.9 Even inupper-middle-income countries and others where domes-tic resources account for the vast majority of healthexpenditure, donor funding may catalyse efforts forissues that might otherwise receive little attention.Estimating the full value of aid that promotes a specifichealth priority is, however, challenging, because fundingdirected towards a specific disease or health systemchallenge will benefit various population groups, not all
of which would or could necessarily be described(let alone quantified) in reports of that funding. Thevalue of donor funding specifically mentioning particularissues can, however, serve as a quantitative metric ofchange in the status of issues on global policy agendas10
and can inform estimates of the minimum value of aidactually supporting a given health priority. Tracking thevalue of aid for health priorities is therefore importantfor holding governments and donors accountable, forassessing the degree to which specific health issues havegained or lost traction on the global agenda, and for indi-cating whether there may be a substantial mismatchbetween investment levels and burden of ill health.In this article, we analyse donor funding for prenatal
and neonatal health (PNH) over the period 2003–2013.Following Froen et al,11 we use the term ‘prenatalhealth’ to refer to the health of babies before andduring birth. Our analysis extends, updates and furtheranalyses previous work to track donor funding for new-borns and stillbirths, which we originally conducted forfunding up to 201012 and reported on briefly for the 75Countdown priority countries up to 201213 and globallyfor stillbirths up to 2013.11 In particular, this new analysisexplicitly includes neonatal health and stillbirth preven-tion, involves improved methods for identifying fundingmentioning PNH, accounts for unspecified recipientsand regional disbursements within country-specificestimates, and is applied to a larger, updated data set foran 11-year period. With these advances, we are now ableto better assess trends and the degree to which donoraid was targeted to need.14 We compare the value offunding mentioning PNH with estimates of the totalvalue of donor funding benefitting maternal, newbornand child health (MNCH) to indicate whether PNH hasgained or lost traction within MNCH and to providelower and upper bounds for estimates of the total valueof donor funding which may actually benefit PNH.Finally, we examine key themes within donors’ reportingof their funding mentioning PNH and focus particularlyon malaria and syphilis in pregnancy, which are leadinginfectious causes of miscarriage and stillbirth and con-tribute to poor neonatal health.1
METHODSData sourceWe identified disbursement records mentioning PNH ordirectly relevant activities in the Countdown to 2015ODA+ data set.8 15 This data set includes ‘official devel-opment assistance’ (ODA) and ‘private grants’, whichtogether we term ‘ODA+’. Other official flows wereexcluded. Records for the Countdown database wereobtained from the Organisation for EconomicCo-operation and Development’s (OECD) CreditorReporting System (CRS) aid activity database on 15January 2015 for the years 2003–2013 and from theVaccine Alliance (GAVI) on its disbursements between2003 and 2006, as the latter were missing from the CRS.15
Data cover disbursements from 31 high-income donor
Key questions
Recommendations for policy▸ Our findings support the importance of global goals for mobi-
lising resources and catalysing change. Implementation andmonitoring of the Every Newborn Action Plan and the neonataltarget within the Sustainable Development Goals (SDGs), aswell as more focus on stillbirths, which still have no SDGtarget, are essential.
▸ Effective mechanisms are needed to hold donors to accountfor high-quality, timely and transparent reporting, and toensure that data systems are available to support this.
2 Pitt C, et al. BMJ Glob Health 2017;2:e000205. doi:10.1136/bmjgh-2016-000205
BMJ Global Health
group.bmj.com on October 23, 2017 - Published by http://gh.bmj.com/Downloaded from

countries, 20 multilateral institutions, two global healthinitiatives (GHIs), and one private foundation to 156recipient countries. Each record contains data on theyear, donor, recipient and value of the disbursement, aswell as the project title and short and long descriptionsof the funded activities. The database avoids double-counting by excluding donor countries’ core contribu-tions to multilaterals (only counting these funds at thetime they are disbursed for specific activities by the mul-tilaterals) and by attributing donor country funding fora specified project to that donor, even if a multilateralagency is contracted to deliver the project. TheCountdown coded each of these records according to anactivity-based framework to assess the value of non-research funding for reproductive health, for maternaland newborn health, and for child health. These cat-egories also allow assessment of the value of MNCH andof reproductive, maternal, newborn and child health(RMNCH) as a whole.
Data codingWe identified records mentioning PNH in the entireCountdown data set using an exhaustive key term searchfollowed by manual review and classification of identi-fied records. We sought to include funding that men-tioned the health of the newborn or fetus, or thatsupported interventions in pregnancy or in the first4 weeks of life that are proven to improve or maintainthe health of the baby before, during, or in the first28 days following birth. In a previous analysis, we devel-oped key terms by reviewing scientific literature; generat-ing a list of general terms, conditions and diseases, andinterventions or programmes meeting our criteria; andthen carefully refining our terms.12 For example, wesought to include funding mentioning stillbirth, new-borns, breastfeeding, or malaria or syphilis in pregnancy,but to exclude funding for antenatal or obstetric careunless it specifically mentioned the baby or PNH inter-ventions. For this analysis, we revised and expanded theprevious set of key terms to increase the sensitivity ofour search. We conducted the search in Microsoft SQLServer Management Studio (Microsoft Corporation,2014) using 135 search terms in seven languages(English, French, Dutch, Spanish, Portuguese, Italian,German), and classified each term within a theme (webtable 1). We identified those of the 2.1 million recordsin the Countdown database containing at least one ofour search terms in the project title, short description orlong description fields reported by donors.We exported the subset of records identified by the
key terms to Excel for review and classification. Recordswith a blank or zero disbursement value were excluded.CP and CG read and individually coded the remainingrecords. First, records that were misclassified (as they didnot in any way support or mention prenatal or neonatalhealth) were removed. Second, records were categorisedas supporting either (1) non-research or, (2) researchactivities; this categorisation was made to allow direct
comparisons with the Countdown estimates of ODA+ forRMNCH, which excludes research funding. As the CRSdatabase is a very incomplete source of data on researchfunding, only those findings regarding non-researchfunding are presented. Third, records were classified aseither (1) exclusively benefiting PNH, or (2) also bene-fiting other population groups, such as mothers or chil-dren older than 1 month. The purpose of thiscategorisation was to examine the degree of integrationof PNH funding within the continuum of care16 and toidentify the minimum value of funding that could beexpected to benefit PNH in practice; both categories arepresented in the analysis.
Data analysisWe present our findings in constant 2013 US$ and assesstrends over the 11-year period. We examined variationin funding mentioning PNH over the 11-year period bydonor and recipient country. For our main analyses, wepresent the full disbursement value of all relevantrecords mentioning PNH and do not make assumptionsabout the share of funding actually benefiting PNH. Weattribute the value of regional and unspecified bilateraldisbursements for PNH to recipient countries in propor-tion to their receipt of country-specific funding for PNHover the entire 2003–2013 period. We present disburse-ments for each year in total and disaggregated bywhether the funding exclusively benefitted PNH or alsobenefitted other population groups.We then compare our findings to the Countdown esti-
mates of MNCH funding. Unlike our assessment ofPNH, Countdown applied a set of disbursement rules todetermine the proportion (0–100%) of the value ofeach record considered to support MNCH.8 15 As aresult, for each record mentioning PNH, either the fullvalue of the disbursement or only part of the value ofthe disbursement may be counted towards theCountdown’s estimates of funding for MNCH.8
To explore the descriptions of funding mentioningPNH, we classify each record mentioning PNH into atleast one of 16 themes, which reflect selected PNH inter-ventions, target populations and causes of ill health.2 Weassigned records to themes using our main SQL searchterms as well as a few additional search terms in Excel(web table 1).To assess the degree of targeting to recipient coun-
tries’ need, we produced scatter plots and conductedordinary least squares regressions. For the scatter plots,we compared total PNH funding and average fundingper live birth over the entire 2003–2013 period with theNMR for the 143 of 156 recipient countries for whichNMR17 and World Bank income group data18 were avail-able. We conducted these analyses for all funding men-tioning PNH and for funding exclusively benefittingPNH. We used NMR data17 for 2008 as the independentvariable because the vast majority of PNH funding wasdisbursed after this date (as we will show), and so wetake these data to reflect the information donors had
Pitt C, et al. BMJ Glob Health 2017;2:e000205. doi:10.1136/bmjgh-2016-000205 3
BMJ Global Health
group.bmj.com on October 23, 2017 - Published by http://gh.bmj.com/Downloaded from

regarding health needs at the time of most of theirfunding decisions regarding PNH. To estimate averagefunding per birth over the 11-year period, we dividedthe total ODA+ for PNH received by each country ineach year by the total number of live births19 in thatcountry in the same year and then calculated the meanof these ratios over the 11-year period for each country.To illustrate recipient countries’ economic needs or cap-acity to address their own health challenges, we colour-coded each data point by World Bank income group.18
With our linear regression models, we sought to deter-mine the degree to which health need (NMR in200817), economic need (natural logarithm of 2008 percapita gross domestic product (GDP)18), and the inter-action of these two measures explained variation in ourdependent variable, the natural logarithm of cumulativePNH funding over 2003–2013. We specified four modelswith the outcome defined as the natural logarithm of:total ODA+ mentioning PNH, ODA+ mentioning PNHper live birth, total ODA+ exclusively benefitting PNHand ODA+ exclusively benefitting PNH per live birth.19
Both explanatory variables were centred by subtractingthe mean value from all observations to facilitate inter-pretation. We conducted the analyses for the countriesin our data set (n=156) for which NMR (n=146), percapita GDP (n=140), and live birth data (if needed)(n=122) were available and for which the specifiedoutcome variable was >0 before the logarithmic trans-formation. We repeated the analyses of funding perbirth for the countries within this set with median popu-lations >250 000 over the period to check whetherextremely small countries, all of which received relativelymodest absolute levels of funding, affected the observedfindings. We also repeated the analyses excludingextreme outliers. To check the appropriateness of ourvariable transformations, we repeated the analyseswithout the logarithmic transformations of per capitaGDP and of the outcome variables and also by adding avalue of one to all outcome values before the logarith-mic transformations so as to allow inclusion in themodels of countries which received no PNH funding. Asall models displayed heteroscedasticity, we usedHuber-White estimators to generate robust SEs; othermodel diagnostics were acceptable. The degree of target-ing to need was assessed based on the sign and signifi-cance of the coefficients on the independent variablesand the R2 value for each model.
RESULTSOf the 2.1 million records in the Countdown database,15 062 were identified by our searches as potentiallyrelevant to PNH. After removing 2957 records withblank or zero disbursement values, 955 that were mis-classified and 398 supporting PNH research activities,10 752 non-research records mentioning PNH remainedfor analysis.
The annual value of ODA+ mentioning PNH or anactivity that would directly benefit PNH increased morethan 14-fold from $105 million in 2003 to $1465million in 2013 (constant 2013 US$, figure 1A, webtable 2). ODA+ for PNH increased in every year until2012 and more than doubled from $708 million in2009 to a high of $1506 million in 2012, but declinedby 3% in 2013.Almost all ODA+ mentioning PNH also benefitted
other population groups; <1% exclusively benefittedPNH over the period and this proportion fell from over2% in 2003 to <0.5% in 2013. ODA+ exclusively benefit-ting PNH tripled from just $2 million in 2003 to $6million in 2013 (figure 1, web table 2). In 2010, thisODA+ exclusively benefitting PNH hit a high of over $11million, but decreased to $5 million, $7 million and $6million in the subsequent 3 years.In figure 1B, we examine ODA+ mentioning and
exclusively benefiting PNH within ODA+ for MNCH,which was estimated to have increased nearly 2.5-foldfrom $2708 million in 2003 to $9287 million in 2013.8
As ODA+ exclusively benefitting PNH represented just0.09% of ODA+ for MNCH over the whole period, it isbarely visible in the figure. In contrast, records mention-ing PNH and benefitting others accounted for 9% ofthe total value of aid to MNCH over the period, andincreased from 3% in 2003 to 13% in 2013. The value ofODA+ for MNCH that mentioned PNH increased15-fold between 2003 and 2013, much faster than the2.5-fold increase in ODA+ for MNCH as a whole. Bothvalues increased in every year from 2003 to 2012;however, from 2012 to 2013 ODA+ for MNCH increasedby a further 14%, while the value of ODA+ for MNCHthat mentioned PNH fell by 13%. Funding for PNH forthe 75 Countdown priority countries showed a similartrend, with an 18-fold increase overall, but a 20-foldincrease between 2003 and 2012 and a 9% dropbetween 2012 and 2013.Most ODA+ mentioning PNH did not contain any key
terms allowing more precise classification of the specificactivities, health conditions or level(s) of the healthsystem targeted. (Table 2) More than three-quarters ofODA+ mentioning PNH included generic terms relatedto newborns, such as ‘neonatal’. Terms specific to breast-feeding were used in descriptions for 12% of the valueof ODA+ for PNH; most of these were funded throughUnicef and did not mention a specific focus on early,exclusive breastfeeding, which would benefit newborns.Of the 1423 records mentioning breastfeeding, 64(valued at $15 million across the period) focused exclu-sively on newborns and mentioned breastfeeding along-side other activities specifically for the newborn. Termsrelated to neonatal tetanus prevention ($284 million,4.0%), neonatal resuscitation ($40 million, 0.6%), birthweight ($32 million, 0.5%), preterm birth ($20 million,0.3%) and umbilical cord care ($15 million, 0.2%) werealso mentioned in PNH funding descriptions across the11 years.
4 Pitt C, et al. BMJ Glob Health 2017;2:e000205. doi:10.1136/bmjgh-2016-000205
BMJ Global Health
group.bmj.com on October 23, 2017 - Published by http://gh.bmj.com/Downloaded from

Figure 1 ODA+ for prenatal and neonatal health, 2003–2013, from 54 donors to 156 recipient countries. (A) Presents the full
disbursement value of non-research ODA+ mentioning PNH, broken down by whether the funding exclusively benefitted PNH or
also benefitted other population groups. It also illustrates how the funding mentioning PNH was categorised within the
Countdown framework for estimating the value of funding for maternal, newborn and child health (MNCH). For each record
mentioning PNH, between 0% and 100% of the full value of the disbursement may be counted towards the Countdown’s
estimates of funding for ‘maternal and newborn health’ (MNH) or ‘child health’. (B) presents ODA+ for MNCH based on estimates
produced by the Countdown to 2015;8 within these estimates are highlighted the value of funding from records which exclusively
benefitted PNH and those which mention PNH but also benefit others. ODA+, official development assistance plus private grants;
PNH, prenatal and neonatal health.
Pitt C, et al. BMJ Glob Health 2017;2:e000205. doi:10.1136/bmjgh-2016-000205 5
BMJ Global Health
group.bmj.com on October 23, 2017 - Published by http://gh.bmj.com/Downloaded from

Among the records analysed, only two, valued at $3million, directly mentioned stillbirth or related terms inits descriptions (table 1). Another project, valued at$24,000 mentioned miscarriage. The fetus was men-tioned in six records valued at $3 million. In contrast,malaria in pregnancy, which accounts for 8.2% of allstillbirths (∼220 000 per year) and is the leading causeof stillbirths in sub-Saharan Africa,1 was mentioned inprojects worth $800 million globally. While all projectsmentioning malaria in pregnancy were included inour estimate of ODA+ for PNH, none explicitly men-tioned stillbirth, miscarriage or the fetus. Only 38 pro-jects, valued at $31 million, mentioned syphilis, whichaccounts for 7.7% of global stillbirths; of these, 10also mentioned newborns, although none mentionedstillbirth, miscarriage or the fetus, even though earlyfetal deaths and stillbirths from syphilis outnumberneonatal deaths from syphilis by more than two toone.20
Over the 11-year period, two donors togetheraccounted for 56% of all ODA+ mentioning PNH: theUSA ($2848 million, 40%) and Canada ($1198 million,
17%). They were followed by the World Bank’sInternational Development Association (IDA, $585million, 8%), the Global Fund ($522 million, 7%) andthe UK ($453 million, 6%) (table 2). The leadingdonors of ODA+ exclusively benefitting PNH wereUnicef ($18 million, 30%), the USA ($15 million, 25%),Japan ($5 million, 8%) and the UK ($4 million, 6%).All ODA from Canada, the IDA and the Global Fundthat mentioned PNH supported activities that would alsobenefit other population groups, as did 99% of ODAfrom the UK and the USA. Canada provided nearly allof its funding mentioning PNH in 2011–2013, when itdisbursed $301 million, $282 million and $286 million,respectively. The UK’s funding increased substantially in2012 and 2013, when it disbursed $180 million and$132 million, respectively. Together, bilateral donorsaccounted for 66% of ODA+ exclusively benefittingPNH and 74% of funding also benefitting others. TheUK, Sweden and Australia all substantially increasedtheir ODA+ mentioning PNH in 2012 but thendecreased their funding in 2013 by a combined total of$107 million, which more than accounted for the
Table 1 Funding for prenatal and neonatal health (PNH) by thematic area, 2003–2013
Theme
Exclusively benefits PNH Mentions PNH and others Total mentioning PNH
Number of
records Value
Per
cent
Number of
records Value
Per
cent
Number of
records Value
Per
cent
Newborn (generic) 524 53.6 91 8280 5426.0 76 8804 5479.6 76
Breastfeeding 64 14.7 25 1359 859.9 12 1423 874.5 12
Malaria in
pregnancy
0 0.0 0 498 800.3 11 498 800.3 11
MNCH 0 0.0 0 305 550.0 8 305 550.0 8
Neonatal tetanus 2 0.6 1 346 283.2 4 348 283.8 4
Postnatal (generic) 0 0.0 0 325 251.6 4 325 251.6 4
Perinatal (generic) 14 5.1 9 169 130.8 2 183 135.9 2
Neonatal
resuscitation
64 14.7 25 21 24.8 0 85 39.5 1
Birth weight 63 14.7 25 40 17.7 0 103 32.4 0
Syphilis 0 0.0 0 38 31.5 0 38 31.5 0
Preterm birth 71 15.5 26 9 4.7 0 80 20.2 0
Umbilical cord 64 14.9 25 3 0.1 0 67 15.0 0
Fetus (generic) 2 0.2 0 4 2.7 0 6 2.9 0
Stillbirth 1 0.5 1 1 2.4 0 2 2.9 0
Kangaroo mother
care
0 0.0 0 2 1.2 0 2 1.2 0
Birth asphyxia 0 0.0 0 0 0.0 0 0 0.0 0
Jaundice 0 0.0 0 0 0.0 0 0 0.0 0
Miscarriage 0 0.0 0 1 0.0 0 1 0.0 0
Total 539 58.8 100 10 213 7116.7 100 10 752 7175.5 100
Total value of funding (constant 2013 US$ millions) provided over the period 2003–2013. Themes are not mutually exclusive, so columns sumto more than 100%. Search terms used to classify records into themes are provided in web table 1.MNCH, maternal, newborn and child health (this category reflects those projects identified by this abbreviation or its equivalent in otherlanguages).
6 Pitt C, et al. BMJ Glob Health 2017;2:e000205. doi:10.1136/bmjgh-2016-000205
BMJ Global Health
group.bmj.com on October 23, 2017 - Published by http://gh.bmj.com/Downloaded from
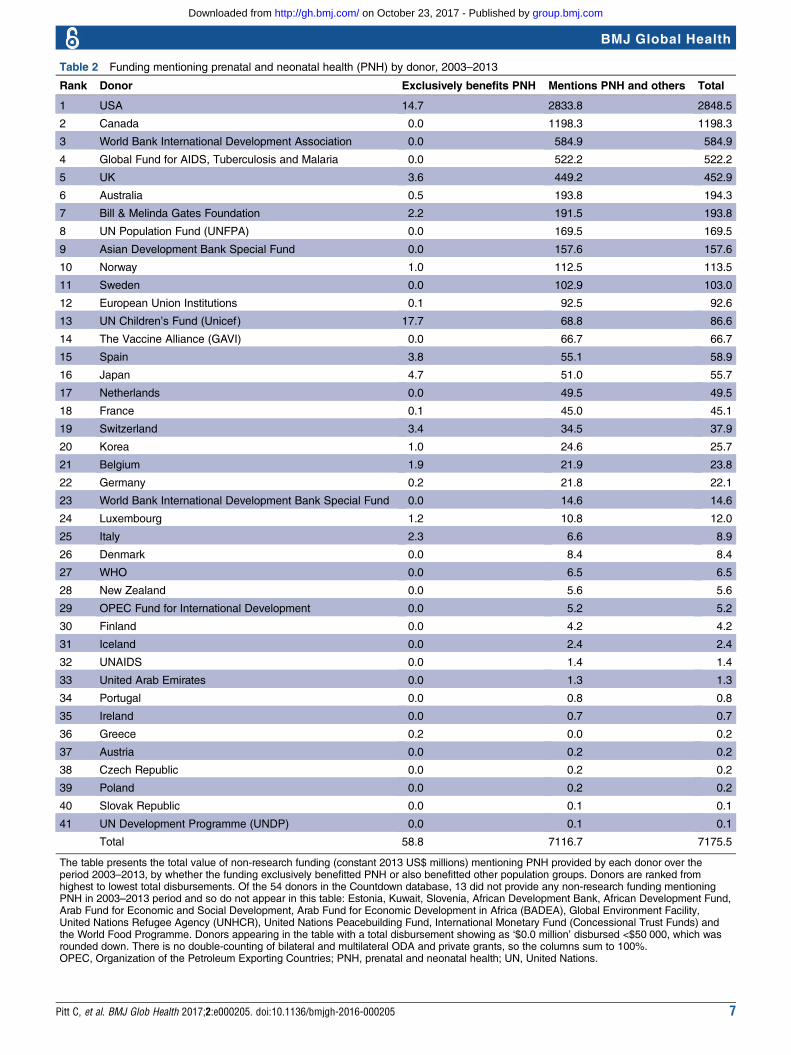
Table 2 Funding mentioning prenatal and neonatal health (PNH) by donor, 2003–2013
Rank Donor Exclusively benefits PNH Mentions PNH and others Total
1 USA 14.7 2833.8 2848.5
2 Canada 0.0 1198.3 1198.3
3 World Bank International Development Association 0.0 584.9 584.9
4 Global Fund for AIDS, Tuberculosis and Malaria 0.0 522.2 522.2
5 UK 3.6 449.2 452.9
6 Australia 0.5 193.8 194.3
7 Bill & Melinda Gates Foundation 2.2 191.5 193.8
8 UN Population Fund (UNFPA) 0.0 169.5 169.5
9 Asian Development Bank Special Fund 0.0 157.6 157.6
10 Norway 1.0 112.5 113.5
11 Sweden 0.0 102.9 103.0
12 European Union Institutions 0.1 92.5 92.6
13 UN Children’s Fund (Unicef) 17.7 68.8 86.6
14 The Vaccine Alliance (GAVI) 0.0 66.7 66.7
15 Spain 3.8 55.1 58.9
16 Japan 4.7 51.0 55.7
17 Netherlands 0.0 49.5 49.5
18 France 0.1 45.0 45.1
19 Switzerland 3.4 34.5 37.9
20 Korea 1.0 24.6 25.7
21 Belgium 1.9 21.9 23.8
22 Germany 0.2 21.8 22.1
23 World Bank International Development Bank Special Fund 0.0 14.6 14.6
24 Luxembourg 1.2 10.8 12.0
25 Italy 2.3 6.6 8.9
26 Denmark 0.0 8.4 8.4
27 WHO 0.0 6.5 6.5
28 New Zealand 0.0 5.6 5.6
29 OPEC Fund for International Development 0.0 5.2 5.2
30 Finland 0.0 4.2 4.2
31 Iceland 0.0 2.4 2.4
32 UNAIDS 0.0 1.4 1.4
33 United Arab Emirates 0.0 1.3 1.3
34 Portugal 0.0 0.8 0.8
35 Ireland 0.0 0.7 0.7
36 Greece 0.2 0.0 0.2
37 Austria 0.0 0.2 0.2
38 Czech Republic 0.0 0.2 0.2
39 Poland 0.0 0.2 0.2
40 Slovak Republic 0.0 0.1 0.1
41 UN Development Programme (UNDP) 0.0 0.1 0.1
Total 58.8 7116.7 7175.5
The table presents the total value of non-research funding (constant 2013 US$ millions) mentioning PNH provided by each donor over theperiod 2003–2013, by whether the funding exclusively benefitted PNH or also benefitted other population groups. Donors are ranked fromhighest to lowest total disbursements. Of the 54 donors in the Countdown database, 13 did not provide any non-research funding mentioningPNH in 2003–2013 period and so do not appear in this table: Estonia, Kuwait, Slovenia, African Development Bank, African Development Fund,Arab Fund for Economic and Social Development, Arab Fund for Economic Development in Africa (BADEA), Global Environment Facility,United Nations Refugee Agency (UNHCR), United Nations Peacebuilding Fund, International Monetary Fund (Concessional Trust Funds) andthe World Food Programme. Donors appearing in the table with a total disbursement showing as ‘$0.0 million’ disbursed <$50 000, which wasrounded down. There is no double-counting of bilateral and multilateral ODA and private grants, so the columns sum to 100%.OPEC, Organization of the Petroleum Exporting Countries; PNH, prenatal and neonatal health; UN, United Nations.
Pitt C, et al. BMJ Glob Health 2017;2:e000205. doi:10.1136/bmjgh-2016-000205 7
BMJ Global Health
group.bmj.com on October 23, 2017 - Published by http://gh.bmj.com/Downloaded from

overall $40 million decline in ODA+ mentioning PNHin 2013.Funding for PNH also varied substantially by recipi-
ent country (figures 2 and 3, web tables 3 and 4). All156 recipient countries in the Countdown ODA+ data-base received funding supporting MNCH, while 125received ODA+ mentioning PNH and 100 receivedfunding exclusively benefitting PNH. The 75Countdown priority countries together received 91% ofall ODA+ for PNH and this proportion remained rela-tively consistent over the period. The recipients of themost ODA+ mentioning PNH were Afghanistan ($667million including regional allocations), Pakistan ($572million), Bangladesh ($375 million), Ethiopia ($364million) and India ($356 million). Taking populationsizes into account, the leading recipients of ODA+ for
PNH per birth tended to be much smaller countries:Belize ($131 per birth), Fiji ($99 per birth), Haiti ($68per birth), Zimbabwe ($60 per birth), Afghanistan ($60per birth) and Nicaragua ($58 per birth). Indiareceived $8 million in ODA+ exclusively benefittingPNH, followed by Mozambique ($4.3 million), Pakistan($3.7 million) and Mali ($3.4 million); only 14 coun-tries received more than $1 million for projects exclu-sively benefitting PNH across the period. With $1.08per birth, the West Bank and Gaza Strip received thelargest volume of funding exclusively benefitting PNH,but could not be included in our scatter plots or regres-sions because NMR data was unavailable. It was fol-lowed by Laos ($0.62 per birth), Ukraine ($0.60 perbirth), Uruguay ($0.58 per birth) and Mali ($0.46 perbirth).
Figure 2 Maps: Variation by recipient country in ODA+ mentioning PNH in total and per live birth, 2003–2013. (A) Presents
variation in total ODA+ mentioning PNH by recipient country. (B) Presents variation in ODA+ mentioning PNH per birth by
recipient country. Data are presented in constant 2013 US$ and were prepared in ArcGIS V.10.3. ODA+, official development
assistance plus private grants; PNH, prenatal and neonatal health.
8 Pitt C, et al. BMJ Glob Health 2017;2:e000205. doi:10.1136/bmjgh-2016-000205
BMJ Global Health
group.bmj.com on October 23, 2017 - Published by http://gh.bmj.com/Downloaded from
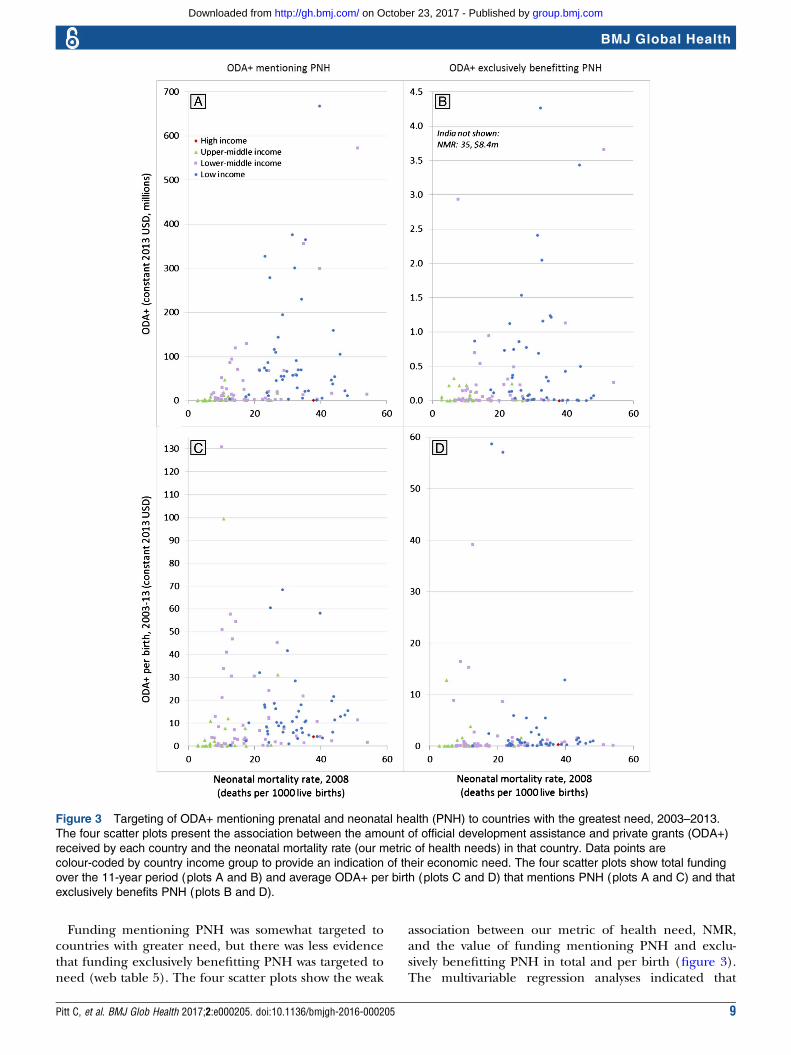
Funding mentioning PNH was somewhat targeted tocountries with greater need, but there was less evidencethat funding exclusively benefitting PNH was targeted toneed (web table 5). The four scatter plots show the weak
association between our metric of health need, NMR,and the value of funding mentioning PNH and exclu-sively benefitting PNH in total and per birth (figure 3).The multivariable regression analyses indicated that
Figure 3 Targeting of ODA+ mentioning prenatal and neonatal health (PNH) to countries with the greatest need, 2003–2013.
The four scatter plots present the association between the amount of official development assistance and private grants (ODA+)
received by each country and the neonatal mortality rate (our metric of health needs) in that country. Data points are
colour-coded by country income group to provide an indication of their economic need. The four scatter plots show total funding
over the 11-year period (plots A and B) and average ODA+ per birth (plots C and D) that mentions PNH (plots A and C) and that
exclusively benefits PNH (plots B and D).
Pitt C, et al. BMJ Glob Health 2017;2:e000205. doi:10.1136/bmjgh-2016-000205 9
BMJ Global Health
group.bmj.com on October 23, 2017 - Published by http://gh.bmj.com/Downloaded from
countries with lower per capita GDP and higher NMRtended to receive more ODA+ mentioning PNH;however, while the negative relationship with per capitaGDP was strongly significant in the total ODA+(p<0.001) and per birth (p<0.001) models, the positiverelationship with NMR was only weakly significant in theper birth model (p=0.058) and not significant in thetotal ODA+ model (p=0.107). Both models demon-strated high goodness of fit, although total ODA+ men-tioning PNH appeared better targeted to health andeconomic need (R2=0.47) than ODA+ per birth(R2=0.35). For funding exclusively benefiting PNH,there was less evidence of targeting to need: the negativeassociation with per capita GDP was strong in both thetotal ODA+ model (p=0.021) and the per birth model(p<0.001), but the association with NMR was not signifi-cant and negative in the total ODA+ model (p=0.664)and weak and positive in the per birth model (p=0.054).The goodness of fit was poor in the total ODA+ model(R2=0.08) but reasonable in the per birth model(R2=0.29) and both were lower than in the models ofODA+ mentioning PNH. When we reran the analysesunder alternative model specifications, the significant,negative relationship with per capita GDP remained inall models, as did the lack of significant relationshipbetween NMR and total ODA+ mentioning or exclu-sively benefitting PNH; however, some specifications ofthe per birth models indicated a moderately significant,positive relationship with NMR while other specificationsindicated that the relationship was not significant (webtable 5).
DISCUSSIONWe found substantial increases in the value of donorfunding mentioning PNH between 2003 and 2013 inabsolute terms and relative to funding for MNCH as awhole. We interpret these findings as reflecting a sub-stantial rise in attention for newborn health on theglobal agenda, particularly from 2008. Nonetheless,funding exclusively benefitting PNH remained extremelylow, reaching just $6 million in 2013 of a total of morethan $9 billion disbursed for MNCH. From 2012 to2013, funding mentioning PNH and exclusively benefit-ting PNH decreased, even though funding for MNCHincreased by 14%. The USA and Canada provided overhalf of funding mentioning PNH over the period; withthe rise to power of Donald Trump and the departure ofPrime Minister Stephen Harper, who personally cham-pioned RMNCH within the G8, this funding may besubject to political changes. We argue that these findingsindicate a need for caution and continued monitoringof donors’ support for newborn health. Consistent withprevious findings,11 12 we found that prenatal health,including stillbirth, continued to receive minimal atten-tion in donors’ descriptions of their programmaticfunding relative to its burden. Some donors have expli-citly prioritised PNH to a greater extent than others; the
list of leading donors mentioning PNH in their fundingrecords shares commonalities with, but is by no meansthe same as, the leading donors for RMNCH as awhole.8 Canada, in particular, is much more highlyranked for PNH funding than for overall RMNCHfunding, although none of its funding exclusively bene-fited newborn health and stillbirth prevention. MostCountdown priority countries received <$1 million infunding even mentioning PNH across the entire 11-yearperiod. We found evidence of targeting of funds men-tioning PNH to countries with lower GDP per capita,but there was inconsistent evidence of targeting basedon NMR, and less evidence that funding exclusivelybenefitting newborns was targeted to need.The actual value of funding that ultimately benefits
PNH could be nearly as low as the value of fundingexclusively benefitting PNH ($6 million in 2013) ornearly as high as the value of funding benefittingMNCH as a whole ($9287 million in 2013). While muchof the funding for maternal health could and shouldalso benefit PNH even if PNH is not mentioned directly,the slower progress in reducing neonatal mortality andstillbirth rates relative to postneonatal and maternal mor-tality indicates that the benefits to PNH from maternaland particularly from child health funding cannot beassumed.6 Funding focused on PNH may therefore playan important role in ensuring that the 5.3 million still-births and neonatal deaths receive due attention withinprogrammes. Funding mentioning PNH that is alsointended to benefit other population groups may bemore likely to benefit PNH than maternal and childhealth programmes which do not mention PNH, butthis is not clear, especially for those where the mentionis just part of the term ‘maternal, newborn and childhealth’. In practice, it is uncertain whether babies actu-ally benefit from maternal and child health programmesand even wider primary healthcare, hospital and healthsystems support, regardless of whether PNH is men-tioned in funding summaries. In some programmes,implementers may be able to influence the focus ofbroader investments, but in others, such as large immun-isation programmes, the investments are very fixed. Forexample, even investments in care at birth or more mid-wives would not necessarily reduce stillbirths or neonataldeaths if key skills or equipment, such as fetal monitor-ing during labour and neonatal resuscitation are notincluded. Conversely, programmes addressing malaria orsyphilis in pregnancy rarely mention stillbirths and yetmay make their greatest impact through stillbirth pre-vention. We also have no information on the relative effi-ciency with which funds are used and translated intopopulation-level benefits in different settings and overtime.While we found an 18-fold increase in the value of
MNCH funding mentioning PNH between 2003 and2012 for the Countdown priority countries, this is onlyhalf the 34-fold increase previously reported for thesame period.13 In contrast, we found a 10-fold increase
10 Pitt C, et al. BMJ Glob Health 2017;2:e000205. doi:10.1136/bmjgh-2016-000205
BMJ Global Health
group.bmj.com on October 23, 2017 - Published by http://gh.bmj.com/Downloaded from

in the total value of funding mentioning PNH for allrecipients between 2003 and 2010, which is slightlyhigher than the nearly ninefold increase previouslyreported for that period.12 Most of the changes in ourestimates from those previously published reflect donorsadding retrospective data, which led to increases in theirfunding estimates for past years. Several of our methodo-logical improvements, notably our inclusion of a relevantproportion of regional and unspecified funding withincountry-specific estimates, led to increases relative toprevious estimates; however, the effects of these changeswere eclipsed by donors’ retrospective amendments totheir data. While such amendments should be encour-aged, they underscore the importance of holdingdonors to account for high-quality, timely and transpar-ent reporting21 and of ensuring that data systems areavailable to support this.The CRS database—on which the Countdown to
2015 ODA+ is based—has several advantages, includingits consistent and comparable reporting framework,which avoids double-counting of funds disbursed fromcountries to multilateral institutions and global healthinitiatives, as well as the fact that the donors themselvesreport and agree all funding reported. Nonetheless,the CRS also has a number of disadvantages, notablythe lack of reports from China, Brazil, some otherdonor countries, and all but one private foundation,and its sector and purpose code classification system,which does not facilitate the identification of fundingfor different types of health activities, beneficiarygroups, or health conditions, such as PNH.12 Ourapproach of first implementing a sensitive key termsearch and then individually reading and coding pro-jects for this analysis was both efficient and, we believe,a reasonably accurate and precise method for max-imally exploiting the available data and overcomingsome of the serious limitations of the sector andpurpose code framework in the CRS database. Suchcombinations of automated and human coding couldprove a useful approach to enable aid tracking for spe-cific issues and should be considered as new mechan-isms are established to hold donors accountable fortheir obligations and commitments in the SDG era.22
These findings must therefore be interpreted with thecaveats given; however, they have important policy impli-cations. Our findings build on our past analyses,12 13
providing further quantitative evidence of the rise ofnewborn health on the global agenda, and the contin-ued neglect of stillbirths and prenatal health in pro-grammatic funding more generally.4 11 Future researchshould examine why some countries receive so muchmore funding mentioning PNH than others andwhether differences in funding descriptions are asso-ciated with differences in programme implementation.We argue that our findings support the importance ofglobal goals for mobilising resources and attention andcatalysing change. Implementation and monitoring ofthe Every Newborn Action Plan23 and the neonatal
target within the SDGs, as well as more focus on still-births, which still have no SDG target, are essential,4
especially in light of the apparent reductions in 2013.
Handling editor Douglas Noble.
Contributors CP and JEL conceived the analysis. CG conducted the search inthe full Countdown to 2015 ODA+ database to identify records mentioningPNH. CP and CG coded the data. CP analysed the data, wrote the paper and isthe guarantor. CP, CG, MM-A, LA, JEL and JB contributed to theinterpretation of the data, critically revised the manuscript for importantintellectual content, gave final approval of the version to be published andhave contributed to the manuscript.
Funding This work was funded through a subgrant from the US Fund forUnicef under their Countdown to 2015 for Maternal, Newborn and ChildSurvival Grant (#OPP1058954) from the Bill and Melinda Gates Foundation.
Disclaimer The funder had no influence on the study design; the collection,analysis, and interpretation of data; the writing of the report; or the decisionto submit the article for publication.
Competing interests None declared.
Provenance and peer review Not commissioned; externally peer reviewed.
Data sharing statement The Countdown to 2015 ODA+ Database, includingthe coding of records mentioning and exclusively benefitting PNH, is publiclyavailable at http://datacompass.lshtm.ac.uk/320/ (DOI: http://dx.doi.org/10.17037/DATA.127).
Transparency The lead author affirms that the manuscript is an honest,accurate and transparent account of the study being reported; that noimportant aspects of the study have been omitted; and that any discrepanciesfrom the study as planned have been explained.
Open Access This is an Open Access article distributed in accordance withthe terms of the Creative Commons Attribution (CC BY 4.0) license, whichpermits others to distribute, remix, adapt and build upon this work, forcommercial use, provided the original work is properly cited. See: http://creativecommons.org/licenses/by/4.0/
REFERENCES1. Lawn JE, Blencowe H, Waiswa P, et al. Stillbirths: rates, risk factors,
and acceleration towards 2030. Lancet 2016;387:587–603.2. You D, Hug L, Ejdemyr S, et al. Global, regional, and national levels
and trends in under-5 mortality between 1990 and 2015, withscenario-based projections to 2030: a systematic analysis by the UNInter-agency Group for Child Mortality Estimation. Lancet2015;386:2275–86.
3. Alkema L, Chou D, Hogan D, et al. Global, regional, and nationallevels and trends in maternal mortality between 1990 and 2015, withscenario-based projections to 2030: a systematic analysis by the UNMaternal Mortality Estimation Inter-Agency Group. Lancet2016;387:462–74.
4. Qureshi ZU, Millum J, Blencowe H, et al. Stillbirth should be givengreater priority on the global health agenda. BMJ 2015;351:h4620.
5. Gluckman PD, Hanson MA. Living with the past: evolution,development, and patterns of disease. Science 2004;305:1733–6.
6. Starrs AM. Survival convergence: bringing maternal and newbornhealth together for 2015 and beyond. Lancet 2014;384:211–3.
7. Moucheraud C, Owen H, Singh N, et al. Countdown to 2015country case studies: What have we learned about processesand progress towards MDGs 4 and 5? BMC Public Health2016;16(Suppl 2):794.
8. Grollman C, Arregoces L, Martinez-Alvarez M, et al. Countdown to2015: 11 years of tracking resource flows to reproductive, maternal,newborn and child health. Lancet Glob Health 2017;5:e104–14.
9. Global Health Expenditure Database. WHO. 2014 (cited 16 May2016). http://apps.who.int/nha/database
10. Shiffman J, Smith S. Generation of political priority for global healthinitiatives: a framework and case study of maternal mortality. Lancet2007;370:1370–9.
11. Froen JF, Friberg IK, Lawn JE, et al. Stillbirths: progress andunfinished business. Lancet 2016;387:574–86.
Pitt C, et al. BMJ Glob Health 2017;2:e000205. doi:10.1136/bmjgh-2016-000205 11
BMJ Global Health
group.bmj.com on October 23, 2017 - Published by http://gh.bmj.com/Downloaded from

12. Pitt C, Lawn JE, Ranganathan M, et al. Donor funding for newbornsurvival: an analysis of donor-reported data, 2002-2010. PLoS Med2012;9:e1001332.
13. Arregoces L, Daly F, Pitt C, et al. Countdown to 2015: changes inofficial development assistance to reproductive, maternal, newborn,and child health, and assessment of progress between 2003 and2012. Lancet Glob Health 2015;3:e410–21.
14. UN Population Division. World Population Prospects: The 2012Revision Population Database: Department of Economic and SocialAffairs; 2013. http://esa.un.org/wpp/Documentation/pdf/WPP2012_Volume-II-Demographic-Profiles.pdf (accessed 19 May 2015).
15. Grollman C, Arregoces L, Martinez-Alvarez M, et al. Developing adataset to track aid for reproductive, maternal, newborn and childhealth, 2003–2013. Nature Scientfic Data 2017;Scientific Data 4,Article number: 170038. doi:10.1038/sdata.2017.38. http://www.nature.com/articles/sdata201738
16. Kerber KJ, de Graft-Johnson JE, Bhutta ZA, et al. Continuum of carefor maternal, newborn, and child health: from slogan to servicedelivery. Lancet 2007;370:1358–69.
17. Global Health Observatory data repository. WHO. 2015 (cited 15March 2016). http://apps.who.int/gho/data/view.main.CM1320R
18. World Bank national accounts data, and OECD National Accountsdata files. World Bank. 2016 (cited 15 March 2016).
19. UN Population Division. World Population Prospects: The 2012Revision Population Database: Department of Economic and SocialAffairs; 2013 [2013]. 2012. http://esa.un.org/unpp/
20. Wijesooriya NS, Rochat RW, Kamb ML, et al. Global burden ofmaternal and congenital syphilis in 2008 and 2012: a health systemsmodelling study. Lancet Glob Health 2016;4:e525–33.
21. Schweitzer J, Expert Consultative Group for Every Women EveryChild on A. Accountability in the 2015 Global Strategy for Women’s,Children’s and Adolescents’ Health. BMJ 2015;351:h4248.
22. Every Woman Every Child’s Independent Accountability Panel 2016.http://www.everywomaneverychild.org/2016/07/28/independent-accountability-panel/ (accessed 30 Mar 2017).
23. Kinney MV, Cocoman O, Dickson KE, et al. Implementation of theEvery Newborn Action Plan: Progress and lessons learned. SeminPerinatol 2015;39:326–37.
12 Pitt C, et al. BMJ Glob Health 2017;2:e000205. doi:10.1136/bmjgh-2016-000205
BMJ Global Health
group.bmj.com on October 23, 2017 - Published by http://gh.bmj.com/Downloaded from

2013− 2003funding for prenatal and neonatal health, Countdown to 2015: an analysis of donor
Arregoces, Joy E Lawn and Josephine BorghiCatherine Pitt, Christopher Grollman, Melisa Martínez-Álvarez, Leonardo
doi: 10.1136/bmjgh-2016-0002052017 2: BMJ Glob Health
http://gh.bmj.com/content/2/2/e000205Updated information and services can be found at:
These include:
References #BIBLhttp://gh.bmj.com/content/2/2/e000205
This article cites 16 articles, 3 of which you can access for free at:
Open Access
http://creativecommons.org/licenses/by/4.0/use, provided the original work is properly cited. See: others to distribute, remix, adapt and build upon this work, for commercialthe Creative Commons Attribution (CC BY 4.0) license, which permits This is an Open Access article distributed in accordance with the terms of
serviceEmail alerting
box at the top right corner of the online article. Receive free email alerts when new articles cite this article. Sign up in the
CollectionsTopic Articles on similar topics can be found in the following collections
(458)Open access
Notes
http://group.bmj.com/group/rights-licensing/permissionsTo request permissions go to:
http://journals.bmj.com/cgi/reprintformTo order reprints go to:
http://group.bmj.com/subscribe/To subscribe to BMJ go to:
group.bmj.com on October 23, 2017 - Published by http://gh.bmj.com/Downloaded from