plaisir results centre) d’accueil...
TRANSCRIPT

PLAISIR RESULTS
(61000) Centre d’accueil St-Marret
December 2011

Part I
CLIENTS REGISTER
1

Unit: 02 2nd floor
CLIENTS REGISTER
2

Montreal (61000) Centre d’accueil St-Marret December 2011
2nd floor CLIENTS REGISTER Unit: 02
Total number of clients: 32 Date of observation: 2011-12 Files to reviewMEDICARE Admission 20 Evaluation
Name CODE NUMBER date Age Sex Eva TE O\D date A C57 2 2011-11-2157 2 2011-12-0957 2 2011-11-2857 2 2011-11-28
XXXXXX XXXXX Xxxxxx XXXXXXXX Xxxxxx XXXXXXXX Xxxxxx XXXXXXX Xxxxxx ................... .......................
02 046 XXXX44542113 1996-06-12 67.7 F 02 114 XXXX38111315 2004-07-21 73.1 M 02 123 XXXX14542612 2005-02-14 87.7 F 02 124 XXXX18592312 2005-10-28 93.3 F .. ...... ............................. .................... ....... .. ..... .. ....................
Page 1/2
c©20111983 - 2008 : 25 ans de PLAISIR printed on January 16, 2012

Montreal (61000) Centre d’accueil St-Marret December 2011
2nd floor CLIENTS REGISTER Unit: 02
Total number of clients: 32 Date of observation: 2011-12 Files to reviewMEDICARE Admission 20 Evaluation
Name CODE NUMBER date Age Sex Eva TE O\D date A C57 1 ? 2011-11-28XXXXXXX Xxxxxxxxx 02 170 ? XXXX26512313 2011-03-10 85.9 F
Page 2/2
c©20111983 - 2008 : 25 ans de PLAISIR printed on January 16, 2012

Unit: 03 3rd floor
CLIENTS REGISTER
5

Montreal (61000) Centre d’accueil St-Marret December 2011
3rd floor CLIENTS REGISTER Unit: 03
Total number of clients: 32 Date of observation: 2011-12 Files to reviewMEDICARE Admission 20 Evaluation
Name CODE NUMBER date Age Sex Eva TE O\D date A C25 2 2011-11-2825 2 2011-11-2825 2 2011-11-2825 2 2011-11-28
XXXXXXX Xxxxxxx XXXXXXXX XXXXX Xxxx XXXXXXX Xxxxxxxxx XXXXXXXXXX Xxxxxxxxx ...................... .....................
03 087 XXXX35622512 1999-12-13 76.0 F03 105 XXXX14532316 2004-04-21 97.8 F03 110 XXXX16610414 2003-11-26 95.2 F03 112 XXXX22560316 2004-01-07 89.6 F ... ....... ............................. ................... ........ ... .... .. ....................
Page 1/2
c©20111983 - 2008 : 25 ans de PLAISIR printed on January 16, 2012

Montreal (61000) Centre d’accueil St-Marret December 2011
3rd floor CLIENTS REGISTER Unit: 03
Total number of clients: 32 Date of observation: 2011-12 Files to reviewMEDICARE Admission 20 Evaluation
Name CODE NUMBER date Age Sex Eva TE O\D date A C25 1 ? 2011-12-02XXXXXXXX Xxx 03 176 XXXX16621714 2011-11-24 95.0 F
Page 2/2
c©20111983 - 2008 : 25 ans de PLAISIR printed on January 16, 2012

Unit: 04 4th floor
CLIENTS REGISTER
8

Montreal (61000) Centre d’accueil St-Marret December 2011
4th floor CLIENTS REGISTER Unit: 04
Total number of clients: 32 Date of observation: 2011-12 Files to reviewMEDICARE Admission 20 Evaluation
Name CODE NUMBER date Age Sex Eva TE O\D date A C57 2 2011-11-2857 2 2011-11-2857 2 2011-11-2857 2 2011-11-28
XXXXXXXX XXXXXX Xxxxxx XXXXXXX XXXXX Xxxxxx XXXXXXX XxxxxxxxxXXXXXX XXXXXX Xxxxxxxxxxx................. .................
04 117 XXXX20582010 2003-09-02 91.4 F04 153 XXXX31621611 2005-04-28 80.0 F04 161 XXXX35052218 2007-05-03 76.6 M04 162 XXXX24592018 2008-02-15 87.3 F.... ...... ........................... .................... ........ ... .... .. ....................
Page 1/2
c©20111983 - 2008 : 25 ans de PLAISIR printed on January 16, 2012

Montreal (61000) Centre d’accueil St-Marret December 2011
4th floor CLIENTS REGISTER Unit: 04
Total number of clients: 32 Date of observation: 2011-12 Files to reviewMEDICARE Admission 20 Evaluation
Name CODE NUMBER date Age Sex Eva TE O\D date A C57 1 ? 2011-11-28XXXXX XXXXXX Xxxxx 04 199 XXXX18581716 2010-08-25 93.4 F
Page 2/2
c©20111983 - 2008 : 25 ans de PLAISIR printed on January 16, 2012

Part II
LONGITUDINAL and NON-COMPARATIVE MODELS
11

Complete program
LONGITUDINAL and NON-COMPARATIVE MODELS
12

Montreal (61000) Centre d’accueil St-Marret December 2011
Complete program Distribution of clients by level of handicap. Model LC1
Handicaps Mobility Phys. indepen- Occupation Social Orientationdence ADL integration Nb.
Observation 1 2 3 4 1 2 3 4 1 2 3 4 1 2 3 4 1 2 3 4 clt.% % % % % % % % % % % % % % % % % % % %
20 (2011-12) - 2 42 56 - - 3 97 - 42 40 19 - - 54 46 - 25 42 33 96
19 (2010-03) - - 46 54 - - 2 98 - 27 46 26 - 2 53 45 - 40 35 25 95
18 (2008-05) - 7 49 45 - - 4 96 2 29 51 17 - 7 57 37 - 41 39 20 92
Mean - 3 46 52 - - 3 97 1 33 46 21 - 3 54 43 - 35 39 26 94
Handicap code: 1 = adequate, 2 = limited, 3 = very limited, 4 = nil
c©20111983 - 2008 : 25 ans de PLAISIR printed on January 16, 2012

Montreal (61000) Centre d’accueil St-Marret December 2011
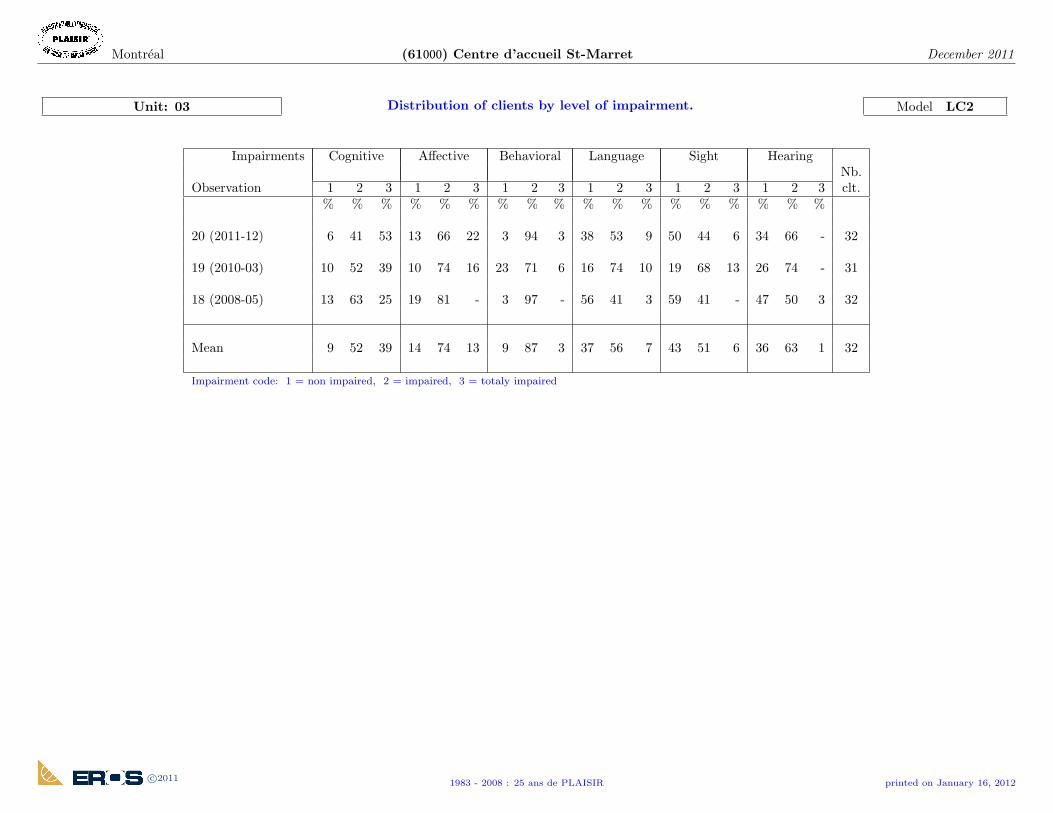
Complete program Distribution of clients by level of impairment. Model LC2
Impairments Cognitive Affective Behavioral Language Sight HearingNb.
Observation 1 2 3 1 2 3 1 2 3 1 2 3 1 2 3 1 2 3 clt.% % % % % % % % % % % % % % % % % %
20 (2011-12) 2 53 45 5 74 21 2 97 1 32 56 11 32 57 10 29 71 - 96
19 (2010-03) 6 51 43 4 77 19 8 88 3 28 65 6 22 61 17 34 66 - 95
18 (2008-05) 8 55 37 10 73 17 3 95 2 37 57 7 43 50 7 47 52 1 92
Mean 5 53 42 6 75 19 5 93 2 33 59 8 33 56 11 36 63 - 94
Impairment code: 1 = non impaired, 2 = impaired, 3 = totaly impaired
c©20111983 - 2008 : 25 ans de PLAISIR printed on January 16, 2012

Montreal (61000) Centre d’accueil St-Marret December 2011
Complete programDistribution of clients according to the type of psychological
problem. Model LC3
0 No problem 1 Physical abuse 3 Disturbs others 6 Persist. anxiety 9 Withdrawal 12 Early awakening with mood disturbance2 Verbal abuse 4 Agitation 7 Sadness 10 Suicidal thoughts 13 Awake 7 hours or less a day
5 Wandering 8 Expr. of distress 11 Freq. thoughts of death
Types of psychological problemObservation CLT 0 1 2 3 4 5 6 7 8 9 10 11 12 13 Nb. clt.
20 (2011-12) Nb. 26 13 7 5 37 4 40 12 1 19 - - - - 96% 27 14 7 5 39 4 42 12 1 20 - - - -
19 (2010-03) Nb. 26 14 19 17 32 7 30 26 5 20 1 - - 1 95% 27 15 20 18 34 7 32 27 5 21 1 - - 1
18 (2008-05) Nb. 24 14 15 12 20 7 38 14 3 9 1 - - - 92% 26 15 16 13 22 8 41 15 3 10 1 - - -
Mean Nb. 25 14 14 11 30 6 36 17 3 16 1 - - 0 94% 27 14 14 12 31 6 38 18 3 17 1 - - 0
c©20111983 - 2008 : 25 ans de PLAISIR printed on January 16, 2012

Montreal (61000) Centre d’accueil St-Marret December 2011
Complete programDistribution of clients according to the type of individual
supportive communication. Model LC4
s Slight M Moderate S SeveresM Slight moderate SA Severe: activeSM Severe moderate SP Severe: passive
No problem Cognitive deficits Psychiatric problemsObservation Nb. clt. % s sM SM SA SP Nb. clt. % s M S Nb. clt. % Nb. clt.
20 (2011-12) 3 3 14 37 - 18 15 84 88 8 1 - 9 9 96
19 (2010-03) 7 7 20 33 - 13 11 77 81 10 1 - 11 12 95
18 (2008-05) 10 11 25 30 - 8 10 73 79 6 3 - 9 10 92
Mean 7 7 20 33 - 13 12 78 83 8 2 - 10 10 94
c©20111983 - 2008 : 25 ans de PLAISIR printed on January 16, 2012

Montreal (61000) Centre d’accueil St-Marret December 2011
Complete program Distribution of clients according to the type of protectiondevice.
Model LC5
R = Rarely 1 Bed rails 4 Vest restraint 7 Abdominal restraint to bed 11 Half-door 9 Fireproof apronS = Sometimes 2 Geriatric chair table 5 Wrist restraint(s), mitten(s) 14 Abdominal restraint to chair 12 Nursing home controlled outingO = Often 3 Wheelchair table 6 Ankle restraint(s) 8 Body restraint 13 Nursing unit controlled outing 10 Psycho-active drugs0 no protection
Types of protection devicesObservation CLT 0 1 2 3 4 5 6 7 14 8 11 12 13 9 10 Nb. clt.
R Nb. 11 - - - - - - - - - - - - - 2% - - - - - - - - - - - - - 2
20 (2011-12) S Nb. - - - - - - - 1 - - - - - - 96% - - - - - - - 1 - - - - - -
O Nb. 47 5 3 - - - - 41 3 - - 2 - 61% 11 49 5 3 - - - - 43 3 - - 2 - 64
R Nb. 3 - - - - - - - 1 - - - - - 1% - - - - - - - 1 - - - - - 1
19 (2010-03) S Nb. - - - - - - - - - - - - - - 95% - - - - - - - - - - - - - -
O Nb. 78 14 4 - - - 2 44 4 - - 6 - 61% 3 82 15 4 - - - 2 46 4 - - 6 - 64
R Nb. 2 - - - - - - - - - - - - - -% - - - - - - - - - - - - - -
18 (2008-05) S Nb. - - - - - - 1 - - - - - - - 92% - - - - - - 1 - - - - - - -
O Nb. 81 5 3 - - - 20 18 3 - - 6 - 58% 2 88 5 3 - - - 22 20 3 - - 7 - 63
R Nb. 5 - - - - - - - 0 - - - - - 1% - - - - - - - 0 - - - - - 1
Mean S Nb. - - - - - - 0 0 - - - - - - 94% - - - - - - 0 0 - - - - - -
O Nb. 69 8 3 - - - 7 34 3 - - 5 - 60% 6 73 8 4 - - - 8 36 4 - - 5 - 64
c©20111983 - 2008 : 25 ans de PLAISIR printed on January 16, 2012

Montreal (61000) Centre d’accueil St-Marret December 2011
Complete programDistribution of clients according to the type of
travelling/mobilization device. Model LC6
2 Cane 8 Wheelchair no assist.0 No decrease or loss 3 Walker 6 Orthesis 9 Wheelchair with ass. 12 Lift1 None (with decr/loss) 4 Quadcane 7 Prosthesis 10 Motorized wheelchair 13 Others
5 Handrails/furniture 11 Geriatric chair
Types de travelling/mobilization devicesObservation CLT 0 1 2 3 4 5 6 7 8 9 10 11 12 13 Nb. clt.
20 (2011-12) Nb. - 11 3 23 - 1 8 - 27 48 2 14 44 1% - 11 3 24 - 1 8 - 28 50 2 15 46 1 96
19 (2010-03) Nb. - 9 4 29 - - 6 - 25 38 1 21 41 1% - 9 4 31 - - 6 - 26 40 1 22 43 1 95
18 (2008-05) Nb. 3 5 2 28 - 1 5 - 40 46 3 12 30 6% 3 5 2 30 - 1 5 - 43 50 3 13 33 7 92
Mean Nb. 1 8 3 27 - 1 6 - 31 44 2 16 38 3% 1 9 3 28 - 1 7 - 33 47 2 17 41 3 94
c©20111983 - 2008 : 25 ans de PLAISIR printed on January 16, 2012

Montreal (61000) Centre d’accueil St-Marret December 2011
Complete programAverage net care minutes required per day by the average client
per area of need. Model LS1
Feed. Elim. Hygi. Mobi. Comm. Resp. Med. IV.Ther Treat. Diag. Basic Technic Total Nb.Observation proce. care care in clt.
A B C D E F G H I J A+B+C+D F+G+H+I+J minutes
20 (2011-12) 31.6 32.5 38.7 38.6 24.7 0.5 10.1 0.2 2.9 5.0 141.5 18.6 184.8 9617.1% 17.6% 21.0% 20.9% 13.4% 0.2% 5.4% 0.1% 1.6% 2.7% 76.6% 10.1% 100%
19 (2010-03) 27.4 34.3 38.8 39.3 22.0 0.3 9.2 0.2 3.9 4.8 139.8 18.3 180.1 9515.2% 19.0% 21.5% 21.8% 12.2% 0.2% 5.1% 0.1% 2.2% 2.6% 77.6% 10.2% 100%
18 (2008-05) 23.0 33.8 39.4 39.2 21.1 0.1 7.5 - 3.2 4.1 135.4 14.9 171.4 9213.4% 19.7% 23.0% 22.9% 12.3% 0.1% 4.4% - 1.8% 2.4% 79.0% 8.7% 100%
Mean 27.4 33.5 39.0 39.1 22.6 0.3 9.0 0.1 3.3 4.6 139.0 17.3 178.9 9415.3% 18.7% 21.8% 21.8% 12.6% 0.2% 5.0% 0.1% 1.9% 2.6% 77.7% 9.7% 100%
c©20111983 - 2008 : 25 ans de PLAISIR printed on January 16, 2012

Montreal (61000) Centre d’accueil St-Marret December 2011
Complete programAverage number of minutes and days of rehabilitation received
per week by the client. Model LS2
Physical therapy Occupational therapy Speech therapyObservation CLT CLT CLT Nb.
Mn/week Day/week Nb. % Mn/week Day/week Nb. % Mn/week Day/week Nb. % clt.
20 (2011-12) 70 1.6 14 15 51 1.3 12 12 96
19 (2010-03) 56 1.6 33 35 36 1.1 11 12 95
18 (2008-05) 61 1.9 39 42 85 1.6 9 10 92
Mean 61 1.8 29 30 55 1.3 11 11 94
Note clients not receiving services have been excluded from the calculation for the averages Mn/week.
c©20111983 - 2008 : 25 ans de PLAISIR printed on January 16, 2012

Montreal (61000) Centre d’accueil St-Marret December 2011
Complete programAverage number of days of nursing rehabilitation services
received per week. Model LS3
Eating/swallowing Toileting Activities Dressing/grooming Locomotion/mobility TransferObservation CLT CLT CLT CLT CLT Nb.
Day/week Nb. % Day/week Nb. % Day/week Nb. % Day/week Nb. % Day/week Nb. % clt.
20 (2011-12) - - - - - - 7.0 11 11 - - - - - - 96
19 (2010-03) - - - 7.0 7 7 7.0 10 11 - - - - - - 95
18 (2008-05) 7.0 1 1 7.0 14 15 6.8 9 10 7.0 1 1 - - - 92
Mean 7.0 0 0 7.0 7 7 6.9 10 11 7.0 0 0 - - - 94
Note The clients not receiving services have been excluded from the calculation for the average Day/week.
c©20111983 - 2008 : 25 ans de PLAISIR printed on January 16, 2012

Montreal (61000) Centre d’accueil St-Marret December 2011
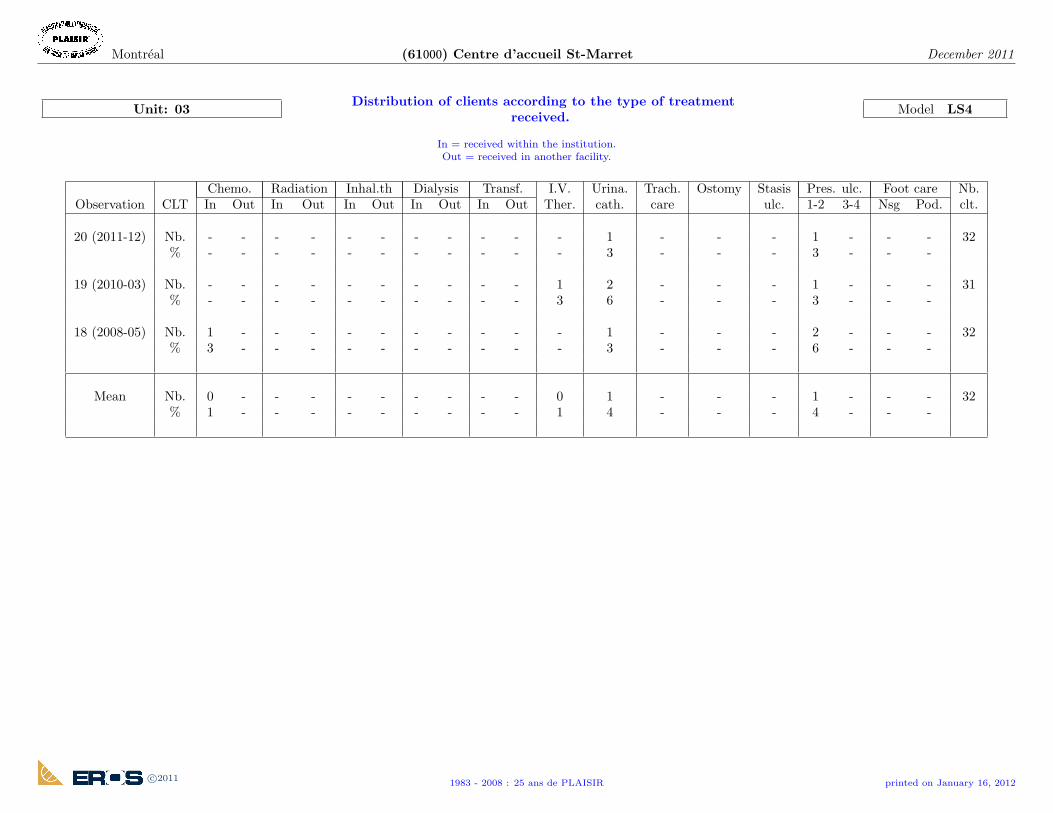
Complete program Distribution of clients according to the type of treatmentreceived.
Model LS4
In = received within the institution.Out = received in another facility.
Chemo. Radiation Inhal.th Dialysis Transf. I.V. Urina. Trach. Ostomy Stasis Pres. ulc. Foot care Nb.Observation CLT In Out In Out In Out In Out In Out Ther. cath. care ulc. 1-2 3-4 Nsg Pod. clt.
20 (2011-12) Nb. 1 - - - - - - - - 1 2 5 - 2 - 5 2 2 - 96% 1 - - - - - - - - 1 2 5 - 2 - 5 2 2 -
19 (2010-03) Nb. - - - - - - - - - - 3 4 - 2 - 6 2 1 1 95% - - - - - - - - - - 3 4 - 2 - 6 2 1 1
18 (2008-05) Nb. 1 - - - - - - 1 - - - 3 - - - 6 3 1 - 92% 1 - - - - - - 1 - - - 3 - - - 7 3 1 -
Mean Nb. 1 - - - - - - 0 - 0 2 4 - 1 - 6 2 1 0 94% 1 - - - - - - 0 - 0 2 4 - 1 - 6 2 1 0
c©20111983 - 2008 : 25 ans de PLAISIR printed on January 16, 2012

Montreal (61000) Centre d’accueil St-Marret December 2011
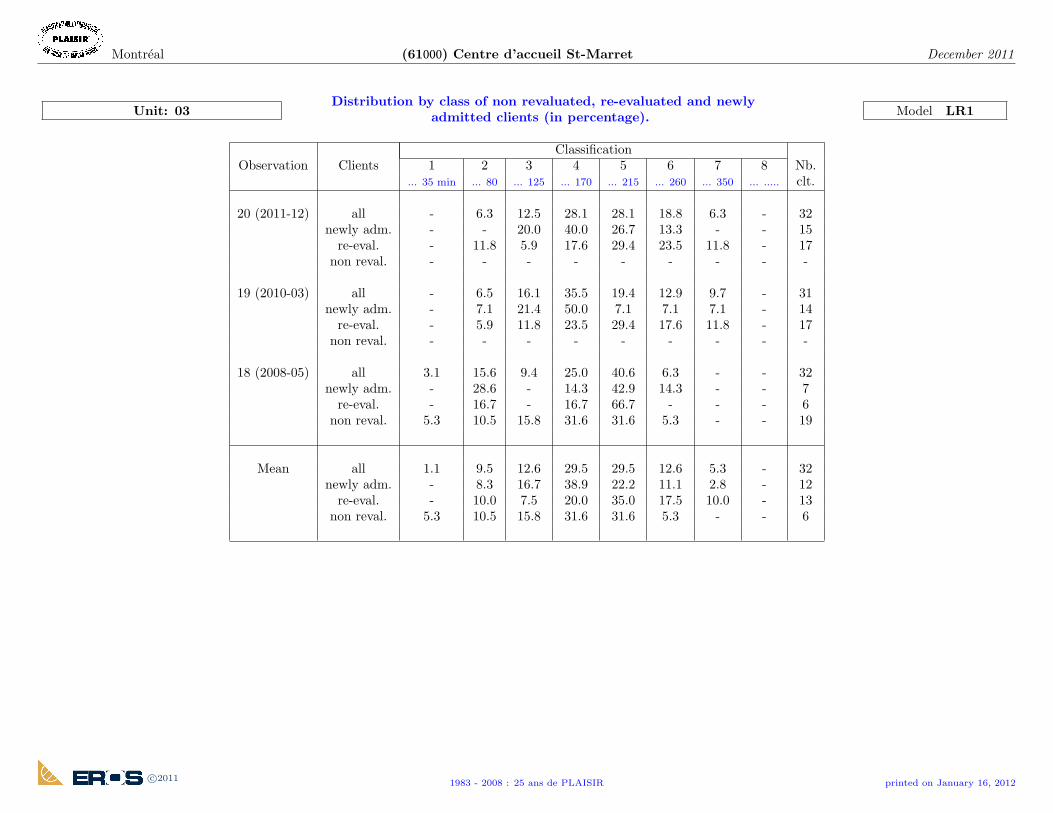
Complete programDistribution by class of non revaluated, re-evaluated and newly
admitted clients (in percentage). Model LR1
ClassificationObservation Clients 1 2 3 4 5 6 7 8 Nb.
... 35 min ... 80 ... 125 ... 170 ... 215 ... 260 ... 350 ... ..... clt.
20 (2011-12) all - 4.2 13.5 17.7 29.2 24.0 11.5 - 96newly adm. - 2.4 24.4 26.8 24.4 14.6 7.3 - 41
re-eval. - 5.5 5.5 10.9 32.7 30.9 14.5 - 55non reval. - - - - - - - - -
19 (2010-03) all - 5.3 12.6 22.1 31.6 18.9 9.5 - 95newly adm. - 4.4 15.6 24.4 33.3 11.1 11.1 - 45
re-eval. - 6.0 10.0 20.0 30.0 26.0 8.0 - 50non reval. - - - - - - - - -
18 (2008-05) all 1.1 6.5 7.6 30.4 35.9 16.3 2.2 - 92newly adm. - 12.5 - 25.0 37.5 25.0 - - 16
re-eval. - 3.8 - 19.2 42.3 30.8 3.8 - 26non reval. 2.0 6.0 14.0 38.0 32.0 6.0 2.0 - 50
Mean all 0.4 5.3 11.3 23.3 32.2 19.8 7.8 - 94newly adm. - 4.9 16.7 25.5 30.4 14.7 7.8 - 34
re-eval. - 5.3 6.1 16.0 33.6 29.0 9.9 - 44non reval. 2.0 6.0 14.0 38.0 32.0 6.0 2.0 - 17
c©20111983 - 2008 : 25 ans de PLAISIR printed on January 16, 2012

Montreal (61000) Centre d’accueil St-Marret December 2011
Complete programDaily number of FTE nursing staff presences required for the
clients as a whole, per shift and according to the type ofactivity, and number of FTE position required per client-year.
Model LR2
DIC CRC AAMTRV Total FTE * Nb.Observation Night Day Evening 24h Night Day Evening 24h Night Day Evening 24h Night Day Evening 24h pos./clt. clt.
20 (2011-12) 4.7 24.0 15.1 43.8 0.6 1.2 0.9 2.7 0.4 1.8 0.8 3.0 5.7 27.1 16.7 49.5 0.86 96
19 (2010-03) 4.7 23.2 14.4 42.2 0.6 1.2 0.9 2.7 0.4 1.8 0.8 2.9 5.6 26.2 16.0 47.9 0.84 95
18 (2008-05) 4.2 21.8 13.0 38.9 0.6 1.2 0.8 2.6 0.4 1.7 0.7 2.8 5.2 24.7 14.5 44.4 0.81 92
Mean 4.5 23.0 14.1 41.7 0.6 1.2 0.9 2.7 0.4 1.8 0.8 2.9 5.5 26.0 15.8 47.2 0.84 94* a FTE position ”works” 218.3 FTE presences per year but is paid for 260.9 presences.
a FTE presence provides 405 productive minutes per day but is paid for 435 ”worked” minutes.
c©20111983 - 2008 : 25 ans de PLAISIR printed on January 16, 2012

Montreal (61000) Centre d’accueil St-Marret December 2011
Complete program Average net care minutes required per shift by the averageclient.
Model LR3
Night Day Evening Level of care ( 24 hours )Observation NtCM NtCM NtCH Variation Class Nb. clt.
20 (2011-12) 19.9 101.4 63.5 184.8 3.08 5 962.6 %
19 (2010-03) 19.9 99.0 61.3 180.1 3.00 5 955.1 %
18 (2008-05) 18.5 95.8 57.0 171.4 2.86 5 92
Mean 19.4 98.8 60.7 178.9 2.98 5 94
c©20111983 - 2008 : 25 ans de PLAISIR printed on January 16, 2012

Montreal (61000) Centre d’accueil St-Marret December 2011
Complete programNet care minutes required by the average client according to the
days of the week and shifts. Model LR4
Observation Monday Tuesday Wednesday Thursday Friday Saturday Sunday Mean Nb. clt.Night 20.0 20.2 19.7 19.5 19.9 20.2 19.4 19.9
20 (2011-12) Day 105.4 102.0 101.3 102.6 101.7 98.6 98.6 101.4 96Evening 63.6 63.5 63.9 63.0 63.9 62.0 64.6 63.5Min/24h 189.0 185.8 184.8 185.1 185.5 180.8 182.6 184.8Hrs/24h 3.15 3.10 3.08 3.08 3.09 3.01 3.04 3.08
Night 19.7 20.1 20.2 19.4 19.8 20.1 19.8 19.919 (2010-03) Day 98.6 101.0 101.1 96.8 99.4 98.6 97.4 99.0 95
Evening 60.8 62.5 61.8 59.7 60.9 62.3 60.8 61.3Min/24h 179.1 183.6 183.1 176.0 180.1 180.9 178.0 180.1Hrs/24h 2.99 3.06 3.05 2.93 3.00 3.01 2.97 3.00
Night 18.6 18.2 19.1 18.3 18.7 18.5 18.2 18.518 (2008-05) Day 95.5 98.8 94.4 95.1 96.3 97.3 93.2 95.8 92
Evening 56.4 57.4 56.9 56.6 57.4 57.3 57.2 57.0Min/24h 170.6 174.4 170.4 170.0 172.4 173.2 168.6 171.4Hrs/24h 2.84 2.91 2.84 2.83 2.87 2.89 2.81 2.86
Night 19.4 19.5 19.6 19.1 19.5 19.6 19.2 19.4Mean Day 99.9 100.6 99.0 98.2 99.2 98.2 96.4 98.8 94
Evening 60.3 61.2 60.9 59.8 60.8 60.6 60.9 60.7Min/24h 179.7 181.3 179.5 177.1 179.4 178.3 176.5 178.9Hrs/24h 2.99 3.02 2.99 2.95 2.99 2.97 2.94 2.98
c©20111983 - 2008 : 25 ans de PLAISIR printed on January 16, 2012

Montreal (61000) Centre d’accueil St-Marret December 2011
Complete program Average number of care hours (net, productive, worked, paid)required per day by the average client. Model LR5
Observation NtCH PrCH WkCH PdCH Nb. clt.
20 (2011-12) 3.080 3.480 3.738 4.467 96
19 (2010-03) 3.002 3.402 3.654 4.367 95
18 (2008-05) 2.856 3.256 3.497 4.180 92
Mean 2.981 3.381 3.631 4.340 94
c©20111983 - 2008 : 25 ans de PLAISIR printed on January 16, 2012

Montreal (61000) Centre d’accueil St-Marret December 2011
Complete programAverage net care hours required per day by the average client
non revaluated, re-evaluated and newly admitted. Model LR6
Net care hours / 24 hours Number of clients % of clientsObservation Non reval. Re-evaluated Newly All Non New Non New
NtCH Variation admitted NtCH Variation reval. Re-eval. adm. All reval. Re-eval. adm.
20 (2011-12) - 3.31 10.97 % 2.77 3.08 2.61 % - 55 41 96 - 57 % 43 %
19 (2010-03) - 3.06 14.23 % 2.94 3.00 5.09 % - 50 45 95 - 53 % 47 %
18 (2008-05) 2.59 3.32 23.05 % 2.92 2.86 - 50 26 16 92 54 % 28 % 17 %
Mean 2.59 3.22 - 2.87 2.98 - 17 44 34 94 18 % 46 % 36 %
c©20111983 - 2008 : 25 ans de PLAISIR printed on January 16, 2012

Montreal (61000) Centre d’accueil St-Marret December 2011
Complete program SYNTHESIS Model LX1
** nursing care Rehabilitation * Handicaps and impairmentsNb. Age Adm. Length % FTE ( NtCH / day ) ( hours / week ) ( % clt. at level 4 or 3 )
Observation clt. Age of stay Wo- pos. / MOB ADL OCC SOC COG AFF BEH
(years) man clt. Tot Basic Com Tech Ph.th. Oc.th. Sp.th. 4 4 4 4 3 3 3
20 (2011-12) 96 86 83 2.9 73 0.86 3.1 2.4 0.4 0.3 0.17 0.11 - 56 97 19 46 45 21 1
19 (2010-03) 95 85 82 3.1 75 0.84 3.0 2.3 0.4 0.3 0.33 0.07 - 54 98 26 45 43 19 3
18 (2008-05) 92 84 81 3.5 74 0.81 2.9 2.3 0.4 0.2 0.43 0.14 - 45 96 17 37 37 17 2
Mean 94 85 82 3.2 74 0.84 3.0 2.3 0.4 0.3 0.31 0.10 - 52 97 21 43 42 19 2
* All the clients including those not receiving services have been included in the calculation for the average hours/week.
** a FTE position ”works” 218.3 FTE presences per year but is paid for 260.9 presences.
a FTE presence provides 405 productive minutes per day but is paid for 435 ”worked” minutes.
c©20111983 - 2008 : 25 ans de PLAISIR printed on January 16, 2012

Montreal (61000) Centre d’accueil St-Marret December 2011
Complete program Distribution of clients according to sex and age on admissionand at the time of observation.
Model N1
Total number of clients : 96
Age of clients Age on admission Age at time of observationNumber % Number % Women (%) Men (%)
Less than 30 years - - - - - -
30 to 44 years 1 1.0 1 1.0 - 100.0
45 to 54 years 2 2.1 1 1.0 - 100.0
55 to 64 years 4 4.2 2 2.1 50.0 50.0
65 to 69 years 4 4.2 3 3.1 66.7 33.3
70 to 74 years 10 10.4 6 6.2 66.7 33.3
75 to 79 years 8 8.3 13 13.5 46.2 53.8
80 to 84 years 20 20.8 10 10.4 50.0 50.0
85 to 89 years 18 18.8 24 25.0 87.5 12.5
90 to 94 years 16 16.7 18 18.8 88.9 11.1
95 years and over 13 13.5 18 18.8 83.3 16.7
Total 96 100.0 96 100.0 72.9 27.1
Average 82.8 85.7
c©20111983 - 2008 : 25 ans de PLAISIR printed on January 16, 2012

Montreal (61000) Centre d’accueil St-Marret December 2011
Complete program Distribution of clients by level of handicap. Model N2
Total number of clients : 96Mobility Phys. indepen- Occupation Social Orientation
dence ADL integrationLevel * % n % n % n % n % n
1 - - - - - - - - - -
2 - - - - - - - - - -
3 - - - - - - - - - -
4 1 1 - - - - - - 2 2
5 1 1 - - 1 1 7 7 23 22
6 10 10 3 3 41 39 47 45 33 32
7 31 30 27 26 40 38 25 24 8 8
8 8 8 41 39 16 15 20 19 32 31
9 48 46 29 28 3 3 1 1 1 1
* See description in PLAISIR form, (Level 1 = Adequate) ... (Level 9 = Nil)
c©20111983 - 2008 : 25 ans de PLAISIR printed on January 16, 2012

Montreal (61000) Centre d’accueil St-Marret December 2011
Complete programDistribution of clients according to sex, per intervals of net care
minutes required per 24 hours. Model N4
Total number of clients : 96
Number PercentageClients requiring :
Women Men Total Women Men Total
Less than 60 min. (1 h) - 1 1 - 3.8 1.0
61 to 90 min. (+1 ≤ 1.5 h ) 5 3 8 7.1 11.5 8.3
91 to 120 min. (+1.5 ≤ 2 h ) 4 3 7 5.7 11.5 7.3
121 to 150 min. (+2 ≤ 2.5 h ) 8 3 11 11.4 11.5 11.5
151 to 180 min. (+2.5 ≤ 3 h ) 12 - 12 17.1 - 12.5
181 to 210 min. (+3 ≤ 3.5 h ) 18 4 22 25.7 15.4 22.9
211 to 240 min. (+3.5 ≤ 4 h ) 11 4 15 15.7 15.4 15.6
241 to 270 min. (+4 ≤ 4.5 h ) 11 7 18 15.7 26.9 18.8
271 to 300 min. (+4.5 ≤ 5 h ) 1 1 2 1.4 3.8 2.1
301 to 330 min. (+5 ≤ 5.5 h ) - - - - - -
Greater than 330 min. (+5.5 h ) - - - - - -
Total 70 26 96 100.0 100.0 100.0
c©20111983 - 2008 : 25 ans de PLAISIR printed on January 16, 2012

Montreal (61000) Centre d’accueil St-Marret December 2011
Complete program Nursing staff required per shift as measured in number of: Model N5
- FTE presences for the clients as a whole - WkCH for the clients as a whole and per client- FTE positions for the clients as a whole and per client - clients per FTE presence
Total number of clients : 96Mean Mean Number
Monday Tuesday Wednesday Thursday Friday Saturday Sunday Total Mean Monday to Saturday of FTEweek / day Friday to Sunday positions
FTE presences 5.75 5.79 5.66 5.61 5.71 5.78 5.60 39.91 5.70 5.70 5.69Night 9.54
WkCH 41.652 41.977 41.024 40.683 41.423 41.931 40.633 289.322 41.332 41.352 41.282
CLT/Presence 16.84
FTE presences 28.02 27.21 27.04 27.35 27.14 26.40 26.41 189.56 27.08 27.35 26.41Day 45.31
WkCH 203.111 197.258 196.018 198.277 196.774 191.404 191.484 1374.326 196.332 198.288 191.444
CLT/Presence 3.55
FTE presences 16.73 16.72 16.80 16.60 16.81 16.35 16.97 116.98 16.71 16.73 16.66Evening 27.96
WkCH 121.296 121.246 121.803 120.314 121.865 118.573 123.004 848.100 121.157 121.305 120.788
CLT/Presence 5.74
FTE presences 50.49 49.72 49.50 49.55 49.66 48.54 48.98 346.45 49.49 49.79 48.7624h 82.81
WkCH 366.058 360.481 358.845 359.274 360.062 351.908 355.121 2511.749 358.821 360.944 353.514
Per client :Night WkCH 0.434 0.437 0.427 0.424 0.431 0.437 0.423 3.014 0.431 0.431 0.430 0.10Day WkCH 2.116 2.055 2.042 2.065 2.050 1.994 1.995 14.316 2.045 2.065 1.994 0.47
Evening WkCH 1.263 1.263 1.269 1.253 1.269 1.235 1.281 8.834 1.262 1.264 1.258 0.2924h WkCH 3.813 3.755 3.738 3.742 3.751 3.666 3.699 26.164 3.738 3.760 3.682 0.86
a FTE position ”works” 218.3 FTE presences per year but is paid for 260.9 presences. Version NIV/24/405-435/218.3
a FTE presence provides 405 productive minutes per day but is paid for 435 ”worked” minutes.
c©20111983 - 2008 : 25 ans de PLAISIR printed on January 16, 2012

Montreal (61000) Centre d’accueil St-Marret December 2011
Complete program Distribution by class of clients according to the types of servicesreceived.
Model N6
Total number of clients : 96Classification
Type of CLT 1 2 3 4 5 6 7 8 Nb.services ... 35 min ... 80 ... 125 ... 170 ... 215 ... 260 ... 350 ... ..... clt.
Nursing Nb. - 4 11 12 20 18 9 - 74only % - 5.4 14.9 16.2 27.0 24.3 12.2 - 77.1
Nursing Nb. - - 2 1 5 2 - - 10and Ph.th. % - - 20.0 10.0 50.0 20.0 - - 10.4
Nursing Nb. - - - 1 2 3 2 - 8and Oc.th. % - - - 12.5 25.0 37.5 25.0 - 8.3
Nursing and Oc.th. Nb. - - - 3 1 - - - 4and Ph.th. % - - - 75.0 25.0 - - - 4.2
Total Nb. - 4 13 17 28 23 11 - 96% - 4.2 13.5 17.7 29.2 24.0 11.5 - 100.0
c©20111983 - 2008 : 25 ans de PLAISIR printed on January 16, 2012

Montreal (61000) Centre d’accueil St-Marret December 2011
Complete program Diseases prevalence (number and % of clients). Model N7
Total number of clients : 96Diseases n % Diseases n %
Malignant neoplasm 14 14.6 % Glaucoma 14 14.6 %Cataract 1 1.0 %
Acquired hypothyroidism 20 20.8 % Blindness, both eyes 1 1.0 %Diabetes mellitus 18 18.8 % Retinal disorders 13 13.5 %
Obesity - -Deficiency anemias 8 8.3 %
Hearing loss 2 2.1 %
Organic psychotic conditions 52 54.2 % Hypertensive diseases 49 51.0 %Schizophrenic disorders 4 4.2 %
Other psychoses 9 9.4 % Ischemic heart diseases 22 22.9 %Heart failure 9 9.4 %
Other heart diseases 20 20.8 %Nevrotic disorders 7 7.3 %
Spec. nonpsycho. disor. due organ. brain dam. 7 7.3 % Cerebrovascular diseases 3 3.1 %Depressive disorders 11 11.5 % Late effects of cerebrovascular diseases 29 30.2 %
Other nonpsychotic disorders 10 10.4 % Diseases of arteries 21 21.9 %
Chronic obstructive pulmonary diseases 20 20.8 %Senility without mention of psychosis - -
Mental retardation 1 1.0 % Hernia of abdominal cavity - -Cerebral degenerations - Alzheimer 23 24.0 %
Renal failure 16 16.7 %
Parkinson and other extra pyramidal diseases 11 11.5 % Rheumatoid arthritis 2 2.1 %Multiple sclerosis and demyelinating diseases 4 4.2 % Osteoarthrosis 9 9.4 %
Hemiplegia 2 2.1 % Other arthropathies 1 1.0 %Epilepsy 2 2.1 % Dorsopathies 4 4.2 %
Other disorders of the central nervous system 4 4.2 % Osteopathies 27 28.1 %
Late effects musculo squel. tissue injuries 29 30.2 % Aphasia - -
c©20111983 - 2008 : 25 ans de PLAISIR printed on January 16, 2012

Montreal (61000) Centre d’accueil St-Marret December 2011
Complete programNet care minutes required in the average per day and per care
category by the average client in the different categories ofcognitive deficits and of psychiatric problems.
Model N8
Categories Feed. Elim. Hygi. Mobi. Basic care Technical Communication NtCM Nb.A B C D (A to D) care clt.
No problem 10.3 15.8 21.1 22.0 69.2 13.9 19.2 102.3 310.1% 15.4% 20.6% 21.5% 67.7% 13.6% 18.8% 100.0%
Light CD 14.0 25.4 30.5 26.7 96.6 15.9 17.3 129.9 1410.8% 19.6% 23.5% 20.6% 74.4% 12.2% 13.4% 100.0%
Moderate light CD 27.9 33.0 41.5 40.4 142.8 19.7 27.6 190.1 37cooperative c. 14.7% 17.3% 21.8% 21.3% 75.1% 10.4% 14.5% 100.0%
Moderate severe CD - - - - - - - - -non cooperative c. - - - - - - - -
Severe CD Active CLT 35.0 40.0 42.0 44.9 161.9 19.0 34.0 214.9 18active client 16.3% 18.6% 19.5% 20.9% 75.3% 8.8% 15.8% 100.0%
Severe CD Passive CLT 67.5 38.7 40.2 55.0 201.4 20.8 16.1 238.2 15passive client 28.3% 16.2% 16.9% 23.1% 84.5% 8.7% 6.7% 100.0%
Total CD 34.2 34.3 39.5 41.7 149.6 19.1 25.2 194.0 8417.6% 17.7% 20.4% 21.5% 77.1% 9.9% 13.0% 100.0%
Light PP 15.5 20.4 36.5 13.7 86.0 14.4 19.3 119.8 812.9% 17.0% 30.4% 11.4% 71.8% 12.1% 16.1% 100.0%
Moderate PP 10.0 36.0 42.6 29.7 118.3 23.6 39.1 181.0 15.5% 19.9% 23.5% 16.4% 65.4% 13.0% 21.6% 100.0%
Severe PP - - - - - - - - -- - - - - - - -
Total PP 14.9 22.1 37.1 15.5 89.6 15.5 21.5 126.6 911.8% 17.5% 29.3% 12.2% 70.8% 12.2% 17.0% 100.0%
Total 31.6 32.5 38.7 38.6 141.5 18.6 24.7 184.8 9617.1% 17.6% 21.0% 20.9% 76.6% 10.1% 13.4% 100.0%
CD = Cognitive Deficits PP = Psychiatric Problems CLT = Client
c©20111983 - 2008 : 25 ans de PLAISIR printed on January 16, 2012

Unit: 02 2nd floor
LONGITUDINAL and NON-COMPARATIVE MODELS
37

Montreal (61000) Centre d’accueil St-Marret December 2011
Unit: 02 Distribution of clients by level of handicap. Model LC1
Handicaps Mobility Phys. indepen- Occupation Social Orientationdence ADL integration Nb.
Observation 1 2 3 4 1 2 3 4 1 2 3 4 1 2 3 4 1 2 3 4 clt.% % % % % % % % % % % % % % % % % % % %
20 (2011-12) - - 47 53 - - 6 94 - 63 34 3 - - 78 22 - 28 63 9 32
19 (2010-03) - - 50 50 - - 3 97 - 41 41 19 - 6 63 31 - 63 25 13 32
18 (2008-05) - 3 50 47 - - - 100 - 40 40 20 - 7 57 37 - 47 37 17 30
Mean - 1 49 50 - - 3 97 - 48 38 14 - 4 66 30 - 46 41 13 31
Handicap code: 1 = adequate, 2 = limited, 3 = very limited, 4 = nil
c©20111983 - 2008 : 25 ans de PLAISIR printed on January 16, 2012

Montreal (61000) Centre d’accueil St-Marret December 2011
Unit: 02 Distribution of clients by level of impairment. Model LC2
Impairments Cognitive Affective Behavioral Language Sight HearingNb.
Observation 1 2 3 1 2 3 1 2 3 1 2 3 1 2 3 1 2 3 clt.% % % % % % % % % % % % % % % % % %
20 (2011-12) - 81 19 3 94 3 3 97 - 44 50 6 25 66 9 28 72 - 32
19 (2010-03) 9 66 25 3 88 9 3 94 3 47 47 6 31 47 22 53 47 - 32
18 (2008-05) 10 67 23 10 70 20 7 93 - 47 40 13 50 43 7 73 27 - 30
Mean 6 71 22 5 84 11 4 95 1 46 46 9 35 52 13 51 49 - 31
Impairment code: 1 = non impaired, 2 = impaired, 3 = totaly impaired
c©20111983 - 2008 : 25 ans de PLAISIR printed on January 16, 2012

Montreal (61000) Centre d’accueil St-Marret December 2011
Unit: 02Distribution of clients according to the type of psychological
problem. Model LC3
0 No problem 1 Physical abuse 3 Disturbs others 6 Persist. anxiety 9 Withdrawal 12 Early awakening with mood disturbance2 Verbal abuse 4 Agitation 7 Sadness 10 Suicidal thoughts 13 Awake 7 hours or less a day
5 Wandering 8 Expr. of distress 11 Freq. thoughts of death
Types of psychological problemObservation CLT 0 1 2 3 4 5 6 7 8 9 10 11 12 13 Nb. clt.
20 (2011-12) Nb. 9 3 - 1 7 - 14 5 1 10 - - - - 32% 28 9 - 3 22 - 44 16 3 31 - - - -
19 (2010-03) Nb. 10 4 6 2 6 - 11 10 4 9 - - - - 32% 31 12 19 6 19 - 34 31 12 28 - - - -
18 (2008-05) Nb. 11 4 6 2 5 - 12 4 1 3 - - - - 30% 37 13 20 7 17 - 40 13 3 10 - - - -
Mean Nb. 10 4 4 2 6 - 12 6 2 7 - - - - 31% 32 12 13 5 19 - 39 20 6 23 - - - -
c©20111983 - 2008 : 25 ans de PLAISIR printed on January 16, 2012

Montreal (61000) Centre d’accueil St-Marret December 2011
Unit: 02Distribution of clients according to the type of individual
supportive communication. Model LC4
s Slight M Moderate S SeveresM Slight moderate SA Severe: activeSM Severe moderate SP Severe: passive
No problem Cognitive deficits Psychiatric problemsObservation Nb. clt. % s sM SM SA SP Nb. clt. % s M S Nb. clt. % Nb. clt.
20 (2011-12) 1 3 4 18 - 4 - 26 81 4 1 - 5 16 32
19 (2010-03) 4 12 11 8 - 1 3 23 72 4 1 - 5 16 32
18 (2008-05) 5 17 9 9 - 1 4 23 77 2 - - 2 7 30
Mean 3 11 8 12 - 2 2 24 77 3 1 - 4 13 31
c©20111983 - 2008 : 25 ans de PLAISIR printed on January 16, 2012

Montreal (61000) Centre d’accueil St-Marret December 2011
Unit: 02Distribution of clients according to the type of protection
device.Model LC5
R = Rarely 1 Bed rails 4 Vest restraint 7 Abdominal restraint to bed 11 Half-door 9 Fireproof apronS = Sometimes 2 Geriatric chair table 5 Wrist restraint(s), mitten(s) 14 Abdominal restraint to chair 12 Nursing home controlled outingO = Often 3 Wheelchair table 6 Ankle restraint(s) 8 Body restraint 13 Nursing unit controlled outing 10 Psycho-active drugs0 no protection
Types of protection devicesObservation CLT 0 1 2 3 4 5 6 7 14 8 11 12 13 9 10 Nb. clt.
R Nb. 4 - - - - - - - - - - - - - 1% - - - - - - - - - - - - - 3
20 (2011-12) S Nb. - - - - - - - - - - - - - - 32% - - - - - - - - - - - - - -
O Nb. 16 1 1 - - - - 10 1 - - - - 21% 13 50 3 3 - - - - 31 3 - - - - 66
R Nb. 1 - - - - - - - - - - - - - 1% - - - - - - - - - - - - - 3
19 (2010-03) S Nb. - - - - - - - - - - - - - - 32% - - - - - - - - - - - - - -
O Nb. 27 6 - - - - - 21 1 - - - - 25% 3 84 19 - - - - - 66 3 - - - - 78
R Nb. 1 - - - - - - - - - - - - - -% - - - - - - - - - - - - - -
18 (2008-05) S Nb. - - - - - - - - - - - - - - 30% - - - - - - - - - - - - - -
O Nb. 28 3 2 - - - 7 7 1 - - - - 19% 3 93 10 7 - - - 23 23 3 - - - - 63
R Nb. 2 - - - - - - - - - - - - - 1% - - - - - - - - - - - - - 2
Mean S Nb. - - - - - - - - - - - - - - 31% - - - - - - - - - - - - - -
O Nb. 24 3 1 - - - 2 13 1 - - - - 22% 6 76 11 3 - - - 7 40 3 - - - - 69
c©20111983 - 2008 : 25 ans de PLAISIR printed on January 16, 2012

Montreal (61000) Centre d’accueil St-Marret December 2011
Unit: 02Distribution of clients according to the type of
travelling/mobilization device. Model LC6
2 Cane 8 Wheelchair no assist.0 No decrease or loss 3 Walker 6 Orthesis 9 Wheelchair with ass. 12 Lift1 None (with decr/loss) 4 Quadcane 7 Prosthesis 10 Motorized wheelchair 13 Others
5 Handrails/furniture 11 Geriatric chair
Types de travelling/mobilization devicesObservation CLT 0 1 2 3 4 5 6 7 8 9 10 11 12 13 Nb. clt.
20 (2011-12) Nb. - 5 2 8 - - 4 - 10 18 1 1 11 1% - 16 6 25 - - 12 - 31 56 3 3 34 3 32
19 (2010-03) Nb. - 2 2 10 - - - - 14 15 1 5 14 -% - 6 6 31 - - - - 44 47 3 16 44 - 32
18 (2008-05) Nb. 1 1 2 7 - - 3 - 15 14 2 5 12 2% 3 3 7 23 - - 10 - 50 47 7 17 40 7 30
Mean Nb. 0 3 2 8 - - 2 - 13 16 1 4 12 1% 1 9 6 27 - - 7 - 41 50 4 12 39 3 31
c©20111983 - 2008 : 25 ans de PLAISIR printed on January 16, 2012

Montreal (61000) Centre d’accueil St-Marret December 2011
Unit: 02Average net care minutes required per day by the average client
per area of need. Model LS1
Feed. Elim. Hygi. Mobi. Comm. Resp. Med. IV.Ther Treat. Diag. Basic Technic Total Nb.Observation proce. care care in clt.
A B C D E F G H I J A+B+C+D F+G+H+I+J minutes
20 (2011-12) 23.9 30.0 41.0 36.1 25.9 0.8 10.0 - 2.8 6.2 130.9 19.8 176.5 3213.5% 17.0% 23.2% 20.4% 14.6% 0.4% 5.7% - 1.6% 3.5% 74.2% 11.2% 100%
19 (2010-03) 19.2 32.2 39.2 42.5 20.5 0.6 9.2 0.1 2.4 5.0 133.2 17.3 171.0 3211.2% 18.8% 22.9% 24.9% 12.0% 0.3% 5.4% - 1.4% 2.9% 77.9% 10.1% 100%
18 (2008-05) 21.5 37.2 41.6 41.8 20.1 0.1 7.4 - 2.3 4.1 142.2 13.9 176.1 3012.2% 21.1% 23.6% 23.7% 11.4% - 4.2% - 1.3% 2.3% 80.7% 7.9% 100%
Mean 21.5 33.0 40.6 40.1 22.2 0.5 8.9 - 2.5 5.1 135.3 17.1 174.5 3112.3% 18.9% 23.3% 23.0% 12.7% 0.3% 5.1% - 1.4% 2.9% 77.5% 9.8% 100%
c©20111983 - 2008 : 25 ans de PLAISIR printed on January 16, 2012

Montreal (61000) Centre d’accueil St-Marret December 2011
Unit: 02Average number of minutes and days of rehabilitation received
per week by the client. Model LS2
Physical therapy Occupational therapy Speech therapyObservation CLT CLT CLT Nb.
Mn/week Day/week Nb. % Mn/week Day/week Nb. % Mn/week Day/week Nb. % clt.
20 (2011-12) 60 1.4 9 28 65 1.8 4 12 32
19 (2010-03) 53 1.6 17 53 15 1.0 3 9 32
18 (2008-05) 66 2.3 14 47 34 1.0 4 13 30
Mean 59 1.8 13 43 40 1.3 4 12 31
Note clients not receiving services have been excluded from the calculation for the averages Mn/week.
c©20111983 - 2008 : 25 ans de PLAISIR printed on January 16, 2012

Montreal (61000) Centre d’accueil St-Marret December 2011
Unit: 02Average number of days of nursing rehabilitation services
received per week. Model LS3
Eating/swallowing Toileting Activities Dressing/grooming Locomotion/mobility TransferObservation CLT CLT CLT CLT CLT Nb.
Day/week Nb. % Day/week Nb. % Day/week Nb. % Day/week Nb. % Day/week Nb. % clt.
20 (2011-12) - - - - - - 7.0 4 12 - - - - - - 32
19 (2010-03) - - - 7.0 2 6 7.0 4 12 - - - - - - 32
18 (2008-05) 7.0 1 3 7.0 4 13 7.0 1 3 7.0 1 3 - - - 30
Mean 7.0 0 1 7.0 2 6 7.0 3 10 7.0 0 1 - - - 31
Note The clients not receiving services have been excluded from the calculation for the average Day/week.
c©20111983 - 2008 : 25 ans de PLAISIR printed on January 16, 2012

Montreal (61000) Centre d’accueil St-Marret December 2011
Unit: 02Distribution of clients according to the type of treatment
received.Model LS4
In = received within the institution.Out = received in another facility.
Chemo. Radiation Inhal.th Dialysis Transf. I.V. Urina. Trach. Ostomy Stasis Pres. ulc. Foot care Nb.Observation CLT In Out In Out In Out In Out In Out Ther. cath. care ulc. 1-2 3-4 Nsg Pod. clt.
20 (2011-12) Nb. - - - - - - - - - 1 - 4 - 1 - 2 1 1 - 32% - - - - - - - - - 3 - 12 - 3 - 6 3 3 -
19 (2010-03) Nb. - - - - - - - - - - 1 2 - 1 - 2 1 - - 32% - - - - - - - - - - 3 6 - 3 - 6 3 - -
18 (2008-05) Nb. - - - - - - - - - - - 1 - - - 2 1 - - 30% - - - - - - - - - - - 3 - - - 7 3 - -
Mean Nb. - - - - - - - - - 0 0 2 - 1 - 2 1 0 - 31% - - - - - - - - - 1 1 7 - 2 - 6 3 1 -
c©20111983 - 2008 : 25 ans de PLAISIR printed on January 16, 2012

Montreal (61000) Centre d’accueil St-Marret December 2011
Unit: 02Distribution by class of non revaluated, re-evaluated and newly
admitted clients (in percentage). Model LR1
ClassificationObservation Clients 1 2 3 4 5 6 7 8 Nb.
... 35 min ... 80 ... 125 ... 170 ... 215 ... 260 ... 350 ... ..... clt.
20 (2011-12) all - 6.3 15.6 15.6 37.5 18.8 6.3 - 32newly adm. - 9.1 27.3 27.3 27.3 - 9.1 - 11
re-eval. - 4.8 9.5 9.5 42.9 28.6 4.8 - 21non reval. - - - - - - - - -
19 (2010-03) all - 3.1 18.8 18.8 46.9 9.4 3.1 - 32newly adm. - 5.6 16.7 16.7 44.4 11.1 5.6 - 18
re-eval. - - 21.4 21.4 50.0 7.1 - - 14non reval. - - - - - - - - -
18 (2008-05) all - 3.3 6.7 33.3 40.0 13.3 3.3 - 30newly adm. - - - - - 100.0 - - 2
re-eval. - - - 25.0 62.5 12.5 - - 8non reval. - 5.0 10.0 40.0 35.0 5.0 5.0 - 20
Mean all - 4.3 13.8 22.3 41.5 13.8 4.3 - 31newly adm. - 6.5 19.4 19.4 35.5 12.9 6.5 - 10
re-eval. - 2.3 11.6 16.3 48.8 18.6 2.3 - 14non reval. - 5.0 10.0 40.0 35.0 5.0 5.0 - 7
c©20111983 - 2008 : 25 ans de PLAISIR printed on January 16, 2012

Montreal (61000) Centre d’accueil St-Marret December 2011
Unit: 02Daily number of FTE nursing staff presences required for the
clients as a whole, per shift and according to the type ofactivity, and number of FTE position required per client-year.
Model LR2
DIC CRC AAMTRV Total FTE * Nb.Observation Night Day Evening 24h Night Day Evening 24h Night Day Evening 24h Night Day Evening 24h pos./clt. clt.
20 (2011-12) 1.3 7.7 4.9 13.9 0.2 0.4 0.3 0.9 0.1 0.6 0.3 1.0 1.7 8.7 5.5 15.8 0.83 32
19 (2010-03) 1.5 7.4 4.6 13.5 0.2 0.4 0.3 0.9 0.1 0.6 0.3 1.0 1.8 8.4 5.2 15.4 0.81 32
18 (2008-05) 1.5 7.2 4.3 13.0 0.2 0.4 0.3 0.9 0.1 0.6 0.2 0.9 1.8 8.2 4.8 14.8 0.83 30
Mean 1.4 7.5 4.6 13.5 0.2 0.4 0.3 0.9 0.1 0.6 0.3 1.0 1.8 8.4 5.2 15.4 0.82 31* a FTE position ”works” 218.3 FTE presences per year but is paid for 260.9 presences.
a FTE presence provides 405 productive minutes per day but is paid for 435 ”worked” minutes.
c©20111983 - 2008 : 25 ans de PLAISIR printed on January 16, 2012

Montreal (61000) Centre d’accueil St-Marret December 2011
Unit: 02Average net care minutes required per shift by the average
client.Model LR3
Night Day Evening Level of care ( 24 hours )Observation NtCM NtCM NtCH Variation Class Nb. clt.
20 (2011-12) 16.9 97.7 62.0 176.5 2.94 5 323.2 %
19 (2010-03) 18.5 94.0 58.6 171.0 2.85 5 32-2.9 %
18 (2008-05) 20.2 97.5 58.4 176.1 2.94 5 30
Mean 18.5 96.4 59.7 174.5 2.91 5 31
c©20111983 - 2008 : 25 ans de PLAISIR printed on January 16, 2012

Montreal (61000) Centre d’accueil St-Marret December 2011
Unit: 02Net care minutes required by the average client according to the
days of the week and shifts. Model LR4
Observation Monday Tuesday Wednesday Thursday Friday Saturday Sunday Mean Nb. clt.Night 16.9 16.7 16.9 17.3 17.1 16.8 16.6 16.9
20 (2011-12) Day 101.6 98.6 95.2 97.5 100.3 97.2 93.2 97.7 32Evening 61.0 60.8 65.0 60.7 60.8 60.0 65.5 62.0Min/24h 179.5 176.1 177.1 175.5 178.2 174.0 175.3 176.5Hrs/24h 2.99 2.94 2.95 2.92 2.97 2.90 2.92 2.94
Night 18.3 18.9 19.2 18.3 18.0 18.5 18.0 18.519 (2010-03) Day 93.0 97.6 98.4 89.6 91.9 93.6 93.8 94.0 32
Evening 57.5 60.2 60.2 58.0 58.1 58.5 57.7 58.6Min/24h 168.7 176.6 177.8 166.0 168.0 170.6 169.5 171.0Hrs/24h 2.81 2.94 2.96 2.77 2.80 2.84 2.82 2.85
Night 20.3 20.1 20.6 19.4 20.7 20.5 19.8 20.218 (2008-05) Day 97.1 103.2 92.2 100.2 97.2 99.3 93.5 97.5 30
Evening 57.8 58.9 58.8 57.0 59.4 58.3 58.4 58.4Min/24h 175.3 182.2 171.6 176.6 177.3 178.2 171.6 176.1Hrs/24h 2.92 3.04 2.86 2.94 2.96 2.97 2.86 2.94
Night 18.4 18.5 18.9 18.3 18.6 18.6 18.1 18.5Mean Day 97.2 99.7 95.3 95.7 96.5 96.6 93.5 96.4 31
Evening 58.8 60.0 61.4 58.6 59.5 59.0 60.6 59.7Min/24h 174.5 178.2 175.6 172.6 174.5 174.2 172.2 174.5Hrs/24h 2.91 2.97 2.93 2.88 2.91 2.90 2.87 2.91
c©20111983 - 2008 : 25 ans de PLAISIR printed on January 16, 2012

Montreal (61000) Centre d’accueil St-Marret December 2011
Unit: 02Average number of care hours (net, productive, worked, paid)
required per day by the average client. Model LR5
Observation NtCH PrCH WkCH PdCH Nb. clt.
20 (2011-12) 2.942 3.342 3.590 4.291 32
19 (2010-03) 2.850 3.250 3.491 4.173 32
18 (2008-05) 2.935 3.335 3.582 4.281 30
Mean 2.909 3.309 3.554 4.247 31
c©20111983 - 2008 : 25 ans de PLAISIR printed on January 16, 2012

Montreal (61000) Centre d’accueil St-Marret December 2011
Unit: 02Average net care hours required per day by the average client
non revaluated, re-evaluated and newly admitted. Model LR6
Net care hours / 24 hours Number of clients % of clientsObservation Non reval. Re-evaluated Newly All Non New Non New
NtCH Variation admitted NtCH Variation reval. Re-eval. adm. All reval. Re-eval. adm.
20 (2011-12) - 3.16 17.45 % 2.52 2.94 3.22 % - 21 11 32 - 66 % 34 %
19 (2010-03) - 2.83 2.68 % 2.87 2.85 -2.89 % - 14 18 32 - 44 % 56 %
18 (2008-05) 2.74 3.09 32.71 % 4.24 2.94 - 20 8 2 30 67 % 27 % 7 %
Mean 2.74 3.04 - 2.83 2.91 - 7 14 10 31 21 % 46 % 33 %
c©20111983 - 2008 : 25 ans de PLAISIR printed on January 16, 2012

Montreal (61000) Centre d’accueil St-Marret December 2011
Unit: 02 SYNTHESIS Model LX1
** nursing care Rehabilitation * Handicaps and impairmentsNb. Age Adm. Length % FTE ( NtCH / day ) ( hours / week ) ( % clt. at level 4 or 3 )
Observation clt. Age of stay Wo- pos. / MOB ADL OCC SOC COG AFF BEH
(years) man clt. Tot Basic Com Tech Ph.th. Oc.th. Sp.th. 4 4 4 4 3 3 3
20 (2011-12) 32 83 80 3.3 66 0.83 2.9 2.2 0.4 0.3 0.28 0.14 - 53 94 3 22 19 3 -
19 (2010-03) 32 84 81 3.3 72 0.81 2.9 2.2 0.3 0.3 0.47 0.02 - 50 97 19 31 25 9 3
18 (2008-05) 30 82 78 3.9 67 0.83 2.9 2.4 0.3 0.2 0.51 0.08 - 47 100 20 37 23 20 -
Mean 31 83 80 3.5 68 0.82 2.9 2.3 0.4 0.3 0.42 0.08 - 50 97 14 30 22 11 1
* All the clients including those not receiving services have been included in the calculation for the average hours/week.
** a FTE position ”works” 218.3 FTE presences per year but is paid for 260.9 presences.
a FTE presence provides 405 productive minutes per day but is paid for 435 ”worked” minutes.
c©20111983 - 2008 : 25 ans de PLAISIR printed on January 16, 2012

Montreal (61000) Centre d’accueil St-Marret December 2011
Unit: 02Distribution of clients according to sex and age on admission
and at the time of observation.Model N1
Total number of clients : 32
Age of clients Age on admission Age at time of observationNumber % Number % Women (%) Men (%)
Less than 30 years - - - - - -
30 to 44 years - - - - - -
45 to 54 years 2 6.2 1 3.1 - 100.0
55 to 64 years 2 6.2 1 3.1 100.0 -
65 to 69 years 2 6.2 2 6.2 50.0 50.0
70 to 74 years 3 9.4 3 9.4 66.7 33.3
75 to 79 years 5 15.6 5 15.6 40.0 60.0
80 to 84 years 4 12.5 4 12.5 75.0 25.0
85 to 89 years 7 21.9 5 15.6 80.0 20.0
90 to 94 years 3 9.4 7 21.9 85.7 14.3
95 years and over 4 12.5 4 12.5 50.0 50.0
Total 32 100.0 32 100.0 65.6 34.4
Average 80.0 83.3
c©20111983 - 2008 : 25 ans de PLAISIR printed on January 16, 2012

Montreal (61000) Centre d’accueil St-Marret December 2011
Unit: 02 Distribution of clients by level of handicap. Model N2
Total number of clients : 32Mobility Phys. indepen- Occupation Social Orientation
dence ADL integrationLevel * % n % n % n % n % n
1 - - - - - - - - - -
2 - - - - - - - - - -
3 - - - - - - - - - -
4 - - - - - - - - - -
5 - - - - 3 1 3 1 28 9
6 19 6 6 2 59 19 75 24 56 18
7 28 9 31 10 34 11 19 6 6 2
8 12 4 53 17 3 1 3 1 9 3
9 41 13 9 3 - - - - - -
* See description in PLAISIR form, (Level 1 = Adequate) ... (Level 9 = Nil)
c©20111983 - 2008 : 25 ans de PLAISIR printed on January 16, 2012

Montreal (61000) Centre d’accueil St-Marret December 2011
Unit: 02 Average care minutes required by each client for each shift. Model N3
Total number of clients : 32## of Night Day Evening Level of care ( 24 hours ) Last evalua-clients NtCM NtCM NtCH Class tion date
046 11.5 97.1 60.9 169.5 2.82 4 2011-11114 22.6 143.9 80.6 247.1 4.12 6 2011-12123 29.7 106.7 77.8 214.2 3.57 5 2011-11124 21.5 127.5 77.8 226.8 3.78 6 2011-11129 18.0 113.6 68.4 200.0 3.33 5 2011-11133 10.5 104.1 48.2 162.8 2.71 4 2011-11136 13.5 112.3 55.2 181.0 3.02 5 2011-11137 20.1 121.2 79.3 220.6 3.68 6 2011-11138 24.1 118.3 74.5 217.0 3.62 6 2011-11141 22.5 86.8 79.1 188.4 3.14 5 2011-11143 14.5 99.9 69.8 184.2 3.07 5 2011-11144 24.5 95.4 70.0 189.9 3.16 5 2011-11146 22.6 116.2 61.9 200.7 3.35 5 2011-11147 3.5 69.9 39.5 113.0 1.88 3 2011-11149 3.8 32.2 28.3 64.3 1.07 2 2011-11150 33.5 150.6 71.7 255.8 4.26 6 2011-11152 24.4 120.9 85.3 230.6 3.84 6 2011-11154 16.8 100.5 62.8 180.1 3.00 5 2011-11155 23.9 134.2 102.1 260.1 4.34 7 2011-11159 23.0 85.9 62.3 171.2 2.85 5 2011-11160 4.5 55.5 46.9 106.9 1.78 3 2011-11161 25.2 84.6 61.8 171.7 2.86 5 2011-11162 5.9 85.7 31.4 123.0 2.05 3 2011-11163 9.0 97.3 42.2 148.5 2.47 4 2011-11164 20.0 106.4 67.5 193.9 3.23 5 2011-11165 9.0 92.3 64.4 165.6 2.76 4 2011-12166 8.5 46.0 35.7 90.2 1.50 3 2011-11167 28.1 83.4 72.7 184.2 3.07 5 2011-11168 26.5 157.5 90.3 274.4 4.57 7 2011-11169 2.5 33.2 23.4 59.1 0.98 2 2011-11
c©20111983 - 2008 : 25 ans de PLAISIR printed on January 16, 2012

Montreal (61000) Centre d’accueil St-Marret December 2011
Unit: 02 Average care minutes required by each client for each shift. Model N3
Total number of clients : 32## of Night Day Evening Level of care ( 24 hours ) Last evalua-clients NtCM NtCM NtCH Class tion date
170 12.0 84.9 57.7 154.6 2.58 4 2011-11171 5.0 60.9 34.1 99.9 1.67 3 2011-11
Mean 16.9 97.7 62.0 176.5 2.94 5
c©20111983 - 2008 : 25 ans de PLAISIR printed on January 16, 2012

Montreal (61000) Centre d’accueil St-Marret December 2011
Unit: 02Distribution of clients according to sex, per intervals of net care
minutes required per 24 hours. Model N4
Total number of clients : 32
Number PercentageClients requiring :
Women Men Total Women Men Total
Less than 60 min. (1 h) - 1 1 - 9.1 3.1
61 to 90 min. (+1 ≤ 1.5 h ) 1 - 1 4.8 - 3.1
91 to 120 min. (+1.5 ≤ 2 h ) 2 2 4 9.5 18.2 12.5
121 to 150 min. (+2 ≤ 2.5 h ) 1 1 2 4.8 9.1 6.2
151 to 180 min. (+2.5 ≤ 3 h ) 6 - 6 28.6 - 18.8
181 to 210 min. (+3 ≤ 3.5 h ) 6 3 9 28.6 27.3 28.1
211 to 240 min. (+3.5 ≤ 4 h ) 3 2 5 14.3 18.2 15.6
241 to 270 min. (+4 ≤ 4.5 h ) 2 1 3 9.5 9.1 9.4
271 to 300 min. (+4.5 ≤ 5 h ) - 1 1 - 9.1 3.1
301 to 330 min. (+5 ≤ 5.5 h ) - - - - - -
Greater than 330 min. (+5.5 h ) - - - - - -
Total 21 11 32 100.0 100.0 100.0
c©20111983 - 2008 : 25 ans de PLAISIR printed on January 16, 2012

Montreal (61000) Centre d’accueil St-Marret December 2011
Unit: 02 Nursing staff required per shift as measured in number of: Model N5
- FTE presences for the clients as a whole - WkCH for the clients as a whole and per client- FTE positions for the clients as a whole and per client - clients per FTE presence
Total number of clients : 32Mean Mean Number
Monday Tuesday Wednesday Thursday Friday Saturday Sunday Total Mean Monday to Saturday of FTEweek / day Friday to Sunday positions
FTE presences 1.67 1.65 1.67 1.70 1.69 1.66 1.64 11.67 1.67 1.67 1.65Night 2.79
WkCH 12.082 11.954 12.093 12.302 12.218 12.057 11.888 84.595 12.085 12.130 11.973
CLT/Presence 19.20
FTE presences 9.04 8.80 8.53 8.72 8.93 8.69 8.38 61.09 8.73 8.80 8.53Day 14.60
WkCH 65.534 63.823 61.850 63.191 64.776 62.992 60.744 442.909 63.273 63.835 61.868
CLT/Presence 3.67
FTE presences 5.37 5.36 5.69 5.35 5.36 5.30 5.73 38.16 5.45 5.43 5.51Evening 9.12
WkCH 38.955 38.855 41.259 38.784 38.861 38.392 41.550 276.656 39.522 39.343 39.971
CLT/Presence 5.87
FTE presences 16.08 15.81 15.89 15.76 15.98 15.65 15.75 110.92 15.85 15.90 15.7024h 26.51
WkCH 116.571 114.632 115.201 114.277 115.855 113.441 114.182 804.160 114.880 115.307 113.811
Per client :Night WkCH 0.378 0.374 0.378 0.384 0.382 0.377 0.372 2.644 0.378 0.379 0.374 0.09Day WkCH 2.048 1.994 1.933 1.975 2.024 1.968 1.898 13.841 1.977 1.995 1.933 0.46
Evening WkCH 1.217 1.214 1.289 1.212 1.214 1.200 1.298 8.645 1.235 1.229 1.249 0.2924h WkCH 3.643 3.582 3.600 3.571 3.620 3.545 3.568 25.130 3.590 3.603 3.557 0.83
a FTE position ”works” 218.3 FTE presences per year but is paid for 260.9 presences. Version NIV/24/405-435/218.3
a FTE presence provides 405 productive minutes per day but is paid for 435 ”worked” minutes.
c©20111983 - 2008 : 25 ans de PLAISIR printed on January 16, 2012

Montreal (61000) Centre d’accueil St-Marret December 2011
Unit: 02Distribution by class of clients according to the types of services
received.Model N6
Total number of clients : 32Classification
Type of CLT 1 2 3 4 5 6 7 8 Nb.services ... 35 min ... 80 ... 125 ... 170 ... 215 ... 260 ... 350 ... ..... clt.
Nursing Nb. - 2 3 4 5 6 1 - 21only % - 9.5 14.3 19.0 23.8 28.6 4.8 - 65.6
Nursing Nb. - - 2 - 5 - - - 7and Ph.th. % - - 28.6 - 71.4 - - - 21.9
Nursing Nb. - - - - 1 - 1 - 2and Oc.th. % - - - - 50.0 - 50.0 - 6.2
Nursing and Oc.th. Nb. - - - 1 1 - - - 2and Ph.th. % - - - 50.0 50.0 - - - 6.2
Total Nb. - 2 5 5 12 6 2 - 32% - 6.2 15.6 15.6 37.5 18.8 6.2 - 100.0
c©20111983 - 2008 : 25 ans de PLAISIR printed on January 16, 2012

Montreal (61000) Centre d’accueil St-Marret December 2011
Unit: 02 Diseases prevalence (number and % of clients). Model N7
Total number of clients : 32Diseases n % Diseases n %
Malignant neoplasm 6 18.8 % Glaucoma 6 18.8 %Cataract - -
Acquired hypothyroidism 7 21.9 % Blindness, both eyes - -Diabetes mellitus 8 25.0 % Retinal disorders 6 18.8 %
Obesity - -Deficiency anemias 3 9.4 %
Hearing loss - -
Organic psychotic conditions 14 43.8 % Hypertensive diseases 10 31.2 %Schizophrenic disorders 2 6.2 %
Other psychoses 3 9.4 % Ischemic heart diseases 8 25.0 %Heart failure 2 6.2 %
Other heart diseases 9 28.1 %Nevrotic disorders 1 3.1 %
Spec. nonpsycho. disor. due organ. brain dam. 1 3.1 % Cerebrovascular diseases - -Depressive disorders 4 12.5 % Late effects of cerebrovascular diseases 8 25.0 %
Other nonpsychotic disorders 3 9.4 % Diseases of arteries 9 28.1 %
Chronic obstructive pulmonary diseases 11 34.4 %Senility without mention of psychosis - -
Mental retardation - - Hernia of abdominal cavity - -Cerebral degenerations - Alzheimer 5 15.6 %
Renal failure 7 21.9 %
Parkinson and other extra pyramidal diseases 5 15.6 % Rheumatoid arthritis 2 6.2 %Multiple sclerosis and demyelinating diseases 3 9.4 % Osteoarthrosis - -
Hemiplegia - - Other arthropathies - -Epilepsy - - Dorsopathies - -
Other disorders of the central nervous system 1 3.1 % Osteopathies 9 28.1 %
Late effects musculo squel. tissue injuries 11 34.4 % Aphasia - -
c©20111983 - 2008 : 25 ans de PLAISIR printed on January 16, 2012

Montreal (61000) Centre d’accueil St-Marret December 2011
Unit: 02Net care minutes required in the average per day and per care
category by the average client in the different categories ofcognitive deficits and of psychiatric problems.
Model N8
Categories Feed. Elim. Hygi. Mobi. Basic care Technical Communication NtCM Nb.A B C D (A to D) care clt.
No problem 11.5 - 19.4 - 30.9 13.2 15.0 59.1 119.5% - 32.8% - 52.3% 22.3% 25.4% 100.0%
Light CD 14.3 19.0 35.5 22.6 91.4 16.4 16.5 124.2 411.5% 15.3% 28.5% 18.2% 73.5% 13.2% 13.3% 100.0%
Moderate light CD 29.4 34.3 43.2 42.2 149.2 22.2 27.7 199.2 18cooperative c. 14.8% 17.2% 21.7% 21.2% 74.9% 11.1% 13.9% 100.0%
Moderate severe CD - - - - - - - - -non cooperative c. - - - - - - - -
Severe CD Active CLT 21.3 32.1 41.1 44.8 139.2 18.5 31.4 189.1 4active client 11.2% 16.9% 21.7% 23.7% 73.6% 9.8% 16.6% 100.0%
Severe CD Passive CLT - - - - - - - - -passive client - - - - - - - -
Total CD 25.8 31.6 41.7 39.6 138.8 20.7 26.6 186.1 2613.9% 17.0% 22.4% 21.3% 74.6% 11.1% 14.3% 100.0%
Light PP 17.6 25.2 41.6 23.6 108.0 14.1 20.6 142.8 412.3% 17.7% 29.1% 16.5% 75.7% 9.9% 14.5% 100.0%
Moderate PP 10.0 36.0 42.6 29.7 118.3 23.6 39.1 181.0 15.5% 19.9% 23.5% 16.4% 65.4% 13.0% 21.6% 100.0%
Severe PP - - - - - - - - -- - - - - - - -
Total PP 16.1 27.4 41.8 24.8 110.1 16.0 24.3 150.4 510.7% 18.2% 27.8% 16.5% 73.2% 10.6% 16.2% 100.0%
Total 23.9 30.0 41.0 36.1 130.9 19.8 25.9 176.5 3213.5% 17.0% 23.2% 20.4% 74.2% 11.2% 14.6% 100.0%
CD = Cognitive Deficits PP = Psychiatric Problems CLT = Client
c©20111983 - 2008 : 25 ans de PLAISIR printed on January 16, 2012

Unit: 03 3rd floor
LONGITUDINAL and NON-COMPARATIVE MODELS
64

Montreal (61000) Centre d’accueil St-Marret December 2011
Unit: 03 Distribution of clients by level of handicap. Model LC1
Handicaps Mobility Phys. indepen- Occupation Social Orientationdence ADL integration Nb.
Observation 1 2 3 4 1 2 3 4 1 2 3 4 1 2 3 4 1 2 3 4 clt.% % % % % % % % % % % % % % % % % % % %
20 (2011-12) - 6 56 38 - - 3 97 - 34 47 19 - - 50 50 - 38 28 34 32
19 (2010-03) - - 52 48 - - - 100 - 23 58 19 - - 61 39 - 48 32 19 31
18 (2008-05) - 16 56 28 - - 13 88 6 38 50 6 - 13 63 25 - 59 31 9 32
Mean - 7 55 38 - - 5 95 2 32 52 15 - 4 58 38 - 48 31 21 32
Handicap code: 1 = adequate, 2 = limited, 3 = very limited, 4 = nil
c©20111983 - 2008 : 25 ans de PLAISIR printed on January 16, 2012
Montreal (61000) Centre d’accueil St-Marret December 2011
Unit: 03 Distribution of clients by level of impairment. Model LC2
Impairments Cognitive Affective Behavioral Language Sight HearingNb.
Observation 1 2 3 1 2 3 1 2 3 1 2 3 1 2 3 1 2 3 clt.% % % % % % % % % % % % % % % % % %
20 (2011-12) 6 41 53 13 66 22 3 94 3 38 53 9 50 44 6 34 66 - 32
19 (2010-03) 10 52 39 10 74 16 23 71 6 16 74 10 19 68 13 26 74 - 31
18 (2008-05) 13 63 25 19 81 - 3 97 - 56 41 3 59 41 - 47 50 3 32
Mean 9 52 39 14 74 13 9 87 3 37 56 7 43 51 6 36 63 1 32
Impairment code: 1 = non impaired, 2 = impaired, 3 = totaly impaired
c©20111983 - 2008 : 25 ans de PLAISIR printed on January 16, 2012

Montreal (61000) Centre d’accueil St-Marret December 2011
Unit: 03Distribution of clients according to the type of psychological
problem. Model LC3
0 No problem 1 Physical abuse 3 Disturbs others 6 Persist. anxiety 9 Withdrawal 12 Early awakening with mood disturbance2 Verbal abuse 4 Agitation 7 Sadness 10 Suicidal thoughts 13 Awake 7 hours or less a day
5 Wandering 8 Expr. of distress 11 Freq. thoughts of death
Types of psychological problemObservation CLT 0 1 2 3 4 5 6 7 8 9 10 11 12 13 Nb. clt.
20 (2011-12) Nb. 9 4 4 1 16 3 18 3 - 4 - - - - 32% 28 12 12 3 50 9 56 9 - 12 - - - -
19 (2010-03) Nb. 12 4 8 2 4 1 9 9 - 6 1 - - - 31% 39 13 26 6 13 3 29 29 - 19 3 - - -
18 (2008-05) Nb. 8 3 3 3 3 3 17 7 - 2 1 - - - 32% 25 9 9 9 9 9 53 22 - 6 3 - - -
Mean Nb. 10 4 5 2 8 2 15 6 - 4 1 - - - 32% 31 12 16 6 24 7 46 20 - 13 2 - - -
c©20111983 - 2008 : 25 ans de PLAISIR printed on January 16, 2012

Montreal (61000) Centre d’accueil St-Marret December 2011
Unit: 03Distribution of clients according to the type of individual
supportive communication. Model LC4
s Slight M Moderate S SeveresM Slight moderate SA Severe: activeSM Severe moderate SP Severe: passive
No problem Cognitive deficits Psychiatric problemsObservation Nb. clt. % s sM SM SA SP Nb. clt. % s M S Nb. clt. % Nb. clt.
20 (2011-12) 2 6 7 9 - 5 6 27 84 3 - - 3 9 32
19 (2010-03) 3 10 9 10 - 2 4 25 81 3 - - 3 10 31
18 (2008-05) 5 16 14 8 - 3 - 25 78 2 - - 2 6 32
Mean 3 11 10 9 - 3 3 26 81 3 - - 3 8 32
c©20111983 - 2008 : 25 ans de PLAISIR printed on January 16, 2012

Montreal (61000) Centre d’accueil St-Marret December 2011
Unit: 03Distribution of clients according to the type of protection
device.Model LC5
R = Rarely 1 Bed rails 4 Vest restraint 7 Abdominal restraint to bed 11 Half-door 9 Fireproof apronS = Sometimes 2 Geriatric chair table 5 Wrist restraint(s), mitten(s) 14 Abdominal restraint to chair 12 Nursing home controlled outingO = Often 3 Wheelchair table 6 Ankle restraint(s) 8 Body restraint 13 Nursing unit controlled outing 10 Psycho-active drugs0 no protection
Types of protection devicesObservation CLT 0 1 2 3 4 5 6 7 14 8 11 12 13 9 10 Nb. clt.
R Nb. 5 - - - - - - - - - - - - - 1% - - - - - - - - - - - - - 3
20 (2011-12) S Nb. - - - - - - - 1 - - - - - - 32% - - - - - - - 3 - - - - - -
O Nb. 8 - - - - - - 16 - - - 1 - 18% 16 25 - - - - - - 50 - - - 3 - 56
R Nb. 2 - - - - - - - 1 - - - - - -% - - - - - - - 3 - - - - - -
19 (2010-03) S Nb. - - - - - - - - - - - - - - 31% - - - - - - - - - - - - - -
O Nb. 26 1 1 - - - - 8 - - - - - 14% 6 84 3 3 - - - - 26 - - - - - 45
R Nb. 1 - - - - - - - - - - - - - -% - - - - - - - - - - - - - -
18 (2008-05) S Nb. - - - - - - 1 - - - - - - - 32% - - - - - - 3 - - - - - - -
O Nb. 27 1 1 - - - 6 4 - - - 2 - 15% 3 84 3 3 - - - 19 13 - - - 6 - 47
R Nb. 3 - - - - - - - 0 - - - - - 0% - - - - - - - 1 - - - - - 1
Mean S Nb. - - - - - - 0 0 - - - - - - 32% - - - - - - 1 1 - - - - - -
O Nb. 20 1 1 - - - 2 9 - - - 1 - 16% 8 64 2 2 - - - 6 29 - - - 3 - 49
c©20111983 - 2008 : 25 ans de PLAISIR printed on January 16, 2012

Montreal (61000) Centre d’accueil St-Marret December 2011
Unit: 03Distribution of clients according to the type of
travelling/mobilization device. Model LC6
2 Cane 8 Wheelchair no assist.0 No decrease or loss 3 Walker 6 Orthesis 9 Wheelchair with ass. 12 Lift1 None (with decr/loss) 4 Quadcane 7 Prosthesis 10 Motorized wheelchair 13 Others
5 Handrails/furniture 11 Geriatric chair
Types de travelling/mobilization devicesObservation CLT 0 1 2 3 4 5 6 7 8 9 10 11 12 13 Nb. clt.
20 (2011-12) Nb. - 3 1 9 - - - - 13 12 1 6 15 -% - 9 3 28 - - - - 41 38 3 19 47 - 32
19 (2010-03) Nb. - 2 1 15 - - 2 - 7 10 - 6 10 -% - 6 3 48 - - 6 - 23 32 - 19 32 - 31
18 (2008-05) Nb. 1 2 - 15 - - 2 - 17 13 1 3 8 4% 3 6 - 47 - - 6 - 53 41 3 9 25 12 32
Mean Nb. 0 2 1 13 - - 1 - 12 12 1 5 11 1% 1 7 2 41 - - 4 - 39 37 2 16 35 4 32
c©20111983 - 2008 : 25 ans de PLAISIR printed on January 16, 2012

Montreal (61000) Centre d’accueil St-Marret December 2011
Unit: 03Average net care minutes required per day by the average client
per area of need. Model LS1
Feed. Elim. Hygi. Mobi. Comm. Resp. Med. IV.Ther Treat. Diag. Basic Technic Total Nb.Observation proce. care care in clt.
A B C D E F G H I J A+B+C+D F+G+H+I+J minutes
20 (2011-12) 27.3 32.6 35.4 36.8 22.7 0.6 9.3 - 0.9 3.7 132.0 14.5 169.3 3216.1% 19.3% 20.9% 21.7% 13.4% 0.3% 5.5% - 0.5% 2.2% 78.0% 8.6% 100%
19 (2010-03) 26.1 33.0 36.4 33.7 20.0 0.3 9.1 0.1 2.6 4.8 129.2 16.8 165.9 3115.7% 19.9% 21.9% 20.3% 12.0% 0.2% 5.5% - 1.5% 2.9% 77.8% 10.1% 100%
18 (2008-05) 13.8 30.0 35.9 35.8 19.8 - 7.3 - 1.9 3.7 115.5 13.0 148.3 329.3% 20.2% 24.2% 24.1% 13.3% - 4.9% - 1.3% 2.5% 77.9% 8.8% 100%
Mean 22.4 31.9 35.9 35.4 20.8 0.3 8.6 - 1.8 4.1 125.5 14.8 161.1 3213.9% 19.8% 22.3% 22.0% 12.9% 0.2% 5.3% - 1.1% 2.5% 77.9% 9.2% 100%
c©20111983 - 2008 : 25 ans de PLAISIR printed on January 16, 2012

Montreal (61000) Centre d’accueil St-Marret December 2011
Unit: 03Average number of minutes and days of rehabilitation received
per week by the client. Model LS2
Physical therapy Occupational therapy Speech therapyObservation CLT CLT CLT Nb.
Mn/week Day/week Nb. % Mn/week Day/week Nb. % Mn/week Day/week Nb. % clt.
20 (2011-12) 95 2.2 4 12 60 1.0 2 6 32
19 (2010-03) 60 1.4 14 45 120 2.0 1 3 31
18 (2008-05) 63 1.9 17 53 165 3.0 2 6 32
Mean 66 1.7 12 37 114 2.0 2 5 32
Note clients not receiving services have been excluded from the calculation for the averages Mn/week.
c©20111983 - 2008 : 25 ans de PLAISIR printed on January 16, 2012

Montreal (61000) Centre d’accueil St-Marret December 2011
Unit: 03Average number of days of nursing rehabilitation services
received per week. Model LS3
Eating/swallowing Toileting Activities Dressing/grooming Locomotion/mobility TransferObservation CLT CLT CLT CLT CLT Nb.
Day/week Nb. % Day/week Nb. % Day/week Nb. % Day/week Nb. % Day/week Nb. % clt.
20 (2011-12) - - - - - - 7.0 4 12 - - - - - - 32
19 (2010-03) - - - 7.0 1 3 7.0 4 13 - - - - - - 31
18 (2008-05) - - - 7.0 6 19 6.5 4 12 - - - - - - 32
Mean - - - 7.0 2 7 6.8 4 13 - - - - - - 32
Note The clients not receiving services have been excluded from the calculation for the average Day/week.
c©20111983 - 2008 : 25 ans de PLAISIR printed on January 16, 2012
Montreal (61000) Centre d’accueil St-Marret December 2011
Unit: 03Distribution of clients according to the type of treatment
received.Model LS4
In = received within the institution.Out = received in another facility.
Chemo. Radiation Inhal.th Dialysis Transf. I.V. Urina. Trach. Ostomy Stasis Pres. ulc. Foot care Nb.Observation CLT In Out In Out In Out In Out In Out Ther. cath. care ulc. 1-2 3-4 Nsg Pod. clt.
20 (2011-12) Nb. - - - - - - - - - - - 1 - - - 1 - - - 32% - - - - - - - - - - - 3 - - - 3 - - -
19 (2010-03) Nb. - - - - - - - - - - 1 2 - - - 1 - - - 31% - - - - - - - - - - 3 6 - - - 3 - - -
18 (2008-05) Nb. 1 - - - - - - - - - - 1 - - - 2 - - - 32% 3 - - - - - - - - - - 3 - - - 6 - - -
Mean Nb. 0 - - - - - - - - - 0 1 - - - 1 - - - 32% 1 - - - - - - - - - 1 4 - - - 4 - - -
c©20111983 - 2008 : 25 ans de PLAISIR printed on January 16, 2012
Montreal (61000) Centre d’accueil St-Marret December 2011
Unit: 03Distribution by class of non revaluated, re-evaluated and newly
admitted clients (in percentage). Model LR1
ClassificationObservation Clients 1 2 3 4 5 6 7 8 Nb.
... 35 min ... 80 ... 125 ... 170 ... 215 ... 260 ... 350 ... ..... clt.
20 (2011-12) all - 6.3 12.5 28.1 28.1 18.8 6.3 - 32newly adm. - - 20.0 40.0 26.7 13.3 - - 15
re-eval. - 11.8 5.9 17.6 29.4 23.5 11.8 - 17non reval. - - - - - - - - -
19 (2010-03) all - 6.5 16.1 35.5 19.4 12.9 9.7 - 31newly adm. - 7.1 21.4 50.0 7.1 7.1 7.1 - 14
re-eval. - 5.9 11.8 23.5 29.4 17.6 11.8 - 17non reval. - - - - - - - - -
18 (2008-05) all 3.1 15.6 9.4 25.0 40.6 6.3 - - 32newly adm. - 28.6 - 14.3 42.9 14.3 - - 7
re-eval. - 16.7 - 16.7 66.7 - - - 6non reval. 5.3 10.5 15.8 31.6 31.6 5.3 - - 19
Mean all 1.1 9.5 12.6 29.5 29.5 12.6 5.3 - 32newly adm. - 8.3 16.7 38.9 22.2 11.1 2.8 - 12
re-eval. - 10.0 7.5 20.0 35.0 17.5 10.0 - 13non reval. 5.3 10.5 15.8 31.6 31.6 5.3 - - 6
c©20111983 - 2008 : 25 ans de PLAISIR printed on January 16, 2012

Montreal (61000) Centre d’accueil St-Marret December 2011
Unit: 03Daily number of FTE nursing staff presences required for the
clients as a whole, per shift and according to the type ofactivity, and number of FTE position required per client-year.
Model LR2
DIC CRC AAMTRV Total FTE * Nb.Observation Night Day Evening 24h Night Day Evening 24h Night Day Evening 24h Night Day Evening 24h pos./clt. clt.
20 (2011-12) 1.5 7.3 4.5 13.4 0.2 0.4 0.3 0.9 0.1 0.6 0.3 1.0 1.9 8.3 5.1 15.3 0.80 32
19 (2010-03) 1.4 7.1 4.2 12.7 0.2 0.4 0.3 0.9 0.1 0.6 0.3 1.0 1.7 8.1 4.7 14.5 0.78 31
18 (2008-05) 1.2 6.5 4.0 11.7 0.2 0.4 0.3 0.9 0.1 0.6 0.3 1.0 1.6 7.5 4.6 13.6 0.71 32
Mean 1.4 7.0 4.2 12.6 0.2 0.4 0.3 0.9 0.1 0.6 0.3 1.0 1.7 8.0 4.8 14.5 0.76 32* a FTE position ”works” 218.3 FTE presences per year but is paid for 260.9 presences.
a FTE presence provides 405 productive minutes per day but is paid for 435 ”worked” minutes.
c©20111983 - 2008 : 25 ans de PLAISIR printed on January 16, 2012

Montreal (61000) Centre d’accueil St-Marret December 2011
Unit: 03Average net care minutes required per shift by the average
client.Model LR3
Night Day Evening Level of care ( 24 hours )Observation NtCM NtCM NtCH Variation Class Nb. clt.
20 (2011-12) 19.5 92.6 57.2 169.3 2.82 4 322.0 %
19 (2010-03) 18.5 92.6 54.8 165.9 2.77 4 3111.9 %
18 (2008-05) 15.5 81.9 50.9 148.3 2.47 4 32
Mean 17.8 89.0 54.3 161.1 2.69 4 32
c©20111983 - 2008 : 25 ans de PLAISIR printed on January 16, 2012

Montreal (61000) Centre d’accueil St-Marret December 2011
Unit: 03Net care minutes required by the average client according to the
days of the week and shifts. Model LR4
Observation Monday Tuesday Wednesday Thursday Friday Saturday Sunday Mean Nb. clt.Night 19.4 21.1 18.4 18.6 19.8 20.2 19.1 19.5
20 (2011-12) Day 96.3 92.6 91.7 93.0 94.8 88.9 91.1 92.6 32Evening 58.0 58.0 56.3 58.2 58.2 55.6 55.9 57.2Min/24h 173.6 171.7 166.4 169.8 172.8 164.7 166.1 169.3Hrs/24h 2.89 2.86 2.77 2.83 2.88 2.74 2.77 2.82
Night 18.5 17.9 19.0 17.1 18.6 19.5 18.7 18.519 (2010-03) Day 93.2 92.0 94.2 89.1 93.9 93.1 92.9 92.6 31
Evening 54.1 53.6 54.7 52.9 55.6 56.3 56.7 54.8Min/24h 165.8 163.5 167.9 159.2 168.2 168.9 168.3 165.9Hrs/24h 2.76 2.72 2.80 2.65 2.80 2.81 2.80 2.77
Night 15.1 15.0 16.1 15.9 15.4 15.0 15.6 15.518 (2008-05) Day 81.6 82.9 83.4 79.3 81.3 84.7 80.1 81.9 32
Evening 50.4 51.1 50.5 51.5 51.0 51.1 50.8 50.9Min/24h 147.2 149.1 150.1 146.8 147.7 150.8 146.5 148.3Hrs/24h 2.45 2.48 2.50 2.45 2.46 2.51 2.44 2.47
Night 17.7 18.0 17.8 17.2 17.9 18.2 17.8 17.8Mean Day 90.4 89.1 89.7 87.1 90.0 88.8 88.0 89.0 32
Evening 54.2 54.3 53.8 54.2 54.9 54.3 54.4 54.3Min/24h 162.2 161.4 161.4 158.6 162.8 161.4 160.2 161.1Hrs/24h 2.70 2.69 2.69 2.64 2.71 2.69 2.67 2.69
c©20111983 - 2008 : 25 ans de PLAISIR printed on January 16, 2012

Montreal (61000) Centre d’accueil St-Marret December 2011
Unit: 03Average number of care hours (net, productive, worked, paid)
required per day by the average client. Model LR5
Observation NtCH PrCH WkCH PdCH Nb. clt.
20 (2011-12) 2.822 3.222 3.460 4.135 32
19 (2010-03) 2.766 3.166 3.400 4.064 31
18 (2008-05) 2.472 2.872 3.084 3.686 32
Mean 2.686 3.086 3.314 3.961 32
c©20111983 - 2008 : 25 ans de PLAISIR printed on January 16, 2012

Montreal (61000) Centre d’accueil St-Marret December 2011
Unit: 03Average net care hours required per day by the average client
non revaluated, re-evaluated and newly admitted. Model LR6
Net care hours / 24 hours Number of clients % of clientsObservation Non reval. Re-evaluated Newly All Non New Non New
NtCH Variation admitted NtCH Variation reval. Re-eval. adm. All reval. Re-eval. adm.
20 (2011-12) - 2.94 4.21 % 2.69 2.82 2.01 % - 17 15 32 - 53 % 47 %
19 (2010-03) - 2.97 18.58 % 2.51 2.77 11.90 % - 17 14 31 - 55 % 45 %
18 (2008-05) 2.40 2.63 2.85 % 2.52 2.47 - 19 6 7 32 59 % 19 % 22 %
Mean 2.40 2.91 - 2.59 2.69 - 6 13 12 32 20 % 42 % 38 %
c©20111983 - 2008 : 25 ans de PLAISIR printed on January 16, 2012

Montreal (61000) Centre d’accueil St-Marret December 2011
Unit: 03 SYNTHESIS Model LX1
** nursing care Rehabilitation * Handicaps and impairmentsNb. Age Adm. Length % FTE ( NtCH / day ) ( hours / week ) ( % clt. at level 4 or 3 )
Observation clt. Age of stay Wo- pos. / MOB ADL OCC SOC COG AFF BEH
(years) man clt. Tot Basic Com Tech Ph.th. Oc.th. Sp.th. 4 4 4 4 3 3 3
20 (2011-12) 32 88 85 2.8 84 0.80 2.8 2.2 0.4 0.2 0.20 0.06 - 38 97 19 50 53 22 3
19 (2010-03) 31 87 84 3.0 84 0.78 2.8 2.2 0.3 0.3 0.45 0.06 - 48 100 19 39 39 16 6
18 (2008-05) 32 86 82 3.6 84 0.71 2.5 1.9 0.3 0.2 0.56 0.17 - 28 88 6 25 25 - -
Mean 32 87 84 3.1 84 0.76 2.7 2.1 0.3 0.2 0.40 0.10 - 38 95 15 38 39 13 3
* All the clients including those not receiving services have been included in the calculation for the average hours/week.
** a FTE position ”works” 218.3 FTE presences per year but is paid for 260.9 presences.
a FTE presence provides 405 productive minutes per day but is paid for 435 ”worked” minutes.
c©20111983 - 2008 : 25 ans de PLAISIR printed on January 16, 2012

Montreal (61000) Centre d’accueil St-Marret December 2011
Unit: 03Distribution of clients according to sex and age on admission
and at the time of observation.Model N1
Total number of clients : 32
Age of clients Age on admission Age at time of observationNumber % Number % Women (%) Men (%)
Less than 30 years - - - - - -
30 to 44 years 1 3.1 1 3.1 - 100.0
45 to 54 years - - - - - -
55 to 64 years 1 3.1 - - - -
65 to 69 years 1 3.1 1 3.1 100.0 -
70 to 74 years 2 6.2 1 3.1 100.0 -
75 to 79 years 1 3.1 3 9.4 100.0 -
80 to 84 years 6 18.8 1 3.1 100.0 -
85 to 89 years 8 25.0 11 34.4 81.8 18.2
90 to 94 years 6 18.8 5 15.6 80.0 20.0
95 years and over 6 18.8 9 28.1 88.9 11.1
Total 32 100.0 32 100.0 84.4 15.6
Average 84.8 87.6
c©20111983 - 2008 : 25 ans de PLAISIR printed on January 16, 2012

Montreal (61000) Centre d’accueil St-Marret December 2011
Unit: 03 Distribution of clients by level of handicap. Model N2
Total number of clients : 32Mobility Phys. indepen- Occupation Social Orientation
dence ADL integrationLevel * % n % n % n % n % n
1 - - - - - - - - - -
2 - - - - - - - - - -
3 - - - - - - - - - -
4 3 1 - - - - - - 6 2
5 3 1 - - - - 19 6 31 10
6 12 4 3 1 34 11 31 10 16 5
7 44 14 34 11 47 15 34 11 12 4
8 - - 41 13 12 4 16 5 31 10
9 38 12 22 7 6 2 - - 3 1
* See description in PLAISIR form, (Level 1 = Adequate) ... (Level 9 = Nil)
c©20111983 - 2008 : 25 ans de PLAISIR printed on January 16, 2012
Montreal (61000) Centre d’accueil St-Marret December 2011
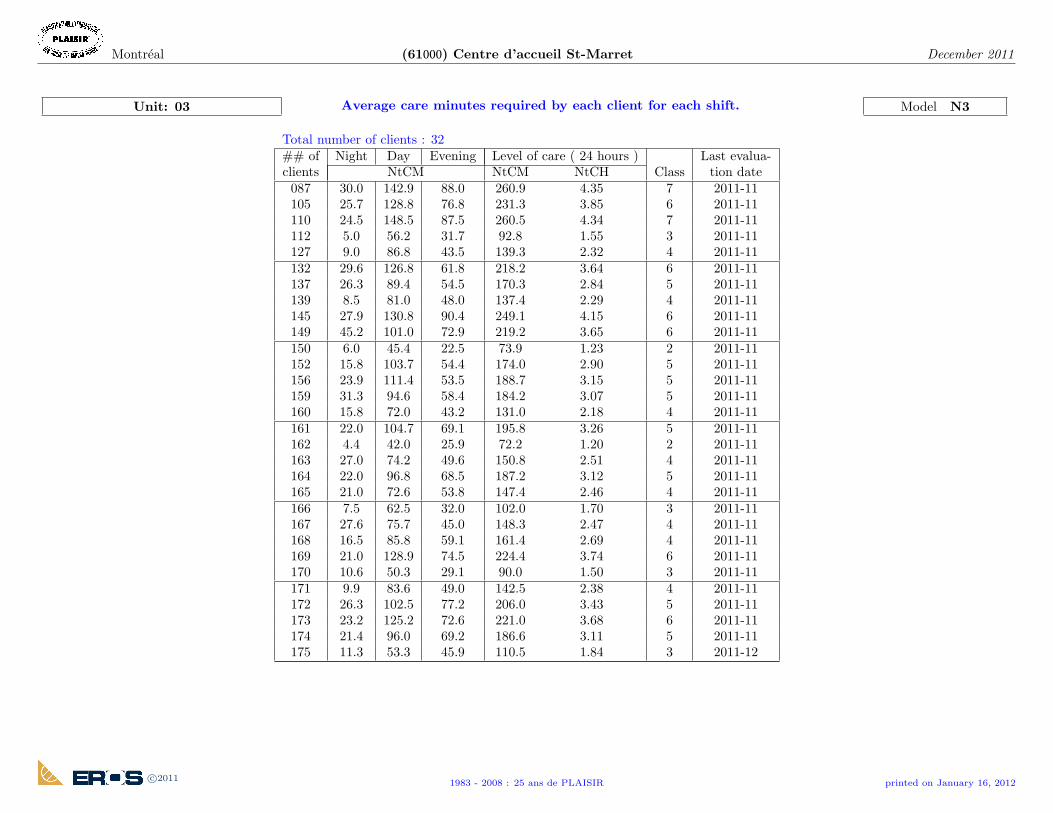
Unit: 03 Average care minutes required by each client for each shift. Model N3
Total number of clients : 32## of Night Day Evening Level of care ( 24 hours ) Last evalua-clients NtCM NtCM NtCH Class tion date
087 30.0 142.9 88.0 260.9 4.35 7 2011-11105 25.7 128.8 76.8 231.3 3.85 6 2011-11110 24.5 148.5 87.5 260.5 4.34 7 2011-11112 5.0 56.2 31.7 92.8 1.55 3 2011-11127 9.0 86.8 43.5 139.3 2.32 4 2011-11132 29.6 126.8 61.8 218.2 3.64 6 2011-11137 26.3 89.4 54.5 170.3 2.84 5 2011-11139 8.5 81.0 48.0 137.4 2.29 4 2011-11145 27.9 130.8 90.4 249.1 4.15 6 2011-11149 45.2 101.0 72.9 219.2 3.65 6 2011-11150 6.0 45.4 22.5 73.9 1.23 2 2011-11152 15.8 103.7 54.4 174.0 2.90 5 2011-11156 23.9 111.4 53.5 188.7 3.15 5 2011-11159 31.3 94.6 58.4 184.2 3.07 5 2011-11160 15.8 72.0 43.2 131.0 2.18 4 2011-11161 22.0 104.7 69.1 195.8 3.26 5 2011-11162 4.4 42.0 25.9 72.2 1.20 2 2011-11163 27.0 74.2 49.6 150.8 2.51 4 2011-11164 22.0 96.8 68.5 187.2 3.12 5 2011-11165 21.0 72.6 53.8 147.4 2.46 4 2011-11166 7.5 62.5 32.0 102.0 1.70 3 2011-11167 27.6 75.7 45.0 148.3 2.47 4 2011-11168 16.5 85.8 59.1 161.4 2.69 4 2011-11169 21.0 128.9 74.5 224.4 3.74 6 2011-11170 10.6 50.3 29.1 90.0 1.50 3 2011-11171 9.9 83.6 49.0 142.5 2.38 4 2011-11172 26.3 102.5 77.2 206.0 3.43 5 2011-11173 23.2 125.2 72.6 221.0 3.68 6 2011-11174 21.4 96.0 69.2 186.6 3.11 5 2011-11175 11.3 53.3 45.9 110.5 1.84 3 2011-12
c©20111983 - 2008 : 25 ans de PLAISIR printed on January 16, 2012

Montreal (61000) Centre d’accueil St-Marret December 2011
Unit: 03 Average care minutes required by each client for each shift. Model N3
Total number of clients : 32## of Night Day Evening Level of care ( 24 hours ) Last evalua-clients NtCM NtCM NtCH Class tion date
176 13.3 92.5 65.7 171.6 2.86 5 2011-12177 15.1 98.0 55.3 168.4 2.81 4 2011-11
Mean 19.5 92.6 57.2 169.3 2.82 4
c©20111983 - 2008 : 25 ans de PLAISIR printed on January 16, 2012

Montreal (61000) Centre d’accueil St-Marret December 2011
Unit: 03Distribution of clients according to sex, per intervals of net care
minutes required per 24 hours. Model N4
Total number of clients : 32
Number PercentageClients requiring :
Women Men Total Women Men Total
Less than 60 min. (1 h) - - - - - -
61 to 90 min. (+1 ≤ 1.5 h ) 1 2 3 3.7 40.0 9.4
91 to 120 min. (+1.5 ≤ 2 h ) 2 1 3 7.4 20.0 9.4
121 to 150 min. (+2 ≤ 2.5 h ) 6 - 6 22.2 - 18.8
151 to 180 min. (+2.5 ≤ 3 h ) 6 - 6 22.2 - 18.8
181 to 210 min. (+3 ≤ 3.5 h ) 6 - 6 22.2 - 18.8
211 to 240 min. (+3.5 ≤ 4 h ) 3 2 5 11.1 40.0 15.6
241 to 270 min. (+4 ≤ 4.5 h ) 3 - 3 11.1 - 9.4
271 to 300 min. (+4.5 ≤ 5 h ) - - - - - -
301 to 330 min. (+5 ≤ 5.5 h ) - - - - - -
Greater than 330 min. (+5.5 h ) - - - - - -
Total 27 5 32 100.0 100.0 100.0
c©20111983 - 2008 : 25 ans de PLAISIR printed on January 16, 2012

Montreal (61000) Centre d’accueil St-Marret December 2011
Unit: 03 Nursing staff required per shift as measured in number of: Model N5
- FTE presences for the clients as a whole - WkCH for the clients as a whole and per client- FTE positions for the clients as a whole and per client - clients per FTE presence
Total number of clients : 32Mean Mean Number
Monday Tuesday Wednesday Thursday Friday Saturday Sunday Total Mean Monday to Saturday of FTEweek / day Friday to Sunday positions
FTE presences 1.86 2.00 1.79 1.80 1.90 1.93 1.84 13.12 1.87 1.87 1.89Night 3.14
WkCH 13.511 14.486 12.948 13.052 13.764 13.973 13.363 95.098 13.585 13.552 13.668
CLT/Presence 17.08
FTE presences 8.62 8.33 8.26 8.36 8.50 8.04 8.21 58.31 8.33 8.41 8.12Day 13.94
WkCH 62.497 60.368 59.856 60.627 61.619 58.262 59.500 422.730 60.390 60.994 58.881
CLT/Presence 3.84
FTE presences 5.13 5.14 5.00 5.15 5.15 4.94 4.97 35.48 5.07 5.11 4.96Evening 8.48
WkCH 37.214 37.248 36.237 37.344 37.352 35.838 36.013 257.246 36.749 37.079 35.926
CLT/Presence 6.31
FTE presences 15.62 15.46 15.04 15.31 15.55 14.91 15.02 106.91 15.27 15.40 14.9624h 25.55
WkCH 113.222 112.103 109.042 111.024 112.735 108.074 108.876 775.074 110.725 111.625 108.475
Per client :Night WkCH 0.422 0.453 0.405 0.408 0.430 0.437 0.418 2.972 0.425 0.424 0.427 0.10Day WkCH 1.953 1.886 1.871 1.895 1.926 1.821 1.859 13.210 1.887 1.906 1.840 0.44
Evening WkCH 1.163 1.164 1.132 1.167 1.167 1.120 1.125 8.039 1.148 1.159 1.123 0.2724h WkCH 3.538 3.503 3.408 3.469 3.523 3.377 3.402 24.221 3.460 3.488 3.390 0.80
a FTE position ”works” 218.3 FTE presences per year but is paid for 260.9 presences. Version NIV/24/405-435/218.3
a FTE presence provides 405 productive minutes per day but is paid for 435 ”worked” minutes.
c©20111983 - 2008 : 25 ans de PLAISIR printed on January 16, 2012

Montreal (61000) Centre d’accueil St-Marret December 2011
Unit: 03Distribution by class of clients according to the types of services
received.Model N6
Total number of clients : 32Classification
Type of CLT 1 2 3 4 5 6 7 8 Nb.services ... 35 min ... 80 ... 125 ... 170 ... 215 ... 260 ... 350 ... ..... clt.
Nursing Nb. - 2 4 7 9 4 1 - 27only % - 7.4 14.8 25.9 33.3 14.8 3.7 - 84.4
Nursing Nb. - - - 1 - 2 - - 3and Ph.th. % - - - 33.3 - 66.7 - - 9.4
Nursing Nb. - - - - - - 1 - 1and Oc.th. % - - - - - - 100.0 - 3.1
Nursing and Oc.th. Nb. - - - 1 - - - - 1and Ph.th. % - - - 100.0 - - - - 3.1
Total Nb. - 2 4 9 9 6 2 - 32% - 6.2 12.5 28.1 28.1 18.8 6.2 - 100.0
c©20111983 - 2008 : 25 ans de PLAISIR printed on January 16, 2012

Montreal (61000) Centre d’accueil St-Marret December 2011
Unit: 03 Diseases prevalence (number and % of clients). Model N7
Total number of clients : 32Diseases n % Diseases n %
Malignant neoplasm 3 9.4 % Glaucoma 4 12.5 %Cataract 1 3.1 %
Acquired hypothyroidism 7 21.9 % Blindness, both eyes 1 3.1 %Diabetes mellitus 6 18.8 % Retinal disorders 4 12.5 %
Obesity - -Deficiency anemias 3 9.4 %
Hearing loss 2 6.2 %
Organic psychotic conditions 20 62.5 % Hypertensive diseases 19 59.4 %Schizophrenic disorders 1 3.1 %
Other psychoses 4 12.5 % Ischemic heart diseases 6 18.8 %Heart failure 2 6.2 %
Other heart diseases 7 21.9 %Nevrotic disorders 5 15.6 %
Spec. nonpsycho. disor. due organ. brain dam. 5 15.6 % Cerebrovascular diseases 1 3.1 %Depressive disorders 7 21.9 % Late effects of cerebrovascular diseases 10 31.2 %
Other nonpsychotic disorders 3 9.4 % Diseases of arteries 1 3.1 %
Chronic obstructive pulmonary diseases 6 18.8 %Senility without mention of psychosis - -
Mental retardation - - Hernia of abdominal cavity - -Cerebral degenerations - Alzheimer 4 12.5 %
Renal failure 6 18.8 %
Parkinson and other extra pyramidal diseases 1 3.1 % Rheumatoid arthritis - -Multiple sclerosis and demyelinating diseases 1 3.1 % Osteoarthrosis 8 25.0 %
Hemiplegia 2 6.2 % Other arthropathies 1 3.1 %Epilepsy 1 3.1 % Dorsopathies - -
Other disorders of the central nervous system 2 6.2 % Osteopathies 9 28.1 %
Late effects musculo squel. tissue injuries 9 28.1 % Aphasia - -
c©20111983 - 2008 : 25 ans de PLAISIR printed on January 16, 2012

Montreal (61000) Centre d’accueil St-Marret December 2011
Unit: 03Net care minutes required in the average per day and per care
category by the average client in the different categories ofcognitive deficits and of psychiatric problems.
Model N8
Categories Feed. Elim. Hygi. Mobi. Basic care Technical Communication NtCM Nb.A B C D (A to D) care clt.
No problem 9.8 23.7 22.0 33.0 88.4 14.2 21.3 124.0 27.9% 19.1% 17.7% 26.6% 71.3% 11.5% 17.2% 100.0%
Light CD 14.7 35.7 30.1 38.8 119.3 15.5 17.4 152.2 79.7% 23.4% 19.8% 25.5% 78.4% 10.2% 11.5% 100.0%
Moderate light CD 17.7 31.5 34.5 33.6 117.4 12.0 27.4 156.8 9cooperative c. 11.3% 20.1% 22.0% 21.4% 74.9% 7.7% 17.5% 100.0%
Moderate severe CD - - - - - - - - -non cooperative c. - - - - - - - -
Severe CD Active CLT 31.6 37.5 41.0 39.5 149.5 13.2 33.8 196.6 5active client 16.1% 19.1% 20.9% 20.1% 76.1% 6.7% 17.2% 100.0%
Severe CD Passive CLT 65.0 37.3 43.3 54.3 199.8 18.6 15.4 233.9 6passive client 27.8% 16.0% 18.5% 23.2% 85.4% 8.0% 6.6% 100.0%
Total CD 30.0 35.0 36.5 40.6 142.1 14.6 23.4 180.1 2716.7% 19.4% 20.3% 22.6% 78.9% 8.1% 13.0% 100.0%
Light PP 14.5 16.9 34.4 4.4 70.1 14.1 18.1 102.3 314.2% 16.5% 33.6% 4.3% 68.5% 13.7% 17.7% 100.0%
Moderate PP - - - - - - - - -- - - - - - - -
Severe PP - - - - - - - - -- - - - - - - -
Total PP 14.5 16.9 34.4 4.4 70.1 14.1 18.1 102.3 314.2% 16.5% 33.6% 4.3% 68.5% 13.7% 17.7% 100.0%
Total 27.3 32.6 35.4 36.7 132.0 14.5 22.7 169.3 3216.1% 19.3% 20.9% 21.7% 78.0% 8.6% 13.4% 100.0%
CD = Cognitive Deficits PP = Psychiatric Problems CLT = Client
c©20111983 - 2008 : 25 ans de PLAISIR printed on January 16, 2012

Unit: 04 4th floor
LONGITUDINAL and NON-COMPARATIVE MODELS
91

Montreal (61000) Centre d’accueil St-Marret December 2011
Unit: 04 Distribution of clients by level of handicap. Model LC1
Handicaps Mobility Phys. indepen- Occupation Social Orientationdence ADL integration Nb.
Observation 1 2 3 4 1 2 3 4 1 2 3 4 1 2 3 4 1 2 3 4 clt.% % % % % % % % % % % % % % % % % % % %
20 (2011-12) - - 22 78 - - - 100 - 28 38 34 - - 34 66 - 9 34 56 32
19 (2010-03) - - 38 63 - - 3 97 - 19 41 41 - - 34 66 - 9 47 44 32
18 (2008-05) - - 40 60 - - - 100 - 10 63 27 - - 50 50 - 17 50 33 30
Mean - - 33 67 - - 1 99 - 19 47 34 - - 39 61 - 12 44 45 31
Handicap code: 1 = adequate, 2 = limited, 3 = very limited, 4 = nil
c©20111983 - 2008 : 25 ans de PLAISIR printed on January 16, 2012
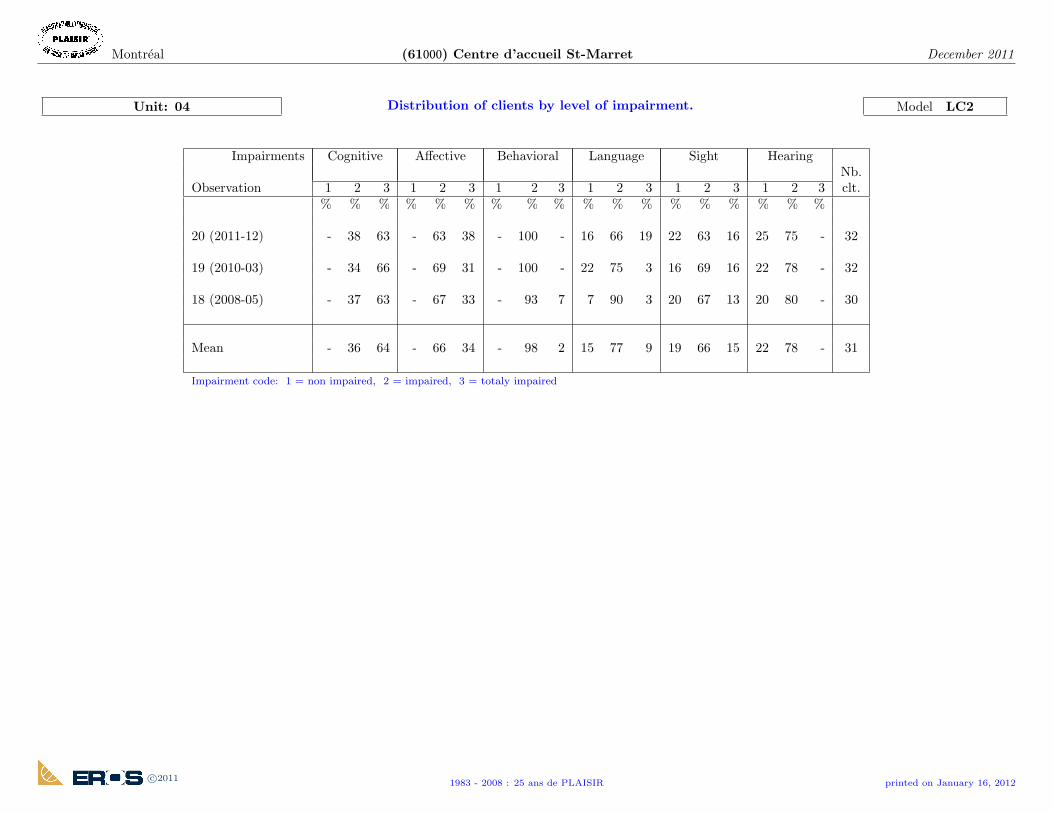
Montreal (61000) Centre d’accueil St-Marret December 2011
Unit: 04 Distribution of clients by level of impairment. Model LC2
Impairments Cognitive Affective Behavioral Language Sight HearingNb.
Observation 1 2 3 1 2 3 1 2 3 1 2 3 1 2 3 1 2 3 clt.% % % % % % % % % % % % % % % % % %
20 (2011-12) - 38 63 - 63 38 - 100 - 16 66 19 22 63 16 25 75 - 32
19 (2010-03) - 34 66 - 69 31 - 100 - 22 75 3 16 69 16 22 78 - 32
18 (2008-05) - 37 63 - 67 33 - 93 7 7 90 3 20 67 13 20 80 - 30
Mean - 36 64 - 66 34 - 98 2 15 77 9 19 66 15 22 78 - 31
Impairment code: 1 = non impaired, 2 = impaired, 3 = totaly impaired
c©20111983 - 2008 : 25 ans de PLAISIR printed on January 16, 2012

Montreal (61000) Centre d’accueil St-Marret December 2011
Unit: 04Distribution of clients according to the type of psychological
problem. Model LC3
0 No problem 1 Physical abuse 3 Disturbs others 6 Persist. anxiety 9 Withdrawal 12 Early awakening with mood disturbance2 Verbal abuse 4 Agitation 7 Sadness 10 Suicidal thoughts 13 Awake 7 hours or less a day
5 Wandering 8 Expr. of distress 11 Freq. thoughts of death
Types of psychological problemObservation CLT 0 1 2 3 4 5 6 7 8 9 10 11 12 13 Nb. clt.
20 (2011-12) Nb. 8 6 3 3 14 1 8 4 - 5 - - - - 32% 25 19 9 9 44 3 25 12 - 16 - - - -
19 (2010-03) Nb. 4 6 5 13 22 6 10 7 1 5 - - - 1 32% 12 19 16 41 69 19 31 22 3 16 - - - 3
18 (2008-05) Nb. 5 7 6 7 12 4 9 3 2 4 - - - - 30% 17 23 20 23 40 13 30 10 7 13 - - - -
Mean Nb. 6 6 5 8 16 4 9 5 1 5 - - - 0 31% 18 20 15 24 51 12 29 15 3 15 - - - 1
c©20111983 - 2008 : 25 ans de PLAISIR printed on January 16, 2012

Montreal (61000) Centre d’accueil St-Marret December 2011
Unit: 04Distribution of clients according to the type of individual
supportive communication. Model LC4
s Slight M Moderate S SeveresM Slight moderate SA Severe: activeSM Severe moderate SP Severe: passive
No problem Cognitive deficits Psychiatric problemsObservation Nb. clt. % s sM SM SA SP Nb. clt. % s M S Nb. clt. % Nb. clt.
20 (2011-12) - - 3 10 - 9 9 31 97 1 - - 1 3 32
19 (2010-03) - - - 15 - 10 4 29 91 3 - - 3 9 32
18 (2008-05) - - 2 13 - 4 6 25 83 2 3 - 5 17 30
Mean - - 2 13 - 8 6 28 90 2 1 - 3 10 31
c©20111983 - 2008 : 25 ans de PLAISIR printed on January 16, 2012

Montreal (61000) Centre d’accueil St-Marret December 2011
Unit: 04Distribution of clients according to the type of protection
device.Model LC5
R = Rarely 1 Bed rails 4 Vest restraint 7 Abdominal restraint to bed 11 Half-door 9 Fireproof apronS = Sometimes 2 Geriatric chair table 5 Wrist restraint(s), mitten(s) 14 Abdominal restraint to chair 12 Nursing home controlled outingO = Often 3 Wheelchair table 6 Ankle restraint(s) 8 Body restraint 13 Nursing unit controlled outing 10 Psycho-active drugs0 no protection
Types of protection devicesObservation CLT 0 1 2 3 4 5 6 7 14 8 11 12 13 9 10 Nb. clt.
R Nb. 2 - - - - - - - - - - - - - -% - - - - - - - - - - - - - -
20 (2011-12) S Nb. - - - - - - - - - - - - - - 32% - - - - - - - - - - - - - -
O Nb. 23 4 2 - - - - 15 2 - - 1 - 22% 6 72 13 6 - - - - 47 6 - - 3 - 69
R Nb. - - - - - - - - - - - - - - -% - - - - - - - - - - - - - -
19 (2010-03) S Nb. - - - - - - - - - - - - - - 32% - - - - - - - - - - - - - -
O Nb. 25 7 3 - - - 2 15 3 - - 6 - 22% - 78 22 9 - - - 6 47 9 - - 19 - 69
R Nb. - - - - - - - - - - - - - - -% - - - - - - - - - - - - - -
18 (2008-05) S Nb. - - - - - - - - - - - - - - 30% - - - - - - - - - - - - - -
O Nb. 26 1 - - - - 7 7 2 - - 4 - 24% - 87 3 - - - - 23 23 7 - - 13 - 80
R Nb. 1 - - - - - - - - - - - - - -% - - - - - - - - - - - - - -
Mean S Nb. - - - - - - - - - - - - - - 31% - - - - - - - - - - - - - -
O Nb. 25 4 2 - - - 3 12 2 - - 4 - 23% 2 79 13 5 - - - 10 39 7 - - 12 - 72
c©20111983 - 2008 : 25 ans de PLAISIR printed on January 16, 2012

Montreal (61000) Centre d’accueil St-Marret December 2011
Unit: 04Distribution of clients according to the type of
travelling/mobilization device. Model LC6
2 Cane 8 Wheelchair no assist.0 No decrease or loss 3 Walker 6 Orthesis 9 Wheelchair with ass. 12 Lift1 None (with decr/loss) 4 Quadcane 7 Prosthesis 10 Motorized wheelchair 13 Others
5 Handrails/furniture 11 Geriatric chair
Types de travelling/mobilization devicesObservation CLT 0 1 2 3 4 5 6 7 8 9 10 11 12 13 Nb. clt.
20 (2011-12) Nb. - 3 - 6 - 1 4 - 4 18 - 7 18 -% - 9 - 19 - 3 12 - 12 56 - 22 56 - 32
19 (2010-03) Nb. - 5 1 4 - - 4 - 4 13 - 10 17 1% - 16 3 12 - - 12 - 12 41 - 31 53 3 32
18 (2008-05) Nb. 1 2 - 6 - 1 - - 8 19 - 4 10 -% 3 7 - 20 - 3 - - 27 63 - 13 33 - 30
Mean Nb. 0 3 0 5 - 1 3 - 5 17 - 7 15 0% 1 11 1 17 - 2 9 - 17 53 - 22 48 1 31
c©20111983 - 2008 : 25 ans de PLAISIR printed on January 16, 2012
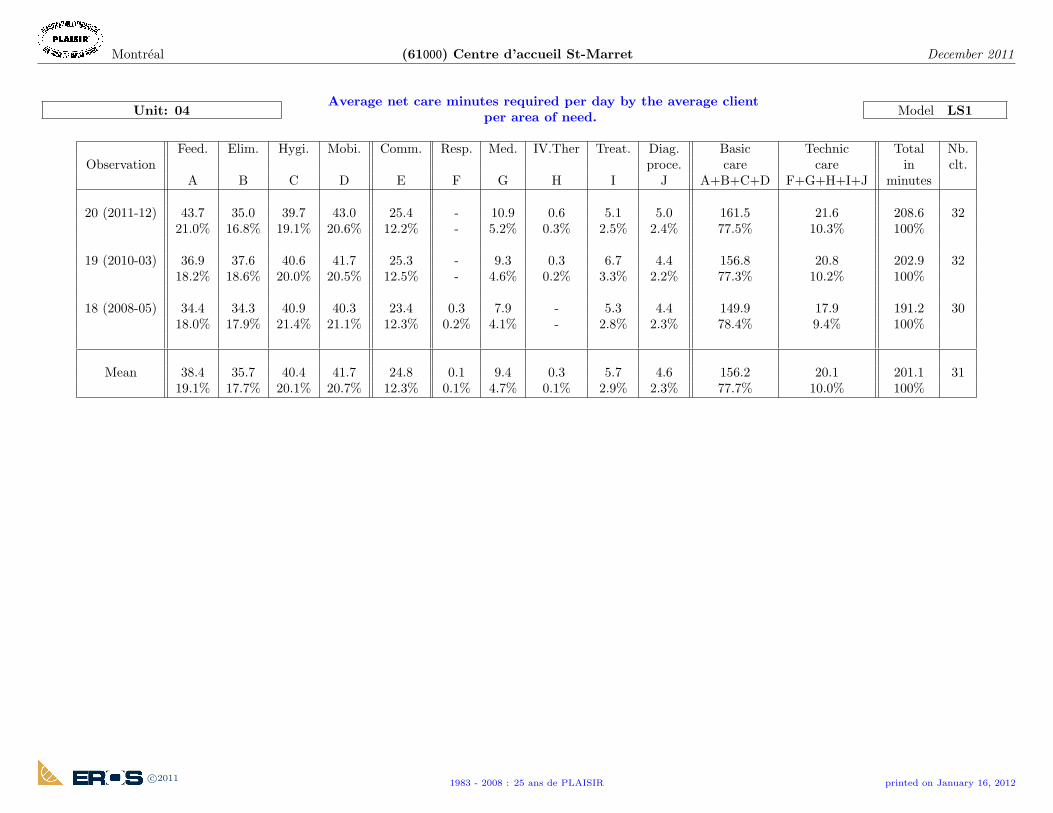
Montreal (61000) Centre d’accueil St-Marret December 2011
Unit: 04Average net care minutes required per day by the average client
per area of need. Model LS1
Feed. Elim. Hygi. Mobi. Comm. Resp. Med. IV.Ther Treat. Diag. Basic Technic Total Nb.Observation proce. care care in clt.
A B C D E F G H I J A+B+C+D F+G+H+I+J minutes
20 (2011-12) 43.7 35.0 39.7 43.0 25.4 - 10.9 0.6 5.1 5.0 161.5 21.6 208.6 3221.0% 16.8% 19.1% 20.6% 12.2% - 5.2% 0.3% 2.5% 2.4% 77.5% 10.3% 100%
19 (2010-03) 36.9 37.6 40.6 41.7 25.3 - 9.3 0.3 6.7 4.4 156.8 20.8 202.9 3218.2% 18.6% 20.0% 20.5% 12.5% - 4.6% 0.2% 3.3% 2.2% 77.3% 10.2% 100%
18 (2008-05) 34.4 34.3 40.9 40.3 23.4 0.3 7.9 - 5.3 4.4 149.9 17.9 191.2 3018.0% 17.9% 21.4% 21.1% 12.3% 0.2% 4.1% - 2.8% 2.3% 78.4% 9.4% 100%
Mean 38.4 35.7 40.4 41.7 24.8 0.1 9.4 0.3 5.7 4.6 156.2 20.1 201.1 3119.1% 17.7% 20.1% 20.7% 12.3% 0.1% 4.7% 0.1% 2.9% 2.3% 77.7% 10.0% 100%
c©20111983 - 2008 : 25 ans de PLAISIR printed on January 16, 2012

Montreal (61000) Centre d’accueil St-Marret December 2011
Unit: 04Average number of minutes and days of rehabilitation received
per week by the client. Model LS2
Physical therapy Occupational therapy Speech therapyObservation CLT CLT CLT Nb.
Mn/week Day/week Nb. % Mn/week Day/week Nb. % Mn/week Day/week Nb. % clt.
20 (2011-12) 60 1.0 1 3 38 1.2 6 19 32
19 (2010-03) 55 2.0 2 6 33 1.0 7 22 32
18 (2008-05) 49 1.5 8 27 100 1.3 3 10 30
Mean 51 1.5 4 12 48 1.1 5 17 31
Note clients not receiving services have been excluded from the calculation for the averages Mn/week.
c©20111983 - 2008 : 25 ans de PLAISIR printed on January 16, 2012

Montreal (61000) Centre d’accueil St-Marret December 2011
Unit: 04Average number of days of nursing rehabilitation services
received per week. Model LS3
Eating/swallowing Toileting Activities Dressing/grooming Locomotion/mobility TransferObservation CLT CLT CLT CLT CLT Nb.
Day/week Nb. % Day/week Nb. % Day/week Nb. % Day/week Nb. % Day/week Nb. % clt.
20 (2011-12) - - - - - - 7.0 3 9 - - - - - - 32
19 (2010-03) - - - 7.0 4 12 7.0 2 6 - - - - - - 32
18 (2008-05) - - - 7.0 4 13 7.0 4 13 - - - - - - 30
Mean - - - 7.0 3 9 7.0 3 10 - - - - - - 31
Note The clients not receiving services have been excluded from the calculation for the average Day/week.
c©20111983 - 2008 : 25 ans de PLAISIR printed on January 16, 2012

Montreal (61000) Centre d’accueil St-Marret December 2011
Unit: 04Distribution of clients according to the type of treatment
received.Model LS4
In = received within the institution.Out = received in another facility.
Chemo. Radiation Inhal.th Dialysis Transf. I.V. Urina. Trach. Ostomy Stasis Pres. ulc. Foot care Nb.Observation CLT In Out In Out In Out In Out In Out Ther. cath. care ulc. 1-2 3-4 Nsg Pod. clt.
20 (2011-12) Nb. 1 - - - - - - - - - 2 - - 1 - 2 1 1 - 32% 3 - - - - - - - - - 6 - - 3 - 6 3 3 -
19 (2010-03) Nb. - - - - - - - - - - 1 - - 1 - 3 1 1 1 32% - - - - - - - - - - 3 - - 3 - 9 3 3 3
18 (2008-05) Nb. - - - - - - - 1 - - - 1 - - - 2 2 1 - 30% - - - - - - - 3 - - - 3 - - - 7 7 3 -
Mean Nb. 0 - - - - - - 0 - - 1 0 - 1 - 2 1 1 0 31% 1 - - - - - - 1 - - 3 1 - 2 - 7 4 3 1
c©20111983 - 2008 : 25 ans de PLAISIR printed on January 16, 2012

Montreal (61000) Centre d’accueil St-Marret December 2011
Unit: 04Distribution by class of non revaluated, re-evaluated and newly
admitted clients (in percentage). Model LR1
ClassificationObservation Clients 1 2 3 4 5 6 7 8 Nb.
... 35 min ... 80 ... 125 ... 170 ... 215 ... 260 ... 350 ... ..... clt.
20 (2011-12) all - - 12.5 9.4 21.9 34.4 21.9 - 32newly adm. - - 26.7 13.3 20.0 26.7 13.3 - 15
re-eval. - - - 5.9 23.5 41.2 29.4 - 17non reval. - - - - - - - - -
19 (2010-03) all - 6.3 3.1 12.5 28.1 34.4 15.6 - 32newly adm. - 4.5 4.5 13.6 40.9 22.7 13.6 - 22
re-eval. - 10.0 - 10.0 - 60.0 20.0 - 10non reval. - - - - - - - - -
18 (2008-05) all - - 6.7 33.3 26.7 30.0 3.3 - 30newly adm. - - - 33.3 44.4 22.2 - - 9
re-eval. - - - 20.0 10.0 60.0 10.0 - 10non reval. - - 18.2 45.5 27.3 9.1 - - 11
Mean all - 2.1 7.4 18.1 25.5 33.0 13.8 - 31newly adm. - 2.2 10.9 17.4 34.8 23.9 10.9 - 15
re-eval. - 2.7 - 10.8 13.5 51.4 21.6 - 12non reval. - - 18.2 45.5 27.3 9.1 - - 4
c©20111983 - 2008 : 25 ans de PLAISIR printed on January 16, 2012

Montreal (61000) Centre d’accueil St-Marret December 2011
Unit: 04Daily number of FTE nursing staff presences required for the
clients as a whole, per shift and according to the type ofactivity, and number of FTE position required per client-year.
Model LR2
DIC CRC AAMTRV Total FTE * Nb.Observation Night Day Evening 24h Night Day Evening 24h Night Day Evening 24h Night Day Evening 24h pos./clt. clt.
20 (2011-12) 1.8 9.0 5.6 16.5 0.2 0.4 0.3 0.9 0.1 0.6 0.3 1.0 2.2 10.0 6.2 18.4 0.96 32
19 (2010-03) 1.8 8.7 5.5 16.0 0.2 0.4 0.3 0.9 0.1 0.6 0.3 1.0 2.1 9.7 6.1 17.9 0.94 32
18 (2008-05) 1.5 8.1 4.6 14.2 0.2 0.4 0.3 0.9 0.1 0.6 0.2 0.9 1.8 9.0 5.1 15.9 0.89 30
Mean 1.7 8.6 5.3 15.6 0.2 0.4 0.3 0.9 0.1 0.6 0.3 1.0 2.0 9.6 5.8 17.4 0.93 31* a FTE position ”works” 218.3 FTE presences per year but is paid for 260.9 presences.
a FTE presence provides 405 productive minutes per day but is paid for 435 ”worked” minutes.
c©20111983 - 2008 : 25 ans de PLAISIR printed on January 16, 2012

Montreal (61000) Centre d’accueil St-Marret December 2011
Unit: 04Average net care minutes required per shift by the average
client.Model LR3
Night Day Evening Level of care ( 24 hours )Observation NtCM NtCM NtCH Variation Class Nb. clt.
20 (2011-12) 23.1 114.1 71.4 208.6 3.48 5 322.8 %
19 (2010-03) 22.6 110.1 70.2 202.9 3.38 5 326.1 %
18 (2008-05) 20.1 108.9 62.2 191.2 3.19 5 30
Mean 22.0 111.1 68.0 201.1 3.35 5 31
c©20111983 - 2008 : 25 ans de PLAISIR printed on January 16, 2012

Montreal (61000) Centre d’accueil St-Marret December 2011
Unit: 04Net care minutes required by the average client according to the
days of the week and shifts. Model LR4
Observation Monday Tuesday Wednesday Thursday Friday Saturday Sunday Mean Nb. clt.Night 23.8 22.9 23.7 22.6 22.8 23.6 22.7 23.1
20 (2011-12) Day 118.3 114.8 116.9 117.2 110.1 109.7 111.6 114.1 32Evening 71.8 71.8 70.3 70.1 72.7 70.4 72.3 71.4Min/24h 213.9 209.5 211.0 209.9 205.5 203.6 206.5 208.6Hrs/24h 3.56 3.49 3.52 3.50 3.43 3.39 3.44 3.48
Night 22.2 23.4 22.3 22.6 22.8 22.1 22.6 22.619 (2010-03) Day 109.5 113.1 110.5 111.6 112.1 108.9 105.3 110.1 32
Evening 70.6 73.4 70.2 68.1 68.9 71.9 68.0 70.2Min/24h 202.4 209.9 203.0 202.2 203.8 202.9 195.9 202.9Hrs/24h 3.37 3.50 3.38 3.37 3.40 3.38 3.27 3.38
Night 20.6 19.7 20.6 19.7 20.3 20.3 19.5 20.118 (2008-05) Day 108.8 111.4 108.3 106.7 111.3 108.9 106.9 108.9 30
Evening 61.5 62.6 61.9 61.8 62.1 62.8 62.8 62.2Min/24h 190.8 193.7 190.9 188.2 193.8 192.0 189.2 191.2Hrs/24h 3.18 3.23 3.18 3.14 3.23 3.20 3.15 3.19
Night 22.2 22.1 22.2 21.7 22.0 22.0 21.6 22.0Mean Day 112.3 113.1 112.0 111.9 111.2 109.1 108.0 111.1 31
Evening 68.1 69.4 67.6 66.8 68.1 68.5 67.8 68.0Min/24h 202.6 204.6 201.9 200.4 201.2 199.7 197.4 201.1Hrs/24h 3.38 3.41 3.36 3.34 3.35 3.33 3.29 3.35
c©20111983 - 2008 : 25 ans de PLAISIR printed on January 16, 2012

Montreal (61000) Centre d’accueil St-Marret December 2011
Unit: 04Average number of care hours (net, productive, worked, paid)
required per day by the average client. Model LR5
Observation NtCH PrCH WkCH PdCH Nb. clt.
20 (2011-12) 3.476 3.876 4.163 4.975 32
19 (2010-03) 3.381 3.781 4.062 4.854 32
18 (2008-05) 3.187 3.587 3.853 4.605 30
Mean 3.352 3.752 4.030 4.816 31
c©20111983 - 2008 : 25 ans de PLAISIR printed on January 16, 2012

Montreal (61000) Centre d’accueil St-Marret December 2011
Unit: 04Average net care hours required per day by the average client
non revaluated, re-evaluated and newly admitted. Model LR6
Net care hours / 24 hours Number of clients % of clientsObservation Non reval. Re-evaluated Newly All Non New Non New
NtCH Variation admitted NtCH Variation reval. Re-eval. adm. All reval. Re-eval. adm.
20 (2011-12) - 3.87 10.26 % 3.03 3.48 2.79 % - 17 15 32 - 53 % 47 %
19 (2010-03) - 3.53 12.28 % 3.32 3.38 6.09 % - 10 22 32 - 31 % 69 %
18 (2008-05) 2.65 3.81 28.45 % 3.15 3.19 - 11 10 9 30 37 % 33 % 30 %
Mean 2.65 3.76 - 3.19 3.35 - 4 12 15 31 12 % 39 % 49 %
c©20111983 - 2008 : 25 ans de PLAISIR printed on January 16, 2012

Montreal (61000) Centre d’accueil St-Marret December 2011
Unit: 04 SYNTHESIS Model LX1
** nursing care Rehabilitation * Handicaps and impairmentsNb. Age Adm. Length % FTE ( NtCH / day ) ( hours / week ) ( % clt. at level 4 or 3 )
Observation clt. Age of stay Wo- pos. / MOB ADL OCC SOC COG AFF BEH
(years) man clt. Tot Basic Com Tech Ph.th. Oc.th. Sp.th. 4 4 4 4 3 3 3
20 (2011-12) 32 86 84 2.6 69 0.96 3.5 2.7 0.4 0.4 0.03 0.12 - 78 100 34 66 62 38 -
19 (2010-03) 32 84 81 2.9 69 0.94 3.4 2.6 0.4 0.3 0.06 0.12 - 62 97 41 66 66 31 -
18 (2008-05) 30 84 81 3.1 70 0.89 3.2 2.5 0.4 0.3 0.22 0.17 - 60 100 27 50 63 33 7
Mean 31 85 82 2.9 69 0.93 3.4 2.6 0.4 0.3 0.10 0.13 - 67 99 34 61 64 34 2
* All the clients including those not receiving services have been included in the calculation for the average hours/week.
** a FTE position ”works” 218.3 FTE presences per year but is paid for 260.9 presences.
a FTE presence provides 405 productive minutes per day but is paid for 435 ”worked” minutes.
c©20111983 - 2008 : 25 ans de PLAISIR printed on January 16, 2012

Montreal (61000) Centre d’accueil St-Marret December 2011
Unit: 04Distribution of clients according to sex and age on admission
and at the time of observation.Model N1
Total number of clients : 32
Age of clients Age on admission Age at time of observationNumber % Number % Women (%) Men (%)
Less than 30 years - - - - - -
30 to 44 years - - - - - -
45 to 54 years - - - - - -
55 to 64 years 1 3.1 1 3.1 - 100.0
65 to 69 years 1 3.1 - - - -
70 to 74 years 5 15.6 2 6.2 50.0 50.0
75 to 79 years 2 6.2 5 15.6 20.0 80.0
80 to 84 years 10 31.2 5 15.6 20.0 80.0
85 to 89 years 3 9.4 8 25.0 100.0 -
90 to 94 years 7 21.9 6 18.8 100.0 -
95 years and over 3 9.4 5 15.6 100.0 -
Total 32 100.0 32 100.0 68.8 31.2
Average 83.5 86.2
c©20111983 - 2008 : 25 ans de PLAISIR printed on January 16, 2012

Montreal (61000) Centre d’accueil St-Marret December 2011
Unit: 04 Distribution of clients by level of handicap. Model N2
Total number of clients : 32Mobility Phys. indepen- Occupation Social Orientation
dence ADL integrationLevel * % n % n % n % n % n
1 - - - - - - - - - -
2 - - - - - - - - - -
3 - - - - - - - - - -
4 - - - - - - - - - -
5 - - - - - - - - 9 3
6 - - - - 28 9 34 11 28 9
7 22 7 16 5 38 12 22 7 6 2
8 12 4 28 9 31 10 41 13 56 18
9 66 21 56 18 3 1 3 1 - -
* See description in PLAISIR form, (Level 1 = Adequate) ... (Level 9 = Nil)
c©20111983 - 2008 : 25 ans de PLAISIR printed on January 16, 2012

Montreal (61000) Centre d’accueil St-Marret December 2011
Unit: 04 Average care minutes required by each client for each shift. Model N3
Total number of clients : 32## of Night Day Evening Level of care ( 24 hours ) Last evalua-clients NtCM NtCM NtCH Class tion date
117 13.1 78.8 47.6 139.5 2.32 4 2011-11153 26.9 126.1 82.3 235.3 3.92 6 2011-11161 35.1 139.2 73.8 248.2 4.14 6 2011-11162 22.9 94.3 81.0 198.3 3.30 5 2011-11163 30.0 122.2 68.3 220.4 3.67 6 2011-11165 33.7 130.1 103.6 267.5 4.46 7 2011-11167 36.5 139.4 72.7 248.6 4.14 6 2011-11170 24.5 139.2 97.8 261.6 4.36 7 2011-11172 24.5 110.8 91.3 226.5 3.78 6 2011-11174 31.6 138.4 97.0 267.0 4.45 7 2011-11175 43.2 127.5 92.4 263.0 4.38 7 2011-11177 25.0 146.6 81.2 252.8 4.21 6 2011-11178 25.1 112.6 64.6 202.3 3.37 5 2011-11179 17.6 116.9 66.4 200.9 3.35 5 2011-11180 26.3 99.1 83.7 209.2 3.49 5 2011-11181 22.5 141.2 72.7 236.4 3.94 6 2011-11184 28.6 142.4 98.9 269.9 4.50 7 2011-11186 27.7 152.9 96.5 277.1 4.62 7 2011-11187 6.5 95.5 38.7 140.7 2.34 4 2011-11188 26.0 149.0 83.0 258.0 4.30 6 2011-11189 30.5 135.0 81.5 247.0 4.12 6 2011-11190 2.7 54.8 30.9 88.5 1.47 3 2011-12191 17.2 108.1 75.7 201.0 3.35 5 2011-11192 29.5 109.6 53.1 192.2 3.20 5 2011-11193 2.5 45.5 32.1 80.2 1.34 3 2011-11194 5.3 48.8 26.6 80.8 1.35 3 2011-11195 20.0 126.9 86.9 233.8 3.90 6 2011-11196 27.6 100.5 63.7 191.8 3.20 5 2011-11197 31.1 148.2 71.6 250.9 4.18 6 2011-11198 26.0 146.8 92.0 264.8 4.41 7 2011-11
c©20111983 - 2008 : 25 ans de PLAISIR printed on January 16, 2012

Montreal (61000) Centre d’accueil St-Marret December 2011
Unit: 04 Average care minutes required by each client for each shift. Model N3
Total number of clients : 32## of Night Day Evening Level of care ( 24 hours ) Last evalua-clients NtCM NtCM NtCH Class tion date
199 11.7 47.2 28.0 86.9 1.45 3 2011-11200 9.1 76.2 47.6 132.8 2.21 4 2011-11
Mean 23.1 114.1 71.4 208.6 3.48 5
c©20111983 - 2008 : 25 ans de PLAISIR printed on January 16, 2012

Montreal (61000) Centre d’accueil St-Marret December 2011
Unit: 04Distribution of clients according to sex, per intervals of net care
minutes required per 24 hours. Model N4
Total number of clients : 32
Number PercentageClients requiring :
Women Men Total Women Men Total
Less than 60 min. (1 h) - - - - - -
61 to 90 min. (+1 ≤ 1.5 h ) 3 1 4 13.6 10.0 12.5
91 to 120 min. (+1.5 ≤ 2 h ) - - - - - -
121 to 150 min. (+2 ≤ 2.5 h ) 1 2 3 4.5 20.0 9.4
151 to 180 min. (+2.5 ≤ 3 h ) - - - - - -
181 to 210 min. (+3 ≤ 3.5 h ) 6 1 7 27.3 10.0 21.9
211 to 240 min. (+3.5 ≤ 4 h ) 5 - 5 22.7 - 15.6
241 to 270 min. (+4 ≤ 4.5 h ) 6 6 12 27.3 60.0 37.5
271 to 300 min. (+4.5 ≤ 5 h ) 1 - 1 4.5 - 3.1
301 to 330 min. (+5 ≤ 5.5 h ) - - - - - -
Greater than 330 min. (+5.5 h ) - - - - - -
Total 22 10 32 100.0 100.0 100.0
c©20111983 - 2008 : 25 ans de PLAISIR printed on January 16, 2012

Montreal (61000) Centre d’accueil St-Marret December 2011
Unit: 04 Nursing staff required per shift as measured in number of: Model N5
- FTE presences for the clients as a whole - WkCH for the clients as a whole and per client- FTE positions for the clients as a whole and per client - clients per FTE presence
Total number of clients : 32Mean Mean Number
Monday Tuesday Wednesday Thursday Friday Saturday Sunday Total Mean Monday to Saturday of FTEweek / day Friday to Sunday positions
FTE presences 2.21 2.14 2.20 2.11 2.13 2.19 2.12 15.12 2.16 2.16 2.16Night 3.61
WkCH 16.059 15.537 15.983 15.328 15.441 15.901 15.382 109.629 15.661 15.669 15.641
CLT/Presence 14.81
FTE presences 10.36 10.08 10.25 10.27 9.71 9.68 9.83 70.16 10.02 10.13 9.75Day 16.77
WkCH 75.080 73.067 74.312 74.459 70.378 70.150 71.240 508.687 72.670 73.459 70.695
CLT/Presence 3.19
FTE presences 6.22 6.23 6.11 6.09 6.30 6.12 6.27 43.34 6.19 6.19 6.19Evening 10.36
WkCH 45.128 45.143 44.307 44.186 45.652 44.342 45.441 314.198 44.885 44.883 44.891
CLT/Presence 5.17
FTE presences 18.80 18.45 18.57 18.48 18.13 17.99 18.22 128.62 18.37 18.48 18.1024h 30.74
WkCH 136.266 133.746 134.602 133.973 131.472 130.393 132.063 932.514 133.216 134.012 131.228
Per client :Night WkCH 0.502 0.486 0.499 0.479 0.483 0.497 0.481 3.426 0.489 0.490 0.489 0.11Day WkCH 2.346 2.283 2.322 2.327 2.199 2.192 2.226 15.896 2.271 2.296 2.209 0.52
Evening WkCH 1.410 1.411 1.385 1.381 1.427 1.386 1.420 9.819 1.403 1.403 1.403 0.3224h WkCH 4.258 4.180 4.206 4.187 4.108 4.075 4.127 29.141 4.163 4.188 4.101 0.96
a FTE position ”works” 218.3 FTE presences per year but is paid for 260.9 presences. Version NIV/24/405-435/218.3
a FTE presence provides 405 productive minutes per day but is paid for 435 ”worked” minutes.
c©20111983 - 2008 : 25 ans de PLAISIR printed on January 16, 2012

Montreal (61000) Centre d’accueil St-Marret December 2011
Unit: 04Distribution by class of clients according to the types of services
received.Model N6
Total number of clients : 32Classification
Type of CLT 1 2 3 4 5 6 7 8 Nb.services ... 35 min ... 80 ... 125 ... 170 ... 215 ... 260 ... 350 ... ..... clt.
Nursing Nb. - - 4 1 6 8 7 - 26only % - - 15.4 3.8 23.1 30.8 26.9 - 81.2
Nursing Nb. - - - - - - - - -and Ph.th. % - - - - - - - - -
Nursing Nb. - - - 1 1 3 - - 5and Oc.th. % - - - 20.0 20.0 60.0 - - 15.6
Nursing and Oc.th. Nb. - - - 1 - - - - 1and Ph.th. % - - - 100.0 - - - - 3.1
Total Nb. - - 4 3 7 11 7 - 32% - - 12.5 9.4 21.9 34.4 21.9 - 100.0
c©20111983 - 2008 : 25 ans de PLAISIR printed on January 16, 2012

Montreal (61000) Centre d’accueil St-Marret December 2011
Unit: 04 Diseases prevalence (number and % of clients). Model N7
Total number of clients : 32Diseases n % Diseases n %
Malignant neoplasm 5 15.6 % Glaucoma 4 12.5 %Cataract - -
Acquired hypothyroidism 6 18.8 % Blindness, both eyes - -Diabetes mellitus 4 12.5 % Retinal disorders 3 9.4 %
Obesity - -Deficiency anemias 2 6.2 %
Hearing loss - -
Organic psychotic conditions 18 56.2 % Hypertensive diseases 20 62.5 %Schizophrenic disorders 1 3.1 %
Other psychoses 2 6.2 % Ischemic heart diseases 8 25.0 %Heart failure 5 15.6 %
Other heart diseases 4 12.5 %Nevrotic disorders 1 3.1 %
Spec. nonpsycho. disor. due organ. brain dam. 1 3.1 % Cerebrovascular diseases 2 6.2 %Depressive disorders - - Late effects of cerebrovascular diseases 11 34.4 %
Other nonpsychotic disorders 4 12.5 % Diseases of arteries 11 34.4 %
Chronic obstructive pulmonary diseases 3 9.4 %Senility without mention of psychosis - -
Mental retardation 1 3.1 % Hernia of abdominal cavity - -Cerebral degenerations - Alzheimer 14 43.8 %
Renal failure 3 9.4 %
Parkinson and other extra pyramidal diseases 5 15.6 % Rheumatoid arthritis - -Multiple sclerosis and demyelinating diseases - - Osteoarthrosis 1 3.1 %
Hemiplegia - - Other arthropathies - -Epilepsy 1 3.1 % Dorsopathies 4 12.5 %
Other disorders of the central nervous system 1 3.1 % Osteopathies 9 28.1 %
Late effects musculo squel. tissue injuries 9 28.1 % Aphasia - -
c©20111983 - 2008 : 25 ans de PLAISIR printed on January 16, 2012
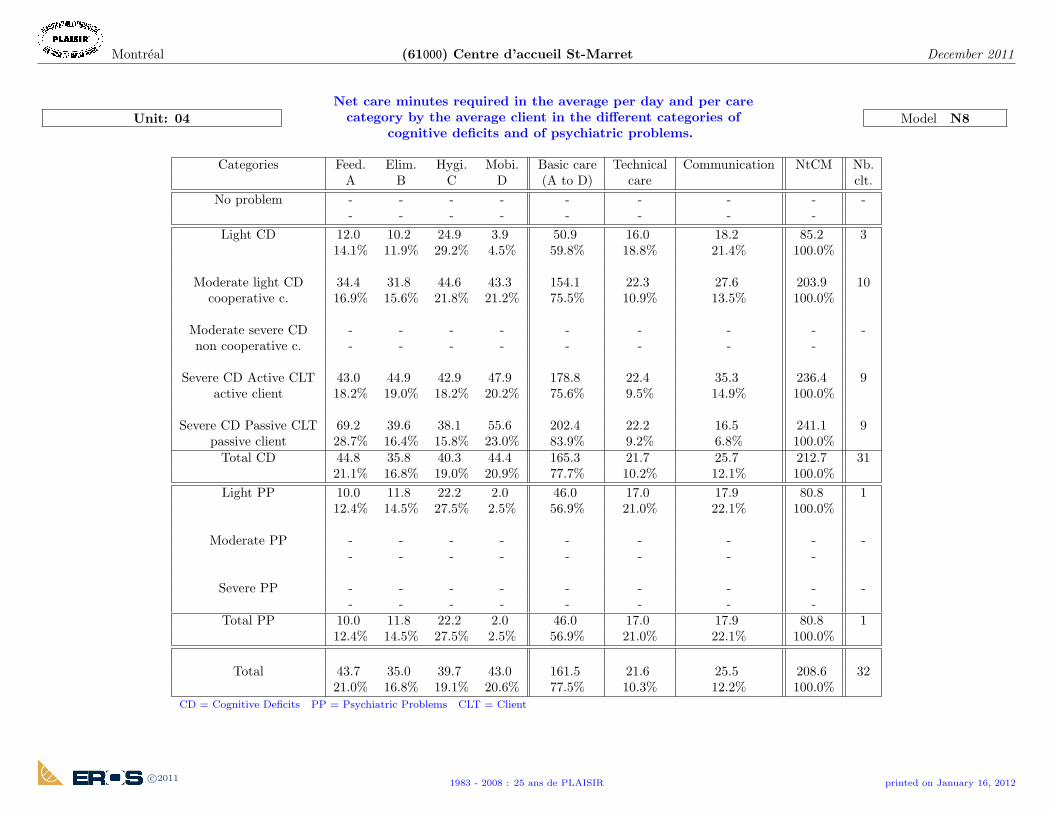
Montreal (61000) Centre d’accueil St-Marret December 2011
Unit: 04Net care minutes required in the average per day and per care
category by the average client in the different categories ofcognitive deficits and of psychiatric problems.
Model N8
Categories Feed. Elim. Hygi. Mobi. Basic care Technical Communication NtCM Nb.A B C D (A to D) care clt.
No problem - - - - - - - - -- - - - - - - -
Light CD 12.0 10.2 24.9 3.9 50.9 16.0 18.2 85.2 314.1% 11.9% 29.2% 4.5% 59.8% 18.8% 21.4% 100.0%
Moderate light CD 34.4 31.8 44.6 43.3 154.1 22.3 27.6 203.9 10cooperative c. 16.9% 15.6% 21.8% 21.2% 75.5% 10.9% 13.5% 100.0%
Moderate severe CD - - - - - - - - -non cooperative c. - - - - - - - -
Severe CD Active CLT 43.0 44.9 42.9 47.9 178.8 22.4 35.3 236.4 9active client 18.2% 19.0% 18.2% 20.2% 75.6% 9.5% 14.9% 100.0%
Severe CD Passive CLT 69.2 39.6 38.1 55.6 202.4 22.2 16.5 241.1 9passive client 28.7% 16.4% 15.8% 23.0% 83.9% 9.2% 6.8% 100.0%
Total CD 44.8 35.8 40.3 44.4 165.3 21.7 25.7 212.7 3121.1% 16.8% 19.0% 20.9% 77.7% 10.2% 12.1% 100.0%
Light PP 10.0 11.8 22.2 2.0 46.0 17.0 17.9 80.8 112.4% 14.5% 27.5% 2.5% 56.9% 21.0% 22.1% 100.0%
Moderate PP - - - - - - - - -- - - - - - - -
Severe PP - - - - - - - - -- - - - - - - -
Total PP 10.0 11.8 22.2 2.0 46.0 17.0 17.9 80.8 112.4% 14.5% 27.5% 2.5% 56.9% 21.0% 22.1% 100.0%
Total 43.7 35.0 39.7 43.0 161.5 21.6 25.5 208.6 3221.0% 16.8% 19.1% 20.6% 77.5% 10.3% 12.2% 100.0%
CD = Cognitive Deficits PP = Psychiatric Problems CLT = Client
c©20111983 - 2008 : 25 ans de PLAISIR printed on January 16, 2012

Part III
UNIT COMPARISON
118

Montreal (61000) Centre d’accueil St-Marret December 2011
Unit comparison Distribution of clients by level of handicap. Model CC1
Handicaps Mobility Phys. indepen- Occupation Social Orientationdence ADL integration Nb.
Unit 1 2 3 4 1 2 3 4 1 2 3 4 1 2 3 4 1 2 3 4 clt.% % % % % % % % % % % % % % % % % % % %
02 - - 47 53 - - 6 94 - 63 34 3 - - 78 22 - 28 63 9 32
03 - 6 56 38 - - 3 97 - 34 47 19 - - 50 50 - 38 28 34 32
04 - - 22 78 - - - 100 - 28 38 34 - - 34 66 - 9 34 56 32
All - 2 42 56 - - 3 97 - 42 40 19 - - 54 46 - 25 42 33 96
Handicap code: 1 = adequate, 2 = limited, 3 = very limited, 4 = nil
c©20111983 - 2008 : 25 ans de PLAISIR printed on January 16, 2012

Montreal (61000) Centre d’accueil St-Marret December 2011
Unit comparison Distribution of clients by level of impairment. Model CC2
Impairments Cognitive Affective Behavioral Language Sight HearingNb.
Unit 1 2 3 1 2 3 1 2 3 1 2 3 1 2 3 1 2 3 clt.% % % % % % % % % % % % % % % % % %
02 - 81 19 3 94 3 3 97 - 44 50 6 25 66 9 28 72 - 32
03 6 41 53 13 66 22 3 94 3 38 53 9 50 44 6 34 66 - 32
04 - 38 63 - 63 38 - 100 - 16 66 19 22 63 16 25 75 - 32
All 2 53 45 5 74 21 2 97 1 32 56 11 32 57 10 29 71 - 96
Impairment code: 1 = non impaired, 2 = impaired, 3 = totaly impaired
c©20111983 - 2008 : 25 ans de PLAISIR printed on January 16, 2012

Montreal (61000) Centre d’accueil St-Marret December 2011
Unit comparisonDistribution of clients according to the type of psychological
problem. Model CC3
0 No problem 1 Physical abuse 3 Disturbs others 6 Persist. anxiety 9 Withdrawal 12 Early awakening with mood disturbance2 Verbal abuse 4 Agitation 7 Sadness 10 Suicidal thoughts 13 Awake 7 hours or less a day
5 Wandering 8 Expr. of distress 11 Freq. thoughts of death
Types of psychological problemUnit CLT 0 1 2 3 4 5 6 7 8 9 10 11 12 13 Nb. clt.
02 Nb. 9 3 - 1 7 - 14 5 1 10 - - - - 32% 28 9 - 3 22 - 44 16 3 31 - - - -
03 Nb. 9 4 4 1 16 3 18 3 - 4 - - - - 32% 28 12 12 3 50 9 56 9 - 12 - - - -
04 Nb. 8 6 3 3 14 1 8 4 - 5 - - - - 32% 25 19 9 9 44 3 25 12 - 16 - - - -
All Nb. 26 13 7 5 37 4 40 12 1 19 - - - - 96% 27 14 7 5 39 4 42 12 1 20 - - - -
c©20111983 - 2008 : 25 ans de PLAISIR printed on January 16, 2012

Montreal (61000) Centre d’accueil St-Marret December 2011
Unit comparisonDistribution of clients according to the type of individual
supportive communication. Model CC4
s Slight M Moderate S SeveresM Slight moderate SA Severe: activeSM Severe moderate SP Severe: passive
No problem Cognitive deficits Psychiatric problemsUnit Nb. clt. % s sM SM SA SP Nb. clt. % s M S Nb. clt. % Nb. clt.
02 1 3 4 18 - 4 - 26 81 4 1 - 5 16 32
03 2 6 7 9 - 5 6 27 84 3 - - 3 9 32
04 - - 3 10 - 9 9 31 97 1 - - 1 3 32
All 3 3 14 37 - 18 15 84 88 8 1 - 9 9 96
c©20111983 - 2008 : 25 ans de PLAISIR printed on January 16, 2012

Montreal (61000) Centre d’accueil St-Marret December 2011
Unit comparison Distribution of clients according to the type of protectiondevice.
Model CC5
R = Rarely 1 Bed rails 4 Vest restraint 7 Abdominal restraint to bed 11 Half-door 9 Fireproof apronS = Sometimes 2 Geriatric chair table 5 Wrist restraint(s), mitten(s) 14 Abdominal restraint to chair 12 Nursing home controlled outingO = Often 3 Wheelchair table 6 Ankle restraint(s) 8 Body restraint 13 Nursing unit controlled outing 10 Psycho-active drugs0 no protection
Types of protection devicesUnit CLT 0 1 2 3 4 5 6 7 14 8 11 12 13 9 10 Nb. clt.
R Nb. 4 - - - - - - - - - - - - - 1% - - - - - - - - - - - - - 3
02 S Nb. - - - - - - - - - - - - - - 32% - - - - - - - - - - - - - -
O Nb. 16 1 1 - - - - 10 1 - - - - 21% 13 50 3 3 - - - - 31 3 - - - - 66
R Nb. 5 - - - - - - - - - - - - - 1% - - - - - - - - - - - - - 3
03 S Nb. - - - - - - - 1 - - - - - - 32% - - - - - - - 3 - - - - - -
O Nb. 8 - - - - - - 16 - - - 1 - 18% 16 25 - - - - - - 50 - - - 3 - 56
R Nb. 2 - - - - - - - - - - - - - -% - - - - - - - - - - - - - -
04 S Nb. - - - - - - - - - - - - - - 32% - - - - - - - - - - - - - -
O Nb. 23 4 2 - - - - 15 2 - - 1 - 22% 6 72 13 6 - - - - 47 6 - - 3 - 69
R Nb. 11 - - - - - - - - - - - - - 2% - - - - - - - - - - - - - 2
All S Nb. - - - - - - - 1 - - - - - - 96% - - - - - - - 1 - - - - - -
O Nb. 47 5 3 - - - - 41 3 - - 2 - 61% 11 49 5 3 - - - - 43 3 - - 2 - 64
c©20111983 - 2008 : 25 ans de PLAISIR printed on January 16, 2012

Montreal (61000) Centre d’accueil St-Marret December 2011
Unit comparisonDistribution of clients according to the type of
travelling/mobilization device. Model CC6
2 Cane 8 Wheelchair no assist.0 No decrease or loss 3 Walker 6 Orthesis 9 Wheelchair with ass. 12 Lift1 None (with decr/loss) 4 Quadcane 7 Prosthesis 10 Motorized wheelchair 13 Others
5 Handrails/furniture 11 Geriatric chair
Types de travelling/mobilization devicesUnit CLT 0 1 2 3 4 5 6 7 8 9 10 11 12 13 Nb. clt.
02 Nb. - 5 2 8 - - 4 - 10 18 1 1 11 1% - 16 6 25 - - 12 - 31 56 3 3 34 3 32
03 Nb. - 3 1 9 - - - - 13 12 1 6 15 -% - 9 3 28 - - - - 41 38 3 19 47 - 32
04 Nb. - 3 - 6 - 1 4 - 4 18 - 7 18 -% - 9 - 19 - 3 12 - 12 56 - 22 56 - 32
All Nb. - 11 3 23 - 1 8 - 27 48 2 14 44 1% - 11 3 24 - 1 8 - 28 50 2 15 46 1 96
c©20111983 - 2008 : 25 ans de PLAISIR printed on January 16, 2012
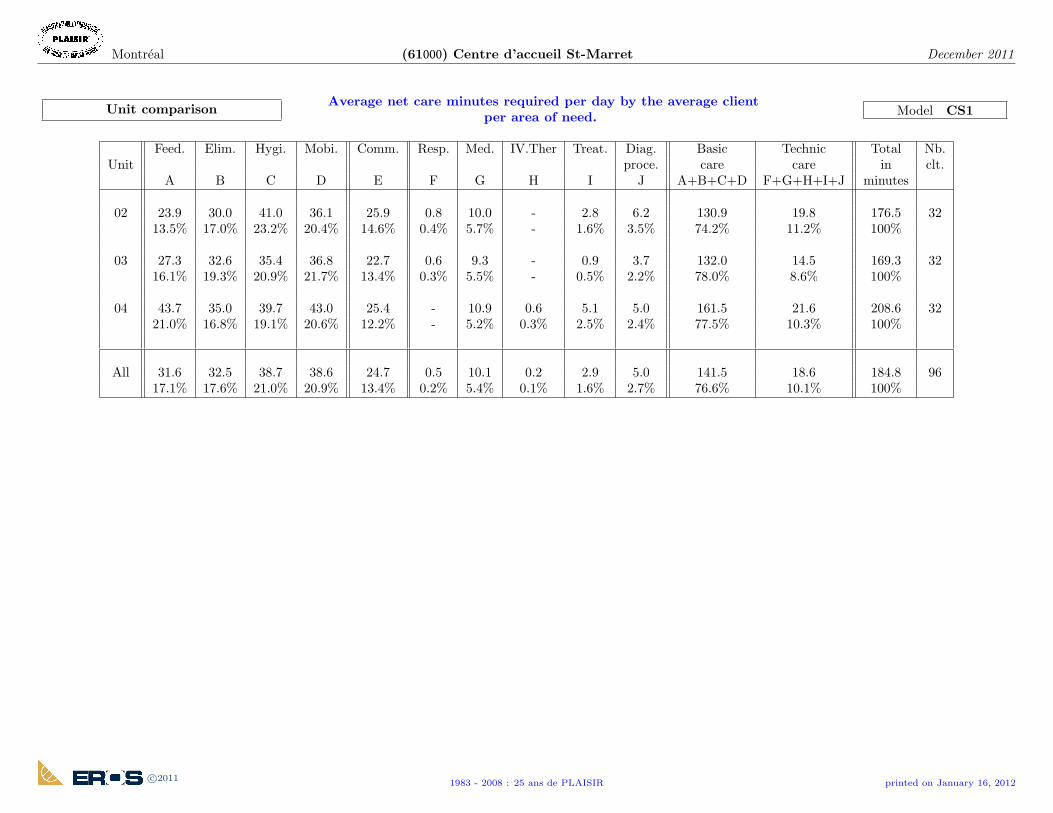
Montreal (61000) Centre d’accueil St-Marret December 2011
Unit comparisonAverage net care minutes required per day by the average client
per area of need. Model CS1
Feed. Elim. Hygi. Mobi. Comm. Resp. Med. IV.Ther Treat. Diag. Basic Technic Total Nb.Unit proce. care care in clt.
A B C D E F G H I J A+B+C+D F+G+H+I+J minutes
02 23.9 30.0 41.0 36.1 25.9 0.8 10.0 - 2.8 6.2 130.9 19.8 176.5 3213.5% 17.0% 23.2% 20.4% 14.6% 0.4% 5.7% - 1.6% 3.5% 74.2% 11.2% 100%
03 27.3 32.6 35.4 36.8 22.7 0.6 9.3 - 0.9 3.7 132.0 14.5 169.3 3216.1% 19.3% 20.9% 21.7% 13.4% 0.3% 5.5% - 0.5% 2.2% 78.0% 8.6% 100%
04 43.7 35.0 39.7 43.0 25.4 - 10.9 0.6 5.1 5.0 161.5 21.6 208.6 3221.0% 16.8% 19.1% 20.6% 12.2% - 5.2% 0.3% 2.5% 2.4% 77.5% 10.3% 100%
All 31.6 32.5 38.7 38.6 24.7 0.5 10.1 0.2 2.9 5.0 141.5 18.6 184.8 9617.1% 17.6% 21.0% 20.9% 13.4% 0.2% 5.4% 0.1% 1.6% 2.7% 76.6% 10.1% 100%
c©20111983 - 2008 : 25 ans de PLAISIR printed on January 16, 2012

Montreal (61000) Centre d’accueil St-Marret December 2011
Unit comparisonAverage number of minutes and days of rehabilitation received
per week by the client. Model CS2
Physical therapy Occupational therapy Speech therapyUnit CLT CLT CLT Nb.
Mn/week Day/week Nb. % Mn/week Day/week Nb. % Mn/week Day/week Nb. % clt.
02 60 1.4 9 28 65 1.8 4 12 32
03 95 2.2 4 12 60 1.0 2 6 32
04 60 1.0 1 3 38 1.2 6 19 32
All 70 1.6 14 15 51 1.3 12 12 96
Note clients not receiving services have been excluded from the calculation for the averages Mn/week.
c©20111983 - 2008 : 25 ans de PLAISIR printed on January 16, 2012

Montreal (61000) Centre d’accueil St-Marret December 2011
Unit comparisonAverage number of days of nursing rehabilitation services
received per week. Model CS3
Eating/swallowing Toileting Activities Dressing/grooming Locomotion/mobility TransferUnit CLT CLT CLT CLT CLT Nb.
Day/week Nb. % Day/week Nb. % Day/week Nb. % Day/week Nb. % Day/week Nb. % clt.
02 - - - - - - 7.0 4 12 - - - - - - 32
03 - - - - - - 7.0 4 12 - - - - - - 32
04 - - - - - - 7.0 3 9 - - - - - - 32
All - - - - - - 7.0 11 11 - - - - - - 96
Note The clients not receiving services have been excluded from the calculation for the average Day/week.
c©20111983 - 2008 : 25 ans de PLAISIR printed on January 16, 2012

Montreal (61000) Centre d’accueil St-Marret December 2011
Unit comparison Distribution of clients according to the type of treatmentreceived.
Model CS4
In = received within the institution.Out = received in another facility.
Chemo. Radiation Inhal.th Dialysis Transf. I.V. Urina. Trach. Ostomy Stasis Pres. ulc. Foot care Nb.Unit CLT In Out In Out In Out In Out In Out Ther. cath. care ulc. 1-2 3-4 Nsg Pod. clt.
02 Nb. - - - - - - - - - 1 - 4 - 1 - 2 1 1 - 32% - - - - - - - - - 3 - 12 - 3 - 6 3 3 -
03 Nb. - - - - - - - - - - - 1 - - - 1 - - - 32% - - - - - - - - - - - 3 - - - 3 - - -
04 Nb. 1 - - - - - - - - - 2 - - 1 - 2 1 1 - 32% 3 - - - - - - - - - 6 - - 3 - 6 3 3 -
All Nb. 1 - - - - - - - - 1 2 5 - 2 - 5 2 2 - 96% 1 - - - - - - - - 1 2 5 - 2 - 5 2 2 -
c©20111983 - 2008 : 25 ans de PLAISIR printed on January 16, 2012

Montreal (61000) Centre d’accueil St-Marret December 2011
Unit comparisonDistribution by class of non revaluated, re-evaluated and newly
admitted clients (in percentage). Model CR1
ClassificationUnit Clients 1 2 3 4 5 6 7 8 Nb.
... 35 min ... 80 ... 125 ... 170 ... 215 ... 260 ... 350 ... ..... clt.
02 all - 6.3 15.6 15.6 37.5 18.8 6.3 - 32newly adm. - 9.1 27.3 27.3 27.3 - 9.1 - 11
re-eval. - 4.8 9.5 9.5 42.9 28.6 4.8 - 21non reval. - - - - - - - - -
03 all - 6.3 12.5 28.1 28.1 18.8 6.3 - 32newly adm. - - 20.0 40.0 26.7 13.3 - - 15
re-eval. - 11.8 5.9 17.6 29.4 23.5 11.8 - 17non reval. - - - - - - - - -
04 all - - 12.5 9.4 21.9 34.4 21.9 - 32newly adm. - - 26.7 13.3 20.0 26.7 13.3 - 15
re-eval. - - - 5.9 23.5 41.2 29.4 - 17non reval. - - - - - - - - -
All all - 4.2 13.5 17.7 29.2 24.0 11.5 - 96newly adm. - 2.4 24.4 26.8 24.4 14.6 7.3 - 41
re-eval. - 5.5 5.5 10.9 32.7 30.9 14.5 - 55non reval. - - - - - - - - -
c©20111983 - 2008 : 25 ans de PLAISIR printed on January 16, 2012

Montreal (61000) Centre d’accueil St-Marret December 2011
Unit comparisonDaily number of FTE nursing staff presences required for the
clients as a whole, per shift and according to the type ofactivity, and number of FTE position required per client-year.
Model CR2
DIC CRC AAMTRV Total FTE * Nb.Unit Night Day Evening 24h Night Day Evening 24h Night Day Evening 24h Night Day Evening 24h pos./clt. clt.
02 1.3 7.7 4.9 13.9 0.2 0.4 0.3 0.9 0.1 0.6 0.3 1.0 1.7 8.7 5.5 15.8 0.83 32
03 1.5 7.3 4.5 13.4 0.2 0.4 0.3 0.9 0.1 0.6 0.3 1.0 1.9 8.3 5.1 15.3 0.80 32
04 1.8 9.0 5.6 16.5 0.2 0.4 0.3 0.9 0.1 0.6 0.3 1.0 2.2 10.0 6.2 18.4 0.96 32
All 4.7 24.0 15.1 43.8 0.6 1.2 0.9 2.7 0.4 1.8 0.8 3.0 5.7 27.1 16.7 49.5 0.86 96* a FTE position ”works” 218.3 FTE presences per year but is paid for 260.9 presences.
a FTE presence provides 405 productive minutes per day but is paid for 435 ”worked” minutes.
c©20111983 - 2008 : 25 ans de PLAISIR printed on January 16, 2012
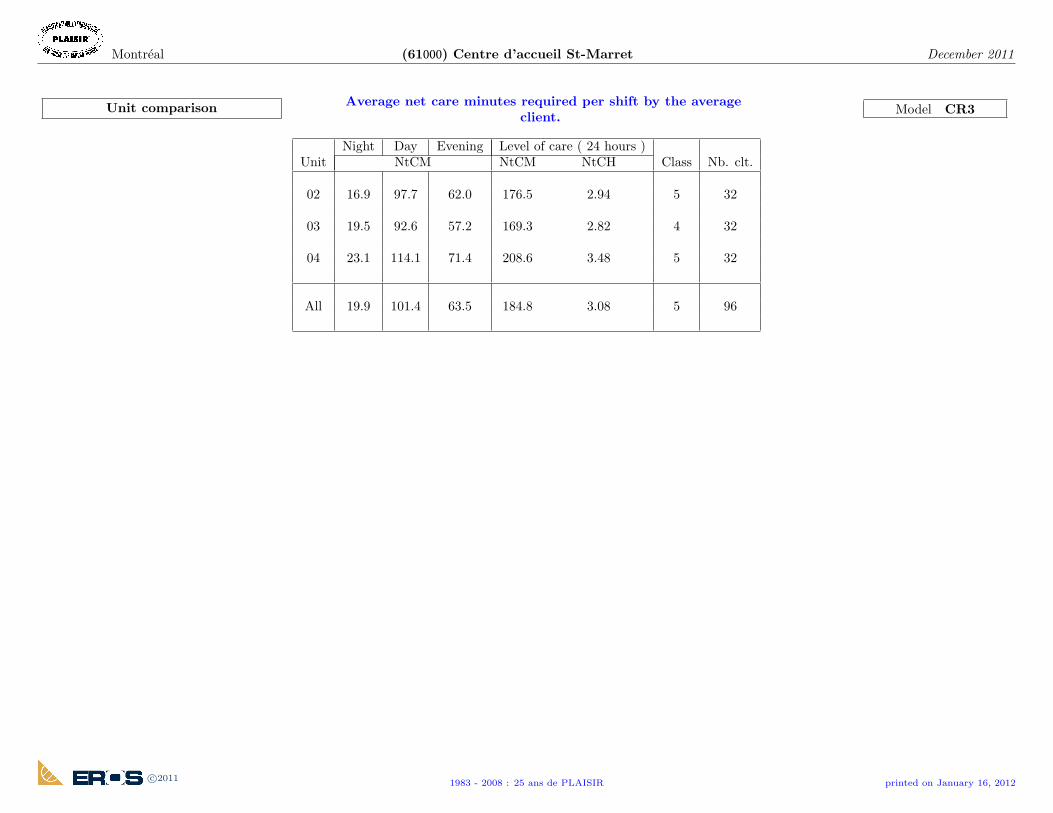
Montreal (61000) Centre d’accueil St-Marret December 2011
Unit comparison Average net care minutes required per shift by the averageclient.
Model CR3
Night Day Evening Level of care ( 24 hours )Unit NtCM NtCM NtCH Class Nb. clt.
02 16.9 97.7 62.0 176.5 2.94 5 32
03 19.5 92.6 57.2 169.3 2.82 4 32
04 23.1 114.1 71.4 208.6 3.48 5 32
All 19.9 101.4 63.5 184.8 3.08 5 96
c©20111983 - 2008 : 25 ans de PLAISIR printed on January 16, 2012

Montreal (61000) Centre d’accueil St-Marret December 2011
Unit comparisonNet care minutes required by the average client according to the
days of the week and shifts. Model CR4
Unit Monday Tuesday Wednesday Thursday Friday Saturday Sunday Mean Nb. clt.Night 16.9 16.7 16.9 17.3 17.1 16.8 16.6 16.9
02 Day 101.6 98.6 95.2 97.5 100.3 97.2 93.2 97.7 32Evening 61.0 60.8 65.0 60.7 60.8 60.0 65.5 62.0Min/24h 179.5 176.1 177.1 175.5 178.2 174.0 175.3 176.5Hrs/24h 2.99 2.94 2.95 2.92 2.97 2.90 2.92 2.94
Night 19.4 21.1 18.4 18.6 19.8 20.2 19.1 19.503 Day 96.3 92.6 91.7 93.0 94.8 88.9 91.1 92.6 32
Evening 58.0 58.0 56.3 58.2 58.2 55.6 55.9 57.2Min/24h 173.6 171.7 166.4 169.8 172.8 164.7 166.1 169.3Hrs/24h 2.89 2.86 2.77 2.83 2.88 2.74 2.77 2.82
Night 23.8 22.9 23.7 22.6 22.8 23.6 22.7 23.104 Day 118.3 114.8 116.9 117.2 110.1 109.7 111.6 114.1 32
Evening 71.8 71.8 70.3 70.1 72.7 70.4 72.3 71.4Min/24h 213.9 209.5 211.0 209.9 205.5 203.6 206.5 208.6Hrs/24h 3.56 3.49 3.52 3.50 3.43 3.39 3.44 3.48
Night 20.0 20.2 19.7 19.5 19.9 20.2 19.4 19.9All Day 105.4 102.0 101.3 102.6 101.7 98.6 98.6 101.4 96
Evening 63.6 63.5 63.9 63.0 63.9 62.0 64.6 63.5Min/24h 189.0 185.8 184.8 185.1 185.5 180.8 182.6 184.8Hrs/24h 3.15 3.10 3.08 3.08 3.09 3.01 3.04 3.08
c©20111983 - 2008 : 25 ans de PLAISIR printed on January 16, 2012

Montreal (61000) Centre d’accueil St-Marret December 2011
Unit comparison Average number of care hours (net, productive, worked, paid)required per day by the average client. Model CR5
Unit NtCH PrCH WkCH PdCH Nb. clt.
03 2.822 3.222 3.460 4.135 32
02 2.942 3.342 3.590 4.291 32
All 3.080 3.480 3.738 4.467 96
04 3.476 3.876 4.163 4.975 32
All-24 hours 295.7 334.1 358.8 428.8 96
All-365 days 107 921.2 121 937.2 130 969.6 156 527.5 96
c©20111983 - 2008 : 25 ans de PLAISIR printed on January 16, 2012

Montreal (61000) Centre d’accueil St-Marret December 2011
Unit comparisonAverage net care hours required per day by the average client
non revaluated, re-evaluated and newly admitted. Model CR6
Net care hours / 24 hours Number of clientsUnit Non Newly Non New
reval. Re-evaluated admitted All reval. Re-eval. adm. All
02 - 3.16 2.52 2.94 - 21 11 32
03 - 2.94 2.69 2.82 - 17 15 32
04 - 3.87 3.03 3.48 - 17 15 32
All - 3.31 2.77 3.08 - 55 41 96
c©20111983 - 2008 : 25 ans de PLAISIR printed on January 16, 2012

Montreal (61000) Centre d’accueil St-Marret December 2011
Unit comparison SYNTHESIS Model CX1
** nursing care Rehabilitation * Handicaps and impairmentsNb. Age Adm. Length % FTE ( NtCH / day ) ( hours / week ) ( % clt. at level 4 or 3 )
Unit clt. Age of stay Wo- pos. / MOB ADL OCC SOC COG AFF BEH
(years) man clt. Tot Basic Com Tech Ph.th. Oc.th. Sp.th. 4 4 4 4 3 3 3
02 32 83 80 3.3 66 0.83 2.9 2.2 0.4 0.3 0.28 0.14 - 53 94 3 22 19 3 -
03 32 88 85 2.8 84 0.80 2.8 2.2 0.4 0.2 0.20 0.06 - 38 97 19 50 53 22 3
04 32 86 84 2.6 69 0.96 3.5 2.7 0.4 0.4 0.03 0.12 - 78 100 34 66 62 38 -
All 96 86 83 2.9 73 0.86 3.1 2.4 0.4 0.3 0.17 0.11 - 56 97 19 46 45 21 1
* All the clients including those not receiving services have been included in the calculation for the average hours/week.
** a FTE position ”works” 218.3 FTE presences per year but is paid for 260.9 presences.
a FTE presence provides 405 productive minutes per day but is paid for 435 ”worked” minutes.
c©20111983 - 2008 : 25 ans de PLAISIR printed on January 16, 2012

EROS - Equipe de Recherche Operationnelle en Sante inc.
5225, rue Berri, bureau 200 Phone : 514-490-0909Montreal (Quebec) Fax : 514-490-0936H2J 2S4 email : [email protected]
Le specialiste de la mesure des charges en soins