planetary and space science - 東京大学
TRANSCRIPT

Planetary and Space Science 81 (2013) 18–31
Contents lists available at SciVerse ScienceDirect
Planetary and Space Science
0032-06http://d
n CorrProject,Japan. T
E-m
journal homepage: www.elsevier.com/locate/pss
On the possibility of lunar core phase detection using new seismometers forsoft-landers in future lunar missions
Ryuhei Yamada a,b,c,d,n, Raphael F. Garcia c,d, Philippe Lognonné e, Naoki Kobayashi b, Nozomu Takeuchi f,Tanguy Nébut e, Hiroaki Shiraishi b, Marie Calvet c,d, J. Ganepain-Beyneix e
a National Astronomical Observatory of Japan, RISE Project 2-21-1 Osawa, Mitaka, Tokyo 181-8588, Japanb Institute of Space and Astronautical Science, Japan Aerospace Exploration Agency, 3-1-1 Yoshinodai, Sagamihara, Kanagawa 229-8510, Japanc Université de Toulouse, UPS-OMP, IRAP, Toulouse, Franced CNRS, IRAP 14, Avenue Edouard Belin, F-31400 Toulouse, Francee Equipe Géophysique Spatiale et Planétaire, Institut de Physique du Globe du Paris, Sorbonne Paris Cité, Université Paris Diderot, UMR 7154 CNRS, F-94100 Saint Maur des Fossés,Francef Earthquake Research Institute, University of Tokyo, Bunkyo-ku, Tokyo 113-0032, Japan
a r t i c l e i n f o
Article history:Received 11 June 2012Received in revised form28 February 2013Accepted 22 March 2013Available online 3 April 2013
Keywords:SeismometerPlanetary explorationLunar explorationMoonquakeLunar seismicityLunar core
33/$ - see front matter & 2013 Elsevier Ltd. Ax.doi.org/10.1016/j.pss.2013.03.009
esponding author at: National AstronomicalCenter Building (South area) 209 2-21-1, Osael.: +81 422 34 3940; fax: +81 422 34 3596.ail address: [email protected] (R. Yamad
a b s t r a c t
Information on the lunar central core; size, current state and composition; are key parameters tounderstand the origin and evolution of the Moon. Recent studies have indicated that possible seismicenergies of core-reflected phases can be identified from past Apollo seismic data, and core sizes aredetermined, but we have still uncertainties to establish the lunar core parameters. We, therefore, plan todetect seismic phases that pass through the interior of the core and/or those reflected from the core–mantle boundary to ensure the parameters using new seismometers for future lunar soft-landingmissions such as SELENE-2 and Farside Explorer projects.
As the new seismometers, we can apply two types of sensors already developed; they are the VeryBroad Band (VBB) seismometer and Short Period (SP) seismometer. We first demonstrate throughwaveform simulations that the new seismometers are able to record the lunar seismic events with S/Nmuch better than Apollo seismometers. Then, expected detection numbers of core-phases on the entirelunar surface for the two types of seismometers are evaluated for two models of seismic momentdistributions of deep moonquakes using the recent interior model (VPREMOON).
The evaluation indicates that the VBB has performance to detect reflected S phases (ScS) from thecore–mantle boundary mainly on the lunar near-side, and the P phases (PKP) passing through theinterior of the core on some areas of the lunar far-side. Then, the SP can also detect PKP phases as firstarrival seismic phase on limited regions on the lunar far-side. If appropriate positions of the seismicstations are selected, core-phases can be detected, allowing us to constrain the origin and evolution ofthe Moon with future lunar soft-landing missions.
& 2013 Elsevier Ltd. All rights reserved.
1. Introduction
The information about interior structures of planetary bodies isa key parameter to understand the process of differentiation andthe original materials of the bodies. Though the first lunarseismological experiments during NASA Apollo programs haveprovided much information about lunar interior structure andlunar seismic activities (Nakamura et al., 1982; Lognonné et al.,2003), we still have difficulties in revealing the lunar deepstructure, including the lunar core due to the regional geometry
ll rights reserved.
Observatory of Japan, RISEwa Mitaka, Tokyo 181-8588,
a).
of four Apollo seismic stations (Apollo 12 and 14–16) on the lunarnear-side, and limited frequency responses and sensitivities ofApollo seismometers.
Early studies based on Lunar prospector data or Apollo Lunarreflectors have suggested that the Moon has a small metallic andconductive core (Hood et al., 1999), likely liquid (Williams et al.,2001). We have to know its size and density to estimate the totalamount of siderophile elements in the Moon so as to validate theMoon's formation through a giant impact scenario (Canup andAsphaug, 2001), and constrain the temperature of the mantle(Gagnepain-Beyneix et al., 2006; Khan et al., 2006) to understandthe thermal history of the Moon.
Recent studies (Weber et al., 2011; Garcia et al., 2011) haveindicated that they could identify the energies of seismic phasesreflected from the core–mantle boundary using the technique of
R. Yamada et al. / Planetary and Space Science 81 (2013) 18–31 19
waveform stacking of deep moonquake events, which occur repeat-edly on a specific nest located at the lunar deep region betweendepths of about 700 and 1200 km, related with positions of the Earth,the Moon and the Sun; that is tidal forcing (Lammlein, 1977), and theyconstrained the core size and its structure. Despite these recent coresize and density estimates (Weber et al., 2011; Garcia et al., 2011), wehave large uncertainties about state and composition of the lunar corebecause there is trade-off between the weakly constrained lowermantle and core size remains for reflected phase on their analysis andit increases uncertainty of the core radius. We do not have any directinformation about state, composition and interior structure of thecore because seismic phases which pass through interior of the coreare not certainly identified from past Apollo data. Though Sellers(1992) described that he could identify the PKP phase (P waveformpassing through interior of the core) from far-side impact data, theidentification is considered to be doubtful and not definitive(Wieczorek et al., 2006). We have to certainly detect the waveformsthat pass through interior of the core and those reflected from thecore–mantle boundary to reduce the current error bars. That is whydirect detection of core phases originated from the deep nests will beone of main topics in future lunar seismological experiments.
Currently, lunar seismological experiment, such as SELENE-2(Tanaka et al., 2008) is planned by JAXA, and several proposalshave been also made, such as the LUNETTE discovery concept(Neal et al., 2010) or the European Medium class Farside Explorerconcept (Mimoun et al., 2011), and they might be re-proposed tofuture opportunities. In these missions, the deployment of 1 (forSELENE-2) to several seismic stations using soft-landers isplanned, with a seismometer carried by the lander and deployedon the surface by a robotic arm. The Very Broad-Band seismometer(VBB) (Lognonné et al., 2000) developed at the Institut duPhysique du Globe du Paris (IPGP) for previous Mars projects(Lognonné et al., 1996, 2000) and Short-Period seismometer (SP)(Yamada et al., 2009) developed in Japan Aerospace ExplorationAgency (JAXA) originally for the LUNAR-A project (Mizutani et al.,2003) are considered for these projects.
In this paper, we investigate how the performances of theseinstruments will map in term of core phases detection, by using theexpected amplitude of signals originating from the deep nests. Thiswill enable us to confirm that reliable evidence of the lunar core canbe obtained by future lunar missions. We first describe currentperformances (frequency responses and detection limits) of the VBBand the SP seismometers (Section 2). Then, we describe conditions ofdetection of the core phases by the two types of seismometers(Section 3). In Section 4, lunar interior models and seismic momentsof deep events are described to estimate amplitudes of the corephases. Then, we evaluate the expected detection numbers of core-phases on each station position during an observation term (Section5) following the conditions described in Section 3 and distributionsof seismic moments of deep events estimated in Section 4. We thenmake some suggestions about the landing positions in futureseismological missions. Finally, we discuss some agendas in thisevaluation (Section 6), and conclude this topic.
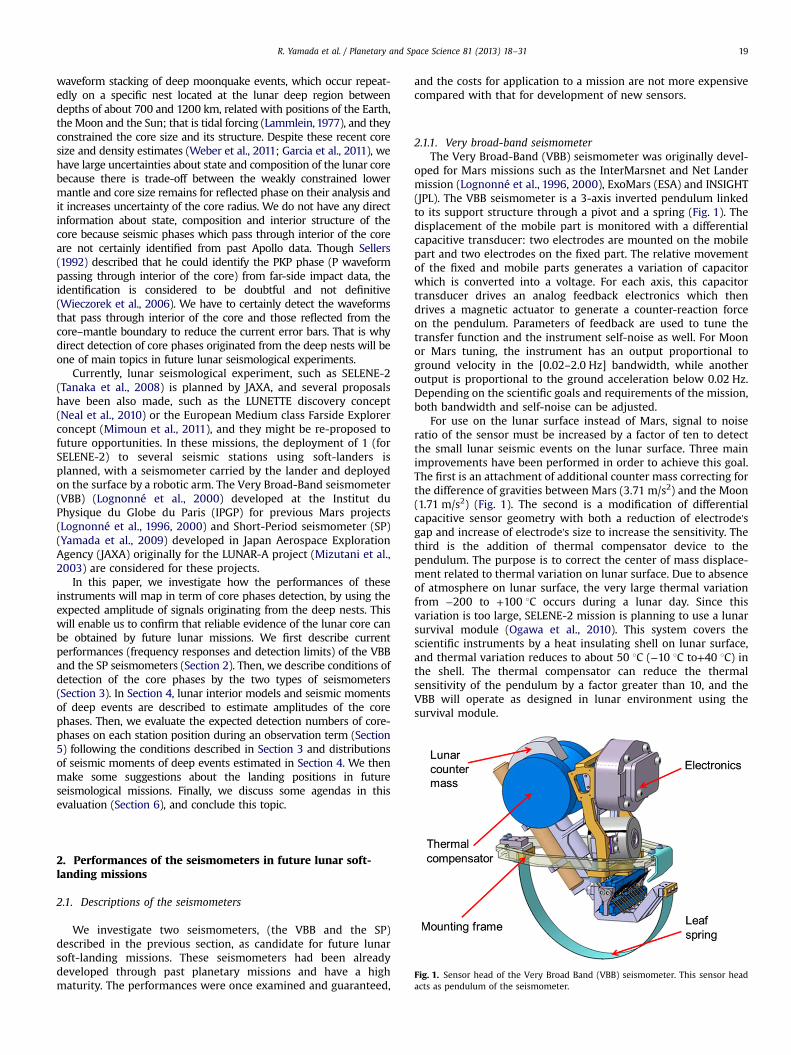
Fig. 1. Sensor head of the Very Broad Band (VBB) seismometer. This sensor headacts as pendulum of the seismometer.
2. Performances of the seismometers in future lunar soft-landing missions
2.1. Descriptions of the seismometers
We investigate two seismometers, (the VBB and the SP)described in the previous section, as candidate for future lunarsoft-landing missions. These seismometers had been alreadydeveloped through past planetary missions and have a highmaturity. The performances were once examined and guaranteed,
and the costs for application to a mission are not more expensivecompared with that for development of new sensors.
2.1.1. Very broad-band seismometerThe Very Broad-Band (VBB) seismometer was originally devel-
oped for Mars missions such as the InterMarsnet and Net Landermission (Lognonné et al., 1996, 2000), ExoMars (ESA) and INSIGHT(JPL). The VBB seismometer is a 3-axis inverted pendulum linkedto its support structure through a pivot and a spring (Fig. 1). Thedisplacement of the mobile part is monitored with a differentialcapacitive transducer: two electrodes are mounted on the mobilepart and two electrodes on the fixed part. The relative movementof the fixed and mobile parts generates a variation of capacitorwhich is converted into a voltage. For each axis, this capacitortransducer drives an analog feedback electronics which thendrives a magnetic actuator to generate a counter-reaction forceon the pendulum. Parameters of feedback are used to tune thetransfer function and the instrument self-noise as well. For Moonor Mars tuning, the instrument has an output proportional toground velocity in the [0.02–2.0 Hz] bandwidth, while anotheroutput is proportional to the ground acceleration below 0.02 Hz.Depending on the scientific goals and requirements of the mission,both bandwidth and self-noise can be adjusted.
For use on the lunar surface instead of Mars, signal to noiseratio of the sensor must be increased by a factor of ten to detectthe small lunar seismic events on the lunar surface. Three mainimprovements have been performed in order to achieve this goal.The first is an attachment of additional counter mass correcting forthe difference of gravities between Mars (3.71 m/s2) and the Moon(1.71 m/s2) (Fig. 1). The second is a modification of differentialcapacitive sensor geometry with both a reduction of electrode'sgap and increase of electrode's size to increase the sensitivity. Thethird is the addition of thermal compensator device to thependulum. The purpose is to correct the center of mass displace-ment related to thermal variation on lunar surface. Due to absenceof atmosphere on lunar surface, the very large thermal variationfrom −200 to +100 1C occurs during a lunar day. Since thisvariation is too large, SELENE-2 mission is planning to use a lunarsurvival module (Ogawa et al., 2010). This system covers thescientific instruments by a heat insulating shell on lunar surface,and thermal variation reduces to about 50 1C (−10 1C to+40 1C) inthe shell. The thermal compensator can reduce the thermalsensitivity of the pendulum by a factor greater than 10, and theVBB will operate as designed in lunar environment using thesurvival module.

Fig. 2. Bird-eye view (left) and the photograph of the Short Period (SP) seismometer (right).
Table 1Characteristics of the VBB and the SP for a soft-lander.
VBB SP
Type Capacitive displacement sensor Electromagnetic sensorResonantfrequency
0.02 Hz 1.1 Hz
Total gain 2.0E+6 V/m/s 2.2E+4 V/m/sSize 58 mm�93 mm�108 mm
(sensor head size)50 mm�50 mm(diameter�height)
Mass 0.25 kg (sensor head mass) 0.33 kg (total sensor mass)Frequencyrange
0.02–2.00 Hz 1.00–50.0 Hz
Fig. 3. Frequency responses of the new seismometers (S2-VBB and S2-SP) and theApollo seismometers (A-LP and A-SP) for velocity. The Apollo long-period (A-LP)seismometer has two operation mode; Peaked-mode (A-LP (P)) and Flat mode(A-LP (F)) (Latham et al., 1973), and the two responses are shown in this figure.
R. Yamada et al. / Planetary and Space Science 81 (2013) 18–3120
2.1.2. Short-period seismometerThe Short-Period (SP) seismometer is an electromagnetic one
which has a pendulum consisting of coil and magnet circuits fixedwith the case (Fig. 2). The sensor is a passive type, and do not needany electrical power for the sensor. The SP was developed throughthe past LUNAR-A penetrator mission (Mizutani et al., 2003). Thesensor has a high-shock capability which can survive throughpenetrating acceleration over 105 m/s2 and the performancesallowing detect small deep moonquakes after the penetration(Yamada et al., 2009).
When we deploy the SP sensor on the lunar surface by a soft-lander not a penetrator, thermal variation around the sensor willbe larger than for penetrator option, even if we use the survivalmodule described above. We have already investigated the changeof the performance of the SP in this new thermal range as shownin figure 6 in Yamada et al. (2009). Through the investigation, wecan expect that the change of neutral position will be able to becorrected using a typical gimbal mechanism in the survivalmodule.
In contrary to the LUNAR-A design using a pressurized atmo-sphere inside the penetrator, SELENE-2 surface package willdeploy a sensor under vacuum on lunar surface. The variation ofpressure around the seismometer can change the damping con-stant and the noise level (Brown noise) (Rodgers, 1992) of thesensor. We have investigated the frequency response as function ofpressure, and have found the damping constant due to air frictionis much smaller under pressure lower than 1 Pa than the othersource of damping (e.g., Foucault currents due to the coil/magnetinteraction) (Yamada et al., 2010). Under vacuum on the lunarsurface, the seismometer will have only electrical damping and thevalue is about 0.4, in contrary to the 0.65 nominal dampingconstant of LUNAR-A. The performances required for lunar seismicobservation are obtained under vacuum.
2.2. Frequency responses and detection limits.
The characteristics of the VBB and the SP sensors for a soft-lander are presented in Table 1. These performances includecharacteristics of amplifiers and filters attached to the seism-ometers planned for a SELENE-2 soft-lander. Fig. 3 shows thefrequency responses of the VBB, the SP and the past Apolloseismometers (Long-period (A-LP) and Short-period (A-SP)
sensors) (Latham et al., 1973) in units of DU/m/s. The responsesof the VBB and the SP are assumed to be those at ordinarytemperature and under vacuum. For future lunar missions, weplan to use 24-bits A/D converter that has much better resolution

R. Yamada et al. / Planetary and Space Science 81 (2013) 18–31 21
than 10-bits A/D used in Apollo missions. Using the high-performance A/D, the sensitivity of the VBB is much higher thanthose of Apollo LP sensors (Fig. 3), while the self-noise of thecomplete VBB system is about several ten times smaller than theone of the Apollo instruments.
The detection limits of these seismometers are indicated inFig. 4. The detection limit is defined by
Dlðf Þ ¼ffiffiffiffiffiffiffiffiffiffiffiffiffiffiffiffiffiffiffiffiffiffiffiffiffiNPðf Þ=Tðf Þ2
qð1Þ
where Dl is the detection limit with term of velocity in ðm=s=ffiffiffiffiffiffiHz
pÞ
and it is corresponding to input equivalent noise as ground motion, fis the frequency, NP is the power spectral density (PSD) of the outputnoise of new seismometers in V2=Hz and T is the frequency responseof the seismometer in ðV=m=sÞ. The noise levels of the VBB and the SPwere evaluated by the measurement and/or the theoretical equations(Yamada et al., 2009).
For the SP, the noise includes the suspension Brown noise, thetransducer Johnson noise and the amplifier's one. For the VBB, thisincludes the capacitive transducer, the Brownian and amplifier'snoise in addition to the feedback noise and the electrostatic forces,intrinsically associated to the capacitive measurement called patcheffect (Kim et al., 2010). The patch effect occurs on surface ofelectrodes attached to the pendulum and the case. The patch dueto crystal morphologies and any pollution generates the electro-static force on the electrodes, and it may act as 1/f noise. The noisecaused from the patch effect is inversely proportional to square ofgap between electrodes (the pendulum and the case). In currentstatus, the long-period noise level of the VBB depends therefore onpatch effect amplitude and on the gaps finally chosen for the VBB.The detection limit of the VBB shown in Fig. 4 adopts a con-servative case with the present design.
Note that for both the VBB and the SP, we assume that theenvironmental noise will be lower than the sensors self-noise,which might however request a careful installation, especially forthe horizontal components, as shown by the noise level recordedon the Apollo (Lognonné and Johnson, 2007). The A/D noise, dueto the 24-bit dynamics, is much smaller than both the SP and VBBnoise. Possible environment noise, associated to tilt, temperatureand magnetic field variations are not taken into account, but willhave to be considered in the design of the sensors housing andinstallation.
In Fig. 4, the noise levels of the Apollo seismometers (Apollo LP(Peaked-mode) and Apollo SP) were derived from the actualseismic data by using time sequences without lunar quakes (see
Fig. 4. Detection limits of the new seismometers and the Apollo seismometers forvelocity. The detection limit of the Apollo-LP is that of Peaked-mode.
Lognonné and Johnson (2007) for Apollo noise level in accelera-tion). We assumed that the seismic data without identified lunarseismic events corresponded to the total output noise of theApollo seismometers, as the Apollo instrument is not expectingto record the micro-seismic noise related to the continuousimpacts as environment noise on the Moon (Lognonné et al.,2009). The spectra of the Apollo noise shown in Fig. 4 are derivedfrom vertical component data of the Apollo LP and SP. Lognonnéand Johnson (2007) shows that the vertical component data doesnot include the environment noise (horizontal noise) maybeassociated to sensor tilt due to temperature variation and thenoise may be related to the instrument. The noise level of thevertical component seems to represent the instrumental self-noisewithout environmental noise as well as those of the VBB and theSP. From comparison in Fig. 4, we can say that our seismometershave better detection limits compared to Apollo seismometers inobservable frequency range (0.02–50 Hz).
2.3. Waveform simulation of lunar seismic events
We have evaluated how the lunar seismic events can beobserved by the new seismometers on the lunar surface. In thisevaluation, we simulated the waveforms of the lunar seismicsignals observed by the new seismometers using the past Apolloseismic data and those of noise of the sensors. The waveformsobserved by the new sensors are simulated from past Apolloseismic events using the next equation:
SWðtÞ ¼ 2Re
Z þ∞
0RAðf Þ � Tnðf Þ
Taðf Þ� Fðf Þ � expð2πif tÞdf
� �ð2Þ
where SW is a simulated waveform of a lunar seismic event asfunction of time t, RA is the Fourier spectrum of raw seismic eventdata observed by the Apollo seismometers, Ta and Tn are thefrequency responses of the Apollo and the new (the VBB or the SP)seismometers including that of electronics, and F is the frequencyresponse of the filter to enhance the seismic signal. Re indicatesthe real part of the signal. The noise waveform of the newseismometer NWðtÞ also is simulated, using the next equation:
NWðtÞ ¼ 2Re
Z þ∞
0
ffiffiffiffiffiffiffiffiffiffiffiffiffiffiffiffiffiNSðf Þ=2
q� RSðf Þ � Fðf Þ � expð2πif tÞdf
� �ð3Þ
where RSðf Þ is a random phase operator and NSðf Þ is the single-side voltage power spectrum density of the noise of the newseismometers in V2=Hz.
Fig. 5 shows that comparison of a deep moonquake including anoise observed by the Apollo LP with the simulated deep moonquakeobserved by the VBB. The waveforms are indicated in DU usingcharacteristics of Apollo 10bit A/D or SELENE-2 24-bit A/D. From pastApollo observation, the signal to noise ratio of deep moonquakewaveform is good in the 0.3–1.1 Hz frequency range. For the reason,Fðf Þ is defined as a butterworth bandpass filter with corner frequen-cies of 0.3 Hz and 1.1 Hz. In these figures, the small deep events whichhave amplitudes of about 3DU in Apollo record are compared. Thenoise waveform of Apollo LP (Fig.5(a)) is assumed to be pre-event dataof the deep moonquake; it is signal before “Arrival of P-waveform ” inthe figure. This waveform is vertical component data of the LP and itseems to represent almost the instrumental self-noise without envir-onmental noise. Here, the signal to noise ratio (S/N) can be evaluatedfrom the event data and pre-event (noise) data in Apollo case. In theVBB case (Fig. 5(b)), the deep event simulated from Eq. (2) based onoriginal Apollo data (3DU event) and the noise waveforms calculatedfrom Eq. (3) are indicated. The comparison between Fig. 5(a) and (b)indicates that the VBB can detect the deep moonquake events withmuch better S/N and A/D resolution compared with Apollo LPseismometer, and we will be able to identify arrival of the seismicevents more clearly by the VBB. Then, the signal to noise ratios of deep

Fig. 5. Waveform of a deep moonquake originated from A1 deep nest; (a) waveform observed by the Apollo-LP seismometer (Peaked-mode), and (b) simulated waveformobserved by the VBB based on Apollo deep event which have similar amplitude to that shown in (a). These waveforms are band-pass filtered between 0.3 and 1.1 Hz and de-spiked. The waveform observed by the Apollo-LP was recorded with sampling rate of 6.625 Hz and resolution of 10 bits (Apollo A/D), and the signal and noise obtained by theVBB are simulated as record with sampling rate of 100 Hz and resolution of 24 bits (SELENE-2 A/D). “Arrival of P-waveform” in these figures means that arrival of P-waveformof the deep moonquake, and in (a) the signal before the arrival corresponds to the noise of the Apollo LP seismometer system.
Fig. 6. Waveform of a meteoroid impact; (a) waveform observed by the Apollo-SP seismometer and (b) simulated waveform observed by the SP based on Apollo impactevent which have similar amplitude to that shown in (a). These waveforms are band-pass filtered between 1.0 and 8.0 Hz and de-spiked. The waveform observed by theApollo-SP was recorded with sampling rate of 53 Hz and resolution of 10 bits (Apollo A/D), and the signal and the noise obtained by the SP is simulated as record withsampling rate of 100 Hz and resolution of 24 bits (SELENE-2 A/D). “Arrival of P-waveform” in the figure means that arrival of P-waveform of the meteoroid impact, and in(a) the signal before the arrival corresponds to the noise of the Apollo SP seismometer system.
R. Yamada et al. / Planetary and Space Science 81 (2013) 18–3122
moonquake events observed by the VBB will be about 25 times betterthan those of Apollo LP between frequency range of 0.3–1.1 Hz.
The meteoroid impacts on the lunar surface are importantsources to investigate the lunar shallow structure (Chenet et al.,2006). Waveforms of meteoroid impacts usually have higher fre-quency component compared to deep moonquakes (Duennebier andSutton, 1974a). So, the short-period seismometer is preferred todetect the meteoroid impacts. Fig. 6 shows that the comparison of awaveform of the meteoroid impact including a noise (pre-eventdata) detected by the Apollo SP vertical component and that by theSELENE-2 SP between frequencies range of 1.0 and 8.0 Hz. Thewaveforms are also indicated in DU using characteristics of theApollo 10-bit A/D or SELENE-2 24-bit A/D. The comparison isperformed for located small meteorite impact (about 5 DU ampli-tudes in Apollo record). From the event, the signal to noise ratioswere also evaluated in both the Apollo-SP and the SP cases as withthe VBB case. This evaluation also indicates that our SP sensor onthe lunar surface can detect the meteoroid impacts with betterS/N and A/D resolutions compared to the Apollo-SP in this highfrequency range.
The waveform simulation of the lunar seismic events observedby the new seismometers as shown in Figs. 5 and 6 indicates thatwe can detect more deep events and meteoroid impacts withbetter S/N and identify arrivals of the body waveforms moreclearly than Apollo-era.
3. Evaluation method for core-phases detection
Let us now address the amplitude of core phases on singleseismograms, which, in contrary to the stacked signals of Garciaet al. (2011) and Weber et al. (2011), have not been so faridentified, For this purpose, we have calculated the waveformsand/or amplitudes of the core-phases of deep moonquakes usingtheoretical equations, possible lunar interior model and the Apolloseismic data. Then, we evaluated how many core-phases can bedetected using the VBB and the SP respectively.
We have to notice effect of seismic scattering in lunar seismo-grams caused from heterogeneous structure of the lunar surface(Dainty et al., 1974) to estimate the waveforms of lunar core-phases.

R. Yamada et al. / Planetary and Space Science 81 (2013) 18–31 23
This effect disturbs the seismic signals, and makes the waveformsimulation difficult using typical theoretical equations.
On the other hand, a seismic simulation indicates that theeffects of scattering will be weak for frequencies lower than about0.1 Hz because the waves in the low frequency range havewavelength longer than thickness of the surface heterogeneouslayer (Shiraishi et al., 2010). Therefore, we adopt two methods toevaluate detection of the core-phases by our seismometers for twodifferent frequency ranges; that lower than 0.1 Hz and that higherthan 0.1 Hz. We evaluate detection capability of the VBB in lowfrequency range and that of the SP in high frequency range.
3.1. Evaluation in low frequency range
In frequency range lower than 0.1 Hz, we can expect lunarseismograms with weak scattering effects. Though the Apollo LPsensors could not detect the seismic signals in this frequencyrange due to the sensor noise (Gagnepain-Beyneix et al., 2006), thebetter performance of the VBB in low frequency range (Fig. 4) maymake us enable to detect the undisturbed waveform in the futuremissions. In this study, we assume that we can detect the lunarseismic signals with little scattering effects and calculate thewaveform by typical theoretical equations in frequency rangearound 0.1 Hz.
In this case, we set the condition of detection of the core-phases as
Umax4 NR ð4Þwhere Umax is the maximum amplitude of the time-series theore-tical waveform Uðt;Δ;KÞ of seismic phase K at an epicentraldistance of Δ in term of velocity, and NR is the RMS amplitude ofthe noise waveform of the seismometer in terms of velocity. U iscalculated using following equations (Aki and Richards, 2002):
Uðt;Δ;KÞ ¼ 2Re
� Z þ∞
0A0ðf ;Δ;KÞ � exp 2if πðt−TÞ þ tnðKÞln f
f s
� �� �� �
�Fðf Þ � expð−πf tnðKÞÞdf�
ð5Þ
tnðKÞ ¼Z dt
QðKÞ ð6Þ
where T is the travel time of the seismic phase, f s is the scalingfrequency and Q is the seismic quality factor. We set the scalingfrequency as 1.0 Hz. In Eq. (5), we assume that surface response is1.0. Fðf Þ is the response of the bandpass filter to enhance the signalbetween a specific frequency range. A0ðf ;Δ;KÞ is the velocityFourier amplitude of input impulse without attenuation at fre-quency of f, and it is calculated as
A0ðf ;Δ;KÞ ¼ 2πf � rpðKÞ � _Mðf Þ � Sf ðKÞ � RtcðKÞ=RðΔÞ ð7Þwhere rp is the radiation pattern, _M is the source function, and Sfis the geo-scale factor given by
Sf ðKÞ ¼cosðλÞ
4πffiffiffiffiffiffiffiffiffiffiffiffiffiffiffiffiffiffiffiffiffiffiffiffiffiffiffiffiffiffiffiffiffiρsρeαsðKÞαeðKÞ5
q ð8Þ
where ρs and ρe are the densities of the lunar surface and sourceregion, αs and αe are the P or S-wave velocity of the lunar surfaceand source region, λ is the incident angle of the seismic phase. Rtc
is the integrated value of reflectance and transmission coefficientsthrough the seismic path. RðΔÞ is the geometrical spreading atepicentral distance of Δ (Aki and Richards, 2002).
Though we do not have evident information about sourcefunction of moonquakes, Goins et al., (1981) estimated that thecorner frequency of the deep moonquake may be about 1.0 Hzfrom analysis of the spectrum. Then, in this low frequency range,
we can presume as
_Mðf Þ ¼M0 ðbelow about 1:0 HzÞ ð9Þwhere M0 is the seismic moment in Nm. We have little informa-tion about radiation patterns of moonquakes. In this study, weadopt constant value of 0.5 as the radiation pattern for all seismicphases, then rpðKÞ ¼ rp¼ 0:5.
NR in Eq. (4) is the effective (root-mean-square) value of inputequivalent noise converted to ground motion (velocity) of theseismometer. The effective value is represented by the followingequation, using Dlðf Þ in Eq. (1), such that
NR ¼ffiffiffiffiffiffiffiffiffiffiffiffiffiffiffiffiffiffiffiffiffiffiffiZ
Dlðf Þ2dfs
ð10Þ
Using Eqs. (4)–(10), we will evaluate the detection of the core-phases by the VBB in the low frequency range.
3.2. Evaluation in high frequency range
In the frequency range higher than about 0.1 Hz, it is difficult topredict waveforms of the core-phases using theoretical equationssuch as Eq. (5), due to effect of intensive scattering. Therefore, weadopt an assumption that the energy of an input impulse beforescattering is preserved after the scattering on lunar surface. Thatmeans that average square amplitude of an input impulse isequivalent to that of an observed waveform whose time windowis T0 after arrival to the surface. Then, we set the condition ofdetection of core phases as
sw24 nw2 ð11Þwhere nw2 is the average square amplitude of moonquake wave-form, which has a time window of T0, and nw2 is also the averagesquare amplitude of noise waveform of the seismometer, whosetime window is T0. The average square amplitude of a seismicsignal of phase K observed at an epicentral distance of Δ is definedas
sw2ðΔ;KÞ ¼Z
Pðf ;Δ;KÞdf ð12Þ
Pðf ;Δ;KÞ ¼ 1T0
Sðf ;Δ;KÞ2 ð13Þ
where Pðf ;Δ;KÞ and Sðf ;Δ;KÞ are PSD and Fourier amplitudes ofthe seismic signal of phase K observed at an epicentral distance ofΔ in velocity. As described above, since the average squareamplitude of the observed signal is equivalent to that of inputimpulse before scattering, the Fourier amplitude is represented bytheoretical equation including attenuation effect;
Sðf ;Δ;KÞ ¼ A0ðf ;Δ;KÞ � expð−πf tnðKÞÞ ð14ÞThe average square amplitude of a noise waveform is also
defined by
nw2 ¼N2R ¼
ZDlðf Þ2df ð15Þ
This noise waveform is represented as the input equivalentnoise converted to ground motion (velocity). Eq. (11) is rewrittenusing Eqs. (12)–(15), such that
1T0
Z A0ðf ;Δ;KÞ � expð−πf tnðKÞÞ2df 4 Z
Dlðf Þ2df ð16Þ
In this study, the frequency bandwidth [0.5–1.5 Hz] is used ashigh frequency range, because we can identify the seismic signalsof deep moonquakes around this frequency from Apollo data atleast. We also assume _Mðf Þ ¼M0 during this frequency range inthe calculation of Eq. (14). In this bandwidth, we will take asreference the SP seismometer performance.

R. Yamada et al. / Planetary and Space Science 81 (2013) 18–3124
From Eqs. (4) and (16), we can evaluate core-phase detection inboth low frequency and high frequency, if we know the values ofA0ðf ; Δ;KÞ and tnðKÞ of the core-phases and detection limits of theLP bandwidth of the VBB and the SP bandwidth of the SP. Thedetection limits are already indicated in Fig. 4. For the calculationsof A0ðf ; Δ;KÞ and tnðKÞ based on Eqs. (6)–(9), we need informationof lunar interior structure and seismic moment which aredescribed in the next section.
4. Models
4.1. Lunar interior model
In this study, we use the VPREMOON lunar interior model (Garciaet al., 2011). In this model, the velocity structure of mantle and crustwas constructed to satisfy lunar seismic and geodetic data, and alunar core size of 380740 km was estimated by detection of core-reflected shear wave energy; ScSH. The liquid Fe-core seems to beappropriate based on geophysical data such as magnetic data (Hoodet al., 1999), geodetic data (Williams et al., 2001; Khan andMosegaard, 2005) and the seismic data (Garcia et al., 2011). Thoughthe P and S wave velocities and density change with depth in themantle of VPREMOON model, we used the averages of P and S wavevelocities and density as the parameters in the lunar mantle forsimplification of calculation because it does not affect on values ofcalculated amplitudes so much and constant elastic velocity in themantle also seems to be appropriate in other studies (Khan et al.,2006). The values of seismic quality factor were referred fromTable 6 in Garcia et al., (2011).
Fig. 7 shows the lunar interior model used in this study;(a) profiles of P and S-wave, density and (b) seismic quality factorwith Moon's radius. Since the value of P-wave velocity in the lunarcore is not defined in the VPREMOONmodel, we adopted the valueof 5.0 km/s from Sellers (1992). As described in Section 1, thisvalue has large uncertainty. However, some measurements underhigh temperature and pressure show that the compressional wavevelocity of liquid Fe is about 4.0–4.5 km/s under pressure in lunarcentral core (about 5 GPa) (Sanloup et al., 2004; Jing et al., 2012).The value of 5 km/s as P-wave velocity in the lunar core seems tobe appropriate.
4.2. Seismic moment
For future lunar seismic experiments, the deep moonquakes willbe the main targets, because the events repeatedly occur on identicalsources, and some nests are already located from analysis of Apollo
Fig. 7. Lunar interior model which has liquid Fe core whose size is 380 km; (a) profiles ofP and S waveform with radius of the Moon. These profiles are referred from VPREMOO
data (Nakamura, 2005). The located deep moonquake nests areuseful in considering positions of the seismic stations to detect thelunar core-phase. In this study, we derive seismic moments of theevents originated from the located active deep moonquake nests anduse them for the evaluation of Eqs. (4) and (16).
4.2.1. Derivation of seismic momentThe seismic moment of a large deep moonquake (originated at
6:34, day 304, 1975) only was evaluated in Goins et al., (1981), butthe deep moonquakes of the same nest have various amplitudes;suggesting variations of the seismic moments. Since we do notknow this variation, we derived the distribution of the momentfrom the deep moonquake events observed by the Apollo LP. Asdescribed in Section 3.2, around frequency of 1 Hz where seismicenergies can be identified from Apollo data, we assume thataverage square amplitude of an input impulse is equivalent tothat of a waveform whose time window is T0 after arrival to thesurface, and the Fourier amplitude of the observed signal isrepresented by theoretical equation including attenuation effectsuch as Eq. (14). Then, the seismic moment could be estimated.
M0 ¼ Sobsðf 0; Δobs; SÞ=Sðf 0; Δobs; S; M0 ¼ 1Þ ð17Þ
where Sobsðf 0;Δobs; SÞ is the Fourier amplitude of an observedS-waveform of a deep moonquake at frequency f 0 and epicentraldistance Δobs and Sðf 0; Δobs; S; M0 ¼ 1Þ is the calculated one usingEq. (14) with the seismic moment M0¼1. We use data ofS-waveforms to derive seismic moments because the S-waveformscan be identified from deep moonquakes more clearly thanP-waveform. We also apply f 0¼1.0 Hz as the dominant frequencyof deep moonquake. The Fourier amplitude of the observed wave-form is calculated by
Sobsðf 0;Δobs; SÞ ¼Z T0=2
−T0=2uðt;Δobs; SÞexpð−2πif 0tÞdt ð18Þ
where uðt;Δobs; SÞ is the observed deep moonquake waveform intime series after arrival of S-waveform. This equation indicates thatthe values of Fourier amplitude and seismic moment of a deep eventvary with length of time window T0. However, we do not know howlong the seismic coda of a seismic phase due to the seismicscattering continues. (Goins et al., 1981) selected the time windowof 27 min to cover entire seismic coda of direct S-waveform, but itmay be too long because many refracted and reflected seismicphases will arrive into the seismic coda and energies of their laterphases can be added to the previous ones. Therefore, we apply twocases, minimum and maximum cases, to derive seismic moments.
P and S waveform velocities and density and (b) profiles of seismic quality factors ofN model (Garcia et al., 2011).

R. Yamada et al. / Planetary and Space Science 81 (2013) 18–31 25
In minimum case, we assume that seismic energy of direct S-waveform is preserved until other seismic phases arrive to theseismic station. This may be not necessarily correct; but it isconservative condition to evaluate the seismic moments. Weassume that the S-waveform reflected at boundary between thesurface low velocity zone and the upper crust is first seismic phaseafter arrival of direct S-waveform and reflection at lunar surface,though the reflected phases are not usually observed because theyare buried in the seismic coda of direct S-waveform. The investi-gation of lunar surface structure (Cooper et al., 1974; Mark andSutton, 1975; Vinnick et al., 2001) indicated the Moon had alow-velocity zone whose thickness was about 1 km at the surfaceand the averaged S-wave velocity was about 0.5 km/s. Though thearrival time of the reflected S-waveform depends on the reflectedangle, first reflected wave will arrive at the seismometer in about5 s later after arrival of direct S-waveform. We adopt T0¼5.0 s asthe time window to evaluate seismic moment in the minimumcase.
In maximum case, we apply the assumption in Goins et al. (1981).This paper estimated the Fourier amplitude of a deep moonquake
Fig. 8. Cumulative numbers of the deep moonquake events originated from active15 nests which has seismic moment larger than a given value in both minimum andmaximum seismic moment models. This figure also shows the cumulative numbersof deep events originated from specific nests; A1 and A6 related with seismicmoment in only maximum case.
Fig. 9. Distribution of seismic moment of deep moonquake events of each active 15 nestsmoment is represented as number per year at intervals of 0.1 Nm in logarithmic expres
from Apollo LP data whose length is 27 min. The waveforms of thistime length roughly include overall envelope of the event and it isassumed that energy of direct S-wave is preserved over wholeenvelope and those of later reflected phases are negligible. Wederive distributions of the seismic moment using T0¼5.0 s (mini-mum case) and T0¼27 min (maximum case) respectively, andevaluate detection of core-phases.
4.2.2. Locations of deep moonquakesWe describe the active nests of the deep moonquakes as target
in the future missions. We define the active nests as thosegenerating more than 50 identified events through period ofApollo seismic experiments and located with good accuracy inNakamura (2005). The following 15 nests are selected; A1, A6, A7,A8, A9, A10, A13, A15, A18, A20, A21, A25, A33, A42 and A51. AX isthe name of the deep moonquake nest defined in the Apollo long-period event catalog (Nakamura et al., 1981) and the locations arelisted in Nakamura (2005). We derive a distribution of seismicmoments through analysis of the Apollo deep moonquake eventsoriginating from these 15 nests.
4.2.3. Distribution of the seismic momentsAbout 800 deep events were analyzed to derive distributions of
the seismic moments from the Fourier amplitude using Eqs. (17)and (18). These events have S/N large enough to identify arrival ofS-waveform using the cross-correlation with reference stackingwaveform (Nakamura, 2003). We used the seismic data observedat Apollo 12 LP for the analysis, because the seismic records atstation 12 had equal amplitudes on all three components ofground motion and they are expected not to be affected by seismicpolarization due to surface strong-scattering zone and indicatetrue amplitude (Goins et al., 1981). Then, Δobs in Eqs. (17) and (18)means epicentral distance between Apollo 12 seismic station andeach active deep nest. Each seismic moment derived from onedeep moonquake is the average moment of the three componentsdata; two horizontal (LPX and LPY) and one vertical (LPZ).
Fig. 8 shows the derived cumulative numbers of all analyzeddeep events with seismic moments larger than a given value inminimum and maximum cases and those of two specific deepnest; A1 and A6 in only the maximum case, and Fig. 9 shows theoccurrence number of the deep moonquake which has the seismicmoment per year for each active deep nest with interval of 0.1 Nmin the (a) maximum case and (b) minimum case. These figuresshow that the activity and distribution of seismic moment are
in (a) maximum case and (b) minimum case. The number of event for each seismicsion.

R. Yamada et al. / Planetary and Space Science 81 (2013) 18–3126
different among each active deep nest. Then, we evaluate thepossible numbers of core-phases to be detected by our seism-ometers during the observation period (one year) using seismicmoment distribution for each active nest. One year is the expectedobservation term for future lunar missions such as the SELENE-2mission. We also evaluate the detection number of core-phasesoriginating from only the A1 nest, because A1 is the most activenest, as shown in Fig. 9, and it will be an important target forfuture experiments.
5. Results
In this section, we present the numbers of core-phases such asScS and PKP expected to be detected by VBB and the SP throughthe one-year lunar mission. In Earth's case, a similar study wasperformed for teleseismic phases (Wysession, 1996). Fig. 10 showsthe travel-time curves of five main seismic phases using theinterior structure model shown in Fig. 7(a). In Fig. 10, PcP andScS phases are P and S waveforms reflected at the core–mantle
Fig. 10. Travel time curves of five seismic phases; P, S, PcP, ScS and PKP. These traveltime curves were calculated using interior model shown in Fig. 7(a) and sourcedepth of 867 km.
Fig. 11. Fourier amplitude of five seismic phases; P, S, PcP, ScS and PKP as functionof epicentral distance at a frequency of 0.1 Hz. These amplitudes were calculatedwith seismic moment of 1.0E13 Nm using interior model shown in Fig. 7 and sourcedepth of 867 km. ‘PKP-DSM’means the amplitude of PKP phase calculated by DirectSolution Method (DSM).
boundary. Here, we notice that the core-reflected waveforms suchas PcP and ScS arrive as later phases of direct P and S waveforms,as shown in Fig. 10. Since these reflected phases are buried inintensive seismic coda of direct phases, we have to observe at lowfrequencies range where the effect of seismic scattering is weak.As described in Section 3, the VBB sensor is useful to achieve theobservation at frequencies lower than 0.1 Hz. On the other hand,we will be able to detect PKP phase in high frequency rangearound 1.0 Hz on both the SP and the VBB, because PKP phasearrives first at large distances as shown in Fig. 10. For the VBB, wecan also detect the PKP phase as later phase in low frequencyrange from 115 to 1401 of epicentral distance shown in Fig. 10.
Since the liquid core is more plausible than the solid core asdescribed above, most energies of S-waveform can be reflected atthe core–mantle boundary (Garcia et al., 2011). Fig. 11 indicatesFourier amplitudes of five seismic phases as a function of epicen-tral distance at frequency of 0.1 Hz. These amplitudes are calcu-lated using Eq. (14) with seismic moment of 1.0E13 Nm. This figureshows that amplitude of ScS phase is about ten times larger thanthat of PcP phase under assumption of liquid core. From thisreason, ScS phase will be the main core phase for the VBB sensorin future missions, and we evaluate the detection numbers of ScSphases and PKP phases for the VBB sensor. For the SP sensor, it isdifficult to detect reflected core phases such as ScS phase orsecondary PKP phase. However, first arrival PKP phase at largedistances are expected to be detected by the SP sensor. Weevaluate the detection numbers of PKP phases for both the SPand VBB sensor in this study.
On the other hand, the calculation of the amplitude of PKPphase using simple ray theoretical method such as Eq. (5) is notnecessarily appropriate near focusing distance because it does notprecisely represent effects of interference among various PKPphases arrive from various directions in lunar sub-surface struc-ture. We, therefore, calculated amplitude of PKP phase withseismic moment of 1.0E+13 at far distance using DSM (DirectSolution Method). The result is shown in Fig. 11 as “PKP-DSM”.This figure show that both calculations indicate similar values ofamplitudes, but the profiles are specially distinguishes at epicen-tral distances larger than 1751. From this comparison, we correctthe amplitude of PKP phase using result of DSM calculation atepicentral distance larger than 1751. On the other hand, it isdifficult to represent effects of the interference to calculate theamplitude of PKP phases precisely, because we do not know theheterogeneity in lunar sub-surface structure affects the interfer-ence. We may be able to investigate this effect from comparisonbetween our current calculations and actual amplitudes of PKPphases observed in future lunar seismic experiments.
5.1. ScS detection
In this section, the numbers of ScS phases to be detected by theVBB through one-year missions is evaluated. As described inSection 3.1, we can express waveform of ScS phase using theore-tical Eq. (5) in low frequency range. Fig. 12 shows the calculatedScS waveformwith the VBB noise. The waveform is calculated withseismic moment of 1.0E12.5 Nm at an epicentral distance of 101and depth of 867 km (the depth of A1 nest) and filtered between0.09–0.11 Hz. The seismic moment of 1.0E12.5 Nm is most expectedvalue from deep events, as shown from Fig. 9(a) in maximum case.This waveform is expressed including the response of the VBBseismometer system and compared to the VBB noise model withsampling rate of 100 Hz and 24 bits resolution. With a noiseamplitude spectral density of about 8.3E–11 m/s/Hz1/2 at 0.1 Hz(Fig. 4) and a LSB of about 0.7E–12 m/s/DU, we expect, from Eq. (10),a RMS noise of about 1.2E–11 m/s in the 0.02 Hz (from 0.09 to0.11 Hz) bandwidth, which corresponds to about 17 DU. This will

R. Yamada et al. / Planetary and Space Science 81 (2013) 18–31 27
generate a peak-to-peak noise about three times this value, which isplotted in Fig. 12. This figure also shows that we will be able toidentify the ScS waveform with possible seismic moment near theactive deep nests by standard waveform stacking.
Fig. 12. Simulated ScS waveform of a deep moonquake observed by the VBBseismometer. The signal and noise are filtered between 0.09 and 0.11 Hz andsimulated with sampling rate of 100 Hz and resolution of 24 bits. This event isassumed to be originated from a deep nest at epicentral distance of 401 and depthof 867 km with seismic moment of 1.0E12.5 Nm.
Fig. 13. The number of ScS phases expected to be detected by the VBB around 0.1 Hz fromseismic moment models. These numbers are evaluated on each station position (21 by 21of ScS phases to be detected by the VBB around 0.1 Hz from only A1 nest during same tewhite stars indicate the epicenters of active deep nests located in (Nakamura, 2005), and(lines of +901 and −901).
To evaluate detection numbers of core phases on each stationposition, we firstly derive Mlimit using calculated Umax of ScS phasesfrom all active 15 nests on the whole lunar surface (21 by 21). It isdefined as
Mlimitðθ;φ;AiÞ ¼NR
Umaxðθ;φ;Ai;M¼ 1Þ ð19Þ
where θ is the latitude, φ is the longitude and Ai is the type of nest, asdefined from 1 to 15. Umaxðθ;φ;Ai;M¼ 1Þ is the maximum amplitudeof a core phase generated from nest Ai observed at a station positionof (θ,φ), using a seismic moment of 1, and it is calculated from Eq. (5).Then, Mlimitðθ;φ;AiÞ is the minimum seismic moment at which wecan detect core phases at the position of (θ,φ) for each deep nest Ai bythe seismometer with RMS noise level of NR. We can detect corephases which have seismic moment larger than Mlimit . The value ofMlimit is defined to be 0 if we cannot detect the core phases (ScS orPKP) outside observable distance range of the phases for each Ai nest.For example, we cannot observe ScS phases in far range larger thanabout 1401, as shown in Fig. 10.
Then, expected detection number of core phases per year (EXN)on each position is defined as below equation;
EXNðθ;φÞ ¼ ∑15
i ¼ 1CDNðAi;Mlimitðθ;φ;AiÞ Þ ð20Þ
where CDN is the cumulative number of deep moonquakes peryear which has seismic moments larger than Mlimit for each deepnest Ai. CDN is defined to be 0 when Mlimit is 0 for each Ai. Thevalue of CDN is derived from Fig. 9 in both maximum and
active 15 nests during one year mission using the (a) minimum and (b) maximum) using lunar interior model shown in Fig. 7. The figure of (c) also indicates numberrm under assumption of maximum seismic moment and seismic activity of A1.Thethe white vertical dashed lines are boundaries between lunar near-side and far-side

R. Yamada et al. / Planetary and Space Science 81 (2013) 18–3128
minimum cases. We assume that active deep nests generate deepmoonquakes following activities during Apollo-era as shown inFigs. 8 and 9 in future experiments.
Fig. 13 shows the values of EXNðθ;φÞ of the ScS-phase to bedetected by VBB on the lunar surface for the (a) minimum case and(b) maximum case. If we assume seismic moments as minimum case,we can expect detection of about 20 ScS phases around north-eastregion on the lunar near-side during one year. As shown in Fig. 9,since the active deep nests located in north-east region as A6 and A7has larger seismic moments than other nests, deployment of aseismic station on the region will be desirable to detect the reflectedcore phases. On the other hand, if we assume seismic moments asmaximum case, about 100 ScS phases per year may be detected onentire lunar nearside, mainly west side. In maximum case, we candetect ScS phases generated from more active nests such as A1, anddeployment on west side around A1 site is more desirable. Thesefigures show that desirable station positions to detect core reflected-phases are different depending on assumptions of seismic moment,though minimum case is more conservative condition. Common toboth cases, the positions around A18 and A51 may be good place todetect ScS phase, and then we could detect about 20–100 ScS phasesaround the region. Anyway, in the plan of SELENE-2 mission, the soft-landers will be deployed on lunar near-side for direct communicationto the Earth. Use of the VBB sensor will be gainful to detect ScSphases in this mission.
On the other hand, Fig. 13(c) shows EXNðθ;φÞ of the ScS phase foronly the most active nest; A1 in the maximum case. In this result, we
Fig. 14. Number of PKP phases expected to be detected by the VBB around 0.1 Hz fromseismic moment models. These numbers are evaluated on each station position (21 by 21of PKP phases to be detected by the VBB around 0.1 Hz from only A1 nest during same tewhite stars indicate the epicenters of active deep nests located in (Nakamura, 2005), and(lines of +901 and −901).
use only CDN and Mlimit of A1 in the calculation of EXN. We canexpect about 20 ScS phases will be detected aroundA1 nest. Deploy-ment of the seismic station on south-west region of lunar near-sidewill be efficient to detect ScS phases from the A1nest.
5.2. PKP detection
We show the results for PKP detection using the VBB sensor.Fig. 14 indicate the values of EXNðθ;φÞ of PKP-phase to be detectedby the VBB on lunar surface for the (a) minimum case,(b) maximum case and (c) A1 maximum case. These results werealso calculated using Eqs. (19) and (20) for PKP phase aroundfrequency range of 0.1 Hz [0.09–0.11 Hz]. As described in previoussection, we corrected values of Umax at epicentral distances largerthan 1751 using results of DSM. On the other hand, this correctiondoes not change number of PKP detection so much because theepicentral distance larger than 1751 are about 1–2% among allcalculated distances.
Fig. 14(a) indicates that we can detect about 15 PKP phases peryear at south-west region of lunar far-side where are correspondingto antipodes of active deep nests located in north-east region of thelunar near-side. In maximum case (Fig. 14(b)), we may be able todetect about 40 PKP phases in north-east region of lunar far-sidewhere are corresponding to antipodes of the deep nests located insouth-west region of the lunar near-side as much as the south-westregion of lunar far-side. In the case, the south-west region of lunarnear-side will be also targeted place for deployment of the seismic
active 15 nests during 1 year mission using the (a) minimum and (b) maximum) using lunar interior model shown in Fig. 7. The figure of (c) also indicates numberrm under assumption of maximum seismic moment and seismic activity of A1. Thethe white vertical dashed lines are boundaries between lunar near-side and far-side

R. Yamada et al. / Planetary and Space Science 81 (2013) 18–31 29
station. Fig. 14(c) indicates expectation of detection of about 25 PKPphases from the A1 nest around antipode of A1 in maximum case.These are almost first arrival seismic phases and can be detected notonly at low frequencies but also at high frequencies.
The SP sensor is also available to detect first arrival PKP phasesin far epicentral distance region. To derive EXN of the SP sensor inhigh frequency range, we calculate Mlimit using next equation;
Mlimitðθ;φ;AiÞ ¼nw2
sw2ðθ;φ;Ai;M ¼ 1Þð21Þ
where nw2ðθ;φ;Ai;M¼ 1Þ is average square amplitude of moon-quake waveform generated from deep nest Ai at station position of(θ,φ) and it is calculated from Eqs. (12)–(14) using seismicmoment of 1.
Fig. 15 shows the EXNðθ;φÞ of first arrival PKP-phase to bedetected by the SP for the (a) minimum and (b) maximum seismicmoment models derived from Eq. (20) using Mlimit in Eq. (21).Fig. 15(a) shows that we could detect about 10 PKP phases onsouth-west region of lunar far-side. This region corresponding toantipode of deep nests occur large moment events such as A6 andA7. In the maximum case, we could also detect about 5 PKP phaseson south-west limited region of the lunar far-side as shown inFig. 15(b). The reason which the EXNðθ;φÞ is less in the maximumcase than those in the minimum case is caused from calculation ofthe average square amplitude in the Eqs. (12) and (13). In thisequation, we divide the Fourier amplitude by the time windowof T0 to represent the average square amplitude. T0 ¼ 1620 s(27 min) may be too long as time window to represent seismicenergy. Anyway, the deployment of the seismic stations on south-west region of lunar far-side will be important to detect PKPphases for both the SP and the VBB.
However, in the case of the SELENE-2 mission, the deploymentin the lunar far-side is not planned. The deployment of the seismicstation in the lunar far-side will be expected for Farside explorerand future penetrator missions such as past LUNAR-A project.Since the SP sensor can be implemented on the penetrator, thesensor is useful to detect seismic phase which pass throughinterior of the core, assuming of course that the source referencetime is constrained by a seismic measurement on the near side.This will therefore enable cost optimization for future seismicnetworks, for example if based on a single SELENE-2 landercomplemented with several penetrators and might better addressseismic constraints on lunar lateral variations (Chenet et al., 2006).
Fig. 15. Number of PKP phases expected to be detected as first seismic arrival phase(a) minimum and (b) maximum seismic moment models. These numbers are evaluatedwhite stars indicate the epicenters of active deep nests located in (Nakamura, 2005), an(lines of +901 and −901).
Due to its focus on core phases, we have concentrated ourdiscussion in the 0.1–1.5 Hz bandwidth, but other signals will berecorded below 0.1 and above 1.5 Hz. For example, the SP sensor onsoft-landers can record signal up until 50 Hz, which will allow thedetection of high frequency lunar seismic events, such as shallowmoonquakes (Nakamura, 1977), small and regional meteoroid impactand thermal moonquakes (Diennebier and Sutton, 1974b), in additionto the investigation of the source functions of their events includingthe deep moonquakes. On the low frequency end, although freeoscillations observations will be likely only for operation durationcomparable to Apollo (Gudkova and Zharkov, 2002; Lognonné,2005), surface waves are likely to be detected by the VBB below0.1 Hz (Gagnepain-Beyneix et al., 2006).
6. Discussion
6.1. Source parameters of deep moonquake
In this study, we have calculated the seismic moments of deepmoonquakes from Fourier amplitude spectrum in two cases of timewindow. As shown in Fig. 8, the distributions of the seismic momentsof deep moonquakes are largely different between the two assump-tions. From the reason, we derived the expected detection numbers ofcore-phases both in two end cases. We can say at least that we canexpect the detection numbers in range of results between minimumand maximum cases as shown in Figs. 13–15. For sure detection, werecommend to refer maps of the minimum case such as Figs. 13(a) and14(a) and the maximum case as Fig. 15(b), because they are severerconditions.
We also assumed a radiation pattern of 0.5 for all seismic phases.We do not have distinct information of radiation pattern of thedeep moonquake, though some focal mechanisms are estimated(Nakamura, 1978; Weber et al., 2009). The value of the radiationpattern changes values of the seismic moment shown in Figs. 8 and 9from calculation of Eq. (17). But that may not affect the calculation ofFourier amplitude from Eqs. (7), (9) and (14), because effects ofradiation pattern cancel out in the calculation of Sðf ;Δ;KÞ underassumption of constant radiation pattern.
6.2. Lunar interior model
In this study, we used a lunar interior model which has constantvelocity in the mantle based on VPREMOON model (Garcia et al.,
by the SP around 1.0 Hz (from 0.5 to 1.5 Hz) during one year mission using theon each station position (21 by 21) using lunar interior model shown in Fig. 7. Thed white vertical dashed lines are boundaries between lunar near-side and far-side

R. Yamada et al. / Planetary and Space Science 81 (2013) 18–3130
2011). However, there are two cases of researches which describe thatlunar mantle has boundaries where the velocities change (Goins et al.,1978; Nakamura, 1983) or constant velocity (Khan et al., 2006).Though we do not have credible evidence of the boundaries, thevelocity change of a few percent in the mantle does not vary theamplitudes of core-phases so much.
On the other hand, the value of seismic quality factor (attenua-tion parameter) varies the amplitudes of core-phases much morethan the velocity. The seismic quality factors were derived fromanalysis of amplitudes and power spectra of lunar seismic events(Nakamura et al., 1976; Nakamura and Koyama, 1982), and thevalues have large errors especially in the deep Moon. We will needfurther analysis of Apollo seismic data and/or new seismic dataobserved by broad band seismometer to constrain the attenuationparameters with better accuracy.
The lunar sub-surface structure has also an important effect onamplitudes. In this study, even if we ignored seismic amplificationcaused from surface fractured structure, the structures will differdepending on location of seismic station and may change theamplitudes of core-phases at different landing sites. Though wecannot apply this effect to our calculation accurately, because wedo not know the lunar sub-surface structures except for someApollo landing sites, comparison of the calculated amplitudes ofseismic phases in this study with actual amplitudes observed infuture missions could give information of the sub-surface struc-ture and interference among seismic phases of the landing site.
1. Conclusion
In this study, we evaluated detection capabilities of the seismicphases which are reflected from core-mantle boundary and passthrough interior of the core by the new seismometers for soft-landers in future lunar missions. First, we confirmed that we canobserve the lunar seismic events with a much better S/N com-pared with past Apollo seismometers using expected performanceof the new seismometers. Then, we evaluated the number of core-phases to be detected during future missions in low frequencyrange for ScS and PKP by the VBB and high frequency range forPKP by the SP following distributions of seismic moments of deepmoonquakes under two assumptions.
Referring to recent lunar interior model (Garcia et al., 2011), weexpect that the VBB can detect ScS and PKP phases around 0.1 Hzwhere effect of scattering will weaken in seismic coda. Theexpected detection numbers of ScS phase originated from 15active deep moonquake nests are about 100 on west side of lunarnear-side in maximum case and about 20 on north-east side oflunar near-side in minimum case during one year observation. Thedetection of about 5–10 PKP phases by the SP and 15–30 by theVBB can be also expected at south-west region of lunar far-sideduring one year, and limited regions in southern-west region oflunar near-side may be also appropriate place to detect PKP phasesfor only the VBB
We still have uncertainties about source parameters of deepmoonquakes, lunar seismic quality factor and lunar sub-surfacestructures. Though changes in these parameters would vary resultsof detection numbers, the positions to detect the core-phases mayessentially not change because they are mainly governed by thegeometry of deep nest locations. Then, the contour maps such asFigs. 13–15 will be gainful to plan the positions of seismic stationsin future lunar seismic experiments. From this study, we demon-strate that the seismometers of lunar soft-landers have perfor-mances allowing to observe direct waveforms more clearly thanpast Apollo mission and to detect core-phases. If we selectappropriate locations of the seismic stations following our results,we can obtain very important data so as to constrain lunar core
parameters (size, state and composition), and better understandorigin and evolution of the Moon.
References
Aki, K., Richards, P.G., 2002. Body waves in media with depth-dependent proper-ties. In: Ellis, J. (Ed.), Quantitative Seismology, second edition University ScienceBooks, California, pp. 385–490.
Canup, R.M., Asphaug, E., 2001. Origin of the Moon in a giant impact near the end ofthe Earth's formation. Nature 412, 708–712.
Chenet, H., Lognonné, P., Wieczorek, M., Mizutani, H., 2006. Lateral variations oflunar crustal thickness from Apollo seismic dataset. Earth and PlanetaryScience Letters 243, 1–14.
Cooper, M.R., Kovach, R.L., Watkins, J.S., 1974. Luna near-surface structure. Reviewsof Geophysics and Space Physics 12 (3), 291–308.
Dainty, A.M., Toksöz, M.N., Anderson, K.R., Pines, P., 1974. Seismic scattering andshallow structure of the Moon in Oceanus Procellarum. The Moon 9, 11–29.
Duennebier, F., Sutton, G.H., 1974A. Meteoroid impacts recorded by the short-period component of Apollo 14 lunar passive seismic station. Journal ofGeophysical Research 79 (29), 4365–4374.
Duennebier, F., Sutton, G.H., 1974B. Thermal moonquakes. Journal of GeophysicalResearch. 79 (29), 4351–4363.
Gagnepain-Beyneix, J., Lognonné, P., Chenet, H., Lombardi, D., Sphon, T., 2006.A seismic model of the lunar mantle and constraints on temperature andmineralogy. Physics of the Earth and Planetary Interiors 159, 140–166.
Garcia, R.F., Gagnepain-Beyneix, J., Chevrot, S., Lognonné, P., 2011. Very preliminaryreference Moon model. Physics of the Earth and Planetary Interiors 188,96–113.
Goins, N.R., ToksÖz, M.N., Dainty, A.M., 1978. Seismic structure of the lunar mantle:an overview. In: Proceedings of the 9th Lunar Planetary Science Conference.pp. 3575–3588.
Goins, N.R., Dainty, A.M., Toksöz, M.N., 1981. Seismic energy release of the Moon.Journal of Geophysical Research 86 (B1), 387–388.
Gudkova, T.V., Zharkov, V.N., 2002. The exploration of the lunar interior usingtorsional oscillations. Planetary and Space Science 50, 1037–1048.
Hood, L.L., Mitchell, D.L., Lin, R.P., Acuna, M.H., Binder, A.B., 1999. Initial measure-ments of the lunar induced magnetic dipole moment using lunar prospectormagnetometer data. Geophysical Research Letters 26, 2327–2330.
Jing, Z., Wang, Y., Yu, T., Sakamaki, T., Kono, Y., Park, C., 2012. In-situ ultrasonicsound velocity measurements of Fe and Fe-light element alloying liquids athigh pressures with implications to planetary cores. In: Proceedings of theAmerican Geophysical Union, Fall Meeting. (Abstract) #DI33A-2426.
Khan, A., Mosegaard, K., 2005. Further constraints on the deep lunar interior.Geophysical Research Letters 32, L22203, http://dx.doi.org/10.1029/2005GL023985.
Khan, A., Maclennan, J., Taylor, S., Connolly, J., 2006. Are the Earth and the Mooncompositionally alike? Inferences on lunar composition and implications forlunar origin and evolution from geophysical modeling. Journal of GeophysicalResearch 111, E05005, http://dx.doi.org/10.1029/2005JE002608.
Kim, W.J., Sushkov, A.O., Dalvit, D.A.R., Lamoreaux, S.K., 2010. Surface contactpotential patches and Casimir force measurements. Quantum Physics arXiv0905, 3421v3.
Lammlein, D.R., 1977. Lunar seismicity and tectonics. Physics of the Earth andPlanetary Interiors 14, 224–273.
Latham, G., Ewing, M., Dorman, J., Nakamura, Y., Press, F., Toksöz, N., Sutton, G.,Duennebier, F., Lammlein, D., 1973. Lunar structure and dynamics: results fromApollo Passive Seismic Experiment. The Moon 7, 396–420.
Lognonné, P., Gagnepain-Beyneix, Banerdt, W.B., Cacho, S., Karczewski, J.F., Morand,M., 1996. An ultra-broad seismometer on InterMarsnet. Planetary and SpaceSciences 44, 1237–1249.
Lognonné, P., Giardini, D., Banerdt,, B., et al., 2000. The NetLander very broad bandseismometer. Planetary and Space Science 48, 1289–1302.
Lognonné, P., Gagnepain-Beyneix, J., Chenet, H., 2003. A new seismic model of theMoon: implications for structure, thermal evaluation and formation of theMoon. Earth and Planetary Science Letters 211, 27–44.
Lognonné, P., 2005. Planetary Seismology. Annual Review of Earth and PlanetaryScience 33191-19.34, http://dx.doi.org/10.1146/annurev.earth.33.092203.122605.
Lognonné, P., Johnson, C., 2007. Planetary seismology, in treatise in geophysics.In: Shubert, G. (Ed.), Planets and Moons, 10. Elsevier, pp. 69–122.
Lognonné, P., Le Feuvre, M., Johnson, C.L., Weber, R.C., 2009. Moon meteoriticseismic hum: steady state prediction. Journal of Geophysical Research 114,E12003, http://dx.doi.org/10.1029/2008JE003294.
Mark, N., Sutton, G.H., 1975. Lunar shear velocity structure at Apollo Site 12, 14 and15. Journal of Geophysical Research 80 (35), 4932–4938.
Mimoun, D., Wieczorek, M., Alkalai, L., et al., 2011. Farside explorer: unique sciencefrom a mission to the farside of the moon. Experimental Astronomy, 10.1007/s10686-011-9252-3.
Mizutani, H., Fujimura, A., Tanaka, S., Shiraishi, H., Nakajima, T., 2003. LUNAR-AMISSION: goals and status. Advances in Space Research 31, 2315–2321.
Nakamura, Y., Duennebier, F., Latham, G., Dorman, J., 1976. Structure of the lunarmantle. Journal of Geophysical Research. 81 (26), 4818–4824.
Nakamura, Y., 1977. HFT events: shallow moonquakes. Physics of the Earth andPlanetary Interiors 14, 217–223.

R. Yamada et al. / Planetary and Space Science 81 (2013) 18–31 31
Nakamura, Y., 1978. A1 moonquakes: source distribution and mechanism.In: Proceedings of Lunar and Planetary Science Conference Proceeding 9.pp. 3589–3607.
Nakamura, Y., Latham, G., Dorman, J., Harris, J., 1981. Passive seismic experimentlong-period event catalog. Galveston Geophysics Laboratory Contribution, 491.
Nakamura, Y., Koyama, J., 1982. Seismic Q of the lunar upper mantle. Journal ofGeophysical Research 86 (B6), 4855–4861.
Nakamura, Y., Latham, G.V., Dorman, H.J., 1982. Lunar seismic experiment: finalsummary-. Journal of Geophysical Research. 87, A117–A123. (Suppl.).
Nakamura, Y., 1983. Seismic velocity structure of the lunar mantle. Journal ofGeophysical Research. 88 (B1), 677–686.
Nakamura, Y., 2003. New identification of deep moonquakes in the Apollo lunarseismic data. Physics of the Earth and Planetary Interiors 139, 197–205.
Nakamura, Y., 2005. Farside deep moonquakes and deep interior of the Moon.Journal of Geophysical Research 110, E1001, http://dx.doi.org/10.1029/2004JE002322.
Neal, C.R., Banerdt, W.B., Alkalai, L., 2010. LUNETTE: establishing a lunar geophysicalnetwork without nuclear power through a discovery-class mission. In: Pro-ceedings of the 41st Lunar and Planetary Science Conference (Abstract). 2710.
Ogawa, K., Iijima, Y., Tanaka, S., 2010. Thermal control unit for long-time survival ofscientific instruments on lunar surface. 38th COSPAR Scientific Assembly.(Abstract), B01.
Rodgers, W.,P., 1992. Frequency limits for seismometers as determined from signalto noise ratios. Part.1: the electromagnetic seismometer. Bulletin of theSeismological Society of America 82 (2), 1071–1098.
Sanloup, C., Fiquet, G., Gregoryanz, E., Morard, G., Mezouar, M., 2004. Effect of Si onliquid Fe compressibility: implications for sound velocity in core materials.Geophysical Research Letters 31, L07604, http://dx.doi.org/10.1029/2004GL019526.
Sellers, C.,P., 1992. Seismic evidence for a low-velocity lunar core. Journal ofGeophysical Research 97 (E7), 11663–11672.
Shiraishi, H., Kobayashi, N., Takeuchi, N., Murakami, H., Lognonné, P., et al., 2010.Lunar broadband seismometer system in the Japanese lunar landing missionSELENE-2; its science goals and instrument details. In: Proceedings of theAmerican Geophysical Union, Fall Meeting (Abstract). #U51B-0039.
Tanaka, S., Shiraishi, H., Kato, M., Okada, T., 2008. group of Post SELENE missions.Advances in Space Research 42, 394–401.
Vinnick, L., Chenet, H., Gagnepain-Beyneix, J., Lognonné, P., 2001. First seismicreceiver functions on the Moon. Geophysical Research Letters 28, 3031–3034.
Weber, R.C., Gills, B.G., Johnson, C.L., 2009. Constraints on deep moonquake focalmechanism through analysis of tidal stress. Journal of Geophysical Research114, E05001, http://dx.doi.org/10.1029/2008JE003826.
Weber, R., Lin, P., Garnero, E., Williams, Q., Lognonné, P., 2011. Seismic detection ofthe lunar core. Science 311, 309–312.
Wieczorek, A., M., Jolliff, L., B., Khan, A., et al., 2006. The constitution and structureof the lunar interior. In: Rosso, J. (Ed.), Reviews in Mineralogy and Geochem-istry, 60. The Mineralogical Society of America, Virginia, pp. 221–364.
Williams, J.G., Boggs, D.H., Yoder, C.F., Ratcliff, J.T., Dicley, J.O., 2001. Lunar rotationaldissipation in solid body and molten core. Journal of Geophysical Research 106,27933–27968.
Wysession, E.M., 1996. How well do we utilize global seismicity? BBSA 86 (5),1207–1219.
Yamada, R., Yamada, I., Shiraishi, H., Tanaka, S., Takagi, Y., Kobayashi, N., Takeuchi,N., Ishihara, Y., Murakami, H., Yomogida, K., Koyama, J., Fujimura, A., Mizutani,H., 2009. Capability of the penetrator seismometer system for lunar seismicevent observation. Planetary and Space Science 57, 751–763.
Yamada, R., Shiraishi, H., Tanaka, S., Fujimura, A., Yamada, I., Araya, A., Kobayashi, N.,Nébut, T., Mimoun, D., Lognonné, P., 2010. Improvement of the seismometerdeveloped for the LUNAR-A penetrator. 38th COSPAR Scientific Assembly.(Abstract), B01.