planning area analysis 2009
TRANSCRIPT

APPENDIX II – BACKGROUND ANALYSIS AND SUPPORTING
STUDIES
31
THE 2030 COMPREHENSIVE PLAN
LAND USE ANALYSIS PLANNING AREA ANALYSIS 2009

APPENDIX II – BACKGROUND ANALYSIS AND SUPPORTING
STUDIES
32
THE 2030 COMPREHENSIVE PLAN

MID DLE RD
RT37 N
FRONT ROYAL PIKE
PERRY RD
SINGHA
SS RD
TASKE
R RD
BARLEY LN
SPRINGDALE RD
JONE
S RD
VALL
EY PI
KE
MILLER RD
MERR
IMANS
LN
PAPERMILL RD
RT37 S
AIRPORT RD
MCDONALD RD
LAUREL GROVE RD
SHAD
Y ELM
RD
HILLANDALE LN
ROUN D HILL R D
CARTERS LN
ARMEL RD
NORT HWESTERN PIKE
FRONT ROYAL PIKE
ST622
ST628
ST621
ST620ST608
ST649
ST642
ST644
ST645
ST803
ST756
ST644
§̈¦81
§̈¦81
0137
0111
2
3
LegendSWSA
Urban Development Area
District Planning AreasBackcreek
Gainesboro
Opequon
Redbud
Shawnee
Stonewall
UDA Acreage - 15209 acres
SWSA Acreage - 24324 acres
Gross Acreage - 51519 acres
Planning Area Analysis 2009 - Frederick County's Urban Areas
Planning Areas
Residential
RESIDENTIALUNITS
# UNITS
Existing 16216
Planned 11544
Potential RP 2352
Land Use
Land Use TOTALACRES
VACANTACRES
Business 4242 1823
Residential 8991 3894
MUIO 149 44
Industrial 5486 2198
MUCO 148 65
Mixed-Use 738 656
N Village 114 62
Urban C 453 224
REC 352 141
PUD 1861 1530
NRR 1124 399
267 23
Hist / DSA 1803 979
Zoning
ZONING TOTALACRES
VACANTACRES
M1 2824 919
HE 29 0
EM 900 100
MS 50 50
MH1 382 40
M2 591 258
RP 7570 2507
R5 1059 832
R4 1622 1161
B3 403 214
B2 1943 1012
B1 68 0
RA 36566 15075
(All acreages based on Parcel calculated acreages)
APPENDIX II – BACKGROUND ANALYSIS AND SUPPORTING
STUDIES
34
THE 2030 COMPREHENSIVE PLAN

APPENDIX II – BACKGROUND ANALYSIS AND SUPPORTING
STUDIES
35
THE 2030 COMPREHENSIVE PLAN
ACHIEVING FISCAL BALANCE THROUGH LAND USE PLANNING THE 25% COMMERCIAL/INDUSTRIAL – 75% OTHER REAL ESTATE TAX
ASSESSMENT RATIO Local governments throughout the country rely on the revenue collected from real estate taxes to fund their general operation. Therefore, it is understandable that the revenue-generating potential for properties receives strong consideration during land use and development decisions. In many circumstances, a site’s ability to generate revenue, and an applicant’s capability to adequately mitigate negative fiscal impacts, are driving factors behind the development approval process. Prompted in part by fiscal concerns, local governments plan and ultimately zone large tracts of land for commercial and industrial use, to ensure that there is not only adequate land available for current demand but also for future demand. This practice of using land use policies (a.k.a. Comprehensive Plan) and the zoning ordinance to achieve fiscal objectives rather than purely land-use objectives is commonly referred to as ‘fiscal zoning’. Under the fiscal zoning approach, local governments discourage proposed developments that have the potential to create a net financial burden on the county and will instead encourage development that promises a net financial gain. Fiscal consideration is a significant element of land use planning. The county has successfully utilized the Comprehensive Policy Plan to designate areas of the county for future commercial and industrial (C/I) land use opportunities since the early 1970s. Over the years this practice has helped reserve designated land for vital tax generating land uses. Through the policies of the Comprehensive Plan areas designated for C/I land uses can be implemented through the rezoning process, which then allows the property owner to develop the site into commercial and/or industrial uses. Once the C/I use has been constructed, the county is then able to bring in additional tax revenues from the site. Through the support and encouragement of C/I uses, the county over the past decade has successfully maintained a relatively low (0.51 to 0.71 percent) real estate tax rate while continuing to provide a high quality of public services to its citizens. The Frederick County 2030 Comprehensive Plan strives to incorporate a more comprehensive analysis of the C/I land uses and their contribution towards the county’s fiscal health into its overall community planning effort. The importance of the C/I land use has elevated in recent years as the country strives to overcome the challenging economic times. In an effort to plan for the county’s prosperous future, the 2030 Comprehensive Plan has been drafted to designate sufficient acreage for C/I land use opportunities that is necessary to generate tax revenue that is necessary to offset the county’s costs for providing public services to the important but more financially burdensome residential land use.
APPENDIX II – BACKGROUND ANALYSIS AND SUPPORTING
STUDIES
36
THE 2030 COMPREHENSIVE PLAN
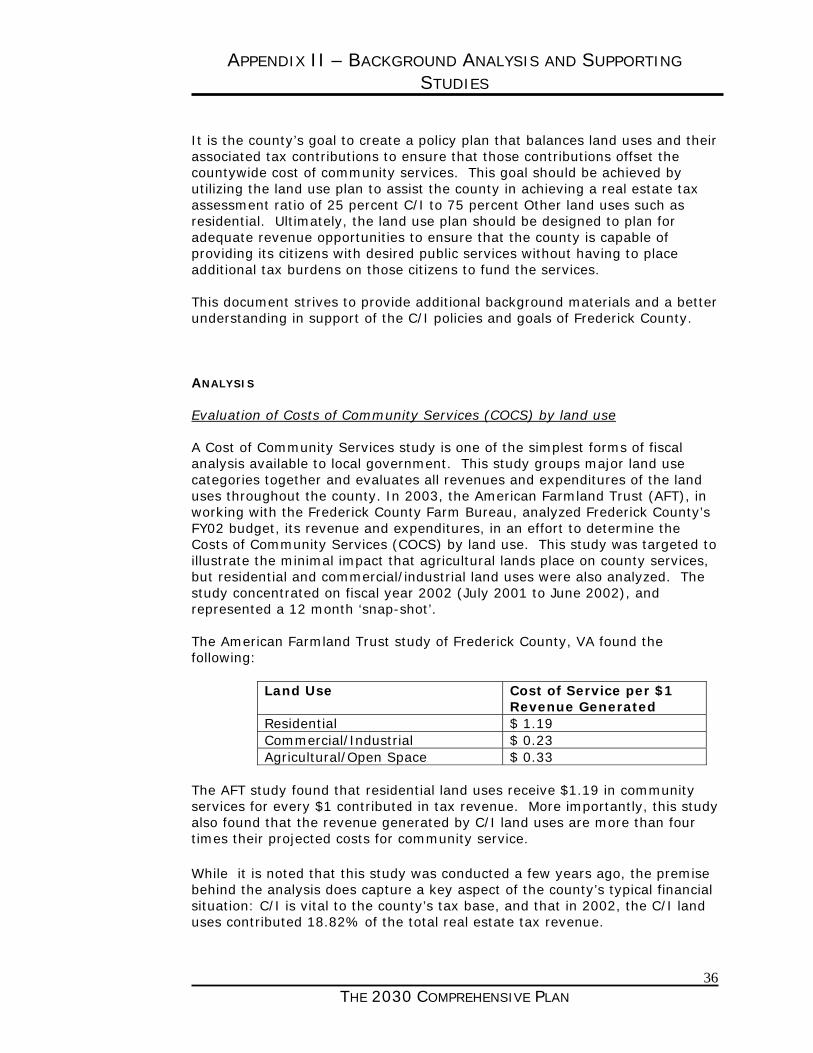
It is the county’s goal to create a policy plan that balances land uses and their associated tax contributions to ensure that those contributions offset the countywide cost of community services. This goal should be achieved by utilizing the land use plan to assist the county in achieving a real estate tax assessment ratio of 25 percent C/I to 75 percent Other land uses such as residential. Ultimately, the land use plan should be designed to plan for adequate revenue opportunities to ensure that the county is capable of providing its citizens with desired public services without having to place additional tax burdens on those citizens to fund the services. This document strives to provide additional background materials and a better understanding in support of the C/I policies and goals of Frederick County. ANALYSIS Evaluation of Costs of Community Services (COCS) by land use A Cost of Community Services study is one of the simplest forms of fiscal analysis available to local government. This study groups major land use categories together and evaluates all revenues and expenditures of the land uses throughout the county. In 2003, the American Farmland Trust (AFT), in working with the Frederick County Farm Bureau, analyzed Frederick County’s FY02 budget, its revenue and expenditures, in an effort to determine the Costs of Community Services (COCS) by land use. This study was targeted to illustrate the minimal impact that agricultural lands place on county services, but residential and commercial/industrial land uses were also analyzed. The study concentrated on fiscal year 2002 (July 2001 to June 2002), and represented a 12 month ‘snap-shot’. The American Farmland Trust study of Frederick County, VA found the following:
Land Use Cost of Service per $1 Revenue Generated
Residential $ 1.19 Commercial/Industrial $ 0.23 Agricultural/Open Space $ 0.33
The AFT study found that residential land uses receive $1.19 in community services for every $1 contributed in tax revenue. More importantly, this study also found that the revenue generated by C/I land uses are more than four times their projected costs for community service. While it is noted that this study was conducted a few years ago, the premise behind the analysis does capture a key aspect of the county’s typical financial situation: C/I is vital to the county’s tax base, and that in 2002, the C/I land uses contributed 18.82% of the total real estate tax revenue.

APPENDIX II – BACKGROUND ANALYSIS AND SUPPORTING
STUDIES
37
THE 2030 COMPREHENSIVE PLAN
In order to project the capital fiscal impacts that would be associated with residential developments, Frederick County utilizes a Development Impact Model (DIM). This DIM is a micro-level model with the ability to analyze site specific land use data. In 2010, as part of the annual review of the DIM, the Development Impact Model-Oversight Committee (DIM-OC) utilized the DIM to evaluate the costs for service for residential land uses. The DIM projects fiscal analysis over a 20 year period (a 20 year ‘snap-shot’), and considers full revenue contributions and expenditure demands, traditional budget elements as well as the associated Capital Improvement Plan projects. The DIM considers the various revenue sources such as real estate and property taxes, as well as sales, meals, and other potential taxes enabled within the community. The findings that were generated from the residential analysis were surprising. The DIM projected that over a 20 year period a single family residence valued at $270,000 would cost the county $1.95 for every $1 contributed. The DIM’s projections indicate a significant disparity in the relationship between residential tax contributions and its associated service expectations.
2010 Development Impact Model (DIM) projections over 20 year period
$270,000 Single Family Dwelling
Tax Revenue $72,881 Real Estate (direct contributions) $26,125 Personal Property, Sales, Meals,
etc (indirect contributions) $46,756
County Service Expenditures $142,394 Capital (schools, public safety,
library, etc) $ 21,672
Operations $120,722 These two studies reinforce the generally accepted belief that residential land uses require more services than their associated tax contributions cover, while on the other hand commercial and industrial land uses offer significant tax revenues which exceed their associated cost for community services. More importantly, these two studies show that the revenues generated by C/I land uses are essential in the county being able to mitigate the residential land use costs for community services, and provide for more opportunities and quality of life elements that make for a great community. Evaluation of County Tax Revenue and Expenditures Utilizing figures for the county’s fiscal year ending June 30, 2010, one gains a better understanding from where funds are derived, and where those funds are then spent.

APPENDIX II – BACKGROUND ANALYSIS AND SUPPORTING
STUDIES
38
THE 2030 COMPREHENSIVE PLAN
Real Estate taxes represented 43 percent ($41.1 million) of the county’s tax revenue in 2010.
This real estate tax revenue is derived from various land uses: residential, commercial, industrial, and agricultural. In 2010 C/I land uses brought in $5.6 million in real estate taxes, or 13.56 percent of the total real estate tax revenue. It should be noted that C/I uses only occupy 1.79 percent of the County’s total land area and contribute $1,229.5 per acre in real estate taxes. In addition to real estate taxes, C/I land uses are also significant contributors to personal property, local sales, meals and lodging, business license, and other local taxes. C/I land uses are vital contributors to the local tax revenue and ultimately contribute over 75 percent of the County’s total tax revenue. At the other end of the spectrum, residential land uses brought in $24.3 million in real estate taxes, or 59.2 percent of the total real estate tax revenue. Residential land uses make up 27 percent of the County’s total land area and contribute an average of $353.40 per acre in real estate taxes. In reviewing the county’s expenditures for the same period, a significant portion of the county’s funds are directed towards education ($65.3 million). At 52.1 percent of the expenditures, the county is clearly committed to educating its residents, preparing for the future, and providing for a high quality of life.

APPENDIX II – BACKGROUND ANALYSIS AND SUPPORTING
STUDIES
39
THE 2030 COMPREHENSIVE PLAN
This review of the County’s 2010 tax revenues and expenditures clearly illustrates that while residential land use contribute a majority of the real estate taxes collected by the County, the costs for covering services provided to those resident far exceeds their contributions. As depicted in the chart above, the expenditures for education (which is a service connected with residential land uses), is more than three times the contributions made from residential property. Through solid land use and financial planning, the county has maintained a stable, relatively low real estate tax rate for the past decade while continuing to provide top notch services to its residents. Utilizing the benefits of C/I, an increase in C/I land uses would offer the county an even greater ability to provide services or cover the increasing costs of services. Recognition of C/I Contributions to the Tax Base Commercial and industrial land uses offer significant benefits to the community, in terms of tax contributions (real estate, meals, machinery, room, etc.) with minimal expectations and impacts on county services. C/I land uses also offer key employment opportunities for the residents of the county to help improve their individual quality of life and achieve their personal goals.

APPENDIX II – BACKGROUND ANALYSIS AND SUPPORTING
STUDIES
40
THE 2030 COMPREHENSIVE PLAN
Based on the 2010 tax revenues, C/I properties represented more than 13 percent of the total real estate property assessments in the county, but accounted for less than 2 percent of the land area within the county. While land values will certainly fluctuate with the ebb and flow of the economy, C/I values will continue to be significant contributors to the county’s tax base and more importantly, C/I tax contributions will offset the residential land use cost for services. Target: Plan for C/I to Represent 25 Percent of Real Estate Assessments In an effort to maintain the county’s ability to provide high quality services while at the same time maintaining low real estate tax rates, the 2030 Comprehensive Plan is utilizing land use planning and C/I opportunities to offset impacts from existing and planned residential uses. If it is a goal for Frederick County to have 25 percent of the total county assessments come from C/I land use values, then it is obvious that at only 13.56 percent (4,556 acres) the county needs additional developed C/I uses. To achieve the 25 percent assessment target in 2010, an additional 2,761 developed acres of C/I land uses would have been needed. Recognizing the county’s 2.9 percent annual growth rate over the past 3 decades, the 2030 Comprehensive Plan should be designed to accommodate an additional 4,859 acres of new C/I opportunities. This projection indicates that the 2030 Comprehensive Plan should contain a minimum designation of 12,176 acres for C/I land uses within the Sewer and Water Service Area (SWSA). Further fluctuations may be anticipated with additional residential growth. 2030 Comprehensive Plan The 2030 Comprehensive Plan has been developed to incorporate a balance of land uses in order to achieve needed tax revenues. The Plan achieves the land use policy target of ensuring that 25 percent of the projected assessments will be in C/I land uses. This is accomplished by designating 16,700 acres for future C/I land uses, which will occupy approximately 2/3 of the 25,000-acre Sewer and Water Service Area (SWSA). The Plan also incorporates opportunities for mixed use developments and single family residential uses at a minimum density of 4 units per acres within the designated Urban Development Area (UDA). The policy of directing residential growth into the UDA also promotes a more efficient use of land and community services, ultimately offering additional cost savings to the county. Mixed use developments also offer additional revenues to address the demands for services generated by the residential uses. Mixed-use developments – such as urban center and neighborhood villages – are planned developments that encourage and accommodate a mix of land uses.
APPENDIX II – BACKGROUND ANALYSIS AND SUPPORTING
STUDIES
41
THE 2030 COMPREHENSIVE PLAN
These projects include an appropriate mix of commercial, office, and residential development. They provide an efficient development pattern that can foster economic development, provide diversity in land use, and reduce the number and the length of automobile trips. These mixed uses projects are encouraged in appropriate locations in the 2030 Comprehensive Plan. CONCLUSION The land use designations contained within the 2030 Comprehensive Plan accommodate the goal of providing 25 percent C/I land uses to 75 percent Other land uses. Maintaining a healthy C/I ratio will help the county maintain its current tax rates while continuing to enhance the services provided the residents - particularity in the area of education. It is through the use of land use policies contained within the Comprehensive Plan that these goals will be supported and achieved. In an effort to reinforce a sound policy basis that balances land use planning and fiscal policies, the ratio of 25/75 between C/I and other land uses in terms of available land areas and taxable value of the land uses shall be the established benchmark. This policy shall dictate that at least 25 percent of the taxable land value (land plus improvement value) in the county should contain C/I land uses, and conversely that no more than 75 percent of the taxable land area should be for uses other than C/I land. By achieving this policy goal, the County will ensure that taxable land values equate to the projected expenditures.

APPENDIX II – BACKGROUND ANALYSIS AND SUPPORTING
STUDIES
42
THE 2030 COMPREHENSIVE PLAN
LAND USE ANALYSIS
URBAN DEVELOPMENT AREA (UDA) REPORT 2010
Residentially Zoned Development Information - vacant lot summary Frederick County, Virginia (Through December 2010)
Vacant Land - No Approved GDPs
2,352 potential units based on permitted densities on
396 acres of vacant land
Zoned Land - Approved GDPs
4,467 Units (maximum yield based on proffered densities)
1,205 Acres
Master Development Planned Projects
4,636 Total residential lots/units planned
1,353 single family lots planned
900 townhouse, duplex, multiplex lots/units planned
372 multi-family units planned
2,011 mixed units planned
(Current Status) Residential Subdivisions Under Development - vacant lots
3,511 Total residential lots/units available
1,808 single family-detached lots available
1,659 townhouse, duplex, multiplex lots available
44 multi-family units available
Grand Total: 14,966 approved, planned, or potential residential lots/units.
103 Single Family-Detached permits have been issued in 2010 within the UDA
54 Townhouse/Duplex/Multiplex permits have been issued in 2010 within the UDA
APPENDIX II – BACKGROUND ANALYSIS AND SUPPORTING
STUDIES
43
THE 2030 COMPREHENSIVE PLAN
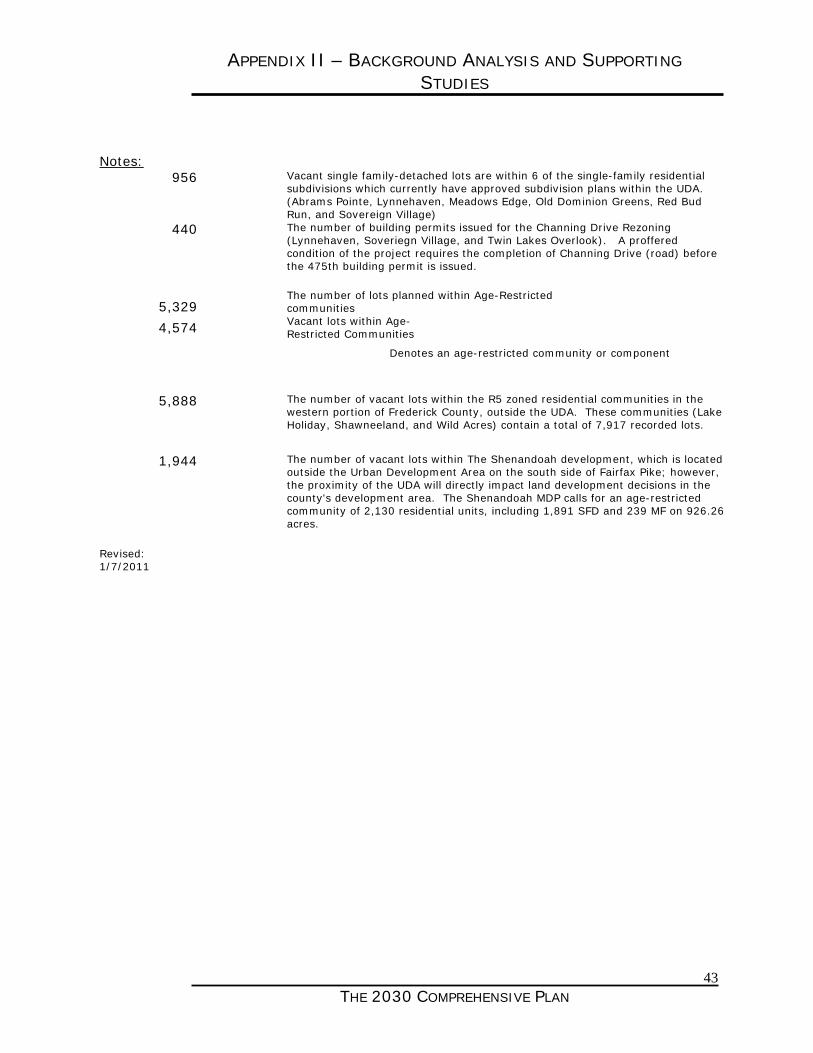
Notes:
956 Vacant single family-detached lots are within 6 of the single-family residential subdivisions which currently have approved subdivision plans within the UDA. (Abrams Pointe, Lynnehaven, Meadows Edge, Old Dominion Greens, Red Bud Run, and Sovereign Village)
440 The number of building permits issued for the Channing Drive Rezoning (Lynnehaven, Soveriegn Village, and Twin Lakes Overlook). A proffered condition of the project requires the completion of Channing Drive (road) before the 475th building permit is issued.
5,329 The number of lots planned within Age-Restricted communities
4,574 Vacant lots within Age-Restricted Communities
� Denotes an age-restricted community or component
5,888 The number of vacant lots within the R5 zoned residential communities in the western portion of Frederick County, outside the UDA. These communities (Lake Holiday, Shawneeland, and Wild Acres) contain a total of 7,917 recorded lots.
1,944 The number of vacant lots within The Shenandoah development, which is located
outside the Urban Development Area on the south side of Fairfax Pike; however, the proximity of the UDA will directly impact land development decisions in the county's development area. The Shenandoah MDP calls for an age-restricted community of 2,130 residential units, including 1,891 SFD and 239 MF on 926.26 acres.
Revised: 1/7/2011