planning for an uncertain future - c.ymcdn.com propylene methanol paraxylene benzene chlorine 2014...
TRANSCRIPT

Global Petrochemical Market OutlookPlanning For An Uncertain Future
Mark Eramo
Vice President
IHS Chemical – Houston, TX
Presented to: Valve Manufacturers Association Of AmericaMarket Outlook Workshop
August 11-12, 2016
San Diego, California

© 2016 IHS
About IHS Markit
IHS Markit thinks about the world in a unique way. We call this
The New Intelligence.
IHS Markit’s singular ability to look across complex industries,
financial markets, and government actions that drive the global
economy and provide our customers with insights, perspective and
solutions for what really matters.
Energy Chemical AutomotiveFinancial Markets
Product Design Technology, Media &
Telecom
Maritime & TradeAerospace,
Defense & Security
© 2016 IHS
Best-in-Class Market
Advisory & Consulting
For The Global
Chemical Industry
IHS Chemical ….represents the most
comprehensive source for chemical market
research, expertise, analytics and consulting in
the world.
IHS
Chemical

© 2016 IHS
Business Information
Chemical Week
Magazine
Competitive Company Analysis
Aromatics & Fibers
Olefins & Derivatives
Chlor-Alkali & Vinyls
Plastics & Polymers
SYNGAS
Chemicals
Chemical Economics Handbook
Specialty Chemicals
World AnalysisDirectory of
Chemical Producers
Technology & Analytics
Process Economics
Program
Cost Curve Service
Scenarios
Consulting Advisory
Strategy
Commercial Analysis
Transaction/ Legal Services
Technology
Renewables
Specialities
Training
Chemical Industry
FeedstocksEvents
Chemical Insights
IHS Chemical Portfolio
Capital Cost Forum
Locations
Houston
White Plains
Santa Clara
London
Zurich
Dusseldorf
Dubai
Singapore
Tokyo
Shanghai
Beijing
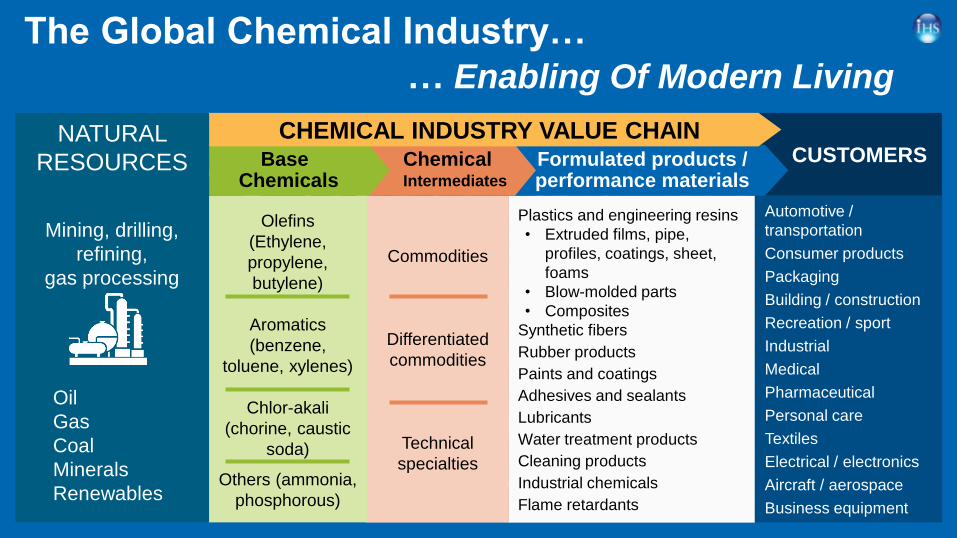
The Global Chemical Industry…
… Enabling Of Modern Living
Automotive /
transportation
Consumer products
Packaging
Building / construction
Recreation / sport
Industrial
Medical
Pharmaceutical
Personal care
Textiles
Electrical / electronics
Aircraft / aerospace
Business equipment
CUSTOMERSFormulated products / performance materials
Plastics and engineering resins
• Extruded films, pipe,
profiles, coatings, sheet,
foams
• Blow-molded parts
• Composites
Synthetic fibers
Rubber products
Paints and coatings
Adhesives and sealants
Lubricants
Water treatment products
Cleaning products
Industrial chemicals
Flame retardants
Commodities
Differentiated
commodities
Technical
specialties
ChemicalIntermediates
BaseChemicals
Olefins
(Ethylene,
propylene,
butylene)
Aromatics
(benzene,
toluene, xylenes)
Chlor-akali
(chorine, caustic
soda)
Others (ammonia,
phosphorous)
CHEMICAL INDUSTRY VALUE CHAINNATURAL
RESOURCES
Mining, drilling,
refining,
gas processing
Oil
Gas
Coal
Minerals
Renewables

Gas-to-Crude Ratio Drives Regional Investment Activity
In The Chemical Industry
0%
30%
60%
90%
120%
0.0
5.0
10.0
15.0
20.0
90 92 94 96 98 00 02 04 06 08 10 12 14 16 18 20 22
Crude (WTI) Natural Gas Gas-to-Crude Ratio
US Energy Price Trends: 1990 to 2022
© 2016 IHSSource: IHS
US
$ P
er
MM
BT
UG
as-to
-Cru
de
BT
U R
atio

Impact of Changing Energy Dynamics On Regional
Chemical Production
-30%
0%
30%
60%
90%
120%
-10
0
10
20
30
40
91 93 95 97 99 01 03 05 07 09 11 13 15 17 19 21
Ga
s-t
o-C
rud
e O
il B
TU
Ra
tio
, %
Mil
lio
n M
etr
ic T
on
s
China Asia Less China (with India) Middle East
North America West Europe Gas-To-Crude BTU Ratio, %
Annual Change - Total Basic Chemicals Production: Ethylene, Propylene, Methanol, Benzene, Paraxylene, Chlorine

Developing World Economic Growth Is Evolving Along
With Contribution To Chemicals Growth
-10
0
10
20
00 01 02 03 04 05 06 07 08 09 10 11 12 13 14 15
% C
ha
ng
e I
n G
DP
Brazil Russia India China
Real GDP Growth (yearly percentage change)
Source: IHS © 2016 IHS
• BRICs fueled global economy
from 2000 to 2008; resulting
in strong demand growth.
• Russia & Brazil have not
recovered from 2009 and face
current recessions.
• India remains a bright spot
with steady growth.
• China economic reform full
impact has yet to be seen.

Global Energy & Economic Fundamentals Have
Changed…Impacting Chemical Investment Decisions
• Crude oil price trends impact regional
competitiveness, cash margins,
investment decisions.
• Ethane/gas based investments in
North America see lower margins in
low crude oil market.
• Key decisions of location, feedstock,
technology, scale, growth, cost
position: are much less “obvious”
• Result is a slowdown in approving
new investments for 2020+
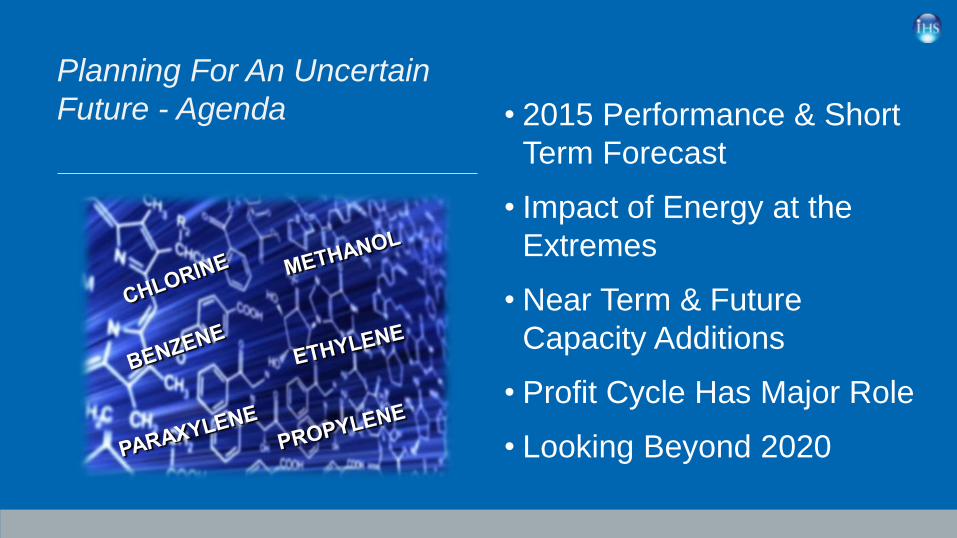
Planning For An Uncertain
Future - Agenda • 2015 Performance & Short
Term Forecast
• Impact of Energy at the
Extremes
• Near Term & Future
Capacity Additions
• Profit Cycle Has Major Role
• Looking Beyond 2020
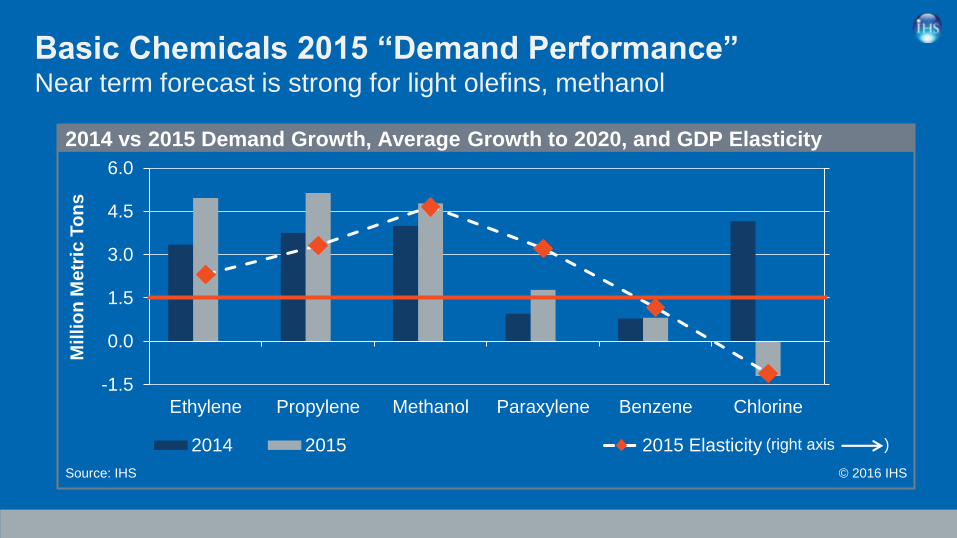
-1.0
0.0
1.0
2.0
3.0
4.0
-1.5
0.0
1.5
3.0
4.5
6.0
Ethylene Propylene Methanol Paraxylene Benzene Chlorine
2014 2015 Avg: 2016 to 2020 2015 Elasticity
2014 vs 2015 Demand Growth, Average Growth to 2020, and GDP Elasticity
© 2016 IHS
Millio
n M
etr
ic T
on
s
Source: IHS
Glo
ba
l GD
P E
las
ticity
(right axis )
Basic Chemicals 2015 “Demand Performance”Near term forecast is strong for light olefins, methanol

Basic Chemicals 2015 “Demand Performance”Near term forecast is strong for light olefins, methanol
-1.0
0.0
1.0
2.0
3.0
4.0
-1.5
0.0
1.5
3.0
4.5
6.0
Ethylene Propylene Methanol Paraxylene Benzene Chlorine
2014 2015 Avg: 2016 to 2020 2015 Elasticity
2014 vs 2015 Demand Growth, Average Growth to 2020, and GDP Elasticity
© 2016 IHS
Millio
n M
etr
ic T
on
s
Source: IHS
Glo
ba
l GD
P E
las
ticity
(right axis )

Significant Demand Growth Could Challenge Supply 130+ MM Metric Tons from 2014 to 2020
• Ethylene, Methanol show
strength, with 36+ MM metric
tons each; Propylene growth
at 32+ MM; stronger than
GDP growth.
• Benzene, Chlorine and
Paraxylene growth is modest,
near 1xGDP or below.
• Total demand for basic
chemicals by 2020 forecast
over 560 MM metric tons
(approx. 4% per year).
0
50
100
150
14 15 16 17 18 19 20
Mil
lio
n M
etr
ic T
on
s
Ethylene Methanol Propylene
Paraxylene Chlroine Benzene
Base Chemical Demand Growth: 2014 to 2020

Planning For An Uncertain
Future - Agenda • 2015 Performance & Short
Term Forecast
• Impact of Energy at the
Extremes
• Near Term & Future
Capacity Additions
• Profit Cycle Has Major Role
• Looking Beyond 2020

• Rapid decline in crude oil pricing
causes supply-chains to “pause”.
• Lower costs combined with a pause
in demand, result in price
declines….….lower prices can
stimulate chemical demand in some
markets.
• Falling prices / lower margins force
re-assessment of capital spending.
• Combination can create tight
markets near term and will influence
future investment decisions .
Extreme Energy Will Impact
Chemical Industry Trends

0
500
1,000
1,500
2,000
02 03 04 05 06 07 08 09 10 11 12 13 14 15 16 17
Regional spot prices: ethylene, propylene, benzene, paraxylene, methanol
© 2016 IHS
US
$ P
er
Me
tric
To
n
Source: IHS
Low Crude Oil Drives Chemical Market Price Declines
• Basic chemical regional spot
prices respond to lower crude
oil pricing.
• Crude oil feedstock based
products declined between
$500 - $700/MT.
• Methanol prices, driven by gas
and coal economics, show
less of a response.
• Price response in derivative
markets show varied impact on
cash margins. Demand
stimulus in plastics markets.
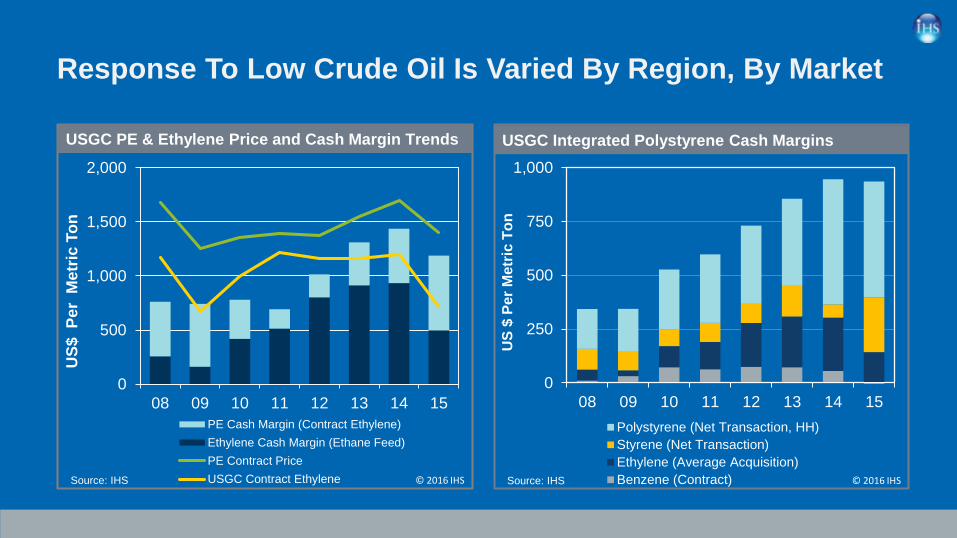
Response To Low Crude Oil Is Varied By Region, By Market
0
500
1,000
1,500
2,000
08 09 10 11 12 13 14 15
US
$ P
er
Me
tric
To
n
PE Cash Margin (Contract Ethylene)
Ethylene Cash Margin (Ethane Feed)
PE Contract Price
USGC Contract Ethylene
USGC PE & Ethylene Price and Cash Margin Trends
Source: IHS © 2016 IHS
0
250
500
750
1,000
08 09 10 11 12 13 14 15
US
$ P
er
Me
tric
To
n
Polystyrene (Net Transaction, HH)
Styrene (Net Transaction)
Ethylene (Average Acquisition)
Benzene (Contract)
USGC Integrated Polystyrene Cash Margins
Source: IHS © 2016 IHS
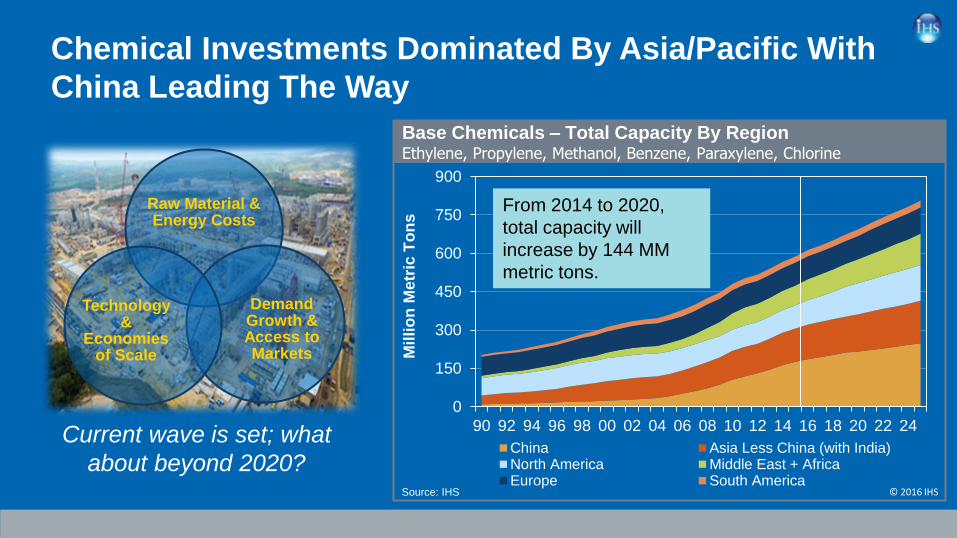
Chemical Investments Dominated By Asia/Pacific With
China Leading The Way
Raw Material & Energy Costs
Demand Growth & Access to Markets
Technology &
Economies of Scale
0
150
300
450
600
750
900
90 92 94 96 98 00 02 04 06 08 10 12 14 16 18 20 22 24
China Asia Less China (with India)North America Middle East + AfricaEurope South America
Base Chemicals – Total Capacity By Region Ethylene, Propylene, Methanol, Benzene, Paraxylene, Chlorine
Source: IHS © 2016 IHS
Mil
lio
n M
etr
ic T
on
s
Current wave is set; what
about beyond 2020?
From 2014 to 2020,
total capacity will
increase by 144 MM
metric tons.
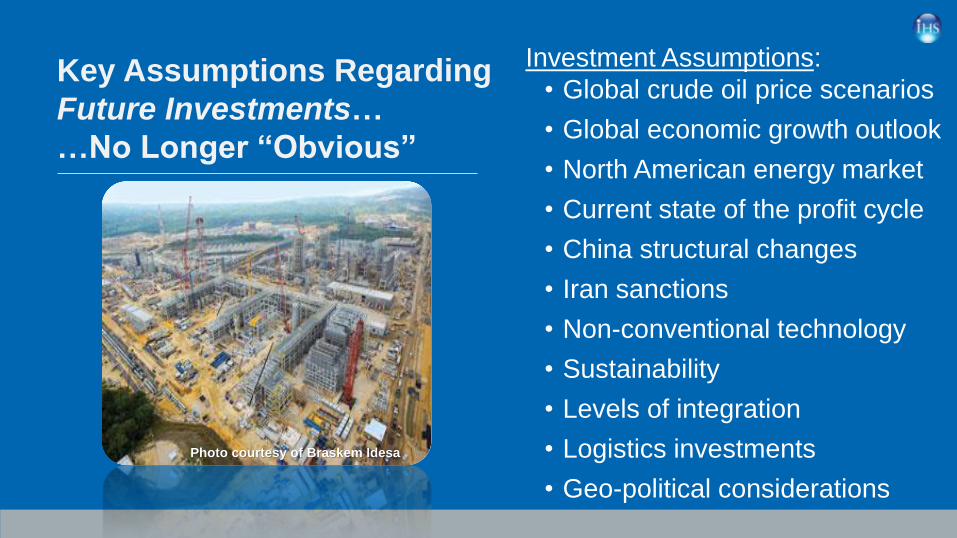
Key Assumptions Regarding
Future Investments…
…No Longer “Obvious”
Investment Assumptions:
• Global crude oil price scenarios
• Global economic growth outlook
• North American energy market
• Current state of the profit cycle
• China structural changes
• Iran sanctions
• Non-conventional technology
• Sustainability
• Levels of integration
• Logistics investments
• Geo-political considerations
Photo courtesy of Braskem Idesa
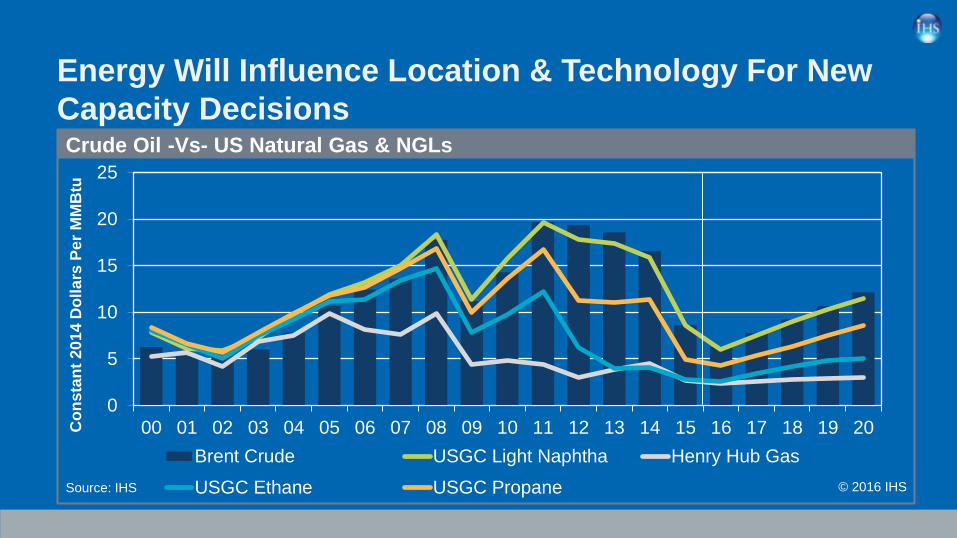
Energy Will Influence Location & Technology For New
Capacity Decisions
0
5
10
15
20
25
00 01 02 03 04 05 06 07 08 09 10 11 12 13 14 15 16 17 18 19 20
Brent Crude USGC Light Naphtha Henry Hub Gas
USGC Ethane USGC Propane
Co
ns
tan
t2
01
4 D
oll
ars
Pe
r M
MB
tu
Crude Oil -Vs- US Natural Gas & NGLs
Source: IHS © 2016 IHS

Non-conventional Technology Providing Options For
Future Investments In Olefins Production
0
200
400
600
800
1000
1200
1400
US Ethane US PDH NEA PDH NEANaphtha
WEPNaphtha
2011 2013 2015
Conventional Olefins Cash Cost
US GTP US GTO NEA CTO NEA MTO
Non-conventional Olefins Cash Costs
PDH = Propane Dehydro; GTP = Gas to Propylene; GTO = Gas to Olefins; CTO = Coal to Olefins; MTO = Methanol to Olefins
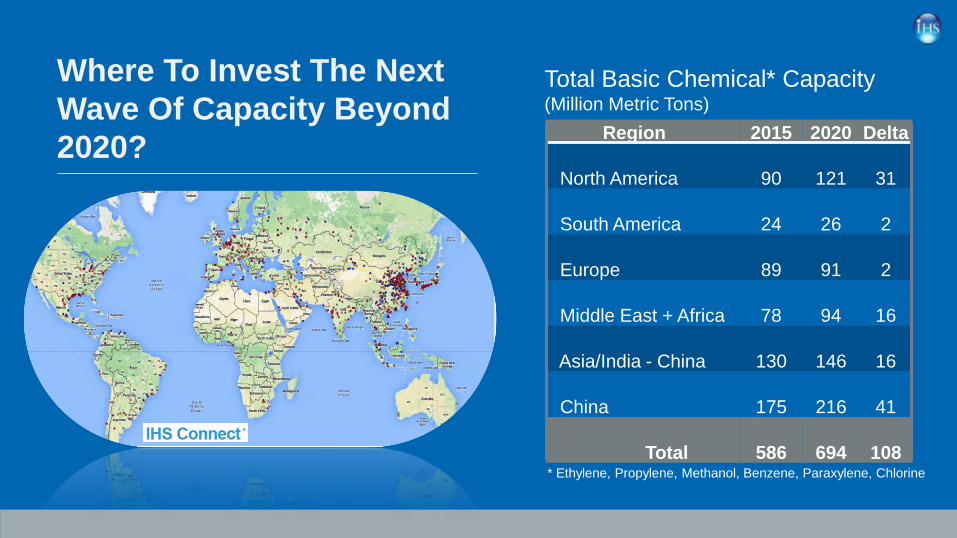
Where To Invest The Next
Wave Of Capacity Beyond
2020?Region 2015 2020 Delta
North America 90 121 31
South America 24 26 2
Europe 89 91 2
Middle East + Africa 78 94 16
Asia/India - China 130 146 16
China 175 216 41
Total 586 694 108
Total Basic Chemical* Capacity(Million Metric Tons)
* Ethylene, Propylene, Methanol, Benzene, Paraxylene, Chlorine

Benzene
Chlorine
Ethylene
Methanol
Paraxylene
Propylene PG
Where To Invest The Next Wave Beyond 2020?
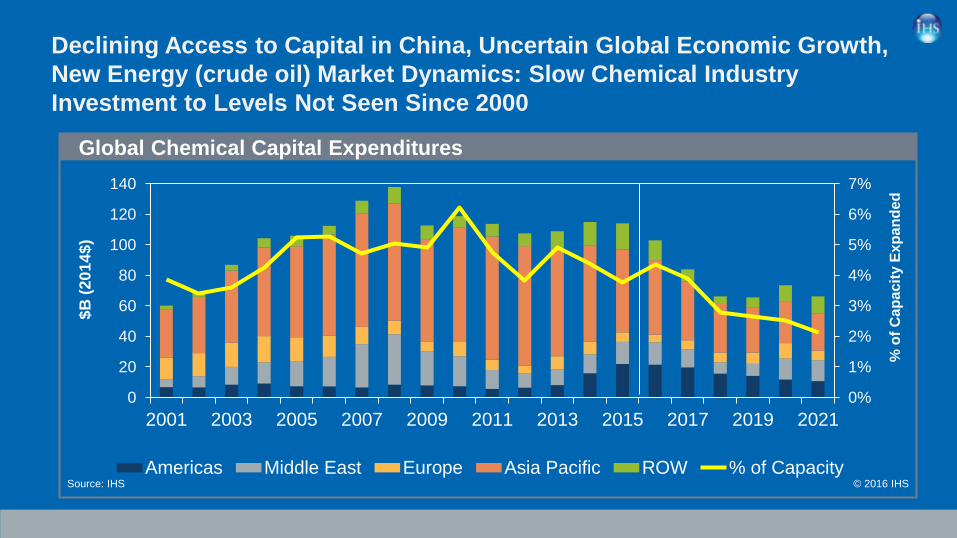
Declining Access to Capital in China, Uncertain Global Economic Growth,
New Energy (crude oil) Market Dynamics: Slow Chemical Industry
Investment to Levels Not Seen Since 2000
0%
1%
2%
3%
4%
5%
6%
7%
0
20
40
60
80
100
120
140
2001 2003 2005 2007 2009 2011 2013 2015 2017 2019 2021
Americas Middle East Europe Asia Pacific ROW % of Capacity
Global Chemical Capital Expenditures
© 2016 IHS
$B
(20
14
$)
Source: IHS
% o
f C
ap
acit
y E
xp
an
ded

Next Ten Years Will See Slower Investment Pace In
China and New Countries In The Top 10
0
60
120
180
Milli
on
Me
tric
To
ns
Base Chemical Capacity Growth: 2015-25
Source: IHS © 2016 IHS
0
60
120
180
Mil
lio
n M
etr
ic T
on
s
Base Chemical Capacity Growth: 2005-15
Total Additions, MM Ton 298
Total top 10 Countries, MM Tons 252
Top 10 Countries, % of total 84%
Total Closures, MM Tons 11.5
Source: IHS © 2016 IHS
Total Additions, MM Ton 265
Total top 10 Countries, MM Tons 222
Top 10 Countries, % of total 83%
Total Closures, MM Tons 7.5
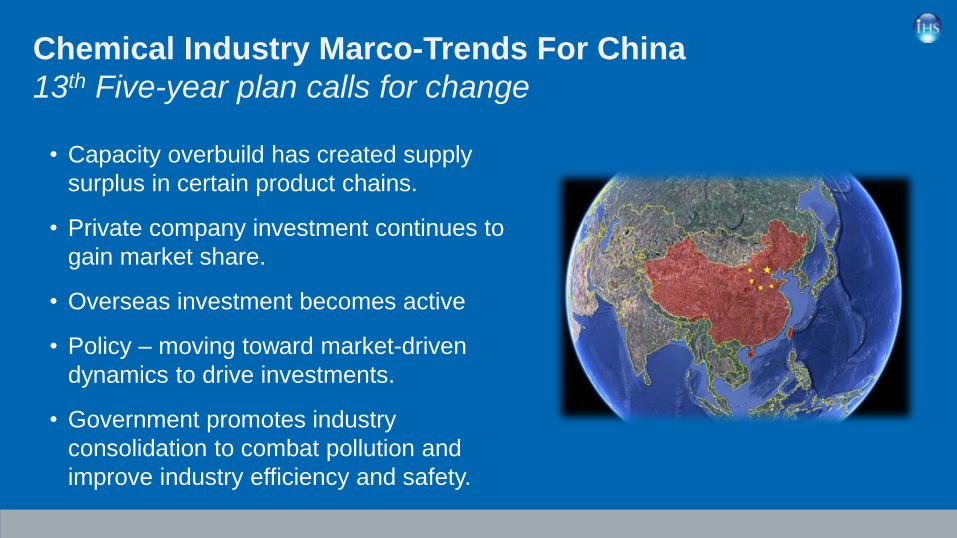
• Capacity overbuild has created supply
surplus in certain product chains.
• Private company investment continues to
gain market share.
• Overseas investment becomes active
• Policy – moving toward market-driven
dynamics to drive investments.
• Government promotes industry
consolidation to combat pollution and
improve industry efficiency and safety.
Chemical Industry Marco-Trends For China
13th Five-year plan calls for change

In China, Headlines Mask Underlying Growth In
Domestic Markets
0
4
8
12
16
20
1995 2000 2005 2010 2015
India Germany Japan China USA
Select County GDP, $US Trillion • Chinese growth slowing, but absolute
growth dwarfs other economies
• Growth shifting to services sector
and away from fixed investment
• Slowdown concentrated in industrials
– primarily in mining, utilities and
heavy manufacturing
• Increasing consumer spending will
continue to drive domestic
consumption of basic chemicals and
plastics
• >75% of Chinese plastics demand is in
consumer non-durable
11th 5-year Plan
12th 5-year Plan

China Aggressively Adds Chlorine, Methanol, Propylene
0
50
100
150
200
250
90 92 94 96 98 00 02 04 06 08 10 12 14 16 18 20 22 24
Propylene (PG/CG) Ethylene Paraxylene
Benzene Methanol Chlorine
China - Base Chemical Total Capacity
Source: IHS © 2016 IHS
Mil
lio
n M
etr
ic T
on
s
• China demonstrating
aggressive investments in
basic chemicals to
maintain a high degree of
self-sufficiency.
• China will add nearly 250
MM metric tons during a
period of three decades.
• Since 2010, major
additions in propylene,
methanol, and chlorine.

Private Investment Continues to Gain Market Share
• SOE’s dominance has been
challenged
• Private and provincial
companies continue gaining
market share
• But, the growth will slow down
• Private investment Intensifies
competition and drives down
prices and margins
Aggregated capacity for benzene, PX, ethylene, propylene, MEG, PTA, methanol
Capacity (million tons) Ownership (Percent)
0%
20%
40%
60%
-
30
60
90
120
150
180
2010 2011 2012 2013 2014 2015 2016 2017 2018 2019 2020
PetroChina
Local Provincial Private
CNOOC Foreign
Private & Local
Sinopec

China Seeking To Develop Industry In Strategic
Locations
CSPC II
NCC - 1350 KTA
Sinopec Maoming PC
PX - 600 KTA
Sinopec Jiujiang PC
PX - 600 KTA
PetroChina Qingzhou
PX - 1000 KTA
CNOOC Ningbo
PX - 600 KTA
Sinopec Quangzhou
NCC: 1000 KTA; PX: 800 KTA
Sinopec ZRCC
NCC: 1200 KTA
Sinopec
NCC: 1000 KTA
PetroChina JV
NCC: 1000 KTA; PX: 1400 KTA• Over 140 chemical industry
parks in China
• Chemical facilities will be
relocated or built inside
industrial parks
• The government will focus
on seven national chemical
industrial parks
• Several major petrochemical
projects are planned
Dalian Changxin
Caofeidian
Lianyonggang
Shanghai
Caojing
Ningbo
Fujian Gulei
Guangdong Huizhou

• Low cost energy and natural gas liquids
provide sustainable advantage for new
investment wave.
• Advantaged feedstock will enable an
additional wave beyond 2020, assuming
crude oil price recovery (near $80/bbl) and
low natural gas pricing (near $3/MM BTU).
• Domestic and International companies are
seeking to invest to leverage the low-cost
opportunities. New entrants to create
increased competition in domestic markets
• Logistics & port infrastructure investment
needed to support higher level of exports
Chemical Industry Marco-Trends For North America

North America & Middle East (conventional) Remain Low Cost
Non-conventional routes perform well in high crude oil scenario
0
200
400
600
800
1000
1200
1400
WesternCanada
US GTO U.S.Ethane
U.S.WeightedAverage
ChinaCTO
WestEuropeNaphtha
NortheastAsia
Naphtha
SoutheastAsia
Naphtha
ChinaMTO
US MTO
2011 2016 2021 SAR @ $1.75/MMbtu
World Ethylene Cast Cost Comparison
Source: IHS © 2016 IHS
US
Do
lla
r P
er
Me
tric
To
n
GTO = Gas-to-Olefins: CTO = Coal-to-Olefins; MTO = Methanol-to-Olefins
(Cash cost = Feed +VC + FC – co-product)
Brent Crude
USGC
Natural Gas
Year ($/Bbl) ($/MM Btu)
2011 112 4.14
2016 42 2.41
2021 91 3.5

US Low Cost Brings Back Methanol and Ethylene
• After peaking near 80 MM
metric tons near 2001, the
US shut down capacity in
methanol and ethylene
near 2010.
• Shale oil & gas have
brought back competitive
economics to the US,
resulting in expansions in
methanol and ethylene
capacity
0
20
40
60
80
100
120
140
90 92 94 96 98 00 02 04 06 08 10 12 14 16 18 20 22 24
Propylene (PG/CG) Ethylene Paraxylene
Benzene Methanol Chlorine
United States - Base Chemical Total Capacity
Source: IHS © 2016 IHS
Mil
lio
n M
etr
ic T
on
s

North America Ethylene Capacity
Growth: 2014 – 2021Completed or Firm Projects (Thousand
Metric Tons)
Company Location Total Growth
ChevronPhillips Cedar Bayou, TX 1,500
Dow Freeport, TX 1,500
Dow Plaquemine, LA 250
Equistar Various sites 401
ExxonMobil Baytown, TX 1,500
Flint Hills Port Arthur, TX 50
Formosa Point Comfort, TX 1,150
Indorama Lake Charles,LA 363
Lotte/Axiall Lake Charles, LA 1,000
Oxy/Mexichem Ingleside, TX 550
Shell Monaca, PA 1,500
Shin-Etsu Plaquemine, LA 500
Sasol Lake Charles, LA 1,550
Westlake KY and LA sites 154
Williams Geismar, LA 129
Braskem Idesa Mexico 1,000
Total Additions 13,097
North American ethylene capacity will increase
to 45+ million metric tons by 2020, driven by
low-cost ethane feedstock

Planning For An Uncertain
Future - Agenda • 2015 Performance & Short
Term Forecast
• Impact of Energy at the
Extremes
• Near Term & Future
Capacity Additions
• Profit Cycle Has Major Role
• Looking Beyond 2020
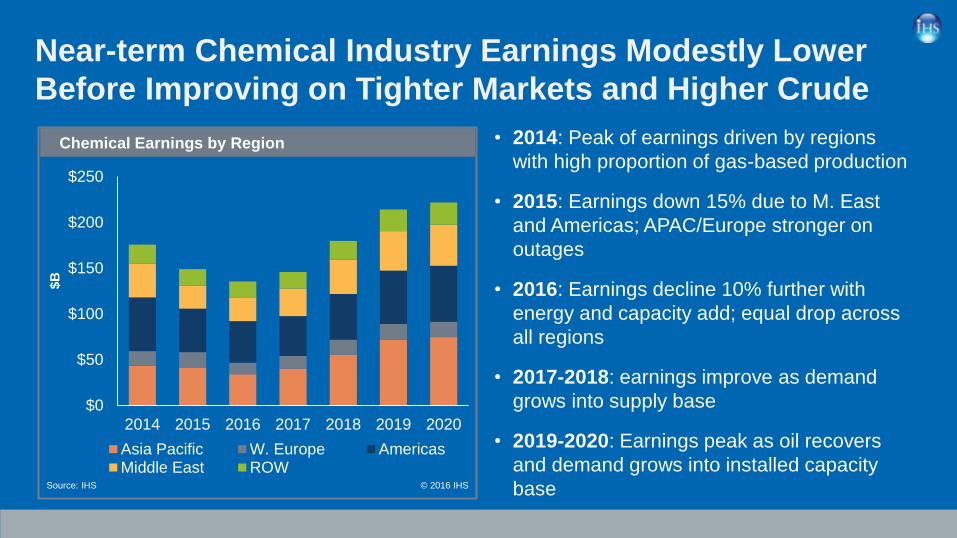
Near-term Chemical Industry Earnings Modestly Lower
Before Improving on Tighter Markets and Higher Crude
$0
$50
$100
$150
$200
$250
2014 2015 2016 2017 2018 2019 2020
Asia Pacific W. Europe AmericasMiddle East ROW
Chemical Earnings by Region
© 2016 IHS
$B
Source: IHS
• 2014: Peak of earnings driven by regions
with high proportion of gas-based production
• 2015: Earnings down 15% due to M. East
and Americas; APAC/Europe stronger on
outages
• 2016: Earnings decline 10% further with
energy and capacity add; equal drop across
all regions
• 2017-2018: earnings improve as demand
grows into supply base
• 2019-2020: Earnings peak as oil recovers
and demand grows into installed capacity
base
Planning For An Uncertain
Future…
Strategic Implications
• The investment landscape is changing
with shifting demand growth and non-
conventional options on technology and
feedstock selection.
• High level of uncertainty in energy and
economic fundamentals present
planners with difficult scenarios for
identifying the best path forward.
• Board level decisions require higher
returns for approval; risk premiums
escalate; defer approvals until conditions
signal more predicable outcome.
• Where investment decisions in 2016 are
“on hold”, could lead to supply limitations
in the 2020+ time-period, as demand
growth accelerates.

Global Petrochemical Market OutlookPlanning For An Uncertain Future
Mark Eramo
Vice President
IHS Chemical – Houston, TX
Presented to: Valve Manufactures Association Of AmericaMarket Outlook Workshop
August 11-12, 2016
San Diego, California