planning virginia department highw°ays transport st · pdf fileplanning virginia...
TRANSCRIPT

A PROCEDURAL METHOD FOR EXPRESS. BUS-FRINGE PARKING TRANSIT PLANNING
by
Kenneth Wester Transportation. Planning
Virginia Department of Highw°ays Engineer
& Transport st ion
and
Michael J. Demetsky Faculty Research Engineer
(The opinions, report are those
findings, and conclusions expressed in this of the authors and••ot necessarily those of the sponsoring agencies.)
(A Virginia Highway. & Transportation Research Council
Cooperative Organization Sponsored Jointly by the Virginia Department of Highways & Transportation and
the University of Virginia)
In Cooperation with the U. S. Federal Highway
Department of Transportation Administration
Charlottesville, Virginia
Nov ember 1976 VHTRC 77-R23


2127
ABSTRACT
The report illustrates aprocedural method for planning express bus-fringe parking transit services a method built upon the findings from previous research, including disaggregate travel choice models and planning guidelines. The methodology addresses the tasks of site-selection, demand analysis, and site evaluation. The appropriateness of this subarea planning process is demonstrated in an application to Southside Richmond. The case study is documented so that transportation planners ca• use it &s a guide for employing the procedure.
iii


2129
PREFACE
This report is one of two which record the implementation portion of a three-phased study concerning planning procedures for express bus-fringe parking subarea transit. The first two phases concerned the analysis of the apnlication of existin• techniques and the development of design guidelines and chomce models, respectively.
The implementation of !ogit dhoice models in the demand analysis stage of a complete planning process which focuses on site selection and site evaluation is described here. A jointly published report shows the mechanics of computatio.hs with logit choice models, both manual and computerized. The companion document is titled "Applica-- tions Manual for Logit Models of Express Bus-Fringe Parking Behavior°
v

2130

A PROCEDURAL METHOD FOR EXPRESS BUS-FRINGE PARKING TRANSIT PLANNING
by
Kenneth Wester Transportation Planning Engineer*
and
Michael J. Demetsky Faculty Research Engineer
INTRODUCTION
Recent research conducted by the Virginia Highway and Trans- portation Research Council produced a theoretical framework for studying express bus-fringe parking lot operations. This re- search inc!ud[e•!-•an analysis of general tripmaker comments and aggregate travel behavior and a set of planning guidelines. (1,2) Mathematical models of the demand for the service as a function of the accessibility of the lot to residential areas, tripmaker characteristics, and the dimensions of"alternative travel choices were also developed.(3)
The purpose of this report is to present the findings from the previous research in a format that can easily be followed by transportation planners to develop express bus-fringe parking transit services.
SCOPE
A basic approach to planning express bus-fringe parking transit consists of (i) a feasibility study to determine" the appropriateness of this transit service for a specific urban area, (2) the designation of potential fringe parking lot sites, (3) an analysis of the demand for the service expected from each potential fringe parking lot site, (4) a comprehensive evaluation and com- parison of the p.otential lot sites, (5) the development of transit services, and (6) the marketing of the new operation. This report organiz.es these steps into a generalized planning methodology which uses the following tools and criteria.
I. Characteristics of successful express bus- fringe parking services.
*Virginia Department of Highways and Transportation.

2. Criteria for :l•cating fringe parking lot sites,
3. Procedures for estimating the auto-transit split and the access mode choice for transit users.
4. Criteria for establishing the transit service.
METHODOLOGY
In the methodology recommended for planning express bus- fringe parking transit the primarj, tasks include the selection of potential sites, demand analysis, and evaluation of the potential alternative sites. The specification of the appropriate level of transit service for each alternative site must also be considered. The procedural method for developing express bus transit services is shown ..in Figure I and is subsequently demon- strated in an application to alternative sites for three corridors in the Southside Richmond area.
End Project
No
Area Analysis
Is Express Bus-Fringe Parking Transit Feasible ?
Yes
Corridor Analysis
Market Area Analysis
Specification of Alternative Sites
Parldng Facility Development at Sites
i•mand Analysis
Site Evaluations
Transit Service Requirements
Marketing and Imple me nta tion
Figure i. Fringe parking-express bus transit planning process.

Area and Site Analysis Servi_ce i.,rea Ana!y.s,•is The Study Area
The development of an express bus-fringe parking operation requires an initial investigation to determine its appropriateness for a specific urban area. Studies of previous park-and-ride operations indicate that the °success of the operation depends upon the presence of the following transportation conditions within an urban area.
I. Limited Parking Facilities The demand for parking within the central business district (CBD) exceeds the supply of parking. Such a situation results in high parking costs and in parkers walking significant distances from their autos to their final destinations.
2. Congested Roadways A signifi•cazt level of congestion exists on roadways•'•.•hecting trip
endpoints. The high level of congestion would be equivalent to the levels of service D, E, or F as defined in the Highway Capacity Manual. (4)
3. Excessive Trip Making Costs An excessive cost is incurred by tripmakems between trip endpbints due to high parking fees, high roadway toils; and any other similar cost penalties, acquired during the course of the trip.(•)
The Corridor
Once it has been determined that the urban area transportation conditions potentially support express bus-fringe parking transit, it is necessary to analyze the surrounding area to determine those corridors affording the greatest improvement (e.g., reduction in vehicle miles of travel) to the transportation system by the im- plementation of the transit service. Corridor is used to define a potential subar.ea to be serviced by an express bus-fringe parking lot operation. It is defined as a set of opportunities located along a.nd at extreme points of a major t.ransportation link. Areas whose development is influenced by the existence of corridor- related opportunities and/or transportati•_n)facilities• are also included within this areal specification.

2134
The Market Area
The.market area for an express bus-fringe parking operation is defined as the geographic location whose residents are potential users of the service. Market areas should generate a significant number of work trips which are attracted to the destination point. Studies have indicated that express bus-fringe parking operations realize their greatest patronage amon• •eo•le making work trips during the peak hours.($,•,7)
Home-to-work trips can be estimated for market areas through the use of census tract data. The total number of work trips with- in a market area can be determined-and defined with respect to their destinations. Areas generating a significant number of work trips applicable to the new transit service are candidates for express bus-fringe parking lot operations. (8)
Previous urban area transportation studies can also be used for securing estimates of home-to-work trips attracted from market areas to snecific destinations. Since federal law requires that transportation studies within urban areas be continuous an• compre- hensive, information from this source should be more reliable than census da1•a.
Lot Location
Site Analy§_is
Fringe parking lots should be located along established travel corridors on which significant numbers of home-to-work trips gener- ated by the market areas can be intercepted. It is desirable for a lot to be situated prior to those points where road congestion begins in order that the transportation system realize a reduction in vehicle miles of travel. If possible, the lot should be placed at a point where access to several destinations is provided by roadway facilities that can accommodate express bus service (i.e., busways, preferential lanes, etc.). (5,6,7)
Lot Accessibility
Wherever the fringe parking lot is located, it is important for it to be highly accessible by the local arterial system. It should provide minimal delays in entry and egress for both buses and automobiles. The ideal location of a park-and-ride facility is at the intersection of a major arterial and a freeway. Such a location provides express buses good freeway access, which is important to minimize bus travel in slow moving arterial traffic

2135
and therefore maximize the amount of travel in the faster moving freeway traffic, in considering potential fringe parking lot sites located at points where a number of travel corridors access the CBD and/or major activity center served, travel time studies are required to determine the route with the least time of travel. It is also important that the bus route be free of congestion, and that measures be taken to eliminate any delays. (2,5,7,9,10)
Consideration .should be given to locating the fringe parking lot to the right side of the corridor of travel leading into the CBD and/or major activity center, so as to enable a large percentage of the patrons to make right turns when entering it. (7)
Local Transit Demand
A possible indicator of desirable fringe lot locations is on- street parking areas used by commuters in the vicinity of transit stops. Therefore, existing local bus service within a market area should be analyzed to determine if such locations exist. More than likely, an express bus-fringe parking lot operation would draw patronage from the existing local service. The local transit serv- ice could be used to sup•gm•ent the express bus-fringe parking lot op.eration during off peak •urs.(7)
l•mpact on Adjacent areas
The park-and-ride lot should be placed within anarea in which it would be compatible with surrounding land uses, and it should have a minimal environmental impact.
Visibility of Lot
The fringe lot should be visible from the freeway or the major arterial that it is near. Such visibility would enable commuters to observe the system and possibly influence them to use it. Law enforcement officials would be able to observe the lot and prevent vandalism, thus making it a safe place for commuters to leave their cars.
(2 ,ii)
Parking F.acility Development
An attractive feature of the express bus-fringe parking lot concept is that it can be implemented at a low capital cost through the utilization of existing parking facilities. However, the potential demand for the proposed operation has to be determined to assure that existing facilities will be adequate.

2136
Joint Use Parkin$ Facilities
The objective of the express bus-fringe parking operation is to minimi.ze the capital cost involved in improving trans- portation facilities. Therefore, the parking lot should be so located as to minimize capital and operational outlays. Accord- ingly, initial consideration should be given to the joint use of existing parking facilities. Joint use sites should be evaluated with respect to potential for conflict between park-and-ride patrons and other users, local environmental concerns, and existing traffic and travel hazards.
Potential joint use parking facilities are. listed below.
Primary Choice Sites
i- Shopping Plazas or Malls
2 Movie or Drive-in Theaters
3 Church or Other Religious Properties 4 Non-school Municipal or Transit Owned Real Estate
Secondary Choice Sites
i Schools
2 Apartment and/or Townhouse Complexes 3 Parks and Recreational Facilities
4 Nightclubs, Restaurants, Motels
Constructed Fringe Parking Lots
Studies of successful park-and-ride operations have identified criteria relating to the design of th• parking lot that play an important role in attracting patrons. These criteria are discussed with reference to the list of design considerations given in Table i. ( 2 ,Ii)
Safe, rapid parking and related movements should be provided to all patrons by the layout of the parking lot. Enough space should be provided to enable park-and-ride and kiss-and-ride functions to be conducted separately. This can be accomplished by making separate lanes available near transit boarding points for discharging and picking up-kiss-and-ride patrons. Raised side- walks should be provided near transit boarding points for pedes- trians and •atrons waiting to board the bus. A margin of safety is provided by segregating pedestrian and vehicle movements.

213-7
Ao
B
C
D
E
Table i
Fringe Parking Lot Design Considerations
Parking i. Drainage 2. Lighting 3. Aesthetics 4. Pavement
5. Delineated
6. Bikeways 7. Walkways
Lot Design Considerations
(Landscaping)
Parking Spaces
(Pedestrian Access Ways,)
Traffic Flow
i. Access Facilities
2. Egress Facilities
Delineation of Traffic Movements
Zirect Links to High Speed Roads
Drop Off Lane for Kiss-and-Ride Patrons
Amenities
i. Shelters
2. Benches
3. Newspaper Stands
4. Telephones 5. Bicycle Racks
Boarding i.
Station
Locate where patrons required to 1,000 feet (Preferably center of parking Walking distance greater than. 1,000 feet feeder bus service
Kiss-and-ride drop off areas should be boarding points Raised sidewalk
walk a maximum lot)
should
should be provided at
located
boarding
Miscellaneous
i. Automatic
2. Security
Considerations
Fare Collection Equipment
of
provide
neam
points

2138
Direct links connecting fringe parking l•ts with high speed roads are sometimes necessary to ensure that neighboring residential areas are not saturated with traffic entering and leaving the lot. The ingress and egress facilities of the lot should be designed to meet the traffic conditions of the peak periods.
Rainfall data should be utilfzed to estimate runoff so that adequate drainage can be provided to ensure unimpaired use of the lot and protection f-or adjacent properties. The lots should be pa•ed and the parking spaces marked so that the area can be used to its full potential. Lighting should be adequate for security, but should not affect neighboring land uses. Amenities such as bus shelters, benches, telephones, and newspaper stands enhance the operation. Bicycle racks, access ways for pedestrians, and feeder bus service attract nondrivers.
Lots requiring a fee should have automatic fare collection equipment as part of the effort to keep operating costs at a minimum.
In large lots, the transit boarding points should be located near the center so patrons will not have to walk more than 1,000 feet (305 metres) from their cars It might be necessary to pro- vide multiple boarding points, multilevel parking, or internal people-mover systems where there is a very large parking demand.
Demand Analysis
Disaggregate Behavioral Models
Kavak and Demetsky have developed disaggregate behavioral models to be used in predicting the demand for a potential express bus-fringe parking operation. (3) These models are disaggregate because the individual is the primary unit of decision, and they are behavioral in character because they are based on theories of individual behavior. These models predict the probabilities of mode choice.(3)
Two demand estimating models were developed from two urbanized areas in Virginia for this planning process; namely the Parh&m Road model and the Princess Anne Plaza mod-el. The Parham Road express bu•s-fringe parking lot model was developed from a high income area ($12,000 per family and greater) with the fringe parking lot located i0 miles (16 km) or less from the CBD. The cost of parking within the CBD was relatively high and the frequency of bus service was 15 minutes or less. Use of this model would be restricted to areas having the same characteristics as the Parham Road area.
(3)

2139
The Princess Anne Plaza •odel was developed from a low in- come market area with the fringe lot located i0 miles (16 km) or
more from the CBD and/or major activity center. The cost of parking in the CBD was. low (75.9% paid less than 50 cents per day) and the frequency of bus service was 30 minutes or more.
(3)
Model Application Procedure
The following process is recommended to be used in applying the travel choice models to each potential site.
i. Establish an approximate market area to be serviced.
2. Delineate the market area into three hypothetical rings as follows"
Ring i consists of traffic zones or census traOts adjacent to the zone or tract con- taining the potential fringe parking lot.
Ring 2 consists of zones or census tracts whose minimum travel path to the CBD passes close to the lot and/or the travel time via the fringe parking lot to the CBD is reasonably close to the minimum direct travel time .
Ring 3 consists of zones or census tracts touchi'ng the first and/or second ring but not included in either category.
3. Determine the socioeconomic data listed in Table 2 for the respective market areas by traffic zone or
census tract.
4. Determine the transportation data listed in Table 3.
5. Select the appropriate model meeting the criteria of the area under study.*
*The Parham Road model includes three for.ecasting models, because of the three hypothetical rings defined earlier for each respective market area. There is an individual model to apply to each respective accessibility group. The Princess Anne Plaza model includes only one model.

(i) Parham Road Model
Pb =
G(X) e
•(x) i + e
where
P b = The probability of choosing the express bus
G(X)- A linear function of explanatory variables
The model coefficients vary according to accessibility level as follows.
Accessibility Group i
G(X) -1.3416 X I + 1.1430 X 2 + 2.353 X 3 + 4.2932 X 4 + 3.3990 X 5
+ 2. 3732
Accessibility Group 2.. G(X) -1.3092 X I 3.9319 X 3 + 10.8990 X 4 + 4.1533 X 5 + 4.3230
Accessibility Group 3
G(X) 1.4384 X 2 4. 7517 X 3 + 8. 5377 X 4 + 4. 7783 X 5
(2) Princess Anne Plaza Model
•(x) e
G(X) i + e
G(X) -3.2961 X 3 + 2.8514 X 4 + 2.0156 X 5 + 1.2444
i0

2141
6. Determine the potential bus ridership by each accessibility group with respect to sex and age as defined by the independent variables listed in Table 4. This can be accomplished with a hand calculator. Once the probability is determined with respect to the accessibility group, age, and sex the auto-transit split can be obtained by multiplying the percentage of population within the respective group times the total number of home-to-work trips for each zone
or census tract. Tables 5 and 6 will assist the planner in accomplishing this step.
7. Determine the potential number of autos to be parked at the potential fringe parking lot utilizing the following submodal split model. Computations are assisted with Table 7.
Submoda! Split Model
G(X) G(X)
i + e
G(X) -5. 7146 X 3 + 3. 4796
The application of this procedure to each potential lot site provides an estimate of demand for the operation that allows planners to locate lo•s so as to optimize patronage an.d best satisfy the planning objectives. It is important to emphasize the part the level of transit service plays in the level of. demand expressed for the operation; the better the service, the greater the demand.
The steps of the generalized forecasting procedure for work trips originating at a given zone are summarized in Figure 2.
ii

2142
Table 2
Socioeconomic Data
Data
No. of zonal work trips terminating at destination zone of service (e.g., no. of CBD work trips)
Estimates of captivity to either mode
Zonal or census tract sex distribution for home-to-work trips
Zonal or census tract age distribution for home-to-work trips
Zonal or census tract automobile ownership
Zonal or census tract licensed drivers
Source
Census or gravity model output
Preliminary survey
Census or survey
Census or survey
Census or survey
Census or survey
Table 3
Transportation System Data
Average Cost Per Trip via Each Alternative Mode
Tolls
Operating cost of auto (dollars per mile)
Transit Fare
Average Total Travel Time Per Trip via Each Alternative
Highway travel times
Transit running time
Excess times
12

Table 4
Independent Variables
X = Sex 0 = Female i
X 2 Age 0 2544
i = Male
i -fOtherwise
Number-of Household Autos X3 Number of Licensed Drivers
T T a b X4 = (T + T a b )/2
T Travel Time via Auto a
T b Travel Time via Bus
C C a b x5 = (c + c )/2 a b
C a
Cost of Using Auto
C b Cost oe Using Bus
.13

x

•n!$d•D s•pnIouI) d!•s•p!N snH
dno•D
•TS ioq •uT•d •2u•ad
iS

2146
Table 7
Poten.tial Fringe Parkers
o •
Submodal Split
Kiss n'Ride Park n'Ride
Potential Fringe Parkers
16

2147
Total work trips originating at zone i destined to CBD during express bus hours
...i__.•L T
Total free choice trips total work trips captive
trips to either mode 11•
Estimate primary split using binary choice model with corresponding accessibility [eve[
Estimated no. of auto trips
Auto person trips
Estimated no. of
express trips
Total express patron- age estimated ao. +
express captives
ira nsit trips
NO___
Estimate secondary split
Total express patronage estimated no. of transi• trips +
total captive transit trips
local bus trips
Total local bus patron- age estimated no.- +
local bus captives
Figure 2. Generalized demand, forecasting procedure.
17

2148
Site Evaluation
The potential sites are next evaluated to compare their ability to support express bus-fringe parking transit services. Specific measures derived from studies of successful express bus-fringe parking lot operations are used here for evaluating potential fringe parking lots. The first four measures cited are required for the implementation of any potential fringe !.• parking lot. Using these measures for a preliminary evaluation, sites unlikely to succeed can be eliminated. Table 8 will assist planners in this preliminary round of evaluation.
Once the preliminary investigation is completed, the re- maining potential sites can be. evaluated using the measures listed below. Application of table 9 will give each po-•ential site an evaluation rating. Sites can be placed in numerical order with the "best" site having the highes• numerical rating.
i. Bus ridership poten,tial
Utilizing the results obtained in the demand analysis, compare the estimated demand of each s'te to those of the other sites.
2. Accessibility to major corridor or expressway
Evaluate each site's accessibility to •a major corridor or expressway (having a minimum of -traffic impedances) leading into the CBD destination served.
3. Accessibility of autos and buses to potential sit°es
Each site should be evaluated with respect to the access and egress of autos and buses.
4. Compatibility with surrounding land use
The compatibility of each site with surrounding land uses should be reviewed.
5. Modifications of site
The modifications to be made at the proposed site depend upon whether the lot is to be jointly used or constructed. Reference should be made to the checklist of design criteria found in Table i.
18

o
o•
S•%TS :I.O•I •UT>[•e d H • •)
o ¢• •o o•-•
19

s•;noH snH 2uI;sTx Z o; sseooV
aooH 0
pooD g
ooo'osas • o 000•0£• u°T•°na•su°3 7o 000'015 I •so3 p•emT•sx 000•015 0 g
aoCex 0 •$IS 7o aouIN l suoTseo777poN •UON g
s•aoV • • 0 a•TS 70 •ZTS saaoV 9-• !
saaoV 9• g
•$IS 7o
• o ,4 7 °. A%71Tqel .reAV
"U
• s$7S .>- l•-•u•:o• uo: suedxv
•uTpunoaans
pue•i ;ueoeA 0 :oz p•zTiT$ fl i
%oq A•du• H •
O• ; 0 O0i-OS I OOZ [ g
auo•; 0 aqAe;4 I
PaAa•sqo g
aoo£ 0
•oo0
pooD g
dTqsa•pTH sna leTSua&o d
r•o'I 0 u•nTp•ki I
LtSTH
O
o
2O

2151
6. Current status of the site
Potential sites should be reviewed in regard to their current use (empty parking lot, partially filled lot, or vacant land) It is more feasible to utilize an empty parking lot than one that is being used.
7. Size of the site
Each site should be evaluated to assure that adequate space is provided for the movement of buses and cars .and the estimated demand.
8. Availability of parking spaces
The utilization Of .a joint use parking facility requires that it be reviewed wi.th respect to available parking spaces and the estimated demand.
9. Observed fringe parking needs
The demonstrated demand of each site should be compared to that of the other sites.
i0. Potential of site expansion
Consideration should be given to future ex>ansion of the site.
ii. Accessibility to existing bus routes
An efficient express bus-fringe parking lot operation can be established if there is potential of services being provided by local bus routes during the off peak hours.
12. Estimated cost of construction
The evaluation of each site includes the development of an estimate of capital costs.
13. Required major policy decisions
Major policy decisions should be made early in the planning process so that no major delays occur in the implementation of an express bus-fringe parking lot opera- tion.

Tmansit Semvices
Once potential.sites for fringe parking lots have been evaluated and the most feasible sites selected, transit services can be developed. The transit service, being a critical part of the express bus-fringe parking operation, warrants a careful analysis with respect to the criteria discussed under the following subheadings.
Transit Service Hours
The express bus-fringe parklng operatmon ms particularly appropriate for serving work --trips. Accordingly, peak periods should be analyzed to determine the starting and quitting times of the workers to be served so that service can be provided durin• the full range of hours.
A study conducted by the Institute of Traffic Engineers found most park-and-ride operations providing service •in the off peak hours. Transit service should be provided on a limited scale during off peak hours for those people going to or leaving work early or those desiring to use the service for shopping and nonwork tr'ips. Local transit operations should be reviewed to see if their services can be coordinated with the express bus-fringe parking io• operation. Off peak hour services could be provided by local transit. (12)
Peak Hour Headway
The frequency of trips is an important aspect of transit service. The-demand for this type of operation will depend greatly upon the headways between vehicles. The shorter the headway, the greater the demand. The following criteria should be referred to when determining the headways required to provide a high.level of service.
i. Potential estimated ridership, 2. bus capacity, 3. trip end- travel times, and
4. starting and stopping work time. range.
22

2153
Peak.hour headways for buses serving the .fringe parking lo-•s shoould be no more than 20 minutes. Studies of such opera- tions have found utilization to decrease rapidly with peak hour headways greater than 20 minutes. Excellent service is provided with headways ranging from 5 to I0 minutes. A 1-hour headway is recommended during the off peak period. (12)
Transit Service Within the Area Served
The express bus-fringe parking lot operation provides bus service to a speci•fic destination. Due to this ideal situation, a high level of service should be provided at the destination. Development of good service requires an analysis of the destination area to determine the relationship between major entry points, street patterns, and employment locations.
Transit service should terminate within a suitable walking distance of major employment locations. It is recommended that bus stops be located at distances rang•ng from 600 to 800 feet (183 to 244 metres.] from major employment destinations. A high level of service requires that waiting times at downtown bus stops not exceed 5 minutes. (13)
Transit Fare
The cost incurred by patrons of• the express bus'-fringe parking lot operation is a factor in the patronage of the system. The transit fare combined with the cost of parking at the fringe lot (if there is a charge to park) should be less. than the cost of using an automobile, i.e. the cost to drive, tolls, downtown parking. ( 12 )
Costs for utilizing the fringe parking lot operation will have to be determined within each metropolitan area. Local govern- mental agencies and transit companies should develop transit fares that have considered operational costs, governmental subsidies, and the benefits to be realized by implementation of such an operation. Most express bus-fringe parking lot operations have a 5 to i0 cent premium charge for the high level of service they will provide. (i2)
Transit Vehicle Requirements
The standard sized bus (8.5 reef wide (2.4 m), 40 feet long (12.2 m), 9.8 feet high (3.0 m) seating 40 to 50 persons should be utilized in providing the transit service. Each bus must have air conditioning and new or refurbished interiors and exteriors,

and be capable of good mobility and high speeds. They should be .maint.ained-in the best operating order and be kept clean inside and outside. It is recommended that the buses for this special service be delineatedfrom local buses by exterior markings.(13,14)
Marketing
Promotional act.ivities should be provided to educate the public and t-o stimulate interest in and awareness of the transit service. It is recommended that a minimum of 2% of the revenues taken in be expended for marketing. Marketing functions should be. organized and carried on by the transit company providing the service. Promotional activities would include newspaper, radio, andtelevision coverage, logo and color schemes to distinguish the service from local services, the development of simple coded system maps with schedule information on route origin and destina- tion times and the development of responsive •e!ephone inquiry services. (13)
APPLICATION TO SOUTHSiDE RICHMOND
The study area is located southof the James River and comprises Chesterfield County and a portion of the city of Richmond. The example application of the planning methodology concerns the south- western quadrant of the Richmond Metropolitan area ,shown in Figure 3. This area is primarily residential in character with some commercial and light industrial establishments. A number of major and minor arterial routes along with one interstate highway traverse the area. Yet a s'gnificant amount of traffic congestion exists on all of these major roadways. During the peak hours of the day the major transportation corridors within this area operate at low levels of service. The problem scenario addresses the feasibility of express bus-fringe parking operations for Southside Ricb•nond and the location of suitable lot sites..

2155
:ICHMO•D
Figure 3. The Richmond Metropolitan area.
25

2156
Site Selection
Service Area Analysis
The Study Area
The study area is examined to determine whether it can-
support express bus-fringe parking transit.
Parking Analys•s. As of- 1972. approximately 20,209 off- street parking spaces were available within the Richmond CBD.(15) According to 1970 census data, approximately 37,157 people worked within the Richmond CBD. It is most .likely this figure would have increased by 1972. Therefore, comparing the available parking spaces to the working population, it can be seen that the demand for parking places exceeds the supply. Even with an auto
occupancy rate of 1.6 persons per auto, the demand would still be greater than the supply (23,223 autos with 1.6 persons per auto).
High parking costs result fro•:• the demand exceeding the supply. A survey of parking costs w•rhin the Richmond CBD showed costs ranging from $1.25 per day to $4.00 per day.
Roadway Analysis. The majority of.major roadways fr.om South- side Richmond to the CBD operate at level of service D or below during peak hours. Table !0 shows the traffic conditions on the major corridors of travel and estimates of their respective levels of service. Traffic counts were secured from the urban traffic counts for the Richmond Metropolitan Area published annually by the Traffic and Safety Division of the Virginia Department of Highways and Transportation.
Tripmaking. Costs. At the present time there are tolls on the Powhite Expressway, the Richmond-Petersburg Turnpike, and the Nickel Bridge which connects Westover Hills Boulevard with Pump House Drive. All three roadways link Southside Richmond with the Richmond CBD. The cost of accessing downtown Richmond v•a the Powhite and Downtown Expressway is 35 cents. Presently this is the only major corridor operating at a level of service greater than D. The cost of utilizing the Richmond-Petersburg Turnpike and the Nickel Bridge is I0 cents.
The above c6nditions are favorable to the implementation of
an express bus-fringe parking lot operation somewhere in Southside Richmond.
26

.F•O 0 rO .H •>
27

2158
o
o 0
0
0
CD CD 0 0 C) 0 C] el) 0 -C) C• 0 lid 0 CD
28

0
"0
• 0 O•
o
0
o cj
0
O CD O O O O O O O O O O O O
• 03 I.• 03 CD • • ¢JD Ob
o •
•u .•
(D •
o o • o c3 o o
29

216n
The Corridor
When an urban area exhibits transportation conditions that warrant the implementation of express bus-fringe parking transit, a corridor study is conducted to determine those corridors which would benefit most with the development of the service.
The Bon Air Corridor. The Bon Air corridor is shown in Figure 4. This area of development runs along Huguenot Road-Cary Street (Route 147), Forest .Hills Avenue-Semmes Avenue and the Downtown- Po.white Expr.essway (Rout• 195) into Chesterfield County. The port.ion of the corridor located north of the James River is pre- dominantly a mixture of industrial and commercial areas with the rest of the corridor radiating south of the James River primarily consisting of single family residential units with a scattering of apartment buildings and small shopping areas. Access to the Richmond downtown area is provided-by the above noted highway links. During the peak periods of the davy these streets are heavily congested, with the exception of the Downtown-Powhite Expressway. The 35-cent toll is the most likely factor in the limited use of the Downtown-Powhite Expressway.
The Route 60 Corridor. The Route 60 corridor, shown in F•gure 5, extends approximately 5 miles from the Cloverleaf Mall area into Downtown .Richmond. It consists •of the Midlothian Turnpike (Route 60) and Hull Street (Route 360). The portion located wi•thin the Rich- mond city limits is predominantly a mixture of industrial and commercial areas with a scattering of residential areas. Land use in Chesterfield County is predominantly residential, with apartment and single family units and some scattered shopping centers.
The •Route i Corridor. The Route i corridor is shown in Figure 6. Th•S sp•ine of development runs along the Jefferson Davis High- way (Route 1-301) and the Richmond-Petersburg Turnpike (Interstate 95). That portion located within the Richmond city limits consists of a mixture of industrial, commercial and residential areas. The part of the corridor in Chesterfield County .is primarily residential with a scattering of shopping centers. Access to. downtown Richmond is provided by the Jefferson Davis Highway (Route 1-301), the Rich- mond-Petersburg Turnpike (Interstate 95) and Commerce Road.
3O

2161
Figure 4. The Bon Air corridor.
31

2162
ICSVILLE
Figure 5. The Route 60 corridor,.

2163
Figure 6. The Route i corridor.
33

2164
The Market A.rea
Utilizing census data, subareas of the respective corridors are analyzed to determine if a substantial number of home-to-work trips destined to the Richmond CBD exist to warrant the implementa- tion of an express bus-fringe parking lot operation. Figures 7 through ii show the respective subareas and the census tracts. Tables ii through 13 list the census tracts and their respective numbers of home-to-work trips destined to the Richmond CBD by individual subarea.
2011.01
2012 Ol
1OO9O3
2011.02
2014.01
I001.05
10 0301
1002.02
Figure 7. The Bon Air corr±•or market area.
34

0
0
o
0

2166
0
0 0
36

2167
o ,-• ,r'-I
0
0
37

2168
0
.•!
0
0
38

169
Table ii
The Bon Air CorridOr Market Area
Census Tracts Home-to-Work Trips
i001.01 445 i001.02 258 1001.03 151 1001.04 891 1009.01 454 1009.02 266 1009.03 388 1009.07 122
TOTAL (1970) (1976)
Table 12
The Route 60 Corridor Market Area
Census Tracts Home-to-Work Trips
1001.03 151 1001.04 891 1001.05 265 1002.01 158 1002.02 785 1002.03 333 1002.04 46 1007- 0 1008.02 142 1009.03 388 1009.04 78 1009.05 168 i010 Iii
TOTAL 2,086 (1970) 2,•.72 (1976)
39

-2170
Table 13
The Route I Corridor Market Area
Census Tracts Home-to-Work Trips
607 450 608 503 609 114
1003.01 361 •003.02 141 1003.03 6 1004.01 368 1004.03 40 1005 153 1006 19 1008.01 352 1008.03 84
TOTAL 2,591 (1970) 2,927 (1976)
(16) Censgs tract data were-obtained from the 1970 census. The population within the Richmond Metropolitan Area.has in- creased by approximately 13% since 1970. Therefore mt was assumed that the home-to-work trips, have increased approximately 13%.
Each subarea has a sufficient number of home-to-work trips destined to the Richmond CBD to warrant the implementation of an express bus-fringe parking lot operation.
Site Analysis
From aerial photographs of Southside Richmond, potential fringe parking lot sites were selected. These sites were located utilizing characteristics associated with successful fringe parking lots. Accessibility was the dominating factor in locating the .potential sites. The majority of the sites were located a• points where major corridors leading into the Richmond CBD were highly accessible. The sites selected in this study consisted of vacant land, shopping centers, and schools and are listed by name in Table 14.
4O

2. 3. 4. 5. 6. 7. 8. 9.
!0. ii. 12.
Table 14
Potential Fringe Parking Lot Sites
The Bon Air Corridor
Chesterfield Mall Huguenot Villa•e Shopping Center Vacant Land Vacant Land Vacant Land Huguenot High School Fred D. Thompson Middle School Vacant Land Vacant Land Forest Hill Shopping Center Vacant Land Bon Air Shopping Center
13. 14. 15. 16. 17. 18. 19.. 20. 21. 22. 23. 24.
The Route 60 Corridor
Vacant Land Cloverleaf Mall K-Mart Beaufont Mall 60 West Shopping Center Vacant Land Vacant Land Chippenham Mall 360 West Shopping Center Vacant Land Vacant Land Vacant Land
.25. 26. 27. 28. 29. 30.
The Route i Corridor
Vacant Land Meadowdale High School Vacant Land- Vacant Land Vacant Land Vacant Land
41

217-2
Demand Analysis
The potential demand for each fringe parking lot site (3) listed in Table 14 is estimated utilizing the Parham Road model. This particular model was selected because of similarities in the socioeconomic data of the Parham Road area and the study area. According to 1970 census data, Southside Richmond consists Of a high income market area similar to the Parham Road market area. Due to the majority, of the potential sites being located at dis- tances of i0 miles (16 km) or less, the Parham Road model is again more suitable than the other model from the Virginia Beach- Norfolk area.
Market areas were defined for each potential fringe parking lot site according to the [email protected] established earlier in this repo• •. The potential market areas for selected sites are listed by traffic zone according to their respective accessibility groups in Table 15.* Table 16 contains data for each traffic zone in- cluded within the defined market area of the representative sites.
Richmond CBD work trip interchanges according to sex and age were established with each traffic zone using factors developed from 1970 census data.(!6)
"*Of the 30 possible sites, examples of the analysis are given for only one from each corridor.
42

2173
0

2174

.2175
0
•-I
• r---'l

.2176
46

2177
I
These factors were developed in the following manner.
City of Richmond Traffic Zones
A People living in the city of Richmond and
i. Working in the city of Richmond 77,032 2. Working in the Richmond CBD 20,545
FACTOR =
20,545 77,032 = .26670
B Sex Distribution
i Males living and working in the city of Richmond 40,858
FACTOR =
40,858 77,032
Femal•,eis Richmond
= .53040
living and working 36•174
in the City of
FACTOR =
36,174 77,032 = .46959
C Age Distribution
i Age 25-44 living and worki°ng in the city.of Richmond 30,535
FACTOR =
30,535 77,032 = .39639
Age (Otherwise) living and working in the city of Richmond 46,497
FACTOR =
46,497 77,032 = .60360
D Richmond CBD work trip factors by sex and age
i Males (25-44) living in the city of Richmond and working in the Richmond CBD
FACTOR .26670 X .53040 X .39639 .056
Males (Otherwise) living in the city of Richmond and working in the Richmond CBD
47

2178
FACTOR .26670 X .53040 X .60360 .0854
Females (25-44) living in the city of Richmond andworking in the Richmond CBD
FACTOR .26670 X .46959 X .39639 .0496
Females (Otherwise) living in the city of Richmond and working in the Richmond CBD
FACTOR .26670 X .46•59 X .60360 .0755
Chesterfield County Traffic Zones
A People living in Chesterfield County and
Working in the city of Richmond Working in the Richmond CBD
14,222 3,199
FACTOR =
3,199 -- 224•3• 14,222
B. Sex Distribution
i Males living in Chesterfield County and working in the city of Richmond 9,031
.FACTOR =
.9,031 = .6350 14,222
Females living in Chesterfield County and working in the city of Richmond 5,191
5,191 3649 FACTOR = 14,222 -
C Age Distribution
Age 25-44 living in Chesterfield County and working in the city of Richmond 7,759
FACTOR =
7,759 _- .54556 14,222
Age (Otherwise) living.in Chesterfield County and working in the city of Richmond 6,463
FACTOR =
6,463 _- .4544 14,222
48

2179
D Richmond CBD Work Trip Factors By Sex and Age
Males (25-44) living in Chesterfield County and working in the Richmond CBD
FACTOR .22493 X .6350 X .54556 .0779
Males (Otherwise) living in Chesterfield -County and working in the Richmond CBD
FACTOR .22493 X .6350 X .4544 .064907
Females (25-44) livin-g in Chesterfield County and working in the Richmond CBD
FACTOR .22493 X .3649 X .54556 .04477
Females (Otherwise) living in Chesterfield County and workin• •i• the Richmond CBD
FACTOR .22493 X .3649 X .4544 .037298
Traffic zone home-to-work trips destined to the city o• Richmond were obtained from the Transportation Planning Division of the Virginia Department of Highways and Transportation. These trips were developed in 1970 as part of the 3-C Planning Process. These work trip volumes from Richmond traffic zones were multiplied by the factors developed for the city of Richmond, while work trips from Chesterfield Coun'ty traffic zones Were multiplied by the factors devel-oped for.Chesterfield County.
Accordingly, the following example shows how work tri• volumes are d.eveloped for traffic zones with respect to sex and age.
Traffic Zone Work Trips to City of Richmond
221 (Chesterfield) 113 179 (Richmond) 3,363
Chesterfield CBD Work Trips
Richmond CBD Work Trips
Male
Age 2S-44
FACTORS
.0779 (221) 113 9
.056 (179) 3,363 188
Other
.064907 7
Female
Age 25-44
Other
.04477 5
.037298 4
.O854 287
.0496 167
.0755 254
49

2180
Licensed drivers by traffic zone were established using factors developed from data provided by the Virginia Division of Motor Vehicles and the 1970 census. The development of these factors is shown below.
i. Licensed driv.ers in Chesterfield County•-- 68,422 Chesterfield County population 93,944
FACTOR =
68,422 _- 72832 93,944
2.. Licensed drivers in the city of Richmond 131,197 city of Richmond population 229,165
FACTOR =
131,197 _- .5725 229,165
Multiplying traffic zone populations by the developed factors resulted in an estimate of the number of licensed drivers per traffic zone. It was necessary to assure that the proper factor (Chesterfield County or City of Richmond) was used with the correct traffic zone. Auto ownership by traffic zone was available from data supplied by the Transportation Planning Division of the Virginia Department of Highways and Transportati-on.
Before the model could be used to estimate the potential de- mand of the fringe parking lot sites a number of assumptions were made. These assumptions are listed below.
i. Captivity to either mode. Estimates of mode captivity were assumed to equal estimates found in the Parham Road express bus fringe parking lot case study because of its similarity with the area under study.
Bus Captivity (CBD Work Trips) 3% Auto Captivity (CBD Work Trips) 40%
2. Operating cost of auto. An estimate of 4 cents per mile was used because of its utilization in the Parham Road express bus fringe parking lot case study. Distances between potential sites and the Richmond CBD were obtained from a Richmond map using a scale. These. are shown in Table 17.
3. Transit fare. A 50 cents fare was established as the cost to ride the express bus from potential fringe parking lot sites in Southside Richmond into the CBD.
5O

2181
Table 17
Distances Between Potential Sites and the Richmond CBD
(i mi. 1.6 kin)
Potential Site Distance (Miles)
i 10.80 2 10.80 3 8.68 4 8.12 5 7.56 6 7.00 7 7.00 8 6.72 9 7.28
i0 6.55 ii 7.28 12 7.67 13 6 .I0 14 6.61 15 6.61 16 6.61 17 7.56 18 7.95 19 8.12 20 6.16 21 6.88 22 7.17 23 7.28 24 7.00 25 8.4O 26 8.88 27 7.2O 28 7.20 29 7.20 30 7.44

4. Travel times. Highway travel times for both the automobile and the bus were assumed to be the same .because of the lack of bus priority measures on corridors leading into the Richmond CBD from South- side Richmond. Interzonal travel times between potential site and CBD traffic zones were used as highway travel times. Before the highway travel times could be used in model application they had to be converted to peak hour travel times. The travel times for each prospective site are shown in Table !8.
5. Excess times. Excess times were assumed to be the following
a. Drive into lot and park 3 minutes
b. Walk to boarding point i minute
c. Wait for bus (bus frequency or headway) 5 minutes
d. Drive onto main route i minute
Total Excess Time i0 minutes
6. Parking cost. The average co{• of parking within the Richmond CBD was assumed to be 75 cents per day.
The travel cost andtime variables for ,the respective modes (X4 and X 5) were determined for each potential site. The specific values of these variables used {or the repre- sentative sites are shown in Table 19.
Once values for X4 and X 5 were obtained the Parham Road model was applied. The Parham Road model estimated the potential express bus ridership for each potential fringe parking lot. To determine the number of autos that would be parked at potential sites it was necessary to apply the submodal split model. The results of both of these applications can be found in Table 20. Examples of the work sheet computation for the Parham Road model application to the representative sites are given in Table 21, while the work sheets for the submodal split model appear i.n Table 22. An example of the application is shown below for site 8.
52

2185
Table 18
Highway Travel Times
Potential Site
Interzonal Travel Times
Peak Hour Travel Times
i 20.50 23.80 2 20.50 23.80 3 20.50 23.80 4 21.00 24.41 5 20.50 23.80 6 18.50 21.50 7 18.50 21.50 8 18.50 21.50 9 16.50 19.20
I0 15.00 17.40 ii 15.00 17.40 12 20.50 23.80 13 15.50 18.00 14 15.50 18.00 15 14.50 16.80 16 15.50 18.00 17 16.25 18.85 18 16.75 19.50 19 18.50 21.50 20 15.00- 17.40 21 19.00 22.00 22 19.75 22.90 23 19.7.5 22.90 24 16.50 19.15 25 19.00 22.0• 26 18.50 21.50 27 15.75 18.30 28 15.50 18.00 29 15.25 17.70 30 15.50 18•00
Note: Interzonal travel times were multiplied by 1.16 to obtain the peak hour travel times. Pignataro(17) cited that the total time lost through delay for city wide travel was 15% to 16% of the normal travel time.
53

218 t
<1! <! i"
lea
+ X 0"3 _.• •
• i"
•-I • • 0 "• 0
• 0
0 • +J >
54

2185
Potential Site
i 2 3 4 5 6 7 8 9
i0 ii 12 13 14
16 17 18 19 2O 21 22 23 z4 25 26 27 28 29 3O
Table 20
Potential Express Bus Ridership and Fringe Parkers
Express Bus Ridership
Fringe Parkers
634 67 666 70 717 75 630 66 989 104 965 i01 965 i01
1,211 127 826 8'7
1,200 126 1,160 122
94O 99 1,137 120
597 63 1,097 i15 1,108 116
551 58 703 74 668 70 791 83 581 61 517 54 532 56 895 94 457 48 430 45 370 39 410 43 415 44 440 46
Note These estimates are from an application of the gravity model for 1970 work trips. The figures will be substan- tially grdater for 1976 because of rapid residential growth in Chesterfield County.
55

2186
> -,4
56

c)
.•I 0
o 0
0
0
-•I 0-,-I
0
c•
$7

Accessibility Group i
G(X) -1.3416 X I .+ i 1430 X 2 2. 353 X 3 + 4. 2932
+ 2 3732 3 3990 XS.
X I Sex (0 Female; i = Male)
X 2 -Age (0 -25-44; i- Otherwise.)
X 3
Number of Household Autos Number of Licensed Drivers
For potential fringe parking lot site 8"
Female, X I =o 0
Age 25-44, X 2 0
Number of Household Autos Number of Licensed Drivers = X3 I
(For this example application the X3 variable was rounded to i.)
X = .34615 4
X 5 = 25327
G(X) -1.3416 (0) + 1.143 (0) + 2.353 (i) + 4.2932(-.34619) +
3.3990 (.25327) + 2.3732" 4.10097
G(X) 4. 10097
G(X) 4.10097 e = e' = 60. 398
58
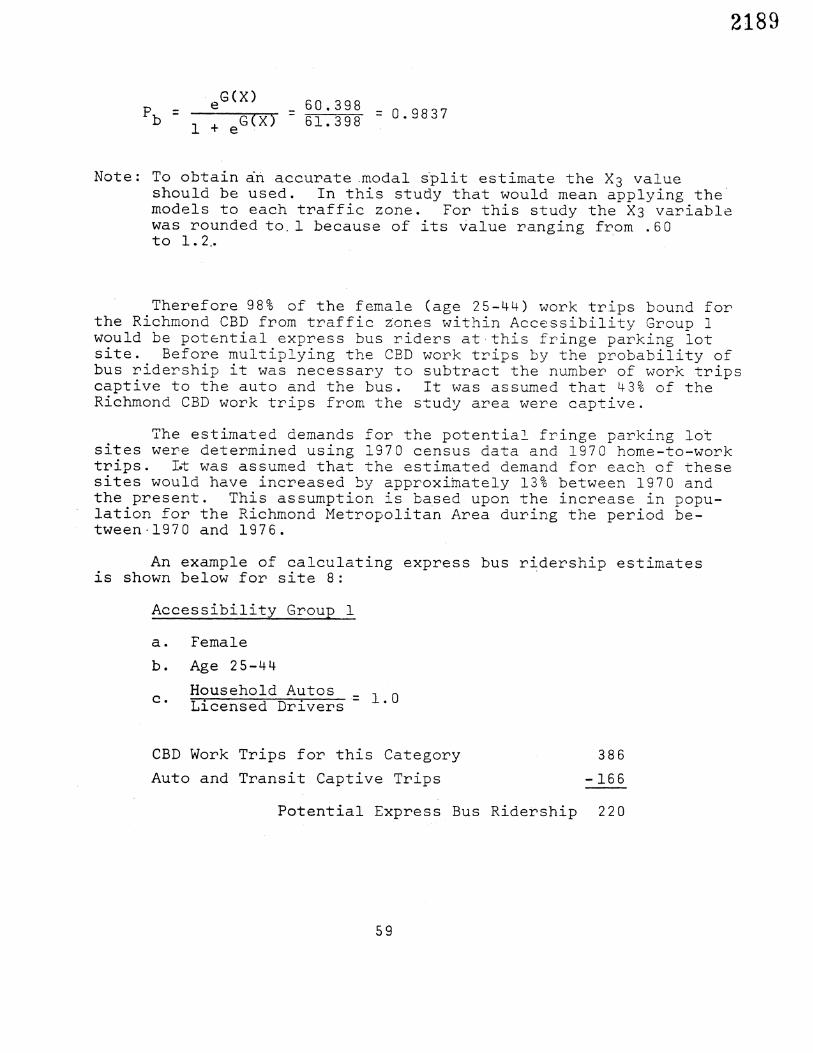
2189
G(x) Pb e
•(X-) ]. + e
60.398 61.398 = 0. 9837
Note" To obtain •n accurate .modal s:plit estimate the X 3 value should be used. In this study that would mean applying the models to each traffic zone. For this study the X3 variable was rounded to. I because of its Value ranging from .60 to 1.2..
Therefore 98% of the female (age 25-44) work trips bound for the Richmond CBD from traffic zones within Accessibility Group 1 would be potential express bus riders at,this fringe parking lot site. Before multiplying the CBD work trips by the probability of bus ridership it was necessary to subtract the number of work trips captive to the auto and the bus. It was assumed that 43% of the Richmond CBD work trips from the study area were captive.
The estimated demands for the potential fringe parking Io• sites wer.e determined using 1970 census data and 1970 home-to-work trips, lot was assumed that the estimated demand for each of these sites would have increased by approxiNately 13% between 1970 and the present. This assumption is based upon the increase in popu- lation for the Richmond Metropolitan Area during the period be- tween-1970 and 1976.
An example of calculating express bus ridership estimates is shown below for site 8-
Acges,sibi!.ity ,Group !
a. Female
b. Age 25-44
Household Autos e. Licensed Drivers
CBD Work Trips for this Category Auto and Transit Captive Trips
386
-166
Potential Express Bus Ridership 220
59

220.X .9837 216 Express bus ridership estimates
+ 12 Captive transit trips
228 Express bus riders for female, age 25-44 in Accessibility •Group i.
Site Evaluation
The potential fringe parking lot sites for Southside Richmond are evaluated utilizing Tables 8 and 9. Each site met the required criteria in the preliminary evaluation (Table 23).
Southside Richmond appeared to be an excellent area to imple- ment an express bus-fringe parking .lot operation because of the substantial number of home-to-work trips destined to the Richmond CBD that was shown by the demand analysis. Each site had an estimated demand of at least 400 express bus users. Because of this significant demand at each site, joint use sites rated low in the final evaluation because of their limited parking supply.
The.final evaluation regarding each measure was conducted using the following criteria.
Potential Bus Ridership. Estimated demand ranged from a
low of 400 express bus riders to a high of 1,300. This .range of potential ridership was judged adequate to support fringe parking lot operations. For purposes of the evaluation those sites with an estimated demand •f 400 to 700 express bus users were given a medium (i) rating while those above 700 were given a high (2) rating.
Accessibility .to. Maj. or Corridor or Exmressway. Potential sites located at points where access t• Powhite Expressway or Interstate 95 could be accomplished with-a minimum of delays (traffic lights, stop signs, left turns, etc.) were rated good (2). A rating of fair (i) was given to those located next to major corridors yet were impeded by numerous traffic lights, signs, etc. in reaching the Powhite Expbess- way or Interstate 95.
Access of Autos and Bu.s.es .to. Site.. In rating potential sites with ••spect tO this measure, a good (2) rating was given to those sites where access to the lot could be made by a right turn in the direction of the Richmond CBD or at a left turn signal.

2191
Table
Site
i0
ii
12
13
15
16
17
18
19
20
21
22
23
2•
25
27
28
29
30
Potential for Bus Ridership
Preliminary Site Evaluation
Accessibility of Accessibility of A Major Highway Automobiles and To Destination Buses to Site
CompaZibi!ity With. Local Land Use
61
2192
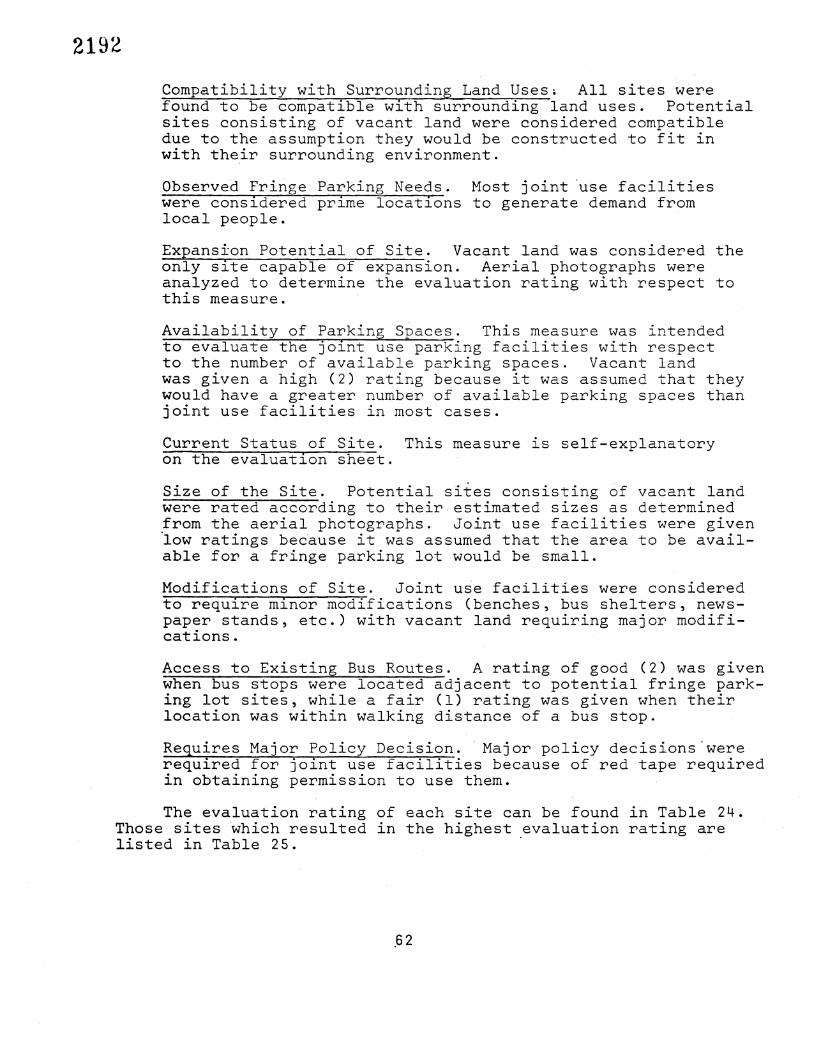
Compatibility with Surroundin.g Land Uses• All sites were found to be compatible with surrounding land uses. Potential sites consisting of vacant land were considered compatible due to..the assumption they would be constructed to fit in with their surrounding environment.
Observed Fringe .P.arking Needs. Most joint 'use facilities •er-e Consid'e•ed prime locAiions to generate demand from local people.
Expa.nsion Potential of Site. Vacant land was considered the only site capable of expansion. Aerial photographs were analyzed to determine the evaluation rating with respect to this measure.
Availability of Parking Spaces. This measure was intended to evaluate the joint use parking facilities with respect to the number of available parking spaces. Vacant land was given a high (2) rating because it was assumed that they would have a greater number of available parking spaces than joint use facilities in most cases.
Current Status of Site. This measure is self-explanatory on the evaluation sheet.
S•ze of the Site. Potential siies consisting of vacant land were rated according to their estimated sizes as determined from the aerial photographs. Joint use facilities were given low ratings because it was assumed that the area to be avail- able for a fringe parking lot would be small.
Modifications of Site. Joint use facilities were considered to require minor modifications (benches, bus shelters, news-
paper stands, etc.) with vacant land requiring major modifi- cations.
Access to Existing Bus Routes. A rating of good (2) was given when bus stops were located adjacent to potential fringe park- ing lot sites, while a fair (i) rating was given when their location was within walking distance of a bus stop.
Requires Major Policy Decision. Major policy decisions were required for joint use facilities because of red tape required in obtaining permission to use them.
The evaluation rating of each site can be found in Table 24. Those sites which resulted in the highest evaluation rating are listed in Table 25.

s•3.no•I snEt •u!•s.zx 3 o:• SS•DDV
uo!•ona•suo 3 7o
aoog 0 aTe.• I pooD g
000 0£g$ • 0 O00•O£g 000' 015 ! Ssoo p•:•e•!3.s3
a•3S 7o suo!•eoITIpoN
e$IS 7o azIs
000 015 0 g
aou.•N I •uoN g
seaoV 9 •, g
e•!S 7o sn$•S &u•aan O
s•oeds •uI•ae d .$o K•!I!q•l•e• v
•IS 7o le!•u•od uo!suedxH
•o3 paz!l!$N I
os •. o 00!-0• I
001 •
•uoN 0 •qAeN i
sPaeN •u!Mae d e#uTaH peAaasq0
•u!punoa•ns q•!m A•!l!q!•edmoo
o• sasnE pue sonny 7o ss•ooV
Ke•ss•adx3 ao aopia=o O
•o•eN o• ss•ooV
.. sn• l•T•ue•o H
o • • o
63

2194
Su.•H uoy•nI•^• Ie•OZ
ao.[eN s•a3nb• •
s•:•noH snH Su!$s!xH o$ ss•ooV
s•A 0 •qAeN I
oN Z
aood 0 ate/ T pooD g
uo!•ona•suoo 7o
asTS 7o
a:• .zS 7o sneers •u•aan o
saoeds •u .•>[ae d
e:•.•S 7o le.•:•u•:•oH uo!suedxx
spa•N •u!•[aecl
000'0Sg$ • 0
000 015 I 000 015 0
aouIN I •uoN g
s•aoV h • 0 s•aoV 9-• i s•aoV 9 • •
pueq Su•oe h 0 %oq P•Z•. I .•%•q I
$oq XSdu•x g
0S Z 0 001-0¢. I
OOI • a
aucN 0 aqKeN I
•UON 0 eq,4eN I
p•Aa•Sq0 g
O
aood 0
pooD g
aooH 0
pooD g
•ooH 0
pooD Z
aoq 0 um.•peN I
O C• O Cq 04 04 O O
,-4 O ,-4 O O C) O ,-• ,-• CD

o
@uT•H UOT•nI•^Z i•O•T
sa•noH sn H
uo•.$onassuoo 3o
a:l..z S 70 suo3:•eo373poN
a:I.3S 9o ez3S
al3S •o sneers •uaaan3
saaeds •uI>[ae H
a:•!S 70 Ie3•ua•og uoIsuedx.7
sPaaN •u•.>[ae H a•u.•al paAaasqo
•u3punoaans
o$ sasnH pue soz•nv 7o ssaooV
ao aop!aao 9 •o.•N o• ssaooV
saA 0 aq/f•N I
ON g
aOOd 0
pooD g
000 OSg$ <
0 O00•OSZ 000•015 I
000 015 0 C
ao .[eN 0 aouTH I aUON g
saaoV 9-h I saaaV 9 • g
pueq SueoeA 0 $oq pazIlT$•q I
$oq £$du•Z g
os S 0 ooI-OS I
OOI • g
euo:I 0 aqAeN I
sea g
auoN 0 aqXeN l
aooH 0
poo9 g
•ooH 0
pooD
sf•@ Ie.•$ua$oH
aooH 0 a!el I pooD g
•oq 0 um3P• I
q•IH g
o o c) ,-• o o o o (D 0
0 0 0 0 C'4 0 0 0 0
,-• o o o o ,-q o o H o
65

2196
Table 25
Optimum Fringe Parking .Lot Sites
The Bon Air Corridor
Site 3 Vacant Land Site 5 Vacant Land Site 8- Vacant Land Site 9 Vacant Land
The Route 60 Corridor
Site 13 Vacant Land Site 15 K-Mart Shopping Center
The Route i Corridor
Site 25 Vacant Land Site 27 Vacant Land Site 28 Vacant Land Site 30 Vacant Land
The results of the evaluation show the majority of best sites to consist of vacant land. Joint use facilities would not be capable of handling these levels of antic.ipated patronage. It is imperative that a high level of transit service be pro.vided in order for an express bus-fringe parking lot operation to s•cceed. The parking supply plays a major role in the level of transit service provided by this type of operation. Inadequate parking could hamper the operation and prevent the accomplishment of long- term improvements of the highway.
There were a number of unutilized parking spaces at the K-Mart Shopping Center. Yet the estimated demand would be greater than the supply at this site. In a situation such as this it would be necessary to consider the vacant land adjacent to the shopping center.
The costs of constructing fringe parking lots are feasible if the lots" are ultimately successful in reducing vehicle flows on high- way facilities. The estimated demand for each of these sites would be a substantial reduction in peak hour traffic on the presen.t high, way facilities leading into the Richmond.CBD. Consideration could
66

be given to using joint use facilities on a short-term basis to see if the anticipated demand is approached. If the demand is met then fringe parking lots can be constructed.
Since the final evaluation resulted in more than one optimum site for each corridor, it was necessary" to evaluate these sites using the sum of the evaluation ratings of the first four measures" (i) potential bus ridership, (2) accessibility to major corridor or expressway leadi.ng to destination, (3) accessibility of autos and buses to site, and (4) compatibility with surrounding land use. The level of success of an express bus-fringe parking lot operation depends upon these measures. If this evaluation results in more than one site, the one with the highest estimated demand should be selected. This process was conducted on the optimum sites for each corridor in this study. The results can .be found-in Table 26.
Table 26
Evaluation of Optimum Sites
Site
Bon Air Corridor
,'3 5 8 9
Route 60 Corridor
13 15
Rout e i Corridor
25 27 28 30
Evaluation For First Four Measures
6 7 8 8
8 8
7 7 7 7
Po "ential Demand
717 989
1,211 826
1,137 1,097
457 370 410 440
-optimum S{te
67

2198
To c.omplete this study the Route 60 corridor is recommended as the f.irst area in which to implement an express bus-fringe parking lot operation. The estimated level of demand for the site within this.area would result in a greater roadway efficiency. The Bon Air corridor would be recommended as the second best area, with the Route i corridor being last.
Transit Service Development
After t.he orlgmn points for express bus services are located, the transit services themselves must be organized. The transit service options include the route, the hours of operation, the headway, the peak hour travel time, the required number of transit vehicles, and the number of transit trips during the hours of operation. The transit services developed for each optimum site are listed below.
Site 8 (Bon Air Corridor)
Route Description" Chippenham Parkway, Powhite Expressway, Downtown Expressway
Hours of-0peration" Morning Peak Hours and Evening Peak Hours
Headway" 5 Minutes
Peak Hour Travel Time" 21.50 Minutes
Required Number of Transit Vehicles" ii
Number of Transit Trips" 32
Site 13 (Route 60 Corridor)
Route Description" Chippenham Parkway, Pow•ite Expressway, Downtown Expressway
Hours of Operation" Morning Peak Hours and Evening Peak Hours
Headway" 5 Minutes
Peak Hour Travel Time" 18.00 Minutes
Required Number of Transit Vehicles" Ii
Number of Transit Trips" 33
68

Site 25 (Route 1 Co•ido•)
Route Description" Chippenham Parkway, Interstate 95, Broad Street
Hours of Operation" Morning Peak Hours and Evening Peak Hours
Headway" 5 Minutes
Peak Hour Travel Time" 22.00 Minutes
Required Number of Transit Vehicles" Ii
Number of Transit Trips" 21
2199
All of the described routes consist of toll roads. Con- sideration should be given .to permitting transit vehicles nonstop movement through the toll collection facilities to cut down on travel time. A 9oute has been recommended for the CBD area, and is shown on the map in Figure 12.
It is necessary to point out that if transit fares and head- ways are changed, the estimated demand will change. It would be necessary to estimate the demand using the new variables.
Once transit services are established, a vigorous marketing campaign should be conducted to inform the populace of the new service. This can be accomplished through radio, television, and the newspaper.

HOLID/.,,Y
DOWNTOWN
Scale of Miles 1:17,500
0.2 0.3
ONE INCH EQUALS ABOUT Miles (1460 FEET)
l•) G. D. CO., INC.
Figure 12. CBD bus route.
7O

2.201
SUMMARY AND RECOMMENDATIONS
Travel choice models and planning guidelines for express bus- fringe parking transit der£ved in earlier research were synthesized to-establish a procedural method for developing ridership for similar transit services in other areas of the Commonwealth. The resulting sub- area transit planning process was demonstrated by an application to Southside Richmond.
The methodology provided is recommended to the Transportation Planning Division fo•_ implementation as a standard method •= •o• express bus-fringe parking transit planning. Very precise levels of ana- lytic detail are possible where the study area and transportation system are similar to those from which mode choice models are available. In such cases, detailed facility and service designs can be developed. For the general case where conditions are not as favorable, assumptions concerning travel behavior must be made to justify estimates of trip making. However, under all circumstances,. the procedures wil'] be particularly valuable foF,:..sketch planning purposes and• feasibility analyses. As a history of application of the procedures develops, an extensive set of disaggregate behavioral models will evolve for a wide range of travel, behavioral, population, and urban conditions.
i. Determine minimum travel paths to the destinatio.n area for each traffic zone to define the market area for each service site according to accessibility.
2. Make an assessment of auto and transit captivity rates.
3. Conduct travel time studies for peak- and non peak hour traffic conditions between potential service sites and the destination area.
4. Estimate work trip volumes according to age and sex groups. Volumes can be estimated most accurately from transportation study data, and age and sex distributions from census data.
71

2202

ACKNOWLEDGEMENTS
The authors acknowledge the assistance received from the Transportation Planning Division of the Virginia Department of Highways and Transportation and the Planning Group at the Re- search Council in the conduct of this research. We especially thank R. N. Robertson for his assistance in organizing this report to meet the needs of the practicing transportation planner.
73


2205
REFERENCES
"An Demetsky, M. J., alysis of. Expr•ss• Bus-Fringe Parkmn•o Operations," Virginia Highway Research Counc•_i,VHRC 73-R23, Charlottesville, Virginia, November 1973.
"Planning Criteria for Demetsky, M.. J.,and.R. P. Cleveland, Express Bus-Fringe Parking Operations," Virginia Highway and Transportation Research Council, VHTRC 75-R64, Charlottesville, Virginia• June •1975
"Demand Estimation for Kavak, F. C., and M. J. Demetsky, Express Bus-Fringe Parking Services," Virginia Highway and Transportation Research Council, VHTRC 75-R60, Charlottesville, Virginia, June 1975.
Highway Capacity Manual, Board, Washington, D. C.,
Special Report 1965.
Highway Research
"Park-and-Ride Trans {• Service" Tanner, G. H., and R. Barba, •Some Guidelines and Considerations for Service Implementation, PRR 44, New York State Department of Transportation, Alban.y, New York, April 1973.
:' Techn{ pal Koh•s. & Sandi, "Park--and-Ride Location. Studmes, MeN09andum, Task No. 8o426, Joint Regional Planning Program, Denver, Colorado, February 1975.
Gatens, D. M., "Locating and Operating Bus Rapid Transit Park-Ride Lots" A Synthesis of Experience and Some Pre- liminary Planning Guidelines," PB-236010, Washington University, Seattle, Washington, August 1973.
Survey of Fringe Parkin.g Area Needs in the Pohick and We.st Spri•g'field Areas of Fairfax County, Metropolitan Transporta- tion Planning Division, Virginia Department of Highways, December 1973.
Barton-Aschman Associates, Commuter Parking at Highway Inter- changes, Barton-Aschraan Associates, Chicago, 1970.
" High- "A Study of Transit Fringe Parking Usage, Deen, T. B., waY Research Record 130, Highway Research Board, Washington•, D. C., 1966, pp. 1-19.
Ellis, Raymond H., John C. Bennett, and Paul R. Rassam, "Considerations in the Design of Fringe Parking Facilities," Management Controls, July 1974, pp. 135-142.
75

2206
Change-of-Mode Parking A State of the Art, An informational report of the Institute of Traffic Engineers, 1815 N. Fort Myer Drive, Arlington, Virginia 22209, January 1973.
Levinson, H. S., W. F. Hoey, D. B. Sanders, and F H. " NCHRP Report "Bus Use of Highways State of the Art,
Highway Research Board, Washington, D. C. 1973.
Wynn, 143,
The Shirley Highway Express-Bus-On-Freeway Demonstration Project Users Reactions to Innovative Bus Features, National Bureau of Standards• NTIS, June 1973.
1972 Inventory of Parking Facilities, Richmond, Va., Metro- politan Transportation Piann{ng Division, Virginia Department of Highways and Transportat'on, 1972.
1970 Census of Population and •Housing Census Tracts, Richmond, Va. Standard Metropolitan Stat'stical Area, U. S. of Commerce, Bureau of Census, 1972.
Department
Pignataro, Louis J., Traffic Engineering, Englewood Cliffs, New Jersey, 1973.
Prentice Hall, Inc.
76