plant information modelling, using artificial intelligence
TRANSCRIPT

COVER PAGE
WA School of Mines: Minerals, Energy and Chemical Engineering
Plant Information Modelling, Using Artificial Intelligence, for
Process Hazard and Risk Analysis Study
Behrouz Khabbaz Beheshti
This Thesis is presented for the Degree of
Doctor of Philosophy of
Curtin University
January 2019

i
Declaration To the best of my knowledge and belief this thesis contains no material previously published
by any other person except where due acknowledgement has been made.
This thesis contains no material which has been accepted for the award of any other degree or
diploma in any university.
Behrouz Khabbaz Beheshti
Date: 19th Jun 2019

ii
Abstract
Accidents in process plant industry, loss of lives and damages to the environment are all
showing the deficiencies of traditional design methods in process plant industry. Numerous
research in this area shows human-error, lack of knowledge, late analysis on process safety,
and improper usage of process data as some of the major causes in triggering these accidents.
In this research, the application of Information modelling, mathematical modelling, and
Artificial intelligence to reduce the risk in different phases, including design, to the operation
of process plants, were investigated. First, Semantic web and knowledge engineering was used
to create knowledge bases of process engineering diagrams. Then, new query methods were
used to study the safety in the design. Second, automation of equipment arrangement design
was investigated, using mathematical modelling of process equipment. An algorithm was
developed to study and validate all possible design scenarios. Third, an algorithm was
developed to develop all possible piping and support design in process plants. Also, machine
learning classification algorithm was used to automate the stress analysis activity. Finally,
information modelling was used to collect the data from 3D models of process plants. An
algorithm was developed to shift the ‘field weld locating’ activity, from the construction phase
to design phase and the benefits were illustrated.
This thesis makes significant contributions to applying Artificial Intelligent-based methods in
the automation of design, safety analysis, and data management in process plant industry. The
contributions includes the development of machine-readable knowledge bases, mathematical
modelling and automation of equipment arrangement and piping design, application of
machine learning in stress analysis of piping design, and shifting field-weld joint selection to
the design phase. This is the first time that each of these methods have been used in process
plant design and they all have been tested on case studies and the results have been analysed
and discussed in each chapter.

iii
Acknowledgements
I wish to thank the following persons for their support and help throughout my research.
To all my family members, colleagues and friends who persisted with me so that I could make
this research journey an effective and successful one. A special thank you to Professor Moses
Tade who firstly encouraged and motivated me to conduct this research and to Dr Hong Mei
Yao who extensively supported me in developing the chapters. Thank you to Professor
Xiangyu Wang who gave me the opportunity to start the journey with the Chemical
engineering team at Curtin University.
To my lovely wife, Dr Somaie Aali, and our daughter, our angel, Hannah who kindly supported
me to spend my time working on this study rather than spending time with them. To my parents
and brother, for their love and support. A special thanks to Mr. Ray Shaw who shared his
valuable experience in industry with me.

iv
Contents COVER PAGE .................................................................................................................................. 1
Declaration ......................................................................................................................................i
Abstract .......................................................................................................................................... ii
Acknowledgements ...................................................................................................................... iii
Contents ........................................................................................................................................ iv
List of figures ................................................................................................................................ vii
List of tables ................................................................................................................................... x
CHAPTER 1 INTRODUCTION ....................................................................................................... 1
1.1 BACKGROUND OF PROCESS PLANT ACCIDENTS, PREVENTION APPROACHES, AND INTEGRATING COMPUTER AND
DATA SCIENCE ........................................................................................................................................ 1
1.2 MOTIVATION FOR THIS WORK....................................................................................................... 2
1.3 RESEARCH METHODOLOGY .......................................................................................................... 5
1.4 RESEARCH CONTRIBUTIONS .......................................................................................................... 8
1.5 OUTLINE OF THE THESIS............................................................................................................... 9
CHAPTER 2 LITERATURE REVIEW ............................................................................................. 12
2.1 HUMAN ERROR AND DATA HANDLING IN PLANT ACCIDENTS .............................................................. 12
2.2 PROCESS HAZARD ANALYSIS METHODS IN DIFFERENT PARTS OF THE PROCESS PLANT LIFECYCLE ................. 13
2.3 ROLE OF DESIGN IN THE SAFETY OF NEW PROCESS PLANT .................................................................. 15
2.3.1 Design of equipment arrangement ................................................................................ 17
2.3.2 Piping design and piping stress analysis ......................................................................... 18
2.3.3 Design for construction safety ........................................................................................ 21
2.4 ARTIFICIAL INTELLIGENCE IN PROCESS PLANT INDUSTRY .................................................................... 21
2.5 SUMMARY .............................................................................................................................. 23
CHAPTER 3 LOGIC-BASED KNOWLEDGE REPRESENTATION FOR HAZARD IDENTIFICATION IN
PROCESS PLANTS ........................................................................................................................... 24
3.1 INTRODUCTION ....................................................................................................................... 24
3.2 CREATING MACHINE-READABLE FORMATS OF P&IDS ...................................................................... 26
3.3 DEVELOPING THE KNOWLEDGE BASE-INCLUSION OF OTHER DRAWINGS ............................................... 30
3.4 DEVELOPING THE KNOWLEDGE BASE-INTEGRATING OF HUMAN KNOWLEDGE ....................................... 31
3.5 NO-SQL INFERENCING ............................................................................................................. 34
3.6 CASE STUDIES .......................................................................................................................... 36
3.6.1 Phillips disaster ............................................................................................................... 36
3.6.2 Acid transfer line ............................................................................................................ 40
3.7 DISCUSSION ............................................................................................................................ 45
3.8 CONCLUSIONS AND FUTURE WORK .............................................................................................. 46
v
CHAPTER 4 AUTOMATION OF EQUIPMENT ARRANGEMENT AND DESIGN VALIDATION IN
PROCESS PLANTS ........................................................................................................................... 48
4.1 ALGORITHM AND PRELIMINARY DATA EXTRACTION ......................................................................... 48
4.2 MATHEMATICAL MODELING OF PROCESS EQUIPMENT ..................................................................... 50
4.2.1 Creating spatial point coordination ................................................................................ 50
4.2.2 Creating equipment data matrix .................................................................................... 52
4.2.3 Critical spatial points ...................................................................................................... 54
4.2.4 Adding more meta-data ................................................................................................. 55
4.2.5 Modeling scenarios......................................................................................................... 55
4.2.6 Combining matrices ........................................................................................................ 57
4.3 ALGORITHM VALIDATION ........................................................................................................... 58
4.3.1 Clash check ..................................................................................................................... 58
4.3.2 Safety distance check ..................................................................................................... 59
4.3.3 Parallel equipment arrangement check ......................................................................... 61
4.4 CASE STUDY – PROCESS FLOW DIAGRAM ....................................................................................... 62
4.5 CASE STUDY-COMPLETE PLANT ................................................................................................... 66
4.6 SUMMARY AND DISCUSSION ....................................................................................................... 69
CHAPTER 5 AUTOMATION OF PIPING AND STRESS ANALYSIS .................................................. 70
5.1 AUTOMATION OF PIPING DESIGN AND SUPPORTING ........................................................................ 70
5.1.1 Generating possible pipe routes ..................................................................................... 72
5.1.2 Determination of elbow number and location ............................................................... 76
5.1.3 Piping support combination ........................................................................................... 77
5.2 MACHINE LEARNING FOR STRESS ANALYSIS .................................................................................... 79
5.2.1 Prediction model formulation ......................................................................................... 80
5.2.2 Machine learning algorithm: gradient boosting method ............................................... 83
5.3 CASE STUDY ............................................................................................................................ 85
5.3.1 Data generation ............................................................................................................. 86
5.3.2 Explanatory data analysis .............................................................................................. 89
5.3.3 Accuracy verification ...................................................................................................... 92
5.3.4 Stress analysis prediction result ..................................................................................... 96
5.4 CONCLUSIONS ......................................................................................................................... 98
CHAPTER 6 PROCESS INFORMATION MODELLING FOR SAFE PIPING INSTALLATION FOR
PROCESS PLANTS ......................................................................................................................... 100
6.1 PIPING INSTALLATION AND FIELD FIT-UP WELDS ............................................................................ 100
6.2 METHODOLOGY DEVELOPMENT ............................................................................................... 102
6.2.1 Information gathering from 3D model ......................................................................... 102

vi
6.2.2 Creating Field Weld Points ........................................................................................... 105
6.2.3 Spool dimension check for transportation .................................................................... 107
6.2.4 Weld point distance from ground ................................................................................. 110
6.2.5 Choosing the best combination .................................................................................... 110
6.3 CASE STUDY .......................................................................................................................... 111
6.4 COMPLEXITY ANALYSIS OF THE ALGORITHM ................................................................................. 117
6.5 CONCLUSIONS ....................................................................................................................... 117
CHAPTER 7 CONCLUSIONS AND RECOMMENDATIONS .......................................................... 118
7.1 CONCLUSIONS ....................................................................................................................... 118
7.2 RECOMMENDATIONS .............................................................................................................. 119
References ................................................................................................................................. 121

vii
List of figures Figure 1-1: Thesis structure ................................................................................................... 11
Figure 2-1: Cause-and-effect diagram: role of design in process plant accidents ................. 15
Figure 2-2: Cause-and-effect diagram: accidents during field fit-up welding ....................... 16
Figure 2-3: Cause-and-effect diagram: project behind schedule ........................................... 17
Figure 2-4: Piping design and stress analysis workflow ........................................................ 20
Figure 3-1: Expert System for hazard identification .............................................................. 25
Figure 3-2: Sample P&ID (“Autodesk AutoCAD Plant 3D” 2014) ...................................... 26
Figure 3-3: Tabular to triple conversion ................................................................................ 27
Figure 3-4: Conversion of header titles to proper ontology predicates .................................. 27
Figure 3-5: Ontology development in Protégé ....................................................................... 27
Figure 3-6: P&ID, extracted tabular data, and the ontology diagram .................................... 28
Figure 3-7: Setting rules for the properties ............................................................................ 29
Figure 3-8: Sample mechanical datasheet, extracted data, and ontology graph .................... 30
Figure 3-9: Linked data graph ................................................................................................ 31
Figure 3-10: Machine-readable knowledge base from human natural language ................... 32
Figure 3-11: Combination of knowledge bases ..................................................................... 33
Figure 3-12: SPARQL query from knowledge base .............................................................. 35
Figure 3-13: P&ID100 for case study 1: Line connected to high-pressure tank .................... 36
Figure 3-14: Graphical representation of the P&ID Ontology ............................................... 37
Figure 3-15: Revised P&ID ................................................................................................... 40
Figure 3-16: P&ID 200 and the extracted data for case study 2 ............................................ 41
Figure 3-17: Graphical representation of the ontology .......................................................... 41
Figure 3-18: Original and revised P&ID ................................................................................ 44
Figure 3-19: Creating a comprehensive knowledge base ...................................................... 46
Figure 4-1: Flowchart for equipment arrangement and validation ........................................ 48
Figure 4-2: Preliminary equipment dimensions from PFD .................................................... 49
Figure 4-3: Spatial data points of a pump .............................................................................. 50
Figure 4-4: Inward spiral vs. coil-shaped guideline for mathematical modeling ................... 51
Figure 4-5: Process equipment spatial point coordination with respect to base point and
rotation in the layout area ...................................................................................................... 52
Figure 4-6: Data matrix vs. limited data of an object ............................................................ 53
Figure 4-7: Points and matrix................................................................................................. 53
Figure 4-8: Nozzles on spatial point graph of the equipment ................................................ 55
Figure 4-9: Operation and maintenance areas ........................................................................ 55
Figure 4-10: Sample scenarios for the base point of a process equipment ............................ 56
Figure 4-11: Two scenarios of the same equipment and their data matrices ......................... 57

viii
Figure 4-12: Sample scenario with five different process equipment .................................... 57
Figure 4-13: Clash between two equipment .......................................................................... 59
Figure 4-14: Equipment spacing (safe distance) matrix ........................................................ 60
Figure 4-15: Distances between “border” points ................................................................... 61
Figure 4-16: Parallel equipment ............................................................................................. 62
Figure 4-17: Process flow diagram ........................................................................................ 63
Figure 4-18: Selected part of the PFD for automatic equipment arrangement ...................... 63
Figure 4-19: Data flow and algorithm .................................................................................... 64
Figure 4-20: Scenario 1 .......................................................................................................... 65
Figure 4-21: Scenario 2 .......................................................................................................... 65
Figure 4-22: Scenario 3 .......................................................................................................... 65
Figure 4-23: Complete plant scenario 1 ................................................................................. 66
Figure 4-24: Complete plant scenario 2 ................................................................................. 67
Figure 4-25: Complete plant scenario 3 ................................................................................. 68
Figure 5-1: From traditional to automated design–analysis workflow .................................. 71
Figure 5-2: Two equipment, two nozzles in a 3D environment ............................................. 72
Figure 5-3: 3D grid pattern between two nozzles .................................................................. 72
Figure 5-4: Specifying two pipe sections for two equipment: Constraint in axis and direction
............................................................................................................................................... 74
Figure 5-5: Possible route from exchanger to pump .............................................................. 75
Figure 5-6: Another possible route from exchanger to pump ................................................ 76
Figure 5-7: All the points on the pipe route ........................................................................... 77
Figure 5-8: Two possible support design for the same pipe route ......................................... 78
Figure 5-9: Creating prediction model with GBM and using it to predict the stress analysis
result of new pipe routes ........................................................................................................ 81
Figure 5-10: Boosting for decision trees ................................................................................ 85
Figure 5-11: Extending the training dataset by rotating the pipes around the gravity axis .... 86
Figure 5-12: Effect of number of elbows on pipe failure rate ................................................ 89
Figure 5-13: Effect of number of pipe supports on failure rate ............................................. 90
Figure 5-14: Effect of number of “Shoe” supports on failure rate ......................................... 90
Figure 5-15: Effect of number of “Guide” supports on failure rate ....................................... 91
Figure 5-16: Effect of head-to-tail distance on failure rate .................................................... 92
Figure 5-17: Ten most important variables in predicting stress analysis result ..................... 94
Figure 5-18: GBM tuning parameter results .......................................................................... 95
Figure 6-1: Wrong position of pipe and adjustment required in piping ............................... 101
Figure 6-2: Alternative schedule .......................................................................................... 102
Figure 6-3: Algorithm to choose the best combination of welding points ........................... 103

ix
Figure 6-4: Creating matrices for each pipe ......................................................................... 104
Figure 6-5: Developing matrices for each spool .................................................................. 105
Figure 6-6: Two different welding combinations for one pipe ............................................ 106
Figure 6-7: Spool length-to be checked with shipping box dimension ................................ 108
Figure 6-8: Important dimensions on a flat-bed truck ......................................................... 109
Figure 6-9: Naphtha hydro treater unit ................................................................................ 112
Figure 6-10: Part of the process plant-15 pipes chosen for the analysis .............................. 112
Figure 6-11: Sorted number of hours working at height ...................................................... 114
Figure 6-12: Sorted number of meters climbing of the scaffolding ..................................... 115
Figure 6-13: Decrease in productivity ................................................................................. 116
Figure 6-14: Increase in the cost of the project .................................................................... 116
Figure 6-15: Complexity analysis ........................................................................................ 117

x
List of tables Table 2-1: Number of fatalities in construction (F. Khan, Rathnayaka, & Ahmed, 2015) .... 21
Table 3-1: Natural language to description logic ................................................................... 32
Table 3-2: OCNL and DL conversions of natural language .................................................. 33
Table 3-3: OWL format from OCNL and DL formats .......................................................... 33
Table 3-4: SWRL from natural language to DL format ......................................................... 34
Table 3-5: Query in natural language and SPARQL ............................................................. 35
Table 3-6: Query from natural language to SPARQL, using OCNL ..................................... 35
Table 3-7: Triples converted to DL format ............................................................................ 37
Table 3-8: Encoding general knowledge-from OCNL to DL ................................................ 37
Table 3-9: From SWRL in natural language to DL format .................................................... 38
Table 3-10: Query about P&ID safety ................................................................................... 39
Table 3-11: Query result: Line connected to high-pressure tank ........................................... 39
Table 3-12: Conversion of certain OCNL expressions into DL format ................................. 42
Table 3-13: Engineering knowledge, from natural language to DL ...................................... 43
Table 3-14: Query from P&ID-Acid transfer line.................................................................. 43
Table 3-15: Query results: Acid transfer line ......................................................................... 44
Table 5-1: Piping stress analysis dataset ................................................................................ 87
Table 5-2: Variables in the dataset ......................................................................................... 88
Table 5-3: Variable importance level: result of GBM model ................................................ 93
Table 5-4: Results of running GBM prediction model on test dataset ................................... 96
Table 5-5: Final test dataset ................................................................................................... 97
Table 5-6: Prediction of test dataset ....................................................................................... 98
Table 6-1: Welding points information for 15 chosen pipes ................................................ 113

1
Chapter 1 Introduction
1.1 Background of process plant accidents, prevention approaches, and
integrating computer and data science
The process industry is considered a hazardous industry for both human lives and the
environment. Accidents in process plants occur in different stages of the plant lifecycle:
construction, pre-commissioning, commissioning, operation, shutdown, and maintenance.
There are various traditional methods for preventing accidents, depending on the nature of the
potential hazards. Process hazard analysis (PHA) is one of the major approaches to accident
prevention. A review of catastrophic process plant accidents from the past two decades reveals
the importance of applying PHA in the early stages of the project (i.e., basic design).
Studies in this area show that limited time, budget, human resources, and knowledge are some
of the obstacles facing a comprehensive analysis in the early stages of design. Because there
is a near-zero chance in increasing the available time and budget, new technologies should be
sought and integrated to assist in this area.
With new improvements in computer hardware and software systems, artificial intelligence
(AI), knowledge engineering (KE), and expert systems (ESs) are developing and emerging in
different fields. These new technologies can be used to increase the safety of process plants in
the different stages of their lifecycle.
A more recent definition of AI is about creating models to understand the past and predict the
future. New core aspects of AI, including machine learning (ML), are introducing smarter
ways of creating models, in which the algorithms are not generated by human beings, but by
the machine itself. This approach has the capability to replace traditional methods in which
predicting the accidents in process plant requires a time-consuming approach and developing
algorithms is difficult.
One of the new transitions in technology is from the information/data science field to KE.
Although proper use of data and their analysis provides powerful tools, KE is able to create
new leverage in different fields and it is not possible to develop them with pure data science
approaches. On the contrary, human knowledge, in the form of human language, is required
to be used for any machine-based analysis. Ontology-based platforms in KE are the basis for
converting human knowledge into machine-readable knowledge. Different software systems
in the process plant industry are constantly generating data, which presents the opportunity to
use KE in this field, to create knowledge-based systems toward a more advanced PHA.
2
The powerful reasoning capabilities of KE systems, integrated with the automated
programming possibilities of ML, are paving the way toward developing ESs to enrich safety
analysis in the basic design phases of a process plant project. These ESs can be useful in
preventing accidents in the commissioning, construction, operation, shutdown, and
maintenance of process plants, by reviewing the design in the basic stages.
The link between the process plant industry and AI, KE, and finally, ES, is established through
the proper use of data, information, and knowledge in this field. Owing to a new set of software
systems for different design stages of process plants (e.g., process analysis, plot plan
development, detailed design 3D modeling, and mechanical stress analysis), it is now possible
to access the required data in the early stages of a new project or to use data from existing
projects. Extracting, exporting, saving, and importing the data from the first stages of the
project is the key in developing ESs in this industry.
1.2 Motivation for this work
Recent accidents in the process plant industry, the loss of many lives, and irreparable damage
to the environment demonstrate the unfortunate failure of human beings and the traditional
methods of designing safe process plants for their whole lifecycle. The lessons learnt from
these accidents and numerous studies in this area reveal some major causes triggering these
accidents; for example, human-error, lack of knowledge, late analysis of process safety, and
improper usage of process data. Integrating new technologies in AI with existing design
methodologies, especially in the basic design phase, could be a proper approach to dealing
with safety concerns in process plant industry.
However, following challenges face the development of this method:
• In order to use AI and KE in the methods of process safety analysis, all the data from
the different process analysis platforms should be converted into one similar format.
Additionally, human knowledge, in the form of human-natural-language, should be
changed into a machine-readable language. The combination of process data and the
machine-readable language (i.e., knowledge) should be the input for an analysis
platform. This analysis platform will be a knowledge-based ES for PHA.
• With a knowledge-based system for process safety analysis, a parallel query system is
required to check different safety aspects in the piping and instrument diagram (P&ID)
or process flow diagram (PFD) of the plant in the basic design/conceptual phase of the
project. The query language should be able to interpret safety questions in the form of
human language, verify the knowledge base, and answer the query in a human-
readable format.

3
• Along with the PFD, the plot plan and equipment arrangement are the most important
deliverable documents in the basic phase of the project. They can also have a vital role
in reducing the potential for hazard in the lifecycle of the plant. With a limited time in
this phase, the equipment arrangement drawing should be developed as the basis for
the architecture of the plant. In developing this important drawing, a combination of
human knowledge and the project specifications is crucial. Additionally, with the
number of equipment and the process plant area, there are thousands of possible
equipment arrangement combinations for each plant. This is again the human
knowledge and project specifications that filter out the approved combinations. In
order to have a parallel safety analysis system, an ES is required to automatically
design all the possible options for the equipment arrangement in a 2D environment
and verify the human knowledge and specifications simultaneously. Developing such
an automated system requires a platform to automatically design each equipment
arrangement option. Data from the PFD should be used as a database for this platform.
Moreover, safety knowledge and specifications (knowledge-base) should be imported
as a part of the platform. Finally, an automated loop is required to read data from the
PFD database, design the equipment arrangement, check the design with the
knowledge base, and filter out the approved arrangements.
• Because automation in the design of the equipment arrangement and parallel safety
checking is proposed here, automation in the other design and analysis stages should
be considered to reduce the design time and provide opportunities to perform the PHA
on different design options. Piping route design, piping supporting, and mechanical
stress analysis are the activities linked to the equipment arrangement. Any change in
the equipment arrangement drawing implies that the piping route and piping support
should be changed, and the mechanical stress/pipe flexibility should be checked for
critical lines (i.e., piping lines with high temperature, pressure, or connected to rotary
equipment). Engineering software (e.g., CAESAR II) has been used for stress analysis
activities in process plant design for approximately 10 years. This process requires the
piping route and piping supports to be modeled in the analysis software after any
change in the design of the plant. Achieving the main goal, which is to develop
different design options and parallel safety analysis, is in contradiction with the time-
consuming nature of this analysis method. Therefore, a better method is required to
replace the design–analysis loop and the traditional use of analysis software. Existing
databases of analyzed routes provide the opportunity to consider ML approaches to
develop a predictive model to solve this issue and to reduce the amount of time
required for design-analysis purposes.

4
• One of the other major potential sources of accidents in the process plant industry is
its complex construction process, especially in piping installation. The traditional
method involves generating a piping isometric drawing from a 3D model and sending
it to the construction office. As in the design stage, there is a constraint time specified
for the construction process. A lack of time, resources, software platform, and
improper use of data are the reasons for accidents during piping installation and
erecting the necessary scaffoldings. The “design for construction safety” concept,
which is used in other construction fields, can be used here to prevent accidents.
Applying this safety concept requires the schedule to be shifted back to the design
phase. In other words, it requires the planning for piping installation to be shifted to
the detailed design phase of the project. In order to achieve this, a knowledge-based
ES should be integrated into the detailed design platform. Additionally, construction
knowledge and safety concerns should be imported to this platform as the knowledge
base. This combination should generate piping isometric drawings, which are ready
for a safe assembly and scaffolding process.
These challenges pose the following questions:
What type of machine-readable format is suitable to represent process data?
How can human knowledge and engineering specifications be converted into a
machine-readable format?
What is the platform to combine process data with human knowledge and engineering
specifications to create a knowledge-based system?
What is the query language to verify the safety of process design?
How can the data from the P&ID and PFD be used in an automatic generation of the
equipment arrangement?
What is the platform and programming language to automatically generate equipment
arrangements?
How is human knowledge integrated as a part of the programming algorithm to check
the equipment arrangement design?
What is the database (i.e., “training” data) for creating the ML platform and a
predictive model?
How is the piping design and piping support information automatically analyzed in
the predictive model?
How can the “design for construction safety” concept be applied in the process plant
industry?
5
This research was conducted to address these questions.
1.3 Research methodology
The overall goal of this project is to increase safety in the process plant lifecycle by integrating
automation tools and AI methods in basic design, hazard analysis, KE, and data gathering. To
achieve this goal, the following studies were carried out:
1) Automation in P&ID safety analysis/HAZOP study:
• Developing a machine-readable source for human knowledge and engineering
specification: to be able to use human knowledge and engineering specification in
a knowledge-based ES and for the machine to compare the process design with
the traditional human-readable knowledge.
• Developing conversion tools for process engineering data: to make process data
readable for the machine in the knowledge base system.
• Integrating machine-readable knowledge base and process data in an expert
system: to combine both data and knowledge in one platform for safety analysis
purposes.
• Developing a query platform for automatic safety analysis: to make enquiries
about safety concerns in the design of the PFD or P&ID.
2) Automation of equipment arrangement and piping design:
• Developing a database from process diagrams: to have the required input data for
automatic design platform.
• Mathematical modeling of each process equipment: to have a mathematical model
of each equipment.
• Mathematical modeling of all possible equipment arrangements: to identify
different possible equipment arrangements.
• Converting human knowledge and project specifications to applicable rules on
mathematical models of arrangements: to be able to automatically apply human
knowledge and project specifications to different mathematical models of
arrangements.
3) Automation of pipe routing and stress analysis:
• Mathematical modeling of pipe routes: to identify different possibilities of pipe
routes between two equipment in the arrangement.
• Developing a machine-learning-based predictive model for stress analysis: to
automatically check the safety and operability of the pipe under high temperature
and pressure.

6
4) Design for safe construction in process plants:
• Data collection from 3D detail design models: to create a database for construction
safety analysis in the design phase.
• Mathematical modeling of 3D model data: to have a model for applying
construction safety rules.
• Applying construction safety rules to the mathematical model: to reject the models
with low safety aspects within them.
The detailed research methodology to target the above objectives is outlined below:
1) Machine-readable human knowledge
This involves the conversion of human-readable knowledge and specifications into a machine-
readable format for automation purposes in safety analysis. Human knowledge and
engineering specifications have traditionally been stored in a human-readable format. Current
research on natural language processing (NLP) and KE is proposing new methods on
generating machine-readable knowledge. Creating ontologies for the machine to understand
the semantics of this field is the first major step in this phase. An approved knowledge and the
latest engineering specifications can be generically generated and used in other projects
without the necessity for regeneration. The interoperability of this knowledge base can be set
as one of its features by following ISO 15926 chapters.
2) Process design data
The PFD and P&ID are not simply process engineering drawings, they can also be considered
as engineering databases, which can be linked to other datasets or used for analysis purposes.
This part of the study addresses the automatic generation of databases from these diagrams. It
not only creates a database for linkage and analysis but also saves the time for future references
and prevents human error in reading and interpretation the diagram, which could lead to
disastrous decision-making in different phases of the project.
3) Integrating process data and machine-readable knowledge
Automation of safety analysis with respect to engineering specifications and human
knowledge is impossible without combining the machine-readable process data and
knowledge base. In this part of study, an ontology-based platform is used for combining these
two datasets. This platform is where these datasets are linked and communicate with each
other. Because this dataset follows a standard format, interoperability is one of its features and
is able to link to other datasets from other projects.
7
4) Query platform
Safety analysis of process diagrams and data extracted from the knowledge base is possible
through using a query language that can read and interpret it. The nature of this query language
is essentially similar to traditional database query languages, such as SQL. The difference is
in the power of this language in understanding semantics. This query language has been used
to compare the process data and knowledge base to identify possible flaws in the design.
5) Mathematical models of process equipment
Automation of equipment arrangement requires a mathematical model of each process
equipment. The basic data for this modeling is gathered from the process diagrams. Process
equipment models are spatial point-based matrices of each equipment and they include all the
required data about each equipment for equipment arrangement purposes. The benefit of
converting the process equipment to these mathematical models is that it allows their use in
the automation algorithms.
6) Human knowledge, project specification, and automation of equipment
arrangement
This stage is about developing automation algorithms for equipment arrangement.
Mathematical models of all process equipment and the process layout are the input data for
the algorithm. The developed algorithm generates mathematical models of all possible
equipment arrangements and the knowledge base, as a part of the algorithm and the resulting
code, filters the approved list of equipment arrangement models. The algorithm then converts
the approved equipment arrangements from mathematical models into human-readable
engineering diagrams for other uses in the lifecycle of the plant.
7) Automation of piping design
Extending the automation capabilities in process plants requires the automation of piping
design to be added to the automation of equipment arrangement design. At this stage, an
algorithm is developed to design all the possible 3D routes between two points. It generates
the number of elbows, and their location in each possible route. It should be considered that it
is not possible to filter the “best” pipe routes without pipe supporting and mechanical stress
analysis. This algorithm should be combined with another automation platform for stress
analysis (especially for critical lines with high pressure and temperature during testing and
operation) to be able to generate the best list of possible piping routes.

8
8) Automation of stress analysis:
Stress analysis is another major activity that should follow each equipment arrangement,
piping, and support design. This especially is the case for the lines that are under high pressure
and temperature during testing or operation. Overlooking this part of the design may lead to
catastrophic accidents during the operation or hydro-testing of lines. Because this activity
creates a time-consuming loop in the design phase, and it is normally considered an expensive
task, this part of the study is dedicated to developing an automatic method of stress analysis.
To achieve this, a number of different pipe routes and their stress analysis are used as the
training dataset of an ML algorithm and a predictive model is developed to predict the analysis
result of any change in the existing routes. For any changes in the equipment arrangement, the
route, and the location of pipe supports, the predictive model provides an analysis to determine
whether route remodeling is needed. This avoids running the model on the analysis software.
Automaton of piping stress analysis is the last step in the automation process, from equipment
arrangement to piping design.
9) Design for safe construction
Shifting the planning activities from the construction phase to the design phase of the project
is one of the recent approaches in reducing casualties in the construction of a process plant.
One major time-consuming activity during the construction is planning the field-fit-up
welding. At this stage of the study, a mathematical model of piping routes is developed form
the 3D model data. An algorithm generates a mathematical model of the required scaffolding
for the piping model. Safety criteria are input as a knowledge base to the algorithm. The
algorithm then generates all possible field-fit-up weld options and chooses the safest set of
field weld points in the design phase.
1.4 Research contributions
This thesis makes significant contributions to applying AI-based methods and cutting-edge
technologies in the automation of design, safety analysis, and data management in the process
plant industry.
The first contribution is the development of machine-readable knowledge bases for safety
analysis in the process industry. This is the first time that such a new field in computer and
data science (semantic technology and KE) is used in safety analysis in the chemical
engineering field. Combining process data, human knowledge, and engineering specifications
in a knowledge-base and developing a query platform to automate/assist in the safety analysis
minimizes the required time for safety analysis, minimizes human error, and also provides the
opportunity for process engineers to try different sets of process diagrams.

9
Another contribution is the development of mathematical models of process equipment and
algorithms to automatically design equipment arrangements, piping routes, and supporting,
and to choose the best models according to the knowledge and engineering specifications
integrated with the algorithms. There have been very few attempts to automate the design in
this field and there has been no success in developing a comprehensive algorithm that fully
integrates human knowledge, best engineering practices, and project specifications in its flow.
The type of mathematical models and the number of details therein, as well as the combination
of knowledge-base in the flowchart in this study minimize the time required for trying different
equipment arrangements and piping designs in the process plant, maximize the time for safety
analysis (e.g., hazard and operability (HAZOP) study), and can add other variables (e.g.,
economic variables) into the list of variables in the design automation process.
The third contribution is the application of an ML algorithm in mechanical stress analysis.
Automation of equipment arrangement, piping, and support design without the automation of
stress analysis would be a no-value-added attempt in this field. Every design should go through
stress analysis (especially for high-pressure/temperature services) before approval for
construction or operation. This is the first time that an AI-based automatic stress analysis
method with ML is introduced in the process industry. The success of this method, along with
the automation of equipment arrangement and piping design will optimize the material use,
reduce human error, and increase the time for process safety analysis, which are all highly
significant benefits to the process industry.
Another contribution is the shift of a series of activities from the construction to the design
phase to increase safety in construction. The traditional method of specifying field-weld points
in the process industry includes the usage of piping isometric drawings in the construction
phase of the project. A lack of data and usual shortage of time in the construction phase
normally lead to human errors and loss of lives during piping assembly, as well as low-quality
welding, which may lead to future leaks of dangerous materials during operation. This is the
first time that such activity is proposed to be shifted to the detailed design phase of the project.
This method benefits from the 3D model data in the detailed design phase, and it can reduce
the human error and number of casualties during the construction phase and increase the
quality of the piping installation for safe operation in the lifecycle of the plant.
1.5 Outline of the thesis
The structure of the thesis is summarized in Figure 1-1. Each chapter in Chapters 3–6 covers
one of the four research contributions. The interactions of the sections are shown by arrows.
The thesis is organized into a total of seven chapters.

10
Chapter 1 provides introductory material and gives the perspective of using AI-based methods
in the process industry and motivations of the study. This chapter also discusses the problems
and required investigations, and finally highlights the contributions of this thesis.
In Chapter 2, a literature review of the accidents in the lifecycle of process plants, human
error, importance of data, automation of design, and new application of AI-based methods in
the process plant industry is presented. This chapter also thoroughly covers the gaps in the
current state of research on AI in the process plant industry and the plan for further needed
research.
The challenges in developing applications with KE and semantic web technology to automate
safety analysis in process plants are discussed in Chapter 3. An application has been developed
on two different platforms and it is tested on a real case study, which highlights the
contribution of this chapter and illustrates the potential for industrial usage of these platforms
for automatic safety analysis in the basic phases of the process plant design.
In Chapter 4, an algorithm for the mathematical modeling of process equipment, integration
of human knowledge and engineering specifications, and finally, automation of equipment
arrangement is discussed. The algorithm is implemented and tested to automatically design a
part of a naphtha hydro-treater process plant as a case study. The accuracy of the design and
its conformity to the human knowledge and project specifications is discussed; moreover, its
possible contribution to the design automation of other larger process plants and its error
detection capabilities in existing designs are illustrated.
Developing an algorithm for piping design automation and using ML for the automation of
stress analysis is discussed in Chapter 5. The algorithm verifies all the possible routes and
piping supports between two points (equipment nozzles) in 3D space and automatically
verifies the analysis without any analysis software. In developing this prediction model for
stress analysis, a database of piping routes with their analysis results was used along with the
gradient boosting algorithm to identify the statistically important features in the stress analysis.
Additionally, the possible integration of this method in real industrial scenarios was discussed
in this chapter to reduce the required design time and the human error.
Chapter 6 is about developing an algorithm to shift some of the activities in the construction
of process plants to the design phase. This algorithm gathers data from 3D information models
and provides the best approach for scaffolding and pipe fit-up welding for the construction
phase of the project. A case study is used to illustrate the benefits of using this algorithm to
increase safety and efficiency in process plant construction.

11
Chapter 7 concludes the research based on the results from each chapter and makes
suggestions for future research.
Plan
t inf
orm
atio
n m
odel
ling,
usin
g A
rtifi
cial
Inte
llige
nce,
for
proc
ess h
azar
d an
d ri
sk a
naly
sis st
udy
C1-
Intr
oduc
tio
n to
A
rtifi
cial
In
telli
gen
ce-b
ased
m
etho
ds
in p
roce
ss
indu
stry
C2-
Lite
ratu
re
Rev
iew Acc
iden
ts in
pr
oces
s in
dust
ry
Hum
an E
rror
Impo
rtanc
e of
da
ta
Aut
omat
ion
of d
esig
n
AI i
n pr
oces
s in
dust
ry
Cur
rent
gap
s
C3-
Log
ic-
base
d sy
stem
s fo
r ha
zard
an
alys
is Kno
wle
dge
engi
neer
ing
Dat
a fr
om
engi
neer
ing
draw
ing
Hum
an
know
ledg
e in
na
tura
l la
ngua
ge
Con
trolle
d N
atur
al
Lang
uage
Des
crip
tion
Logi
c an
d Se
man
tic w
eb
Kno
wle
dge
base
Logi
c-ba
sed
quer
y sy
stem
s
Que
ry
syst
em fo
r ha
zard
an
alys
is
C4-
Aut
omat
ion
in d
esig
n of
eq
uipm
ent
arra
ngem
ent D
ata
colle
ctio
n fr
om P
FD
Mat
hem
atic
al
mod
el
Enco
ding
en
gine
erin
g sp
ecifi
catio
n
Gen
erat
ing
all
poss
ible
ar
rang
emen
ts
Shor
tlist
ing
appr
oved
ar
rang
emen
ts
Add
ing
furth
er fi
lters
C5-
Aut
omat
ion
of p
ipin
g de
sign
an
d st
ress
an
alys
is
Dat
a co
llect
ion
from
eq
uipm
ent
arra
ngem
ent
Mat
hem
atic
al
mod
el
Gen
erat
ing
all
poss
ible
pip
e ro
utes
Gen
erat
ing
all
poss
ible
pip
e su
ppor
ting
Col
lect
ing
data
from
100
pi
pe ro
utes
Stre
ss
anal
ysis
of a
ll pi
pes
Mac
hine
le
arni
ng
algo
rithm
Anal
ysis
Aut
omat
ic s
tress
an
alys
is re
sult
C6-
Safe
ty
in p
ipin
g as
sem
bly
Dat
a co
llect
ion
from
3D
m
odel
Spec
ifyin
g fit
-up
poin
ts
Gen
erat
ing
all
poss
ible
sc
enar
ios
App
lyin
g sa
fety
filte
rs
on sc
enar
ios
Shor
tlist
ing
appr
oved
Sc
enar
ios
C7-
Con
clus
ion
and
futu
re
wor
k
Figure 1-1: Thesis structure

12
Chapter 2 Literature review
The process plant industry faces catastrophic accidents with irreversible consequences for
human beings and the environment. The number of casualties and the cost of damage resulting
from incidents in the process plant industry have been significant. Some of examples area
follows: the Flixborough incident in 1974 with 450 million dollars lost and 28 deaths, Piper
Alpha accident in 1987 with 300 million dollars in damage and 167 deaths, and the BP disaster
in 2005 in the US with 1.5 billion dollars in damage, 15 deaths, and 180 people injured.
In this chapter, a literature survey is conducted to review the impact of human error in PHA
and in the design of process plants. The importance of equipment arrangement and pipe
routing/analysis is also discussed. Subsequently, previous efforts in automating equipment
arrangement and pipe routing/analysis are highlighted and the application of AI in the design
and safety analysis of process plants is presented.
2.1 Human error and data handling in plant accidents
Human error has been identified as the root cause for many process plant accidents, such as
Esso Australia’s gas plant and Piper Alpha on the British continental shelf (Murphy, 2009).
This factor has been thoroughly discussed by (Skogdalen & Vinnem, 2012) for the oil and gas
industry. Human error can be traced as the cause in all these industrial disasters (Lundteigen
& Rausand, 2008; Skogdalen & Vinnem, 2011, 2012). Studies on human reliability
(Rasmussen, 1997) and human factors (Gould, Ringstad, & van de Merwe, 2012) in such a
vulnerable industry are of great value (Skogdalen & Vinnem, 2011). Human error probability
and human reliability can be quantified (Kujath, Amyotte, & Khan, 2010) and estimated by
referring to operational experiences (Abbassi et al., 2015), dynamic Bayesian networks
(Preischl & Hellmich, 2013), and databases (Cai et al., 2013).
Data communication and communication among members of the team are important activities
in different parts of the lifecycle of a process plant. It is crucial for the safety of the plant to
use the proper means of communication and data transfer in every stage of the project. Many
accidents in the process plant industry occur because of a lack of proper communication among
teams involved in the design of the plant (Kariuki & Löwe, 2007). A shortage of time for error
detection and modification is another factor of process plant accidents (Kletz, 2009). It has
also been considered as a major reason for incomplete application of health and safety
management in the industry (Williams, 2015).

13
Data play a major role in every step of decision-making (Berg, Gersinska, & Sievers, 2010).
However, inappropriate handling of data during querying, integrating, and interpreting causes
human error.
Proper interoperability has a critical role in the competitive environment in which owners of
capital facilities try to achieve lower costs in managing their facilities during their lifecycles
(Gallaher, O’Connor, Dettbarn, John L, & Gilday, 2004). Different parties typically use
different sets of words, terminology, and data formats (Eweje, Turner, & Müller, 2012), which
prevents information interoperability. It is important for everyone involved in the information
network to use the same “ontology” for the sake of interoperability.
Vendors and manufacturers involved in the design and construction of process plants use their
own specific software to produce engineering drawings and documents. These drawings are
only human-readable and cannot be considered as a database. It is the responsibility of the end
user to read and interpret data from these drawings, reach a reasonable conclusion, and make
correct decisions.
Traditional database systems (relational databases in particular) choose different schemas
according to their database management system (DBMS). Every time users change the data,
the database is updated, but it does not guarantee the change in any other databases, as they do
not use the same database schema. It should also be noted that a major change in the data
requires the whole schema to be changed. (Chapman, 2005) shows that relational database
systems currently face major challenges in an era in which every industry is using big data
with dynamic entry and access.
There is always great potential for human error in traditional data capturing (Murphy, 2009).
Traditional database systems, especially relational databases, use SQL-based query languages.
However, these databases cannot cope with the nature, amount, and variety of data in the
process plant industry. Moreover, such databases are not capable of storing human knowledge
(in the form of human natural language) for querying and reasoning purposes. The lack of this
capability is the reason for their weak reasoning platforms. A good database requires the whole
set of knowledge to achieve the best results when queried.
2.2 Process hazard analysis methods in different parts of the process plant
lifecycle
(Shariff & Zaini, 2013) have thoroughly reviewed the history of process plant accidents and
discussed previous and future studies to reduce/mitigate the incidents in this field.

14
Depending on the phase of the project, there are different methods in the hazard analysis of a
plant. One of the most common methods is PHA, which has various sub methods. HAZOP is
a well-known method of PHA that is still widely used in various existing and new process
plants, and a thorough literature review has been presented by (Hinze & Teizer, 2011).
Another method of safety checking, especially for the operation of high-temperature/pressure
pipes, is using analysis software during the plant design. Common software packages for
piping stress analysis in the industry include CAESAR II (by coade), AutoPIPE (by Bentley),
and CAEPIPE (by sstusa).
Although methods such as HAZOP (Dunjó, Fthenakis, Vílchez, & Arnaldos, 2010a) and
systemic safety management system (SSMS) (Dunjó, Fthenakis, Vílchez, & Arnaldos, 2010b)
have been applied or proposed to increase safety in process plants, they are still not able to
prevent accidents from occurring (Santos-Reyes & Beard, 2009). Traditional methods
consider safety after the completion of the design (Fabiano & Currò, 2012); moreover, PHA
lacks rule-based human experience from previous studies and accident analysis information in
their databases (Hurme & Rahman, 2005). Market competition is forcing industries to balance
the investments in safety with productivity (Suardin, Mannan, & El-Halwagi, 2007). A study
has shown it is cheaper to apply safety in the early stages of the design (Houssin & Coulibaly,
2011).
Traditional PHA and HAZOP studies are time-consuming methods (Wang, Gao, & Wang,
2012). The success of hazard analysis depends on the skill of the team members (Dunjó et al.,
2010a), and it is prone to failure because of the lack of skill, proper communication, and data
(Qureshi, 1988). Other downfalls of HAZOP study were discussed by other researchers
(Bullock, Mitchell, & Skelton, 1991). PHA also requires the input of lessons learned from real
cases of accidents in the process industry (Jones, 1992).
One of the first attempts at developing a rule-based platform for HAZOP was HAZOPEX
(Parmar & Lees, 1987). (Heino, Suokas, & Karvonen, 1988) continued the trend and
developed more knowledge-based systems for hazard analysis. (Venkatasubramanian &
Preston, 1996) also illustrated a rule-based method for automation in HAZOP. AHA (Kang,
Lee, Kang, Suh, & Yoon, 1999; Kang, Yoon, & Suh, 2001) is another automated hazard
identification tool, in which three different knowledge bases were developed and used. Using
logical statements and cause–effect relations in HAZOP study was introduced in literature
(Galluzzo, Bartolozzi, & Rinaudo, 1999). HAZOPExpert (Venkatasubramanian &
Vaidhyanathan, 1994) and the following modifications (Srinivasan & Venkatasubramanian,
1996; Vaidhyanathan & Venkatasubramanian, 1995, 1996) were efforts at developing an ES
and a support tool for HAZOP study. OptHAZOP (F. I. Khan & Abbasi, 1997a), TOPHAZOP

15
(F. I. Khan & Abbasi, 1997b), COMHAZOP (F. I. Khan & Abbasi, 1997b), and HAZOPTool
(Karvonen, Heino, & Suokas, 1990) are other support systems using knowledge bases in PHA.
(S. Rahman, Khan, Veitch, & Amyotte, 2009) introduced a knowledge-based system to
automatically run HAZOP in the process design. (Bragatto, Monti, Giannini, & Ansaldi, 2007)
developed a knowledge-based software application in which HAZOP study is integrated with
the CAD/PLM systems. Using signed directed graphs (SDG) in computer-aided HAZOP was
introduced by (Lü & Wang, 2007). Another example of using data in the P&ID was presented
by (S. Rahman et al., 2009). Other attempts include a fuzzy inference system in HAZOP
(Guimaraes & Lapa, 2006) and PROCOS (Guimaraes & Lapa, 2006), which analyzed error
prevention and recovery in operation. Using ontologies in HAZOP studies were discussed in
the literature (Cui, Zhao, & Zhang, 2010; Zhao, Cui, Zhao, Qiu, & Chen, 2009).
2.3 Role of design in the safety of new process plant
Although many accidents have been claimed to be rooted back to the operation (Mahnken,
2001), they can still be traced further back to the design phase of the project. The design phase
can be divided into the “basic” and “detailed” phases. Figure 2-1 shows the role of design in a
cause–effect diagram.
Figure 2-1: Cause-and-effect diagram: role of design in process plant accidents
“Design for safety” or “inherently safe design” is a concept that can be applied to the basic
stages of the project to prevent future accidents. Inherent safety is based on the decision-
making in the conceptual/basic phase of the project. It is proven to be an economically
attractive tool to reduce the risk of accidents in process plants (Chang & Lin, 2006).With the
lack of information and with no proper design at this stage, decision-making is difficult (R
Rusli, Shariff, & Khan, 2013) The inherent safety and design for safety concepts are responses
to major disasters in the process plant industry and are proposed as alternative methods to

16
reduce the complexity of design. This complexity was increased by the number of add-on
protection layers (M. Rahman, Heikkilä, & Hurme, 2005). This concept can be used in
preventing accidents at different stages of the lifecycle of a process plant. Unfortunately, with
the lack of tools and methodologies, inherent safety has not yet been fully applied in the
process industry (Schupp, Hale, Pasman, Lemkovitz, & Goossens, 2006).
Studies show the effect of the environment on human performance (F. I. Khan & Amyotte,
2002; Kidam, Sahak, Hassim, Shahlan, & Hurme, 2016; Risza Rusli & Shariff, 2010).
Decisions made in process plant construction sites can be affected by its challenging
environment and lead to fatal injuries and losses. Figure 2-2 illustrates the roots of accidents
during field fit-up weld. One common cause is the project being behind schedule.
Figure 2-2: Cause-and-effect diagram: accidents during field fit-up welding
Figure 2-3 illustrates the causes/sub-causes of delays in a project. Shifting the activities from
the construction to the design phase could be an alternative to eliminate this delay and
ultimately increase the safety in the construction during the field fit-up weld.

17
Figure 2-3: Cause-and-effect diagram: project behind schedule
Two major parts of a process plant design are “equipment arrangement” and “piping” design.
Both of these play an important role in the safety of the plant. The role of these design stages
and drawbacks of traditional design methods are discussed below.
2.3.1 Design of equipment arrangement
A proper equipment arrangement is vital for avoiding domino effects and increasing safety
(Darbra, Palacios, & Casal, 2010). It is considered the basis for the detailed equipment
arrangement and also leads to other design activities, including civil, structure, piping,
electrical, and instrumentation. Studies have shown that proper spacing, equipment
arrangement, and following specifications can minimize the number of casualties and the
degree of environmental disturbance (D I Patsiatzis, Knight, & Papageorgiou, 2004; Xu &
Papageorgiou, 2009). Additionally, (Taylor, 2007) discussed the importance of the economical
and safety aspects of layout design and proposed a method of automating this process.
Although equipment arrangement design is an important part of the design and plays a major
role in the lifecycle of the plant, traditional project scheduling allocates a very limited time for
this document (Guirardello & Swaney, 2005). It is mostly based on experience and lessons
learned from previous plant designs (Dimitrios I Patsiatzis & Papageorgiou, 2002) Moreover,
there are hundreds of options under which equipment can be arranged in the plant. The
traditional methods of equipment arrangement need hundreds of trial-and-error cycles to find
the best fit that considers all the project specification requirements and best practices. This is
not viable with the typical limitations in time and budget. Efforts to solve this problem through
applying computer algorithms have been focusing on object-based method. Because all the

18
meta-data required for a comprehensive list of scenarios cannot be achieved in this way; a
point-based method must be developed.
Equipment arrangement study is a part of the famous facility layout problem (FLP) (Singh &
Sharma, 2006), which is not limited to the chemical engineering field. Many research efforts
have implemented optimization methods on single- and multiple-floor layouts (Ahmadi,
Pishvaee, & Jokar, 2017), such as using mathematical optimization (Anjos & Vieira, 2017) to
reduce the energy usage (Y. Wu, Wang, & Feng, 2016) or to minimize the sum of distances
between facilities (Paes, Pessoa, & Vidal, 2017). In order to ensure safety and minimize costs,
(Dimitrios I Patsiatzis & Papageorgiou, 2002) introduced a mathematical model to optimize
the plant layout design in the basic stages of the project. A chemical plant layout can be
designed to reduce risk (Alves, de Medeiros, & Araújo, 2016; Caputo, Pelagagge, Palumbo,
& Salini, 2015). However, there is still lack of safety implementation in this research area
(Neghabi & Ghassemi Tari, 2016).
(Eini, Abdolhamidzadeh, Reniers, & Rashtchian, 2015) developed a tool to optimize the
integration of inherent safety in the design of a process plant and also combined the cost linked
to each method. An object-oriented method in the automation of process models was proposed
by (Barth, Strube, Fay, Weber, & Greifeneder, 2009). The importance of the integrating
knowledge and incomplete data at the conceptual phase of the project was emphasized by
(Burdorf, Kampczyk, Lederhose, & Schmidt-Traub, 2004) and an automatic tool to generate
a process model for making necessary decisions at the early stages of the project was therefore
developed. Integrating data into a process design simulator was proved to be possible (Shariff
& Leong, 2009). Some suggested to considering the design of process plants as a mathematical
programming activity (Westerberg, 2004).
2.3.2 Piping design and piping stress analysis
Another major design activity is the piping design. Figure 2-4 shows the traditional workflow
in the piping design and stress analysis loop. Piping and piping support failure is one of the
root causes for accidents in the process plant industry (Persson, Santos, Tavares, & de
Andrade, 2009). Ignoring a comprehensive stress analysis in the design increases the
probability of pipes failures and leaks, which could be a risk to human beings (Brown, Seker,
Revankar, & Downar, 2012; Kidam & Hurme, 2012; Kidam et al., 2016) and could be a
triggering point for domino accidents following the leak of hazardous materials.
To minimize human error, maximize the time for safety analysis, and reduce piping and
support material costs, the design team should be provided with the opportunity to test
different equipment arrangements, pipe routings, and choose various support locations and
types. Considering the time and budget limitations of the project in the design phase, it is not

19
possible to try all the design possibilities. Moreover, every change in the piping design requires
the stress analysis for high-pressure or high-temperature lines. The loop of “design change to
stress analysis” is not only a bottleneck in the way of creativity and testing new designs but
also prone to human error with respect to updating the design, revising the data for analysis,
and communication among team members.
The piping cost in a process plant can reach as high as 80% of the equipment cost (Peters,
Timmerhaus, West, Timmerhaus, & West, 1968) which shows the necessity of applying new
methods to reducing its cost (Akbarnia, Amidpour, & Shadaram, 2009). Automation of pipe
route design with automation algorithms can save up to 50% of the total detailed design costs
(Park & Storch, 2002). Some of the existing piping automation algorithms are as follows:
Maze (Lee, 1961), Escape (Hightower, 1988), Network optimization (Nicholson, 1966), and
GA (Ito, 1999). New methods of pipe routing and optimization have been proposed by other
researchers (Montalvo et al. 2008; Kang & Lee 2017; Kim et al. 2013; Guirardello& Swaney
2005). What is missing in all these automation and optimization methods is the integration of
stress analysis. Although many pipe routes may be cost effective or able to detect obstacles in
a fixed environment, there is no guarantee that they pass the stress analysis test. Additionally,
it should be noted that the automation of design creates a dynamic environment in which
obstacles (i.e., equipment and structures) constantly move in each proposed arrangement.

20
Figure 2-4: Piping design and stress analysis workflow
As illustrated in the flowchart shown in Figure 2-4, piping design requires stress analysis of
the piping, especially for critical lines with high temperature and pressure in the testing and
operation. Considering the amount of time required for changing the design and the required
stress analysis after that, an automation method for stress analysis should be added to the pipe
routing automation algorithm.
The automation of this loop removes this burden and helps by providing time for testing new
equipment arrangements, piping design and supports, safety analysis, and material cost
minimization, without going over budget during the design or falling behind schedule.
Supervised ML algorithms can be used to find structure and correlations in data, which are
normally imperceptible to humans, and the patters of which are impossible to simulate through

21
traditional programming in computer science (Ayodele, 2010). The gradient-boosting machine
(GBM) algorithm could be helpful for this purpose.
2.3.3 Design for construction safety
Accidents in the process plant industry are not limited to the incidents during operation and
maintenance. The construction of process plants claims many lives each year. Table 1 shows
the number of construction fatalities from 2003 to 2009.
Table 2-1: Number of fatalities in construction (F. Khan, Rathnayaka, & Ahmed, 2015)
Year Fatalities 2003 1131 2004 1272 2005 1224 2006 1226 2007 1204 2008 969 2009 607
New technologies are being applied in construction industry to increase safety. Some of these
technologies include visualization (Guo, Yu, & Skitmore, 2017), making prediction models
(Zhu et al., 2016), using unmanned aerial systems (de Melo, Costa, Álvares, & Irizarry, 2017),
and psychological monitoring of workers (Guo, Yu, Xiang, Li, & Zhang, 2017). Even robotics
(Lundeen, Kamat, Menassa, & McGee, 2017) are currently being used to increase safety in
construction.
A better design can effectively increase the construction safety (Weinstein, Gambatese, &
Hecker, 2005). “Design for safety” is a new proposed approach to increase safety in
construction (Hongling, Yantao, Weisheng, & Yan, 2016). A study showed that 42% of the
reviewed fatality cases were linked to the concept design for construction safety (Behm, 2005).
Building information modeling (BIM) models can be highly beneficial in this approach
(Malekitabar, Ardeshir, Sebt, & Stouffs, 2016). The aim of this study is to bring a part of
construction into design and apply the “design for safety” concept.
2.4 Artificial intelligence in process plant industry
Considering the possibility of human error in making critical decisions, new methods of
decision-making should be sought, using the capabilities of computers (i.e., AI) because it has
become clear that smarter industry processes require new models of information (Gallagher,
Underhill, & Rimmer, 2003). In other words, facing the challenges in the process industry and
the consequences of human error (Bou-ghannam, 2013) requires innovative methods

22
(Sheridan, 2008) and innovation in every industry requires a new look at knowledge
management (Noroozi, Khakzad, Khan, MacKinnon, & Abbassi, 2013).
Although ML has been seen for years as merely a subset of AI, the truth is that ML is the core
of AI (Du Plessis, 2007). The use of ML algorithms has gained momentum in different
industries to increase productivity, quality, prediction capabilities, as well as reduce cost, and
more. For example, reducing the cost of testing and personnel supervision by using ML
methods has been thoroughly discussed in (Plasek, 2016). Integrating ML tools in industry is
another challenge, which is the topic of much discussion (Shadravan, Tarrahi, & Amani,
2015).
Ontology is a knowledge representation for a specific domain. It can list the most important
concepts and instances, describes the relation between objects, and is currently causing
revolution on the World Wide Web (Rana, Staron, Hansson, Nilsson, & Meding, 2014). In
order to create a machine-readable format of an ontology, it is written in Web ontology
language (OWL). (C. Wu, Xu, Zhang, & Na, 2013) showed an example of using ontologies in
HAZOP studies and (Mohammadfam, Kalatpour, Golmohammadi, & Khotanlou, 2013) have
illustrated the usage of ontologies and knowledge bases in process equipment failures. As
discussed by (Verhagen, Bermell-Garcia, van Dijk, & Curran, 2012), it is important to use
ontologies to deal with interoperability issues in industry. OntoCAPE (Morbach, Yang, &
Marquardt, 2007) is one of the ontologies developed in the process engineering field.
OWL is a W3C standard language to represent ontologies in semantic technology and is an AI
tool. OWL integrates two areas of data science and AI. Some branches of OWL (including
OWL DL) are based on description logic, which itself is rooted from first-order logic. As
defined by W3C, OWL is Web ontology language and ontology is a term that describes the
entities in a specific domain and the relation between these entities. OWL includes classes,
properties, and instances to respectively define the entities in the domain, their relations, and
individuals. OWL DL is the most expressive sublanguage of OWL and is directly related to
description logic, which makes it easy to create a machine-readable format of human
knowledge in any specific domain and is used in this study as the language for knowledge
representation in process engineering. It is worth mentioning that ISO 15926 is a standard
being developed for data modeling of information in the process plant industry (“OWL -
Semantic Web Standards,” 2012). One example for the data modeling of engineering
drawings, by using ISO 15926, has been presented by (Leal, 2005).

23
2.5 Summary
The complexity of design and safety analysis results in human error and catastrophic accidents
in the lifecycle of plants. Although specifications suggest a thorough guideline for PHA, the
competitive market is pushing for the design of these plants to be ready in a short time.
Publications do not suggest a completely automated method in the design of important parts
such as equipment arrangement, pipe routing, and piping stress analysis. Traditional design
and safety analysis methods fail to simultaneously provide a complete set of drawings for safe
operation and construction in the basic phases of the project. Additionally, with the rise of AI,
publications still do not suggest a practical method of integrating it into the design and safety
analysis of process plants. In this study, systematic research has been conducted to develop
practical uses of information modeling, KE, ML, and design automation, for safety analysis as
well as the development of equipment arrangement, pipe routing, and piping stress analysis.

24
Chapter 3 Logic-based knowledge representation for hazard
identification in process plants
Hazard identification in the process industry is one of the activities that relies on the integration
of human knowledge and data from engineering documents. One of the main factors resulting
in human error and improper hazard identification is the nature of data and data management,
including issues regarding interoperability, data formats, database schema, query systems, and
the lack a system integrating human knowledge into the current databases. In this chapter, to
develop a smarter dataset, a machine-readable format of human knowledge and logical
inferences from the knowledge base for hazard identification is proposed. This knowledge
base includes machine-readable formats of engineering drawings and human knowledge and
is a base for a knowledge-based ES for hazard identification. This method was applied to two
case studies and the results are discussed. Finally, other benefits of using the knowledge base
and future usages of this method in the process plant industry are discussed.
3.1 Introduction
Traditional hazard identification in the basic design of process plants requires many
brainstorming sessions for experts in the field to discuss the basic engineering documents and
identify the hazards according to their experiences, engineering specifications of the project,
and the lessons learnt from previous incidents in the industry. The methodology is based on
logical inferences based on general knowledge for an individual plant.
The success of hazard analysis depends on the skill of the team members (Dunjó et al., 2010a)
and it is prone to failure because of a lack of skill, human error, and lack of knowledge
(Qureshi, 1988). Human error has been identified as the root cause for many process plant
accidents, including Esso Australia’s gas plant and Piper Alpha on the British continental shelf
(Murphy, 2009). A shortage of time for error detection and modification is also considered
one of the other reasons for process plant accidents (Kletz, 2009).
With new improvements in computer hardware and software systems, AI, KE, and ES are
developing and emerging in different fields. These new technologies can be used in increasing
the safety of process plants in their different lifecycle stages. The link between the process
plant industry and AI, KE, and finally, ES, is established through the proper use of data,
information, and knowledge in this field.

25
The proposed ES uses a machine-readable combination of engineering drawings, engineering
specifications, and human knowledge, to automatically detect hazards in P&IDs. Figure 3-1
shows its simplified algorithm.
Human knowledgeHuman natural language Simplified language-CNL
Description logicOntology languageMachine-readable format
Manual conversion
Ontology editor
Ontology editor
Engineering drawing
Tabular format
CAD export
Ontology editor
SPARQL query
Query in human language
Ontology editor
Ontology editor
Hazard Identification Result
Figure 3-1: Expert System for hazard identification
The P&ID plays a major role in the process plant industry. It is developed from the PFD into
a diagram that is used from the basic design, into the detailed design, and then during
procurement, construction, testing, pre-commissioning, commissioning and operation. P&ID
documents are generally developed by the process engineering team by using process analysis
software (e.g., Aspen Hysys). Figure 3-2 shows an example of this diagram.
All sources of data, including P&ID documents, have their own format. The process
engineering department normally uses specific software to analyze the process from the PFD
and provides the information required for the design of the plant. This information includes
the pipe size, material, pressure, and temperature. The design and drafting department
produces P&ID engineering drawings using computer aided design (CAD) software. P&ID
drawings normally show the flow and the relation between equipment in a human-readable
format. At present, certain software development companies offer “smart” P&ID documents,
which are data-enriched. Engineering drawings are not only human-readable but also require
an expert to follow a specific pattern in reading the data, integrating them with human
knowledge and providing reasoning.

26
In order to create a machine-readable format of a P&ID, three layers of information should be
considered: engineering symbols, human interpretation of a P&ID, and individual data in each
P&ID. In other words, in order for the machine to “understand” a P&ID drawing, all these
layers should be converted into a unique knowledge base.
Figure 3-2: Sample P&ID (“Autodesk AutoCAD Plant 3D” 2014)
Recent computer-aided drawing (CAD) software packages, which are used in process
engineering as well as other industries, are able to include data through adding attributes to
each part of the drawings. These data can be extracted in a comma separated format (.CSV),
which is a tabular format for basic databases. Moreover, there are other databases in each
process plant project in tabular format. Examples of these databases include line lists,
equipment lists, and valve lists.
3.2 Creating machine-readable formats of P&IDs
In computer and information science, an ontology is defined as a set of representational basics
to model a domain of knowledge (Gruber, Ontology, & Özsu, 2009). Ontology languages (e.g.,
OWL and RDF/XML) are used to develop ontologies in different domains. An ontology can
be used as a knowledge base in process engineering and may include extracted data from
engineering drawings. Ontology editors such as Protégé and Fluent Editor are used to develop
the ontologies in each domain. There are certain existing ontologies in the process engineering

27
and oil/gas industries, but for the purpose of adding more data from other sources (which are
described in other sections), a new ontology is developed here.
The first part of the ontology development is using the schema in the extracted tabular data
from engineering drawings. Ontology languages following a “triple” concept (subject-
predicate-object). Because the tabular data are convertible to triples, it is possible to create an
ontology from all the extracted data from P&ID drawings. Figure 3-3 shows an example of
the conversion from tabular to triple format.
PredicateSubject Object Subject-Predicate-Object
Figure 3-3: Tabular to triple conversion
A proper ontology requires a better list of “predicates” to be provided. For interoperability
reasons, the chosen predicates can be based on ISO 15926 and POSC Caesar (Topping, 2011).
Figure 3-4 shows the conversion of column headers into proper predicates to be used in the
ontology editor and its usage in converting tabular format to proper triple format. Figure 3-5
shows the ontology developed for the equipment E-1s, discussed above, in the Protégé
ontology editor.
• Eq-1 Equipment tag TK-1002.• Eq-1 Material Carbon Steel.
• Eq-1 hasEquipmentTag TK-1002.• Eq-1 hasMaterialOfConstruction CarbonSteel.
Equipment tag MaterialEq-1 TK-1002 Carbon Steel
Schema column Ontology editor
Equipment tag hasEquipmentTag
Pressure hasDesignPressure
Pressure unit hasDesignPressureUnit
Material hasMaterialOfConstruction
Figure 3-4: Conversion of header titles to proper ontology predicates
Figure 3-5: Ontology development in Protégé

28
Figure 3-6 shows a part of the P&ID, extracted data into related tabular data, and the graphical
representation of a part of the ontology.
TK-1
002
4"-C
S300
-P-10
61
HA-185
4"
4"-CS300-P-10724"-CS300-P-1070
4"HA-186 HA-187
4"
E-1007
HA-188 4"
TI-1010
Atm.
2"-C
S300
-P-10
60
Eq. number Eq. ID Type P&ID No. Number of nozzles
Eq-1 E-1007 Heat exchanger P&ID-100 4Eq-2 TK-1002 Tank P&ID-100 6
Valve No.Valve
TAG No. Type Size (inch) Line No. Material
Valve-1 HA-185 Gate valve 4 4-CS300-P-1061 CSValve-2 HA-186 Gate Valve 4 4-CS300-P-1072 CSValve-3 HA-187 Gate Valve 4 4-CS300-P-1070 CS
Line No. Line ID From To Des. Temp.
Des. Pressure
P&ID No.
Spool-1 4-CS300-P-1061 E-1007 TK-1002 120 10 P&ID-100
Spool-2 4-CS300-P-1072 TK-1002 E-1007 70 10 P&ID-100
Spool-3 2-CS300-P-1060 TK-1002 Atm. 70 10 P&ID-100
Equi
pmen
t Li
stLi
ne L
istVa
lve L
ist
E-1 E-1007
Heat Exchang
er
hasT
ype
4
E-2
TK-1002
Tank
6
PID-100
Spool-1
4-CS300-P-1061
Valve-1
120
Figure 3-6: P&ID, extracted tabular data, and the ontology diagram

29
In addition to developing the ontological knowledge base from P&ID drawings, human
knowledge, which is used in interpreting P&ID drawings, can be a part of this knowledge base.
Integrating these two gives the machine the capability to interpret the data, which is
conceptually converting this knowledge base into an interpreting system, and not solely
another platform for storing data.
Human knowledge for the interpretation of P&IDs is developed in an ontology editor by using
“classes” and “predicates/properties.” For example, “Equipment” can be a class and has the
property of “hasEquipmentTag.” “hasEquipmentTag” is defined as an “Asymmetric,”
“Functional,” and “non reflexive” property between “Equipment” and “EquipmentTag” in
order to set the concept in the ontology that an equipment should have an equipment tag, and
each equipment has one, and only one tag. Figure 3-7 shows this concept in Protégé.
Figure 3-7: Setting rules for the properties
More human knowledge, in natural language format, can be added to the ontology. Below is a
list of some examples that can be integrated into the ontology.
• P&ID is an engineering drawing, including at least one equipment and one piping spool.
• Shell and Tube Heat-Exchanger is a heat-exchanger type of equipment.
• Heat-Exchanger is an equipment type.
• Every nozzle is an equipment-part.
• Nozzle can only be a part of an equipment.
• “connect-to” is a symmetric relation.
• A valve can only be in one piping spool. When a pipe “includes” a valve, it means the valve “is in” the
pipe.

30
3.3 Developing the knowledge base-inclusion of other drawings
In order to have a reliable database, all the new data should be integrated into the existing
knowledge base. The knowledge base will be a platform to add other types of data from other
sources. In the case of process plants, different forms of data are developed, depending on the
phase of the project. In the detailed design phase, for example, mechanical datasheets are
drawings that are normally developed in other departments than process engineering.
Integrating the data from these drawings extends the capabilities of query and reasoning from
the knowledge base, by linking the data from two sources. Such an integration will be helpful
in applying model-based definition (MDB) (Kaufmann & Bernstein, 2010) in process plants.
Therefore, the next step is to integrate information from the mechanical datasheet and the
tabular data (shown in Figure 3-8) into the knowledge base. Classes such as
“NumberOfNozzles” and relations such as “hasNumberOfNozzles” have been developed to
cover the knowledge representation required for an “individual” such as “Equipment-1.”
N3
N1 N2
N4N3
N1
500 1200 3700
500 1100 2300 550 950
750
750
E-1007
Nozzle ID Size(DN) Pressure(lb) Dist-Base Dist-Centre OrientationN1 100 150 500 750 UpN2 100 150 1700 750 UpN3 100 150 500 750 DownN4 100 150 4450 750 Down
E-1 E-1007
N1
hasN
ozzle
100
N2
100
150
lb
mm
hasSizeunit
Figure 3-8: Sample mechanical datasheet, extracted data, and ontology graph

31
Because two machine-readable knowledge bases are available from the P&ID and mechanical
datasheet, it is now possible to combine them into one knowledge base. Figure 3-9 below
shows the linked graph data that illustrate the developed knowledge base and the classes and
relations by combining the P&ID and mechanical datasheet. It shows how different sources of
data and information are now linked together in one unique knowledge base.
Figure 3-9: Linked data graph
3.4 Developing the knowledge base-Integrating of human knowledge
The final step in creating a complete knowledge base for hazard identification is integrating
human knowledge into this knowledge base. In order to achieve that, this knowledge should
be converted into the ontology format. This conversion requires a brief introduction to DL and
OWL.
DLs are a family of logic-based languages for knowledge representation in different domains
(Baader, Horrocks, & Sattler, 2008). DLs have reasoning capability and OWL is based on DL
languages (Horrocks, Patel-Schneider, & Van Harmelen, 2003). Simplified sentences in
human natural language can be illustrated in DL; Table 3-1 below shows some examples.

32
Table 3-1: Natural language to description logic
Natural language DL format
Gate-valve is a type of valve. gate−valve valve
Ethylene is considered ahighly-flammable hydrocarbon.
{_Ethylene} highly−flammable−hydrocarbon
Kpa is one of the units for pressure. {_Kpa} pressure−unit
It is clear that manual conversion of human language into DL would not be possible, especially
in the case that a huge number of sentences should be converted to DL. One possible approach
is a combination of controlled natural language (CNL) grammar and an ontology editor that
can support it. Figure 3-10 shows the process:
Human knowledgeHuman natural language Simplified language-CNL
Description logicOntology languageMachine-readable format
Manual conversion
Ontology editor
Ontology editor
Figure 3-10: Machine-readable knowledge base from human natural language
Although CNL is still a fuzzy term and there is no precise definition for it, it can be defined as
a restrictive version of natural language and it has been used in different environments and
disciplines (Kuhn, 2014). One of the examples is Attempto controlled English (Fuchs,
Schwertel, & Schwitter, 1998). Another example is Ontorion Controlled Natural Language
(OCNL), which is designed to be compatible with OWL (Seganti, Kapłański, & Zarzycki,
2015). Table 3-2 shows some examples.

33
Table 3-2: OCNL and DL conversions of natural language
Natural language OCNL format DL format
Gate-valve is a type of valve. every gate-valve is a valve. gate−valve valve
Ethylene is considered ahighly-flammable hydrocarbon.
Ethylene is a highly-flammable-hydrocarbon.
{_Ethylene} highly−flammable−hydrocarbon
Kpa is one of the unitsfor pressure.
Kpa is a pressure-unit. {_Kpa} pressure−unit
Semantic Web (SW) is considered the next generation of the Web and ontology languages
such as RDF and OWL are used as its language (Lucanu, Li, & Dong, 2006). OWL was
developed by the World Wide Web Consortium (W3C) to overcome the limited
expressiveness of RDF Schema (Antoniou & Van Harmelen, 2004). Because OWL is based
on DL (Yang, Dong, & Miao, 2008), all the simplified sentences above will be converted to
OWL. Table 3-3 shows the ontology (OWL/XML encoded) version of DL formats.
Table 3-3: OWL format from OCNL and DL formats
OCNL format DL format Ontology format(OWL/XML)
every gate-valve is a valve. gate−valve
⊑
valve<SubClassOf xmlns="http://www.w3.org/2002/07/owl#">
<Class IRI="GateValve" /> <Class IRI="Valve" />
Ethylene is a highly-flammable-hydrocarbon.
{_Ethylene}
⊑
highly−flammable−hydrocarbon
<ClassAssertion xmlns="http://www.w3.org/2002/07/owl#">
<Class IRI="HighlyFlammableHydrocarbon" /><NamedIndividual IRI="Ethylene" />
Kpa is a pressure-unit. {_Kpa}
⊑
pressure−unit
<ClassAssertion xmlns="http://www.w3.org/2002/07/owl#">
<Class IRI="PressureUnit" /><NamedIndividual IRI="Kpa"
<NamedIndividual IRI="Kpa" /></ClassAssertion>
Both data from engineering drawings and human knowledge are in a unique format, because
both have been encoded into ontology/OWL format. These two knowledge bases can now be
combined to form a unique knowledge base, which is illustrated in Figure 3-11.
Human knowledgeHuman natural language Simplified language-CNL
Description logicOntology languageMachine-readable format
Manual conversion
Ontology editor
Ontology editor
Engineering drawing
Tabular format
CAD export
Ontology editor
Figure 3-11: Combination of knowledge bases
Another part of human knowledge is the conditional relations. A conditional relation in logic
is expressed as pair of propositions, where one of the propositions is expressed to be true if

34
the other is true. This part is more sophisticated than triple-made sentences. Some examples
of conditional relations in the process industry are presented here:
If a valve is a part of a line, then the same fluid passes through the line and the valve.
If a valve is open, then it is not closed.
Although these expressions seem simple, they are essential parts of a knowledge base for
accurate logical inferences.
Part of the engineering knowledge and project specifications can be introduced to the
knowledge base through these conditional relations. Here is an example:
If a tank is open and the tank does not have high-level control, then it may overflow. If the tank
overflows, then humans are exposed to the material in the tank. If the material in the tank is
hazardous material, then the site is not safe.
In the SW, these conditional relations are defined as Semantic Web Rule Language (SWRL).
Adding this part of the human knowledge is essential to create a knowledge base for accurate
inferencing. As with other parts of the human knowledge, it is possible to convert the OCNL
format of SWRL into DL and use them as part of the ontology/knowledge base. Table 3-4
shows an example in which two engineering expressions are converted into the OCNL and DL
format. As discussed, the DL format can be integrated as a part of the knowledge base, in
OWL language.
Table 3-4: SWRL from natural language to DL format
DL format
When a pipe is connected to a nozzle, which ia a part of an equipment, then the pipe is connected to the equipment.
If a process-pipe(1) is-connected-to a nozzle(1) and the nozzle(1) belongs-to an equipment(1) then the process-pipe(1) is-connected-to the equipment(1).
⌂○process−pipe(?process−pipe−1) ○nozzle(?nozzle−1)
⋀
be−connected−to(?process−pipe−1,?nozzle−1)
⋀
○nozzle(?nozzle−1)
⋀
○equipment(?equipment−1)
⋀
belong−to(?nozzle−1,?equipment−1)→be−connected−to(?process−pipe−1,?equipment−1)
A vertical tank with pressre more than 1000 Kpa is considerred a high-pressure tank.
if a vertical-tank(1) has-operating-pressure an operating-pressure(1) and the operating-pressure(1) has-value greater-than 1000 and the operating-pressure(1) has-pressure-unit Kpa then the vertical-tank(1) is a high-pressure-tank.
⌂○vertical−tank(?vertical−tank−1) ○operating−pressure(?operating−pressure−1)
⋀
have−operating−pressure(?vertical−tank−1,?operating−pressure−1)
⋀
○operating−pressure(?operating−pressure−1)
⋀
°have−value(?operating−pressure−1,?:value−tmp−1)
⋀
°>1000(?:value−tmp−1)
⋀
○operating−pressure(?operating−pressure−1)
⋀
have−pressure−unit(?operating−pressure−1,_Kpa)→○high−pressure−tank(?vertical−tank−1)
OCNL formatNatural language format
3.5 NO-SQL inferencing
It is now possible to make a query from this knowledge base. Because this knowledge base is
based on DL, a logical inference can be a part of the query. The query language for this OWL-
based knowledge base is SPARQL, which is a No-SQL query language and is the W3C-
recommended query language for SW. Figure 3-12 shows where the query can be made from
the knowledge base.

35
Human knowledgeHuman natural language Simplified language-CNL
Description logicOntology languageMachine-readable format
Manual conversion
Ontology editor
Ontology editor
Engineering drawing
Tabular format
CAD export
Ontology editor
SPARQL query
Figure 3-12: SPARQL query from knowledge base
Table 3-5 shows two examples:
Table 3-5: Query in natural language and SPARQL
Query(Natural language) SPARQL format
Equipment tag of Equipment1
PREFIX pro: <http://processplantontology.com/processontology20.owl#>SELECT ?EquipmentTag WHERE { pro:Equipment1 pro:hasequipmenttag ?EquipmentTag.}
list of equipment tags which the equipment material is carbon steel
PREFIX pro: <http://processplantontology.com/processontology20.owl#>SELECT ?EquipmentTagWHERE{?Equipment pro:hasMaterialOfConstruction ?CarbonSteel.?Equipment pro:hasequipmenttag ?EquipmentTag.}
It is also possible to use CNL to convert simplified queries, in human natural language, into
SPARQL format queries. The CNL grammar is used in this case is again OCNL, which was
used for the content of the knowledge base. FE ontology editor can convert the OCNL format
of the query into SPARQL, as illustrated in Table 3-6.
Table 3-6: Query from natural language to SPARQL, using OCNL
Query(Natural language) OCNL format SPARQL format
list of equipment tags which the equipment material is carbon steel.
Who-Or-What has-material-of-construction Carbon-Steel?
PREFIX pro: <http://processplantontology.com/processontology20.owl#>SELECT ?EquipmentTagWHERE{?Equipment pro:hasMaterialOfConstruction ?CarbonSteel.?Equipment pro:hasequipmenttag ?EquipmentTag.}

36
3.6 Case studies
3.6.1 Phillips disaster
Figure 3-13 shows a part of a P&ID in which a two-inch line is connected to a high-pressure
tank (TK-1002) at its head and connected to the atmosphere at its tail. A logic-based
knowledge representation is used to identify hazard(s) in the process design. First, an ontology
is extracted from this part of the P&ID. In the next step, the engineering specification, in the
form of human knowledge is presented in DL and OCNL formats. Finally, a combination of
these two knowledge bases is used for a SPARQL/OCNL query about the safety of the design.
Valve hasType isInLine hasMaterial hasManufacturer
V-1 SingleBlockValve PipingSpool 1 … …
Piping hasID hasHead hasTail hasMaterial
PipingSpool 1 2-CS300-P-1060 Nozzle 1 Atmosphere …
Nozzle hasTag isInEquipment hasMaterial hasSize
Nozzle-1 N-1 Equipment-1 … …
TK-1
002
Atm.
2"-C
S300
-P-1
060
N-1
V-1
Equipment hasTag hasPressure hasMaterial isinPID
Equipment-1 TK-1002 1200 … P&ID-100
Figure 3-13: P&ID100 for case study 1: Line connected to high-pressure tank

37
The ontology editor is used to convert these tables into a part of the knowledge base. A part
of this encoding is shown in Table 3-7 in two formats: OCNL and DL.
Table 3-7: Triples converted to DL format
DLV-1 has-type Single-Block-Valve. {_V−1} (have−type).({_Single−Block−Valve})Piping-Spool-1 has-valve V-1. {_Piping−Spool−1} (have−valve).({_V−1})Piping-Spool-1 has-line-number "2-CS300-P-1060".
{_Piping−Spool−1} (have−line−number).("2−CS300−P−1060")
Triple-OCNL format
A graphical ontology is shown in Figure 3-14 below:
Figure 3-14: Graphical representation of the P&ID Ontology
There is also general engineering knowledge that should be added to the knowledge base for
accurate reasoning (shown in Table 3-8). This part of the knowledge base is not limited to any
specific project and can be applied to any P&ID:
Table 3-8: Encoding general knowledge-from OCNL to DL
DLEvery single-block-valve is a valve. single−block−valve valveIf a process-pipe(1) is-connected-to a nozzle(1) and the nozzle(1) belongs-to an equipment(1) then the process-pipe(1) is-connected-to the equipment(1).
⌂○process−pipe(?process−pipe−1) ○nozzle(?nozzle−1)⋀
be−connected−to(?process−pipe−1,?nozzle−1)
⋀
○nozzle(?nozzle−1)
⋀
○equipment(?equipment−1)
⋀
belong−to(?nozzle−1,?equipment−1)→be−connected−to(?process−pipe−1,?equipment−1)
Open is a valve-status.Close is a valve-status.
{_Open} valve−status{_Close}
⊑
valve−status
OCNL format
Another layer that should be added here is the engineering specification, originally in the form
of human natural language, into OCNL, and then DL format. The sentence below is the natural
language format of the engineering specification.

38
“If a vertical tank’s operating pressure is above 1000 kPa, a connected pipe to this tank which
leads to atmosphere on the other side MUST have a double block valve.”
Table 3-9 below shows the conversion into the OCNL and DL format.
Table 3-9: From SWRL in natural language to DL format
KnowledgeNatural language
DL
if a vertical-tank(1) has-operating-pressure an operating-pressure(1) and the operating-pressure(1) has-value greater-than 1000 and the operating-pressure(1) has-pressure-unit Kpa then the vertical-tank(1) is a high-pressure-tank.
⌂○vertical−tank(?vertical−tank−1) ○operating−pressure(?operating−pressure−1)
⋀
have−operating−pressure(?vertical−tank−1,?operating−pressure−1)
⋀
○operating−pressure(?operating−pressure−1)
⋀
°have−value(?operating−pressure−1,?:value−tmp−1)
⋀
°>1000(?:value−tmp−1)
⋀
○operating−pressure(?operating−pressure−1)
⋀
have−pressure−unit(?operating−pressure−1,_Kpa)→○high−pressure−tank(?vertical−tank−1)
If a process-pipe(1) has-line-tail Atmosphere and the process-pipe(1) is-connected-to a vertical-tank(1) and the vertical-tank(1) is a high-pressure-tank then the process-pipe(1) must-have Double-Block-Valve.
⌂○process−pipe(?process−pipe−1) have−line−tail(?process−pipe−1,_Atmosphere)
⋀
○process−pipe(?process−pipe−1)
⋀
○vertical−tank(?vertical−tank−1)
⋀
be−connected−to(?process−pipe−1,?vertical−tank−1)
⋀
○vertical−tank(?vertical−tank−1)
⋀
○high−pressure−tank(?vertical−tank−1)→must−have(?process−pipe−1,_Double−Block−Valve)
If a process-pipe(1) is-in-drawing a piping-and-instrument-diagram-drawing(1) and the process-pipe(1) has-line-tail Atmosphere and the process-pipe(1) is-connected-to a vertical-tank(1) and the vertical-tank(1) is a high-pressure-tank and the process-pipe(1) does-not-have Double-Block-Valve then the piping-and-instrument-diagram-drawing(1) has-design-status Unsafe and Recommendation-1 have-status Applicable.
⌂○process−pipe(?process−pipe−1)
⋀
○piping−and−instrument−diagram−drawing(?piping−and−instrument−diagram−drawing−1)
⋀
be−in−drawing(?process−pipe−1,?piping−and−instrument−diagram−drawing−1)
⋀
○process−pipe(?process−pipe−1)
⋀
have−line−tail(?process−pipe−1,_Atmosphere)
⋀
○process−pipe(?process−pipe−1)
⋀
○vertical−tank(?vertical−tank−1)
⋀
be−connected−to(?process−pipe−1,?vertical−tank−1)
⋀
○vertical−tank(?vertical−tank−1)
⋀
○high−pressure−tank(?vertical−tank−1)
⋀
○process−pipe(?process−pipe−1)
⋀
doe−not−have(?process−pipe−1,_Double−Block−Valve)→have−design−status(?piping−and−instrument−diagram−drawing−1,_Unsafe)
Recommendation-1 has-content Line-Connected-To-High-Pressure-Tank-And-Atomosphere-Must-Have-A-Double-Block-Valve.
{_Recommendation−1} (have−content).({_Line−Connected−To−High−Pressure−Tank−And−Atomosphere−Must−Have−A−Double−Block−Valve})
SWRL-OCNL format
“If a
ver
tical
tank
’s o
pera
ting
pres
sure
is a
bove
100
0 K
pa, a
con
nect
ed p
ipe
to th
is ta
nk
whi
ch le
ads t
o at
mos
pher
e on
the
othe
r sid
e M
UST
hav
e a
doub
le b
lock
val
ve.”
The SPARQL query for hazard identification is the reasoner that refers to the knowledge base,
which is the DL combination of information from the P&ID and human knowledge. It is the
reasoning engine/reasoner that can ultimately help with hazard identification. As discussed,
the SPARQL query can be asked with the OCNL format. Table 3-10 below shows the question
to check the safety of design in the P&ID above.

39
Table 3-10: Query about P&ID safety
QueryNatural language Query-OCNL format Query result
Is P&ID design safe? Who-Or-What has-design-status Unsafe?
P&ID-100
At this stage, the reasoner identifies the P&ID as “Unsafe,” but it cannot help the designer to
modify the design. In order to add this ability, a “Recommendation” part has been added to
the knowledge base. For example, in this case, because the root cause of the “Unsafe” status
is the lack of a double block valve, a recommendation is initially added to the original human
knowledge. Table 3-11 shows the complete query result.
Table 3-11: Query result: Line connected to high-pressure tank
QueryNatural
languageQuery-OCNL format Query result
Who-Or-What has-design-status Unsafe?
P&ID-100
Who-Or-What is a recommendation that has-status Applicable?
Recommendation-1 has-content Line-Connected-To-High-Pressure-Tank-And-Atomosphere-Must-Have-A-Double-Block-Valve.
Is P
&ID
des
ign
unsa
fe?
And
if
unsa
fe, w
hat i
s rec
omm
ende
d?
This way, the knowledge base not only helps with hazard identification but also provides a
recommendation to the process designer to modify it. In this case, the response to the query
includes the recommendation: “Line-Connected-To-High-Pressure-Tank-And-Atomosphere-
Must-Have-A-Double-Block-Valve.”
A revised P&ID, shown in Figure 3-15, considers two block valves for the line. This time, the
reasoner approves the P&ID and identifies it as “Safe,” because a double-block valve has been
used instead of a single-block valve.

40
TK-1
002
Atm.2"
-CS3
00-P
-106
0
TK-1
002
Atm.
2"-C
S300
-P-1
060
Rejected Approved
Figure 3-15: Revised P&ID
The case study discussed above was from the Phillips disaster in 1989 (F. I. Khan & Abbasi,
1999) in which 23 people died and 130 people were injured. A thorough review and better
P&ID design could have prevented the incident from occurring.
3.6.2 Acid transfer line
Figure 3-16 shows a part of a P&ID in which a line transfers phosphoric acid from a storage
tank to a reactor. A logic-based knowledge representation is used to identify hazard(s) in the
process design. The same steps as in case study 1 are followed; first, an ontology is extracted
from this part of the P&ID. In the next step, the engineering specification, in the form of human
knowledge is presented in the DL and OCNL formats. Finally, a combination of these two
knowledge bases is used for a SPARQL/OCNL query about the safety of the design.
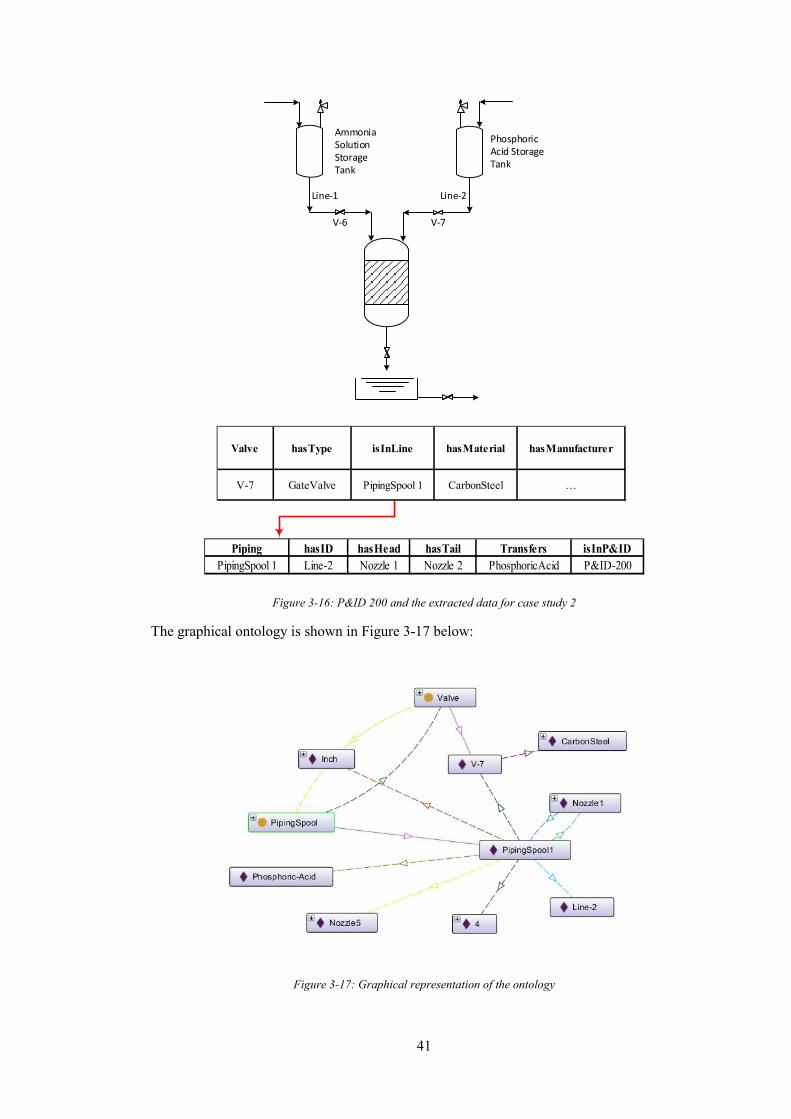
41
Valve hasType isInLine hasMaterial hasManufacturer
V-7 GateValve PipingSpool 1 CarbonSteel …
V-6
Line-1 Line-2
V-7
Phosphoric Acid Storage Tank
Ammonia Solution Storage Tank
Piping hasID hasHead hasTail Transfers isInP&IDPipingSpool 1 Line-2 Nozzle 1 Nozzle 2 PhosphoricAcid P&ID-200
Figure 3-16: P&ID 200 and the extracted data for case study 2
The graphical ontology is shown in Figure 3-17 below:
Figure 3-17: Graphical representation of the ontology

42
There is also general engineering knowledge that should be added to the knowledge base for
accurate reasoning (shown in Table 3-12). This part of the knowledge base is not limited to
any specific project and can be applied to any P&ID:
Table 3-12: Conversion of certain OCNL expressions into DL format
DLPhosphoric-Acid is an acidic-service. {_Phosphoric−Acid} acidic−service
if a process-pipe(1) has-service a service(1) and the process-pipe(1) has-valve a valve(1) then the valve(1) has-service the service(1).
⌂○process−pipe(?process−pipe−1) ○service(?service−1)
⋀
have−service(?process−pipe−1,?service−1)
⋀
○process−pipe(?process−pipe−1)
⋀
○valve(?valve−1)
⋀
have−valve(?process−pipe−1,?valve−1)→have−service(?valve−1,?service−1)
Monel is a material-of-manufacturing. {_Monel} material−of−manufacturing
OCNL
Engineering Knowledge:
When a line is carrying acidic product, valve material should be Monel or 316 Stainless Steel
and the flow rate should be checked at all time.
Table 3-13 below shows the conversion into the OCNL and DL formats.

43
Table 3-13: Engineering knowledge, from natural language to DL
KnowledgeNatural language
DL
if a valve(1) is-in-drawing a piping-and-instrument-diagram-drawing(1) and the valve(1) has-service a service(1) and the service(1) is an acidic-service and the valve does-not-have-material-of-manufacturing Monel then the piping-and-instrument-diagram-drawing(1) has-design-status Unsafe and Recommendation-4 have-status Applicable.
⌂○valve(?valve−1)
⋀
○piping−and−instrument−diagram−drawing(?piping−and−instrument−diagram−drawing−1)⋀
be−in−drawing(?valve−1,?piping−and−instrument−diagram−drawing−1)
⋀
○valve(?valve−1)
⋀
○service(?service−1)
⋀
have−service(?valve−1,?service−1)
⋀
○service(?service−1)
⋀
○acidic−service(?service−1)
⋀
○valve(?valve−x)
⋀
doe−not−have−material−of−manufacturing(?valve−x,_Monel)→have−design−status(?piping−and−instrument−diagram−drawing−1,_Unsafe)
⋀
have−status(_Recommendation−4,_Applicable)
if a process-pipe(1) is-in-drawing a piping-and-instrument-diagram-drawing(1) and the process-pipe(1) has-service an acidic-service(1) and the process-pipe(1) does-not-have-flow-indicator a flow-indicator(1) then the piping-and-instrument-diagram-drawing(1) has-design-status Unsafe and Recommendation-5 have-status Applicable.
⌂○process−pipe(?process−pipe−1)
⋀
○piping−and−instrument−diagram−drawing(?piping−and−instrument−diagram−drawing−1)
⋀
be−in−drawing(?process−pipe−1,?piping−and−instrument−diagram−drawing−1)
⋀
○process−pipe(?process−pipe−1)
⋀
○acidic−service(?acidic−service−1)
⋀
have−service(?process−pipe−1,?acidic−service−1)
⋀
○process−pipe(?process−pipe−1)
⋀
○flow−indicator(?flow−indicator−1)
⋀
doe−not−have−flow−indicator(?process−pipe−1,?flow−indicator−1)→have−design−status(?piping−and−instrument−diagram−drawing−1,_Unsafe)
⋀
have−status(_Recommendation−5,_Applicable)
Recommendation-4 has-content Valve-Contains-Acid-Should-Be-From-Stainless-Steel-Or-Monel
{_Recommendation−4} (have−content).({_Valve−Contains−Acid−Should−Be−From−Stainless−Steel−Or−Monel})
Recommendation-5 has-content Line-Contains-Acid-Must-Have-Flow-Indicator.
{_Recommendation−5} (have−content).({_Line−Contains−Acid−Must−Have−Flow−Indicator})
SWRL-OCNL format
Whe
n a
line
is ca
rryi
ng a
cidi
c pr
oduc
t, va
lve
mat
eria
l sho
uld
be M
onel
or 3
16
Stai
nles
s Ste
el a
nd th
e flo
w ra
te sh
ould
be
chec
ked
at a
ll tim
e.
Table 3-14 below shows the question, by the SPARQL/reasoning engine, to check the safety
of the design in the P&ID above.
Table 3-14: Query from P&ID-Acid transfer line
QueryNatural language Query-OCNL format Query result
Is P&ID design safe? Who-Or-What has-design-status Unsafe?
P&ID-200
At this stage, the reasoner identifies the P&ID as “Unsafe,” but it cannot help the designer to
modify the design. In order to add this ability, a “Recommendation” part is added to the
knowledge base. For example, in this case, because the root cause of the “Unsafe” status is the
wrong material of the valve and the lack of a flow indicator, two recommendations are initially
added to the original human knowledge, as shown in Table 3-15 below:

44
Table 3-15: Query results: Acid transfer line
QueryNatural
languageQuery-OCNL format Query result
Who-Or-What has-design-status Unsafe?
P&ID-200
Who-Or-What is a recommendation that has-status Applicable?
Recommendation-4 has-content Valve-Contains-Acid-Should-Be-From-Stainless-Steel-Or-Monel.
Recommendation-5 has-content Line-Contains-Acid-Must-Have-Flow-Indicator.
Is P
&ID
des
ign
unsa
fe?
And
if
unsa
fe, w
hat i
s rec
omm
ende
d?
This way, the knowledge base not only helps with hazard identification, but it can provide a
recommendation to the process designer to modify it. In this case, response to the query will
include the recommendation: “Valve-Contains-Acid-Should-Be-From-Stainless-Steel-Or-
Monel.” and “Line-Contains-Acid-Must-Have-Flow-Indicator.”
A revised P&ID, Figure 3-18, considers a Monel valve and a flow indicator for this line. This
time, the reasoner approves the P&ID and identifies it as “Safe.”
V-6
Line-1 Line-2
V-7
Phosphoric Acid Storage Tank
Ammonia Solution Storage Tank
V-6
Line-1 Line-2
V-7
Phosphoric Acid Storage Tank
Ammonia Solution Storage Tank
F I
CS Monel
Rejected Approved
Figure 3-18: Original and revised P&ID
45
3.7 Discussion
With the development of data science, there are now alternatives to SQL, called No-SQL in
general, which can boost the existing capabilities of SQL by introducing new formats of data.
One of the main reasons for developing the knowledge base is to be able to query it by using
No-SQL. As discussed, there are many situations in the process plant lifecycle in which it is
critical to get the right answer for the query, and answering the query requires multiple
documents, drawings, and documents, with their latest revisions, to be sought.
An example of that would be the hazard identification in process engineering diagrams (e.g.,
the P&ID). It is obvious that, without the knowledge base, answering this question would
require the design validation team to refer to different drawings, specifications, lessons learnt
from previous incidents, and find mistakes in the process diagram. This is actually the
traditional method of hazard identification in the process engineering field, which is normally
conducted by a group of experts in the field; it is not only time-consuming but also inevitably
introduces human error. The two case studies in this chapter illustrate the accuracy and speed
of using a knowledge base, and their reasoning engine for hazard identification.
It should be noted that developing such a knowledge base for a process plant requires a digital
format of engineering drawings (e.g., the P&ID). Although a part of this ES requires the time
and effort to convert human knowledge and engineering specifications into the CNL format,
it should be that once this is complete, the knowledge base can be used in different projects,
without the requirement that this part be done again.
Another major benefit in this method is the capability of using the ISO 15926 standard, which
is a developing standard. Following ISO 15926 standardizes the assignment of “predicates” in
the triples and data extraction from CAD platforms.
The idea is not limited to the design of new process plants, but with the current challenges of
process plant owners in managing their facilities, while trying to keep their personnel safe and
the environment intact, it is possible to model all types of information from existing plants (as
shown in Figure 3-19) for the purpose of any reasoning during the operation and maintenance.
Moreover, it may be used in conjunction with “Internet of Things” (IoT) technology (F. I.
Khan & Abbasi, 1999).
The aim of ontology-based modelling and analysis is to reduce the amount of time, effort, and
money that is required to do process hazard analysis in the future. It requires an investment in
time and money, but the return of this investment is worth the time and effort since it is
eliminating the repetitive (and unnecessary) activities. Besides, it minimizes the human error
in future hazard analysis.

46
On the other hand, current advancements in Natural Language Processing is benefiting this
process in converting natural language, into a machine-readable format. This research is aimed
to apply NLP in converting human-readable scripts into semantic language in the next steps.
Figure 3-19: Creating a comprehensive knowledge base
3.8 Conclusions and future work
In this chapter, state-of-the-art semantic technology and ontology language were used to
address safety issues in the process industry, and their roots in data query and reasoning and
successful application to two case studies were illustrated. The contribution here lies in
developing machine-readable knowledge bases for safety analysis in the process industry. This
is the first time that such a new field in computer and data science (semantic technology and
KE) is used in safety analysis in the chemical engineering field. Combining process data,
human knowledge, and engineering specifications in a knowledge base and developing a query
platform to automate/assist in the safety analysis minimize the required time for safety
analysis, minimize human error, and also provide the opportunity for process engineers to try
different sets of process diagrams.
Developing a knowledge base (ontology), including the data from engineering drawings (e.g.,
P&ID and mechanical datasheet), using CNL, DL, and OWL language was proposed. Using a
No-SQL language (e.g., SPARQL) and built-in reasoners in ontology editors to gain accurate
responses for complex questions during the lifetime of a plant were also illustrated. The

47
flexibility of a knowledge base in integrating data from different sources and its data
visualization and unique identifier features were also presented.
Because the roots of this methodology are a part of semantic technology and AI development,
it can be linked to other AI systems and applications to create a type of process plant that acts
smarter in each phase of the project (i.e. design, construction, operation, and shutdown and
maintenance). The development of applications for design automation can be named as such
futuristic applications because the machine stores human knowledge and it can read other
formats of existing data. Therefore, the future of this research will be about using the human
knowledge in a machine-readable format for reviewing the design, as well as automating the
design.

48
Chapter 4 Automation of equipment arrangement and design
validation in process plants
In this chapter, an algorithm for the automation of equipment arrangement in process plants is
first developed. Mathematical models of equipment in the PFD are then established. The
algorithm is applied to equipment models to generate multiple scenarios of equipment
arrangement. Human knowledge and engineering specifications are integrated to the algorithm
to check the scenarios and filter the best arrangements
4.1 Algorithm and preliminary data extraction
Figure 4-1 shows the algorithm flowchart. Data from the PFD and preliminary equipment
dimensions are used in creating data matrices of the layout and equipment with mathematical
modeling. All possible scenarios for the equipment arrangement are created and different
matrices are developed for each scenario. The project specification and best engineering
practices are then applied to each scenario model to filter the scenarios and choose the
approved list.
Start
Data from Process Flow
Diagram (PFD)
Database
Preliminary equipment dimensions
Create point-data matrix for each
equipment
Create scenarios of equipment
arrangement
Specification rules
Convert spec rules to logical/programmable
rules
Check scenario matrices with rules
Add scenario to list of ‘not-approved’
scenario list
Add scenario to list of ‘approved’ scenario list
ApprovedNot Approved
End
Best Practice according to
previous experiences
Figure 4-1: Flowchart for equipment arrangement and validation

49
At the first stage, a database is developed which includes the data from process flow diagram
(PFD) and the preliminary equipment dimensions. It is worth mentioning that the equipment
manufacturers in the process plant industry have preliminary dimensions, based on the process
information. For example, a centrifugal pump with specific operation/test pressure and
temperature and in/out nozzle dimensions has a rectangular shape with certain dimensions;
these dimensions are normally in a (somehow) similar range among centrifugal pump
manufacturers. The same concept is correct for other equipment in this field (i.e. heater, heat
exchanger, towers).
In the next stage, the algorithm develops data models, in form of matrices, for each equipment,
by converting each equipment into data-enriched nodes. Combination of these data models
creates multiple scenarios for equipment arrangement.
Another part of the algorithm is about integrating the engineering specifications into the code;
in other words, equipment arrangement rules (e.g. clash prevention, safe distance, and
orientations) can become a part of the code script.
In the last stage, rules (included as a part of the code) are going to check each equipment
arrangement scenario and approves its validity.
PFDs normally show the relation between the process equipment at the early stages of the
project. PFDs are human-readable diagrams and include information about the relations among
the equipment. It is a common practice in the process plant industry for, with the preliminary
information in the PFD, the preliminary dimensions of the process equipment to be generated
as a database for the preliminary design of the equipment arrangement. These data are based
on the lessons learned and previous similar process plants. Figure 4-2 below shows an example
of this.
P-101
D-101
E-107 A/B/C/D
F-101R-101
FEED SURGE DRUM
CHARGE PUMPS
FEED EXCHANGERS
REACTOR
CHARGE FURNACE
L 1
D1D2
T1
P1
T2
P2
T3
P3
T4
P4
T5
P5
T6
P6
T7
P7
L 2
PFDPreliminary sizing of
2D equipment
Figure 4-2: Preliminary equipment dimensions from PFD
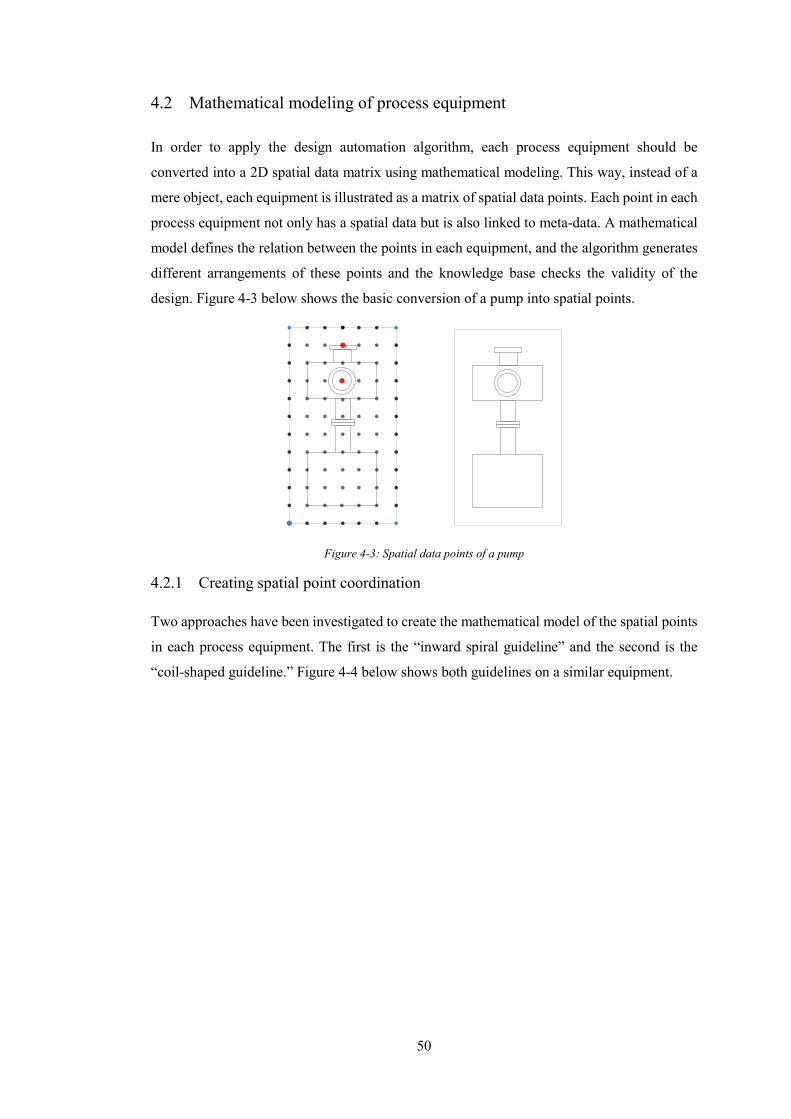
50
4.2 Mathematical modeling of process equipment
In order to apply the design automation algorithm, each process equipment should be
converted into a 2D spatial data matrix using mathematical modeling. This way, instead of a
mere object, each equipment is illustrated as a matrix of spatial data points. Each point in each
process equipment not only has a spatial data but is also linked to meta-data. A mathematical
model defines the relation between the points in each equipment, and the algorithm generates
different arrangements of these points and the knowledge base checks the validity of the
design. Figure 4-3 below shows the basic conversion of a pump into spatial points.
Figure 4-3: Spatial data points of a pump
4.2.1 Creating spatial point coordination
Two approaches have been investigated to create the mathematical model of the spatial points
in each process equipment. The first is the “inward spiral guideline” and the second is the
“coil-shaped guideline.” Figure 4-4 below shows both guidelines on a similar equipment.

51
1
2
3
4
5
6
7
8
9
10
11
12 13 14 15 16 17 18
29
57
77
76
75
74
73
72
71
49
19
34 33 32 31 30
35
36
37
38
39
40
41
42
43
44 45 46 47 48
60 59 58
61
62
63
64
65
66
67
68 69 70
78
79
80
81
82
83
84
26
25
24
23
22
21
20
27
28
56
55
54
53
52
51
50
11
6
1
14
15
28
29
42
43
56
57
70
71
84 83 82 81 80 79 78
7
9
19
24
33
38
47
52
61
65
77
2 3 4 5 6
13
16
27
30
41
44
55
58
69
72 73 74 75 76
12 11 10
17
26
31
40
45
54
59
68 67 66
18
25
32
39
46
53
60
22
35
36
49
50
63
64
21
8
20
23
34
37
48
51
62
11
6
Preliminary sized equipment Point-based model Inward spiral for
mathematical modelling
Preliminary sized equipment Point-based model Coil-shaped guideline for
mathematical modelling
Figure 4-4: Inward spiral vs. coil-shaped guideline for mathematical modeling
Creating a mathematical model with the inward spiral guideline is a complex task. The coil-
shaped guideline provides a simpler approach to develop a mathematical model that can
predict the location of the points and other features from the number of each point. The
coordination of each point ( )_ _,P No P NoX Y is based on the coordination of the base point
( )0 0,X Y and the orientation of the equipment ( )α in the layout area. Figure 4-5 illustrates
the coordination of points for an equipment in four different rotations.
Following the coil-based guideline, each point’s coordination can be expressed as follows:
( ) ( )( )( ) ( ) ( ) ( ) ( )( ) ( )( )( )( ) ( )
( ) ( )( )( ) ( ) ( ) ( ) ( )( ) ( )( )( )( ) ( )
_ 0 0
_ 0 0
:::
_ mod 1 sin _ _ mod 1 1 1 cos
_ mod 1 cos _ _ mod 1 1 1 sin
P No
P No
L LengthW Width
Rotation Angle
X Y P No W X P No P No W W
Y Y P No W X P No P No W W
α
α α
α α
−
= + + × + + − + × + − ×
= + + × − + − + × + − ×

52
v
90oα =
180oα =
270oα =
Layout area (XP_No,YP_No)
(X0,Y0)
Figure 4-5: Process equipment spatial point coordination with respect to base point and rotation in the layout area
4.2.2 Creating equipment data matrix
As discussed above, creating a matrix from each process equipment gives us the opportunity
of adding more meta-data to each point. Figure 4-6 shows the difference between the amount
of data in a mere object and a matrix conversion of the same equipment. It shows limited data
from the “object” when compared with the mathematical model.

53
1 1 1 1
1 10 1 10
1 50 1 50 1 1 2 1
1 1
2 1
2 11
2 1
2 1
E E
E E
E E E E
E m E m
X Y Corner NA NA NA E N E
X Y Operation NA NA NA E N EE
X Y Nozzle Nozz Conn NA Nozzle E N E
X Y Internal NA NA NA E N E
− −
− −
− − − −
− −
= −
[ ]WidthLengthEE 11 =
Figure 4-6: Data matrix vs. limited data of an object
An integrated knowledge base in the algorithm requires a reference to the meta-data of each
point in the process equipment data matrix, such that the equipment arrangement design may
be validated. This is a combination of different data matrices. Therefore, each equipment data
matrix should have enough information in each row. Figure 4-7 below shows the nature of
data in each column of the data matrix and each row refers to a point in the equipment.
2 1 2 1
2 10 2 10
2 50 2 50 2 1 1 1
2 1
1 2
1 2
1 2
1 2
E E
E E
E E E E
E m E m
X Y Corner NA NA NA E N E
X Y Border NA NA NA E N E
X Y Nozzle Nozz Conn NA Nozzle E N E
X Y Internal NA NA NA E N E
− −
− −
− − − −
− −
−
X co
ordi
natio
n
Y co
ordi
natio
n
Poin
t Loc
atio
n
Spec
ial f
eatu
re1
Spec
ial f
eatu
re2
Conn
ecte
d po
int
Equi
pmen
t Nam
e
Conn
ecte
d Eq
uipm
ent o
n PF
D
Equi
pmen
t Orie
ntat
ion
Figure 4-7: Points and matrix

54
4.2.3 Critical spatial points
Because some parts of the checklist in the algorithm are around the border, corner, and nozzle
points of each process equipment, it is important to consider them in the data matrix and
mathematical model of each equipment. The following rules should be considered in the
mathematical modeling of the equipment:
Corners
( )( )( )( )( )( )
_1 _ 2 _ 3 _ 4
_1 1 _ 3 _1
_ 2 1 _ 4 _ 2
_ int , , ,
1 1
1 1
Co Co Co Co
Co Co Co
Co W Co Co
Corner Po s P P P P
P P P P L W
P P P P L W+
=
= → = + × + +
= → = + × + +
Border/perimeter points
Below is the rule for detecting the list of points positioned on the border/perimeter of the
equipment:
( )( ) ( )( )( ) ( )( )( ) ( ) ( )( )
_1 _ 2 _
_1 _ 2 _ 3 _ 4
_ int , , ,
_ _
_ mod 1 1 0 _ mod 1 0
_ _ int
Bo Bo Bo n
Co Co Co Co
Border Po s P P P
if P P No P P P No P
P No W P No W
P No Border Po s
=
≤ ≤ ∨ ≤ ≤ ∨
+ − = ∨ + =
→ ∈
Nozzle points
Nozzle locations are also used in the algorithm and should be recorded as part of the data
matrix.
[ ]( )
1 2
_ _1 _ _1
_ , ,
_ _P No Nozz P No Nozz
Nozzle List Nozz Nozz
if X X Y Y P No Nozzle List
=
= ∧ = → ∈
Figure 4-8 below shows the location of two nozzles and their mirror points on the spatial point
graph of the process equipment.

55
Figure 4-8: Nozzles on spatial point graph of the equipment
4.2.4 Adding more meta-data
As discussed, further details can be added to the mathematical models for equipment. This
includes meta-data about the points in the operation, maintenance, and other required zones
around each equipment. Assigning data rows to the matrix to cover these points will be helpful
in future, because rules about each set of points will be added to the equipment arrangement
algorithm. Figure 4-9 below shows “operation” and “maintenance” spaces added to the data
matrix.
1 1 1 1
1 10 1 10
1 50 1 50
1 1
Corner
Operation
Maintenance
Internal
2 1
2 1
2 1
2 1
E E
E E
E E
E m E m
X Y NA NA NA E N E
X Y NA NA NA E N E
X Y NA NA NA E N E
X Y NA NA NA E N E
− −
− −
− −
− −
Figure 4-9: Operation and maintenance areas
4.2.5 Modeling scenarios
Now that the mathematical model for the process equipment data matrix is defined, it is
possible to extend it to multiple pieces of equipment simultaneously and to create a data matrix
of different scenarios. Each scenario represents a unique arrangement of all the process
equipment in a PFD.
In order to cover all possible scenarios, the first step is to consider the process area as a spatial
data matrix. The algorithm sets an order for the process equipment and assigns a point in the

56
process area as the base point for one equipment at a time. Another degree of freedom in the
algorithm for each equipment is the angle, or direction of the equipment with respect to the
north of the plan. Therefore, each equipment not only has the freedom to choose its base point,
but also can set its direction (North, South, East, or West). Figure 4-10 shows a process area
with the specified length and width of L and W. It shows a possible coordination and direction
for the base point of one simple equipment.
(X01,Y01)
(X02,Y02)
Figure 4-10: Sample scenarios for the base point of a process equipment
If the number of equipment in the PFD is K, then the number of scenarios is ( ) 4KL W× × .
Figure 4-11 shows two different scenarios and the corresponding generated matrix. It shows
two orientations and two different base points for the same equipment, which generates two
different matrices of point data:

57
E1-1 E1-1
E1-10 E1-10
E1-50 E1-50 E1-1 E2-1
E1-m E1-m
X Y Cor. NA NA NA E2 N E1
X Y Op. NA NA NA E2 N E1
X Y Nozz. Nozz. NA Nozz. E2 N E1
X Y Int. NA NA NA E2 N E1
E1-Scn1 =
E1-1 E1-1
E1-10 E1-10
E1-50 E1-50 E1-1 E2-1
E1-m E1-m
X Y Cor. NA NA NA E2 E E1
X Y Op. NA NA NA E2 E E1
X Y Nozz. Nozz. NA Nozz. E2 E E1
X Y Int. NA NA NA E2 E E1
E1-Scn2 =
Figure 4-11: Two scenarios of the same equipment and their data matrices
Figure 4-12 below shows an example of a scenario (scenario n) with five equipment. Each
equipment has the freedom to set its first point and orientation in the layout. Accordingly, five
matrices are generated and the information of the specific scenario is recorded among other
thousands of other possible scenarios.
−=
−−
−−−−
−−
−−
12
12
12
12
1
11
1211501501
101101
1111
ENENANANAInternalYX
ENENozzleNAConnNozzNozzleYX
ENENANANAOperationYX
ENENANANACornerYX
E
mEmE
EEEE
EE
EE
−=
−−
−−−−
−−
−−
21
21
21
21
2
12
1112502502
102102
1212
ENENANANAInternalYX
ENENozzleNAConnNozzNozzleYX
ENENANANAOperationYX
ENENANANACornerYX
E
mEmE
EEEE
EE
EE
−=
−−
−−−−
−−
−−
31
31
31
31
3
33
2113503503
103103
1313
EENANAENAInternalYX
EENANozzleEConnNozzNozzleYX
EENANAENAOperationYX
EENANAENACornerYX
E
nEnE
EEEE
EE
EE
−=
−−
−−−−
−−
−−
54
54
54
54
5
55
1415505505
105105
1515
EWENANANAInternalYX
EWENozzleNAConnNozzNozzleYX
EWENANANAOperationYX
EWENANANACornerYX
E
sEsE
EEEE
EE
EE
−=
−−
−−−−
−−
−−
45
45
45
45
4
44
1514504504
104104
1414
ESENANANAInternalYX
ESENozzleNAConnNozzNozzleYX
ESENANANAOperationYX
ESENANANACornerYX
E
kEkE
EEEE
EE
EE
Figure 4-12: Sample scenario with five different process equipment
4.2.6 Combining matrices
In order to apply rules to each scenario, the separate matrices in each scenario should be
concatenated as one mathematical model in the form of a matrix. Equation (4.1) below shows
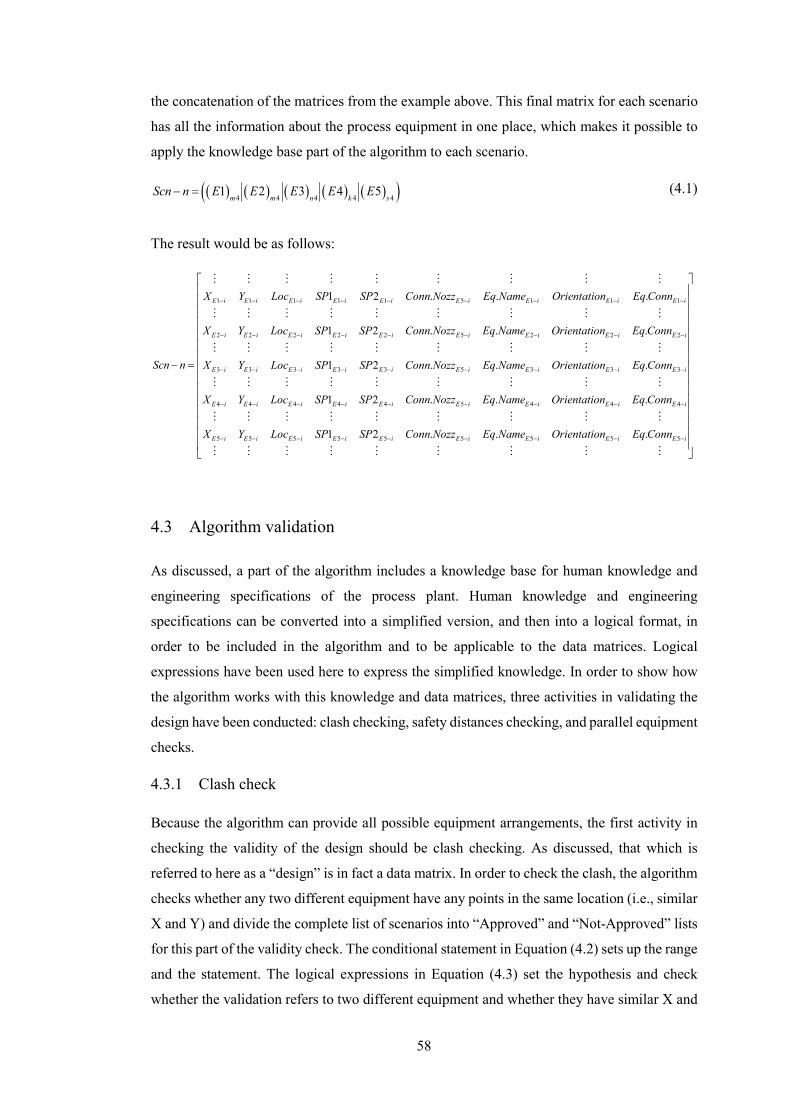
58
the concatenation of the matrices from the example above. This final matrix for each scenario
has all the information about the process equipment in one place, which makes it possible to
apply the knowledge base part of the algorithm to each scenario.
( ) ( ) ( ) ( ) ( )( )4 4 4 4 41 2 3 4 5
m m n k sScn n E E E E E− = (4.1)
The result would be as follows:
1 1 1 1 1 5 1 1 1
2 2 2 2 2 5 2 2 2
3
1 2 . . .
1 2 . . .
E i E i E i E i E i E i E i E i E i
E i E i E i E i E i E i E i E i E i
E i
X Y Loc SP SP Conn Nozz Eq Name Orientation Eq Conn
X Y Loc SP SP Conn Nozz Eq Name Orientation Eq Conn
Scn n X
− − − − − − − − −
− − − − − − − − −
−− =
3 3 3 3 5 3 3 3
4 4 4 4 4 5 4 4 4
5 5 5 5
1 2 . . .
1 2 . . .
1
E i E i E i E i E i E i E i E i
E i E i E i E i E i E i E i E i E i
E i E i E i E i
Y Loc SP SP Conn Nozz Eq Name Orientation Eq Conn
X Y Loc SP SP Conn Nozz Eq Name Orientation Eq Conn
X Y Loc SP S
− − − − − − − −
− − − − − − − − −
− − − −
5 5 5 5 52 . . .E i E i E i E i E iP Conn Nozz Eq Name Orientation Eq Conn− − − − −
4.3 Algorithm validation
As discussed, a part of the algorithm includes a knowledge base for human knowledge and
engineering specifications of the process plant. Human knowledge and engineering
specifications can be converted into a simplified version, and then into a logical format, in
order to be included in the algorithm and to be applicable to the data matrices. Logical
expressions have been used here to express the simplified knowledge. In order to show how
the algorithm works with this knowledge and data matrices, three activities in validating the
design have been conducted: clash checking, safety distances checking, and parallel equipment
checks.
4.3.1 Clash check
Because the algorithm can provide all possible equipment arrangements, the first activity in
checking the validity of the design should be clash checking. As discussed, that which is
referred to here as a “design” is in fact a data matrix. In order to check the clash, the algorithm
checks whether any two different equipment have any points in the same location (i.e., similar
X and Y) and divide the complete list of scenarios into “Approved” and “Not-Approved” lists
for this part of the validity check. The conditional statement in Equation (4.2) sets up the range
and the statement. The logical expressions in Equation (4.3) set the hypothesis and check
whether the validation refers to two different equipment and whether they have similar X and
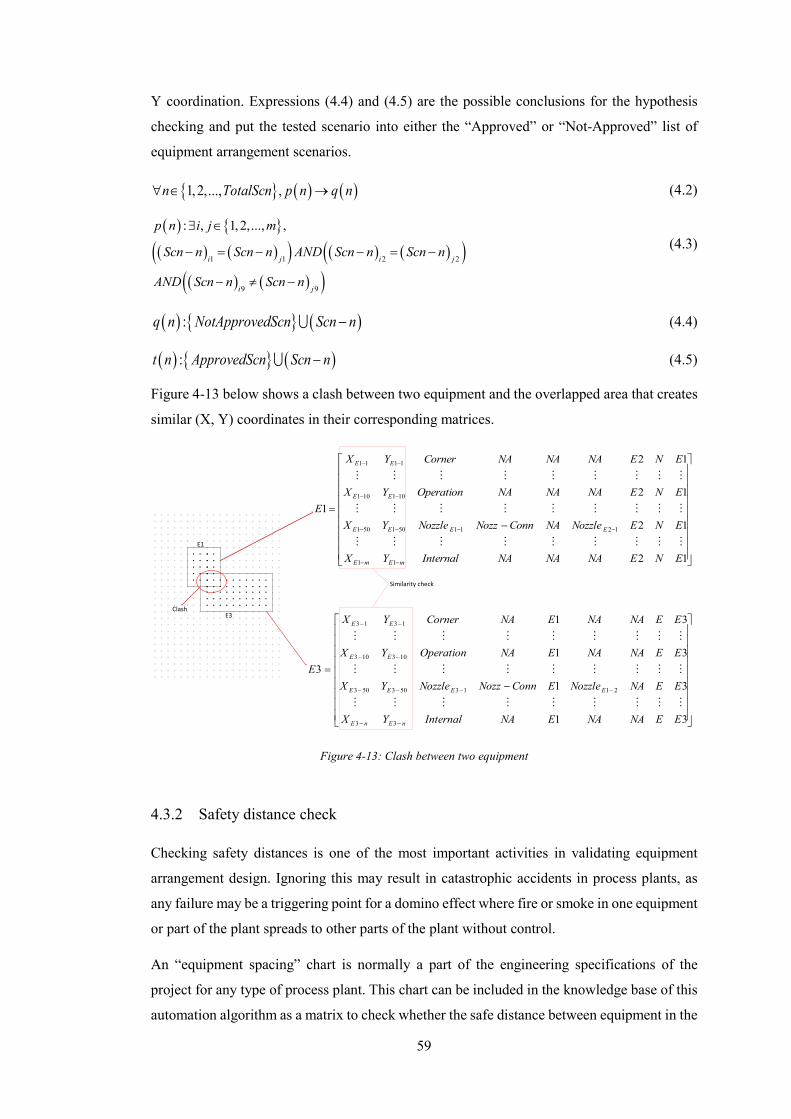
59
Y coordination. Expressions (4.4) and (4.5) are the possible conclusions for the hypothesis
checking and put the tested scenario into either the “Approved” or “Not-Approved” list of
equipment arrangement scenarios.
{ } ( ) ( )1,2,..., ,n TotalScn p n q n∀ ∈ → (4.2)
( ) { }( ) ( )( ) ( ) ( )( )
( ) ( )( )1 1 2 2
9 9
: , 1, 2,..., ,
i j i j
i j
p n i j m
Scn n Scn n AND Scn n Scn n
AND Scn n Scn n
∃ ∈
− = − − = −
− ≠ −
(4.3)
( ) { } ( ):q n NotApprovedScn Scn n− (4.4)
( ) { } ( ):t n ApprovedScn Scn n− (4.5)
Figure 4-13 below shows a clash between two equipment and the overlapped area that creates
similar (X, Y) coordinates in their corresponding matrices.
−=
−−
−−−−
−−
−−
12
12
12
12
1
11
1211501501
101101
1111
ENENANANAInternalYX
ENENozzleNAConnNozzNozzleYX
ENENANANAOperationYX
ENENANANACornerYX
E
mEmE
EEEE
EE
EE
−=
−−
−−−−
−−
−−
31
31
31
31
3
33
2113503503
103103
1313
EENANAENAInternalYX
EENANozzleEConnNozzNozzleYX
EENANAENAOperationYX
EENANAENACornerYX
E
nEnE
EEEE
EE
EE
Figure 4-13: Clash between two equipment
4.3.2 Safety distance check
Checking safety distances is one of the most important activities in validating equipment
arrangement design. Ignoring this may result in catastrophic accidents in process plants, as
any failure may be a triggering point for a domino effect where fire or smoke in one equipment
or part of the plant spreads to other parts of the plant without control.
An “equipment spacing” chart is normally a part of the engineering specifications of the
project for any type of process plant. This chart can be included in the knowledge base of this
automation algorithm as a matrix to check whether the safe distance between equipment in the

60
arrangement is considered. Figure 4-14 shows a matrix for the list of equipment in a PFD and
the required safety distance of equipment from each other. This matrix is developed along with
the development of the PFD and obtains its values from the engineering specifications of the
project.
Figure 4-14: Equipment spacing (safe distance) matrix
In order to check the safe distance, the algorithm lists all possible distances between “border”
points of each two equipment, finds the minimum, and compares that with the safe distance
matrix. Figure 4-15 illustrates some of the distances between “border” points of two
equipment.
In the mathematical description, the problem statement and logical check are represented by
Equation 4.6 and 4.7. It also computes the minimum distance between “border” points and
compares it with the safe distance matrix. In the case that the minimum distance is less than
the identified safety distance in the safe distance matrix, the scenario is identified as “Not-
Approved.” Expressions (4.8) and (4.9) show the possible conclusions for the hypothesis
checking and put the tested scenario in either the “Approved” or “Not-Approved” list.
{ } ( ) ( )1,2,..., ,n TotalScn p n q n∀ ∈ → (4.6)
( ) { }
( ) ( )( ) ( ) ( )( ) ( ) ( )( )( ) ( )( )( ) ( )( )
2 2
1 1 2 2 9 9
3 3
9 9
: , 1, 2,..., ,
min ,
' '
i j i j i j
i j
i j
p n i j m
Scn n Scn n Scn n Scn n SD Scn n Scn n
AND Scn n Scn n Border
AND Scn n Scn n
∃ ∈
− − − + − − − ⟨ − −
− = − =
− ≠ −
(4.7)
( ) { } ( ):q n NotApprovedScn Scn n− (4.8)
( ) { } ( ):t n ApprovedScn Scn n− (4.9)

61
d2
d4d1
d5
d8
d7
d3
d6
d9
d11
d10
d12
d13
d16d17
d15 d14
d18
Figure 4-15: Distances between “border” points
4.3.3 Parallel equipment arrangement check
For some equipment in the equipment arrangement design, being parallel to each other is one
of the major aspects of their positioning in the layout. This simplifies their operation,
maintenance, and piping design. Some of these cases include stand-by pumps, compressors,
or a series of shell-and-tube heat exchangers. Figure 4-16 shows an example of two parallel
equipment and their corresponding matrices. For this equipment, being parallel is not only
about the orientation of the equipment, but more importantly, it is about the location of
connected nozzles in relation to each other. The algorithm checks the type of point, its
connected nozzle on the PFD and the coordination of these two points in relation to each other.
Statement (4.10) shows the logical expression for this rule.

62
−=
−−
−−−−
−−
−−
12
12
12
12
1
11
1211501501
101101
1111
ENENANANAInternalYX
ENENozzleNAConnNozzNozzleYX
ENENANANAOperationYX
ENENANANACornerYX
E
mEmE
EEEE
EE
EE
−=
−−
−−−−
−−
−−
21
21
21
21
2
12
1112502502
102102
1212
ENENANANAInternalYX
ENENozzleNAConnNozzNozzleYX
ENENANANAOperationYX
ENENANANACornerYX
E
mEmE
EEEE
EE
EE
Figure 4-16: Parallel equipment
( ) { }( ) ( )( )
( ) ( )( )( ) ( )( )( ) ( )( ) ( ) ( )( )( )
3 5
7 9
3 3
1 1 2 2
: , 1, 2,..., ,
' '
i j
i j
i j
i j i j
p n i j m
Scn n Scn n
AND Scn n Scn n
AND Scn n Scn n Nozzle
AND Scn n Scn n AND Scn n Scn n
∃ ∈
− = −
− = −
− = − =
− ≠ − − ≠ −
(4.10)
4.4 Case study – process flow diagram
To validate the above activities (clash checking, checking safety distances, and parallel
equipment checks), below are some of the rules that can be integrated into the knowledge base
of the algorithm. This case study demonstrates the automation of a part of the equipment
arrangement in a section of a naphtha hydro-treater plant (Bausbacher & Hunt, 1990).
Figure 4-17 shows the flow diagram used in this case study and Figure 4-18 shows the part for
which the equipment arrangement will be applied. It should be noted that it is a common
practice in the design of process plants to divide the PFD into separate parts and arrange the
equipment in each part separately. Later in the design stage, these separate parts are combined
to create a complete set of equipment arrangement for the entire PFD.

63
P-101
D-101
E-107 A/B/C/D
F-101R-101
FEED SURGE DRUM
CHARGE PUMPS
FEED EXCHANGERS
REACTOR
CHARGE FURNACE105oF
105oF275oF
800oF
Figure 4-17: Process flow diagram
P-101
D-101
E-107 A/B/C/D
F-101R-101
FEED SURGE DRUM
CHARGE PUMPS
FEED EXCHANGERS
REACTOR
CHARGE FURNACE
Figure 4-18: Selected part of the PFD for automatic equipment arrangement
As shown in Figure 4-19, there are different sources for the knowledge base of the algorithm;
one part of data comes from the PFD, which is helpful in specifying the preliminary
dimensions of the process equipment. Another part is from the engineering specifications and
human knowledge. As discussed, this part of knowledge can be simplified into logical rules

64
and encoded as part of the algorithm. The algorithm is used to generate different possible
scenarios for the equipment arrangement and to validate them with the knowledge base.
P-101
D-101
FEED SURGE DRUM
CHARGE PUMPS
Data from Process Flow
Diagram (PFD)
Minimum safe distance
between D-101 and P-101
D-101 directly
connected to P-101
P-101 is a charge pump
P-101 must have a stand-by
pump
Stand-by pump should be
located parallel and in the
minimum safe distance
Directly-connected
nozzles should be aligned
Preliminary equipment dimensions
Specification rules
Best Practice according to
previous experiences
Operation and maintenance
zones should be assigned for each pump
Operation and maintenance
zones should be assigned for the
drum
Drum preliminary size
is 3300X1200 mm
Pump preliminary size
is 1100X750 mm
Stand-by pump should have the same size as the
main pump
Create a matrix model of the
drum
Create a matrix model of the
pumps
Random location and
orientation for each pump
Random location and
orientation for drum
Check
Not approved
Reject scenario Send for final check
Approved
Check
Reject scenario Add scenario to approved list
Approved
Chard and soft clash check
Not approved
Figure 4-19: Data flow and algorithm
Figure 4-20 to Figure 4-22 show three different scenarios generated by the algorithm as well
as the results of the validity check with the design knowledge base.
These figures show that scenario 1 is rejected for the clash, non-parallel positioning of the
pumps, and for not considering the minimum safety distance between the pump and the drum.
There is no clash in scenario 2 and the safety distance is considered, but the pumps are not in
a parallel situation, as required in the knowledge base of the algorithm. Scenario 3 is approved
for complying with all the necessary requirements.
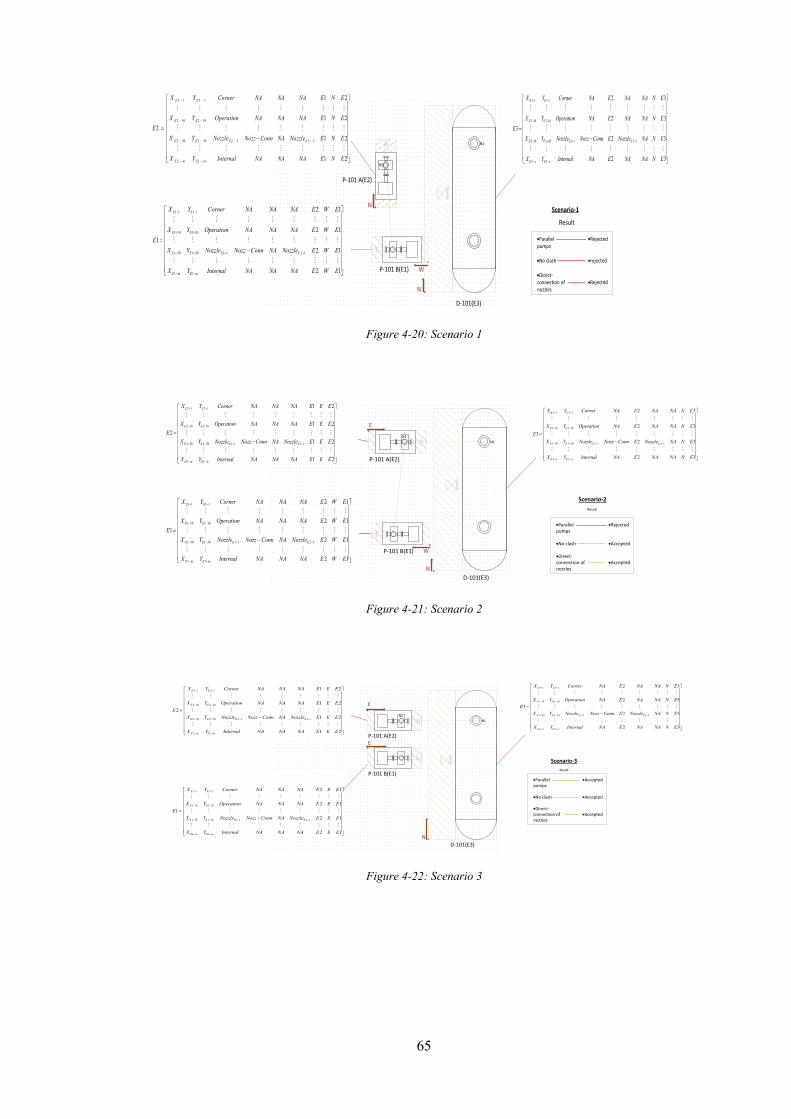
65
1 1 1 1
1 10 1 10
1 50 1 50 1 1 2 1
1 1
2 1
2 11
2 1
2 1
E E
E E
E E E E
E m E m
X Y Corner NA NA NA E W E
X Y Operation NA NA NA E W EE
X Y Nozzle Nozz Conn NA Nozzle E W E
X Y Internal NA NA NA E W E
− −
− −
− − − −
− −
= −
−=
−−
−−−−
−−
−−
21
21
21
21
2
12
1112502502
102102
1212
ENENANANAInternalYX
ENENozzleNAConnNozzNozzleYX
ENENANANAOperationYX
ENENANANACornerYX
E
mEmE
EEEE
EE
EE
3 1 3 1
3 10 3 10
3 50 3 50 3 1 2 1
3 3
2 3
2 33
2 3
2 3
E E
E E
E E E E
E n E n
X Y Corner NA E NA NA N E
X Y Operation NA E NA NA N EE
X Y Nozzle Nozz Conn E Nozzle NA N E
X Y Internal NA E NA NA N E
− −
− −
− − − −
− −
= −
Figure 4-20: Scenario 1
3 1 3 1
3 10 3 10
3 50 3 50 3 1 2 1
3 3
2 3
2 33
2 3
2 3
E E
E E
E E E E
E n E n
X Y Corner NA E NA NA N E
X Y Operation NA E NA NA N EE
X Y Nozzle Nozz Conn E Nozzle NA N E
X Y Internal NA E NA NA N E
− −
− −
− − − −
− −
= −
1 1 1 1
1 10 1 10
1 50 1 50 1 1 2 1
1 1
2 1
2 11
2 1
2 1
E E
E E
E E E E
E m E m
X Y Corner NA NA NA E W E
X Y Operation NA NA NA E W EE
X Y Nozzle Nozz Conn NA Nozzle E W E
X Y Internal NA NA NA E W E
− −
− −
− − − −
− −
= −
2 1 2 1
2 10 2 10
2 50 2 50 2 1 1 1
2 1
1 2
1 22
1 2
1 2
E E
E E
E E E E
E m E m
X Y Corner NA NA NA E E E
X Y Operation NA NA NA E E EE
X Y Nozzle Nozz Conn NA Nozzle E E E
X Y Internal NA NA NA E E E
− −
− −
− − − −
− −
= −
Figure 4-21: Scenario 2
3 1 3 1
3 10 3 10
3 50 3 50 3 1 2 1
3 3
2 3
2 33
2 3
2 3
E E
E E
E E E E
E n E n
X Y Corner NA E NA NA N E
X Y Operation NA E NA NA N EE
X Y Nozzle Nozz Conn E Nozzle NA N E
X Y Internal NA E NA NA N E
− −
− −
− − − −
− −
= −
1 1 1 1
1 10 1 10
1 50 1 50 1 1 2 1
1 1
2 1
2 11
2 1
2 1
E E
E E
E E E E
E m E m
X Y Corner NA NA NA E E E
X Y Operation NA NA NA E E EE
X Y Nozzle Nozz Conn NA Nozzle E E E
X Y Internal NA NA NA E E E
− −
− −
− − − −
− −
= −
2 1 2 1
2 10 2 10
2 50 2 50 2 1 1 1
2 1
1 2
1 22
1 2
1 2
E E
E E
E E E E
E m E m
X Y Corner NA NA NA E E E
X Y Operation NA NA NA E E EE
X Y Nozzle Nozz Conn NA Nozzle E E E
X Y Internal NA NA NA E E E
− −
− −
− − − −
− −
= −
Figure 4-22: Scenario 3

66
4.5 Case study-complete plant
By expanding the rules and integrating them into the algorithm, it is possible to cover the entire
process plant. Figure 4-23, Figure 4-24, and Figure 4-25 show three possible scenarios for the
entire plant.
Figure 4-23: Complete plant scenario 1
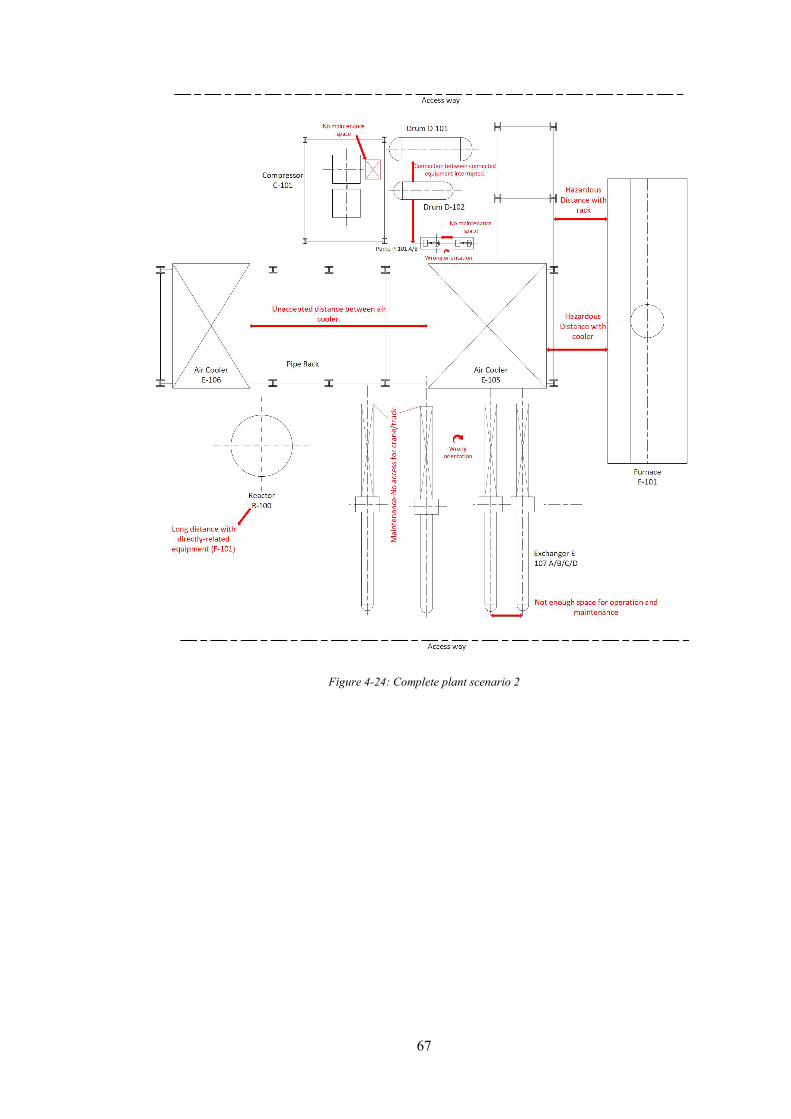
67
Figure 4-24: Complete plant scenario 2

68
Figure 4-25: Complete plant scenario 3
The comments in red are the flaws in the equipment arrangement that were detected by the
algorithm and its knowledge base. Incorrect orientation of equipment, clashes in the
arrangement, incorrect location for installation, and ignoring safe distance and equipment
spacing are some of the examples here. The last figure (scenario 3) with comments in green is
one of the scenarios with no flaws detected by the algorithm. The equipment arrangement here
considered the right location, right orientation, and safe distance between equipment. It should
be emphasized that in the background, the algorithm worked on a large set of data matrices of
2D spatial points, with their associated meta-data, which is how it was able to try all the
possible scenarios and validate each arrangement.
69
4.6 Summary and discussion
Considering the time/resource limitations for equipment arrangement, its important role for
the safety of the plant, as well as the huge number of possible scenarios to arrange equipment
in each process plant and large number of specifications and engineering practices that should
be checked for each scenario, it is important to consider an automated method to assist in this
case. In this chapter, a new algorithm was proposed to automate the equipment arrangement
in the process industry. This algorithm created point-based mathematical models of each
equipment and the plant area, created all the possible scenarios for equipment arrangement
and checked the validity of the design in each scenario. Best practices and engineering
specifications (e.g., safe distance between equipment) were encoded into the program
environment for validation. The case studies show its accuracy in detecting arrangement faults
and its ability to short-list the best scenarios.
the effectiveness of this algorithm is because it eliminates the time/resource limitations for
equipment arrangement in the basic design of process plants. Besides, it adds another safety
layer during the design stage. It provides the design team with the opportunity to check all
possible equipment arrangement scenarios, without affecting the traditional routine in
developing plot plans in process plants and works as a safe assistant in ensuring the safe and
economic design, in a very limited time.

70
Chapter 5 Automation of piping and stress analysis
Piping design, pipe support design, and piping stress analysis are considered as some of the
activities that are prone to human error in the process plant industry. A failure in a
comprehensive analysis may result in the loss of human lives during pre-commissioning,
commissioning, or operation, as well as catastrophic effects on the environment through the
leakage of hazardous material.
A lack of communication between the design and analysis team members could be considered
as one of the main drawbacks in the design process. Traditional methods of design require the
designers to update the stress analysis team regarding any changes in the equipment
arrangement, pipe routes, or pipe support locations and type. A failure in proper
communication and updating the analysis team will result in a plant design, prone to failure
due to a lack of a proper stress analysis. In this chapter, the automation of piping and pipe
supporting design and piping stress analysis has been proposed to deal with current challenges
in the industry. This chapter is divided into three main sections. Section 5.1 illustrates the
details of the algorithm for piping design between two equipment and the algorithm for the
automation of pipe support. Section 5.2 introduces an ML approach for the automation of
stress analysis. Finally, in Section 3, the use of supervised ML for stress analysis and the results
of the developed prediction model are further discussed in a case study.
5.1 Automation of piping design and supporting
Figure 5-1 illustrates the transformation from the traditional design–analysis workflow to the
automated flow, in which ML is being used. It starts with capturing data from the equipment
arrangement. These data are then used in creating all possible pipe routes and pipe supports
between each two pieces of equipment. ML is then used in the automation of piping stress
analysis.

71
Prel
imin
ary
desi
gn
Pipe
rout
ing
Pipe
supp
ort
Equi
pmen
t ar
rang
emen
t
Pipi
ng st
ress
an
alys
is
Des
ign
revi
ew
Approved Not Approve
Appr
oved
for
cons
truc
tion
Approved
Not Approved
Gen
erat
ing
pipi
ng
Isom
etri
cs
Revi
sed
pipi
ng
Isom
etri
cs
for a
naly
sis
Send
ing
info
rmat
ion
to
Stre
ss a
naly
sis
team
Prel
imin
ary
desi
gn
Equi
pmen
t ar
rang
emen
t
Pred
ictiv
e m
odel
Des
ign
revi
ew
Approved Not Approve
Appr
oved
for
cons
truc
tion
Approved
Not Approved
Auto
mat
ed P
ipe
rout
ing
and
supp
ortin
g
Figu
re 5
-1: F
rom
trad
ition
al to
aut
omat
ed d
esig
n–an
alys
is w
orkf
low

72
5.1.1 Generating possible pipe routes
The required data at this stage are the coordinates of the start and end points of the route of the
pipe, and the direction of the route from each equipment. Figure 5-2 below is shows an
example in a 3D environment:
Figure 5-2: Two equipment, two nozzles in a 3D environment
A 3D grid pattern (Figure 5-3) is required to set the points in the space between two points.
Figure 5-3: 3D grid pattern between two nozzles
Then, the distances in each direction are
0 1
0 1
0 1
DistEW X X
DistNS Y Y
DistUD Z Z
= −
= −
= −
The next step is to define the range for each of the distances in the different directions:

73
[ ][ ][ ]
1,2,3, ,
1, 2,3, ,
1, 2,3, ,
EW
NS
UD
R DistEW
R DistNS
R DistUD
=
=
=
Traveling from point 1 to point 2 for the pipe implies to complete the gap between two points
in each axis. There could be thousands of route options from point 1 to point 2. A sub-list of
routes that satisfy this condition is selected:
For EW axis, EW k EWR R− ⊂ and EWi EWR R∈ ,
[ ]1 2, , ,EW k EW EW EWnR R R R− = is accepted,
1If:
i n
EWii
R DistEW=
=
=∑
If approved, EW kR − is renamed to EW App kR − − .
For each axis, there exists a list of approved combinations:
1 2
1 2
1 2
, , , (for EW axis)
, , , (for NS axis)
, , , (for UD axis)
EW App EW App EW App EW App m
NS App NS App NS App NS App n
UD App UD App UD App UD App p
R R R R
R R R R
R R R R
− − − − − − −
− − − − − − −
− − − − − − −
= = =
A combination of them is creates a pipe route that travels from point 1 to 2. That is:
For EW App i EW AppR R− − −∈ , andNS App j NS AppR R− − −∈ UD App k UD AppR R− − −∈ :
, ,t EW App i NS App j UD App kCombination R R R− − − − − − =
It should be noted that not all these combinations are approved. For example, in the case that
both equipment nozzles are in the UD axis, the number of items in UD AppR − should be more
than 2. The comprehensive list of logical conditions for approved combinations is as follows:
( )( )
, , 1_ ' ' 2 _ ' ' 2
, , 1_ ' ' 2 _ ' ' 2
t t NS App i t NS App i
t t NS App i t EW App i
App Combination Combination R App Combination P Dir NS P Dir NS len R
App Combination Combination R App Combination P Dir EW P Dir EW len R
App Com
− − − −
− − − −
∀ − ⊂ ∈ − = ∧ = → >
∀ − ⊂ ∈ − = ∧ = → >
∀ − ( )( )
, , 1_ ' ' 2 _ ' ' 2
, , 1_ ' ' 2 _ ' ' 1
t t UD App i t UD App i
t t NS App i t NS App i
bination Combination R App Combination P Dir UD P Dir UD len R
App Combination Combination R App Combination P Dir NS P Dir NS len R
App Combination
− − − −
− − − −
⊂ ∈ − = ∧ = → >
∀ − ⊂ ∈ − = ∨ = → >
∀ − ( )( )
, , 1_ ' ' 2 _ ' ' 1
, , 1_ ' ' 2 _ ' ' 1
t t EW App i t EW App i
t t UD App i t UD App i
Combination R App Combination P Dir EW P Dir EW len R
App Combination Combination R App Combination P Dir UD P Dir UD len R
− − − −
− − − −
⊂ ∈ − = ∨ = → >
∀ − ⊂ ∈ − = ∨ = → >
An approved combination will be a set like the example below.

74
Because the algorithm works on the sequence of lists, in order to create other possible
combinations, i.e., other routes, items inside each sub-list can be shuffled to its ultimate
combination limit. Therefore, depending on the length of each sub-list, there are other
combinations of points for each approved combination.
After all approved combinations have been developed, depending on the direction of the first
and end points, the first items of each related list are stored separately.
For example, for the case that we have P1_Dir = NS and P2_Dir = UD, the first items of both
NS points and UD points are selected and used as the first and last sections of the pipe route:
Figure 5-4 below shows the result of using the first and last section of the combination of
which the length in NS axis is _ 1NS AppR and the length in UD axis is _ 1UD AppR .
Figure 5-4: Specifying two pipe sections for two equipment: Constraint in axis and direction
In the next step, all three lists in the 3 axes are combined and shuffled to create another
combination:

75
The final combination may look like the list shown below:
1 2 2 2 1, , , , , , ,i NS App EW App NS App EW Appm UD Appp NS Appn UD App UD AppApp Combination R R R R R R R R− − − − − − − − − =
A 3D representation of the list above is shown in Figure 5-5 :
Figure 5-5: Possible route from exchanger to pump
Another possible combination can be represented as below:
1 2 2 2 1, , , , , , ,j NS App UD App NS App UD Appp EW App NS Appn EW Appm UD AppApp Combination R R R R R R R R− − − − − − − − − =
A 3D representation of it is illustrated in Figure 5-6:

76
Figure 5-6: Another possible route from exchanger to pump
5.1.2 Determination of elbow number and location
One of the major types of input data for the stress analysis automation algorithm is the number
of elbows and their location. In order to calculate the number and location of elbows in each
combination, the algorithm iterates through the list and identifies the items that are different
from the previous ones. Meanwhile, it creates a summary of each section’s length to calculate
the location of the elbow.
From the coordination of the elbows, a list of coordination for all the points between the start
and end points of the route can be developed. Figure 5-7 shows the graphical representation.
( ) ( ) ( ) ( ) ( )0 0 0 0 0 1 0 0 2 0 1 0 0 2 0 1 2 0 1 1 1
Total_Points
, , , , , , , , , , , , , , , , , ,NS App EW App NS App EW App NS App NS AppX Y Z X Y R Z X R Y R Z X R Y R R Z X Y Z− − − − − −
=
+ + + + + +

77
Figure 5-7: All the points on the pipe route
5.1.3 Piping support combination
If we consider “Shoe,” “Guide,” and “Anchor” as three main piping support types for any
piping route, and set the maximum of n supports for each route, the possible combinations for
support types are given by:
( ) [ ]( ) ( )
[ ] [ ] [ ]11 12 1 21 22 2 1 2
Total_PointsSupport_Types ST , ,
Possible_Combinatons m _ 3
Support_Combinations , , , , , , , , , , , ,
n n
n n m m mn
nShoe Guide Anchor
len Support Types
S S S S S S S S S
⟨
=
= =
=
The next step is to randomly assign a pipe support to each point. Various combinations of
point-supports can be developed and analyzed by this method. Below is an illustration of two
combinations and Figure 5-8 shows the 3D model design for this configuration.

78
Figure 5-8: Two possible support design for the same pipe route

79
5.2 Machine learning for stress analysis
With the completion of the piping design and pipe support design, and with access to extracted
data from both these activities, the piping stress analysis can begin. In order to automate the
stress analysis, a supervised ML algorithm for classification, called GBM, is proposed. It
should be noted that the classical supervised learning approach requires enormous (and often
expensive) tasks in order to provide the explanatory and target variables in a specific domain.
A database of 3D models and the resulting stress analysis helps in creating the predictive model
to predict the failure/non-failure of the new pipe routes.
GBM is an ML process for regression and classification, in which new models are fitted in
order to create a better estimate of the predicted variable. It uses an ensemble of weak learners
(e.g., decision trees) to create a more complex prediction tool.
GBM has been very successful in industry and also in ML competitions (Bissacco, Yang, &
Soatto, 2007; Hutchinson, Liu, & Dietterich, 2011; Johnson & Zhang, 2014; Pittman & Brown,
2011). The GBM algorithm starts with the process of computing the deviation of residuals for
each partition and continues with determining the best data partitioning in each stage. Next,
the successive model fits the residuals from the previous stage and develops a new model to
reduce the residual variance. The reduction in the residual variance follows the functional
gradient descent technique, in which it minimizes the residual variance by descending its
derivatives.
Below is the algorithm GBM (Max Kuhn, n.d.):

80
5.2.1 Prediction model formulation
Because “supervised learning” is proposed, each pipe route should be modeled in stress
analysis software (e.g., CAESAR II) along with the supports. Data about the pipe, including
the material, thickness, diameter, and design and operation temperature and pressure, should
be entered. After finalizing the analysis, the result (i.e., failure or non-failure) should be
recorded along with the data for developing the prediction model. These data include the
location of elbows, supports, type of supports, location of head and tail of the pipe, and all the
other data that were previously entered into the analysis application. The result (i.e., failure or
non-failure of the pipe route) is be considered as the “target variable” and the remaining
variables (e.g., number of elbows and number of supports) are “explanatory variables” for the
ML model and are used to predict new pipe routes, with new explanatory variables. The
prediction model can be used to predict new pipe routes. Any route is introduced as a new
“test” dataset and the stress analysis result can be predicted. Figure 5-9 shows the workflow.

81
Data set
Training dataset Testing dataset
Creating GBM model
Prediction
Pipe route-1
Pipe route-2
Pipe route-3
…..
Pipe route-n
Prediction
Random split
Machine Learning Stage
Stress analysis result prediction stage
Accuracy of the model
Stress analysis result
Figure 5-9: Creating prediction model with GBM and using it to predict the stress analysis result of new pipe routes
The variables for the GBM method are defined as follows:
p: predictive variable
r: response variable
M: number of iteration steps for optimization
: parameter estimationθ
0̂f : initial guess

82
{ }M
iif 1ˆ
= : function increments (boosts)
λ : shrinkage parameter
maxM : maximum number of iterations
K: cross-validation parameter
K: Number of data points
The result of the stress analysis is the dataset ( ) 1, =iNrp , where ( )dppp ,,1 = is the
list of explanatory variables and y is the response variable label.
The explanatory variables ( )dppp ,,1 = , in the case of piping stress analysis and for
this study, are those variables affecting the analysis report. They are listed below:
TH: pipe tail location
n: number of elbows
m: number of supports
EL_iP ( { }1, ,i n∈ ): elbow locations
EL_icd ( { }1, ,i n∈ ): elbow change in direction
SUP_jP ( { }1, ,j m∈ ): support locations
SUP_jty ( { }1, ,j m∈ ): support types
The response variable r here is:
r: analysis result (failure or non-failure of pipe)
Td: design temperature
To: operation temperature
Pd: design pressure
Po: operation pressure
Dnom: nominal diameter of pipe
Ps: pipe service
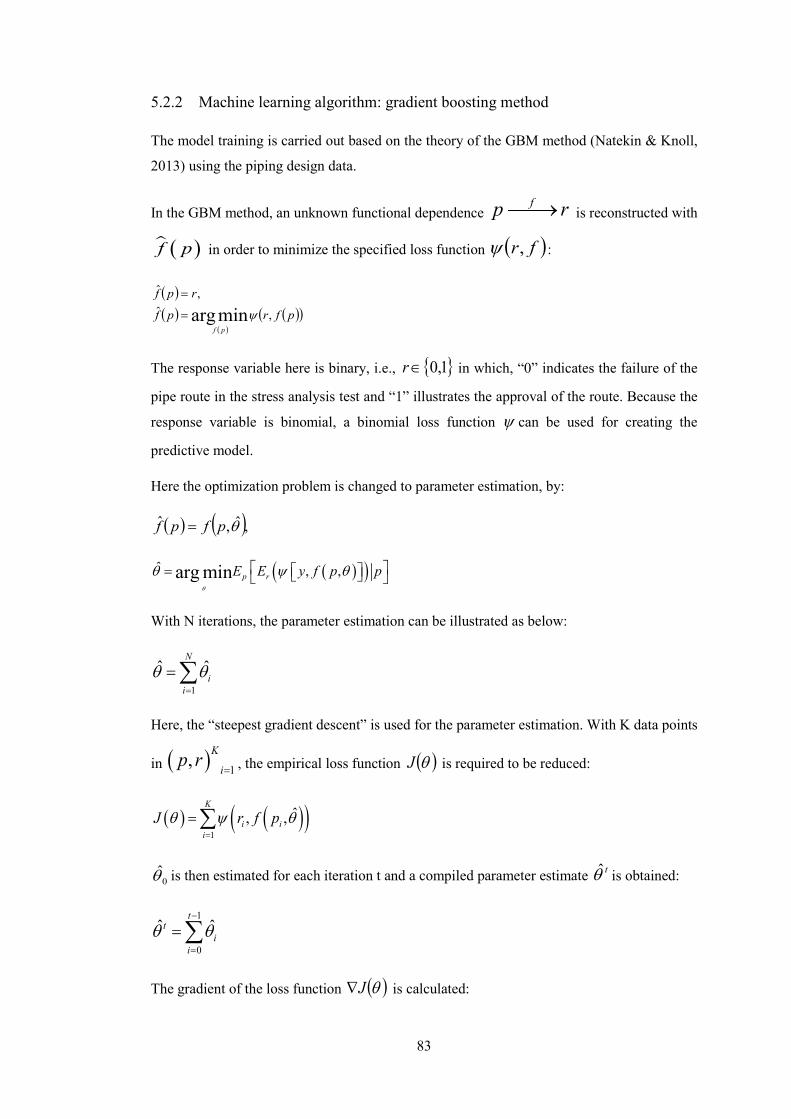
83
5.2.2 Machine learning algorithm: gradient boosting method
The model training is carried out based on the theory of the GBM method (Natekin & Knoll,
2013) using the piping design data.
In the GBM method, an unknown functional dependence rp f→ is reconstructed with
( )f p in order to minimize the specified loss function ( )fr,ψ :
( )( )
( )( )( )pfrpf
rpf
pf
,ˆ,ˆ
minarg ψ=
=
The response variable here is binary, i.e., { }1,0∈r in which, “0” indicates the failure of the
pipe route in the stress analysis test and “1” illustrates the approval of the route. Because the
response variable is binomial, a binomial loss function ψ can be used for creating the
predictive model.
Here the optimization problem is changed to parameter estimation, by:
( ) ( ),ˆ,ˆ θpfpf =
( )( )ˆ , ,arg min p rE E y f p pθ
θ ψ θ =
With N iterations, the parameter estimation can be illustrated as below:
1
ˆ ˆN
ii
θ θ=
= ∑
Here, the “steepest gradient descent” is used for the parameter estimation. With K data points
in ( ) 1, K
ip r
= , the empirical loss function ( )θJ is required to be reduced:
( ) ( )( )1
ˆ, ,K
i ii
J r f pθ ψ θ=
= ∑
0θ̂ is then estimated for each iteration t and a compiled parameter estimate tθ̂ is obtained:
1
0
ˆ ˆt
ti
iθ θ
−
=
= ∑
The gradient of the loss function ( )θJ∇ is calculated:
84
( ) ( ){ } ( )( ) ti
i JJJJ
θθθθθθ
ˆ=
∂∂
=∇=∇
A new incremental parameter estimate is then calculated and added to the ensemble:
( ) tJ θθ ˆ→∇−
It should be noted that a boosting method has been used here instead of conventional ML
techniques for optimization. The main difference is that the function estimate f̂ is
parameterized in the additive functional form.
A new function is required to be the most parallel to ( ){ } 1K
t i ig p = :
( ) ( )( )( ) ( ) ( )pfpf
rtt
ppf
pfrEpg1ˆ
,−=
∂
∂=
ψ
Using the “least-squares minimization” method for optimization purposes:
( ) ( ) ( ) 2,
1, arg min ,
K
t t t i ii
g p h pρ θρ θ ρ θ=
= − + ∑
The result depends on ( )fr,ψ and ( )θ,ph . Therefore, the next step is to choose the right
“loss function” and “base-learner.”
Classifying the loss function depends on the response variable. As the response variable is
categorical here (i.e., { }1,0∈r ), either a Binomial or Adaboost loss function can be used. If
12 −= rr and { }1,1−∈r are assumed, the probability of the response can be calculated by
(also called the Bernoulli loss):
( ) ( )( )fpfp 2exp1log, −+=ψ
or the Adaboost loss:
( ) ( )fpfp −= exp,ψ
The base-learner can be chosen from either “decision trees,” “linear models,” or “smooth
models.”
Although many other models can be used in gradient boosting, “decision trees” are one of the
most common base models. Every decision tree can be used to reduce some loss function. We
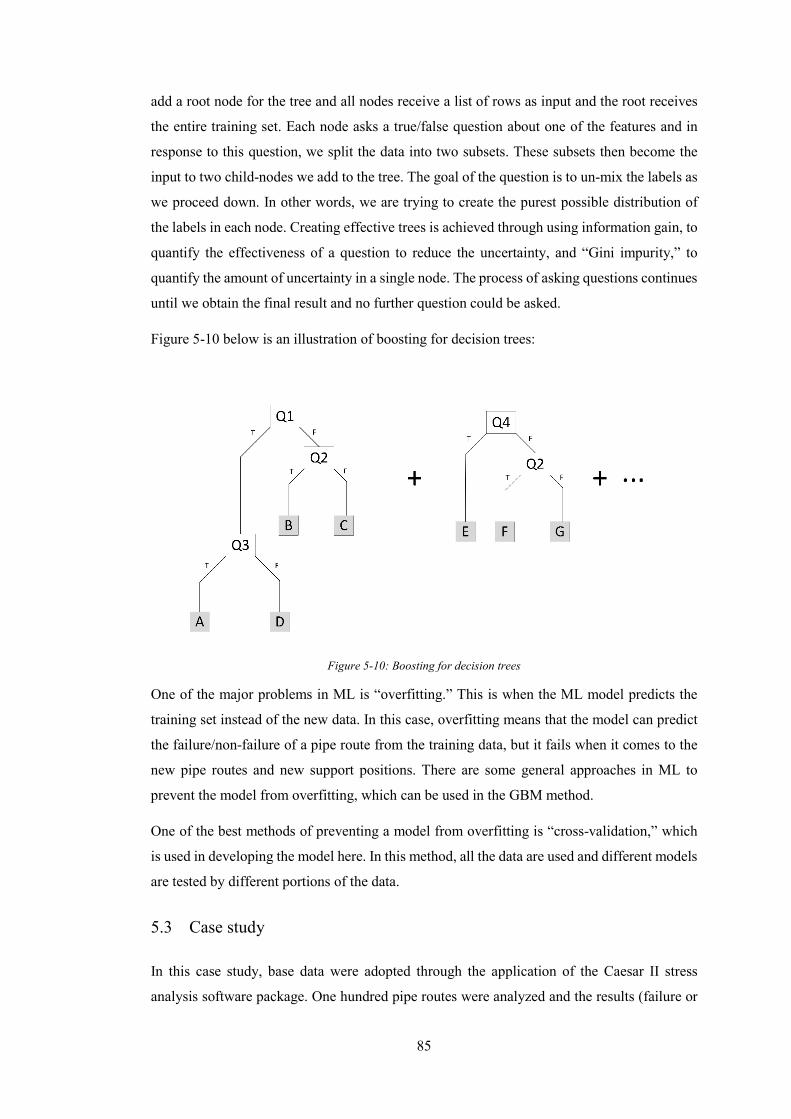
85
add a root node for the tree and all nodes receive a list of rows as input and the root receives
the entire training set. Each node asks a true/false question about one of the features and in
response to this question, we split the data into two subsets. These subsets then become the
input to two child-nodes we add to the tree. The goal of the question is to un-mix the labels as
we proceed down. In other words, we are trying to create the purest possible distribution of
the labels in each node. Creating effective trees is achieved through using information gain, to
quantify the effectiveness of a question to reduce the uncertainty, and “Gini impurity,” to
quantify the amount of uncertainty in a single node. The process of asking questions continues
until we obtain the final result and no further question could be asked.
Figure 5-10 below is an illustration of boosting for decision trees:
Figure 5-10: Boosting for decision trees
One of the major problems in ML is “overfitting.” This is when the ML model predicts the
training set instead of the new data. In this case, overfitting means that the model can predict
the failure/non-failure of a pipe route from the training data, but it fails when it comes to the
new pipe routes and new support positions. There are some general approaches in ML to
prevent the model from overfitting, which can be used in the GBM method.
One of the best methods of preventing a model from overfitting is “cross-validation,” which
is used in developing the model here. In this method, all the data are used and different models
are tested by different portions of the data.
5.3 Case study
In this case study, base data were adopted through the application of the Caesar II stress
analysis software package. One hundred pipe routes were analyzed and the results (failure or

86
non-failure) of the routes were recorded. Table 5-1 shows part of this dataset. The dataset is
first analyzed via explanatory data analysis and a graphical representation of its content. GBM
is then used to create the prediction model; 75% of the dataset is used as a training dataset and
25% is used to check the accuracy of the prediction model. Finally, 10 new pipe routes are
introduced to the prediction model and the prediction results are compared to the stress
analysis result using the analysis software (Caesar II).
5.3.1 Data generation
In order to increase the size of the training dataset, all the pipe routes, along with their
supports were rotated around the gravity axis (i.e., the Y-axis in in this case). This is done
with the knowledge that rotating pipes around the gravity axis does not affect the final result.
This way, every data point from the analysis is extended to 36 data points, with different
elbow and support locations. It improves the size of the dataset, in its training process toward
developing a prediction model. Figure 5-11 shows the graphical model of this process.
Figure 5-11: Extending the training dataset by rotating the pipes around the gravity axis

87
Tabl
e 5-
1: P
ipin
g st
ress
ana
lysi
s dat
aset
Li
ne
Num
ber
POS-
H-X
POS-
H-Y
POS-
H-Z
POS-
T-X
POS-
T-Y
POS-
T-Z
POS-
EL-1
-X
POS-
EL-1
-Y
POS-
EL-1
-Z
DI-E
L-1
…PO
S-SU
PP-1
-XPO
S-SU
PP-1
-YPO
S-SU
PP-1
-ZTY
-SU
PP-
1N
U-E
LLN
U_S
UPP
SUSF
ail
Line
110
0000
1000
0010
0000
1300
0010
0000
1000
0010
0000
1000
0010
0000
NO
…10
6000
1000
0010
0000
SHO
E0
40
Line
210
0000
1000
0010
0000
1300
0010
0000
1000
0010
0000
1000
0010
0000
NO
…10
6000
1000
0010
0000
SHO
E0
60
Line
310
0000
1000
0010
0000
1300
0010
0000
1000
0010
0000
1000
0010
0000
NO
…10
6000
1000
0010
0000
SHO
E0
60
Line
410
0000
1000
0010
0000
1270
0010
1000
1000
0012
7000
1000
0010
0000
YES
…10
6000
1000
0010
0000
SHO
E1
60
Line
510
0000
1000
0010
0000
1250
0010
1000
1020
0011
8000
1000
0010
0000
YES
…10
6000
1000
0010
0000
SHO
E3
60
Line
610
0000
1000
0010
0000
1250
0010
6000
1000
0011
8000
1000
0010
0000
YES
…10
6000
1000
0010
0000
SHO
E3
60
Line
710
0000
1000
0010
0000
1220
0010
6000
1030
0011
8000
1000
0010
0000
YES
…10
6000
1000
0010
0000
SHO
E4
31
Line
810
0000
1000
0010
0000
1220
0010
5000
1030
0011
8000
1000
0010
0000
YES
…10
6000
1000
0010
0000
SHO
E4
50
Line
910
0000
1000
0010
0000
1220
0010
5000
1040
0011
8000
1000
0010
0000
YES
…11
2000
1000
0010
0000
SHO
E3
50
Line
10
1000
0010
0000
1000
0011
9000
1050
0010
1000
1000
0010
0000
9700
0YE
S…
1030
0010
0000
9700
0SH
OE
45
0Li
ne 1
110
0000
1000
0010
0000
1190
0010
8000
1040
0010
0000
1030
0010
0000
YES
…10
9000
1030
0010
0000
SHO
E4
50
Line
12
1000
0010
0000
1000
0011
9000
1080
0010
4000
1000
0010
3000
1000
00YE
S…
1030
0010
3000
1000
00ST
OP
43
1Li
ne 1
310
0000
1000
0010
0000
1190
0010
8000
1040
0010
0000
1030
0010
0000
YES
…10
3000
1030
0010
0000
SHO
E4
31
Line
14
1000
0010
0000
1000
0011
9000
1080
0010
2000
1000
0010
3000
1000
00YE
S…
1030
0010
3000
1000
00SH
OE
45
0Li
ne 1
510
0000
1000
0010
0000
1190
0010
8000
1020
0010
0000
1030
0010
0000
YES
…10
3000
1030
0010
0000
SHO
E4
31
Line
16
1000
0010
0000
1000
0011
9000
1030
0010
0000
1000
0010
3000
1000
00YE
S…
1030
0010
3000
1000
00SH
OE
43
1Li
ne 1
710
0000
1000
0010
0000
1190
0010
3000
9300
010
0000
1030
0010
0000
YES
…10
3000
1030
0010
0000
SHO
E4
40
Line
18
1000
0010
0000
1000
0011
9000
9700
010
5000
1000
0097
000
1000
00YE
S…
1030
0097
000
1000
00SH
OE
44
0Li
ne 1
910
0000
1000
0010
0000
1190
0097
000
9600
010
0000
9700
010
0000
YES
…10
3000
9700
010
0000
SHO
E4
50
Line
20
1000
0010
0000
1000
0011
9500
1000
0010
5000
1155
0010
0000
1000
00YE
S…
1030
0010
0000
1000
00SH
OE
35
0Li
ne 2
110
0000
1000
0010
0000
1195
0010
3000
1030
0011
5500
1000
0010
0000
YES
…10
3000
1000
0010
0000
SHO
E3
60
Line
22
1000
0010
0000
1000
0011
1500
1060
0010
3000
1095
0010
0000
1000
00YE
S…
1035
0010
0000
1000
00SH
OE
44
0Li
ne 2
310
0000
1000
0010
0000
1110
0010
6000
1040
0010
0000
1000
0010
1000
YES
…10
3000
1000
0010
1000
SHO
E5
50
Line
24
1000
0010
0000
1000
0011
1000
1000
0099
000
1000
0010
0000
9600
0YE
S…
1030
0010
0000
9600
0GU
IDE
53
0Li
ne 2
510
0000
1000
0010
0000
1090
0010
6000
1040
0010
0000
1000
0010
1000
YES
…10
3000
1000
0010
1000
STO
P4
31
Line
26
1000
0010
0000
1000
0010
7000
1060
0010
0000
1000
0010
0000
9700
0YE
S…
1030
0010
0000
9700
0GU
IDE
53
1Li
ne 2
710
0000
1000
0010
0000
1110
0011
1000
1000
0010
0000
1050
0010
0000
YES
…10
0000
1000
0010
0000
NO
SUPP
40
0Li
ne 2
810
0000
1000
0010
0000
1110
0011
1000
1000
0010
0000
1050
0010
0000
YES
…10
3000
1050
0010
0000
GUID
E4
20
Line
29
1000
0010
0000
1000
0011
1000
1110
0010
0000
1000
0010
5000
1000
00YE
S…
1030
0010
5000
1000
00GU
IDE
44
0Li
ne 3
010
0000
1000
0010
0000
1090
0010
7000
1050
0010
5000
1000
0010
0000
YES
…10
0000
1000
0010
0000
NO
SUPP
50
1
…
…
…
…
…
…
…
…
…
…
…
…
…
…
…
…
…
…
…

88
The variables in the dataset are defined as shown in Table 5-2 .
Table 5-2: Variables in the dataset
Var. number
Variable name Variable description
1 POS.H.X X coordination of the head of the pipe (Constant)
2 POS.H.Y Y coordination of the head of the pipe (Constant)
3 POS.H.Z Z coordination of the head of the pipe (Constant)
4 POS.T.X X coordination of the tail of the pipe
5 POS.T.Y Y coordination of the tail of the pipe
6 POS.T.Z Z coordination of the tail of the pipe
7 POS.EL.n.X X coordination of the nth elbow in the pipe (1<=n<=6)
8 POS.EL.n.Y Y coordination of the nth elbow in the pipe (1<=n<=6)
9 POS.EL.n.Z Z coordination of the nth elbow in the pipe (1<=n<=6)
10 DI.EL.n.NO No direction change for the nth elbow in the pipe (1<=n<=6)
11 DI.EL.n.YES Direction change for the nth elbow in the pipe (1<=n<=6)
12 POS.SUPP.n.X X coordination of the nth support in the pipe (1<=n<=6)
13 POS.SUPP.n.Y Y coordination of the nth support in the pipe (1<=n<=6)
14 POS.SUPP.n.Z Z coordination of the nth support in the pipe (1<=n<=6)
15 TY.SUPP.n.GUIDE Guide support type for the nth support in the pipe (1<=n<=6)
16 TY.SUPP.n.NOSUPP No support for the nth support in the pipe (1<=n<=6)
17 TY.SUPP.n.SHOE Shoe support type for the nth support in the pipe (1<=n<=6)
18 TY.SUPP.n.STOP Stop support type for the nth support in the pipe (1<=n<=6)
19 NU.ELL Number of elbows in the pipe
20 NU_SUPP Number of supports in the pipe
21 SUSFail Failure or non-failure of pipe
The constants and constraints under consideration include:
• Design, test, and operation temperature
• Design, test, and operation pressure
• Pipe schedule/thickness
• Pipe head coordination
• Equipment nozzle allowable loads
• Maximum number of elbows: 6
• Maximum number of pipe supports: 6

89
5.3.2 Explanatory data analysis
In the section below, the correlation between the failure of a pipe route and the explanatory
variables of the models is visualized and interpreted for 3600 data points in the training dataset.
It is important to consider that the failure/non-failure of every data point in the dataset depends
on a variety of variables (i.e., explanatory variables) and cannot be relied/predicted by
individual parameters. To help with the understanding, Figure 5-12 to Figure 5-16 are used to
illustrate the pipe failure in relation to the number of elbows, supports, and head-to-tail
distance.
Elbow and failure:
Figure 5-12: Effect of number of elbows on pipe failure rate
Figure 5-12 above shows an obvious relation between the number of elbows and the failure
rate in the dataset; with the increasing number of elbows, the failure rate decreases.
Support and failure:

90
Figure 5-13: Effect of number of pipe supports on failure rate
From Figure 5-13, except for when the number of supports increased from 2 to 3, the general
trend depicts that increasing support number causes an increased failure rate. It should be noted
that the type of pipe support (i.e., shoes and guides) has different effects on the analysis with
respect to their force axes. This graph only shows a total number and does not consider the
type of support. This is the primary focus on the explanatory data analysis in the next two
graphs.
Failure and number of shoe supports:
Figure 5-14: Effect of number of “Shoe” supports on failure rate

91
As discussed above, the number of supports, by itself, cannot be considered as the only support
parameter related to the failure rate. It is also necessary to consider the type of support. The
graph above (Figure 5-14) shows the relationship between the number of shoe supports and
the failure rate in the whole dataset. There is obviously an increase in the failure rate with the
increase in shoe supports and the slope is higher than the gradient of the supports–failure rate
graph in Figure 5-13.
Failure and number of guide supports:
Figure 5-15: Effect of number of “Guide” supports on failure rate
The relationship between the number of guide supports and the failure rate (Figure 5-15) shows
a very different trend from the shoe supports. Introducing one guide can reduce the failure
from 0.63 to 0.55; however, two guide shoes brings the risk of higher failure (maximum of
0.72). The different impact from these two types of supports is due to the force axes; the shoe
support is mostly used as a weight support, whereas the guide support stops the movement of
the pipe along the perpendicular line on the axis of the pipe.
Head-to-tail distance:

92
Figure 5-16: Effect of head-to-tail distance on failure rate
Figure 5-16 shows the head-to-tail distance in each route for all 3600 data points in the dataset.
It is clear that the failed/non-failed routes are distributed around this graph and they are not
separable. This shows a low correlation between the head-to-tail distance and the analysis
result.
As discussed, GBM is an ensemble of classification trees, which takes individual decision
trees and aggregates them to form a better predictor than a single decision tree would have
been.
5.3.3 Accuracy verification
The dataset is split into two groups, 75% for training and 25% for testing, and GBM is used to
create the model.
The variable importance is one of the outputs of the prediction model. It shows the importance
level of each model input variable. Table 5-3 shows the variables in order of importance.

93
Table 5-3: Variable importance level: result of GBM model
Variable Importance
POS.EL.2.Y 12.9553693TY.SUPP.4.NOSUPP 7.8768705
POS.SUPP.2.Y 6.9308737POS.EL.5.Y 6.1576681
POS.T.Y 5.2387948TY.SUPP.2.SHOE 4.8641372
DI.EL.3.NO 3.5644723NU_SUPP 3.5346972
POS.EL.6.Y 3.4808724TY.SUPP.3.GUIDE 3.2831595TY.SUPP.6.SHOE 3.2454378
DI.EL.5.NO 3.2082149POS.SUPP.3.Y 2.8952452
NU.ELL 2.8773052TY.SUPP.5.NOSUPP 2.6422876
POS.EL.1.Y 2.1370942TY.SUPP.4.SHOE 2.0606916
TY.SUPP.6.NOSUPP 1.9041312TY.SUPP.2.STOP 1.7380178TY.SUPP.1.STOP 1.3891927
POS.SUPP.4.Y 1.368184TY.SUPP.1.GUIDE 1.3667232
POS.SUPP.2.X 1.2471682POS.EL.4.Y 1.2333643POS.EL.3.Y 1.1414419
POS.SUPP.1.Y 1.126258POS.SUPP.5.Y 0.9804106POS.SUPP.6.Y 0.870888POS.SUPP.2.Z 0.8139176
TY.SUPP.5.SHOE 0.6561795
… …
POS.EL.2.Z 0.14409755POS.T.Z 0.12409378
POS.SUPP.6.X 0.11163119POS.EL.3.X 0.08204836
POS.SUPP.3.X 0.06787305POS.EL.3.Z 0.0667646POS.EL.5.Z 0.02979592
POS.H.X 0POS.H.Y 0POS.H.Z 0
DI.EL.1.NO 0DI.EL.1.YES 0DI.EL.2.NO 0DI.EL.2.YES 0POS.EL.4.X 0POS.EL.4.Z 0DI.EL.4.NO 0DI.EL.4.YES 0POS.EL.6.X 0POS.EL.6.Z 0DI.EL.6.NO 0
POS.SUPP.1.Z 0TY.SUPP.1.NOSUPP 0
POS.SUPP.3.Z 0TY.SUPP.3.STOP 0
POS.SUPP.4.Z 0TY.SUPP.4.GUIDE 0

94
The 10 most important (i.e., most influential on the prediction model) variables are graphically
shown in Figure 5-17. In a manual modification of the pipe route and pipe support design,
these most important variables could be used to change the stress result. Increasing the training
dataset would change the importance level of the variables.
Figure 5-17: Ten most important variables in predicting stress analysis result
The relationship between the tuning parameters and the estimates of performance is shown in
Figure 5-18. The GBM model tunes the parameters to gain the best accuracy by trading off
between complexity and the training dataset size (Figure 5-18).
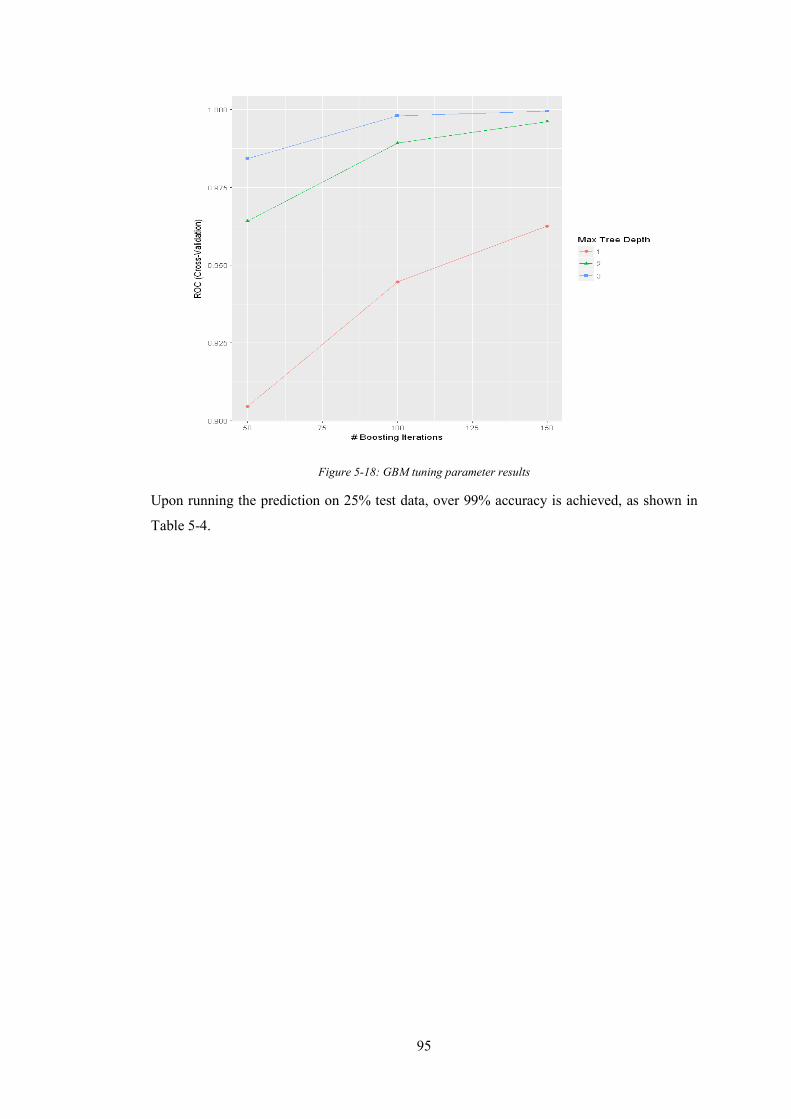
95
Figure 5-18: GBM tuning parameter results
Upon running the prediction on 25% test data, over 99% accuracy is achieved, as shown in
Table 5-4.

96
Table 5-4: Results of running GBM prediction model on test dataset
Pipe No.
PredictionCeasar II
result1 Not_App Not_App2 Not_App Not_App3 Not_App Not_App4 App App5 App App6 Not_App Not_App7 Not_App Not_App8 Not_App Not_App9 Not_App Not_App10 Not_App Not_App
… … …
273 Not_App App
… … …
832 Not_App App
… … …
894 App App895 App App896 App App897 App App898 Not_App Not_App899 App App900 Not_App Not_App901 Not_App Not_App902 Not_App Not_App903 Not_App Not_App904 Not_App Not_App
Accuracy: 0.992256637168142
The accuracy of 99.2%, achieved from the GBM method, demonstrates the possibility of using
ML methods in automating piping stress analysis. The required training data in this case were
provided through the application of the Caesar II stress analysis software package. It should
be noted that there are existing plants of which the design data can be collected and used as
the training dataset to increase the accuracy of the GBM prediction model.
5.3.4 Stress analysis prediction result
Ten new pipe routes are now analyzed using stress analysis software, and then introduced to
the GBM prediction model. Table 5-5 shows a part of the dataset and the stress analysis report,
from the software (Caesar II). This dataset is then introduced to the GBM prediction model;
Table 5-6 illustrates the prediction results. This shows that the prediction model accurately
predicted the stress result.

97
Tabl
e 5-
5: F
inal
test
dat
aset
POS-
H-X
POS-
H-Y
POS-
H-Z
POS-
T-X
POS-
T-Y
POS-
T-Z
POS-
EL-1
-XPO
S-EL
-1-Y
POS-
EL-1
-ZD
I-EL-
1…
POS-
SUPP
-1-X
POS-
SUPP
-1-Y
POS-
SUPP
-1-Z
TY-S
UPP
-1PO
S-SU
PP-2
-XPO
S-SU
PP-2
-Y
1000
0010
0000
1000
0093
000
1000
0010
0000
1000
0010
3000
1000
00YE
S…
9500
010
3000
1000
00GU
IDE
1000
0010
0000
1000
0010
0000
1000
0092
000
1000
0010
0000
1000
0010
3000
1000
00YE
S…
9700
010
3000
1000
00GU
IDE
1000
0010
0000
1000
0010
0000
1000
0092
000
1000
0010
0000
1000
0010
3000
1000
00YE
S…
9500
010
3000
1000
00GU
IDE
1000
0010
0000
1000
0010
0000
1000
0087
000
1010
0010
4000
1000
0010
0000
1040
00YE
S…
9700
010
0000
1040
00GU
IDE
9000
010
0000
1000
0010
0000
1000
0087
000
1010
0010
4000
1000
0010
0000
1040
00YE
S…
9700
010
0000
1040
00GU
IDE
9100
010
0000
1000
0010
0000
1000
0087
000
1010
0010
4000
1000
0010
0000
1040
00YE
S…
9850
010
0000
1040
00GU
IDE
8950
010
0000
1000
0010
0000
1000
0087
000
1010
0010
4500
1000
0010
0000
1045
00YE
S…
9850
010
0000
1045
00GU
IDE
8950
010
0000
1000
0010
0000
1000
0087
000
1010
0010
3500
1000
0010
0000
1035
00YE
S…
9850
010
0000
1035
00GU
IDE
8950
010
0000
1000
0010
0000
1000
0011
7000
9800
092
000
1120
0010
0000
1000
00YE
S…
1060
0010
0000
1000
00SH
OE
1140
0098
000
1000
0010
0000
1000
0010
2000
7900
093
000
1000
0010
1000
1000
00YE
S…
9800
098
000
1000
00GU
IDE
9800
089
000

98
Table 5-6: Prediction of test dataset
Test LineCaesar II
resultPrediction
TestLine-1 Not_App Not_AppTestLine-2 Not_App Not_AppTestLine-3 Not_App Not_AppTestLine-4 Not_App Not_AppTestLine-5 Not_App Not_AppTestLine-6 Not_App Not_AppTestLine-7 App AppTestLine-8 Not_App Not_AppTestLine-9 App AppTestLine-10 App App
5.4 Conclusions
The failure of piping routes is still considered a major hazard for all types of process plants.
Ideally, the engineering design team ensures sufficient safety provisions during the detailed
design stage. Such a provision method is considered time/budget-consuming and prone to
human error. It also creates a bottleneck in checking different design options (i.e., equipment
arrangement, pipe routing, and supporting) and PHA activities in a time/budget-constrained
project schedule.
This work discussed the application of automation algorithms in piping/piping support design,
and an ML algorithm in the stress analysis of piping routes. The aim of this study is to develop
a predictive model to accurately predict the result of stress analysis (i.e., failure or non-failure)
of pipe routes and pipe supporting, without using stress analysis software or manual
calculations.
Applying a gradient boosting model on the developed dataset, and testing the prediction model
on the testing dataset revealed that the prediction model is capable of predicting the stress
analysis result with 99% accuracy. The existing results of stress analysis reports of different
process plants can be used as a training dataset for extending the capabilities of such a
prediction model.
This chapter illustrated a simplified approach in predicting stress analysis reports. A complete
model/platform at the industrial stage would require a comprehensive database of previous
analysis results and a major effort by a team of engineers and AI experts.

99
This algorithm is an assistant for the design team to cover all the possible piping routes,
without missing the vital stress analysis step. This method can be easily integrated into the
traditional methods of process plant detail design and ensures a safe and economic design. It
can save time and resources without ignoring the safety of the plant in the operation and
maintenance stages.

100
Chapter 6 Process Information Modelling for safe piping
installation for process plants
The unique nature of each construction project, multidisciplinary activities, and usage of
different plant and equipment are some of the reasons for accidents in construction industry.
Process plants are considered as mega industrial projects. Construction of these projects is
considered as one of the most sophisticated construction activities. One of the major sources
of hazard in the lifecycle of the process plant is the lack of quality in piping joint welds. Lack
of quality in weld joints poses a threat as the hazardous material can leak from these joints
during the operation phase. Studies are showing the correlation between quality of weld with
the environment and safety of the location for fit-up and welding activity.
This chapter proposes a method in which Field Fit-up Weld (FFW) points can be chosen at the
design phase of the project, using 3D BIM models of the process plant. In this method, all the
information from the 3D model are extracted and analyzed in order to find the best
combination of FFW points to create a faster and safer construction method to complete a
higher quality piping installation. An algorithm developed for this method has been tested on
a case study which shows a clear difference between the numbers of hours required to work at
height in the traditional and the new method. It also demonstrates the difference in productivity
and cost of project using these two different methods.
6.1 Piping installation and field fit-up welds
Piping installation is one of the most complex activities in completing the construction of
process plants. It includes the installation of scaffolding, shop and field stress relieve
installation, shop and field welding, transportation to site, using cranes to hold the pipes before
complete installation, sand blast and painting, hydro-test, and radiographic test. In order to
install pipes, scaffolding is required to be set up as a temporary support for pipes and also as
a working deck for all the activities around piping installation. A usual practice in installation
of pipes is to prepare spools in a shop, transfer them to the construction site, and weld them
together to complete the route. This process is like putting different pieces of a 3D puzzle
together.
Although it is much faster and more convenient for the team to prepare and weld spools in a
controlled environment like fabrication shop, some activities are required to be done at the
construction site. There are two major reasons for that. First is the transportation of spools to
the site which should consider the limitation of shipping box. For example in the case of using
a flat-bed truck or a shipping container, maximum dimension of spools to be transported can

101
be 12 × 3 × 3 meters. The second reason is the possibility of the equipment footings or the
equipment not being in the right position or any mistake in the manufacturing of the
equipment. For this reason, some field fit-up welds (FFW) should be considered (at least one
for each X, Y, and Z axis in an imaginary Cartesian system). Normally 150 mm of extra length
of pipe is considered for each FFW point for required adjustments by the fitter and welder.
Figure 6-1 shows an example in which the pump has been installed in a wrong place.
Adjustments are required to be made in the piping in order to rectify the problem and connect
the pipe to the pump.
Figure 6-1: Wrong position of pipe and adjustment required in piping
In order to complete the piping installation, and, depending on the position of FFW points, a
team of fitters, welders, and testers may be required to climb up the scaffolding (mostly
through provided ladders). It means that finishing this activity not only requires work at height,
but also requires the team to climb up and down the scaffolding. Both activities are working
at height activities and are considered high-risk. Fall from height is considered as one of the
major reasons for fatalities in construction industry (Haslam et al., 2005). Therefore, any effort
in reducing the number of points higher than 2 meters can reduce the risk of injury.
Normally, FFW points are chosen from piping isometric drawings at the site during the
construction. Construction is at fast pace and decision makings in that phase are normally
bound by mistakes. Besides, in normal practices and facilities at construction site, it is not

102
possible for the team to put all the parameters together and choose the safest combination of
FFW points.
Pipe failure may result in secondary accidents, including pool formation, a cloud or a jet
(Delvosalle, Fievez, Pipart, & Debray, 2006). A comprehensive database about pipe failures
is introduced in reference (Lydell & Riznic, 2008). Kletz has listed major leaks of hazardous
material and showed that pipe failure accounted for half of these incidents (Kletz, 2009). It
also emphasis the need for focus on the design and construction to prevent these accidents
from happening.
6.2 Methodology Development
The proposed method will be applied in a project schedule. Part of the activity in construction
(i.e. field weld specification) is removed and shifted to design phase of the project. Besides, it
shifts 2 other super ceding activities (piping pre-fabrication and piping installation) to an
earlier stage of the project (Figure 6-2).
Figure 6-2: Alternative schedule
6.2.1 Information gathering from 3D model
Process plants BIM (data enriched 3D models) are capable of providing the required data for
each pipe. After data pre-processing, the algorithm could be applied in developing the best
combination. Figure 6-3 illustrates the algorithm.

103
Figure 6-3: Algorithm to choose the best combination of welding points
Number of welding points (NOP) in each pipe is gathered here:
=
mNm
NNN
NOP
3
2
1
321
Also, all the information about pipes can be gathered in one place. These information includes
the name of the pipe (Pk), number of welding points (NOPk), and size of the pipe (Sk):

104
=
mmm SNOPP
SNOPPSNOPPSNOPP
P
333
222
111
Figure 6-4 shows part of the plant in which all the required information from each pipe is
gathered in different matrices.
Figure 6-4: Creating matrices for each pipe
For each pipe, the information about every weld point is also gathered from the model. Figure
6-5 shows different matrices for each pipe and for every single welding point. All these
matrices will eventually be combined in one matrix for each pipe.
=
nnnn
k
DirZYX
DirZYXDirZYX
P
2222
1111

105
Figure 6-5: Developing matrices for each spool
6.2.2 Creating Field Weld Points
Choosing the field weld points creates different combinations for each pipe.
From here, points for spool number “n” will be split according to their directions into groups.
So for pipe ‘k’, and for j number of points in East-West axis (EW), t number of points in North-
South axis, and i number of points in Up-Down (UD) axis; we will have the arrangements as
shown below:
1
1 1
1
2
2 2
2
3
3 3
3
_
NS
NS
NS
NS
NS
NS
k NS
NS
NS
NSt
t NSt
NSt
XNS Y
Z
XNS Y
ZNOP NS X
NS YZ
XNS Y
Z
=
=
=
=
=
1
1 1
1
2
2 2
2
3
3 3
3
_
UD
UD
UD
UD
UD
UD
k UD
UD
UD
UDi
i UDi
UDi
XUD Y
Z
XUD Y
ZNOP UD X
UD YZ
XUD Y
Z
=
=
=
=
=
1
1 1
1
2
2 2
2
3
3 3
3
_
EW
EW
EW
EW
EW
EW
EWk
EW
EW
EWj
j EWj
EWj
XEW Y
Z
XEW Y
Z
XNOP EWEW Y
Z
XEW Y
Z
=
=
=
=
=
And the number of combinations for pipe ‘k’ is as shown below:

106
( ) ( ) ( )_ _ _ kNumber of Combinations
1 1 1NOP EW NOP NS NOP UDk k k
n n nX X
=
The combinations for pipe ‘k’ to include all three axis are as follows:
[ ][ ][ ]
[ ]
=
=
UDiNStEWj
UDiNStEWj
UDiNStEWj
UDNSEW
UDNSEW
UDNSEW
UDNSEW
UDNSEW
UDNSEW
UDNSEW
UDNSEW
UDNSEW
itj
k
ZZZYYYXXX
ZZZYYYXXXZZZYYYXXXZZZYYYXXX
UDNSEW
UDNSEWUDNSEWUDNSEW
nsCombinatio
311
311
311
211
211
211
111
111
111
311
211
111
Figure 6-6 illustrate an example in which 2 combinations have been developed for one pipe
with different welding points.
H
H
H
XYZ
T
T
T
XYZ
1
1
1
EW
EW
EW
XYZ
2
2
2
UD
UD
UD
XYZ
1
1
1
NS
NS
NS
XYZ
1(NS1)
2(UD2)
3(EW1)
Head
Tail
H
H
H
XYZ
T
T
T
XYZ
Head
Tail
3(NS2)
2(UD1)
1(EW2)
1
1
1
UD
UD
UD
XYZ
2
2
2
EW
EW
EW
XYZ
2
2
2
NS
NS
NS
XYZ
Combination 1 Combination 2
Figure 6-6: Two different welding combinations for one pipe

107
6.2.3 Spool dimension check for transportation
Each combination creates a number of field fit-up weld points and it means that the pipe itself
will be split into spools. These spools need to be transported to site. One important thing that
should be considered here is the dimension of each spool. Due to the size limitation of the
shipping box. If a combination creates even one spool that has bigger dimensions than the
shipping box, that spool, and also the combination, will be rejected as it is not possible to
transport it to site.
For each combination, as discussed, there are:
( )21 kHEWjn XXL −= ( )2
1 kHEWjn YYW −= ( )21 kHEWjn ZZH −=
( )22 EWjNSjn XXL −= ( )2
2 EWjNSjn YYW −= ( )22 EWjNSjn ZZH −=
( )23 NSjUDjn XXL −= ( )2
3 NSjUDjn YYW −= ( )23 NSjUDjn ZZH −=
( )24 UDjkTn XXL −= ( )2
4 UDjkTn YYW −= ( )24 UDjkTn ZZH −=
Figure 6-7 shows the spool dimensions for combinations 1 and 2 in the pipe, shown in
Figure 6-6.

108
H 11
H 12
H 13
H 14
H 21
H 22
H 23
H 24
Combination 1 Combination 2
Figure 6-7: Spool length-to be checked with shipping box dimension
[ ] [ ] [ ] [ ][ ][ ] [ ] [ ] [ ][ ][ ] [ ] [ ] [ ][ ]
[ ] [ ] [ ] [ ][ ]
=−
444333222111
343434333333323232313131
242424232323222222212121
141414131313121212111111
)(
nnnnnnnnnnnn
k
HWLHWLHWLHWL
HWLHWLHWLHWLHWLHWLHWLHWL
HWLHWLHWLHWL
DimensionsnsCombinatio

109
=
t
t
t
HWL
DimensionsTruck _
From here we check the dimension of truck and compare it with combination-dimensions to
prepare a list of approved combinations (Figure 6-7). Figure 6-8 shows the important
dimensions on a flat-bed truck. Dimensions here are considered as the ‘shipping box’
dimension for the transportation of spools, from the manufacturing yard to the construction
site.
Logical expression to choose the approved combinations for transportation purposes is as
below:
{ }nNOCk ,,3,2,1 =
{ }4,3,2,1=kNOS
kNOCi ∈
kNOSj ∈
ttt HWL ≡⟩
( ) ( ) ( )( ) { }iLHLWLLji ktijtijtij Re:, →⟩∨⟩∨⟩∀
( ) ( ) ( )( ) ( ) ( ) ( )( )( ) { }iHHHWHLWHWWWLji ktijtijtijtijtijtij Re:, →⟩∨⟩∨⟩∧⟩∨⟩∨⟩∀
( ) ( ) ( )( ) ( ) ( ) ( )( ) ( ) ( ) ( )( )( ) { }iApHHHWHLWHWWWLLHLWLLji ktijtijtijtijtijtijtijtijtij →⟩∨⟩∨⟩∧⟩∨⟩∨⟩¬∧⟩∨⟩∨⟩¬∀ :,
c
Figure 6-8: Important dimensions on a flat-bed truck

110
Approved combinations for spool ‘k’ is defined as:
=
UDfNSfEWf
UDNSEW
UDNSEW
UDNSEW
k
PPP
PPPPPPPPP
nsCombinatioApproved
333
222
111
_
6.2.4 Weld point distance from ground
For each of the approved combinations in each spool, summation of point distances from the
ground is recorded (Ground level = G.L.):
[ ][ ][ ]
[ ]
=
−−−
−−−−−−−−−
=
∑
∑
∑
∑
3
1
3
13
3
12
3
11
///
///
///
///
333
222
111
__
kf
k
k
k
GLPGLPGLP
GLPGLPGLP
GLPGLPGLP
GLPGLPGLP
k
Z
Z
Z
Z
HHHHHH
HHHHHHHHHHHHHHHHHH
oundDistFromGrnsCombinatioApproved
UDfNSfEWf
UDNSEW
UDNSEW
UDNSEW
This loop will be repeated for all the spools, from 1 to n, and approved combinations for all
the spools will be recorded.
Number of approved combinations for each spool:
=
nNAC
NACNACNAC
nsCombinatioApprovedNo
3
2
1
__
Number of total possible combinations:
NACT= NAC1 × NAC2 × NAC3 × …× NACn
6.2.5 Choosing the best combination
This final matrix lists all the combinations for the plant:

111
[ ][ ][ ]
[ ]
=
=
∑∑∑
∑∑∑
∑∑∑
∑∑∑
3
1
3
12
3
11
3
13
3
121
3
111
3
12
3
121
3
111
3
11
3
121
3
111
21
32111
22111
12111
_
TTT
TTT
nNACNACNAC
n
n
n
nNACNACNAC
n
n
n
ZZZ
ZZZ
ZZZ
ZZZ
ACACAC
ACACACACACACACACAC
nsCombinatioTotal
=
∑ ∑
∑ ∑
∑ ∑
∑ ∑
=
=
=
=
=
=
=
=
NoSi
iiNAC
NoSi
ii
NoSi
ii
NoSi
ii
TZ
Z
Z
Z
nsCombinatioTotal
1
3
1
1
3
13
1
3
12
1
3
11
_
As discussed, the best combination is the one that has the lowest summation of distances from
the ground which will reduce the number of hours working at height, the number of hours
climbing the scaffolding. In turn the job efficiency is increased as well as the safety.
The best combination is a combination ‘r’ which is ∑ ∑=
=
NoSi
iiNACr
Z1
3
1min in
∑ ∑
∑ ∑
∑ ∑
∑ ∑
=
=
=
=
=
=
=
=
NoSi
iiNAC
NoSi
ii
NoSi
ii
NoSi
ii
TZ
Z
Z
Z
1
3
1
1
3
13
1
3
12
1
3
11
.
This algorithm will be demonstrated next using the case study below to show the difference between cost, efficiency, and safety risk of the job in different combinations, in a quantified manner.
6.3 Case study
A Naphtha hydro treater unit (Bausbacher & Hunt, 1993) has been modelled and the geometry
data (including the coordination of all welding points, pipe numbers, pipe size, and weld point
direction) has been collected from the 3D model (Figure 6-9).

112
Figure 6-9: Naphtha hydro treater unit
15 pipes were randomly chosen to see the effect of different combination of points (Figure
6-10).
Figure 6-10: Part of the process plant-15 pipes chosen for the analysis

113
Table 6-1: Welding points information for 15 chosen pipes
At least 3 field weld points had to be chosen to leave enough room for required adjustments at
the construction site. Information has been exported from the 3D model and formatted to show
the required data for the analysis (Table 6-1). These information includes the number of pipes,
size, number of welding points, direction/axis of welding points, and location of each point.
The algorithm was applied on the dataset and the best combination (with the lowest summation
of distances from the ground) was chosen along with other combination, for comparison
purposes. In this case, the best set of field fit-up welding joints is as below:

114
Pipe 1: {1: [10000, 10000, 100], 2: [11150, 9850, 100], 3: [11150, 8850, 250]},
Pipe 2: {1: [11000, 10000, 100], 2: [12150, 9850, 100], 3: [12150, 8850, 250]},
Pipe 3: {1: [12300, 10000, 100], 2: [12150, 9850, 100], 3: [12150, 8850, 250]},
Pipe 4: {1: [13300, 10000, 100], 2: [13150, 9850, 100], 3: [13150, 8850, 250]},
Pipe 5: {1: [14000, 10000, 100], 2: [15150, 9850, 100], 3: [15150, 8850, 250]},
Pipe 6: {1: [15000, 10000, 100], 2: [16150, 9850, 100], 3: [16150, 8850, 250]},
Pipe 7: {1: [17150, 10000, 1000], 2: [17150, 9850, 100], 3: [17300, 9000, 2400]},
Pipe 8: {1: [18150, 10000, 1000], 2: [18150, 9850, 100], 3: [18300, 9000, 2400]},
Pipe 9: {1: [19000, 8550, 100], 2: [20150, 8700, 100], 3: [20150, 8850, 250]},
Pipe 10: {1: [21000, 8550, 100], 2: [22150, 8700, 100], 3: [22150, 8850, 250]},
Pipe 11: {1: [22000, 10000, 100], 2: [23150, 9850, 100], 3: [23150, 8850, 250]},
Pipe 12: {1: [25300, 10000, 100], 2: [25150, 9850, 100], 3: [25150, 8850, 250]},
Pipe 13: {1: [27000, 10000, 100], 2: [28150, 9850, 100], 3: [28150, 8850, 250]},
Pipe 14: {1: [11150, 15000, 1000], 2: [11150, 14850, 100], 3: [11300, 14000, 2400]},
Pipe 15: {1: [10000, 8550, 100], 2: [11150, 8700, 100], 3: [11150, 8850, 250]}
The results from the analysis of 15 pipes in the plant are discussed below.
1) Increased number of hours required to work above 2 meters (working at height): Figure 6-11 shows that the number of hours for working at height in this case (including
welding, sand blasting, painting, and radiographic test). This number increases from 0 hours
to around 350 hours which dramatically increases the risk of falling from height by choosing
the wrong combination.
Figure 6-11: Sorted number of hours working at height

115
2) Increase in the number of hours climbing above 2 meters Figure 6-12 shows that the number of meters required to climb the stairs of scaffolding. This
number increases from 0 to 2 meters which not only increases the risk of falling from height,
but also reduces the efficiency of work by increasing the number of hours required to finish
the same amount of job.
Figure 6-12: Sorted number of meters climbing of the scaffolding
3) Decrease in productivity Here, productivity (welding per hour) is defined as “total output/total input”. In this case, the
output, which is the total number of field fit-up welds, is constant. On the other hand, the input,
which is the total amount of time required to finish the FFW welding, changes with the chosen
combination:
( ) 2 2NumberOfWeldings WeldingHoursAbove M WeldingHoursBelow M +
∑ ∑
Figure 6-13 shows that the productivity decreases from 0.25 to 0.05 (20 % decrease) by
choosing the wrong combination of field-weld points.

116
Figure 6-13: Decrease in productivity
4) Increase in cost Figure 6-14 shows that the price of welding (with an average of 100 AUD/hour rate of payment
for pipe welding in construction site) increases from around 12000 AUD to around 54000
AUD.
The cost is calculated by:
( ) HourtWeldingCosngbScaffoldiCMowWeldingBelMveWeldingAbo ×++∑ ∑ ∑ lim22
Figure 6-14: Increase in the cost of the project

117
6.4 Complexity analysis of the algorithm
In order to develop the complexity analysis of the algorithm, it was run on a supercomputer
platform with access to 48 GB RAM and parallel computing. Figure 6-15 shows the
complexity analysis.
Figure 6-15: Complexity analysis
6.5 Conclusions
The traditional methods of choosing field fit-up welds, scheduling the activity for construction
phase, and using hard copy piping isometric drawings are all creating a high-risk environment
for fitters, welders, sandblast and painting, and radiographic test team members. Besides, with
millions of combinations to choose from, it is almost impossible for the team at construction
site to choose the safest and most-economic option. Construction of complex mega projects,
such as process plants, requires the engagement of data from 3D models, shifting the activities
to the design phase, and developing domain algorithms that can increase safety and reduce the
potential for hazard.
An algorithm was developed (using 3D models) to find the best combination for this activity
(with minimum working hours at height). Application of the algorithm to a 15-pipe case study
suggested that this method could help in reducing the number of hours working/climbing at
heights, therefore, improving efficiency of the project.

118
Chapter 7 Conclusions and Recommendations
Hazardous nature of process plant industry and its potential to create a catastrophic disaster
for the human being and nature is still not under control. Throughout the years, different
techniques have been introduced to reduce the risk in design, construction, operation, and
maintenance of these mega projects. With the rise of Artificial Intelligence and capabilities of
computer and data science in the past decade, it is time to propose methods that integrate AI’s
best practices into the process industry to reduce the risk in different phases of such projects.
The review on the literature and previous studies revealed the lack of practical proposals that
can be applied into the real world practices. These methods should reach for a union with
existing methodologies in industry and go beyond academic theories to deal with current
problems. The aim of this research was to assess the opportunities in using information,
Artificial Intelligence, and Semantic knowledge in risk analysis, risk deduction, and
automation of design in process plant industry. This study successfully:
• Developed ontology-based information models from Piping and Instrument diagrams;
• Created machine-readable knowledge bases from engineering specification and lesson
learned in process industry without Natural Language Processing;
• Combined human knowledge and engineering drawings, and used Description Logic
for design analysis;
• Developed an algorithm to integrate engineering knowledge and extract data from
P&ID to automate equipment arrangement design;
• Developed an algorithm to automate pipe routing and pipe supporting;
• Used Logistic regression methods in Machine learning to automate piping stress
analysis;
• Developed an algorithm to optimise the selection of ‘field fit-up weld’ points, reduce
risk in construction and increase speed and efficiency in construction of process
plants.
Conclusions and recommendations, achieved from applying these methods, are discussed
below.
7.1 Conclusions
• In this study, knowledge engineering and semantic technology were used for risk
analysis in process industry. Its application on two case studies were successfully
illustrated. This study shows that creating a comprehensive knowledge base and
accompanying a logical query platform can minimize the time for safety analysis and

119
minimizes human error. Furthermore, in this part of the study, flexibility of ontology
knowledge base in integrating data from different sources, including data from
engineering drawings, engineering specifications, and human knowledge were also
presented. Also, using Controlled Natural Language to convert human natural
language to ontology language were discussed and presented. Using a built-in logical
reasoner to accurately gain response from the knowledge base was illustrated.
• A new algorithm to automate the equipment arrangement was proposed. This
algorithm was successfully applied on two case studies and the results illustrated its
power and accuracy in automating a time consuming task. The first part of the
algorithm is about converting equipment objects into point matrices. In the second
part, engineering specifications and practices for equipment arrangement are encoded
to be a part of the code. Using this algorithm, it is now possible to use extracted data
from P&ID drawings to integrate them with engineering specifications, in the
programming language format, to create multiple scenarios and filter the approved
ones.
• An algorithm was developed to create all possible pipe routes and pipe supports. Also
a machine-learning algorithm was used to automate the process of piping stress
analysis. Both algorithms were successfully used in 2 case studies. The pipe route and
support algorithm created all possible design scenarios for pipe route and support
between 2 points in a 3D model area. Applying the machine-learning algorithm and
using the prediction model revealed its potential to reach 99% accuracy in predicting
the stress analysis result of new pipe routes, with new supporting system.
• The study also proposed the use of data in process plant 3D models to choose the best
(i.e. safest) set of FFW points during the design stage. Testing the developed algorithm
in a case study showed its potential in decreasing the amount of hour required to work
at height and climbing the scaffolding and also decrease in project cost and increase
in productivity.
7.2 Recommendations
1) In order to create ontologies from process drawings (e.g. Piping and Instrument
Diagrams), data-enriched CAD drawings need to be developed and meta-data should
be added to different components. Currently used drawings in the industry are limited
in their data and are not providing opportunities to apply semantic knowledge systems
on them.
2) Creating a knowledge base to combine data from drawings and knowledge
specifications requires the human language to be converted to a machine-readable

120
format and compatible with other part of the knowledge base (i.e. engineering drawing
data). Since Natural Language Processing (NLP) is not developing semantic language
format of knowledge (i.e. in the form OWL language), it is recommended that the
human knowledge and engineering specifications to be converted to OWL language.
Controlled Natural Language (CNL) and FE ontology editor can be used in this case.
It is recommended that ISO 15926 standard to be used in converting natural language
to CNL, and to OWL.
3) It is recommended that the equipment arrangement algorithm to run along with the
development of the P&ID for a better collaboration between process and mechanical
design teams. Future study in the section focuses on developing 3D models of the
equipment arrangement to reach the capabilities beyond 2D models. Along with
development of the 3D equipment arrangement models, it is recommended that the
pipe routing and pipe support design algorithm to run to provide opportunities for
design review in the early stages of the project. Future study in this field links this
information model to a cost estimation platform to compare the cost of material in
different design scenarios.
4) In order to gain more accurate results in the industrial usage of machine learning for
piping stress analysis, it is recommended that the information from piping models (e.g.
geometrical location of elbows, supports, etc.) and their stress analysis results in the
existing process plants to be recorded in a data base and used as the ‘training’ data
base for the machine learning algorithm. Future study in this area focuses on linking
the piping design algorithm to the analysis platform, so that the automatic design and
analysis could be performed simultaneously.
5) It is recommended that the Field Fit-Up weld selection activity to be shifted, from
construction phase to the design phase of the project. It can reduce the error in the
selection process and ultimately increase the efficiency and safety. Future study in this
area can be extended to scaffolding and machineries (e.g. cranes).
Safety analysis in the basic phases of a process plant project is a significant industrial problem.
By application of the modern techniques in Artificial Intelligence, semantic web, knowledge
engineering, machine learning, Information Modelling, and Automation of design, a safer
design for the lifecycle of a process plant could be achieved. The results could be beneficial
to all process industries. We’re looking forward to making contributions to further
improvement and advances in this area.

121
References Abbassi, R., Khan, F., Garaniya, V., Chai, S., Chin, C., & Hossain, K. A. (2015). An integrated
method for human error probability assessment during the maintenance of offshore
facilities. Process Safety and Environmental Protection, 94, 172–179.
Ahmadi, A., Pishvaee, M. S., & Jokar, M. R. A. (2017). A survey on multi-floor facility layout
problems. Computers & Industrial Engineering, 107, 158–170.
Akbarnia, M., Amidpour, M., & Shadaram, A. (2009). A new approach in pinch technology
considering piping costs in total cost targeting for heat exchanger network. Chemical
Engineering Research and Design, 87(3), 357–365.
Alves, D. T. S., de Medeiros, J. L., & Araújo, O. de Q. F. (2016). Optimal determination of
chemical plant layout via minimization of risk to general public using Monte Carlo and
Simulated Annealing techniques. Journal of Loss Prevention in the Process Industries,
41, 202–214. https://doi.org/https://doi.org/10.1016/j.jlp.2016.03.026
Anjos, M. F., & Vieira, M. V. C. (2017). Mathematical optimization approaches for facility
layout problems: The state-of-the-art and future research directions. European Journal
of Operational Research, 261(1), 1–16.
https://doi.org/https://doi.org/10.1016/j.ejor.2017.01.049
Antoniou, G., & Van Harmelen, F. (2004). Web ontology language: Owl. In Handbook on
ontologies (pp. 67–92). Springer.
Ayodele, T. O. (2010). Introduction to machine learning. In New Advances in Machine
Learning. InTech.
Baader, F., Horrocks, I., & Sattler, U. (2008). Description logics. Foundations of Artificial
Intelligence, 3, 135–179.
Barth, M., Strube, M., Fay, A., Weber, P., & Greifeneder, J. (2009). Object-oriented
engineering data exchange as a base for automatic generation of simulation models. In
Industrial Electronics, 2009. IECON’09. 35th Annual Conference of IEEE (pp. 2465–
2470). IEEE.
Bausbacher, E., & Hunt, R. (1990). Process plant layout and piping design. Auerbach
Publishers,.
Bausbacher, E., & Hunt, R. (1993). Process plant layout and piping design. PTR Prentice Hall.
Behm, M. (2005). Linking construction fatalities to the design for construction safety concept.
Safety Science, 43(8), 589–611.

122
Berg, H.-P., Gersinska, R., & Sievers, J. (2010). Procedure for probabilistic safety assessment
of leaks and breaks of piping systems. International Journal of Pressure Vessels and
Piping, 87(2), 94–99. https://doi.org/https://doi.org/10.1016/j.ijpvp.2009.12.006
Bissacco, A., Yang, M.-H., & Soatto, S. (2007). Fast human pose estimation using appearance
and motion via multi-dimensional boosting regression. In Computer Vision and Pattern
Recognition, 2007. CVPR’07. IEEE Conference on (pp. 1–8). IEEE.
Bou-ghannam, A. (2013). Foundational Ontologies for Smarter Industries, 1–28. Retrieved
from http://www.redbooks.ibm.com/abstracts/redp5081.html?Open
Bragatto, P., Monti, M., Giannini, F., & Ansaldi, S. (2007). Exploiting process plant digital
representation for risk analysis. Journal of Loss Prevention in the Process Industries,
20(1), 69–78.
Brown, N. R., Seker, V., Revankar, S. T., & Downar, T. J. (2012). An endothermic chemical
process facility coupled to a high temperature reactor. Part I: Proposed accident scenarios
within the chemical plant. Nuclear Engineering and Design, 246, 256–265.
https://doi.org/https://doi.org/10.1016/j.nucengdes.2011.12.027
Bullock, C., Mitchell, F., & Skelton, B. (1991). Developments in the use of the hazard and
operability study. Professional Safety, 36(8), 33.
Burdorf, A., Kampczyk, B., Lederhose, M., & Schmidt-Traub, H. (2004). CAPD—computer-
aided plant design. Computers & Chemical Engineering, 28(1), 73–81.
Cai, B., Liu, Y., Zhang, Y., Fan, Q., Liu, Z., & Tian, X. (2013). A dynamic Bayesian networks
modeling of human factors on offshore blowouts. Journal of Loss Prevention in the
Process Industries, 26(4), 639–649.
Caputo, A. C., Pelagagge, P. M., Palumbo, M., & Salini, P. (2015). Safety-based process plant
layout using genetic algorithm. Journal of Loss Prevention in the Process Industries, 34,
139–150.
Chang, J. I., & Lin, C.-C. (2006). A study of storage tank accidents. Journal of Loss Prevention
in the Process Industries, 19(1), 51–59.
Chapman, R. E. (2005). Inadequate Interoperability: a closer look at the costs. In International
Symposium on Automation and Robotics in Construction ISARC (Vol. 22).
Cui, L., Zhao, J., & Zhang, R. (2010). The integration of HAZOP expert system and piping
and instrumentation diagrams. Process Safety and Environmental Protection, 88(5),
327–334. https://doi.org/https://doi.org/10.1016/j.psep.2010.04.002

123
Darbra, R. M., Palacios, A., & Casal, J. (2010). Domino effect in chemical accidents: main
features and accident sequences. Journal of Hazardous Materials, 183(1), 565–573.
de Melo, R. R. S., Costa, D. B., Álvares, J. S., & Irizarry, J. (2017). Applicability of unmanned
aerial system (UAS) for safety inspection on construction sites. Safety Science, 98, 174–
185.
Delvosalle, C., Fievez, C., Pipart, A., & Debray, B. (2006). ARAMIS project: a comprehensive
methodology for the identification of reference accident scenarios in process industries.
Journal of Hazardous Materials, 130(3), 200–219.
Du Plessis, M. (2007). The role of knowledge management in innovation. Journal of
Knowledge Management, 11(4), 20–29.
Dunjó, J., Fthenakis, V., Vílchez, J. A., & Arnaldos, J. (2010a). Hazard and operability
(HAZOP) analysis. A literature review. Journal of Hazardous Materials, 173(1), 19–32.
Dunjó, J., Fthenakis, V., Vílchez, J. A., & Arnaldos, J. (2010b). Hazard and operability
(HAZOP) analysis. A literature review. Journal of Hazardous Materials, 173(1), 19–32.
Eini, S., Abdolhamidzadeh, B., Reniers, G., & Rashtchian, D. (2015). Optimization procedure
to select an inherently safer design scheme. Process Safety and Environmental
Protection, 93, 89–98.
Eweje, J., Turner, R., & Müller, R. (2012). Maximizing strategic value from megaprojects:
The influence of information-feed on decision-making by the project manager.
International Journal of Project Management, 30(6), 639–651.
Fabiano, B., & Currò, F. (2012). From a survey on accidents in the downstream oil industry to
the development of a detailed near-miss reporting system. Process Safety and
Environmental Protection, 90(5), 357–367.
Fuchs, N. E., Schwertel, U., & Schwitter, R. (1998). Attempto Controlled English—not just
another logic specification language. In International Workshop on Logic Programming
Synthesis and Transformation (pp. 1–20). Springer.
Gallagher, C., Underhill, E., & Rimmer, M. (2003). Occupational safety and health
management systems in Australia: Barriers to success. Policy and Practice in Health and
Safety, 1(2), 67–81.
Gallaher, M. P., O’Connor, A. C., Dettbarn, John L, J., & Gilday, L. T. (2004). Cost analysis
of inadequate interoperability in the US capital facilities industry. National Institute of
Standards and Technology (NIST).

124
Galluzzo, M., Bartolozzi, V., & Rinaudo, C. (1999). Automating HAZOP analysis of batch
processes. Computers & Chemical Engineering, 23, S661–S664.
https://doi.org/https://doi.org/10.1016/S0098-1354(99)80162-8
Gould, K. S., Ringstad, A. J., & van de Merwe, K. (2012). Human reliability analysis in major
accident risk analyses in the Norwegian petroleum industry. In Proceedings of the
Human Factors and Ergonomics Society Annual Meeting (Vol. 56, pp. 2016–2020). Sage
Publications.
Gruber, T., Ontology, I. L. L., & Özsu, M. T. (2009). Encyclopedia of database systems.
Ontology.
Guimaraes, A. C. F., & Lapa, C. M. F. (2006). Hazard and operability study using approximate
reasoning in light-water reactors passive systems. Nuclear Engineering and Design,
236(12), 1256–1263.
Guirardello, R., & Swaney, R. E. (2005). Optimization of process plant layout with pipe
routing. Computers & Chemical Engineering, 30(1), 99–114.
Guo, H., Yu, Y., & Skitmore, M. (2017). Visualization technology-based construction safety
management: A review. Automation in Construction, 73, 135–144.
Guo, H., Yu, Y., Xiang, T., Li, H., & Zhang, D. (2017). The availability of wearable-device-
based physical data for the measurement of construction workers’ psychological status
on site: From the perspective of safety management. Automation in Construction.
Haslam, R. A., Hide, S. A., Gibb, A. G. F., Gyi, D. E., Pavitt, T., Atkinson, S., & Duff, A. R.
(2005). Contributing factors in construction accidents. Applied Ergonomics, 36(4), 401–
415.
Heino, P., Suokas, J., & Karvonen, I. (1988). An expert system in process design-analysis of
process safety and reliability. In Artificial Intelligence for Industrial Applications, 1988.
IEEE AI’88., Proceedings of the International Workshop on (pp. 225–231). IEEE.
Hightower, D. W. (1988). A solution to line routing problems on the continuous plane. In
Papers on Twenty-five years of electronic design automation (pp. 11–34). ACM.
Hinze, J. W., & Teizer, J. (2011). Visibility-related fatalities related to construction equipment.
Safety Science, 49(5), 709–718.
Hongling, G., Yantao, Y., Weisheng, Z., & Yan, L. (2016). BIM and Safety Rules Based
Automated Identification of Unsafe Design Factors in Construction. Procedia
Engineering, 164, 467–472.

125
Horrocks, I., Patel-Schneider, P. F., & Van Harmelen, F. (2003). From SHIQ and RDF to
OWL: The making of a web ontology language. Web Semantics: Science, Services and
Agents on the World Wide Web, 1(1), 7–26.
Houssin, R., & Coulibaly, A. (2011). An approach to solve contradiction problems for the
safety integration in innovative design process. Computers in Industry, 62(4), 398–406.
Hurme, M., & Rahman, M. (2005). Implementing inherent safety throughout process lifecycle.
Journal of Loss Prevention in the Process Industries, 18(4), 238–244.
Hutchinson, R. A., Liu, L.-P., & Dietterich, T. G. (2011). Incorporating Boosted Regression
Trees into Ecological Latent Variable Models. In AAAI (Vol. 11, pp. 1343–1348).
Ito, T. (1999). A genetic algorithm approach to piping route path planning. Journal of
Intelligent Manufacturing, 10(1), 103–114.
Johnson, R., & Zhang, T. (2014). Learning nonlinear functions using regularized greedy forest.
IEEE Transactions on Pattern Analysis and Machine Intelligence, 36(5), 942–954.
Jones, D. W. (1992). Lessons from HAZOP experiences. Hydrocarbon Processing, 71(4), 77–
80.
Kang, B., Lee, B., Kang, K., Suh, J., & Yoon, E. (1999). AHA: a knowledge based system for
automatic hazard identification in chemical plant by multimodel approach. Expert
Systems with Applications, 16(2), 183–195.
https://doi.org/https://doi.org/10.1016/S0957-4174(98)00070-0
Kang, B., Yoon, E. S., & Suh, J. C. (2001). Application of automated hazard analysis by new
multiple process-representation models to chemical plants. Industrial & Engineering
Chemistry Research, 40(8), 1891–1902.
Kariuki, S. G., & Löwe, K. (2007). Integrating human factors into process hazard analysis.
Reliability Engineering & System Safety, 92(12), 1764–1773.
Karvonen, I., Heino, P., & Suokas, J. (1990). Knowledge Based Approach to Support HAZOP-
Studies. Technical Research Centre of Finland.
Kaufmann, E., & Bernstein, A. (2010). Evaluating the usability of natural language query
languages and interfaces to Semantic Web knowledge bases. Web Semantics: Science,
Services and Agents on the World Wide Web, 8(4), 377–393.
https://doi.org/http://dx.doi.org/10.1016/j.websem.2010.06.001
Khan, F. I., & Abbasi, S. . (1999). Major accidents in process industries and an analysis of
causes and consequences. Journal of Loss Prevention in the Process Industries, 12(5),
126
361–378. https://doi.org/10.1016/S0950-4230(98)00062-X
Khan, F. I., & Abbasi, S. A. (1997a). OptHAZOP—an effective and optimum approach for
HAZOP study. Journal of Loss Prevention in the Process Industries, 10(3), 191–204.
https://doi.org/https://doi.org/10.1016/S0950-4230(97)00002-8
Khan, F. I., & Abbasi, S. A. (1997b). TOPHAZOP: a knowledge-based software tool for
conducting HAZOP in a rapid, efficient yet inexpensive manner. Journal of Loss
Prevention in the Process Industries, 10(5–6), 333–343.
Khan, F. I., & Amyotte, P. R. (2002). Inherent safety in offshore oil and gas activities: a review
of the present status and future directions. Journal of Loss Prevention in the Process
Industries, 15(4), 279–289.
Khan, F., Rathnayaka, S., & Ahmed, S. (2015). Methods and models in process safety and risk
management: past, present and future. Process Safety and Environmental Protection, 98,
116–147.
Kidam, K., & Hurme, M. (2012). Design as a contributor to chemical process accidents.
Journal of Loss Prevention in the Process Industries, 25(4), 655–666.
https://doi.org/https://doi.org/10.1016/j.jlp.2012.02.002
Kidam, K., Sahak, H. A., Hassim, M. H., Shahlan, S. S., & Hurme, M. (2016). Inherently safer
design review and their timing during chemical process development and design. Journal
of Loss Prevention in the Process Industries, 42, 47–58.
https://doi.org/https://doi.org/10.1016/j.jlp.2015.09.016
Kletz, T. A. (2009). Don’t just pass the parcel: Accidents that would not have occurred if those
involved had talked together. Journal of Loss Prevention in the Process Industries, 22(6),
667–671.
Kuhn, T. (2014). A survey and classification of controlled natural languages. Computational
Linguistics, 40(1), 121–170.
Kujath, M. F., Amyotte, P. R., & Khan, F. I. (2010). A conceptual offshore oil and gas process
accident model. Journal of Loss Prevention in the Process Industries, 23(2), 323–330.
Leal, D. (2005). ISO 15926. Oil & Gas Science and Technology, 60(4), 629–637.
Lee, C. Y. (1961). An algorithm for path connections and its applications. IRE Transactions
on Electronic Computers, (3), 346–365.
Lü, N., & Wang, X. (2007). SDG-Based HAZOP and Fault Diagnosis Analysis to the
Inversion of Synthetic Ammonia. Tsinghua Science & Technology, 12(1), 30–37.

127
https://doi.org/https://doi.org/10.1016/S1007-0214(07)70005-6
Lucanu, D., Li, Y. F., & Dong, J. S. (2006). Semantic web languages–towards an institutional
perspective. In Algebra, Meaning, and Computation (pp. 99–123). Springer.
Lundeen, K. M., Kamat, V. R., Menassa, C. C., & McGee, W. (2017). Scene understanding
for adaptive manipulation in robotized construction work. Automation in Construction,
82, 16–30.
Lundteigen, M. A., & Rausand, M. (2008). Spurious activation of safety instrumented systems
in the oil and gas industry: Basic concepts and formulas. Reliability Engineering &
System Safety, 93(8), 1208–1217.
Lydell, B., & Riznic, J. (2008). OPDE—The international pipe failure data exchange project.
Nuclear Engineering and Design, 238(8), 2115–2123.
Mahnken, G. E. (2001). Use case histories to energize your HAZOP. Chemical Engineering
Progress, 97(3), 73–78.
Malekitabar, H., Ardeshir, A., Sebt, M. H., & Stouffs, R. (2016). Construction safety risk
drivers: A BIM approach. Safety Science, 82, 445–455.
Max Kuhn. (n.d.). The caret Package. Retrieved January 29, 2018, from
https://topepo.github.io/caret/index.html
Mohammadfam, I., Kalatpour, O., Golmohammadi, R., & Khotanlou, H. (2013). Developing
a process equipment failure knowledge base using ontology approach for process
equipment related incident investigations. Journal of Loss Prevention in the Process
Industries, 26(6), 1300–1307.
Morbach, J., Yang, A., & Marquardt, W. (2007). OntoCAPE—A large-scale ontology for
chemical process engineering. Engineering Applications of Artificial Intelligence, 20(2),
147–161. https://doi.org/http://dx.doi.org/10.1016/j.engappai.2006.06.010
Murphy, G. D. (2009). Improving the quality of manually acquired data: Applying the theory
of planned behaviour to data quality. Reliability Engineering & System Safety, 94(12),
1881–1886. https://doi.org/http://dx.doi.org/10.1016/j.ress.2009.05.008
Natekin, A., & Knoll, A. (2013). Gradient boosting machines, a tutorial. Frontiers in
Neurorobotics, 7, 21.
Neghabi, H., & Ghassemi Tari, F. (2016). A new concept of adjacency for concurrent
consideration of economic and safety aspects in design of facility layout problems.
Journal of Loss Prevention in the Process Industries, 40, 603–614.

128
https://doi.org/https://doi.org/10.1016/j.jlp.2016.02.010
Nicholson, T. A. J. (1966). Finding the shortest route between two points in a network. The
Computer Journal, 9(3), 275–280.
Noroozi, A., Khakzad, N., Khan, F., MacKinnon, S., & Abbassi, R. (2013). The role of human
error in risk analysis: Application to pre-and post-maintenance procedures of process
facilities. Reliability Engineering & System Safety, 119, 251–258.
OWL - Semantic Web Standards. (2012). Retrieved from https://www.w3.org/OWL/
Paes, F. G., Pessoa, A. A., & Vidal, T. (2017). A hybrid genetic algorithm with decomposition
phases for the Unequal Area Facility Layout Problem. European Journal of Operational
Research, 256(3), 742–756. https://doi.org/https://doi.org/10.1016/j.ejor.2016.07.022
Park, J.-H., & Storch, R. L. (2002). Pipe-routing algorithm development: case study of a ship
engine room design. Expert Systems with Applications, 23(3), 299–309.
https://doi.org/https://doi.org/10.1016/S0957-4174(02)00049-0
Parmar, J. C., & Lees, F. P. (1987). The propagation of faults in process plants: hazard
identification. Reliability Engineering, 17(4), 277–302.
Patsiatzis, D. I., Knight, G., & Papageorgiou, L. G. (2004). An MILP approach to safe process
plant layout. Chemical Engineering Research and Design, 82(5), 579–586.
Patsiatzis, D. I., & Papageorgiou, L. G. (2002). Optimal multi-floor process plant layout.
Computers & Chemical Engineering, 26(4), 575–583.
Persson, L. G., Santos, F. B., Tavares, C. A. C., & de Andrade, A. E. (2009). Methodology of
pipe and equipment layout for on-shore oil & gas industry. In Computer Aided Chemical
Engineering (Vol. 27, pp. 1845–1850). Elsevier.
Peters, M. S., Timmerhaus, K. D., West, R. E., Timmerhaus, K., & West, R. (1968). Plant
design and economics for chemical engineers (Vol. 4). McGraw-Hill New York.
Pittman, S. J., & Brown, K. A. (2011). Multi-scale approach for predicting fish species
distributions across coral reef seascapes. PloS One, 6(5), e20583.
Plasek, A. (2016). On the Cruelty of Really Writing a History of Machine Learning. IEEE
Annals of the History of Computing, 38(4), 6–8.
Preischl, W., & Hellmich, M. (2013). Human error probabilities from operational experience
of German nuclear power plants. Reliability Engineering & System Safety, 109, 150–159.
Qureshi, A. R. (1988). The role of hazard and operability study in risk analysis of major hazard

129
plant. Journal of Loss Prevention in the Process Industries, 1(2), 104–109.
Rahman, M., Heikkilä, A.-M., & Hurme, M. (2005). Comparison of inherent safety indices in
process concept evaluation. Journal of Loss Prevention in the Process Industries, 18(4),
327–334.
Rahman, S., Khan, F., Veitch, B., & Amyotte, P. (2009). ExpHAZOP+: Knowledge-based
expert system to conduct automated HAZOP analysis. Journal of Loss Prevention in the
Process Industries, 22(4), 373–380. https://doi.org/10.1016/j.jlp.2009.01.008
Rana, R., Staron, M., Hansson, J., Nilsson, M., & Meding, W. (2014). A framework for
adoption of machine learning in industry for software defect prediction. In Software
Engineering and Applications (ICSOFT-EA), 2014 9th International Conference on (pp.
383–392). IEEE.
Rasmussen, J. (1997). Risk management in a dynamic society: a modelling problem. Safety
Science, 27(2–3), 183–213. https://doi.org/http://dx.doi.org/10.1016/S0925-
7535(97)00052-0
Rusli, R., & Shariff, A. M. (2010). Qualitative Assessment for Inherently Safer Design
(QAISD) at preliminary design stage. Journal of Loss Prevention in the Process
Industries, 23(1), 157–165.
Rusli, R., Shariff, A. M., & Khan, F. I. (2013). Evaluating hazard conflicts using inherently
safer design concept. Safety Science, 53, 61–72.
https://doi.org/https://doi.org/10.1016/j.ssci.2012.09.002
Santos-Reyes, J., & Beard, A. N. (2009). A SSMS model with application to the oil and gas
industry. Journal of Loss Prevention in the Process Industries, 22(6), 958–970.
Schupp, B., Hale, A., Pasman, H., Lemkovitz, S., & Goossens, L. (2006). Design support for
the systematic integration of risk reduction into early chemical process design. Safety
Science, 44(1), 37–54.
Seganti, A., Kapłański, P., & Zarzycki, P. (2015). Collaborative editing of ontologies using
fluent editor and ontorion. In International Experiences and Directions Workshop on
OWL (pp. 45–55). Springer.
Shadravan, A., Tarrahi, M., & Amani, M. (2015). Intelligent Tool to Design Fracturing,
Drilling, Spacer and Cement Slurry Fluids Using Machine Learning Algorithms. In SPE
Kuwait Oil and Gas Show and Conference. Society of Petroleum Engineers.
Shariff, A. M., & Leong, C. T. (2009). Inherent risk assessment—a new concept to evaluate

130
risk in preliminary design stage. Process Safety and Environmental Protection, 87(6),
371–376.
Shariff, A. M., & Zaini, D. (2013). Inherent risk assessment methodology in preliminary
design stage: A case study for toxic release. Journal of Loss Prevention in the Process
Industries, 26(4), 605–613. https://doi.org/10.1016/j.jlp.2012.12.003
Sheridan, T. B. (2008). Risk, human error, and system resilience: fundamental ideas. Human
Factors: The Journal of the Human Factors and Ergonomics Society, 50(3), 418–426.
Singh, S. P., & Sharma, R. R. K. (2006). A review of different approaches to the facility layout
problems. The International Journal of Advanced Manufacturing Technology, 30(5–6),
425–433.
Skogdalen, J. E., & Vinnem, J. E. (2011). Quantitative risk analysis offshore—human and
organizational factors. Reliability Engineering & System Safety, 96(4), 468–479.
Skogdalen, J. E., & Vinnem, J. E. (2012). Combining precursor incidents investigations and
QRA in oil and gas industry. Reliability Engineering & System Safety, 101, 48–58.
Srinivasan, R., & Venkatasubramanian, V. (1996). Petri net-digraph models for automating
HAZOP analysis of batch process plants. Computers & Chemical Engineering, 20,
S719–S725.
Suardin, J., Mannan, M. S., & El-Halwagi, M. (2007). The integration of Dow’s fire and
explosion index (F&EI) into process design and optimization to achieve inherently safer
design. Journal of Loss Prevention in the Process Industries, 20(1), 79–90.
Taylor, D. W. (2007). The role of consequence modeling in LNG facility siting. Journal of
Hazardous Materials, 142(3), 776–785.
Topping, R. (2011). An Introduction to ISO 15926, Fiatech whitepaper, November 2011.
Vaidhyanathan, R., & Venkatasubramanian, V. (1995). Digraph-based models for automated
HAZOP analysis. Reliability Engineering & System Safety, 50(1), 33–49.
https://doi.org/https://doi.org/10.1016/0951-8320(95)00052-4
Vaidhyanathan, R., & Venkatasubramanian, V. (1996). A semi-quantitative reasoning
methodology for filtering and ranking HAZOP results in HAZOPExpert. Reliability
Engineering & System Safety, 53(2), 185–203.
Venkatasubramanian, V., & Preston, M. (1996). A perspective on intelligent systems for
process hazards analysis. In AIChE symposium series (Vol. 92, pp. 160–171). American
institute of chemical engineers.

131
Venkatasubramanian, V., & Vaidhyanathan, R. (1994). A knowledge‐based framework for
automating HAZOP analysis. AIChE Journal, 40(3), 496–505.
Verhagen, W. J. C., Bermell-Garcia, P., van Dijk, R. E. C., & Curran, R. (2012). A critical
review of Knowledge-Based Engineering: An identification of research challenges.
Advanced Engineering Informatics, 26(1), 5–15.
https://doi.org/10.1016/j.aei.2011.06.004
Wang, F., Gao, J., & Wang, H. (2012). A new intelligent assistant system for HAZOP analysis
of complex process plant. Journal of Loss Prevention in the Process Industries, 25(3),
636–642.
Weinstein, M., Gambatese, J., & Hecker, S. (2005). Can design improve construction safety?:
Assessing the impact of a collaborative safety-in-design process. Journal of Construction
Engineering and Management, 131(10), 1125–1134.
Westerberg, A. W. (2004). A retrospective on design and process synthesis. Computers &
Chemical Engineering, 28(4), 447–458.
Williams, J. C. (2015). HEART—a proposed method for achieving high reliability in process
operation by means of human factors engineering technology. In Safety and Reliability
(Vol. 35, pp. 5–25). Taylor & Francis.
Wu, C., Xu, X., Zhang, B., & Na, Y. (2013). Domain ontology for scenario-based hazard
evaluation. Safety Science, 60, 21–34.
Wu, Y., Wang, Y., & Feng, X. (2016). A heuristic approach for petrochemical plant layout
considering steam pipeline length. Chinese Journal of Chemical Engineering, 24(8),
1032–1037. https://doi.org/https://doi.org/10.1016/j.cjche.2016.04.043
Xu, G., & Papageorgiou, L. G. (2009). Process plant layout using an improvement-type
algorithm. Chemical Engineering Research and Design, 87(6), 780–788.
Yang, D., Dong, M., & Miao, R. (2008). Development of a product configuration system with
an ontology-based approach. Computer-Aided Design, 40(8), 863–878.
Zhao, J., Cui, L., Zhao, L., Qiu, T., & Chen, B. (2009). Learning HAZOP expert system by
case-based reasoning and ontology. Computers & Chemical Engineering, 33(1), 371–
378.
Zhu, Z., Park, M.-W., Koch, C., Soltani, M., Hammad, A., & Davari, K. (2016). Predicting
movements of onsite workers and mobile equipment for enhancing construction site
safety. Automation in Construction, 68, 95–101.

132
Every reasonable effort has been made to acknowledge the owners of copyright material. I
would be pleased to hear from any copyright owner who has been omitted or incorrectly
acknowledged.