plant invasion alters the michaelis–menten kinetics of
TRANSCRIPT

Plant invasion alters the Michaelis–Menten kineticsof microbial extracellular enzymes and soil organic matterchemistry along soil depth
Kyungjin Min . Vidya Suseela
Received: 14 January 2020 / Accepted: 24 July 2020 / Published online: 11 August 2020
� Springer Nature Switzerland AG 2020
Abstract Microbial extracellular enzymes decom-
pose distinct components of soil organic matter
(SOM), thus influencing its stability. However, we
lack the knowledge about how the kinetics of
individual enzymes vary when multiple substrates
change simultaneously. Here we used Japanese knot-
weed (Polygonum cuspidatum) invasion as a model
system to explore how the Michaelis–Menten kinetics
(Vmax and km) of microbial extracellular enzymes vary
with corresponding SOM components across soil
depth (0–5, 5–10, and 10–15 cm). We hypothesized
that invasion will increase the Vmax (maximum
enzyme activity) and km (substrate concentration at
half Vmax) of oxidative enzymes but decrease the Vmax
and km of hydrolytic enzymes, and that increasing soil
depth will alleviate the invasion effects on the enzyme
kinetics. The invasion of knotweed, which input litter
rich in recalcitrant compounds, altered soil chemistry
including an increase in lignin and fungal biomass
compared to the adjacent non-invaded soils. The Vmax
of peroxidase, the oxidative enzyme that degrades
lignin, increased in the invaded soils (0–5 cm) com-
pared to the non-invaded soils. Among the hydrolytic
enzymes, the Vmax of N-acetyl-glucosaminidase which
degrades chitin from fungal cell walls increased in the
invaded soils (0–5 cm). However, there was no
associated change in the km of peroxidase and N-
acetyl-glucosaminidase under invasion, suggesting
that microbes modified the enzyme production rates,
not the types (isozyme) of enzymes under invasion.
The Vmax of all enzymes decreased with depth, due to
the reduced substrate availability. These results high-
light that the addition of relatively recalcitrant sub-
strates due to plant invasion altered the kinetics of
microbial extracellular enzymes with implications for
SOM chemistry in the invaded soils.
Keywords Extracellular enzymes � Michaelis–
Menten kinetics � Substrate availability � Plantinvasion � Phenolics � Lignin
Introduction
Invasion by non-native plant species poses one of the
greatest threats to ecosystems around the world
(Pimentel et al. 2001; Pimentel 2002; Cronk and
Responsible Editor: Melany Fisk.
Electronic supplementary material The online version ofthis article (https://doi.org/10.1007/s10533-020-00692-5) con-tains supplementary material, which is available to authorizedusers.
K. Min � V. Suseela (&)
Department of Plant and Environmental Sciences,
Clemson University, Clemson, SC 29634, USA
e-mail: [email protected]
K. Min
e-mail: [email protected]
123
Biogeochemistry (2020) 150:181–196
https://doi.org/10.1007/s10533-020-00692-5(0123456789().,-volV)( 0123456789().,-volV)

Fuller 2014). Apart from the well documented
economic and biodiversity loss, non-native plant
invasion can also influence soil organic matter
(SOM) chemistry by producing physically and chem-
ically distinct litter from the native species they
displace (Elgersma et al. 2012; Tharayil et al. 2013;
Tamura and Tharayil 2014; Suseela et al. 2016). As
soil microorganisms deploy extracellular enzymes to
degrade organic matter for resource acquisition, such
changes in litter chemistry under plant invasion may
alter microbial community and the amounts and types
of extracellular enzymes they generate. This, in turn,
may exert a positive feedback on the chemistry of
SOM, creating a persistent effect of the invasive
species on SOM dynamics even after their removal
(Reynolds et al. 2017). However, we lack the knowl-
edge about how the activities and kinetics of func-
tionally different microbial extracellular enzymes
would vary under non-native plant invasion. Consid-
ering that non-native plant invasion is widespread
across biomes and SOM is the largest terrestrial
organic carbon (C) pool, understanding microbial
resource acquisition strategies under plant invasion is
indispensable for projecting the stability of distinct
SOM compounds in invaded ecosystems.
The activity of extracellular enzymes is often
modeled by using the Michaelis–Menten kinetics
(Schimel and Weintraub 2003; Wang et al. 2013;
Wieder et al. 2013, 2014; Eq. 1).
V ¼ Vmax S½ �Km þ S½ � ð1Þ
Vmax ¼ Vcat � E½ � ð2Þ
In Eq. 1, enzyme activity V is expressed as a fraction
of the maximum enzyme activity Vmax. As Vmax is the
product of the catalytic rate constant Kcat and the
enzyme concentration [E], more enzymes indicate
greater Vmax (Eq. 2). When substrate concentration [S]
is relatively small, V is lower than Vmax and increases
with [S]. At relatively high [S], all active sites of
enzymes are occupied with substrates, thus V ap-
proaches Vmax. By definition, km is the substrate
concentration at which half of the Vmax is reached. The
km value represents the inverse affinity of the enzyme
to substrate. That is, the lower the km, the better the
enzyme binds to its substrate. Under laboratory
conditions where a single enzyme at fixed concentra-
tion reacts with its corresponding substrate without
microorganisms, the Michaelis–Menten parameters
(Vmax and km) describe the intrinsic enzyme properties,
unique to each enzyme–substrate pair.
However, when microbes are included in the
system, the Michaelis–Menten parameters reflect
microbial modifications in the amounts and types of
an enzyme (i.e. isozyme). When microbes invest their
energy and extant resources in enzyme production,
there is a trade-off between the amount (Vmax) and
efficiency (km) of the enzyme (Benner 1989; Allison
et al. 2011, 2014; German et al. 2011). Generating
more efficient enzymes is expensive because microbes
need extra machinery to alter enzyme’s hydrophobic-
ity, the number and types of chemical bonds (hydrogen
bond and electrostatic bond) to achieve a stable sub-
strate-enzyme complex. Thus, microbes are likely to
adjust their enzyme productions (amounts and types)
when substrate quantity and quality vary. For exam-
ple, when substrates are abundant, it may be advan-
tageous for microbes to produce less efficient (high km)
but more extracellular enzymes (high Vmax), because
the rate-limiting factor is the amount of enzymes, not
the substrate. Consistent with this prediction, Loepp-
mann et al (2016) recently demonstrated that microbes
inhabiting soils rich in labile C exhibit higher Vmax and
km of hydrolytic enzymes than those in soils with low
labile C. Alternatively, when changes in substrate
quantity and composition modify microbial commu-
nity composition, it could lead to the production of
different isoforms of enzymes with distinct km (Stone
et al. 2012).
Invasive species can indirectly influence enzyme
kinetics if changes in substrate quality and quantity
alter microbial community composition and the asso-
ciated enzyme production. For example, many inva-
sive species generate litter rich in phenolic compounds
such as lignin. Because the production of oxidative
enzymes that degrade lignin is largely limited to fungi
(Sinsabaugh 2010), increasing lignin can stimulate
fungal growth (Six et al. 2006; Tamura and Tharayil
2014; Suseela et al. 2016). Microbial community with
relatively high fungal abundance may generate more
oxidative enzyme (higher Vmax) to decay lignin, while
decreasing efficiency (higher km) due to the trade-off.
Invasive species can also directly alter extracellular
enzyme kinetics via inhibition of enzymes by pheno-
lics. Non-native plant species often generate litter rich
in extractable phenolics including tannins (Liao et al.
2006; Li et al. 2010; Yuan et al. 2014; Suseela et al.
123
182 Biogeochemistry (2020) 150:181–196
2016). The phenolics can serve as an inhibitor of
enzyme activity. Tannins can directly bind to enzymes
and suppress the catalytic activity via changes in
enzyme solubility, secondary and tertiary structure as
well as hydrophobicity (Rohn et al. 2002; Joanisse
et al. 2007; Ximenes et al. 2011). This direct enzyme-
phenolics interaction can decrease Vmax of all types of
enzymes, with km reduced (uncompetitive inhibition)
or unchanged (non-competitive inhibition). In uncom-
petitive inhibition, phenolics can only bind to the
enzyme–substrate complex. As a consequence of Le
Chatelier’s principle, the equilibrium of E ? S $ ES
shifts to the right, reducing km. Also, the binding of
phenolics to the enzyme–substrate complex would
prolong the time for the product to leave the active site
of the enzyme (decreasing Vmax). In non-competitive
inhibition, phenolics can bind to either enzyme alone
or enzyme–substrate complex. Thus, the equilibrium
E ? S $ ES would stay the same (no change of km),
but it still takes longer for the product to leave the ES
complex (decreasing Vmax). Given the differential
roles that altered litter quantity and quality play in
modulating enzyme kinetics, it is important to explore
individual SOM components and corresponding
enzyme activity along with changes in the microbial
community under invasion.
The distribution of distinct SOM can vary differ-
entially with soil depth with the potential to alter the
Michaelis–Menten kinetics of enzymes across depths.
Generally, the abundance of SOM is highest at surface
soil due to higher plant leaf litter input, and decreases
with depth as the distance from the input source
increases (Angst et al. 2016; Billings et al. 2018).
Therefore, the effects of plant invasion on enzyme
kinetics may be confined to surface soils, not extended
into soils at increasing depths. Alternatively, SOM at
increasing depth may be associated with more mineral
and hence have higher stability, which can alter
enzyme kinetics (Loeppmann et al. 2016).
To evaluate the enzyme kinetics under plant
invasion, we chose Japanese knotweed (Polygonum
cuspidatum) invasion as a model system, because P.
cuspidatum invasion creates a novel substrate field by
generating physically and chemically distinct litter
inputs than the native species they displace (Das-
sonville et al. 2007; Fan et al. 2009; Suseela et al.
2016). Our study site in Massachusetts has been
invaded by P. cuspidatum for[ 20 years. Previous
studies conducted at this site revealed that P.
cuspidatum input litter rich in phenolic compounds
including lignin and tannins (Suseela et al. 2016),
resulting in increased SOM content and altered SOM
composition (Tamura and Tharayil 2014; Tamura
et al. 2017). The invasion of P. cuspidatum also
increased fungal biomass and decreased bacterial
biomass at this study site (Tamura and Tharayil
2014; Suseela et al. 2016), in Massachusetts and
several other P. cuspidatum invaded sites across the
eastern US, where the invaded soils had a uniform
fungal community composition than the adjacent non-
invaded soils. Decomposing P. cuspidatum leaves had
more fungal colony-forming units than the litter of
native herb plants (Mincheva et al. 2014). The shift in
the microbial community towards a more fungal
dominated system may also alter the kinetics of
enzyme activity in the invaded system with implica-
tions for SOM decomposition.
Based on the changes in the substrate availability
under P. cuspidatum invasion and the roles of
phenolics in modulating enzyme activity, we hypoth-
esized that the increase in lignin under invasion would
enable oxidative enzymes to overcome the enzyme-
phenolics inhibition and the decrease in labile C and
phenolics inhibition would negatively influence
hydrolytic enzyme kinetics. Specifically, we hypoth-
esized that plant invasion will increase the Vmax and kmof oxidative enzymes but decrease the Vmax and km of
hydrolytic enzymes. We also hypothesized that the
invasion effect on Vmax and km would decrease with
increasing soil depth. Here, we determined the
Michaelis–Menten kinetics of hydrolytic (acid phos-
phatase [AP], b-glucosidase [BG], N-acetyl-glu-
cosaminidase [NAG]) and oxidative (peroxidase
[PER]) extracellular enzymes and the corresponding
substrate quantities (acid phosphatase/organic phos-
phorus, b-glucosidase/cellulose, N-acetyl-glu-
cosaminidase/chitin, and peroxidase/lignin) when
substrate field varies with plant invasion and soil
depth.
Methods
Soil sampling and initial physicochemical
characteristics
We chose our study site in Amherst, MA (42� 240 N,72� 310 W), where P. cuspidatum has invaded native
123
Biogeochemistry (2020) 150:181–196 183
ecosystems for more than 20 years (Tharayil et al.
2013; Tamura and Tharayil 2014) with little apparent
disturbance. The invaded and the adjacent, non-
invaded stands experience the same climate and
exhibit similar soil properties such as pH, bulk density,
texture, and soil moisture (Tamura and Tharayil 2014;
Suseela et al. 2016; also unpublished data in this
study). However, the long history of invasion led to
distinct biological and chemical properties between
the invaded and the non-invaded stands (Tharayil et al.
2013; Tamura and Tharayil 2014; Suseela et al. 2016).
The dominant vegetation in the non-invaded stand was
Dactylis glomerata, Setaria viridis, Solidago sp.,
Galium aparine, Rumex crispus, Ambrosia sp., Cype-
rus rotundus, Epilobium, Fraxinus pennsylvanica,
Daucus carota, Ipomoea sp., Arisaema triphyllum,
Viola sp., Hypericum perforatum, Impatiens capensis,
Oenothera biennis, Erigeron annuus, Plantago lance-
olata, Plantago major, Oxalis stricta, and Trifolium
pratense. Similar to most studies in invasion ecology
where invasion is not experimentally manipulated, we
cannot completely rule out the possibility that the
difference between invaded and non-invaded stands
existed before invasion rather than a consequence of
the invasion. However, the uniform chemistry and soil
microbial community that occurred in P. cuspidatum
invaded soils in geographically distinct locations
across the eastern US including the same study site
reduced the concern that other causes could have
resulted in the difference between the invaded and
non-invaded stands (Suseela et al. 2016). Therefore,
even though we acknowledge that our sampling was
limited to one study site, we believe that the results
obtained here are largely due to the invasion of P.
cuspidatum, not by chance, and are generally appli-
cable to other P. cuspidatum invaded soils.
Using transect sampling, we collected six soil cores
(5 cm diameter) from 0 to 5, 5 to 10, and 10 to 15 cm
in invaded and adjacent non-invaded stands, respec-
tively in August 2018 (n = 6). First, we set up a 15 m
primary transect along the invading front, then estab-
lished six, 16 m secondary transects, each separated
by 3 m, centered on and perpendicular to the primary
transect. At each secondary transect, soils at 8 m
distance (toward invaded and non-invaded zones,
respectively) from the primary transect were collected.
All soils were shipped immediately to Clemson
University in a cooler and stored at - 20 �C until
analysis. Roots, litter, and stones were manually
removed from the soil samples before further analysis.
Soil chemistry
Soil organic matter (SOM)
The SOM content was quantified using loss on ignition
method. Briefly, we dried 1 g of fresh soil in a crucible
at 105 �C and 600 �C overnight sequentially and the
difference in the sample weight between 105 �C and
600 �C was used for calculating the content of SOM.
Dissolved organic carbon (DOC)
We extracted the DOC by mixing 5 g of soil with
40 mL of 2 M KCl. The soil slurry was gently shaken
on a rotary shaker for 1 h and centrifuged at 2,500 rpm
for 10 min. The supernatant was filtered through a
0.45 lm syringe filter (Aqua 30, Whatman). The
filtrate was frozen at - 20 �C and analyzed on a
Shimadzu TOC-L analyzer.
Soil phenolics
We extracted soil phenolics using base hydrolysis as
described in Wang et al. (2015). We added 6 mL of
1 M NaOH to 1 g of soil, vortexed, and incubated at
90 �C for 1 h. After cooling in ice for 10 min, the
tubes were centrifuged at 2500 rpm for 5 min and
4 mL of supernatant was transferred to new tubes. We
added 5 lL of internal standard (trans-cinnamic acid
and ethyl vanillin, each at 400 mg/L) and 2 mL of
50% HCl to obtain a pH\ 2. After cooling in ice for
5 min, the tubes were centrifuged at 2500 rpm for
5 min and 4 mL of the supernatant was transferred to
new tubes. We added 2 mL of cold ethyl acetate to the
supernatants and cooled the samples in ice for 5 min.
Liquid–liquid extraction of phenolics was facilitated
by mixing the tubes on a rotary shaker for 15 min and
cooling them in ice for 10 min. After centrifugation at
2500 rpm for 5 min, 1 mL of the upper ethyl acetate
layer containing phenolics was transferred to 2 mL
GC vials and stored at - 20 �C until analysis. We
transferred 200 lL of the sample to 300 lL insert/GC
vials and dried under Ar. The samples were silylated
via reaction with 100 lL of N-methyl-N-(trimethylsi-
lyl)-trifluoroacetamide with 1% trimethylchlorosilane
at 65 �C for 25 min. The derivatized samples were
123
184 Biogeochemistry (2020) 150:181–196

analyzed using a gas chromatography-mass spectrom-
etry (GC–MS; Agilent 7980A GC system coupled
with a 5975 C Series quadrupole mass analyzer,
Agilent) with a split ratio of 20.
Lignin, chitin, and cellulose
We employed pyrolysis-GC–MS for assessing the
relative abundance of cellulose, chitin, and lignin.
Pyrolysis-GC–MS can help characterize SOM chem-
istry without any chemical extraction. Pyrolysis uses
thermal energy to break down SOM compounds to
smaller molecules, which in turn are separated and
detected on a GC–MS. Because each fragment
exhibits a fingerprint of the parent SOM compound,
pyrolysis-GC–MS enables molecular identification of
individual SOM compounds in heterogeneous soil
(Saiz-Jimenez and de Leeuw 1984; Hempfling and
Schulten 1990; Nierop et al. 2005; Buurman et al.
2007; Pold et al. 2017). In this study, the isothermal
furnace method was used to perform pyrolysis on soil
samples (CDS 5150, CDS inc.). A total of 20–30 mg
of soil samples were weighed into quartz tubes along
with 4 lL of the internal standard (1 mM fluoranthene
in 50:50 (v/v) ethanol: chloroform). Samples were
heated at 500 �C for 60 s and the pyrolysates were
carried to a GC–MS (Agilent 7980A/5975C Series,
Agilent) in He. Samples were analyzed with a split
ratio of 25, mass range m/z of 50–500, and ionization
energy 70 eV. Peaks were deconvoluted and extracted
using AMDIS v3.2 and compared to the reference
spectra in the National Institute of Standards and
Technology mass spectral libraries and literature (van
der Kaaden et al. 1984; Nierop et al. 2005; Buurman
et al. 2007; Furuhashi et al. 2009; Mattonai et al. 2016;
Zhang et al. 2017). After correcting sample matrix
effects on peak area using the internal standard, we
grouped each pyrolysate into three categories (i.e.,
lignin, chitin, and cellulose, Table S1) and summed
the relative peak area. Our results do not provide the
absolute quantification of each compound, but rather
allows us to compare the relative abundance of each
compound across samples.
Organic phosphorus
We determined organic phosphorus content by sub-
tracting inorganic phosphorus content from total
phosphorus content (De Schrijver et al. 2012). For
each sample, we subsampled two 1 g of soil, one for
total phosphorus and the other for inorganic phospho-
rus. Soils for total phosphorus were ignited at 600 �Cfor 1 h to release phosphorus from an organic entity
(Legg and Black 1955; Saunders and Williams 1955).
We added 30 mL of 1 M HCl to the inorganic
phosphorus and the total phosphorus subsamples,
and these subsamples were shaken at 200 rpm for 16 h
for inorganic phosphorus extraction. The extractants
were centrifuged at 3000 rpm for 20 min and the
supernatants were passed through a 0.45 lm syringe
filter (Aqua 30, Whatman). The filtrates were stored at
- 20 �C until analysis. After thawing, samples were
analyzed for orthophosphate on a micro-segmented
flow analyzer (A2, Astoria-Pacific) using a colorimet-
ric method (absorbance change at 660 nm). The
difference in orthophosphate between the total phos-
phorus and total inorganic phosphorus in samples was
considered as total organic phosphorus (De Schrijver
et al. 2012).
Fungal biomass-ergosterol
We used base hydrolysis to extract ergosterol for the
quantification of live fungal biomass (Tamura and
Tharayil 2014; Ekblad and Mikusinska 2016). A total
of 6 g of fresh soil was mixed with 13 mL of 0.14 M
KOH in methanol in glass tubes. The tubes were
covered with aluminum foil and incubated in a heat
block at 85 �C for 50 min. We transferred 9 mL of
the supernatant to new tubes and added 4 mL of 1 M
HCl. After centrifugation at 2500 rpm for 10 min to
precipitate interference, 12 mL of the supernatant was
transferred to new tubes. We added 2 mL of hexane to
samples for liquid–liquid extraction. Samples were
dried under Ar and silylated with 100 lL N-methyl-N-
(trimethylsilyl) trifluoroacetamide with 1%
trimethylchlorosilane at 60 �C for 40 min. The
derivatized samples were analyzed using GC–MS
(Agilent 7890A/5975C). The ergosterol standards
were prepared in chloroform at 0, 6, 13, 25, 50, and
100 ppm concentrations.
Extracellular enzyme assays
We quantified the enzyme activity (V) and Michaelis–
Menten kinetics of four microbial extracellular
enzymes relevant to soil C dynamics such as using
substrate analogs: b-glucosidase (cellulose decay)
123
Biogeochemistry (2020) 150:181–196 185

with 4-methylumbelliferyl beta-D-glucopyranoside
(MUB-BG; M3633, Sigma-Aldrich), N-acetyl-glu-
cosaminidase (chitin decay) with 4-methylumbellif-
eryl N-acetyl-beta-D-glucosaminide (MUB-NAG;
M2133, Sigma-Aldrich), acid phosphatase (organic
phosphorus decay) with 4-methylumbelliferyl phos-
phate (MUB-AP; M8883, Sigma-Aldrich), and per-
oxidase (lignin decay) with 3,30,5,50-tetramethylbenzidine (TMB; cat.229280050, Acros).
All enzyme assays were performed using a microplate
reader (Synergy Mx, Biotek).
We prepared soil slurries by mixing 1 g soil with
125 mL of 50 mM sodium acetate buffer at each soil
pH and blending for 30 s. For hydrolytic enzyme
assays, we used black 96 well plates for fluorescence
detection at 360 nm extinction and 450 nm emission
wavelengths. MUB-substrates were prepared at 0, 25,
50, 100, 200, 400, and 600 lM in deionized water for
each enzyme–substrate pair to obtain the Michaelis–
Menten plot. For each soil sample, we used one
microplate, including standards (10 lM of 4-methy-
lumbelliferone (MUB; M1381, Sigma-Aldrich),
quench control, soil control, substrate control, and
assay wells (Table S2). We quantified the release of
fluorescent MUB tag from the substrate analog, five
times for 75 min. The fluorescence emission was
corrected using quench control, substrate control, and
soil control, and transformed to unit mol of MUB
using standard (Min et al. 2014, 2019). After checking
the linearity of the amount of MUB released (fluores-
cence level) over time (Supplementary Information
(SI) 1), the slope was used to calculate enzyme activity
(lmol/h/g dry soil) at each MUB-substrate
concentration.
For oxidative enzyme assays, clear 96 well plates
were used for quantifying absorbance at 450 nm. We
chose TMB as a substrate for peroxidase, as it is very
sensitive to oxidative enzymatic activity, exhibits
linear changes in absorbance with time, and exhibits
the Michaelis–Menten kinetics (Johnsen and Jacobsen
2008; Singh et al. 2013; Triebwasser-freese et al.
2015), making it suitable for this study. We prepared
TMB at 0, 160, 320, 800, 1600, 2400, and 2800 lM in
50 mM citric acid to prevent auto-oxidation (Perron
and Brumaghim 2009). Each clear plate includes
phenol oxidase/mineral control, soil control, substrate
control, and assay wells (Table S3). A standard plate
was prepared separately from assay plates. The
absorbance was measured four times for 25 min and
the reactions were stopped at each time point by
adding 70 lL of 0.2 M H2SO4. The net peroxidase
absorbance was converted to unit mol of product
generated (net peroxidase absorbance = 0.0257 9
TMB content (lmol) ? 0.1963). The slope between
the absorbance and elapsed time was used to calculate
enzyme activity (lmol/h/g dry soil) at each TMB
concentration (Supplementary Information (SI) 1).
Statistical analyses
All data were checked for normality and log-trans-
formed if necessary, to meet the assumption of normal
distribution. We estimated Vmax and km by fitting the
Michaelis–Menten model to enzyme activity V in R.
The effects of invasion, depth, and the interaction of
invasion and depth on the Michaelis–Menten param-
eters, soil chemistry, and ergosterol were tested using
a mixed-effects restricted maximum likelihood
(REML) model. Fixed factors were invasion, depth,
and the interaction between invasion and depth, and
random factor was soil core. When there were
significant effects of invasion and depth at a = 0.05,
Tukey’s HSD test was employed to discern the
differences among individual groups. Non-metric
multidimensional scaling was used to visualize and
separate the effects of invasion and depth on overall
soil chemistry. Figures were prepared using Sigmaplot
12.0 (Systat Software) and statistical analyses were
performed using R (R core team, version 3.6.3).
Results
Soil chemistry and fungal biomass
Non-metric multidimensional scaling analysis of soil
chemistry showed that the invaded soils clustered
separately from the non-invaded soils (Fig. 1). While
soil chemistry in the non-invaded soils exhibited a
relatively uniform distribution across depth, soil
chemistry in the invaded soils at 0–5 cm and
5–10 cm depth were clearly separated from that at
10–15 cm.
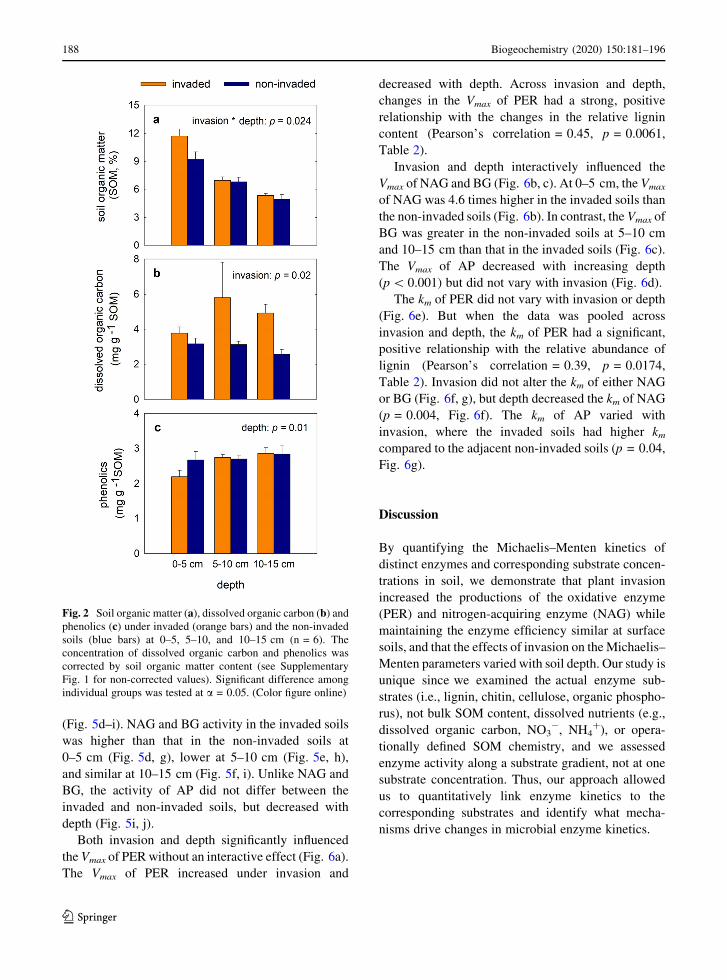
Total SOM content was influenced by the interac-
tion between invasion and depth (p = 0.024, Fig. 2a,
Table S4). The P. cuspidatum invaded soils tended to
have higher SOM compared to the adjacent non-
invaded soils at 0–5 cm (p = 0.08). However, at
123
186 Biogeochemistry (2020) 150:181–196

5–10 cm and 10–15 cm, the SOM content was similar
between the invaded and non-invaded soils. Overall,
depth decreased SOM content both in the invaded and
non-invaded soils (p\ 0.001, Fig. 2a). There was a
positive relationship between DOC and SOM (Pear-
son’s correlation = 0.46, p = 0.0058, Table 1). Even
when DOC content was corrected by SOM content,
invasion still significantly elevated DOC content at all
depths (p = 0.02, Fig. 2b; also see Supplementary
Fig. 1a). Soil phenolics were not influenced by
invasion, but significantly changed with depth
(p = 0.01, Fig. 2c).
Invasion and depth interactively influenced the
relative abundance of lignin (p = 0.02, Fig. 3a). The
invaded soils exhibited a greater lignin content at
0–5 cm (p = 0.06) and 5–10 cm (p = 0.03) than the
non-invaded soils. The relative abundance of chitin
varied with depth, with soils at 0–10 cm exhibiting
higher chitin content than soils at 10–15 cm
(p = 0.005, Fig. 3b). Chitin content tended to be
higher in the invaded soils than the non-invaded soils
at 0–5 cm and 5–10 cm, but the differences were not
significant. Neither invasion nor depth significantly
influenced the relative abundance of cellulose
(Fig. 3c). The organic phosphorus concentration was
influenced by depth, with increasing values along soil
depth (p = 0.002, Fig. 3d). The effects of invasion,
depth, and the interaction of invasion and depth on the
relative abundance of enzyme substrates per g soil
(lignin, chitin, cellulose, organic phosphorus) exhib-
ited similar patterns as observed for those per g SOM
(Supplementary Fig. 2).
Ergosterol, the live fungal biomass index, was
interactively influenced by invasion and depth
(p = 0.002, Fig. 4). At 0–5 cm, ergosterol was 37%
higher in the invaded soils than the non-invaded soils.
In contrast, at 5–10 and 10–15 cm, the ergosterol
content did not differ between the invaded and non-
invaded soils. Ergosterol exhibited a strong positive
relationship with lignin content (Pearson’s correla-
tion = 0.79, p\ 0.001, Table 1), but had no relation-
ship with chitin content (live and dead fungal cell wall;
Pearson’s correlation = 0.16, p = 0.34, Table 1).
Enzyme activity V and Michaelis–Menten
parameters
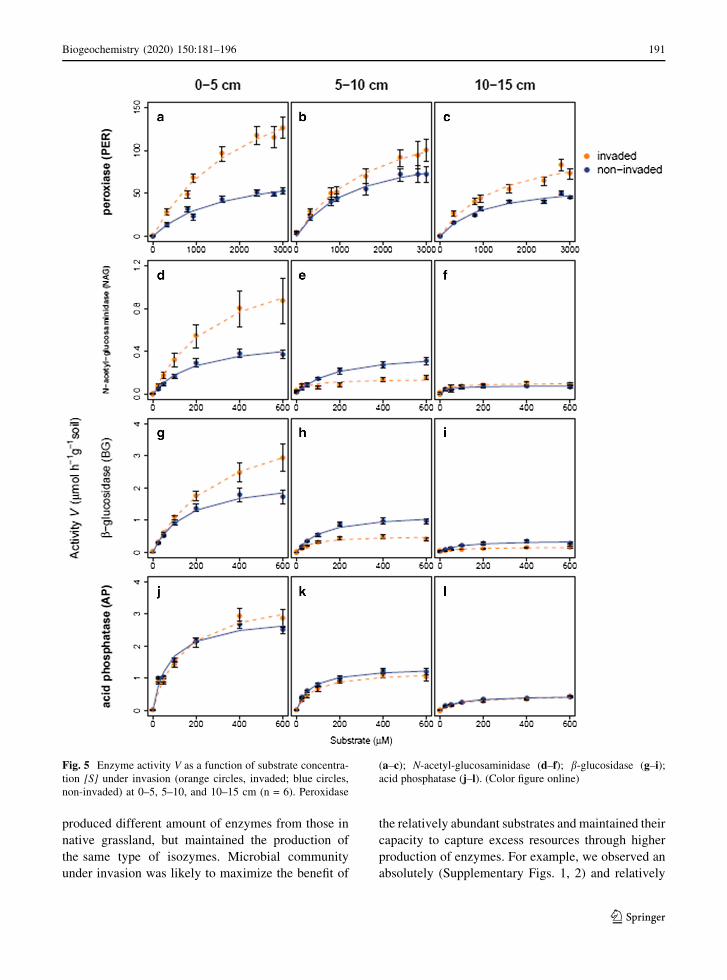
The activity of PER (peroxidase, oxidative enzyme)
was higher under invasion at all depths (Fig. 5a–c).
However, hydrolytic enzymes showed different pat-
terns from PER. For example, invasion and depth
interactively influenced the activity of NAG and BG
Fig. 1 Non-metric
multidimensional scaling of
soil chemistry (n = 6).
Different colors represent
the invaded (orange) and the
non-invaded soils (blue) and
different symbols indicate
different soil depth (circles
for 0–5 cm, triangles for
5–10 cm, and squares for
10–15 cm). (Color
figure online)
123
Biogeochemistry (2020) 150:181–196 187
(Fig. 5d–i). NAG and BG activity in the invaded soils
was higher than that in the non-invaded soils at
0–5 cm (Fig. 5d, g), lower at 5–10 cm (Fig. 5e, h),
and similar at 10–15 cm (Fig. 5f, i). Unlike NAG and
BG, the activity of AP did not differ between the
invaded and non-invaded soils, but decreased with
depth (Fig. 5i, j).
Both invasion and depth significantly influenced
the Vmax of PERwithout an interactive effect (Fig. 6a).
The Vmax of PER increased under invasion and
decreased with depth. Across invasion and depth,
changes in the Vmax of PER had a strong, positive
relationship with the changes in the relative lignin
content (Pearson’s correlation = 0.45, p = 0.0061,
Table 2).
Invasion and depth interactively influenced the
Vmax of NAG and BG (Fig. 6b, c). At 0–5 cm, the Vmax
of NAG was 4.6 times higher in the invaded soils than
the non-invaded soils (Fig. 6b). In contrast, the Vmax of
BG was greater in the non-invaded soils at 5–10 cm
and 10–15 cm than that in the invaded soils (Fig. 6c).
The Vmax of AP decreased with increasing depth
(p\ 0.001) but did not vary with invasion (Fig. 6d).
The km of PER did not vary with invasion or depth
(Fig. 6e). But when the data was pooled across
invasion and depth, the km of PER had a significant,
positive relationship with the relative abundance of
lignin (Pearson’s correlation = 0.39, p = 0.0174,
Table 2). Invasion did not alter the km of either NAG
or BG (Fig. 6f, g), but depth decreased the km of NAG
(p = 0.004, Fig. 6f). The km of AP varied with
invasion, where the invaded soils had higher kmcompared to the adjacent non-invaded soils (p = 0.04,
Fig. 6g).
Discussion
By quantifying the Michaelis–Menten kinetics of
distinct enzymes and corresponding substrate concen-
trations in soil, we demonstrate that plant invasion
increased the productions of the oxidative enzyme
(PER) and nitrogen-acquiring enzyme (NAG) while
maintaining the enzyme efficiency similar at surface
soils, and that the effects of invasion on theMichaelis–
Menten parameters varied with soil depth. Our study is
unique since we examined the actual enzyme sub-
strates (i.e., lignin, chitin, cellulose, organic phospho-
rus), not bulk SOM content, dissolved nutrients (e.g.,
dissolved organic carbon, NO3-, NH4
?), or opera-
tionally defined SOM chemistry, and we assessed
enzyme activity along a substrate gradient, not at one
substrate concentration. Thus, our approach allowed
us to quantitatively link enzyme kinetics to the
corresponding substrates and identify what mecha-
nisms drive changes in microbial enzyme kinetics.
Fig. 2 Soil organic matter (a), dissolved organic carbon (b) andphenolics (c) under invaded (orange bars) and the non-invaded
soils (blue bars) at 0–5, 5–10, and 10–15 cm (n = 6). The
concentration of dissolved organic carbon and phenolics was
corrected by soil organic matter content (see Supplementary
Fig. 1 for non-corrected values). Significant difference among
individual groups was tested at a = 0.05. (Color figure online)
123
188 Biogeochemistry (2020) 150:181–196

Invasion indirectly modifies enzyme activity
and Michaelis–Menten kinetics
While changes in the Michaelis–Menten parameters
can occur via either direct phenolics-enzyme interac-
tion or indirect substrate effects on microbial enzyme
production, our data suggest that the indirect effects
were dominant in this study. First, we observed
different enzyme activity V of PER, NAG, and BG
between the invaded and the non-invaded soils at
0–5 cm (Fig. 5a, d, g) in spite of the similar phenolics
(Fig. 2c, Supplementary Fig. 1b). If phenolics directly
inhibited enzyme activity via phenolics-protein inter-
action, we should have observed a similar degree of
inhibition for PER, NAG, and BG in the invaded and
non-invaded soils, which was not the case. However,
different classes of phenolics (e.g. flavonoids,
monophenolics) may differentially affect the potential
activity of peroxidase (Suseela et al. 2016). It was not
surprising to observe similar levels of phenolics
between the invaded and the non-invaded soils in this
study, given that we collected soils in August (end of
the growing season). Previous studies from the same
site showed that the pool size of phenolics was higher
under invasion in spring (Tharayil et al. 2013; Suseela
et al. 2016), but that phenolics content did not differ
between the invaded and non-invaded soils in July
(Tharayil et al. 2013). Thus, it should be noted that the
enzyme activites and subsequent soil C and N cycling
may exhibit seasonal variation in the invaded
sites (Tharayil et al. 2013). Second, the changes in
the Michaelis–Menten parameters for PER (Fig. 6a, e)
and NAG (Fig. 6b, f) at 0–5 cm (same km and higher
Vmax) did not follow those under typical enzyme
inhibition scenarios. For example, when phenolics
bind to the enzyme, it can modify enzyme solubility,
secondary and tertiary structure, and hydrophobicity
(Rohn et al. 2002; Joanisse et al. 2007; Ximenes et al.
2011). These changes in the structural and chemical
properties of the enzyme can lower enzyme activity
noncompetitively (same km and lower Vmax) or
uncompetitively (lower km and lower Vmax; Waldrop
2009). However, we did not observe such changes in
the Michaelis–Menten parameters of PER and NAG,
suggesting that the changes in the activity of PER and
NAG under invasion may not be due to the direct
inhibition of enzymes by phenolics. In contrast,
the same km and lower Vmax of BG in the invaded
soils imply that phenolics may have bound to the
enzyme and enzyme–substrate complex, inhibiting
noncompetitively (Fig. 6c, g).
Instead, invasion was more likely to influence
enzyme kinetics via changes in the microbial com-
munity and associated enzyme production in this
study. The strong, positive relationships between
ergosterol and lignin (Table 1) and between ergosterol
and Vmax of PER (r = 0.73, p\ 0.001), and the
increase in ergosterol under invasion at 0–5 cm
(Fig. 4a) suggests that the increased lignin input under
P. cuspidatum stimulated fungal growth, which in
turn, produced PER for decaying lignin. In addition, a
significant, positive relationship between ergosterol
and Vmax of NAG (r = 0.87, p\ 0.001) also indicates
that fungal growth enhanced the production of NAG.
Plant invasion often modifies soil microbial commu-
nity composition (Batten et al. 2006; Liao and Boutton
2008; Elgersma and Ehrenfeld 2011). It has been
reported from the same study site that the invasion of
P.cuspidatum increased fungal biomass but decreased
bacterial biomass (Tamura and Tharayil 2014; Suseela
et al. 2016), and fungal community composition was
significantly different between the invaded and the
non-invaded soils (Suseela et al. 2016). The P.
cuspidatum invaded soils across several sites in the
Table 1 Pearson’s
correlation coefficient
(r) among soil chemistry
index and ergosterol
Bold: p\ 0.05
SOM soil organic matter,
DOC dissolved organic
carbon, P phosphorus
SOM DOC Phenolics Lignin Chitin Cellulose Organic P Ergosterol
SOM 0.46 0.87 0.83 0.43 0.77 0.11 0.67
DOC 0.60 0.44 0.31 0.34 0.05 0.45
Phenolics 0.68 0.37 0.65 0.23 0.65
Lignin 0.25 0.53 0.25 0.79
Chitin 0.29 - 0.11 0.16
Cellulose 0.09 0.39
Organic P 0.34
Ergosterol
123
Biogeochemistry (2020) 150:181–196 189

eastern US had a uniform fungal community com-
pared to the adjacent non-invaded stands. The increase
in fungal biomass and uniform fungal community in P.
cuspidatum invaded stands is potentially due to the
input of chemically distinct litter rich in recalcitrant
compounds (Suseela et al. 2016; Tamura et al. 2017).
Due to the differences in the biomass stoichiometry,
nutrient use efficiency, and metabolic pathways,
different microbes generate a unique combination of
extracellular enzymes to meet their distinct resource
demand (Anderson and Domsch 2010; Keiblinger
et al. 2010; Crowther and Bradford 2013). For
example, increased recalcitrant C requires the activity
of oxidative enzymes that are generated by fungi
(Sinsabaugh 2010). This may be due to relatively high
biomass C:N ratio (thus lower nitrogen demand) and
greater C use efficiencies of fungi (Six et al. 2006;
Keiblinger et al. 2010), conferring fungi to grow
relatively better on recalcitrant C than bacteria. Thus,
plant invasion seemed to alter the Michaelis–Menten
parameters via favoring fungi over bacteria and
influencing microbial communities’ enzyme produc-
tion in this study.
Microbes under invasion alter the production rate
of enzyme, not the type of enzyme
Modification of Vmax with little to no changes in kmunder plant invasion highlights that microbial com-
munities that have diverged over 20 years of invasion
Fig. 3 Relative abundance of lignin (a), chitin (b), cellulose(c) and organic phosphorus concentrations (d) under invaded(orange bars) and the non-invaded soils (blue bars) at 0–5, 5–10,
and 10–15 cm (n = 6). Significant difference between the
invaded and the non-invaded soils was marked with an asterisk
at a = 0.05. Integrated area refers to the area under the
corresponding peaks from the chromatogram. Enzyme substrate
concentration was normalized by soil organic matter content
(see Supplementary Fig. 2 for non-corrected values). (Color
figure online)
Fig. 4 Ergosterol concentration as an estimate of live fungal
biomass under invaded (orange bars) and the non-invaded soils
(blue bars) at 0–5, 5–10, and 10–15 cm (n = 6). Significant
difference between the invaded and the non-invaded soils was
marked with asterisk at a = 0.05. (Color figure online)
123
190 Biogeochemistry (2020) 150:181–196
produced different amount of enzymes from those in
native grassland, but maintained the production of
the same type of isozymes. Microbial community
under invasion was likely to maximize the benefit of
the relatively abundant substrates and maintained their
capacity to capture excess resources through higher
production of enzymes. For example, we observed an
absolutely (Supplementary Figs. 1, 2) and relatively
Fig. 5 Enzyme activity V as a function of substrate concentra-
tion [S] under invasion (orange circles, invaded; blue circles,
non-invaded) at 0–5, 5–10, and 10–15 cm (n = 6). Peroxidase
(a–c); N-acetyl-glucosaminidase (d–f); b-glucosidase (g–i);acid phosphatase (j–l). (Color figure online)
123
Biogeochemistry (2020) 150:181–196 191

123
192 Biogeochemistry (2020) 150:181–196

(Figs. 2, 3) higher abundance of SOM, lignin, and
DOC under invasion and a significant, positive
relationship between PER production and lignin
content (Table 2). Hence, if microbes had switched
their enzyme production from high affinity to low-
affinity enzymes when lignin concentration became
high under invasion, the net resource gain from lignin
decay would have decreased. However, by generating
high-affinity enzymes when lignin was abundant
under invasion, microbes were able to decay more
lignin (high affinity of enzyme ? more sub-
strates = more net gain) compared to those in the
non-invaded soils (Fig. 5a–c). Such overflow of
resources to microbes has been reported under rela-
tively high substrate availability (Russel and Cook
1995; Manzoni et al. 2012; Szenk et al. 2017). Indeed,
litter input under P. cuspidatum invaded soils was 2.5
times higher than the adjacent, non-invaded soils
(Tamura and Tharayil 2014). Microbial overconsump-
tion of substrates partially explains the accelerated
nutrient cycling rates at topsoils under P. cuspidatum
invaded (Dassonville et al. 2007), particularly by the
fall season (Tharayil et al. 2013). Moreover, the
enzymatic transformation products may persist in
the invaded soils (Suseela et al. 2016) that could neg-
atively affect the growth of the native species (Mo-
ravcova et al. 2011; Murrell et al. 2011; Dommanget
et al. 2014).
Michaelis–Menten kinetics under plant invasion
varies with enzymes and depth
Our second hypothesis that the degree to which
invasion modifies enzyme kinetics would decrease
with increasing soil depth was supported for the Vmax
of NAG. When soil depth increased from 0 to 5 cm to
10–15 cm, the difference in the Vmax between the
invaded and the non-invaded soils reduced by * 85%
for NAG (Fig. 6b), due to the reductions in the relative
chitin content (Fig. 3) and fungal biomass (Fig. 4)
along with depth.
Microbial enzyme production was highest at
0–5 cm in both invaded and non-invaded soils (higher
Vmax, Fig. 6), where the contents of SOM, lignin, and
chitin were higher than 5–10 cm or 10–15 cm (Fig. 2).
Even though we did not test individual microbial
population, our results are in line with the evolution-
ary-economic behavior of microbial resource alloca-
tion strategies (Allison et al. 2014). At any point,
microbes need to decide how to allocate resources
among biomass generation, new enzyme production,
respiration, and communication with neighboring
microbes. Contrary to resource allocations to other
processes (e.g., biomass production, respiration)
which can benefit microbes relatively quickly and
directly, microbial enzyme production is a rather risky
investment of current resources. Once generated,
microbial extracellular enzymes should be exuded
into the soil matrix and move in a water film to
encounter corresponding substrates. Neighboring
cheater cells, enzyme-mineral interaction, water and
substrate availability can all influence the success of
this microbial investment, which can be gauged as a
greater acquisition of new resources than the amount
of resources used for enzyme generation. As such,
microbes would have evolved to generate more
enzymes when the corresponding substrates exist in
bFig. 6 Michaelis-Menten parameter Vmax of peroxidase (a); N-acetyl-glucosaminidase (b); b-glucosidase (c); acid phosphatase(d), and km of peroxidase (e); N-acetyl-glucosaminidase (f); b-glucosidase (g); acid phosphatase (h) under invaded (orange
bars) and the non-invaded soils (blue bars) at 0–5, 5–10, and
10–15 cm (n=6). Significant difference between the invaded and
the non-invaded soils at each depth was marked with asterisk.
(Color figure online)
Table 2 Pearson’s correlation coefficient (r) and p value between substrate and Michaelis–Menten parameters of corresponding
enzymes
PER NAG BG AP
Vmax-lignin
km-lignin
Vmax-
chitin
km-chitin
Vmax-
cellulose
km-cellulose
Vmax-organic P km-organic P
r 0.45 0.39 0.13 0.01 0.15 0.04 - 0.45 - 0.04
p 0.0061 0.0174 0.4812 0.9401 0.4022 0.8320 0.0071 0.8173
PER peroxidase, NAG N-acetyl-glucosaminidase, BG b-glucosidase, AP acid phosphatase, P phosphorus
123
Biogeochemistry (2020) 150:181–196 193

abundant quantities to increase their likelihood of
success (Benner 1989; Allison et al. 2011, 2014;
German et al. 2011). In this study, higher relative
abundance of lignin and increase in fungal biomass
along with increases in PER and NAG generation
(higher [S] and higher [E]in the Eqs. 1 and 2) under
invasion at 0–5 cm would have promoted microbial
success in resource acquisition.
Conclusions
Our results suggest that the input of relatively
recalcitrant substrates by P. cuspidatum altered the
kinetics of microbial extracellular enzymes. The soils
under P. cuspidatum had higher lignin and fun-
gal biomass than the adjacent non-invaded soils.
We observed a corresponding increase in the Vmax of
PER and NAG in the invaded soils, which degrades
lignin and chitin, respectively. The enzymatic trans-
formation of the recalcitrant chemical compounds in
P. cuspidatum litter further alters the carbon chem-
istry under P. cuspidatum soils. The persistence of
these enzymatic transformation products in the in-
vaded soils may negatively affect native species and
thus interfere with restoration efforts. The manage-
ment practices that can effectively alter the soil
chemistry and nutrient cycling in the invaded soils -
would benefit the native species. Thus, understand-
ing the enzymatic transformation of plant litter and
subsequent changes in nutrient and C cycling in the
invaded habitats would help to formulate knowledge-
based restoration practices.
Acknowledgements We thank Prasanta Bhowmik, Hamid
Mashayekhi for allowing us to use labs at the University of
Massachusetts Amherst, and Jameson Bodenheimer for help
with the lab experiments. This material is based on research that
is supported by the United States Department of Agriculture
NIFA under Award Number 2017-67014-26698. This is
Technical Contribution No. 6893 of the Clemson University
Experiment Station.
References
Allison SD, Weintraub MN, Gartner TB, Waldrop MP (2011)
Evolutionary-economic principles as regulators of soil
enzyme production and ecosystem function. Soil Enzymol.
Springer, Berlin, pp 229–243
Allison SD, Chacon SS, German DP (2014) Substrate concen-
tration constraints on microbial decomposition. Soil Biol
Biochem 79:43–49
Anderson T, Domsch KH (2010) Soil microbial biomass: the
eco-physiological approach. Soil Biol Biochem
42:2039–2043
Angst G, John S, Mueller CW, Kogel-knabner I, Rethemeyer J
(2016) Tracing the sources and spatial distribution of
organic carbon in subsoils using a multi-biomarker
approach. Sci Rep 6:29478. https://doi.org/10.1038/
srep29478
Batten KM, Scow KM, Davies KF, Harrison SP (2006) Two
invasive plants alter soil microbial community composi-
tion in serpentine grasslands. Biol Invasions 8:217–230
Benner S (1989) Enzyme kinetics and molecular evolution.
Chem Rev 89:789–806
Billings SA, Hirmas D, Sullivan PL, Lehmeier CA, Min K,
Brecheisen Z, Hauser E, Stair R, Richter D (2018) Loss of
deep roots limits biogenic agents of soil development that
are only partially restored by decades of forest regenera-
tion. Elem Sci Anth. https://doi.org/10.1525/elementa.287
Buurman P, Peterse F, Martin G (2007) Soil organic matter
chemistry in allophanic soils: a pyrolysis-GC/MS study of
a Costa Rican Andosol catena. Eur J Soil Sci 58:1330–1347
Cronk Q, Fuller J (2014) Plant invaders. Routledge, London
Crowther TW, Bradford MA (2013) Thermal acclimation in
widespread heterotrophic soil microbes. Ecol Lett
16:469–477
Dassonville N, Vanderhoeven S, Gruber W, Meerts P (2007)
Invasion by Fallopia japonica increases topsoil mineral
nutrient concentrations. Ecoscience 14:230–240
De Schrijver A, Vesterdal L, Hansen K, De Frenne P, Augusto
L, Achat DL, Staelens J, Baeten L, De Keersmaeker L, De
Neve S, Verheyen K (2012) Four decades of post-agri-
cultural forest development have caused major redistribu-
tions of soil phosphorus fractions. Oecologia 169:221–234
Dommanget F, Evette A, Spiegelberger T, Gallet C, Pace M,
Imbert M, Navas ML (2014) Diffential allelopathic effects
of Japanese knotweed on willow and cottonwood cuttings
used in riverbank restoration techniques. J EnvironManage
132:71–78
Ekblad A, Mikusinska A (2016) Production and turnover of
ectomycorrhizal extramatrical mycelial biomass and
necromass under elevated CO2 and nitrogen fertilization.
New Phytol 211:874–885
Elgersma KJ, Ehrenfeld JG (2011) Linear and non-linear
impacts of a non-native plant invasion on soil microbial
community structure and function. Biol Invasions
13:757–768
Elgersma KJ, Yu S, Vor T, Ehrenfeld JG (2012) Microbial-
mediated feedbacks of leaf litter on invasive plant growth
and interspecific competition. Plant Soil 356:341–355
Fan P, Hay A, Marston A, Lou H, Hostettmann K (2009)
Chemical variability of the invasive neophytes Polygonumcuspidatum Sieb. and Zucc. and Polygonum sachalinen-sisF. Schimoidt et Maxim. Biochem Syst Ecol 37:24–34
Furuhashi T, Beran A, Blazso M, Czegeny Z, Schwarzinger C,
Steiner G (2009) Pyrolysis GC/MS and IR spectroscopy in
chitin analysis of Molluscan Shells. Biosci Biotechnol
Biochem 73:93–103
123
194 Biogeochemistry (2020) 150:181–196
German D, Chacon SS, Allison SD (2011) Substrate concen-
tration and enzyme allocation can affect rates of microbial
decomposition. Ecology 92:1471–1480
Hempfling R, Schulten H (1990) Chemical characterization of
the organic matter in forest soils by Curie point pyrolysis-
GC/MS and pyrolysis-field ionization mass spectrometry.
Org Geochem 15:131–145
Joanisse G, Bradley RL, Preston C, Munson A (2007) Soil
enzyme inhibition by condensed litter tannins may drive
ecosystem structure and processes: the case of Kalmia
angustifolia. New Phytol 175:535–546
Johnsen A, Jacobsen OS (2008) A quick and sensitive method
for the quantification of peroxidase activity of organic
surface soil from forests. Soil Biol Biochem 40:814–821
Keiblinger KM, Hall EK, Wanek W, Szukics U, Hammerle I,
Ellersdorfer G, Bock S, Strauss J, Sterflinger K, Richter A,
Zechmeister-Boltenstern S (2010) The effect of resource
quantity and resource stoichiometry on microbial carbon-
use-efficiency. FEMS Microbiol Ecol 73:430–440
Legg JO, Black C (1955) Determination of organic phosphorus
in soils. II Ignition method. Soil Sci Soc Am J 19:139–143
Li ZH, Wang Q, Ruan X, Pan CD, Jiang DA (2010) Phenolics
and plant allelopathy. Molecules 15:8933–8952
Liao C, Peng R, Luo Y, Zhou X, Wu X, Fang C, Chen J, Li B
(2006) Altered ecosystem carbon and nitrogen cycles by
plant invasion: a meta-analysis. New Phytol 177:706–714
Liao JD, Boutton T (2008) Soil microbial biomass response to
woody plant invasion of grassland. Soil Biol Biochem
40:1207–1216
Loeppmann S, Blagodatskaya E, Pausch J (2016) Substrate
quality affects kinetics and catalytic efficiency of exo-en-
zymes in rhizosphere and detritusphere. Soil Biol Biochem
92:111–118
Manzoni S, Taylor P, Richter A, Porporato A (2012) Environ-
mental and stoichiometric controls on microbial carbon-
use efficiency in soils. New Phytol 196:79–91
Mattonai M, Tamburini D, Colombini MP, Ribechini E (2016)
Timing in analytical pyrolysis: Py(HMDS)-GC/MS of
glucose and cellulose using online micro reaction sampler.
Anal Chem 88:9318–9325
Min K, Lehmeier CA, Ballantyne F, Tatarko A, Billings SA
(2014) Differential effects of pH on temperature sensitivity
of organic carbon and nitrogen decay. Soil Biol Biochem
76:193–200
Min K, Buckeridge K, Ziegler S, Edwards K, Bagchi S, Billings
SA (2019) Temperature sensitivity fo biomass-specific
microbial exo-enzyme activities and CO2 efflux is resistant
to change across short- and long-term timescales. Glob
Change Biol 25:1793–1807
Mincheva T, Barni E, Varese GC, Brusa G, Cerabolini B,
Siniscalco C (2014) Litter quality, decomposition rates and
saprotrophic mycoflora in Fallopia japonica (Houtt.)
Ronse Decraene and in adjacent native grassland vegeta-
tion. Acta Oecol 54:29–35
Moravcova L, Pysek P, Jarosık V, Zakravsky P (2011) Potential
phytotoxic and shading effects of invasive Fallopia(Polygonaceae) taxa on the germination of dominant native
species. NeoBiota 9:31–47
Murrell C, Gerber E, Krebs C, Parepa M, Schaffner U, Bossdorf
O (2011) Invasive knotweed affects native plants through
allelopathy. Am J Bot 98:38–43
Nierop KGJ, van Bergen PF, Buurman P, van Lagen B (2005)
NaOH and Na4P2O7 extractable organic matter in two
allophanic volcanic ash soils of the Azores Islands—a
pyrolysis GC/MS study. Geoderma 127:36–51
Perron NR, Brumaghim J (2009) A Review of the antioxidant
mechanisms of polyphenol compounds related to iron
binding. Cell Biochem Biophys 53:75–100
Pimentel D (2002) Biological invasions: economic and envi-
ronmental costs of alien plant, animal, and microbe spe-
cies. CRC Press, Boca Raton
Pimentel D, McNair S, Janecka J, Wightman J, Simmonds C,
O’connell C, Wong E, Russel L, Zern J, Aquino T, Tso-
mondo T (2001) Economic and environmental threats of
alien plant, animal, and microbe invasions. Agric Ecosyst
Environ 84:1–20
Pold G, Grandy AS, Melillo JM, Deangelis KM (2017) Changes
in substrate availability drive carbon cycle response to
chronic warming. Soil Biol Biochem 110:68–78
Reynolds PL, Glanz J, Yang S, Hann C, Couture J, Grosholz E
(2017) Ghost of invasion past: legacy effects on commu-
nity disassembly following eradication of an invasive
ecosystem engineer. Ecosphere 8:e01711. https://doi.org/
10.1002/ecs2.1711
Rohn S, Rawel HM, Kroll J (2002) Inhibitory effects of plant
phenols on the activity of selected enzymes. J Agric Food
Chem 50:3566–3571
Russell JB, Cook GM (1995) Energetics of bacterial growth:
balance of anabolic and catabolic reactions. Microbiol Rev
59:48–62
Saiz-Jimenez C, de Leeuw J (1984) Pyrolysis-gas chromatog-
raphy-mass spectrometry of soil polysaccharides, soil ful-
vic acids and polymaleic acid. Org Geochem 6:287–293
Saunders W, Williams E (1955) Observations on the determi-
nation of total organic phosphorus in soils. J Soil Sci
6:254–267
Schimel JP, Weintraub MN (2003) The implications of exoen-
zyme activity on microbial carbon and nitrogen limitation
in soil: a theoretical model. Soil Biol Biochem 35:549–563
Singh H, Dixit S, Verma PC, Kumar P, Singh H, Dixit S, Verma
PC, Singh PK (2013) Differential peroxidase activities in
three different crops upon insect feeding. Plant Signal
Behav. https://doi.org/10.4161/psb.25615
Sinsabaugh RL (2010) Phenol oxidase, peroxidase and organic
matter dynamics of soil. Soil Biol Biochem 42:391–404
Six J, Frey SD, Thiet RK, Batten KM (2006) Bacterial and
fungal contributions to carbon sequestration in agroe-
cosystems. Soil Sci Soc Am J 2:555–569
Stone MM, Weiss MS, Goodale CL, Adams MB, Fernandez IJ,
German DP, Allison SD (2012) Temperature sensitivity of
soil enzyme kinetics under N-fertilization in two temperate
forests. Glob Change Biol 18:1173–1184
Suseela V, Alpert P, Nakatsu CH, Armstrong A, Tharayil N
(2016) Plant-soil interactions regulate the identity of soil
carbon in invaded ecosystems: implication for legacy
effects. Funct Ecol 30:1227–1238
Szenk M, Dill KA, de Draff AMR (2017) Why do fast-growing
bacteria enter overflow metabolism? Testing the mem-
brane real estate hypothesis. Cell Syst 5:95–104
Tamura M, Tharayil N (2014) Plant litter chemistry and
microbial priming regulate the accrual, composition and
123
Biogeochemistry (2020) 150:181–196 195
stability of soil carbon in invaded ecosystems. New Phytol
203:110–124
Tamura M, Suseela V, SimpsonM, Powell B, Tharayil N (2017)
Plant litter chemistry alters the content and composition of
organic carbon associated with soil mineral and aggregate
fractions in invaded ecosystems. Glob Change Biol
23:4002–4018
Tharayil N, Alpert P, Bhowmik P, Gerard P (2013) Phenolic
inputs by invasive species could impart seasonal variations
in nitrogen pools in the introduced soils: a case study with
Polygonum cuspidatum. Soil Biol Biochem 57:858–867
Triebwasser-freese DJ, Tharayil N, Caroline MP, Gerard PG
(2015) Catalytic kinetics and activation energy of soil
peroxidases across ecosystems of differing lignin chemis-
tries. Biogeochem 124:113–129
van der Kaaden A, Boon J, de Leeuw JW, de Lange F, Wijnand
Schuyl PJ, Schulten HR, Bahr U (1984) Comparison of
analytical pyrolysis techniques in the characterization of
chitin. Anal Chem 56:2160–2165
Waldrop G (2009) A qualitative approach to enzyme inhibition.
Biochem Mol Biol Edu 37:11–15b
Wang G, Post WM, Mayes MA (2013) Development of
microbial-enzyme-mediated decomposition model
parameters through steady-state and dynamic analyses.
Ecol Appl 23:255–272
Wang JJ, Tharayil N, Chow AT, Suseela V, Zeng H (2015)
Phenolic profile within the fine-root branching orders of an
evergreen species highlights a disconnect in root tissue
quality predicted by elemental- and molecular-level carbon
composition. New Phytol 206:1261–1273
Wieder WR, Boehnert J, Bonan GB (2014) Evaluating soil
biogeochemistry parameterizations in Earth systemmodels
with observations. Global Biogeochem Cycles 28:211–222
Wieder WR, Bonan GB, Allison SD (2013) Global soil carbon
projections are improved by modelling microbial pro-
cesses. Nat Clim Change 3:1–4
Ximenes E, Kim Y, Mosier N, Dien B, Ladisch M (2011)
Deactivation of cellulases by phenols. Enzyme Microb
Technol 48:54–60
Yuan Y, Tang J, Leng D, Hu S, Yong JWH, Chen X (2014) An
invasive plant promotes its arbuscular mycorrhizal sym-
bioses and competitiveness through its secondary
metabolites: indirect evidence from activated carbon. PLoS
ONE. https://doi.org/10.1371/journal.pone.0097163
Zhang J, Kim KH, Choi YS, Motagamwala AH, Dumesic JA,
Brown RC, Shanks BH (2017) Comparison of fast pyrol-
ysis behavior of cornstover lignins isolated by different
methods. Sustain Chem Eng 5:5657–5661
Publisher’s Note Springer Nature remains neutral with
regard to jurisdictional claims in published maps and
institutional affiliations.
123
196 Biogeochemistry (2020) 150:181–196