plasma reactor characterization
TRANSCRIPT

1
Chapter 1
Plasma Reactor Characterization
1.1 Introduction
Plasma is often referred to as the fourth state of matter. It is highly reactive making it
useful for a number of chemical processing applications. Plasma is created when a neutral
gas is given sufficient energy from an electronic discharge source to create new product
ions and radicals. The source of free electrons is generally a high energy glow discharge
such as a high voltage electrode. This resulting collisions of electrons and gas molecules
result in a net energy transfer to the molecules producing metastable fragments and
energized ions. The resulting product is a mixture of highly excited ions consisting of
fragmented portions of the parent molecule. Plasma generated from an oxygen (O2)
carrier gas typically consists of O+, O-, O2+ and O3
+ ions for example. The plasma
particles are extremely unstable and their energetic states cause them to be highly
reactive with particles or surfaces that they contact.1 Plasma is generally produced in a
low pressure environment using a high vacuum system to promote stability of ionic
radicals formed. This low pressure stability is achieved by effectively increasing the
mean free path between the active components. Plasma may also be produced in an
environment near atmospheric pressure without the need for maintaining an expensive
vacuum system. 2
Plasma processes provide a cost effective and environmentally friendly alternative to
many important industrial processes because the method produces no unwanted waste
products and in most cases exposes operators to no significant hazards. Plasma
pretreatment is a vital process used for improving lamination, printing, and adhesion.
Plasma promotes adhesion by increasing the effective surface area of the metals for
example. This roughening in turn promotes more intimate molecular contact between the
metal and the adhesive allowing for stronger bonds to occur.3 The highly reactive ions
found in plasma make the processing a valuable tool in surface cleaning. Additionally
plasma etching is a tool used in the semiconductor industry to create tunnels on surfaces.
Plasma etching achieves this by creating a highly reactive plasma phase which contacts
2
and volatilizes the solid portion of the material to be etched. The volatilized material can
then be removed by desorption from the substrate in gaseous form.4
A variety of carrier gases can be used in plasma processing. Oxygen and argon are
two examples of carrier gases that can be used to modify surfaces. When plasma is
utilized in a controlled vacuum environment, a chemically modified surface can be
attained for use in subsequent applications. Oxygen is a commonly used carrier gas
because of its reactivity. Oxygen plasma is often used to react with low energy organic
contaminants to provide clean, high energy surfaces for chemical applications. The term
�plasma etching� refers to the selective removal of material and it is now widely used in
industry for a number of applications.5 The term more commonly refers to the process of
pathway formation on semiconductor surfaces using plasma processes.
Surface energy provides a key measure for gauging the effectiveness of plasma
modification on polymers. Plasma treatment improves wettability by creating higher
energy surfaces. These high energy surfaces allow water to spread over a solid surface
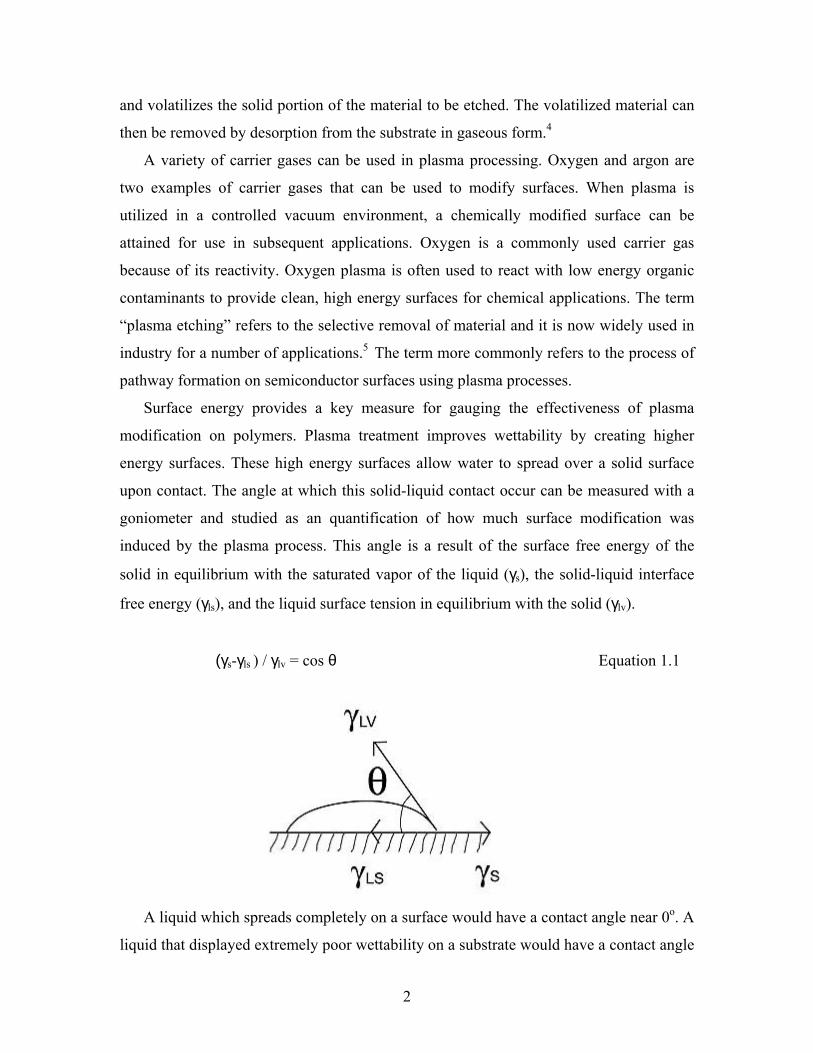
upon contact. The angle at which this solid-liquid contact occur can be measured with a
goniometer and studied as an quantification of how much surface modification was
induced by the plasma process. This angle is a result of the surface free energy of the
solid in equilibrium with the saturated vapor of the liquid (γs), the solid-liquid interface
free energy (γls), and the liquid surface tension in equilibrium with the solid (γlv).
(γs-γls ) / γlv = cos θ Equation 1.1
A liquid which spreads completely on a surface would have a contact angle near 0o. A
liquid that displayed extremely poor wettability on a substrate would have a contact angle

3
approaching 180o. A droplet having a 180o contact angle would appear as a perfectly
shaped ball sitting on a table top with no observable spreading occurring at its base in
contact with the table.
Surface energy reflects contributions from two distinct components. The polar
component (γp) of surface energy represents tension related to polar interactions and
hydrogen bonding. The dispersive component (γd) of surface energy encompasses
interactions caused by van der Waals and weaker intermolecular forces. The total surface
energy is attained from the sum of these two individual components. To account for both
components of the surface energy, contact angle (θ) data is often used from two fluids
where both surface energy components are known in each fluid. The total surface energy
of the substrate can then be calculated from the harmonic mean in which two equations
(Equations 1.1 and 1.2) are solved for polar and dispersive components, γp and γd. 6
(1 + cos θ 1) γ1 /4 = [γ1d γd /(γ1d +γd)] + [(γ1p γp /(γ1p +γp)] (1.1)
(1 + cos θ 2) γ2 /4 = [γ2d γd /(γ2d +γd)] + [(γ2p γp /(γ2p +γp)] (1.2)
The total surface energy is then calculated from the sum of the polar and dispersive
components.
γ = γp + γd (1.3)
Corona treatment is a commonly used industrial process for increasing the surface
energy of polymer substrates and enhance wettability. It has also been utilized to induce
wettability gradients across polymer surfaces for mechanical and biological applications.7
Corona discharge utilizes a high potential electrode to ionize gases in the discharge path.
The fragmented gas ions are highly reactive and act to modify the polymer surface. The
electrical discharge from the corona occurs at a threshold voltage. At voltages less than
the threshold voltage, no discharge occurs. When the threshold voltage is exceeded,
electrons are emitted from the discharge electrode and move to the lower potential
electrode ionizing the gaseous medium in its path. As reactive radicals recombine and
undergo relaxation, radiation is given off in the form of visible light yielding a corona

4
glow. Excessive voltage across the electrode is detrimental to the modification process
and produces unwanted arcing between the electrodes.8
Polymer surface modification by corona discharge is an unstable process and
wetting effects produced by the reactive ions are transient. Effects of corona discharge
modification on polyethylene surfaces after five minutes of corona treatment in air
disappear and are no longer observable by XPS analysis two days after treatment. 9 XPS
analysis quantifies chemical species on the surface of a sample. All elements and bonding
states are identified with this analytical technique with the exceptions of hydrogen and
helium. The instrument utilizes x-rays to emit photoelectrons from the sample surface.
The photoelectrons emitted are separated by an energy analyzer based on kinetic energy.
The photoelectron intensity is then plotted against binding energy to produce the XPS
spectrum.
The gradual disappearance of surface modification occurs primarily for two
reasons. First, ionic fragments and other contaminants from the surrounding air may
imbed in the modified surface reducing the wettability of the polymer. The polymer itself
may also be subject to a relaxation in which polar functional groups of the chain are
overturned into the bulk of the polymer. 9, 10 Secondly, the nature of the surface
modification induces high energy functional groups which may rearrange to form lower
energy species. Therefore it is crucial that further processing of a corona modified
surface take place soon after corona exposure. The nature of corona modification
produces functional groups on the surface of the polymer which may be utilized in a
chemical reaction to produce a sustainable wetting surface.11,12 Surfactants may also be
used on a corona modified polymer surface to sustain wettability for an extended period
of time.
Extensive XPS analysis has been performed on corona treated polystyrene
surfaces in air. Greenwood et all have shown corona treatment of polystyrene at
atmospheric pressure resulted in a dramatic increase in oxygen character on the surface of
the polymer from zero percent to 30.9% carbon-oxygen functionalities. Approximately
one third of these oxygen functional groups were carboxylic acid.13 The other functional
groups were comprised primarily of carbonyl derivatives (-C=O). Hydroxyl groups have
been shown to be present in air corona treatment as well.
5
Literature has also shown that corona discharge and other plasma treatments
introduce a significant amount of surface degradation onto the polymer by imparting pit-
like structures onto the polymer surface. The amount of surface degradation appears to be
dependant upon the pressure of the plasma process being used. High pressure plasma
processes induce larger pit-like structures typically on the order of 400-500 nm in
diameter. Low pressure plasma processes are much less destructive to the substrate and
cause smaller amount of surface degradation. 13
6
1.2 Experimental
A plasma reactor was constructed for the purpose of ionizing gases above a polymer
substrate placed on a grounded sample holder. The chamber consisted of a 11� x 8� x 8�
lexan case built with two inlet ports for gas flow. A 50 kV corona discharge coil with a
variable voltage control was mounted through the top of the chamber and sealed. The unit
utilized a variable voltage control that allowed voltages of up to 50 kV. Inlet ports were
installed at the base of the chamber to allow gases to flow into and out of the chamber. In
addition to these features, a 3 inch by 3 inch square sample platform was installed with
position adjustment controls to enable the sample holder to be adjusted vertically or
horizontally.
Water vapor was first used in characterizing the effects of water plasma on
polystyrene surfaces. Silicon surfaces were first cleaned by immersion in xylene for a
minimum of three hours. Silicon surfaces were then transferred to ethanol for a minimum
of six hours before applying polymer. An 10% by weight solution of polystyrene in
xylene was then spun on the cleaned silicon surfaces and baked for 3 hours at 120oC.
Water vapor was passed through the chamber by bubbling clean air into water within an
enclosed vessel. Tubing at the top of vessel was connected to the inlet of the plasma
reactor to allow water vapor to circulate within the chamber as the carrier gas. Humidity
levels within the chamber were measured using a Zellweger Analytical Zephyr II+
humidity meter. Humidity levels were found to quickly reach an equilibrium within the
chamber at atmospheric pressure of approximately 88% after 10 minutes of air circulation
at 40 cc/min.
Polystyrene thin films on silicon were then placed on the sample holder to
characterize contact wetting angles as a function of discharge voltage, height below the
discharge, and discharge time. Advancing contact angles were measured by removing the
film substrates from the chamber and pipetting a 10 µl water droplet onto each modified
surface. A second 10 µl droplet was then pipetted on top of the first drop and the contact
angle of the resulting water mass was measured using a Rame-Hart tilting base model
100-06 goniometer. In the first study, polystyrene films were placed on the sample holder
30 mm below the discharge wire of the corona unit at a voltage of 37 kV and exposure
7
time of one minute. Contact angle data was taken at additional discharge heights of 35,
40, 50, and 65 mm above the substrate at the same exposure time and voltage. A contact
angle curve was graphed as a function of varying discharge height. This characterization
study was repeated for discharge voltages of 32 kV, 42 kV, and 47 kV.
A second contact angle study was performed in which the 37 kV discharge height was
maintained at a constant value of 30 mm and the exposure time was varied. The 18%
solution of polystyrene in NMP was again spun onto cleaned silicon surfaces and
exposed to water plasma at time intervals of 10, 20, 30, 45, 60, and 120 seconds.
Polybutadiene was used as a second polymer to generate a contact angle series versus
time at a discharge voltage of 37 kV and height of 30 mm for comparison.
To calculate surface energy effect resulting from the plasma chamber, two additional
series of contact angle data were taken with formamide droplets on polystyrene surfaces.
The first data series was taken at exposure heights of 30, 35, 40, 50, and 65 mm discharge
height at fixed exposure time of one minute and with a constant discharge voltage of 37
kV. The second data series was taken at exposure times of 0, 10, 20, 30, 45, 60, and 120
seconds at a fixed discharge height of 30 mm and a constant discharge voltage of 37 kV.
This data was utilized with parallel data from water droplets in calculations of
polystyrene surface energy using the harmonic mean method.
Contact angle characterization was also performed as a function of discharge time and
position on the sample platform perpendicular to the linear corona discharge electrode
wire. To perform these studies, 5 mm x 8 mm silicon pieces were cut and polystyrene
was spuncast onto each cleaned piece from a solution of 10% by weight polystyrene in
xylene. The pieces were baked for one hour at 120oC to remove residual xylene from the
surfaces. For time characterization of plasma exposure time, polystyrene coated silicon
pieces were individually exposed to water vapor plasma at discharge times of 10, 20, 30,
45, 60, and 120 seconds. 10 ml deionized water drops were then pipetted onto each
polymer surface. A second drop was then pipetted on top of the initial drop and the
advancing contact angle was measured and recorded. Advancing contact angles were
measured four times and averaged. Contact angle characterization by sample platform
position was achieved by placing polystyrene coated silicon pieces at 0.25 cm intervals
across the 3 inch by 3 inch sample platform perpendicular to the discharge wire. Pieces

8
were staggered in two adjacent, individual rows. Samples were simultaneously exposed
to water vapor plasma at 37 kV for 1 minute exposure time at 37 kV and 3 cm depth
below the wire. Deionized water was immediately pipetted in 10 ml drops onto each
polystyrene film to minimize surface energy losses. Advancing contact angle
measurements were then taken for at each position four times and averaged.
Ammonia hydroxide was used to produce amine functional groups on the polystyrene
surface in additional studies performed at a discharge voltage of 37 kV and height of 30
mm. The ammonia carrier gas was produced by bubbling nitrogen gas through ammonia
hydroxide at a rate of 40 cc/min. The resulting ammonia rich vapor was then fed into the
inlet of the plasma chamber. Advancing contact angle curves were generated for this
process as a function of exposure time within the plasma reactor. XPS analysis was also
performed to quantify the degree of amine functionalization produced by the ammonia
plasma process.
A 2% solution by weight of polybutadiene in xylene was spun cast onto cleaned
silicon surfaces and baked for 30 minutes at 40oC. Characterization studies were
performed on this polymer as a function of discharge height and exposure time for
comparative purposes with polystyrene. Contact angle data was taken at discharge
heights of 30, 35, 40, 60, and 65 mm at two voltages of 37 kV and 42 kV. Contact angle
data on polybutadiene was taken at a discharge voltage of 37 kV for discharge times of
19, 29, 39, 45, 60, and 120 seconds.
9
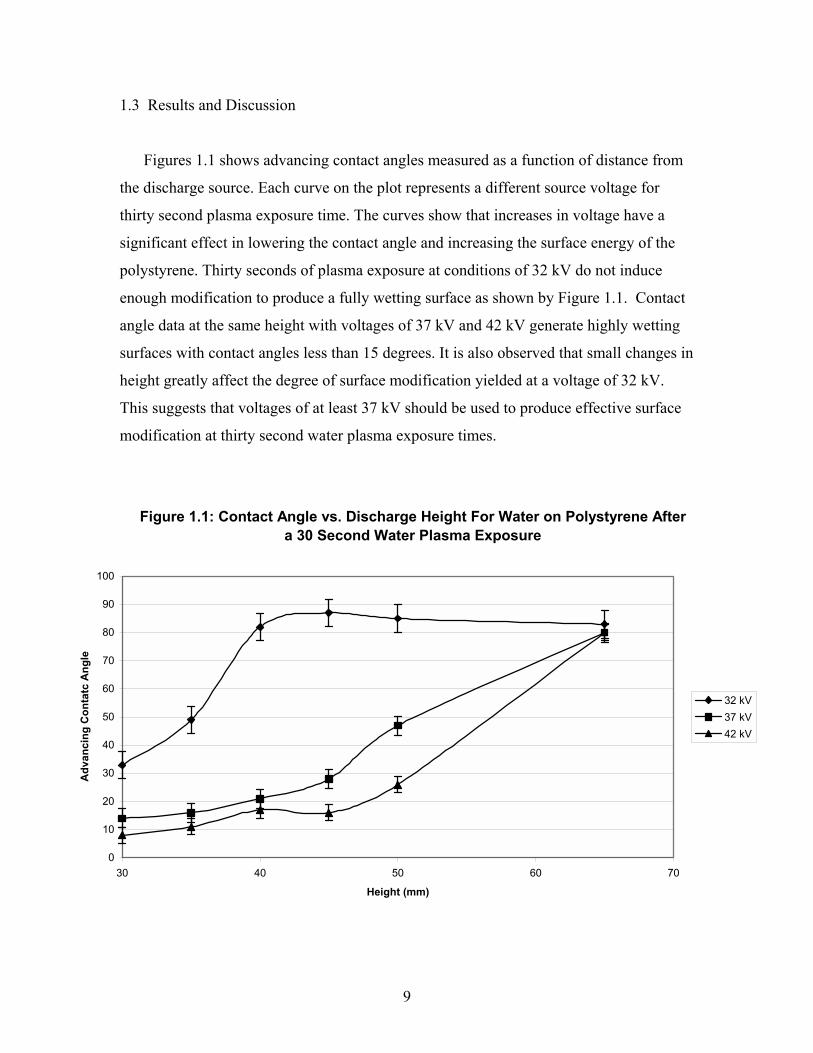
1.3 Results and Discussion
Figures 1.1 shows advancing contact angles measured as a function of distance from
the discharge source. Each curve on the plot represents a different source voltage for
thirty second plasma exposure time. The curves show that increases in voltage have a
significant effect in lowering the contact angle and increasing the surface energy of the
polystyrene. Thirty seconds of plasma exposure at conditions of 32 kV do not induce
enough modification to produce a fully wetting surface as shown by Figure 1.1. Contact
angle data at the same height with voltages of 37 kV and 42 kV generate highly wetting
surfaces with contact angles less than 15 degrees. It is also observed that small changes in
height greatly affect the degree of surface modification yielded at a voltage of 32 kV.
This suggests that voltages of at least 37 kV should be used to produce effective surface
modification at thirty second water plasma exposure times.
Figure 1.1: Contact Angle vs. Discharge Height For Water on Polystyrene After a 30 Second Water Plasma Exposure
0
10
20
30
40
50
60
70
80
90
100
30 40 50 60 70
Height (mm)
Ad
va
nc
ing
Co
nta
tc A
ng
le
32 kV
37 kV
42 kV

10
Similar studies were performed for one and two minute exposure times. Exposure for
one minute at 42 kV again yielded the strongest degree of surface modification. Contact
angle data at 32 kV however was much closer to the data given at 37 kV when the
exposure time was extended to one minute. Figure 1.3 shows contact angle data obtained
at the same voltages after an exposure time of two minutes. Contact angle data at 37 kV
approaches the values given at 42 kV when the exposure time is increased to two
minutes. The data at 32 kV shows significantly less modification than 37 kV and 42 kV
conditions at discharge distance greater than 35 mm. Collectively, this contact angle data
demonstrates that a maximal degree of surface modification can be achieved by
optimizing time, height, and voltage parameters without using large time exposure or
voltage conditions.
Figure 1.2: Contact Angle vs. Discharge Height for Water On Polystyrene After a One Minute Water Plasma Exposure
0
10
20
30
40
50
60
70
80
90
100
30 40 50 60 70
Height (mm)
Ad
va
nc
ing
Co
nta
ct
An
gle
32 kV
37 kV
42 kV

11
Figure 1.3: Contact Angle vs. Discharge Height For Water on Polystyrene After a Two Minute Water Plasma Exposure
0
10
20
30
40
50
60
70
80
90
100
30 40 50 60 70
Height (mm)
Ad
va
nc
ing
Co
nta
ct
An
gle
32 kV
37 kV
42 kV
Error bars on contact angle graphs represent the average standard deviation of contact
angle data points for each voltage curve. It should be noted however that the spread in
measured contact angle data appeared to consistently increase with higher measured
values of contact angles. Average advancing contact angle data less than 25o in all cases
demonstrated significantly less spread in individual data points than contact angle
averages measured on more hydrophobic surfaces with higher values. The 37 kV curve
on Figure 1.3 shows an average contact angle value of 10o at a height of 30 mm and a
value of 87o at 65 mm. The measured values for the 10o average were 9o, 10o, 10o, and
13o. The measured values for the 87o average were 79o, 85o, 91o, and 94o. This increase in
variation with increasing contact angle measurements was likely inherent in the process
because the plasma modification was more influenced by small variations in voltage,
height, and exposure time when the modification had not reached a maximum. This
observed variation was present in all contact angle data taken.

12
Standard corona conditions were initially selected to use in surface modification of
polymer films based on these results. Contact angle results show that better surface
modification is achieved with higher voltages. During these experiments it should be
noted that some arcing from the discharge wire to the sample platform was observed at
larger voltages. Mild arcing was occasionally observed at 42 kV and 3 cm height. Strong
arcing appeared more consistently at higher voltages greater that 45 kV. Because arcing
has a very destructive effect on the capacitor within the corona power supply it must be
avoided. Therefore a voltage of 37 kV was selected as a standard voltage to use unless
other power requirements were needed.
Arcing was also a primary consideration in selecting a standard discharge height in
plasma experiments. Contact angle curves showed that surface modification of
polystyrene films was improved at smaller discharge heights above the sample. However,
lowering the discharge wire within 3 cm of the sample platform at 37 kV also produced
significant arcing. Therefore a standard experimental height of 3 cm was chosen for later
experiments unless other conditions were specifically needed. At the selected conditions
of 37 kV and 3 cm height, Figure 1.4 shows that maximum surface modification occurs
after approximately 45 seconds of water plasma exposure. Based on this curve, a
standard exposure time of one minute was selected for experiments performed at these
height and voltage conditions.
13
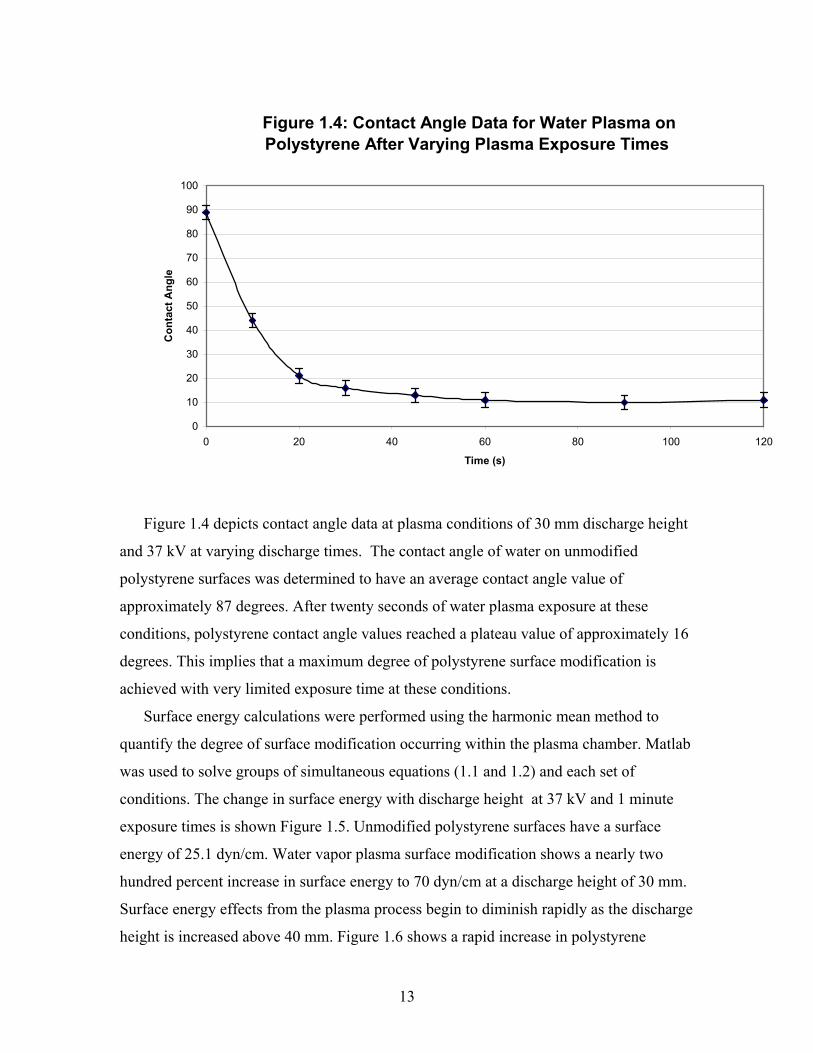
Figure 1.4: Contact Angle Data for Water Plasma on Polystyrene After Varying Plasma Exposure Times
0
10
20
30
40
50
60
70
80
90
100
0 20 40 60 80 100 120
Time (s)
Co
nta
ct
An
gle
Figure 1.4 depicts contact angle data at plasma conditions of 30 mm discharge height
and 37 kV at varying discharge times. The contact angle of water on unmodified
polystyrene surfaces was determined to have an average contact angle value of
approximately 87 degrees. After twenty seconds of water plasma exposure at these
conditions, polystyrene contact angle values reached a plateau value of approximately 16
degrees. This implies that a maximum degree of polystyrene surface modification is
achieved with very limited exposure time at these conditions.
Surface energy calculations were performed using the harmonic mean method to
quantify the degree of surface modification occurring within the plasma chamber. Matlab
was used to solve groups of simultaneous equations (1.1 and 1.2) and each set of
conditions. The change in surface energy with discharge height at 37 kV and 1 minute
exposure times is shown Figure 1.5. Unmodified polystyrene surfaces have a surface
energy of 25.1 dyn/cm. Water vapor plasma surface modification shows a nearly two
hundred percent increase in surface energy to 70 dyn/cm at a discharge height of 30 mm.
Surface energy effects from the plasma process begin to diminish rapidly as the discharge
height is increased above 40 mm. Figure 1.6 shows a rapid increase in polystyrene

14
surface energy during the first twenty seconds of modification. Surface energy then
appears to plateau at 70 dyn/cm with longer exposure times.

15
Figure 1.5: Surface Energy of Polystyene vs. Corona Discharge Height at 37 kV and 1 Minute Exposure Time
0
10
20
30
40
50
60
70
80
30 40 50 60 70
Height (mm)
Su
rfa
ce
En
erg
y (
dy
n/c
m)
Figure 1.6: Surface Energy of Polystyrene vs. Water Plasma Exposure Time at 37 kV and 3 cm Discharge Height
0
10
20
30
40
50
60
70
80
0 20 40 60 80 100 120 140
Time (s)
Su
rfa
ce
En
erg
y (
dy
n/c
m)
16
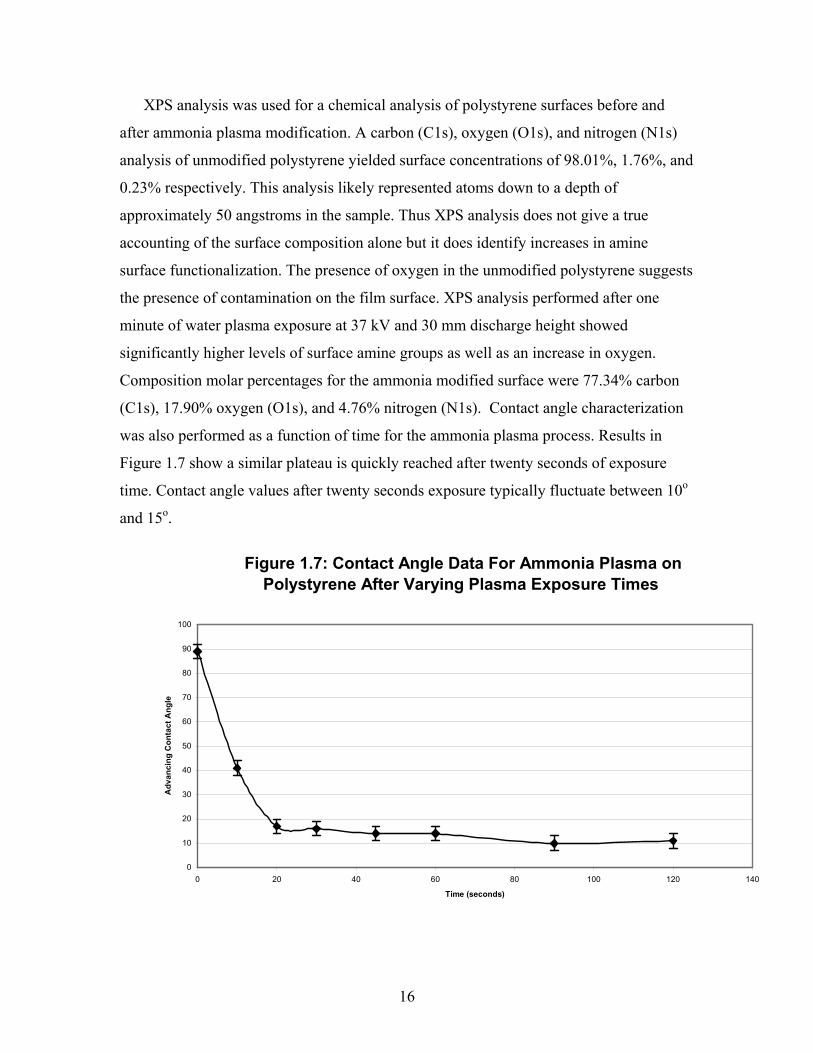
XPS analysis was used for a chemical analysis of polystyrene surfaces before and
after ammonia plasma modification. A carbon (C1s), oxygen (O1s), and nitrogen (N1s)
analysis of unmodified polystyrene yielded surface concentrations of 98.01%, 1.76%, and
0.23% respectively. This analysis likely represented atoms down to a depth of
approximately 50 angstroms in the sample. Thus XPS analysis does not give a true
accounting of the surface composition alone but it does identify increases in amine
surface functionalization. The presence of oxygen in the unmodified polystyrene suggests
the presence of contamination on the film surface. XPS analysis performed after one
minute of water plasma exposure at 37 kV and 30 mm discharge height showed
significantly higher levels of surface amine groups as well as an increase in oxygen.
Composition molar percentages for the ammonia modified surface were 77.34% carbon
(C1s), 17.90% oxygen (O1s), and 4.76% nitrogen (N1s). Contact angle characterization
was also performed as a function of time for the ammonia plasma process. Results in
Figure 1.7 show a similar plateau is quickly reached after twenty seconds of exposure
time. Contact angle values after twenty seconds exposure typically fluctuate between 10o
and 15o.
Figure 1.7: Contact Angle Data For Ammonia Plasma on Polystyrene After Varying Plasma Exposure Times
0
10
20
30
40
50
60
70
80
90
100
0 20 40 60 80 100 120 140
Time (seconds)
Ad
va
nc
ing
Co
nta
ct
An
gle
17
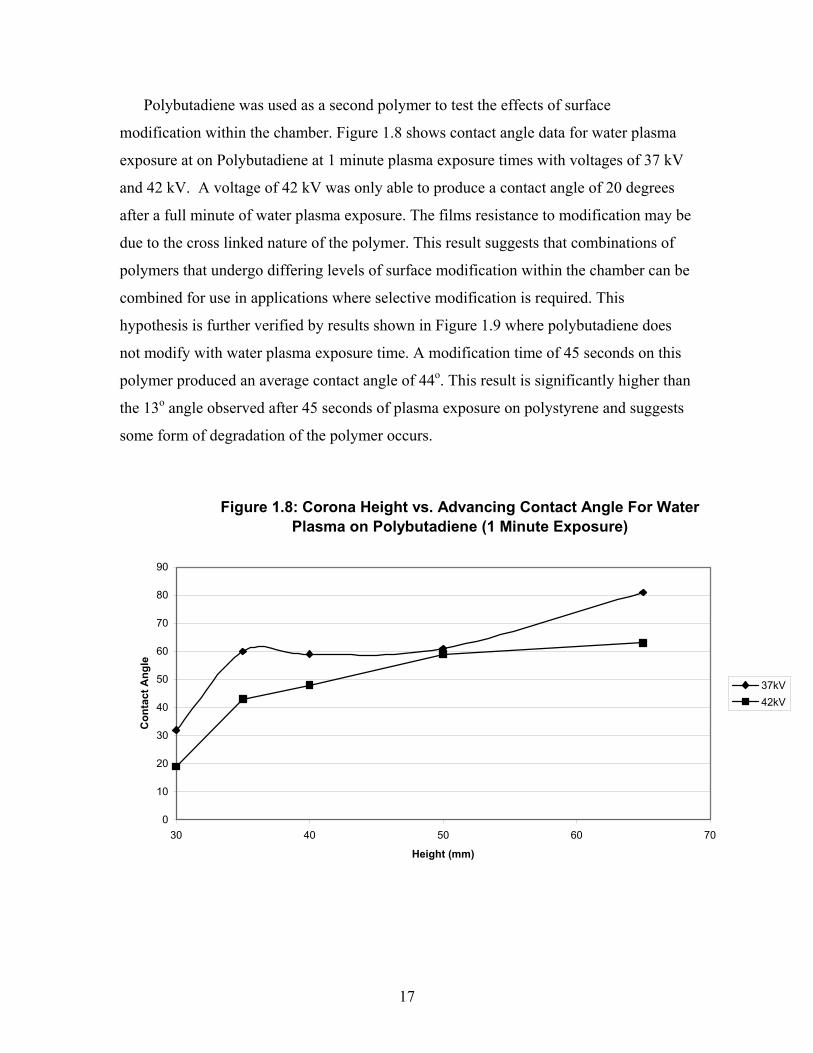
Polybutadiene was used as a second polymer to test the effects of surface
modification within the chamber. Figure 1.8 shows contact angle data for water plasma
exposure at on Polybutadiene at 1 minute plasma exposure times with voltages of 37 kV
and 42 kV. A voltage of 42 kV was only able to produce a contact angle of 20 degrees
after a full minute of water plasma exposure. The films resistance to modification may be
due to the cross linked nature of the polymer. This result suggests that combinations of
polymers that undergo differing levels of surface modification within the chamber can be
combined for use in applications where selective modification is required. This
hypothesis is further verified by results shown in Figure 1.9 where polybutadiene does
not modify with water plasma exposure time. A modification time of 45 seconds on this
polymer produced an average contact angle of 44o. This result is significantly higher than
the 13o angle observed after 45 seconds of plasma exposure on polystyrene and suggests
some form of degradation of the polymer occurs.
Figure 1.8: Corona Height vs. Advancing Contact Angle For Water Plasma on Polybutadiene (1 Minute Exposure)
0
10
20
30
40
50
60
70
80
90
30 40 50 60 70
Height (mm)
Co
nta
ct
An
gle
37kV
42kV

18
Figure 1.9: Contact Angle of Water on Polybutadiene After After Varying Water Plasma Exposure Times
0
10
20
30
40
50
60
70
80
90
100
0 20 40 60 80 100 120 140
Time (s)
Co
nta
ct
An
gle

19
1.4 Conclusions
A plasma chamber can be effectively constructed utilizing a 50 kV corona discharge
unit and selected carrier gases. The degree of surface modification will be greatly
affected by the distance the polymer film is maintained from the discharge unit as well as
the plasma exposure time. Polystyrene samples placed closest to the discharge electrode
and exposed for the greatest amount of time will yield the highest degree of surface
modification. These conditions will also produce the greatest increase in surface energy
as suggested by contact angle data. Discharge voltage, height, and time may be optimized
to produce a maximal level of polymer surface modification and prevent arcing without
using high voltages which may be detrimental to the corona power supply.
20
1.4 References
1. Hollahan, J. Techniques and Applications of Plasma Chemistry. Wiley. New
York. 1974.
2. Lynch, J. Journal of Applied Polymer Science. v. 71. p. 319. Jan. 1999.
3. Good, R.J. Journal of Adhesion Science and Technology. v. 7(9). p. 1015-21.
1993.
4. M. Lieberman. Principles of Plasma Discharges and Materials Processing. John
Wiley and Sons. New York. 1994.
5. Padday, J.F. Journal of Adhesion Science and Technology. v. 6(12). p. 1347-58.
6. Ph. D. Dissertation. Ronald Attilio DiFelice. Virginia Tech. April 2001.
7. Lee, J. Journal of Colloid and Interface Science. v. 205(2). p. 323-330. Sept.
1998.
8. L. Loeb. Electrical Coronas: Their Basic Physical Mechanisms. University of
California Press. 1962.
9. Foerch, R. Journal of Adhesion Science and Technology. v. 5(7). p. 549-64. 1991
10. Murakami, T. Journal of Colloid and Interface Science. v. 202(1). p.37-44. 1993.
effects of aging media after plasma treatment with oxygen
11. Morra, M. Journal of Colloid and Interface Science. v. 137. p. 11. 1990.
12. Occhiello, E. Journal of Applied Polymer Science. v. 42, 551. 1991.
13. Greenwood, O. Journal of Adhesion Science and Technology. 9(3), 311-326.
(1995).
21
Chapter 2
Quantification of Surface Modification
2.1 Introduction
Photoluminescence is a phenomenon in which light is emitted from a material
excited by another light source of higher energy. The photons from the source must have
enough energy to cause excitation for photoluminescence. In this excited state, electrons
transition from their valence electron states to a higher energy conductance band. The
resulting excited transition state is unstable and the electrons quickly fall back to their
original ground states. As the electrons return to ground state, photoluminescent radiation
is emitted. This relaxation occurs on the order of nanoseconds and the radiation given in
returning to ground state can be collected by a fluorescence spectrometer for analysis.
Photoluminescent radiation provides a unique insight into the material properties and
electronic energy states of the sample.1
Photoluminescence analysis is a valuable tool because it provides a wealth of
information on the electronic properties of a substance with limited degrading of the
sample being tested. Unlike many other methods of optical analysis, photoluminescence
is relatively insensitive to issues of excitation beam alignment and surface imperfections
of the sample being tested.2 The primary requirement for utilizing photoluminescence
analysis is that the sample being studied must contain a gap between conductance and
valence bands allowing for emissions due to the relaxation of excited electrons. This band
gap may be inherent in the material or artificially induced by secondary impurity
materials. Samples that do not contain prohibitively large band gaps or contain very small
energy band gaps will not produce luminescence in the visible wavelength range without
the addition of impurities.
Photoluminescent tagging dyes are often used as staining agents in biological
applications to label and sort cells in tissue samples. They are also widely used as
molecular probes to label the presence of specific functional groups and molecules.
Tagging agents are useful in these applications because they form covalent bonds with
22
specific functional groups. After attachment the tagging agents absorb light of a specific
excitation wavelength. The excited electrons resulting from this absorption in turn emit
light of a specific wavelength which can be detected by fluorescence sprectrometry.
Bryhan et al. have shown fluorescent dyes are useful in tagging oxidized groups on
polymers after surface modification with corona discharge.3 Fluorescence intensity has
also been used to estimate the concentration of DNA in hybridization reactions by
inducing ethidium bromide (EtBr).4 Photoluminescent tagging agents are available in a
broad range of excitation and emission wavelengths.
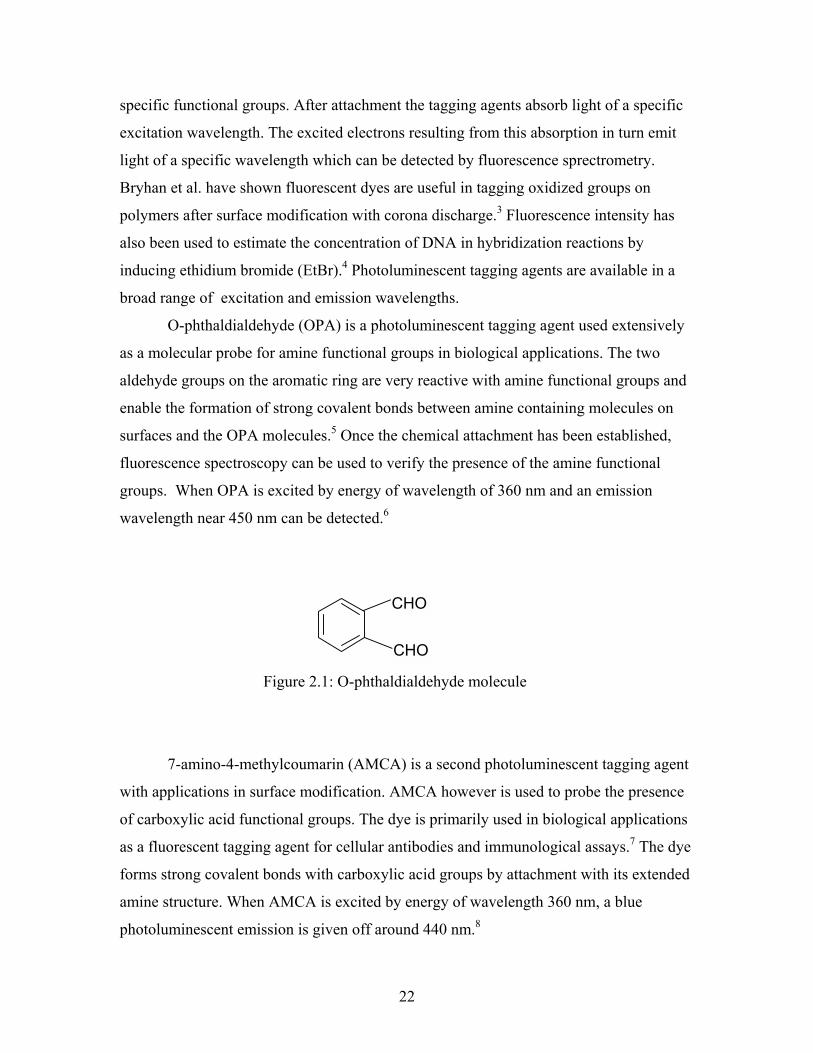
O-phthaldialdehyde (OPA) is a photoluminescent tagging agent used extensively
as a molecular probe for amine functional groups in biological applications. The two
aldehyde groups on the aromatic ring are very reactive with amine functional groups and
enable the formation of strong covalent bonds between amine containing molecules on
surfaces and the OPA molecules.5 Once the chemical attachment has been established,
fluorescence spectroscopy can be used to verify the presence of the amine functional
groups. When OPA is excited by energy of wavelength of 360 nm and an emission
wavelength near 450 nm can be detected.6
CHO
CHO Figure 2.1: O-phthaldialdehyde molecule
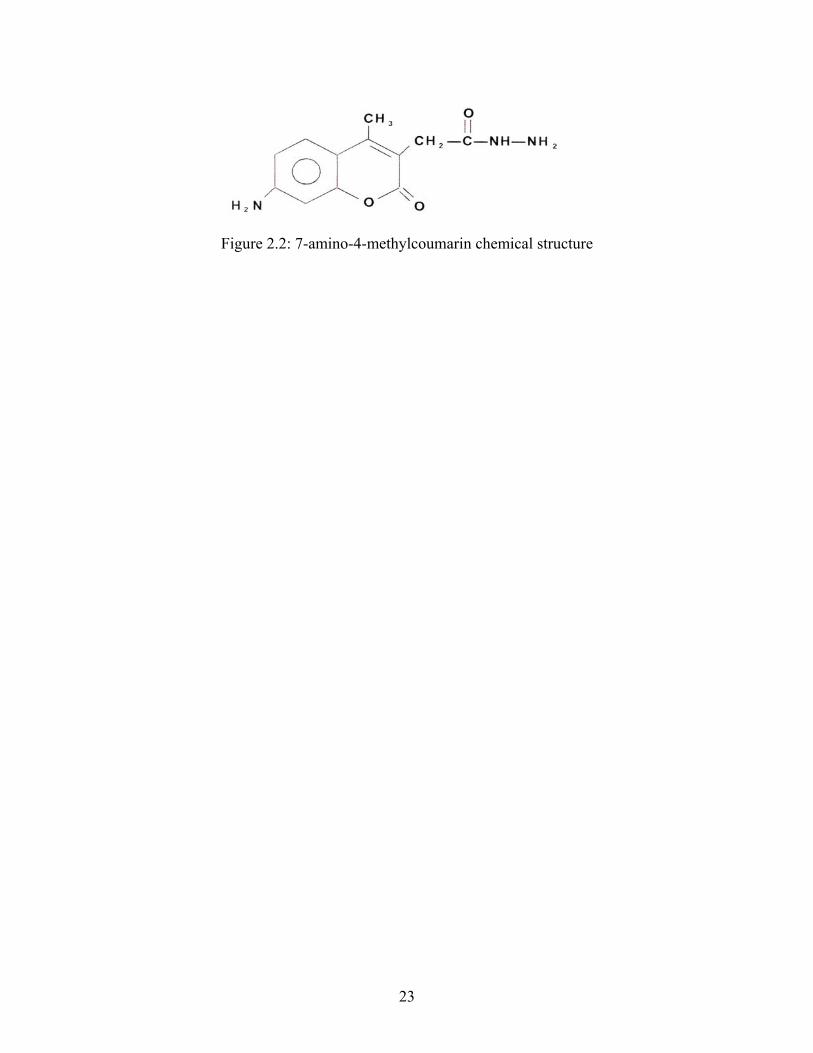
7-amino-4-methylcoumarin (AMCA) is a second photoluminescent tagging agent
with applications in surface modification. AMCA however is used to probe the presence
of carboxylic acid functional groups. The dye is primarily used in biological applications
as a fluorescent tagging agent for cellular antibodies and immunological assays.7 The dye
forms strong covalent bonds with carboxylic acid groups by attachment with its extended
amine structure. When AMCA is excited by energy of wavelength 360 nm, a blue
photoluminescent emission is given off around 440 nm.8
23
Figure 2.2: 7-amino-4-methylcoumarin chemical structure
24
2.2 Experimental
Two photoluminescent dyes were used as a basis to verify surface modification by
the presence of specific functional groups. A 5 ml solution of AMCA was prepared by
dissolving 1 mg of AMCA reagent into 1 ml of dimethylformamide (DMF). The solution
was then diluted with the addition of 4 ml of water yielding a base solution with a
concentration of 0.81 mmol/L in a total volume of 5 mL. This solution served as a basis
from which all other AMCA experiments were performed. OPA was received directly
from Pierce Endogen in solution with a molar concentration of 5.96 mmol/L .
The second stage of preparation for this experimental series required the
generation of calibration curves for AMCA and OPA for the purpose of estimating the
carboxyl and amine surface concentrations from photoluminescent intensity data. Each
calibration curve was prepared by using the maximum photoluminescent intensity near
the emission wavelength of each dye solution. These peak intensities were then taken for
a series of dilutions for each solution and plotted as a function of concentration. All
surfaces were prepared by spincasting 10% polystyrene by weight in xylene onto clean
silicon substrates. Polymer films were baked for one hour at 120oC to remove residual
xylene left over from the spinning process.
AMCA was first used to verify the presence of carboxyl groups on modified
polystyrene surfaces during the water vapor plasma process. Polystyrene surface
modification was then achieved by corona treatment using deionized water vapor as the
carrier gas at 37 kV, 3 cm discharge height, and one minute plasma exposure time. 50 µl
of the prepared AMCA dilute solution were pipetted onto the surface immediately after
plasma modification. The solution remained on the surface for a period of 10 minutes
before the surface was rinsed in deionized water and dried with an air gun.
Photoluminescence emission spectra were then taken using the Hitachi F4500
Fluorescence Spectrometer at an excitation wavelength of 360 and a scanning rate 240
nm/min. A resulting emission around 450 nm would indicate the presence of carboxyl
functional groups.
The same process was repeated to verify the presence of amine functional groups
on polystyrene after ammonia plasma modification. In this process however, the
25
premixed solution of OPA was used as the photoluminescent tag in place of the AMCA
reagent. Additional studies were also performed in which AMCA was used in the amine
plasma process and OPA was used in the water vapor plasma process.
Photoluminescent tags were also used as a tool to characterize ion current
distribution within the plasma chamber. Polystyrene was again spun onto 5 mm x 8 mm
rectangular pieces of clean silicon and baked for 30 minutes at 120oC. These pieces were
then placed at 0.25 cm intervals across the 3 inch by 3 inch sample platform
perpendicular to the discharge wire. Pieces were staggered in two individual rows
because the 5 mm width of each sample prohibited placement of the pieces at 0.25 cm
intervals in a single row. Samples were exposed to water vapor plasma at 37 kV for 1
minute exposure time at 37 kV and 3 cm depth below the wire. After plasma exposure,
the samples were removed and 50 uL of AMCA solution was pipetted onto each polymer
film. AMCA remained on each film for 10 minutes before rinsing in deionized water and
air gun drying. Photoluminescence spectra were taken of each piece and the maximum
intensity was graphed as a function of perpendicular distance from the discharge wire
center line (e.g. 0.25 cm, 0.5 cm, 0.75 cm, etc.). AMCA calibration curves were used to
estimate relative carboxylic acid concentration per unit area implied by the
photoluminescence intensity at each position.
26
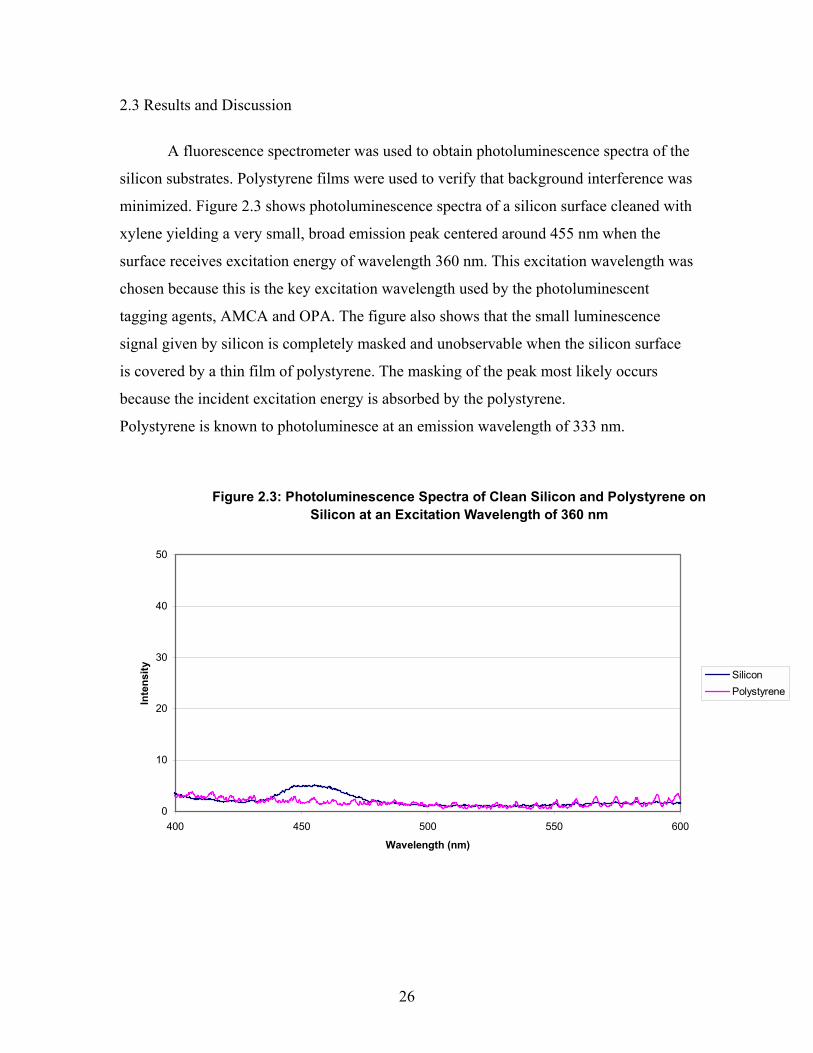
2.3 Results and Discussion
A fluorescence spectrometer was used to obtain photoluminescence spectra of the
silicon substrates. Polystyrene films were used to verify that background interference was
minimized. Figure 2.3 shows photoluminescence spectra of a silicon surface cleaned with
xylene yielding a very small, broad emission peak centered around 455 nm when the
surface receives excitation energy of wavelength 360 nm. This excitation wavelength was
chosen because this is the key excitation wavelength used by the photoluminescent
tagging agents, AMCA and OPA. The figure also shows that the small luminescence
signal given by silicon is completely masked and unobservable when the silicon surface
is covered by a thin film of polystyrene. The masking of the peak most likely occurs
because the incident excitation energy is absorbed by the polystyrene.
Polystyrene is known to photoluminesce at an emission wavelength of 333 nm.
Figure 2.3: Photoluminescence Spectra of Clean Silicon and Polystyrene on Silicon at an Excitation Wavelength of 360 nm
0
10
20
30
40
50
400 450 500 550 600
Wavelength (nm)
Inte
nsi
ty
Silicon
Polystyrene

27
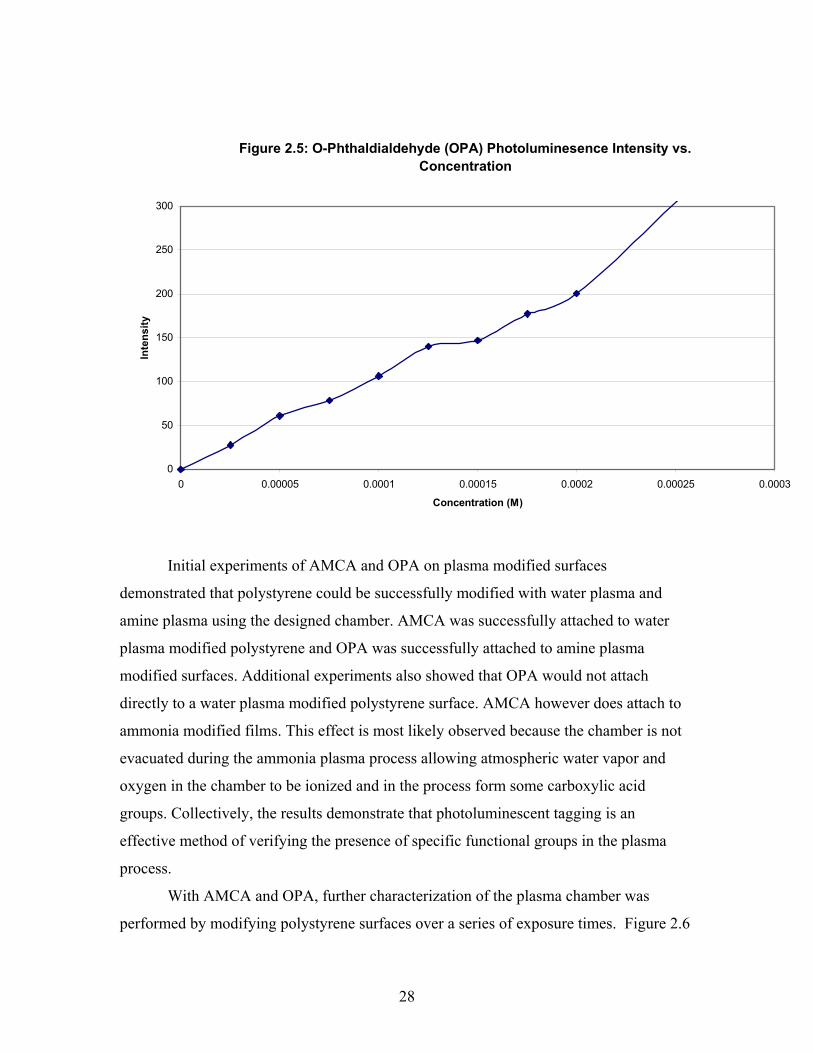
Figures 2.4 and 2.5 illustrate the change in intensity as a function of the
concentration of the photoluminescing tags in solution. The calibration curve for AMCA
was observed to be nonlinear with a concentration of 2 x 10⁻⁷ M yielding a
photoluminescence intensity peak of approximately 200 units. At concentrations lower
than this value, the calibration curve is approximately linear. As the concentration
increases above 2 x 10⁻⁷ M, the calibration curve becomes more parabolic in nature where
increases in concentration do not produce as a significant an effect on photoluminescence
intensity. The calibration curve for OPA is also somewhat linear up to a concentration of
0.0002 M. At stronger concentration curve becomes parabolic. These curves were used to
estimate carboxylic acid and amine functional group concentrations based on
photoluminescence intensities. Because the curves were much more linear for dilute
concentrations having intensities of less than 200 units, it was assumed that reasonable
estimates of surface moieties could be attained given identical detector conditions.
Figure 2.4: AMCA Photoluminescence Intensity vs. Concentration
0
200
400
600
800
1000
1200
0 0.0000001 0.0000002 0.0000003 0.0000004 0.0000005 0.0000006 0.0000007 0.0000008 0.0000009
Concentration
Inte
ns
ity
28
Figure 2.5: O-Phthaldialdehyde (OPA) Photoluminesence Intensity vs. Concentration
0
50
100
150
200
250
300
0 0.00005 0.0001 0.00015 0.0002 0.00025 0.0003
Concentration (M)
Inte
nsi
ty
Initial experiments of AMCA and OPA on plasma modified surfaces
demonstrated that polystyrene could be successfully modified with water plasma and
amine plasma using the designed chamber. AMCA was successfully attached to water
plasma modified polystyrene and OPA was successfully attached to amine plasma
modified surfaces. Additional experiments also showed that OPA would not attach
directly to a water plasma modified polystyrene surface. AMCA however does attach to
ammonia modified films. This effect is most likely observed because the chamber is not
evacuated during the ammonia plasma process allowing atmospheric water vapor and
oxygen in the chamber to be ionized and in the process form some carboxylic acid
groups. Collectively, the results demonstrate that photoluminescent tagging is an
effective method of verifying the presence of specific functional groups in the plasma
process.
With AMCA and OPA, further characterization of the plasma chamber was
performed by modifying polystyrene surfaces over a series of exposure times. Figure 2.6
29
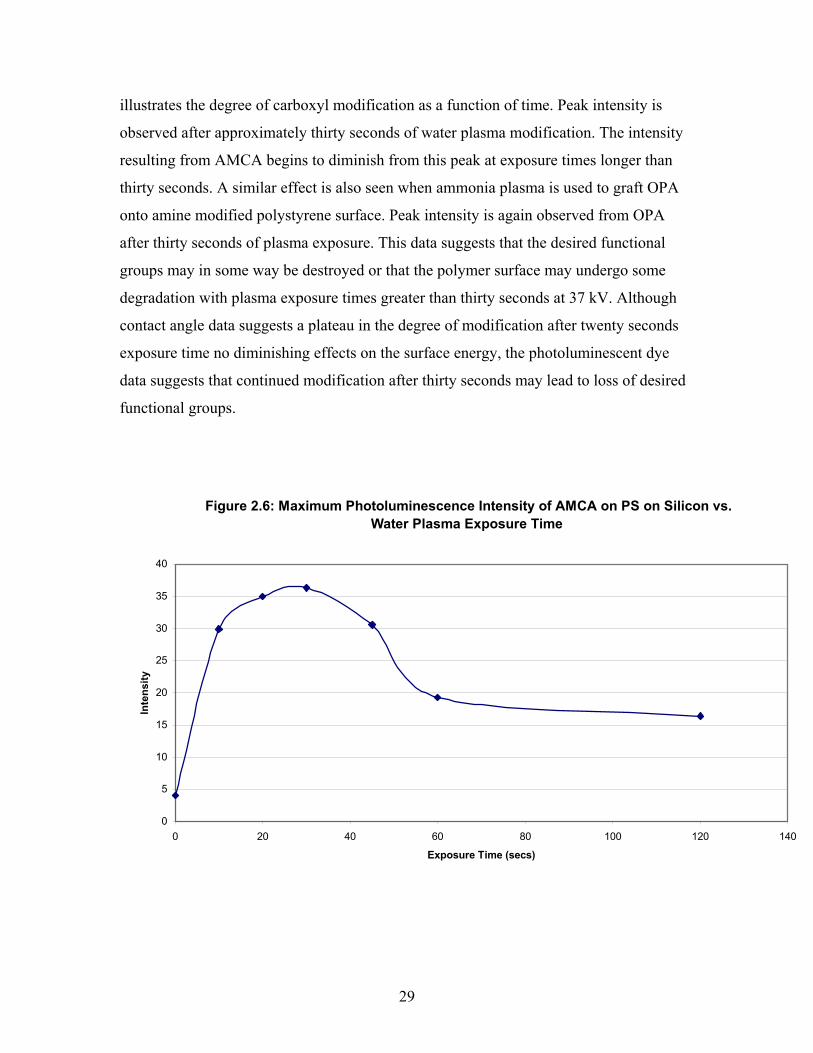
illustrates the degree of carboxyl modification as a function of time. Peak intensity is
observed after approximately thirty seconds of water plasma modification. The intensity
resulting from AMCA begins to diminish from this peak at exposure times longer than
thirty seconds. A similar effect is also seen when ammonia plasma is used to graft OPA
onto amine modified polystyrene surface. Peak intensity is again observed from OPA
after thirty seconds of plasma exposure. This data suggests that the desired functional
groups may in some way be destroyed or that the polymer surface may undergo some
degradation with plasma exposure times greater than thirty seconds at 37 kV. Although
contact angle data suggests a plateau in the degree of modification after twenty seconds
exposure time no diminishing effects on the surface energy, the photoluminescent dye
data suggests that continued modification after thirty seconds may lead to loss of desired
functional groups.
Figure 2.6: Maximum Photoluminescence Intensity of AMCA on PS on Silicon vs. Water Plasma Exposure Time
0
5
10
15
20
25
30
35
40
0 20 40 60 80 100 120 140
Exposure Time (secs)
Inte
nsi
ty

30
Figure 2.7: Maximum Photoluminescence Intensity of OPA at Varying Amine Plasma Exposure Times
0
5
10
15
20
25
30
0 20 40 60 80 100 120 140
Time (secs)
Inte
nsi
ty
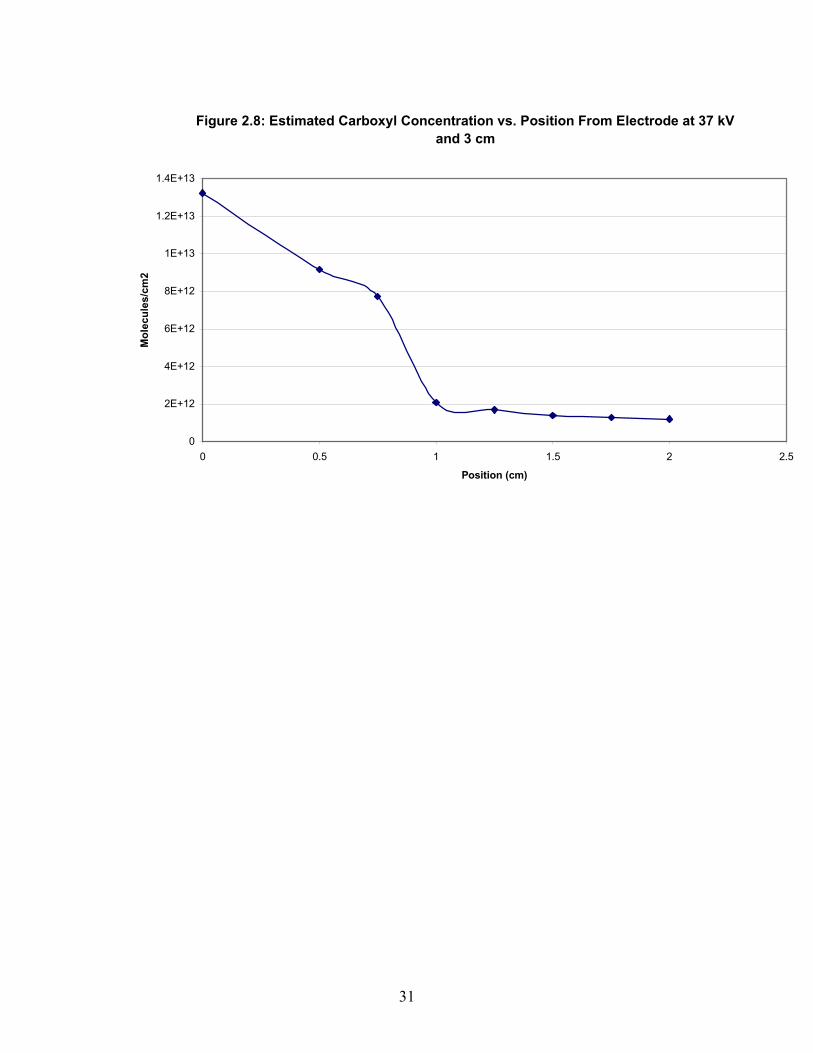
AMCA was also used to quantify the amount of carboxylic acid modification as a
function of position on the sample platform using chamber conditions of 37 kV, 30 mm
electrode height, and one minute water plasma exposure times. In Figure 2.8, the
intensity produced by AMCA begins to quickly diminish at small distances from the
electrode centerline on the sample platform. At positions of 7.5 mm or more away from
the centerline, the carboxyl concentration is estimated to be negligible. These results
show that ion current density of corona is at a maximum at the centerline as observed by
surface modification.
31
Figure 2.8: Estimated Carboxyl Concentration vs. Position From Electrode at 37 kV and 3 cm
0
2E+12
4E+12
6E+12
8E+12
1E+13
1.2E+13
1.4E+13
0 0.5 1 1.5 2 2.5
Position (cm)
Mo
lecu
les/
cm2
32
2.4 Conclusions Photoluminescent dyes validated surface modification using the ammonia and
water plasma processes. Although photoluminescence does not enable exact
quantification of concentrations of functional groups on surfaces to be determined,
estimates of functional surface coverage could be made using photoluminescence versus
solution concentration calibration curves for the dyes. A maximum degree of
modification with the carboxyl and amine functional groups appears after thirty seconds
of plasma exposure in both cases. This data suggests that a change in the nature of the
surface modification occurs between twenty seconds and thirty seconds of plasma
exposure that is not well represented by the contact angle data alone.

33
2.5 References
1. C. Parker. Photoluminescence of Solutions. Elsevier Publishing Co. New York. 1968. 2. D. Skoog. Principles of Instrumental Analysis. Holt, Rinehart, and Winston. New York. 1971 3. Yguerabide, J. Analytical Biochemistry. v. 228. p. 208. 1995. 4. Bryhan, M. Applied Spectroscopy. v. 47(10). p.1609. Oct. 1993. 5. Li X. Journal of Immunological Methods. v. 172 (2). p. 141. Jun. 1994. 6. G. Hermanson. Bioconjugate Techniques. Academic Press. New York. 1996. 7. M. Blostein. Journal of Biological Chemistry. v. 275(48). p. 38120. December 2000. (AMCA) 8. �Instructions for Immuno-Pure AMCA-Hydrazide,� Pierce-Endogen. 1996.

34
Chapter 3
Applications of Surface Modification
3.1 Introduction
The ability to chemically modify a surface by plasma treatment has important
implications in bioengineering applications. Its significance is derived from the ability of
deoxyribonucleic acid (DNA) and protein groups to be covalently bonded to surfaces
containing carboxylic acid, and amine functional groups, respectively. DNA is composed
of deoxyribose sugar, phosphate groups, and four base pairs known as adenine, cytosine,
guanine, and thymin. 1 However it is the presence of phosphate groups on DNA structures
which enable covalent bonding of the DNA onto carboxyl functionalized surfaces by way
of a conjugation reaction with carbodiimide coupling agents. Water soluble
ethylcarbodiimide hydrochloride is most commonly used as a coupling agent to assist in
these binding reactions. Zammatteo et al and others have shown covalent binding of
DNA to amine functionalized surfaces with this process.2 Surface attachment of DNA
provides a means for additional biochemical study to take place in a stabilized
environment. Zhang et al for example have demonstrated hybridization of a DNA single
strand to a synthetic complement attached to a thin film of polyethylene-co-acrylic acid
by partial penetration into the film. 3 They also show that fluorescence spectrometry may
be used to verify the presence of single-stranded DNA with an excitation of 265 nm
which absorbs maximally at this wavelength. The reduction of absorbance properties of
DNA with hybridization make fluorescence spectrometry a valuable tool in measuring
hybridization rates in DNA reactions. 4
Polystyrene is a commonly used substrate for these types of biochemical studies
because it is a durable and inexpensive polymer which lends itself well to surface
modification by a variety of processes.5 Surface modification processes on polystyrene
for these applications are tailored to amine and carboxyl functional groups because these
groups form the basis for the bonding of numerous biomaterials.6 Chemical and plasma
pretreatment of polymers are methods used to introduce carboxyl and hydroxyl groups

35
onto polystyrene. Gamma radiation, chemical pretreatment, and plasma treatment are
commonly used to introduce amine groups onto polystyrene. 7,8
The ability to cost-effectively produce amine and carboxyl functionalized surfaces
is also valuable in the surface attachment of proteins. Proteins are comprised of chains of
amino acids. They are like polymers in that they may be composed of as many as sixty or
more amino acid units. The presence of carboxyl functional groups make proteins highly
reactive with amine groups for surface binding.9 There is currently much interest in the
attachment of proteins onto amine terminated self-assembled alkanethiol chains for use in
DNA sequencing and biomolecular adsorption sensors.10,11
The ability to functionalize polymer thin films in a cost effective manner for
reactions of carboxylic acid and amine groups would clearly prove to be a valuable tool
for biochemical applications. However, the application of this process would not be
limited to bioengineering. The incorporation of semiconductors into thin polymer films is
widely used in the fabrication of electronic display devices. The implantation of zinc
sulfide in polymer films is a common tool for the production of color behind pixels in
electronic display units.
Zinc sulfide is a direct band gap semiconductor compound possessing unique
electronic and photoluminescence properties. As a semiconducting compound, zinc
sulfide contains an accessible energy band gap allowing electrons with sufficient energy
to escape the electron rich valence band and enter its antibonding conductance band.
It is the accessibility of valence electrons to crossing the energy band gap which
distinguishes semiconductors from insulating and conducting compounds. 12 Insulators
inhibit the flow of electrons through its media because the energy required for electrons
to cross the band gap is very large. Similarly, conductive materials like metallic solids
have no band gaps where electrons to appear in shared clouds around the atoms in the
molecular lattice.13 This narrow band gap in essence allows electrons to move freely
between the constituent atoms.
The presence of impurities in the compound and its semiconductor band gap give
zinc sulfide unique luminescence properties when combined with various doping agents.
Zinc sulfide has an energy band gap of 3.68 eV .14 When radiation of sufficient energy to
enable valence band electrons to overcome this band gap is imparted onto zinc sulfide,
36
the electrons absorb the energy and make the transition across the energy gap. The
excited nature of these transitioning electrons make them highly active and the electrons
fall back from the conductance band. As the electrons fall back from the conductance
band to the valence band, energy is given off in the form of blue light at a wavelength of
420 nm. The energy band gap for zinc sulfide however suggests that radiation should be
emitted at 337 nm. The emission at 420 nm results from defects in the material.
The introduction of impurities into the zinc sulfide lattice can greatly alter the
optoelectric properties of zinc sulfide. Copper and manganese ions are commonly used as
doping agents to change the electronic configurations of zinc sulfide and in turn change
the band gap. With the change in the energy band gap comes a new set of luminescent
properties for the compound. As the electrons fall back toward their valence band, the
dopant allows the electron to undergo the transition in a stepwise manner by falling back
to the impurity energy level first. The electrons then undergo a second transition in
falling from the dopant energy level to the valence band. Zinc sulfide doped with
manganese (Mn2+) impurities yields visible light at a wavelength of 585 nm and appears
yellow.15 Doping with copper however produces an entirely different electronic
configuration and zinc sulfide with this impurity produces visible light at a wavelength of
525 nm and appears green.16
These properties make zinc sulfide a widely used and critical compound
fabricating electroluminescent microelectronic devices. Zinc sulfide is most commonly
used in thin films synthesized by vapor deposition, chemical vapor deposition, or plasma
sputtering. Chemical vapor deposition uses gaseous precursors to form thin films of the
semiconductor on the desired substrate at very high temperatures. The deposition process
is a costly manufacturing method due to high temperature requirements and waste
disposal of unwanted desorbed products.17 The high vacuum process enables control of
deposition on the thickness of a single molecular layer and achieves these objectives with
virtually no contamination. The process is again very expensive because of the costs
associated with maintaining the high vacuum.
Zinc sulfide is most recognized for its application in thin film electroluminescent
displays. They are most commonly used in flat panel displays for computers and laptops.
At the heart of each display unit is zinc sulfide and other photoluminescing phosphors

37
encased in a thin polymer film. The films are typically deposited by plasma sputtering or
other high vacuum techniques. When zinc sulfide is used in this capacity, it is usually
doped with a manganese impurity to emit yellow light upon excitation. Combinations of
other phosphors and dopants are used to generate different colors of light such as red and
green. The polymer imbedded phosphors are then layered between two conducting
surfaces which provide a source of excitation to trigger the luminescence.
38
3.2.1 Experimental Procedure: Zinc Sulfide Synthesis in Polystyrene Using the experimental methods previously documented in the first two chapters,
polystyrene films were spun cast onto clean silicon surfaces using an 18% solution by
weight of the polymer in 1-methyl-2-pyrrolidinone (NMP). Surfaces were baked for a
period of three hours at 120oC to remove unwanted NMP solvent. Films were surface
modified with the water plasma process at a distance of 30 mm below the discharge
sources at 37 kV. Modified films were then immersed in a 20% solution by weight of
zinc acetate in deionized water for a period of four hours to allow zinc to react onto the
carboxyl modified surface. Films were removed from the solution, rinsed in deionized
water and blown dry with pressurized air. Zinc was imbedded into the polystyrene film
by an annealing process in which the films were baked in a vacuum oven for three hours
at 120oC under a nitrogen blanket. This annealing process enabled the zinc to settle into
the interior of the polymer film creating a hydrophobic surface. Film surfaces were tested
for wettability to verify that the annealing process was successful.
After annealing, films were placed in a pressure vessel and hydrogen sulfide gas
was pumped over the zinc imbedded films to a pressure of 6 psi. This pressure was
maintained for a period of 10 minutes. Films were removed from the pressure vessel and
pressurized air was blown across each surface in a fume hood to remove any residual
hydrogen sulfide.
Photoluminescence analysis was performed on the films to verify the presence of
zinc sulfide. An excitation wavelength of 332 nm was used in photoluminescence
analysis at a scanning rate of 240 nm/min with emission and excitation slits width
settings of 5 nm.
Additional studies were performed to determine the optimal water plasma
exposure time and as well as the optimal immersion time for modified polystyrene slides
in the zinc acetate solution. A series of polystyrene films were modified with water
plasma at varying exposure times at 37 kV and 30 mm discharge height. The series of six
films were treated with water plasma at times of 10, 30, 45, 60, 90, and 120 seconds. The
films were then annealed and the zinc acetate was reacted with hydrogen sulfide gas at 6
psi for 10 minutes. Photoluminescence spectra were taken of each sample at an excitation
39
wavelength of 332 nm. A second study was performed in which five films were modified
at the same voltage and height conditions for one minute with water plasma. The films
were then placed in the 20% zinc acetate solution for immersion times of 20 minutes, one
hour, two hours, four hours, and ten hours. Films were removed and annealed at 120oC.
Zinc acetate imbedded in the film surfaces was then reacted with hydrogen sulfide gas to
produce zinc sulfide particles. Fluorescence spectroscopy was again performed on the
films with an excitation wavelength of 332 nm.
Atomic force microscopy (AFM) was performed on film samples containing zinc
sulfide to develop an image of the particles.
40
3.2.2: Experimental Procedure: DNA Binding to Polystyrene
Silicon surfaces were cleaned by immersion in xylene for a period of six hours.
Polystyrene films were then spun cast onto the cleaned silicon substrates from a 1%
solution of polystyrene in toluene. Films were baked for 10 minutes at 120oC under a
nitrogen blanket to prevent contamination.
Carbodiimide buffer solution was premixed by adding 0.767g of (1-[3-
(Dimethylamino) propyl]-3-ethylcarbodiimide hydrochloride (EDC) to 2 mL of deionized
water. This solution served as a conjugation agent for reacting amine groups from the
DNA to the carboxyl functional groups produced during surface modification.18 The
mixture was shaken to dissolve the EDC. DNA was prepared for surface attachment by
mixing 2.2 µl of 27 base pair DNA synthesized by Ransom-Hill Biosciences, Inc. with
200 µL of deionized water. Washing solution consisted of 0.1 N NaOH and 0.25% SDS
(dodecyl sulfate sodium salt) in deionized water. This solution was used to wash residual
unbinded DNA and buffer solution from the surface before further instrumental analysis
was performed.
Surface modification of the polystyrene films was achieved by plasma treatment
with water vapor carrier gas. A 37 kV discharge voltage was used at one minute exposure
times 3 cm above each polymer surface. 50 µL of carbodiimide buffer solution was then
applied to the wetting area on each substrate. 10 µL of DNA solution was then pipetted
onto the buffer solution on the modified polystyrene surface.
After DNA application, the surfaces with buffered DNA were placed atop a glass
slide stationed above a warm water bath for 5 hours at 50oC. After this incubation period,
surfaces were rinsed three times in beakers of washing solution that were preheated to
50oC. Surfaces were blown dry with an airgun after the third washing in preparation for
fluorescence spectrometry and XPS analysis.
Absorption analysis was performed using a Hitachi F-4500 Fluorescence
Spectrometer. Ultra-violet excitation energy was used at a wavelength of 265 nm.
Photoluminescence analysis was performed on plasma treated polystyrene surfaces and
on DNA binded surfaces. XPS analysis was also performed to probe for the presence of
phosphorus on the treated surfaces.
41
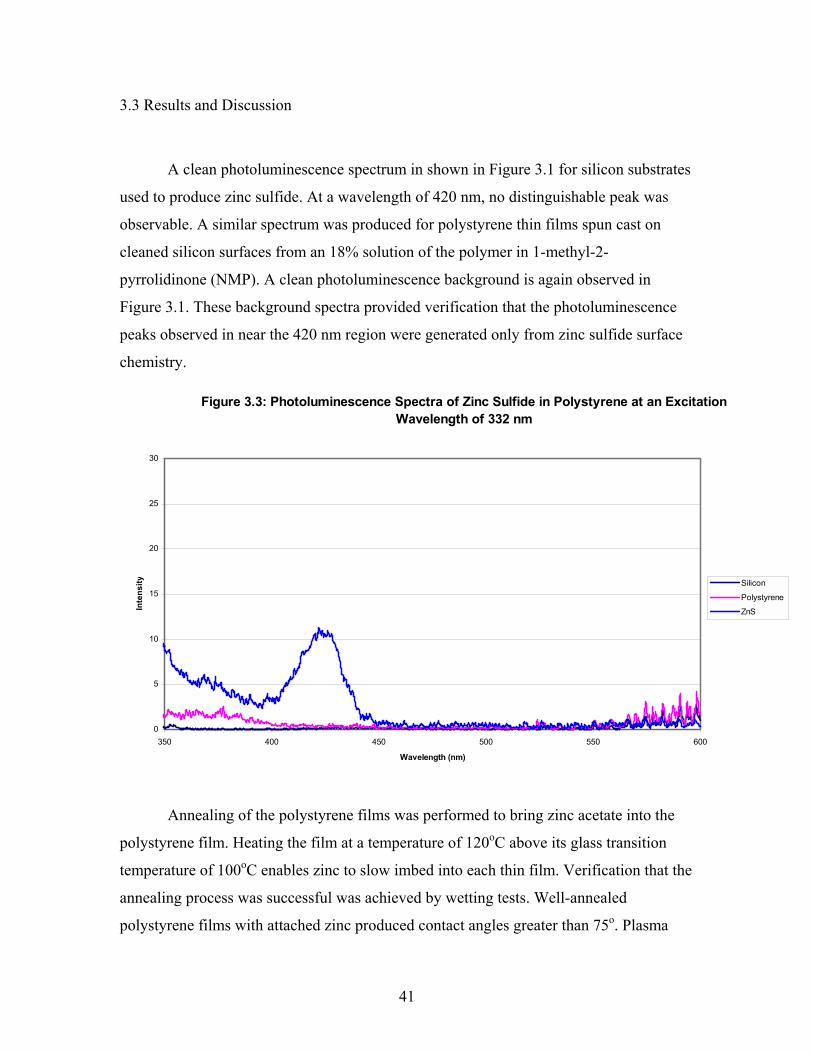
3.3 Results and Discussion
A clean photoluminescence spectrum in shown in Figure 3.1 for silicon substrates
used to produce zinc sulfide. At a wavelength of 420 nm, no distinguishable peak was
observable. A similar spectrum was produced for polystyrene thin films spun cast on
cleaned silicon surfaces from an 18% solution of the polymer in 1-methyl-2-
pyrrolidinone (NMP). A clean photoluminescence background is again observed in
Figure 3.1. These background spectra provided verification that the photoluminescence
peaks observed in near the 420 nm region were generated only from zinc sulfide surface
chemistry.
Figure 3.3: Photoluminescence Spectra of Zinc Sulfide in Polystyrene at an Excitation Wavelength of 332 nm
0
5
10
15
20
25
30
350 400 450 500 550 600
Wavelength (nm)
Inte
ns
ity
Silicon
Polystyrene
ZnS
Annealing of the polystyrene films was performed to bring zinc acetate into the
polystyrene film. Heating the film at a temperature of 120oC above its glass transition
temperature of 100oC enables zinc to slow imbed into each thin film. Verification that the
annealing process was successful was achieved by wetting tests. Well-annealed
polystyrene films with attached zinc produced contact angles greater than 75o. Plasma

42
modified surfaces containing chemically attached zinc would remain wetting almost
indefinitely (at least four months) without the annealing process. This result suggests that
a surfactant could be used to produce stable wetting polymer surfaces for an extended
period of time after plasma treatment.
Figure 3.2: A 1 x 1 µm AFM image of zinc sulfide on polystyrene
After the hydrogen sulfide reaction, the presence of zinc sulfide was demonstrated
by fluorescence spectrometry. The photoluminescence peak at 420 nm in Figure 3.1
confirms the formation of zinc sulfide in the polystyrene thin film. An AFM image was
used to estimate particle sizes formed in the polymer ranging from 50 nm to 350 nm as
seen in Figure 3.2.19
Zinc sulfide reactions were also used as a tool to understand water plasma
modification effects on polystyrene. Figure 3.3 illustrates that the water plasma exposure
time before immersion in the zinc acetate bath clearly improves zinc sulfide yield without
the detrimental effects suggested by data from the photoluminescent tagging study in
Chapter 2. This result is more consistent with the contact angle data which shows no
increase in wetting angle with increased exposure times above twenty seconds. Contact

43
angle data does however suggest that the largest degree of surface modification occurs
after this initial twenty second period with almost insignificant improvements in surface
energy occurring after this exposure time. Data in Figure 3.3 shows a strong correlation
between plasma exposure time and zinc sulfide formation with the greatest yield
produced after two minutes of plasma exposure. Zinc acetate may also be reactive with
other functional groups generated during the plasma process. These groups may
contribute to increases in the surface energy of the polymer film but may not be reactive
with AMCA.
Figure 3.3: Zinc Sulfide Photoluminescence Intensity at 420 nm as a Function of Water Plasma Exposure Time Study
0
5
10
15
20
25
30
35
0 20 40 60 80 100 120
Time (s)
PL
In
ten
sity
Evidence of successful DNA grafting onto surface modified polystyrene is
observed in both photoluminescence and XPS data. A reduction in photoluminescence
intensity of polystyrene is observed in Figure 3.4. The film of polystyrene from the 1%
toluene solution produces a photoluminescence intensity peak at 333 nm of 76 (arbitrary
units). After DNA grafting occurred, the photoluminescence intensity dropped by about
26% from a maximum intensity of 76 to 56. This result may be attributable to strong
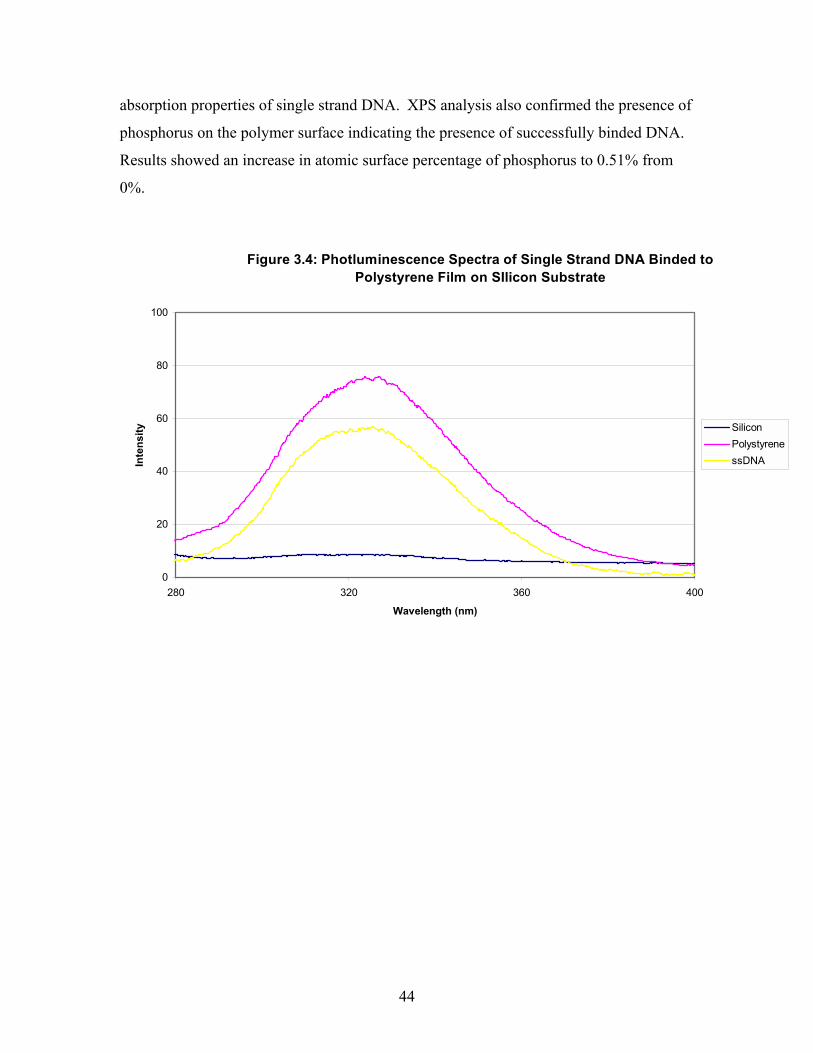
44
absorption properties of single strand DNA. XPS analysis also confirmed the presence of
phosphorus on the polymer surface indicating the presence of successfully binded DNA.
Results showed an increase in atomic surface percentage of phosphorus to 0.51% from
0%.
Figure 3.4: Photluminescence Spectra of Single Strand DNA Binded to Polystyrene Film on SIlicon Substrate
0
20
40
60
80
100
280 320 360 400
Wavelength (nm)
Inte
nsi
ty Silicon
Polystyrene
ssDNA
45
3.4 Conclusions
Surface modification of polystyrene thin films with atmospheric pressure water
plasma provides a means to generate zinc sulfide particles. The presence of zinc sulfide
can be confirmed with fluorescence spectrometry. Increasing the water plasma exposure
time of polystyrene films clearly improves zinc sulfide yield after the hydrogen sulfide
reaction. Zinc sulfide agglomerations formed in this process have a size of
approximately 40 nm. Surfactants may be used on plasma modified polymer films to
produce long lasting wetting surfaces. Atmospheric pressure water plasma was also
utilized to successfully attach single strand DNA to polystyrene surfaces.

46
3.5 References 1. Ts�O, P. Basic Principles in Nucleic Acid Chemistry. Academic Press. 1974. 2. Zammatteo, N. Analytical Biochemistry. v. 236. p.85. 3. Zhang, P. Macromolecules. v. 32(7). p. 2149. Apr. 1999. 4. Towery, R. Biosensors and Bioelectronics. v.16. p.1. 2001. 5. R. Wells. Journal of Adhesion Science. v. 7. p. 1129. 1993. 6. Matson, R. Analytical Biochemistry. v. 217. p. 206. 1994. 7. Inaki, Y. Functional Monomers and Polymers, Procedures, Synthesis, Applications. Dekker. New York. 1987. 8. Liston, E. Journal of Adhesion Science and Technology. v. 7. p.1091. 1993. 9. Hecht, S. Bioorganic Chemistry: Peptides and Proteins. Oxford Press. 1998. 10. Smith, E. Langmuir. v. 17. p. 2502. April 2001.proteins/DNA on gold surfaces 11. D. Bain. Science. v. 240. 1999. 12. S. V. Gaponenko. Optical Properties of Semiconductor Nanocrystals. Cambridge University Press. 1998. 13. Glanville, J. Chemistry For Engineers. Prentice-Hall. 2000. 14. Lindroos, S. Materials Research Bulletin. v. 32(12): p. 1631. Dec. 1997. 15. Arora, A. Journal of Physics D-Applied Physics. v. 24(8): p.1462. Aug. 1991 16. Khosravi, A. Applied Physics Letters. v. 67(18). p. 2702-04. Oct. 1995.
17. Breen M. Langmuir. v. 17(3). p. 903. February 2001. 18. Rasmussen, S. Analytical Biochemistry. v.198. p.138. 1991. 19. AFM images taken by Sanjun Niu from images from samples produced by Jeff Ward.

47
Path Forward
The characterization of the plasma chamber detailed in this thesis provides a basis
for a number of interesting applications to explore in future research endeavors. It has
been shown that differences in wettability across a polymer surface can be imparted by
careful regulation of height, exposure time, and voltage parameters. Using these controls
a fluid could be made to flow across a surface driven by these differences in surface
energy. This idea was initiated during AMCA ion modeling studies in which water was
observed to problematically flow across adjacent silicon pieces with polystyrene films.
These surface energy differences were caused by the location of the silicon pieces at
different positions perpendicular to the discharge electrode on the sample platform. The
surface modification is transient however and further investigation into the use of
surfactants to stabilize these surface energy changes should be performed to make this
idea feasible for practical applications.
Polybutadiene experiments proved that different polymers require differing
degrees of polymer modification to achieve wettability. This observation could be
utilized in conjunction with self-assembling block copolymers to achieve selective
surface modification. This modification process could allow structures to be chemically
created from specific sites on the copolymer surface using the newly attached functional
groups.
Further investigation should also be made into impurity doping of the zinc sulfide
generated from the plasma process in Chapter 3. The incorporation of manganese or
copper into the semiconductor lattice would create much more usable groups of
compounds with a wide-range of photoluminescing applications.