pnnl-19086: replacement of radiography with ultrasonics ... · (npp) weld inspection applications....
TRANSCRIPT

PNNL-19086
Prepared for the U.S. Nuclear Regulatory Commission under a Related Services Agreement with the U.S. Department of Energy Contract DE-AC05-76RL01830
Replacement of Radiography with Ultrasonics for the Nondestructive Inspection of Welds – Evaluation of Technical Gaps – An Interim Report TL Moran P Ramuhalli AF Pardini MT Anderson SR Doctor April 2010

DI SC LAIM ER
This report was prepared as an account of work sponsored by an agency of the United States Government. Neither the United States Government nor any agency thereof. nor !Janelle Memorial Institute, nor any of their employees, makes any warranty, express or implied, or assum es any Icgalliability or responsibility ror the accuracy, completen ess, or useruln ess or any inrorma tion , apparatus, product, or process disclosed, or represents that its use would not inrringe pri\'ately owned rights. Reference herein to any specific commercial product, process, or service by trade name, trademark, manufacturer, or otherwise does not necessarily constitute or imply its endorsement, recommendation, or [woring by the United States Govcrnment or any agcncy thereof, or Battelle Memorial Institute. The views and opinions of authors expressed herein do not necessarily state or reflect those of the United States Government or any agency thereof
PAC IFIC NORTH WEST NATIONAL LABORATORY operated by BATfELLE
for the UN ITED STATES DEPARTMENT OF ENERGY
under COl1lract DE-ACO>76RLOI830
@ This document was printed on recycled paper.
(912003)

PNNL-19086
Replacement of Radiography with Ultrasonics for the Nondestructive Inspection of Welds – Evaluation of Technical Gaps – An Interim Report TL Moran P Ramuhalli AF Pardini MT Anderson SR Doctor April 2010 Prepared for U.S. Nuclear Regulatory Commission under a Related Services Agreement with the U.S. Department of Energy Contract DE-AC05-76RL01830 Pacific Northwest National Laboratory Richland, Washington 99352


iii
Summary
Radiographic techniques for industrial inspection have been in use for over 100 years. A key factor in their durability has been the ease and effectiveness of the inspection procedure, including the availability of optical-quality images that facilitate interpretation. Due to concerns such as the radiation hazard posed by radiographic imaging systems, the U.S. nuclear power plant industry has expressed interest in replacement methods for radiographic testing (RT). Ultrasonic testing (UT) has been proposed as a potential replacement method. While RT and UT are both volumetric nondestructive evaluation (NDE) methods, the physics of these processes are substantially different. Radiography relies on transmission and absorption/attenuation of small wavelength electromagnetic energy (x-rays and gamma rays). Ultrasonics, on the other hand, relies on the interaction of acoustic wave energy with flaws in the inspected material. Differences in density or acoustic impedance result in reflection or scattering of the wave, which is recorded as evidence of a discontinuity in the material. The Pacific Northwest National Laboratory (PNNL) performed a literature search and analysis for the U.S. Nuclear Regulatory Commission (NRC) to:
• Compare the flaw detection capabilities of the replacement method (UT) to the reference method (radiography)
• Assess the false call rate of the replacement method to that of the reference method
• Determine if procedures (for inspecting the parts, and qualification of the system, process, and operator) for the replacement method exist.
A second issue is the recent emergence of digital imaging media for radiographic testing. Digital radiographic testing (DRT) is a technique where digitized radiographic images are obtained using alternative imaging media such as storage phosphor plates and direct digital arrays (DDA). Any attempt at replacing radiography needs to address the reliability of DRT systems, because it appears likely that these systems will become the industry standard in the near future. A related issue is to determine if there is a need for RT (and particularly DRT) procedure and personnel qualification for nuclear power plant (NPP) weld inspection applications.
This initial report is a preliminary study on these issues, and is a first step towards:
• Determining whether using ultrasonic testing (UT) in lieu of RT for new construction is feasible
• Determining whether performance-based criteria are needed for RT
• Verifying the effectiveness and reliability of UT and RT for construction, pre-service, and in-service inspections.
The NRC also tasked PNNL with evaluating the relevant literature to identify technical gaps related to:
• The reliability of digital radiographic testing (DRT)
• Replacing radiography with ultrasonic inspection for construction/fabrication weld inspection
• Investigating performance demonstration for radiography.

iv
Literature surveys found over 600 journal and conference papers and technical reports, and over 100 documents related to the main objectives listed above. The evaluation of the documents focused on comparing the techniques applied with the 2007 Edition of the ASME Code with 2008 Addenda and Code Cases, detection reliability for UT and RT, length and depth sizing reliability, and round-robin studies that directly compared UT and RT. The resulting analysis identified the following technical gaps:
RT Replacement with UT:
• Expected Flaw Types: Studies have not been conducted to determine the likely types, locations, sizes, and number of flaws that are expected in fabrication/construction welds in typical NPP components for new construction. This information will drive the choice of an inspection method and likely play a key role in determining whether RT replacement with UT is feasible.
• Acceptance Criteria: Equivalence (interchangeability) of UT and RT will depend on acceptance criteria. Studies have not been conducted to establish this equivalence and identify appropriate criteria for UT fabrication inspection of geometries typically found in operating U.S. NPPs. It should be noted that such a study has not been conducted for the newer proposed designs as the designs have not yet been finalized.
• Technical Advances in UT: The equivalence (or superiority) of UT is also dependent on the type of UT technique and equipment. Recent Code Cases specify the use of automated equipment to record the raw UT data; the specifications for such systems have not yet been determined for NPP use. Comparisons using recent advances in automated UT would be helpful in determining the extent of replacement that is feasible.
• UT Flaw Discrimination Capability: Currently, the ability to discriminate (and interpret) between different fabrication flaws (i.e., determine whether the flaw is planar or volumetric and its location and size) from UT measurements is limited, particularly in the presence of high levels of acoustic noise. Techniques for accurate classification of indications detected by UT are necessary for improving the reliability of UT and potential expansion of UT to fabrication/construction inspections.
• ASME Code: After review of the current standards for UT and RT, there are clearly gaps in the Codes where guidance is needed on acceptance of using UT in lieu of RT for nuclear applications. The technical basis for some of the Code Cases is also not clear.
• Performance Demonstration for Fabrication/Production Inspection: One of the ASME Code Cases addresses the use of UT in lieu of RT for new construction while a similar Code Case addresses the use of UT for modifications in currently operating reactors. Inspection volumes and flaw types are potentially very different between pre-service and in-service inspection. Appropriate performance demonstration requirements for construction/fabrication inspection using UT have yet to be determined.
Reliability of DRT:
• Applicability to NPP Welds: The equivalence of DRT and film RT for NPP geometries is not clear, and studies establishing this equivalence in typical NPP weld geometries have not been performed.
• Reliability: Studies performed to date have not characterized DRT performance (probability of detection (POD) and length sizing reliability) on a statistically large and representative set of
v
flaws/samples. The impact of the DRT inspection variables (such as dose, exposure time, etc.) on POD has not been documented.
• Code Acceptance: After review of the current standards for DRT, there are clearly gaps in the Codes where guidance is needed for both computed and digital radiography for nuclear applications.
Performance Demonstration for RT:
• Operator Influence on Reliability: RT system performance depends heavily on the individual operator. Variations in experimental procedures and/or experience/motivation, etc., appear to have a strong influence on detection rates. There have been very few human factors studies in this regard, and thus this effect cannot be quantified.
• Impact of DRT: It is difficult to determine whether use of a digital RT system will make any difference in operator interpretability (i.e., if the operator is very experienced with film RT, then does this experience carry over to digital RT?). In theory, experience with film should be portable to DRT, because the inspection physics are the same. In practice, the availability of enhancement tools in DRT, and resolution and SNR differences, may impact interpretation reliability. So far, studies have focused on showing (visually) that film and DRT give identical results (or that DRT gives superior results). There does not seem to be a systematic, unbiased study on the effect of DRT on operator performance, as well as statistically based POD estimates for DRT.
• Training: The hypothesis is that appropriate training incorporating elements of performance demonstration should improve reliability. Accordingly, an appropriate training regimen for DRT operators would need to be determined.
The evaluation documented in this report, and the technical gap analysis summarized above, enabled the following conclusions:
• The inspection parameters and the POD for DRT inspection of NPP welds need to be determined.
• UT replacement of RT is feasible; however, the techniques for UT have to be specified or a performance standard needs to be defined. Potential parameters may include: UT technique (automated UT, or computer-assisted UT), probe (pulse-echo vs. phased-array vs. pitch-catch), angle of inspection (normal, angle beam), scan direction (perpendicular to weld and parallel to weld, to catch both axial and circumferential flaws), etc.
• UT acceptance criteria for fabrication/construction weld inspection must be defined based on fitness for service and not workmanship standards. Using acceptance criteria based on RT criteria is not good practice, because the physics of the two processes are very different.
• Some form of training (at a minimum) is necessary to ensure DRT reliability.
The gap analysis identified the following issues which could not be assessed based on the information identified from the literature search:
• Detection reliability of DRT in nuclear power plant inspection.
• Optimization of DRT inspection setup for typical NPP component geometries.
• Quantify typical and best-case detection sensitivity and POD of DRT systems. Understand how the different inspection variables impact the sensitivity.

vi
• Establish the role of human factors and determine the level of training necessary for DRT operators. Quantify the effect of operator reliability in detection reliability.
• The conditions for equivalence of DRT and film RT in typical fitness-for-purpose geometries need to be defined.
• The literature search and assessment identified gaps in the Codes where guidance is needed for computed and digital radiography for nuclear applications. This information could be used to develop the needed Code guidance for DRT.
• One way to fill in many of the gaps would be the performance of a mini-round robin for typical NPP geometries with known flaws, using automated UT, film RT, and DRT. The operational parameters could be controlled with specific procedures for inspection, data recording, and interpretation. The data and results could then be applied to:
– Compare UT system performance for Appendix VIII qualified personnel, equipment, and procedures.
– Compare POD, rejection rates, and sizing accuracy of UT, film RT, and DRT systems.
– Propose appropriate UT acceptance criteria for fabrication/construction inspection. This information can potentially contribute to future ASME Code revisions.
– Investigate techniques for interpreting UT inspection data and assess the capability to determine the type of flaw from UT measurements.
• To address the effect of human factors in RT and DRT, pilot studies could be conducted to better understand the role of human factors and to determine the level of training necessary for DRT operators. These studies would assist in determining whether performance demonstration requirements are needed for RT (and in particular for DRT).

vii
Acronyms and Abbreviations
ASME American Society of Mechanical Engineers ASTM American Society of Testing and Materials AUT automated ultrasonic testing BPVC Boiler and Pressure Vessel Code CAUT computer assisted ultrasonic testing CC Code Case CCSS centrifugally cast stainless steel CFR Code of Federal Regulations CNR contrast-to-noise ratio CR computed radiography CT computed tomography DDA direct digital array DQE detector quantum efficiency DRT digital radiographic testing EDM electrical discharge machining EN European Standard HD high definition IGSCC intergranular stress corrosion cracking IIW International Institute of Welding IQI image quality indicators ISI in-service inspection LOF lack of fusion LP lack of penetration LSR limiting spatial resolution MMA manual metal arc MRR Mini Round Robin MTF Modulation Transfer Function MUT manual ultrasonic testing NDE nondestructive evaluation NPP nuclear power plant nSNR normalized signal-to-noise ratio PA phased array (ultrasonic testing) PDI Performance Demonstration Initiative PE pulse-echo (mode of ultrasonic inspection) PFC probability of false calls PIRR Piping Inspection Round Robin
viii
PISC Programme for the Inspection of Steel Components PM projection magnification POD probability of detection POR probability of rejection PSI pre-service inspection RG Regulatory Guide ROC receiver operating characteristic RRT round-robin test RT radiographic testing SAFT synthetic aperture focusing technique SNR signal-to-noise ratio SMAW submerged arc welding SRb basic spatial resolution TOFD time-of-flight diffraction TOFT time-of-flight technique TW through-wall UT ultrasonic testing VVER Vodo-Vodyannoy Energeticheskiy Reactor (Russian designation for light-water
pressurized reactors)
ix
Contents
Summary ...................................................................................................................................................... iii Acronyms and Abbreviations ..................................................................................................................... vii 1.0 Introduction ....................................................................................................................................... 1.1
1.1 Organization of Report .............................................................................................................. 1.2
2.0 Background ........................................................................................................................................ 2.1
2.1 Report Objectives ...................................................................................................................... 2.1
2.1.1 Replacement of RT with UT .......................................................................................... 2.1
2.1.2 Equivalence of Film RT and Digital Radiographic Testing ........................................... 2.2
2.1.3 Performance Demonstration for DRT ............................................................................ 2.3
2.2 Literature Survey ....................................................................................................................... 2.3
2.3 Weld Inspection Methods .......................................................................................................... 2.4
2.3.1 Ultrasonics for Weld Inspection ..................................................................................... 2.4
2.3.2 Common Ultrasonic Techniques .................................................................................... 2.5
2.3.3 Radiography for Weld Inspection .................................................................................. 2.7
2.4 Reliability of Weld Inspection Methods ................................................................................... 2.9
2.4.1 Reliability of UT ............................................................................................................ 2.9
2.4.2 Reliability of Film-Based RT ....................................................................................... 2.15
2.5 An Overview of Weld Inspection Codes ................................................................................. 2.17
2.6 Performance Demonstration .................................................................................................... 2.18
3.0 A Comparison of Film and Digital Radiography for Weld Inspection .............................................. 3.1
3.1 Digital Detectors ....................................................................................................................... 3.1
3.2 Inspection Procedures ............................................................................................................... 3.3
3.3 A Comparison of Film and DRT ............................................................................................... 3.4
3.3.1 Reliability of DRT .......................................................................................................... 3.4
3.3.2 Status of Standards and Regulatory Guides for DRT in 2009 ...................................... 3.10
3.4 Performance-based Criteria for Film and Digital Radiography .............................................. 3.10
4.0 Replacement of RT with UT – A Literature Survey .......................................................................... 4.1
4.1 Replacement of RT with UT – Current Status of Round-Robin Studies .................................. 4.1
4.2 ASME Code Acceptance of Replacement ................................................................................. 4.7
4.3 Discussion ................................................................................................................................. 4.8
5.0 Summary and Gap Analysis .............................................................................................................. 5.1
5.1 Equivalence of Film and DRT .................................................................................................. 5.1
5.1.1 Inspection Setup ............................................................................................................. 5.1
5.1.2 Detection Sensitivity ...................................................................................................... 5.1
5.1.3 Cost ................................................................................................................................ 5.2

x
5.2 Replacement of RT with UT for Production/Fabrication Inspection ........................................ 5.2
5.2.1 Reliability ....................................................................................................................... 5.2
5.2.2 Inspectability Issues ....................................................................................................... 5.3
5.2.3 Human Factors ............................................................................................................... 5.3
5.2.4 Record Keeping .............................................................................................................. 5.3
5.2.5 Health and Radiation ...................................................................................................... 5.4
5.2.6 Cost ................................................................................................................................ 5.4
5.3 Performance Demonstration for RT .......................................................................................... 5.4
5.4 Technical Gaps .......................................................................................................................... 5.5
5.4.1 Replacement of RT with UT for Production/Fabrication Weld Inspection .................... 5.5
5.4.2 Replacement of Film RT with DRT ............................................................................... 5.6
5.4.3 Performance-Based Criteria for DRT ............................................................................. 5.6
6.0 Conclusions and Recommendations .................................................................................................. 6.1
7.0 References ......................................................................................................................................... 7.1
Appendix A – Glossary of Key Radiographic Quantities ......................................................................... A.1

xi
Figures
2.1 Digital Radiograph of Particles with Different Coating Layers in Thin-Wall Tubes Illustrate the Use of Digital Radiography and the “Optical” Quality of the Image......................................... 2.2
2.2 Typical UT Techniques .................................................................................................................... 2.5
2.3 Diagram of TOFD Technique .......................................................................................................... 2.6
2.4 Example of an AUT Fixed Array Scanner for Pipe Girth Welds ..................................................... 2.7
2.5 Diagram of Phased Array Beam Formation and Image Display ...................................................... 2.7
2.6 Schematic of an X-ray System ......................................................................................................... 2.8
2.7 Schematic of a CT Inspection System ............................................................................................. 2.9
2.8 BERTA Detectability Results and IGSCC Detectability Results with RT. ................................... 2.18
3.1 Principle of Computed Radiography ................................................................................................ 3.2
3.2 Direct and Indirect Conversion of Radiation ................................................................................... 3.3
3.3 Multigain Calibration Technique in DDAs ...................................................................................... 3.8
3.4 Effect of High-Pass Filtering for DRT Image Enhancement ........................................................... 3.8
3.5 Radiographic Set Up ........................................................................................................................ 3.9
3.6 Theoretical POD for Different Thresholds ...................................................................................... 3.9
4.1 Acceptance Curves for Planar and Volumetric Flaws ..................................................................... 4.6
4.2. Acceptance Curves for Planar Flaws Based on two Different Acceptance Criteria ........................ 4.6
Tables
2.1 Summary of Cited Research Studies Quantifying UT Detection and Sizing Reliability ............... 2.10
2.2 Summary of Citations Relevant to Crack Detection Sensitivity .................................................... 2.16
3.1 Advantages and Disadvantages of Film, CR, and Digital Detectors ............................................... 3.5
3.2 Issues Impacting DRT Detection Reliability ................................................................................... 3.6
4.1 Examples of Parameters that can Influence POD ............................................................................ 4.2
4.2 Summary of UT and RT Round-Robin Studies ............................................................................... 4.3

xii

1.1
1.0 Introduction
Radiographic techniques for industrial inspection have been in use for over 100 years. A key factor in their durability has been the ease and effectiveness of the inspection procedure, including the availability of optical-quality images that facilitate interpretation. Due to concerns such as the radiation hazard posed by radiographic imaging systems, the high cost of radiography as compared to ultrasonics, and the possibility of radioactive sources ending up in landfills (or in the wrong hands), the U.S. nuclear power plant industry has expressed interest in replacement methods for radiographic testing (RT). The replacement of RT, currently required for the fabrication acceptance inspection of nuclear power plant components, has several potential advantages, including:
• The lack of radiation hazards eliminates the need to close the area where the inspections are being performed. This can potentially result in higher productivity and lower costs
• Reduction (or elimination) in consumables used in radiographic inspection, again potentially lowering costs
• Potential for improved detection of planar flaws such as cracks, resulting in increased safety of operating components
• As low as reasonably achievable (ALARA) radiation concerns.
However, the replacement of an accepted volumetric inspection practice with another can be very challenging. Before such replacement is implemented, additional data/information is needed (Forli 1995) to:
• Compare the flaw detection capabilities of the replacement method (UT) to the reference method (radiography)
• Assess the false call rate of the replacement method to that of the reference method
• Determine if procedures (for inspecting the parts, and qualification of the system, process, and operator) for the replacement method exist.
This initial report is a preliminary study on these issues, and is a first step towards:
• Determining whether using ultrasonic testing (UT) in lieu of RT for new construction is feasible
• Determining whether performance-based criteria are needed for RT
• Verifying the effectiveness and reliability of UT and RT for construction, pre-service, and in-service inspections.
The goal of this initial report is to compile and evaluate relevant literature that will help identify technical gaps related to:
• The reliability of digital radiographic testing (DRT)
• Replacing radiography with ultrasonic inspection for construction/fabrication weld inspection
• Investigating performance demonstration for radiography.

1.2
1.1 Organization of Report
The remainder of this report is organized as follows:
Section 2 presents the problem statement, and the approach adopted to address the goals of this report. A brief overview of UT and RT methods for weld inspection, as well as current (2009) ASME Code requirements for UT and RT weld inspection, is presented.
Section 3 compares the state-of-the art (2009) in DRT with film-based RT.
Section 4 contains a comparison of the detection and sizing capabilities of UT and (film) RT based on available literature. The ASME Code is reviewed for Code-acceptance of UT replacement of RT.
Section 5 evaluates the relevant literature and identifies technical gaps that need to be addressed prior to replacement of RT with UT. Gaps related to performance-based criteria for RT are also identified. These gaps form the basis for recommendations for future work in this area.
Section 6 summarizes the results and recommendations for further study.
Appendix A contains a glossary of common RT terms that are used throughout this report.
2.1
2.0 Background
Ultrasonic testing (UT) and radiography are the primary volumetric methods employed to inspect welds. The goal of weld inspection is to detect construction/fabrication flaws, or service degradation, that may impact the structural integrity of the welded component. Common weld fabrication flaws include cracks, lack of fusion, incomplete penetration, and volumetric inclusions such as slag and porosity. Thermal or mechanical fatigue and stress corrosion cracking are typical of service-related degradation. In general, volumetric inclusions are considered benign as long as they are embedded below a critical size, while planar flaws (cracks and lack of fusion) are considered structurally important flaws that are generally not acceptable. However, the criteria for acceptability of planar and volumetric flaws are determined by relevant codes, which tend to differ based on the application and governing code organization.
2.1 Report Objectives
2.1.1 Replacement of RT with UT
In the nuclear power industry, RT is required by Section III of the American Society of Mechanical Engineers (ASME) Boiler and Pressure Vessel Code (ASME BPVC), Rules for Construction of Nuclear Facility Components, for the acceptance inspection of fabrication/construction welds (ASME 2007b) to ensure workmanship standards. A potential replacement method for RT is UT. UT is approved by Section XI of the ASME BPVC, Rules for Inservice Inspection of Nuclear Power Plant Components to develop a pre-service inspection baseline and for the detection of any flaws that may result during operation. Section XI references Section III for certain repairs, replacements, or modifications, and it is also permissible to use UT for limited fabrication/construction inspections. However, a comprehensive study comparing the flaw detection capabilities of RT and UT for typical nuclear power plant configurations and conditions has not been conducted.
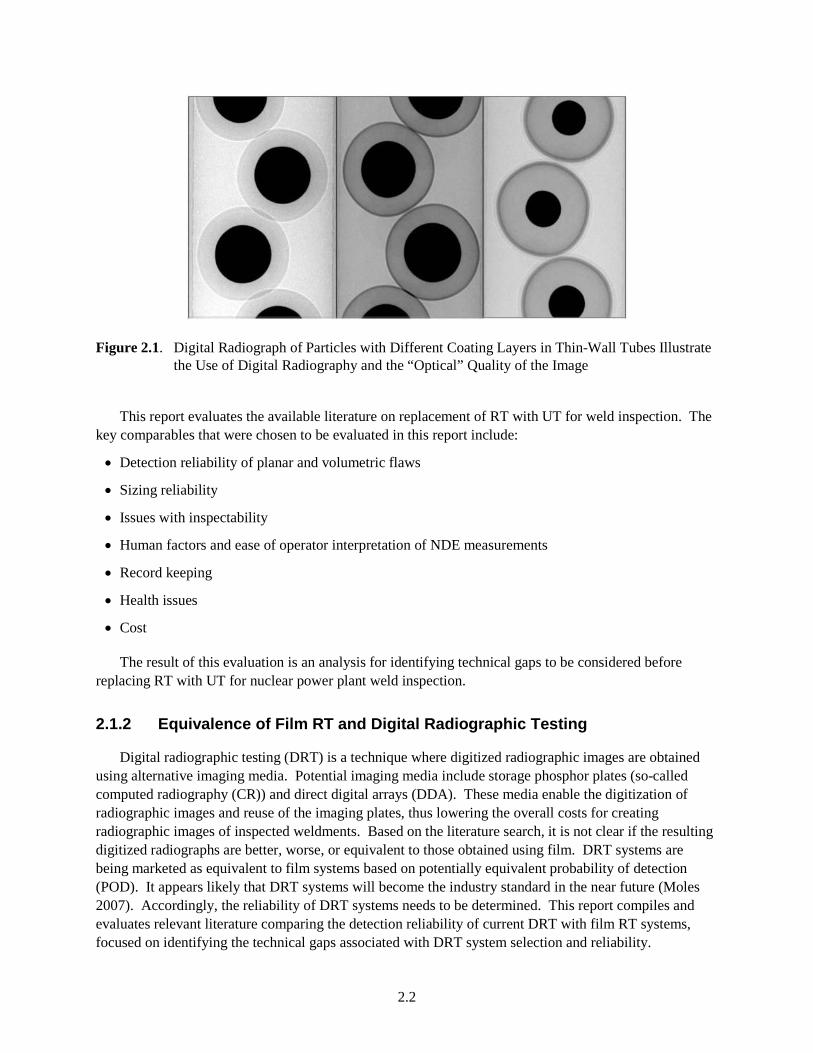
While RT and UT are both volumetric nondestructive evaluation (NDE) methods, the physics of these processes are substantially different. Radiography relies on transmission and absorption/attenuation of small wavelength electromagnetic energy (x-rays and gamma rays). Pores/inclusions or material discontinuities or gradients will result in different attenuation values, resulting in differences in the optical density in radiographs. The result of this process is an optical-quality image (Light 2004) that can be easily interpreted (Figure 2.1; Ahmed et al. 2006), particularly with the availability of reference radiographs (Siewert et al. 1992; Reynolds and Crouse 2009). Ultrasonics, on the other hand, relies on the interaction of acoustic wave energy with flaws in the inspected material. Differences in density or acoustic impedance result in reflection or scattering of the wave, which is recorded as evidence of a discontinuity in the material. The result is a time-based record of the scattered acoustic wave that contains information about the location and distance to a discontinuity. Interpretation of the recorded signal is complicated by a number of factors including acoustic mode-conversions (e.g., wave mode conversion from longitudinal to shear) and the fact that different flaws can result in similar measurement signals.
2.2
Figure 2.1. Digital Radiograph of Particles with Different Coating Layers in Thin-Wall Tubes Illustrate
the Use of Digital Radiography and the “Optical” Quality of the Image
This report evaluates the available literature on replacement of RT with UT for weld inspection. The key comparables that were chosen to be evaluated in this report include:
• Detection reliability of planar and volumetric flaws
• Sizing reliability
• Issues with inspectability
• Human factors and ease of operator interpretation of NDE measurements
• Record keeping
• Health issues
• Cost
The result of this evaluation is an analysis for identifying technical gaps to be considered before replacing RT with UT for nuclear power plant weld inspection.
2.1.2 Equivalence of Film RT and Digital Radiographic Testing
Digital radiographic testing (DRT) is a technique where digitized radiographic images are obtained using alternative imaging media. Potential imaging media include storage phosphor plates (so-called computed radiography (CR)) and direct digital arrays (DDA). These media enable the digitization of radiographic images and reuse of the imaging plates, thus lowering the overall costs for creating radiographic images of inspected weldments. Based on the literature search, it is not clear if the resulting digitized radiographs are better, worse, or equivalent to those obtained using film. DRT systems are being marketed as equivalent to film systems based on potentially equivalent probability of detection (POD). It appears likely that DRT systems will become the industry standard in the near future (Moles 2007). Accordingly, the reliability of DRT systems needs to be determined. This report compiles and evaluates relevant literature comparing the detection reliability of current DRT with film RT systems, focused on identifying the technical gaps associated with DRT system selection and reliability.

2.3
2.1.3 Performance Demonstration for DRT
A related issue for DRT systems is the need for qualification (of the system, the procedure, and the operators). This is particularly true as these systems become the accepted standard for radiographic weld inspection in nuclear power applications. This initial report evaluates relevant literature on RT qualification for determining the technical gaps associated with performance demonstration for DRT.
2.2 Literature Survey
The first step in addressing the goals of this project was to conduct a literature survey of publicly available documents that discuss the reliability and capabilities of ultrasonic and radiographic NDE methods. The PNNL research team developed a list of keywords and phrases by focusing on the main objectives of the project, performing a preliminary literature search, and leveraging on expertise at PNNL in the area of NDE methods. The following is a list of the terms used in the initial literature search:
• Digital Radiography • Computed Radiography • Det Norski Veritas • Forli • Danish Welding Institute • TWI • Ultrasonic • Industrial • Welds
• Weldments • Preservice • Inservice • Construction • Fabrication • Film RT • UT • Edison Welding
• Pressure Vessel Research Council
• Flaws • Industrial radiograph • ASME Section XI • ASME Section III • ASME Code Case (CC) • UT in lieu of RT
The research team then conducted a formal literature search by meeting with professional information specialists from the Hanford Technical Library (HTL) in Richland, Washington, and providing them with the list of keywords and phrases to use as search terms. The time scale selected for the search was from 1980 to 2009. HTL specialists searched engineering, science, and government databases in order to locate all applicable documents. Some of the databases used in the search were:
• Engineering Village 2 - Compendex, Inspec, NTIS (National Technical Information Service)
• Metadex and Corrosion Abstracts
• Defense Technical Information Center
• INIS International Nuclear Information System
• Web of Science
• Science Research Connection
• ADAMS (U.S. Nuclear Regulatory Commission [NRC] Agency-wide Documents Access and Management System)

2.4
The team reviewed hundreds of abstracts and continued to revise search terms to find the most relevant documents to use in the analysis. The team continued the search by reading papers and following up on citations in these papers and with experts in the NDE field.
Literature surveys found over 600 journal and conference papers and technical reports, and over 100 documents related to the main objectives listed above. The evaluation of the documents focused on comparing the techniques applied with the 2007 Edition of the ASME Code with 2008 Addenda and Code Cases, detection reliability for UT and RT, length and depth sizing reliability, and round-robin studies that directly compared UT and RT. The resulting analysis is documented in the next several sections.
2.3 Weld Inspection Methods
2.3.1 Ultrasonics for Weld Inspection
Ultrasonic testing of welds is a nondestructive evaluation method in which high-frequency sound waves are introduced into materials for the detection of imperfections or flaws in the material. The sound waves travel through the material and are reflected at interfaces such as surface boundaries, grain boundaries, cracks, and pores. The reflected acoustic energy is converted to electrical signals which are recorded and analyzed to determine the presence and location of flaws or discontinuities.
A typical UT inspection system consists of several pieces of equipment, such as the signal pulser/receiver, transducer(s), couplant, amplifier, and display devices. A pulser/receiver is an electronic device that transfers electrical pulses to a transducer which generates high-frequency ultrasonic energy. UT frequencies used to inspect stainless steel and nickel-base alloy materials commonly used in nuclear vessel welds are generally between 0.5 to 2.25 MHz. The couplant, commonly water, gel, or oil, removes air between the transducer and the material being inspected, and provides a medium for efficient transfer of sound energy into and out of the test material. The introduced acoustic energy propagates through the material in the form of elastic waves. Discontinuities (such as a crack) in the wave path result in part of the energy being reflected back from the flaw surface. The reflected wave signal is transformed back into an electrical signal by the transducer and displayed on an oscilloscope screen.
UT is typically performed in either through-transmission mode (two transducers located on opposite sides of the component) or pulse-echo mode (one transducer located on one side of the component). For noisy materials (cladding, stainless steels) a dual transducer is commonly used where one transducer is used for transmitting and the other transducer sitting next to it is used as the receiving transducer. The dual mode (pitch-catch) is far more common than the through transmission mode for NPP inspections (Figure 2.2). The through-transmission mode only measures signal attenuation, while the pulse-echo mode can measure both transit time and signal attenuation. As a result, pulse echo (PE) can provide information on flaw location, length, and flaw depth. Another advantage to using pulse echo is that only single-sided access to the component is sufficient because one transducer can be used as both the transmitter and the receiver.

2.5
Figure 2.2. Typical UT Techniques: a) pulse-echo, b) through-transmission, and c) pitch catch
(Cartz 1995, Figure 3.3). Reprinted with permission of ASM International®. All rights reserved. www.asminternational.org.
2.3.2 Common Ultrasonic Techniques
UT inspection of welded structures has been around for over 40 years (Rudlin et al. 2004). Conven-tional UT consists of a pulse-echo mode of inspection, with manual scanning of the weld. In the 1970s automated techniques for scanning the weld and displaying the data were introduced, with advances in the late 1970s including time-of-flight diffraction techniques for flaw detection and sizing. Multi-probe automated ultrasonic testing systems were introduced in the 1980s, with phased-array systems introduced in the late 1990s. A brief summary of these different techniques is given below (Rudlin et al. 2004).
• Manual Ultrasonic Testing (MUT) – This technique is performed by an operator manipulating an ultrasonic probe over the work piece and visually monitoring the screen of an ultrasonic flaw detector. Typically the operator would use different angle-beam probes and scanning directions to detect all orientations that are possible for flaws. Sizing of flaws is typically carried out by measuring the probe movement for the presence of the signal until it falls by a fixed amount as the probe is traversed across the flaw (dB-drop technique). The maximum amplitude technique, on the other hand, uses the distance the probe is moved to maximize the amplitude of the first and last peak signals from an A-scan (pick up tip-diffracted signals from the flaw extremities).
• Automated Ultrasonic Testing (Automated UT) – The automated UT is similar to MUT in regards to the use of angle-beam probes for detecting and sizing of flaws. Multiple angle-beam probes are used to obtain full coverage of the required volume. The main difference with MUT is the ability to record position with the use of encoders and scanning frames to move a single probe over the surface in a fixed pattern.

2.6
• Computer Assisted Ultrasonic Testing (CAUT) – The actual scanning of the CAUT system is identical to the automated UT described above (DeNale and Lebowitz 1989). Computer-assisted UT can additionally use computer algorithms to flag potential flaws (Brown and DeNale 1991). The data however is still reviewed by an inspector if it has been flagged for further review. The evaluation of the data can be performed remotely.
• Time-of-Flight Diffraction (TOFD) – TOFD technique uses two probes, one for transmitting and the other for receiving (Figure 2.3). The UT beam produces a diffracted signal from the flaw extremities, which act as point sources, as well as a reflected signal. The diffracted signals appear as signals arriving at different times at the receiver. This technique is used to improve the depth sizing estimates of a flaw based on geometrical calculations of the signal arrival times. The disadvantages are where the different signals cannot be resolved in time (small flaws, flaws close to the inspection surface) and the amplitude of the diffracted signals can be low.
Figure 2.3. Diagram of TOFD Technique
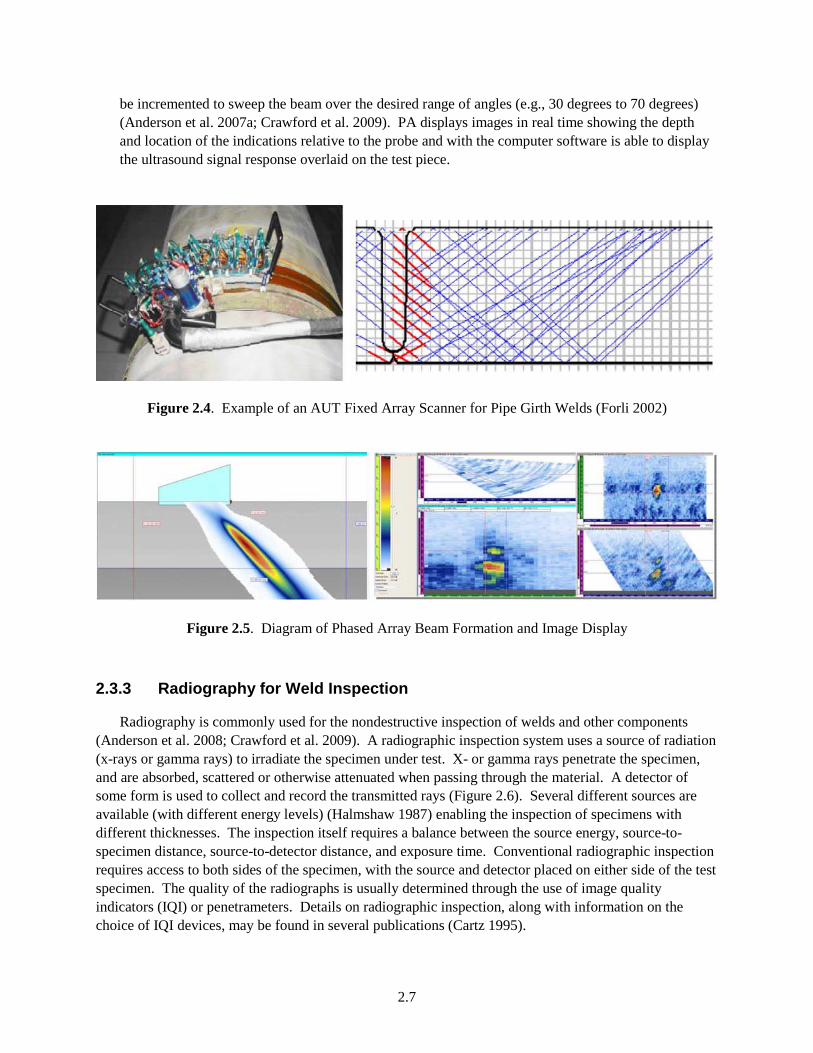
• AUT – The AUT (also an acronym for Automated Ultrasonic Testing) technique uses multiple probes simultaneously, all focused at different points within the volume of the weld (Figure 2.4). The focused zones are specifically angled to detect lack of sidewall and root fusion, together with other wide-angle beams to detect flaws in the weld volume. The flaw length is estimated by using the probe movement and the thickness dimension can be calculated to within the tolerance of the individual zone sizes.
• Phased-Array Ultrasonic Testing (PA) – PA uses a multiple-element probe unlike the manual or automatic UT systems, where the output pulse from each element has its own time delay to produce a constructive interference at a specific angle and a specific depth (Figure 2.5). These time delays can
2.7
be incremented to sweep the beam over the desired range of angles (e.g., 30 degrees to 70 degrees) (Anderson et al. 2007a; Crawford et al. 2009). PA displays images in real time showing the depth and location of the indications relative to the probe and with the computer software is able to display the ultrasound signal response overlaid on the test piece.
Figure 2.4. Example of an AUT Fixed Array Scanner for Pipe Girth Welds (Forli 2002)
Figure 2.5. Diagram of Phased Array Beam Formation and Image Display
2.3.3 Radiography for Weld Inspection
Radiography is commonly used for the nondestructive inspection of welds and other components (Anderson et al. 2008; Crawford et al. 2009). A radiographic inspection system uses a source of radiation (x-rays or gamma rays) to irradiate the specimen under test. X- or gamma rays penetrate the specimen, and are absorbed, scattered or otherwise attenuated when passing through the material. A detector of some form is used to collect and record the transmitted rays (Figure 2.6). Several different sources are available (with different energy levels) (Halmshaw 1987) enabling the inspection of specimens with different thicknesses. The inspection itself requires a balance between the source energy, source-to-specimen distance, source-to-detector distance, and exposure time. Conventional radiographic inspection requires access to both sides of the specimen, with the source and detector placed on either side of the test specimen. The quality of the radiographs is usually determined through the use of image quality indicators (IQI) or penetrameters. Details on radiographic inspection, along with information on the choice of IQI devices, may be found in several publications (Cartz 1995).

2.8
Figure 2.6. Schematic of an X-ray System
In conventional radiography, the location and orientation of the specimen is fixed relative to the source and detector location. The result is a radiograph where the orientation of any flaws is fixed with respect to the source and detector locations. In some cases, the source and detector may be mounted on a scanner, and the specimen moved relative to the scanner to inspect different regions of the specimen. However, each region of the specimen is radiographed only once, with a fixed orientation relative to source and detector. An alternative approach is to subject each region on the specimen to multiple radiographic inspections. Each inspection is performed with the specimen oriented at a different angle relative to the source and/or detector. While this technique improves the information on flaws (potentially enabling better detection and through-wall sizing), the approach tends to have higher costs. A common variation on this approach is computed tomography (CT) (Figure 2.7), where multiple view angles are used, and the resulting two dimensional data combined to create three-dimensional (3D) images of the specimen. Typically, CT scans require a computer-controlled scanner system to obtain precision control of view angles (Ewert et al. 2007a).

2.9
Figure 2.7. Schematic of a CT Inspection System
2.4 Reliability of Weld Inspection Methods
2.4.1 Reliability of UT
UT inspection reliability (Doctor 2007) has improved over the years and has been the detection method most often used for inservice inspections at nuclear power plants (NPPs). As seen in the following studies (Forli 1979; Forli and Hansen 1982; Forli and Pettersen 1985; DeNale 1986; Ford and Hudgell 1987; DeNale and Lebowitz 1989, 1990a, b; Forli 1990; Light 2004; Spanner 2005), UT is more reliable at detecting planar flaws such as cracks and lack of fusion. Planar flaws are typically found during service because cracking is a dominant service degradation process as opposed to volumetric flaws (slag and porosity) that are more commonly created and thus found in welding fabrication.
Table 2.1 provides a brief summary of the various round-robin studies and other UT detection and sizing reliability research in publically available literature. Most of the studies focus on planar flaws, which are the typical flaws found during in-service inspections as opposed to volumetric flaws that are typically found during fabrication/construction.
The variability in UT reliability in NDE is affected by several different factors as discussed in Table 2.1. The variations in accurate detection and sizing as discussed in several paper and reports (Bell et al. 1982; Doctor 1984; Ford and Hudgell 1987; Heasler et al. 1993; Thavasimuthu et al. 1998; Heasler and Doctor 2003; Skala and Vit 2003; Kim et al. 2004; Lozev et al. 2004; Rudlin et al. 2004; Lozev et al. 2005; Doctor 2006; Rebello et al. 2006; Lee et al. 2007) are affected by different flaw sizes and shapes, grain structure of materials, frequency and angle beams, interference by detected and refracted signals, couplant variations, human factors in taking and analyzing data, curvature of the component and surface interferences, and orientation and location of the flaw relative to the angle of the
2.10
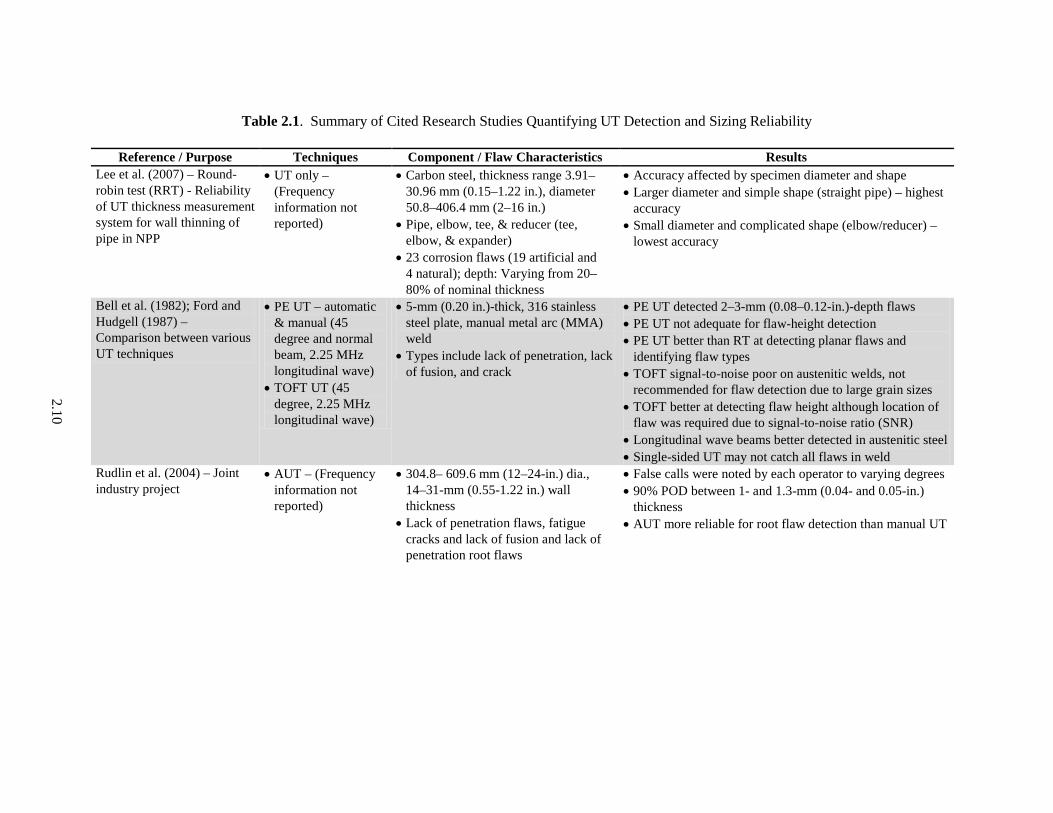
Table 2.1. Summary of Cited Research Studies Quantifying UT Detection and Sizing Reliability
Reference / Purpose Techniques Component / Flaw Characteristics Results
Lee et al. (2007) – Round-robin test (RRT) - Reliability of UT thickness measurement system for wall thinning of pipe in NPP
• UT only – (Frequency information not reported)
• Carbon steel, thickness range 3.91–30.96 mm (0.15–1.22 in.), diameter 50.8–406.4 mm (2–16 in.)
• Pipe, elbow, tee, & reducer (tee, elbow, & expander)
• 23 corrosion flaws (19 artificial and 4 natural); depth: Varying from 20–80% of nominal thickness
• Accuracy affected by specimen diameter and shape • Larger diameter and simple shape (straight pipe) – highest
accuracy • Small diameter and complicated shape (elbow/reducer) –
lowest accuracy
Bell et al. (1982); Ford and Hudgell (1987) – Comparison between various UT techniques
• PE UT – automatic & manual (45 degree and normal beam, 2.25 MHz longitudinal wave)
• TOFT UT (45 degree, 2.25 MHz longitudinal wave)
• 5-mm (0.20 in.)-thick, 316 stainless steel plate, manual metal arc (MMA) weld
• Types include lack of penetration, lack of fusion, and crack
• PE UT detected 2–3-mm (0.08–0.12-in.)-depth flaws • PE UT not adequate for flaw-height detection • PE UT better than RT at detecting planar flaws and
identifying flaw types • TOFT signal-to-noise poor on austenitic welds, not
recommended for flaw detection due to large grain sizes • TOFT better at detecting flaw height although location of
flaw was required due to signal-to-noise ratio (SNR) • Longitudinal wave beams better detected in austenitic steel • Single-sided UT may not catch all flaws in weld
Rudlin et al. (2004) – Joint industry project
• AUT – (Frequency information not reported)
• 304.8– 609.6 mm (12–24-in.) dia., 14–31-mm (0.55-1.22 in.) wall thickness
• Lack of penetration flaws, fatigue cracks and lack of fusion and lack of penetration root flaws
• False calls were noted by each operator to varying degrees • 90% POD between 1- and 1.3-mm (0.04- and 0.05-in.)
thickness • AUT more reliable for root flaw detection than manual UT

2.11
Table 2.1. Continued
Reference / Purpose Techniques Component / Flaw Characteristics Results
Rebello et al. (2006) – Evaluate the reliability of UT
• Manual PE UT • Automated UT
(TOFD and PE) – (Frequency information not reported)
• API X70 steel pipe, 254-mm (10 in.) OD and 19.05-mm (0.75 in.) thickness
• Lack of penetration (LP)and lack of fusion (LOF) made by TIG submerged arc welding (SMAW), 3–20-mm (0.12-0.79 in.) length, 2–5-mm (0.08-0.20 in.) depth
• Human factor is still the main cause for detection failure of discontinuities
• Automatic inspection should improve reliability by removing human factor errors
• POD for Automated UT is great than MUT • 63% (100%) average POD for LOF and 77% (100%)
average POD for LP for MUT (automated UT) • All length sizes were oversized
Lozev et al. (2004); Lozev et al. (2005) – Optimizing inspection of thin-walled pipe using Automated UT
• PA UT, 32-element, 10 MHz, natural shear wave @ 52 deg inspection angle, PE
• Single-element PE UT, 60 deg, 10 MHz
• X55 steel pipe, 200-mm (7.87-in.) OD, 4.5-mm (0.18-in.) thick
• ID cracks and sidewall incomplete fusion, 5%–60% deep
• UT probes and inspection angles can be optimized through modeling
• Weld cap width and weld shrinkage interfere with probes and signals
• When compared to single element, PA has increased detection and sizing capabilities
• High frequencies (10 MHz) were used for detection in steel
• Sizing error was 0.44 mm (0.02 in.) with standard deviation of 0.44 mm (0.02 in.)
Kim et al. (2004) – Round-robin study to assess performance of ultrasonic in-service inspection
• Manual UT • Automated UT –
(Frequency information not reported)
• 304L stainless steel, SA312 and TP347 stainless steel
• Electrical discharge machining (EDM) notches, fatigue crack
• 66% POD for 15-mm (0.59-in.) length • 60% average POD for any size depth • Automated UT has higher POD than MUT • Thermal fatigue cracking had lower detectability than
EDM notch • Circumferential cracks have higher POD than axial
cracking • Defects smaller than 10 mm (0.39 in.) were sized larger
and defects larger than 10 mm (0.39 in.) were sized smaller
• Necessary to introduce performance demonstration system to assess uncertainty of UT results

2.12
Table 2.1. Continued
Reference / Purpose Techniques Component / Flaw Characteristics Results Thavasimuthu et al. (1998) – Impact of flaw tilt angle (relative to incident ultra-sonic beam) on detection, and determine whether inspec-tions conducted per ASME Code can correctly detect and size flaws of all orientations
• PE UT, angles (normal, 45, 60, and 70 deg and variable), frequencies (1, 2.25, 4, and 5 MHz)
• Test blocks (200 × 165 × 20 mm) (7.87 × 6.50 × 0.79 in.)
• Holes of 3 mm (0.12 in.) and at 30-mm (1.18-in.) depth, inclined at angles 10 to 45 deg
• Reliable and reproducible detection of defects is possible if the defects are misoriented not more than ±15 deg
• If the orientation is great than 15 deg, then the defect will most likely be under sized or undetected
Skala and Vit (2003) – Assess TOFD for NDE of VVER reactor components
• PE UT • TOFD (pitch catch)
– (5 MHz, 60 deg wedges and 2.5 MHz and 45 deg wedge)
• VVER base metal, 70-, 140- and 150-mm (2.76-, 5.51-, 5.97-in.) thick
• Artificial cracks – semielliptical and constant depth, 5–15-mm (0.20–0.59 in.) EDM notches on ID and OD, PISC (Programme for the Inspection of Steel Components) Type A cracks and EDM notches for LOF
• Height difference between real and measured TOFD detected cracks were 0.9–1.5 mm (0.04–0.06 in.)
• All flaws detected by TOFD that were detected by PE UT • Planar flaws perpendicular to surface were detected by
TOFD • PE UT reliably detects under cladding cracks from ID,
TOFD was able to detect only 1 of the under cladding cracks but able from both sides
Doctor (1984, 2006); Heasler and Doctor (2003) – PIRR
• Conventional Manual UT – (Frequency information not reported)
• Cast stainless steel, ferritic steel, wrought stainless steel
• Thermal fatigue crack, intergranular stress corrosion cracking (IGSCC), EDM notches, 0–7-mm (0–0.25-in.) depth, up to 90-mm (3.54-in.) length
• UT inspection of thermal fatigue cracks in centrifugally cast stainless steel (CCSS) is ineffective using conventional MUT
• UT inspection of clad ferritic material can be 100% effective if adequate sensitivity is used
• UT of wrought SS is marginally effective and is in between ferritic case and CCSS case
• UT inspection of SS should be qualified to blind testing • Crack-length sizing tends to be non-conservative for long
cracks: require length to be made until signal drops into noise
• Crack-depth sizing using amplitude drop method is inaccurate

2.13
Table 2.1. Continued
Reference / Purpose Techniques Component / Flaw Characteristics Results Heasler and Doctor (2003) – Comparison of PIRR, MRR, and PISC III
• Manual UT • Automated UT –
(Frequency information not reported)
• Wrought stainless steel • The earliest round robin (Piping Inspection Round Robin [PIRR]) produced the lowest detection score while PISC III (latest) produced the best
• Average POD for 10-mm (0.39-in.) deep flaw is 90%, average POD for 5-mm (0.20-in.) deep flaw is 70%
• In the earlier studies, PIRR and Mini Round Robin (MRR), the length sizing was inconsistent and undersized large flaws
• More training and testing was required for the further studies, which resulted in better depth sizing
• All teams passed regulatory tests that qualified them to perform field inspections for IGSCC; but in all cases, more training and testing is required to increase qualified depth sizing
Heasler et al. (1993) – PISC II – evaluate effectiveness of NDT techniques for ISI of RPV components
• Manual UT • Automated UT –
(Frequency information not reported)
• Steel plates w/ cladding, 246–262-mm (9.69–10.31-in.) thick, PWR inlet nozzle, 200–250-mm (7.87–9.84-in.) thick
• Microcracks, macrocracks, slag, porosity, vertical cracks, welding flaws, copper and carbon cracking
• POD is better for higher-sensitivity procedures • Flaws located in clad/base metal require specific
procedures for adequate detection • Detection procedures are influenced by flaw variability • Advance sizing procedures (synthetic aperture focusing
technique [SAFT], TOFT, holography) characterize flaws more accurately in both length and depth
• There is a need to study human element in NDE • UT inspection needs to improve flaw-length sizing
capabilities as no teams passed Appendix VIII sizing requirements
Crutzen et al. (1989); Dombret (1989); Murgatroyd et al. (1989) – PISC II – Parametric Studies on the Effects of Defect Characteristics
• Automated UT (2-MHz, 45 deg shear wave, focused beam)
• Pulse Echo – 2-MHz (45, 60, 80 deg shear wave, different focus depths and Tandem)
• Ferritic Steel no cladding– ASME SA 533 Class 1
• Planar defects – size: 3–25-mm (0.12–0.98-in.) through wall, 15–125-mm (0.59–4.92-in.) length, 3–190-mm (0.12–7.48-in.) depth; tile angle ± 0–15 deg; varied roughness; crack tip radius: 1–20 µm (0.04–0.79 mil)
• Strongest echoes generated by the flaws are from edge-diffracted signals
• Skewed defects are harder to detect • Smooth cracks have a larger response to the lower tip than
the upper tip and the peak amplitude increases as the tilt angle increases (0–15 deg)
• Rough defects generate higher echoes at the tip peak and the peak amplitude spikes for tilt angles between 7 and 15 degrees

2.14
Table 2.1. Continued
Reference / Purpose Techniques Component / Flaw Characteristics Results • TOFD – 2 MHz,
45 deg shear wave • 6-dB drop sizing technique is not possible for defects
smaller than the UT beam width and only increased in error for tilt and skew angles
• TOFD detected 2-mm (0.08-in.) size defects, skew angle up to 15 deg. Did not affect TOFD detection, upper crack tips difficult to detect if as close as 3 mm (0.12 in.) from scanning surface.
PISC (1993d) – PISC III: Sizing of Flaws in Full Scale Reactor Pressure Vessels
• Manual UT (PE, TOFD)
• Automated UT (PE, TOFD, holography) – (Frequency information not reported)
• RT (MINAC)
• BWR Vessel, support ring containing PWR nozzle and plate assemblies
• Planar flaws – cracks or lack of fusion near to the inside clad surface, inner radius corner of nozzles, and slags and crack in the weld
• Several sizing techniques are capable of sizing simple planar flaw ranging from 6mm (0.25 in.) to 30 mm (1.18 in.) in depth with tolerance of 4 mm (0.16 in.) or ± 2 mm (0.08 in.)
• Most precise sizing result are obtained by techniques based on crack tip location (contact or immersion focused) and techniques complemented by reconstruction algorithms
• Composite flaw (rough crack, multiple crack, combination of planar and volumetric flaws) – few techniques are able to recognize or even classify the flaws
• Combining techniques produced better detection and sizing results for composite flaws
• Largest errors due to human errors in locating or recognizing flaw signals or by selecting the wrong technique (transducers, frequencies)
PISC (1993a, b, c, 1998)– PISC III results on Action 3 Nozzles and Dissimilar welds
• Manual and Automated UT (contact and immersion) – (Frequency information not reported)
• RT
• BWR nozzle(stainless steel/Inconel/ carbon steel) and safe-end (Inconel/ wrought stainless steel) and PWR safe-end (Inconel/cast stainless steel)
• Surface planar flaws, subsurface cracks and fabrication flaws (10–50% through wall)
• Tendency to oversize in through-wall direction (size error ± 5 mm (0.20 in.)
• 70% correct flaw rejection rate • Flaws smaller than 2 mm (0.08 in.) are not well detected
by current technology used in the PISC studies • Flaws in the weld or buttering are difficult to detect • Manual and automatic UT on average produce similar
results • The flaws difficult for UT detection were also difficult for
RT

2.15
signal beam. The studies presented in Table 2.1 are composed of different materials, techniques and methods, and any attempt to directly compare all these studies is impractical.
As stated before, UT is more reliable at detecting planar flaws but there are limitations to what it is capable of detecting. In particular, recent studies using different frequencies and angle beams highlight the fact that UT will not see perfectly smooth planar flaws that are misoriented by more than 15 degrees (Thavasimuthu et al. 1998), but if the flaw is rough one may be able to detect it (NUREG-1696). TOFD is also capable of identifying the tips of misoriented flaws (Crutzen et al. 1989; Dombret 1989; Murgatroyd et al. 1989). The studies also point that the reliability is greatly affected by the material and grain structure as is the case with austenitic stainless steel (Bell et al. 1982; Ford and Hudgell 1987). PNNL has performed several studies over the years assessing the effectiveness and reliability of novel approaches to NDE for inspecting coarse-grained, cast stainless steel reactor components. A summary of this work is provided in Doctor (2007) and the most current work in phased-array technology is provided in Anderson et al. (2007b) and Crawford et al. (2009).
Some of the studies in Table 2.1 comparing manual UT and automated UT found that automated UT has a higher detection rate than manual UT (Heasler et al. 1993; Kim et al. 2004; Rudlin et al. 2004; Rebello et al. 2006). Automated UT is able to record position, which allows the use of advanced software being applied to the raw data (Heasler et al. 1993). The round-robin studies, PIRR, PISC (I, II, III), MRR, etc. (Doctor 1984; Heasler et al. 1993; Heasler and Doctor 2003; Doctor 2006), which have been documented in several other papers and NUREG reports, have all been conducted to determine the reliability of UT for weld inspection of NPP components. These studies continued to test the latest technologies and procedures at the time. The results of these studies on crack detection in austenitic stainless steel have shown that the average POD for flaws of 5 mm (0.20 in.) has been around 70% (Heasler and Doctor 2003). The reliability has also been greatly improved by performance demonstration requirements, which will be discussed later in this section.
2.4.2 Reliability of Film-Based RT
Conventionally, film-based RT has been used for detecting volumetric flaws (such as slag inclusions or porosities). While important from the perspective of workmanship standards (Doctor 2007) (because the number and size of volumetric flaws are an indication of welding quality), most volumetric flaws have only a small impact on structural integrity because they are typically small and embedded. On the other hand, planar flaws (cracks or lack of fusion) have a greater potential impact on structural integrity, and are more important from the point of view of detection reliability.
Several studies have been conducted to quantify planar flaw detection sensitivity of Film RT. Detection in Film RT is dependent on the change in film density or contrast between the background and the indication. Most analysis of film is conducted by human operators, and the Rose model (Lu et al. 2003) hypothesizes that a signal-to-noise ratio (SNR) of 5 or better in radiographs is necessary for visual perception of flaws. The SNR can be shown to be proportional to contrast as well as the square root of the area of the indication in the radiograph. The area of a planar indication on the radiograph will depend on its volume and tilt relative to the incident beam. Further, the contrast in the radiograph is a function of several variables such as film density, graininess, source strength and distance, and specimen thickness. Thus, for crack detectability each of these quantities plays a critical role. Table 2.2 provides a brief summary of several theoretical and experimental studies on crack detection sensitivity in film RT.
2.16
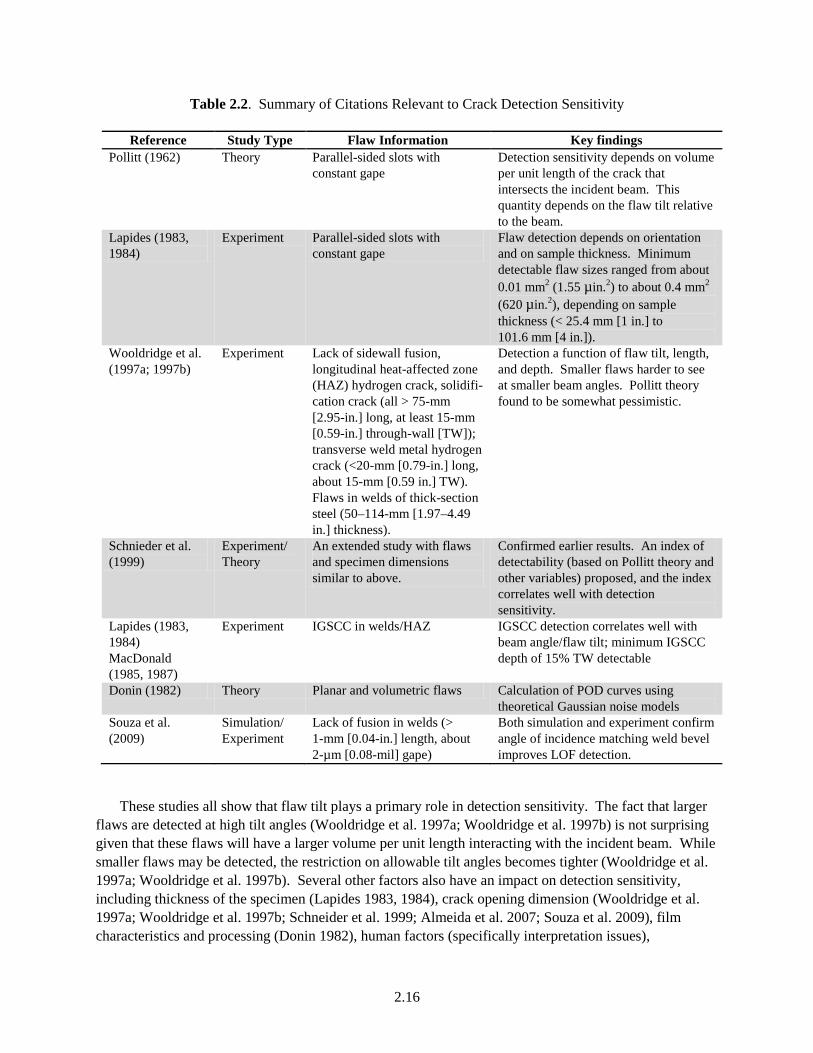
Table 2.2. Summary of Citations Relevant to Crack Detection Sensitivity
Reference Study Type Flaw Information Key findings Pollitt (1962) Theory Parallel-sided slots with
constant gape Detection sensitivity depends on volume per unit length of the crack that intersects the incident beam. This quantity depends on the flaw tilt relative to the beam.
Lapides (1983, 1984)
Experiment Parallel-sided slots with constant gape
Flaw detection depends on orientation and on sample thickness. Minimum detectable flaw sizes ranged from about 0.01 mm2 (1.55 µin.2) to about 0.4 mm2
(620 µin.2), depending on sample thickness (< 25.4 mm [1 in.] to 101.6 mm [4 in.]).
Wooldridge et al. (1997a; 1997b)
Experiment Lack of sidewall fusion, longitudinal heat-affected zone (HAZ) hydrogen crack, solidifi-cation crack (all > 75-mm [2.95-in.] long, at least 15-mm [0.59-in.] through-wall [TW]); transverse weld metal hydrogen crack (<20-mm [0.79-in.] long, about 15-mm [0.59 in.] TW). Flaws in welds of thick-section steel (50–114-mm [1.97–4.49 in.] thickness).
Detection a function of flaw tilt, length, and depth. Smaller flaws harder to see at smaller beam angles. Pollitt theory found to be somewhat pessimistic.
Schnieder et al. (1999)
Experiment/ Theory
An extended study with flaws and specimen dimensions similar to above.
Confirmed earlier results. An index of detectability (based on Pollitt theory and other variables) proposed, and the index correlates well with detection sensitivity.
Lapides (1983, 1984) MacDonald (1985, 1987)
Experiment IGSCC in welds/HAZ IGSCC detection correlates well with beam angle/flaw tilt; minimum IGSCC depth of 15% TW detectable
Donin (1982) Theory Planar and volumetric flaws Calculation of POD curves using theoretical Gaussian noise models
Souza et al. (2009)
Simulation/ Experiment
Lack of fusion in welds (> 1-mm [0.04-in.] length, about 2-µm [0.08-mil] gape)
Both simulation and experiment confirm angle of incidence matching weld bevel improves LOF detection.
These studies all show that flaw tilt plays a primary role in detection sensitivity. The fact that larger flaws are detected at high tilt angles (Wooldridge et al. 1997a; Wooldridge et al. 1997b) is not surprising given that these flaws will have a larger volume per unit length interacting with the incident beam. While smaller flaws may be detected, the restriction on allowable tilt angles becomes tighter (Wooldridge et al. 1997a; Wooldridge et al. 1997b). Several other factors also have an impact on detection sensitivity, including thickness of the specimen (Lapides 1983, 1984), crack opening dimension (Wooldridge et al. 1997a; Wooldridge et al. 1997b; Schneider et al. 1999; Almeida et al. 2007; Souza et al. 2009), film characteristics and processing (Donin 1982), human factors (specifically interpretation issues),

2.17
unsharpness, source-film distance and source strength, etc. The relative importance of these factors seems to depend on the type of flaw (Pollitt 1962), and under favorable conditions, small cracks with very small opening dimension can be detected using film RT (Almeida et al. 2007; Souza et al. 2009). Note that the impact of variations in most of these factors can often be represented as noise, which reduces the SNR and consequently impacts detectability (Donin 1982).
Figure 2.8 presents a snapshot of some of these early studies (Lapides 1984). The British Engine Radiographic Technique Assessment (BERTA) experiment (Lapides 1983) used parallel-sided slots and showed a clear correlation between minimum detectable flaw size (defined in volume per unit length) and sample thickness (Figure 2.8). The minimum detectable flaw size ranged from about 0.01 mm2 (1.55 µin.2) to about 0.4 mm2 (620 µin.2), depending on sample thickness (less than 25.4 mm to 114.3 mm (1 in. to 4.5 in.). The second figure shows the results of tests on IGSCC cracking in welds, which showed a clear correlation with orientation angle. Minimum detectable flaw sizes were about 15% TW. These results, and other similar studies, provided data on crack sensitivity and several mathematical models have been the end result (Lapides 1983). These studies taken as a whole indicate that radiography has the potential for detecting planar flaws with high reliability only under favorable conditions.
The reliability (in terms of POD) of RT for detecting planar and volumetric flaws in welds has been assessed primarily in round-robin studies (Forli and Pettersen 1985; DeNale and Lebowitz 1990b). These studies indicate that, in general, the RT POD for volumetric flaws is generally higher than that for planar flaws, and depends on the specimen geometry and application.
In practice, penetrameter sensitivity is often taken as an indication of detection sensitivity. Pollitt’s analysis, though somewhat conservative, also shows that the use of wire penetrameters may provide the best correlation between the image quality and crack sensitivity. However, penetrameter sensitivity is primarily an indication that the required standards for radiographic image generation have been met (Pollitt 1962) and not an indication of flaw detection sensitivity (Reynolds and Crouse 2009).
2.5 An Overview of Weld Inspection Codes
Title 10 of the Code of Federal Regulations (CFR) Part 50.55a(b) requires the use of ASME Boiler and Pressure Vessel Code Section III, Rules for Construction of Nuclear Facility Components, and Section XI, Rules for In-service Inspection Nuclear Power Plant Components. The requirement to use NDE for weldments is outlined in Section III and Section XI of the ASME BPVC. To meet defense-in-depth standards, NDE must reliably detect and accurately characterize any degradation that occurs before it reaches a size where it can challenge the structural integrity of components so that timely corrective actions can be taken (Doctor 2007).
For fabrication/construction, ASME Code Section III (Division 1, Articles NB/NC/ND) defines which volumetric examination method is to be used on the welds for nuclear components. All fabrication/construction examinations are required to be performed in accordance with ASME BPVC Section V (Article 2 for Radiographic Examination or Article 4 for Ultrasonic Examination). Pre-service inspection (PSI) and In-service inspection (ISI) examinations are defined in ASME Code Section XI. The examination method (UT or RT) is prescribed, and the examinations are required to be performed in accordance with either Section V, Article 2 for RT or Section XI, Appendix I for UT.

2.18
Figure 2.8. BERTA Detectability Results and IGSCC Detectability Results with RT. Source: Lapides
(1984), copyright © 1984 Electric Power Research Institute, Inc.; reproduced with permission.
Acceptance standards for fabrication, and PSI and ISI, are defined in the relevant sections (Section III for fabrication, Section XI for PSI and ISI). Acceptance standards for fabrication are based on RT workmanship standards and not on fitness for service, with flaw accept/reject criteria based only upon the length of the indication and not on the through-wall size or though-wall location of the flaw (Doctor 2007). Typically RT is used versus UT for fabrication inspections. Acceptance standards for PSI and ISI are based on fracture mechanics. Typically UT is the preferred choice versus RT for these inspections.
Several other industry codes on nondestructive examination of welds are available. In the United States, examples include NAVSEA T9074-AS-GIB-010/271 (CHG NOTICE 1) and MIL-STD-2035A. These are the most recent updates to the codes documented in DeNale and Lebowitz (1990b).
2.6 Performance Demonstration
NDE is very skill dependent (Enkvist et al. 2001; Doctor 2007) and in the early 1970s/1980s, a need was identified to develop and implement a performance demonstration process to ensure that the
2.19
examination techniques are effective at detecting and sizing the target flaw types and sizes. Indeed, to counter the issues with NDE reliability,
“…simply increasing inspection sensitivities was not a viable solution. The systems would be overloaded with information from harmless reflectors. It was clear that prescriptive requirements on examination techniques would not work for all applications. Individual solutions were required to solve particular problems. Performance demonstration was selected as the most appropriate solution. This scheme requires that particular procedure, equipment, and personnel combinations are capable of detecting and sizing flaws of concern” (Miller 2008).
Performance demonstrations as defined for ASME Code Section XI Appendix VIII, ensure this effectiveness through the use of a stringent process qualification. Personnel qualifications are performed to ensure that the individuals are capable of reliably executing the qualified examination procedures within acceptable norms of performance. Appendix VIII addresses specific examinations where procedures, personnel, and equipment are required to be tested on a set of secure specimens (blind/blind demonstration). However, performance demonstrations for only one of the above components (procedure, personnel, or equipment) while using other components that are qualified have been implemented for certain examinations. This type of testing is known as blind/open demonstration. The type of demonstrations to be used is decided based upon safety consequences, needed rigor, etc. The basis for performance demonstration and the U.S. implementation strategy is detailed in Willetts and Ammirato (1987). NUREG/CR-4882 (Spanner et al. 1990) documents some of the early work that led to the performance demonstration requirements followed in ASME Code, Section XI Appendix VIII. In the United States, performance demonstration for ISI is required per Title 10 CFR 50.55a(g)(6)(ii)(C)(1), “Implementation of Appendix VIII to Section XI of the ASME Boiler & Pressure Vessel Code.” Appendix VIII was designed to be a screening test using a statistically based sampling process and not to quantify the POD curve for each inspector. The Performance Demonstration Initiative (PDI) was the industry effort created to implement the requirements of Appendix VIII. Appendix VIII set a high standard and the nuclear industry made many improvements in order to perform at the required level. This is confirmed by inspections being performed with Appendix VIII qualified procedures, equipment, and personnel detecting many new indications in weldments that had previously been inspected with ISI meeting the ASME Code requirement prior to Appendix VIII. The key is that the improved inspection can correctly disposition these new indications and they can be tracked as NPPs operate for 60 or more years. Due to the limited number of procedures, it is easy to collapse PDI data across inspectors using the same procedure to quantify the effectiveness of field examinations. New procedures, personnel, and technologies, such as phased arrays, new flaw detectors, and piezocomposite transducers, continue to be qualified under this initiative.

2.20

3.1
3.0 A Comparison of Film and Digital Radiography for Weld Inspection
Filmless RT techniques, such as fluoroscopes and direct imaging methods, have been investigated and used since at least the late 1980s (Fletcher 1988). Recent developments in solid-state technology have led to the development of highly sensitive digital detectors for radiography, leading to so-called digital radiographic testing (DRT) (Klyuev and Sosnin 1999). Interest in DRT for industrial applications seems to be increasing world-wide, with organizations such as the International Atomic Energy Agency (IAEA) supporting Coordinated Research Programs (CRP) in this area (Ewert et al. 2007b). In the United States, progress in DRT is being monitored by the Federal Working Group on Industrial Digital Radiography.(a
3.1 Digital Detectors
) The key to DRT is to find a way of directly recording the RT image on a computer (or other digital media). DRT first made its appearance in medical diagnostics. Limitations on detector size and image quality have limited the adoption of these detectors in industrial NDE until recently. This section provides a brief survey of the state of the art in DRT, and compares its detection reliability with that of film RT. While the goal of this report is the evaluation of UT reliability relative to that of DRT reliability, such comparisons have simply not been performed. However, published literature documents several studies comparing UT with film radiography. These studies, when augmented with the comparisons between film and DRT provided in this section, will help determine whether UT can be used in lieu of RT and/or DRT. The literature reviewed in this section covers only standard radiographic techniques that acquire images from a single view (i.e., single angle of incidence of the radiation). Multiview approaches, such as computed tomography (Redmer et al. 2002; Zhukov et al. 2008), are not discussed here due to their relatively infrequent use in pre-service and in-service inspection of NPP welds.
DRT is a generic term encompassing several filmless detector technologies, which can be used with both x-ray and gamma ray sources. DRT that is the focus of this report is to be distinguished from digitized radiography, which consists of the digitization of exposed film. DRT currently uses one of the following types of detectors (Mishra et al. 2007):
• Storage phosphor plates (so-called “Computed radiography or CR”). This technique uses the concept of photostimulated luminescence. Exposure of a phosphor plate to radiation results in charges being stored in the crystal lattice of the phosphor material. The amount of charge stored depends on the radiation dose received; the resulting stored charges constitute a latent radiographic image. Subsequent illumination of the detector with visible laser radiation releases the stored charges which emit luminescence at wavelengths that depend on the chemical composition of the phosphor. The readout procedure consists of a scanning laser that interrogates each pixel (location) on the phosphor plate, and a camera that records the amount of luminescence (Figure 3.1). Software controllers integrate the sequential data into an image. The latent image, which may be stored for long periods (several hours), is erased by exposing the plate to white light, after which the plate may be reused. The panels themselves can be flexible and used everywhere in place of film. In this report, these detectors will be referred to as CR detectors, and the technique as computed radiography.
(a) http://www.dwgndt.org/fwgidr.htm

3.2
Figure 3.1. Principle of Computed Radiography
• Indirect digital detectors (scintillation detectors or scintillators). Scintillators are materials that can convert x-radiation photons to visible light photons (Figure 3.2). Common scintillator materials include thallium-doped cesium iodide (CsI-Tl) and cadmium telluride. These scintillators are integrated with imagers such as amorphous silicon, charge coupled devices or CMOS photodiodes, to obtain a radiographic image. The imager makes use of the photoelectric effect, wherein certain materials will release electrons when exposed to light. The number of electrons released is proportional to the amount of light and, therefore, to the radiation dose. The difference between the three imagers is predominantly in the read-out electronics and formation of the final radiographic image.
• Direct digital detector arrays (DDA). Direct conversion digital detectors use materials that release electrons when exposed to radiation. No visible light is generated. Typical DDA use amorphous selenium, with integrated charge collection and read-out layers (Figure 3.2). While the spatial resolution of these systems may be high, the conversion efficiency (i.e., amount of charge generated per MeV) is not as high as those achieved by the scintillation detectors. In this report, scintillators and DDA will be referred to as digital detectors.

3.3
Figure 3.2. Direct and Indirect Conversion of Radiation (Mishra et al. 2007)
In CR and scintillation detectors, the visible light generated tends to diffuse in all directions, resulting in blurring and limiting the resolution that may be achieved. While CR detectors can be flexible, both scintillation and DDA detectors are typically formed as flat panels, with a detector (or scintillation and photoconversion) layer and charge-readout layer. Additional electronics (such as amplifiers) can be built into the panel for improved SNR. The drawback of the flat panels is their rigidity; that is, they cannot be bent to conform to the shape of the object being tested.
The primary advantage of DRT detectors is that the same detector can be used again and again without incurring costs related to consumables such as film. However, the lifetime of these detectors is limited by factors such as cumulative radiation dosage. CR detectors can typically be used up to about 10,000 times, and can be used in inspections requiring high-radiation dosages. Digital detector flat panels have to be restricted to low dosages (typically less than 250 keV) to avoid damage (Ewert et al. 2005; Mishra et al. 2007) and have typical lifetimes of about a 1000 cycles. However, digital detectors have very high sensitivity (higher than film), so exposure times can be kept low. Digital detector flat panels also require special handling (low dust/humidity, even temperatures, etc.) so utility and life of the panels may be low in practical industrial settings unless special precautions can be taken (Shepard 2006).
The performance parameters for DRT are defined using parameters such as the Modulation Transfer Function (MTF), the limiting spatial resolution (LSR), and the detector quantum efficiency (DQE). The MTF defines the contrast as a function of spatial frequency (defined in terms of line pairs per mm), with the LSR corresponding to the spatial frequency at which the contrast is insufficient to distinguish between the lines. The DQE is a measure of the SNR (or equivalently, the contrast-to-noise ratio – CNR). Details of these (and other) parameters are provided in Appendix A. Note that these parameters are related to each other (Mishra et al. 2007).
3.2 Inspection Procedures
The basic procedures for radiography using digital detectors are similar to those using film. DRT also requires access to both sides of the specimen, with minimum/maximum source-object and object-detector distances necessary to keep the geometric unsharpness below permissible limits. The procedures for DRT

3.4
also call for the use of IQI to ensure adequate image quality (Ewert and Zscherpel 2000; Ewert et al. 2007a). Differences in the procedure arise from the unique characteristics of digital detectors. For instance, the speed of digital detectors is much higher than that of film, resulting in faster exposures (Pincu and Kleinberger 2009). Other differences arise due to the unequal responses of the different pixels in digital detectors. A calibration step is usually necessary to address this issue. However, the large dynamic range of digital detectors ensures that a single exposure can capture information that typically requires multiple exposures when using film.
3.3 A Comparison of Film and DRT
3.3.1 Reliability of DRT
Table 3.1 summarizes the advantages and disadvantages of film, CR and digital detectors for industrial inspection. The information in the table is collected from several sources (Ewert 2002; Light 2004; Ewert et al. 2005; Mishra et al. 2007; Ewert et al. 2008; Zapata et al. 2008; Marinho et al. 2009; Pincu and Kleinberger 2009). Table 3.2 provides a summary of the various issues that impact detection reliability in DRT.
The information in the table should be interpreted with caution. Almost all of the studies cited above draw conclusions based on a limited set of flaws. Moreover, the experimental conditions (such as detectors, source strengths, specimen thicknesses, etc.) are not the same across all of these studies. With these caveats, some general trends may be observed. First, detection sensitivity in DRT is a complex function of several variables. Understanding how each of these variables impact the sensitivity is important to obtaining high-quality radiographs. Characterization of the detector response, either experimentally or through simulation (Jensen and Xu 2003), may be necessary to ensure that appropriate calibration [such as the multi-gain calibration procedure shown in Figure 3.3 (Marinho et al. 2009)] can be performed to address any pixel-to-pixel or detector-to-detector variability. Assuming that all such variables are properly accounted for, and that the inspection setup has been appropriately determined, then it appears likely that DRT using digital detectors can match (or better) the crack detection sensitivity of film RT. This result is achieved in spite of the poorer spatial resolution and contrast sensitivity of digital detectors. The use of post-processing [such as high-pass filtering – Figure 3.4 (Moreira and Simeies 2007)] can further improve contrast sensitivity and detection reliability. On the other hand, current CR technology does not appear to match the detection sensitivity of film RT, and further developments in this technology may be necessary. Micro-focus x-ray systems, with projection magnification, may be used to improve the resolution and detection sensitivity of DRT systems (Ewert 2002; Blakeley and Spartiotis 2006; Jaenisch et al. 2007; Ewert et al. 2008; Harara 2008). The studies related to the use of lead screens (Beckmann et al. 2008) indicate that optimization of code requirements may be necessary prior to wide-spread use of these technologies. Of course, the use of screens is useful in reducing backscatter radiation while enhancing the radiograph (Wendt et al. 2003).

3.5
Table 3.1. Advantages and Disadvantages of Film, CR, and Digital Detectors
Issue Film CR Digital Detectors Relevant References Mechanical Flexibility
Yes Yes No
Ewert (2002), Light (2004), Pincu and Kleinberger (2009)
Packaging Dust/water proof Dust/water proof N/A Storage/Shelf Life of Radiograph
In excess of 50 years (potentially over 500 years)
Digital image may be stored indefinitely(a)
Digital image may be stored indefinitely(a)
Readability Independent of data format
Potential dependence on data formats
Potential dependence on data formats
Cost of Consumables
High Low Low
Ewert (2002), Light (2004), Pincu and Kleinberger (2009)
Dose Sensitivity
Low-Medium High High
Exposure Time/ Dose Rates
High Low Low
Reuse of Media No Yes(b) Yes(c) Direct Digital Storage of Data
No(d) Yes Yes
Image Enhancement
No(d) Yes Yes
Interpretation Visual Visual/Automated Visual/Automated Light (2004), Zapata et al. (2008)
Noise Depends on film grain; can be very low
Potential for higher noise (structure noise)
Potential for higher noise Ewert et al. (2008)
Other Issues Potential for erasure problems in HD-CR, require delicate handling
Need a “clean” environ-ment (dust/humidity free); heating problems; calibration needed to correct pixel-pixel variation/bad pixels Ewert (2002),
Ewert et al. (2005), Mishra et al. (2007), Marinho et al. (2009)
Saturation at High Dose Levels
Unlikely Likely Very likely(e)
Spatial Resolution (pixel pitch)
High (small) Medium (medium) Low (high), may require microfocus systems to achieve high detection reliability
(a) Digital storage media can degrade over time. (b) CR requires a secondary processing stage, where the exposed phosphor plates need to be scanned using a
specialized scanner. The phosphor plates may be reused after they have been erased using the scanner. (c) Detector degrades over time, so there is a limit on number of times the detector can be reused. (d) Digital storage of film and enhancement of the image is possible only if a high-resolution scanner is used to
digitize the exposed film, after the film has been processed. (e) Digital detectors can be reset (zeroed) when they approach saturation. This may be a potential advantage
when using RT for in-service inspection in areas where high background radiation levels are present.

3.6
Table 3.2. Issues Impacting DRT Detection Reliability
Issues Impacting Reliability Key Findings: CR
Key Findings: Digital Detectors Relevant References
Dynamic Range Higher than film Higher than film Ewert et al. (2005) SRb Lower resolution than film
(pixel pitch of HD-CR on the order of 25 µm). LSR for HD-CR at best 20 lp/mm (508 lp/in.), while CR has 5 lp/mm (127 lp/in.) typical. HD-CR can meet EN Class-B requirements; CR may not be able to meet even EN Class-A requirements.
Lower resolution than CR (pixel pitch 50–100 µm (1.96–3.94 mil) at best, 100–200 µm (3.94–7.87 mil) typical). LSR of 5 lp/mm (127 lp/in.) typical.
Mohr and Bueno (2002); Spartiotis et al. (2003, 2004, 2005); Mishra et al. (2007); Beckmann et al. (2008); Ewert et al. (2008); Marinho et al. (2009)
MTF and LSR LSR less than that of film (MTF is narrower than that of film), implying lower contrast sensitivity.
LSR less than that of film (MTF is narrower). This implies lower contrast sensitivity.
Howard (2001); Mohr and Bueno (2002); Spartiotis et al. (2003, 2004, 2005); Mishra et al. (2007); Marinho et al. (2009)
Contrast Sensitivity
Generally lower than that of film. Among CR detectors, higher resolution (HD-CR) has better contrast sensitivity under similar exposure conditions. Smaller changes in contrast sensitivity for varying thickness, due to larger dynamic range.
Generally lower than that of film (under identical condi-tions). Higher resolution provides better contrast sensitivity under similar exposure conditions. Smaller changes in contrast sensi-tivity for varying thickness, due to larger dynamic range.
Howard (2001); Lu et al. (2003); Marinho et al. (2009)
Dose and Dose Rate, Exposure Setting
Lower dose rates required than film. Under identical conditions, film has higher sensitivity leading to higher quality (Class B).
Lower dose rates than film. For the same dose rates, DRT using digital detectors had better detectability than film.
Beckmann et al. (2008); Ewert et al. (2008); Marinho et al. (2009)
Thickness of Specimens
Limitations in dose rates and resolution may limit applicability of CR to thick specimens.(a)
Limitations in dose rates and resolution may limit applicability of DRT using digital detectors for thick specimens.(a)
Ewert et al. (2005); Beckmann et al. (2008); Ewert et al. (2008); Marinho et al. (2009)
Increased Exposure Time
Can saturate detector. Structure noise becomes apparent at longer exposures.
Can saturate detector. However, can improve SNR by resetting sensors periodically, and averaging over multiple images.
Ewert et al. (2008)
Front Lead Screens
Decrease contrast sensitivity and degrade image quality
Beckmann et al. (2008); Ewert et al. (2008); Marinho et al. (2009)
Post Processing Improved sensitivity (by about 1–2 wire pair IQI)
Moreira and Simeies (2007)
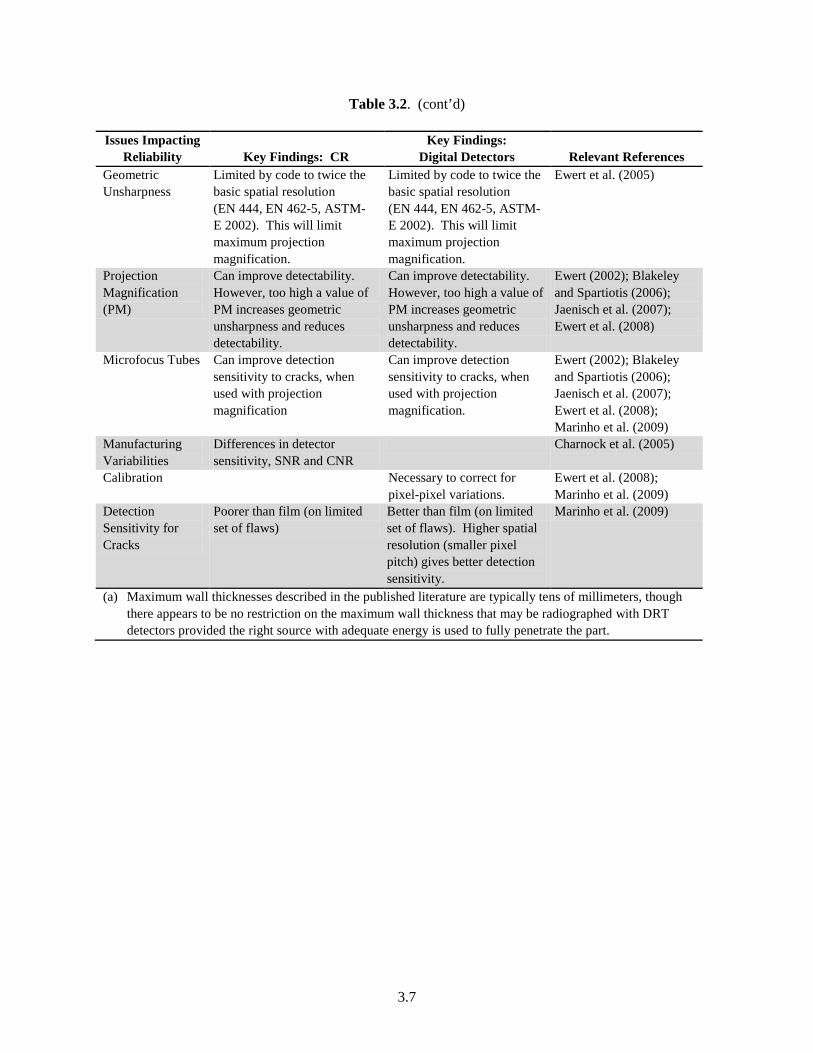
3.7
Table 3.2. (cont’d)
Issues Impacting Reliability Key Findings: CR
Key Findings: Digital Detectors Relevant References
Geometric Unsharpness
Limited by code to twice the basic spatial resolution (EN 444, EN 462-5, ASTM- E 2002). This will limit maximum projection magnification.
Limited by code to twice the basic spatial resolution (EN 444, EN 462-5, ASTM-E 2002). This will limit maximum projection magnification.
Ewert et al. (2005)
Projection Magnification (PM)
Can improve detectability. However, too high a value of PM increases geometric unsharpness and reduces detectability.
Can improve detectability. However, too high a value of PM increases geometric unsharpness and reduces detectability.
Ewert (2002); Blakeley and Spartiotis (2006); Jaenisch et al. (2007); Ewert et al. (2008)
Microfocus Tubes Can improve detection sensitivity to cracks, when used with projection magnification
Can improve detection sensitivity to cracks, when used with projection magnification.
Ewert (2002); Blakeley and Spartiotis (2006); Jaenisch et al. (2007); Ewert et al. (2008); Marinho et al. (2009)
Manufacturing Variabilities
Differences in detector sensitivity, SNR and CNR
Charnock et al. (2005)
Calibration Necessary to correct for pixel-pixel variations.
Ewert et al. (2008); Marinho et al. (2009)
Detection Sensitivity for Cracks
Poorer than film (on limited set of flaws)
Better than film (on limited set of flaws). Higher spatial resolution (smaller pixel pitch) gives better detection sensitivity.
Marinho et al. (2009)
(a) Maximum wall thicknesses described in the published literature are typically tens of millimeters, though there appears to be no restriction on the maximum wall thickness that may be radiographed with DRT detectors provided the right source with adequate energy is used to fully penetrate the part.

3.8
Figure 3.3. Multigain Calibration Technique in DDAs (from Marinho et al. 2009). Copyright 2009,
The American Society for Nondestructive Testing, Inc. Reprinted with permission from Materials Evaluation.
Figure 3.4. Effect of High-Pass Filtering for DRT Image Enhancement (from Moreira and Simeies
2007): (a) DRT image of cracks and (b) DRT image after a 17×17 high-pass filter is used. Enhancement of crack images can be seen.

3.9
In NDE, performance is often specified in the form of POD, probability of false calls (PFC), and/or probability of rejection (POR). POD or POR curves may be used to evaluate individual systems. Alternatively, plotting POD vs. PFC gives the receiver operating characteristic (ROC) curve that demonstrates the tradeoff between increased detection rates and increased false-call rates. Few studies exist reporting the POD of DRT systems for weld-flaw detection. One such study is based on simulation (Jaenisch et al. 2007), and is focused on the inspection of seal welds for pore detection (Figure 3.5) using high-energy (9 MeV) x-rays, with a collimated 2048 pixel line detector. Incidence angle is at 35 degrees. The study shows high POD for flaws greater than 2 mm (0.08 in.) in size, when the SNR is held constant (Figure 3.6). It must be pointed out that the analysis uses only contrast as the feature of interest; in practice, other pieces of information are used by the operator, and therefore, this analysis is probably conservative. Several other factors also affect the POD (Mohr and Willems 2008), and that a higher resolution detector is not always the optimal detector for a problem. In fact, based on a theoretical model of detection in CR systems, it appears that a medium-resolution CR system will perform better (higher
Figure 3.5. Radiographic Set Up. Virtual scene (left) and schematic (right). Reprinted with permission
from Jaenisch et al. (2007). Copyright 2007, American Institute of Physics.
Figure 3.6. Theoretical POD for Different Thresholds. Reprinted with permission from Jaenisch et al.
(2007). Copyright 2007, American Institute of Physics.

3.10
POD and better normalized SNR (nSNR)) at lower dose levels, while at higher dose levels, medium- and high-resolution CR panels will have roughly equal performance (equal nSNR and correspondingly equal POD) (Mohr and Willems 2008).
3.3.2 Status of Standards and Regulatory Guides for DRT in 2009
Currently, standards (ASTM E2007) and codes (EN 14784, and Mandatory Appendix VIII of Section V, ASME BPVC) for weld inspection using CR have been developed in the United States and Europe. The European codes split the testing into two classes (A and B), with differing quality requirements. Requirements on contrast sensitivity, nSNR, and basic spatial resolution (SRb) are specified, based on such quantities as the source energy and specimen density/thickness. The ASME Code specifies contrast sensitivity only through the use of IQIs.
The standards for DRT are a work in progress. The only standard to date related to DRT is ASTM E 2597 (Standard Practice for Manufacturing Characterization of Digital Detector Arrays) (Marinho et al. 2009). The Federal Working Group on Industrial Digital Radiography has also published two white papers dealing with recommended training for digital radiographic level III operators (FWGIDR 2009b), and recommended guidelines for qualification of digital radiography systems and processes (FWGIDR 2009a), based on currently available codes and standards.
3.4 Performance-based Criteria for Film and Digital Radiography
Traditionally, RT inspection has been performed to workmanship standards that have focused on detecting and identifying volumetric inclusions in construction and fabrication welds. The detection performance of RT is due to a combination of the instrumentation settings (source, detector, exposure time, etc.) and operator performance. In the case of film RT, film processing also plays an important role (Lapides 1983) in detection performance. Few round-robin studies exist that explicitly separate the effect of each of these contributors to the final result. However, since the publication of ASME BPV Code Section XI, Appendix VIII (Performance Demonstration), U.S. utilities have had wide-ranging experience in ultrasonic performance demonstration (Willetts and Ammirato 1987; EPRI 1988; Ammirato et al. 1993; Bollini 1994; Miller 2008). The experience gained during the development and implementation of ultrasonic performance demonstration can potentially inform and guide the discussion on performance-based criteria for RT.
There have been a number of studies on NDE reliability in general (Singh 2000), and on human factors in NDE reliability in particular (Fucsok 1998; Dymkin and Konshina 2000; Rummel 2004). NDE reliability is a function of several variables, including the so-called application variables and human factors. All of these variables need to be controlled sufficiently if the reliability of the technique is to be improved (Fucsok 1998; Dymkin and Konshina 2000; Rummel 2004; Rebello et al. 2006). Several studies on the role of human factors in NDE reliability conclude that factors such as age and experience contribute little to the overall performance of the operator (Stephens Jr. 2000; Enkvist et al. 2001). It is likely that factors such as training, fatigue, and likelihood of flaw occurrence in field conditions all play some role in the poor reliability of NDE in general (Aldrin et al. 2006), though a major contributor appears to be flaw-to-flaw variability (Wang et al. 2006). Studies conducted as a part of PISC III Action 7 on human reliability (Murgatroyd 1994) also point to similar issues impacting variations in technical skills of operators. In addition, the decision-making process of operators appears to be key to

3.11
the reliability analysis (Enkvist et al. 2001). These and several other studies (Spanner et al. 1986; Triggs et al. 1986) point to the need for strategy-based training and qualification that improves the decision-making process (Stephens Jr. 2000).
Quantification of the effects of human factors on reliability and costs may be done using probabilistic models. Aldrin et al. (2006) discuss a parametric probability model for human factors and show a case study related to costs and probability of failure, for variations in the parameter values. The variations are tied to different human factors (skill, training, etc.). For instance, random missed calls may indicate poor focus or a bias in the expected frequency of finding flaws. The simulated case study indicates that such models can provide insight into the reliability of NDE and potentially identify the factors that impact POD.
In evaluating the role of the operator in RT effectiveness and reliability, existing round-robin studies need to be evaluated for the operator contribution to RT detection reliability. This amounts to separating out the impacts on detection performance due to the technique (RT procedure) and the operator. While it is not clear if these can be separated out completely (Dymkin and Konshina 2000), one possible approach is to fix the technique and have many operators evaluate the same data, and use (Spanner et al. 1986; Triggs et al. 1986) ROC curves to quantify reliability. This modular validation approach (Nockemann et al. 1997) will provide a basis for the variations in detection reliability due to operator training, experience, and background. Such studies are limited, with one such study (using film RT) reported in Fucsok et al. (2002). The results show that operator-specific ROC curves have some differences based on age/experience. New and mid-career operators seemed to have the poorest performance. However, the differences do not seem to be significant (though no formal statistical analysis is performed). Individual motivation and education were hypothesized as accounting for any differences.
There do not appear to be any studies on human factors specific to DRT. It is assumed that the role of human factors in detection reliability of DRT will be similar to that in film RT. However, factors such as the higher sensitivity of digital detectors as well as the availability of image enhancement routines can impact the overall detection reliability. A lack of adequate training for operators in DRT principles is likely to play a decisive role in the POD of individual inspectors, though studies confirming or disproving this are lacking. However, training for Level III operators was identified as an important issue impacting the transition to DRT (FWGIDR 2009b). Such training and qualification could potentially include the use of virtual or theoretical models (Chapman 1995). Note that the discussion on detection performance in DRT also points to the interrelated nature of the experimental parameters necessary to make good quality radiographs. While the codes for DRT methods are not complete [or could be improved (Beckmann et al. 2008)], they are an important step in achieving quality radiographs.
While not conclusive in any manner, the studies cited above, when taken together, seem to indicate that a key component to improving detection performance in any inspection method should be the training received by the operators. The vast body of experience in UT performance demonstration for NPP ISI also seems to indicate that qualification (through performance demonstration) is only one component of improving reliability of inspection. Improving inspection reliability requires that the operator properly execute procedures in the field. Additionally, the application must be within the scope of the procedure qualification, including access and geometric conditions (Miller 2008). In the case of RT in particular, it appears that there is room for misinterpreting standards and codes (Reynolds and Crouse 2009), resulting in inaccurate dispositioning of flaws, and therefore, a continuous process that incorporates both qualification and appropriate training may be necessary.

3.12

4.1
4.0 Replacement of RT with UT – A Literature Survey
Replacement of one NDE method with another is a complex process. The key factors (Forli 1995) that must be considered before replacement include:
• The flaw detection capabilities of the replacement method are similar to (or better than) the reference method (radiography).
• The false call rate of the replacement method is, at worst, the same as that of the reference method (and in practice, is significantly lower than that of the reference method).
• The costs of the replacement method are similar to, or lower than, the costs of the reference method.
• Procedures (for inspecting the parts, and qualification of the system, process and operator) for the replacement method exist, and are easy to follow and implement.
In this section, a comparison of the technical capabilities of RT and UT is provided, along with a discussion of some of the factors that must be considered prior to replacement of RT. The technical capability review is based on an extensive literature survey of studies on UT/RT capabilities and potential for RT replacement with UT.
4.1 Replacement of RT with UT – Current Status of Round-Robin Studies
Any discussion on replacement of RT with UT must consider both the detection and sizing capabilities of the two methods. Flaw detection is a primary consideration, and as such, most of the literature on replacement has been focused on detection performance. The fact that radiography has challenges in accurately sizing flaws also appears to have played a role in this focus on detection. This section reviews the available literature comparing the detection and sizing performance of RT and UT.
The key factor in replacement of one method with another is the POD. Several round-robin studies have been conducted that compare the POD for ultrasonics with RT. While some conclusions relative to POD can be drawn from these studies, some caution must be exercised since the data from these studies are sometimes contradictory. In most cases, the studies should not be directly compared because each study is set up differently (different geometries, materials, experimental parameters, etc.) and addresses a different need (usually specific to a particular industry; Shackleton 1987). The assessed values of POD are also specific to the geometry/application, and cannot be generalized to other geometries. For instance, round-robin studies on flaw detection in mild steel will not be applicable to dissimilar metal welds. An incomplete list of factors affecting the POD is presented in Table 4.1 (Forli 1998). While a direct comparison is therefore not advisable, the studies can be used to obtain general conclusions on the detection rates of UT and RT. With these limitations in mind, a summary of the various round-robin studies that compare UT and RT are provided in Table 4.2. Each study is described with relation to the type of specimens, details of the techniques compared, and a summary of the results. A discussion summarizing all of the results, and identifying specific conclusions follows.
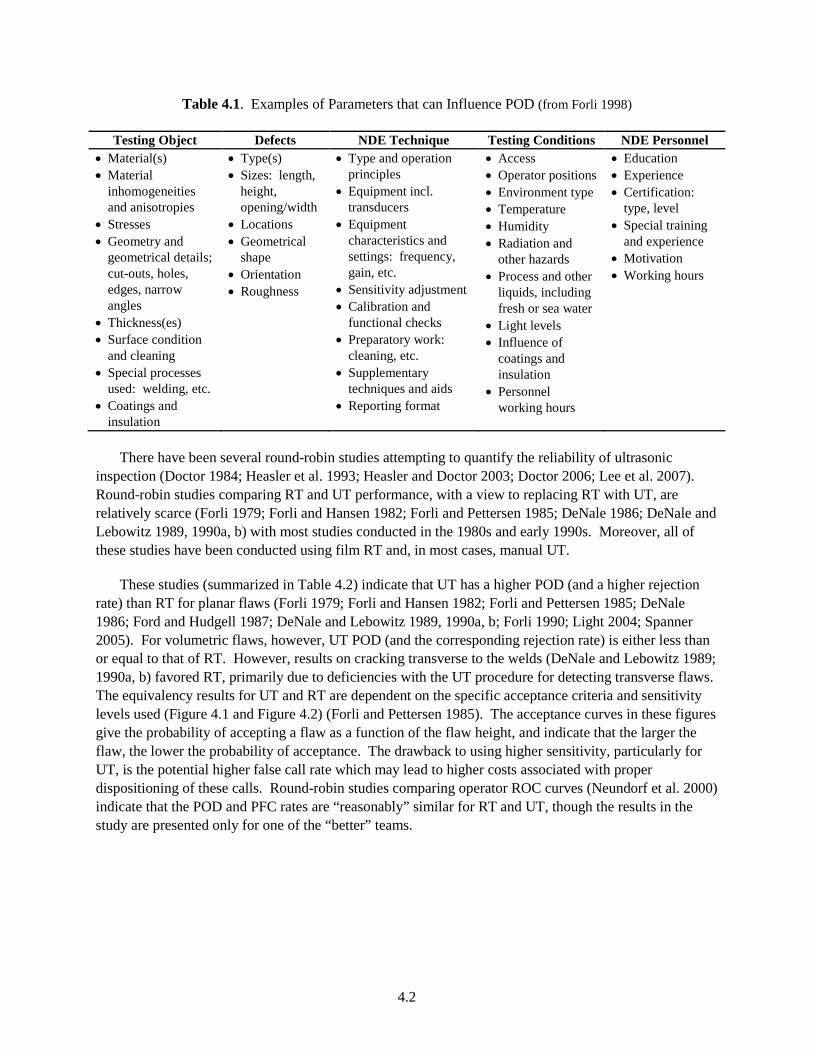
4.2
Table 4.1. Examples of Parameters that can Influence POD (from Forli 1998)
Testing Object Defects NDE Technique Testing Conditions NDE Personnel • Material(s) • Material
inhomogeneities and anisotropies
• Stresses • Geometry and
geometrical details; cut-outs, holes, edges, narrow angles
• Thickness(es) • Surface condition
and cleaning • Special processes
used: welding, etc. • Coatings and
insulation
• Type(s) • Sizes: length,
height, opening/width
• Locations • Geometrical
shape • Orientation • Roughness
• Type and operation principles
• Equipment incl. transducers
• Equipment characteristics and settings: frequency, gain, etc.
• Sensitivity adjustment • Calibration and
functional checks • Preparatory work:
cleaning, etc. • Supplementary
techniques and aids • Reporting format
• Access • Operator positions • Environment type • Temperature • Humidity • Radiation and
other hazards • Process and other
liquids, including fresh or sea water
• Light levels • Influence of
coatings and insulation
• Personnel working hours
• Education • Experience • Certification:
type, level • Special training
and experience • Motivation • Working hours
There have been several round-robin studies attempting to quantify the reliability of ultrasonic
inspection (Doctor 1984; Heasler et al. 1993; Heasler and Doctor 2003; Doctor 2006; Lee et al. 2007). Round-robin studies comparing RT and UT performance, with a view to replacing RT with UT, are relatively scarce (Forli 1979; Forli and Hansen 1982; Forli and Pettersen 1985; DeNale 1986; DeNale and Lebowitz 1989, 1990a, b) with most studies conducted in the 1980s and early 1990s. Moreover, all of these studies have been conducted using film RT and, in most cases, manual UT.
These studies (summarized in Table 4.2) indicate that UT has a higher POD (and a higher rejection rate) than RT for planar flaws (Forli 1979; Forli and Hansen 1982; Forli and Pettersen 1985; DeNale 1986; Ford and Hudgell 1987; DeNale and Lebowitz 1989, 1990a, b; Forli 1990; Light 2004; Spanner 2005). For volumetric flaws, however, UT POD (and the corresponding rejection rate) is either less than or equal to that of RT. However, results on cracking transverse to the welds (DeNale and Lebowitz 1989; 1990a, b) favored RT, primarily due to deficiencies with the UT procedure for detecting transverse flaws. The equivalency results for UT and RT are dependent on the specific acceptance criteria and sensitivity levels used (Figure 4.1 and Figure 4.2) (Forli and Pettersen 1985). The acceptance curves in these figures give the probability of accepting a flaw as a function of the flaw height, and indicate that the larger the flaw, the lower the probability of acceptance. The drawback to using higher sensitivity, particularly for UT, is the potential higher false call rate which may lead to higher costs associated with proper dispositioning of these calls. Round-robin studies comparing operator ROC curves (Neundorf et al. 2000) indicate that the POD and PFC rates are “reasonably” similar for RT and UT, though the results in the study are presented only for one of the “better” teams.

4.3
Table 4.2. Summary of UT and RT Round-Robin Studies
Reference Purpose Techniques Component/Flaw Characteristics Results
Forli (1979, 1990); Forli and Hansen (1982); Forli and Pettersen (1985)
POD for UT and RT
• Manual UT (echo height from a 3-mm [0.12-in.] side-drilled hole)
• Film RT (IIW degrees)
• C-Mn mild steel, wall thickness up to 25 mm (0.98 in.)
• Up to 13 mm (0.51 in.) in height w/ average at 2.5 mm (0.10 in.), types included porosity, slag inclusion, incomplete penetration, lack of fusion, crack, and other
• POD is dependent on acceptance criteria • The higher the sensitivity, the higher the detection rate • UT tends to detect more flaws than RT • Detection of incomplete penetration, slag, and cracks were
similar for UT and RT • Detection of LOF is better in UT, detection of porosity is
better in RT
DeNale (1986); DeNale and Lebowitz (1989, 1990a, b)(a)
UT/RT ability to detect flaws of different types and sizes, accept and reject criteria, repeatability of methods
• Manual UT (PE)
• CAUT (PE) • RT (x-ray,
Co-60, Ir-192/ type M and AA film)
• 38.1-mm (1.5-in.) thick, steel test plate, SMAW and GMAW
• Types include slag, LOF, incomplete penetration, cracks, and porosity
• UT detected and rejected more planar flaws, while UT and RT were comparable for detection/rejection of volumetric flaws
• CAUT w/ experience operator outperformed all methods, followed by MUT, CAUT, and RT
• RT detected transverse cracking better than UT because the UT beam was perpendicular to the weld
• Lower-energy or finer-grained film gave a greater detection rate for RT
Ford and Hudgell (1987)
Not a round robin but a good comparison between various UT Techniques and film RT
• PE UT • X-ray RT • TOFT UT,
ideal lab conditions
• 5-mm (0.20-in.) thick, 316 stainless steel plate, manual metal arc (MMA) weld
• Types include lack of penetration, lack of fusion and crack
• Length: 7–120 mm (0.28–4.72 in.)
• Depth: 1–45 mm (0.04–1.77 in.)
• X-ray RT and PE UT best techniques to use for austenitic welds, RT smallest size 1–2 mm (0.04–0.08 in.), PE UT 2–3-mm (0.08–0.12-in.) depth
• RT and PE UT not adequate for flaw height detection • PE UT better than RT at detecting planar flaws and
identifying flaw types • TOFT signal-to-noise poor on austenitic welds, not
recommended for flaw detection • TOFT better at detecting flaw height although location of
flaw was required due to SNR

4.4
Table 4.2. Continued
Reference Purpose Techniques Component/Flaw Characteristics Results
Spanner (2005)(b) Not round robin, technical justification for replacing RT with UT
• Manual UT • Automated
UT • RT • (Blind
conditions)
• Ferritic pipe – 355.6-mm (14-in.) dia., 19.05–27.79-mm (0.75–1.094-in.) thick, 406.4-mm (16-in.) dia., 21.44-mm(0.844-in.) thick
• Lack of fusion, porosity, slag, concavity, and incomplete penetration
• Automatic UT and MUT length sized within ASME performance demonstration limits (19.05-mm [0.75-in.] root mean square error)
• POD for flaws greater than 10.16 mm (0.4 in.) was 100% where shorter flaws (6.35–9.14 mm [0.25–0.36 in.]) had a POD around 76%
• UT was able to detect most reliably the planar flaws • UT results were better than RT • Automated UT able to reproduce images for later
comparison Neundorf et al. (2000, 2002)(b,c)
Gain information on the feasibility of evaluation methods and on influential parameters of NDE
• UT • RT (film and
digitizing film)
• DRT
• Austenitic pipes and pipe-elbow connections
• Service induced cracks, defects varied from 2.5–25% TW
• RT detected more than 85% of the 25% TW flaws w/ false calls <0.1
• RT detection of 2.5% TW flaws is around 55% • UT detected more than 80% for 25% TW w/ false calls
slightly more than 0.1 • UT detection of 2.5% TW was around 60% • Both UT and RT experience worse results for materials
fabricated in the 1970s as opposed to the 1980s results Light (2004) Replace RT with
UT for removal of sources from environment
• UT imaging camera
• Film RT • DRT
• 5 steel plate with thickness ranging from 12.7–28.6 mm (1/2 to 1-1/8 in.)
• Round-bottom holes and surface notches
• RT provides a clear, optical quality image • Real time imaging for RT but image quality is less than
film • UT inspector must be able to interpret A-scan • UT w/ digital visual imaging is lesser in quality than RT • UT is best at detecting debonds and planar defects
Brast et al. (1998) Report in German (from abstract only)
• UT • RT (film)
• 15 Austenitic piping welds, 150, 200, and 250 mm (5.91, 7.87, 9.84 in.) diameter, 8–18 mm (0.31–0.71 in.) thickness
• IGSCC, 20–25% TW
• UT detection rates ~70% comparable international round-robin tests
• RT false detection rates are better than international round robin
• Improvements were made by grinding welds, avoiding sharp notches at root, coaxial surfaces, reduce misalignment of edges

4.5
Table 4.2. Continued
Reference Purpose Techniques Component/Flaw Characteristics Results
Erhard and Ewert (1999)
• PE UT • TOFD UT • Film RT
• Thin plate and tubes (10-mm [0.39-in.] thick)
• Surface-breaking cracks – 3-mm and 5-mm (0.12 in. and 0.20 in.) notches
• Depth – 0.8–12 mm (0.03–0.47 in.)
• TOFD limits for surface-breaking crack cannot detect 2 wavelengths or less
• Planar tomography if using multiple angles, it can improve crack detection and depth sizing
• Recommended that another technique in addition to TOFD be used for defect detection
(a) Experience played a significant role in UT detection. (b) The teams were tested in a blind test. (c) Results in paper were from the best UT and RT teams.

4.6
Figure 4.1 Acceptance Curves for (a) Planar and (b) Volumetric Flaws (from Forli and Pettersen 1985,
reprinted with the kind permission of The British Institute of Non-Destructive Testing and the authors). In the figures, R2, R3, R4, R5 represent different radiographic acceptance criteria, with Rk meaning acceptance for IIW degree k or better. U20, U50, U100 represent different UT acceptance criteria corresponding to signal at 20%, 50%, and 100% of reference level (echo height from a 3-mm (0.12-in.) diameter side-drilled hole), respectively.
Figure 4.2. Acceptance Curves for Planar Flaws Based on two Different Acceptance Criteria (a) and (b)
(from Forli and Pettersen 1985, reprinted with the kind permission of The British Institute of Non-Destructive Testing and the authors). Equivalent acceptance criteria for RT and UT are shown in each figure. In each figure, the acceptance curves for different planar flaw types are shown, with lack of fusion (labeled “C”), incomplete penetration (“D”), and cracks (“E”). For instance, the curve labeled U50E corresponds to the curve for cracks, with ultrasonic acceptance criteria set to 50% reference level.
Note that the detection reliability of UT also depends on the specific UT technique used. Studies by the U.S. Navy (DeNale 1986; DeNale and Lebowitz 1989, 1990a, b) and EPRI (Spanner 2005) indicate that computer-assisted UT (CAUT), with an experienced operator, outperformed manual UT in detection and disposition rates, indicating that the repeatability and data recording capabilities of CAUT and

4.7
general automated UT are advantageous. Other studies comparing pulse-echo UT with TOFD conclude that pulse-echo UT has better detection and location capabilities (Ford and Hudgell 1987; Erhard and Ewert 1999). However, TOFD appears to have the advantage in depth sizing (Ford and Hudgell 1987) as long as the specimen thickness is greater than about 2 wavelengths (Erhard and Ewert 1999).
The literature comparing sizing capabilities of RT and UT is rather limited. RT, by its very nature, is difficult to apply for sizing a flaw and for locating a flaw in the through wall direction. Because RT produces a 2D image of a 3D object, only a size estimate in the direction perpendicular to the radiation beam may be obtained. For cracks, this means estimates of through-wall depth are very difficult to obtain unless one is using a multi-view approach where multiple angles of attack are used to radiograph the flaw (Redmer et al. 2002). For conventional (i.e., single-shot) radiographs, the flaw depth must necessarily be assumed to be the worst case (i.e., through-wall). Note that flaw depth and location estimates are more important when dealing with planar (cracking/lack of fusion) flaws. Flaw depth sizing is therefore an area where UT has a distinct advantage. Few depth sizing studies using RT have been performed, though comparisons of length estimates from RT and UT appear to provide similar results (Higuchi et al. 2004; Lozev et al. 2004; Lozev et al. 2005). These studies were performed on a limited set of flaws and do not constitute a true round-robin study. As discussed earlier, Ford and Hudgell (1987) presents data showing the relatively poor performance of RT on depth sizing and location of the flaw in the through-thickness direction.
4.2 ASME Code Acceptance of Replacement
To date, five ASME Code Cases have been published that allow the use of ultrasonic inspection in lieu of radiography for weld inspection. These code cases have not yet been approved by the NRC. These are:
• ASME Pressure Piping Code Case 168 (CC 168) “Use of Ultrasonic Examination in Lieu of Radiography for B31.1 Application” – Approved June 1997
• ASME Boiler and Pressure Vessel Code Case 2235-9 (CC 2235) “Use of Ultrasonic Examination in Lieu of Radiography Section I; Section VIII, Division 1 and 2; and Section XII” – Approved October 11, 2005
• ASME Pressure Piping Code Case 179 (CC 179) “Use of Ultrasonic Examination in Lieu of Radiography for B31.1 Applications in Materials ½ in. and Less in Wall Thickness” – Approved June 28, 2006
• ASME Boiler and Pressure Vessel Code Case N-659-2 (CC N-659) “Use of Ultrasonic Examination in Lieu of Radiography for Weld Examination: Section III, Division 1 and 3” – Revision 2 approved June 9, 2008
• ASME Boiler and Pressure Vessel Code Case N-713 (CC N-713) “Ultrasonic Examination in Lieu of Radiography” – Approved November 10, 2008
CC 168 and CC 179 apply to pressurized piping welds used in electric power generating stations in industrial and institutional plants, geothermal heating systems, and central and district heating and cooling systems that are covered under ASME Power Piping Code B31.1 (ASME 2007a). CC 2235 applies to construction of power boilers, pressure vessels, and transportation tanks under ASME BPV Sections I, VIII (Division 1and 2), and XII. CC N-659 and CC N-713 are the only two Code Cases that apply to

4.8
nuclear components. Under ASME BPV Code Section III, Division 1 and 3, CC N-659 focuses on fabrication and construction examinations applied to class 1, 2, and 3 components and storage and transportation containers for spent nuclear fuel and high-level radioactive waste. CC N-713 is applicable to welding and brazing repairs and replacements under ASME BPV Code Section XI, Division 1.
Although the application areas for these Code Cases are different, there are similar requirements in each of these Code Cases. The requirements include the use of automated ultrasonic systems, some type of performance demonstration on selected specimens, personnel qualification, and flaw acceptance criteria. CC N-659 and CC N-713 specifically reference performance demonstration in accordance with Section XI, Appendix VIII.
There appears to be little literature documenting the technical basis or user experiences with most of these Code Cases. The exceptions are CC 2235 and CC N-659. A technical basis for ASME CC 2235 is presented in Rana et al. (2000). The specified flaw acceptance standards, which are based on fracture mechanics, can eliminate unnecessary and costly repairs of meaningless imperfections found in the vessel fabrication. CC 2235 has been applied in several instances, and the experiences documented in the open literature (Goto et al. 2000; Yeomans and Davidson 2004). Comparisons between UT TOFD and RT (Goto et al. 2000) in thick-section ferritic steel welds appear to show equivalent or better detection performance (in terms of number and size of flaws detected) with UT TOFD. However, grouping of voids (porosity) may be interpreted as a crack using TOFD, or two small voids may be interpreted as an upper and a lower tip signal, and therefore additional confirmatory UT techniques such as pulse echo are necessary. A similar study (Yeomans and Davidson 2004) reports no performance or reliability data.
User experiences with CC N-659 are documented in Spanner (2005) and Henry (2008). CC N-659 has not been approved by NRC (Henry 2008) but has been used on a case-by-case basis mainly where logistical problems or component configuration have prevented the use of RT. The Code Case has been applied to field use for the inspection of a heat exchanger already delivered to the construction site where RT would require disassembling. Another application cited in Henry (2008) is for inspection of a transport cask encased in tungsten shielding which preclude the use of RT. No reliability data are presented; however, it is expected that a major challenge in using this Code Case will be to determine the number of anomalous indications (indications in addition to the expected flaws that are detected by UT) that can be tolerated from the standpoint of potential repairs.
4.3 Discussion
RT is an ASME-acceptable volumetric method for fabrication/construction inspection of welds and has been traditionally used for the detection of fabrication anomalies. UT has been the preferred volumetric method for pre-service and in-service inspection. Replacing RT with UT for fabrication inspection has an advantage in that the same method (with potentially the same acceptance criteria) is used for inspection throughout the lifetime of the component (Rana et al. 2000). There have been preliminary discussions in this regard at the new ASME Section III/Section XI Subgroup – Industry Experience for New Plants regarding the benefits of using the same technique(s) for inservice inspection that was used for fabrication of the component(s).
The different round-robin studies directly comparing RT and UT (and other related studies) also enable the following conclusions:
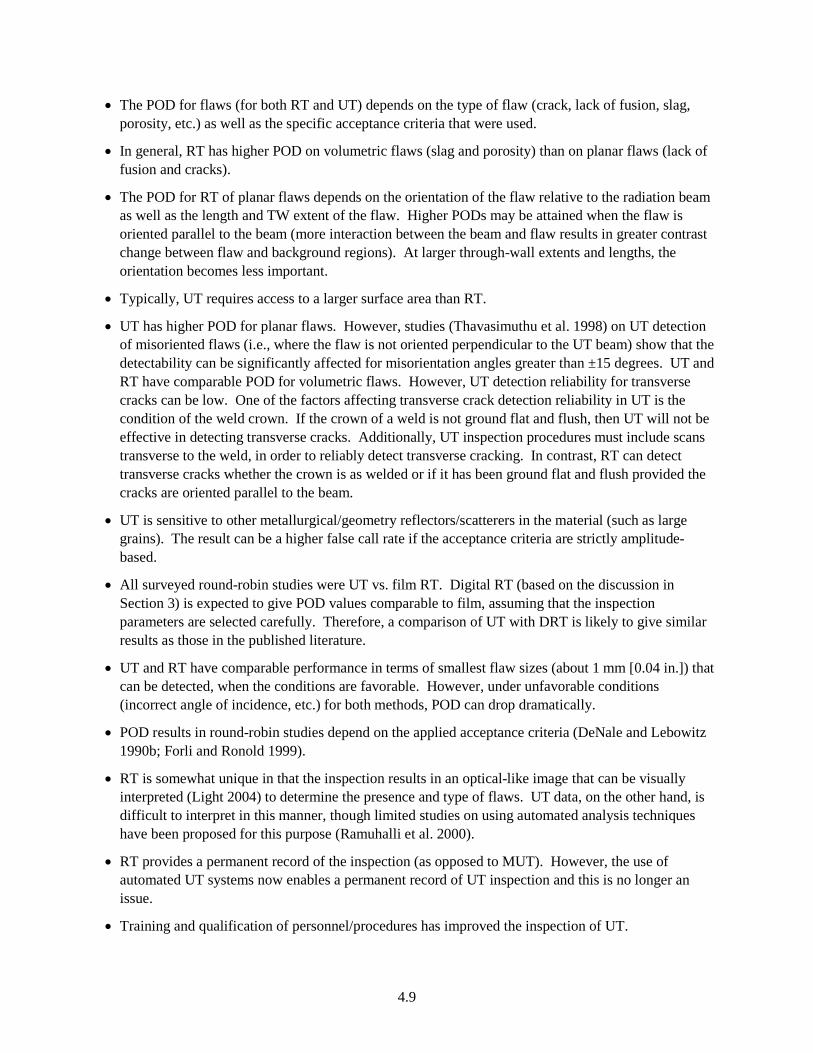
4.9
• The POD for flaws (for both RT and UT) depends on the type of flaw (crack, lack of fusion, slag, porosity, etc.) as well as the specific acceptance criteria that were used.
• In general, RT has higher POD on volumetric flaws (slag and porosity) than on planar flaws (lack of fusion and cracks).
• The POD for RT of planar flaws depends on the orientation of the flaw relative to the radiation beam as well as the length and TW extent of the flaw. Higher PODs may be attained when the flaw is oriented parallel to the beam (more interaction between the beam and flaw results in greater contrast change between flaw and background regions). At larger through-wall extents and lengths, the orientation becomes less important.
• Typically, UT requires access to a larger surface area than RT.
• UT has higher POD for planar flaws. However, studies (Thavasimuthu et al. 1998) on UT detection of misoriented flaws (i.e., where the flaw is not oriented perpendicular to the UT beam) show that the detectability can be significantly affected for misorientation angles greater than ±15 degrees. UT and RT have comparable POD for volumetric flaws. However, UT detection reliability for transverse cracks can be low. One of the factors affecting transverse crack detection reliability in UT is the condition of the weld crown. If the crown of a weld is not ground flat and flush, then UT will not be effective in detecting transverse cracks. Additionally, UT inspection procedures must include scans transverse to the weld, in order to reliably detect transverse cracking. In contrast, RT can detect transverse cracks whether the crown is as welded or if it has been ground flat and flush provided the cracks are oriented parallel to the beam.
• UT is sensitive to other metallurgical/geometry reflectors/scatterers in the material (such as large grains). The result can be a higher false call rate if the acceptance criteria are strictly amplitude-based.
• All surveyed round-robin studies were UT vs. film RT. Digital RT (based on the discussion in Section 3) is expected to give POD values comparable to film, assuming that the inspection parameters are selected carefully. Therefore, a comparison of UT with DRT is likely to give similar results as those in the published literature.
• UT and RT have comparable performance in terms of smallest flaw sizes (about 1 mm [0.04 in.]) that can be detected, when the conditions are favorable. However, under unfavorable conditions (incorrect angle of incidence, etc.) for both methods, POD can drop dramatically.
• POD results in round-robin studies depend on the applied acceptance criteria (DeNale and Lebowitz 1990b; Forli and Ronold 1999).
• RT is somewhat unique in that the inspection results in an optical-like image that can be visually interpreted (Light 2004) to determine the presence and type of flaws. UT data, on the other hand, is difficult to interpret in this manner, though limited studies on using automated analysis techniques have been proposed for this purpose (Ramuhalli et al. 2000).
• RT provides a permanent record of the inspection (as opposed to MUT). However, the use of automated UT systems now enables a permanent record of UT inspection and this is no longer an issue.
• Training and qualification of personnel/procedures has improved the inspection of UT.

4.10
A review of the literature also indicates that more recent automated submerged arc welding (SAW) is less likely to produce discontinuities when compared against the manual shielded metal arc welding (SMAW) process (DeNale and Lebowitz 1990b). Both SMAW and SAW processes can be used for axial and circumferential welds, while the electroslag process is sometimes used for axial welding. The SMAW process is more likely to result in volumetric flaws. A review of NDE data from the Pressure Vessel Research Users Facility (PVRUF) (PWR) and Shoreham (BWR) that are of significance to fracture mechanics indicate (Jackson et al. 2001) that the density of flaws in the PVRUF and Shoreham vessels is significantly greater than the predicted values, with the cumulative flaw rate of the Shoreham vessel material approximately three times greater than the PVRUF vessel material. Numerous small flaws were found on the fusion surfaces of the structural weld with the base metal, with the largest flaws being complex in shape and related to weld repair areas. The flaw density in the base material appears to be at least an order of magnitude smaller than that of the welds as expected because of float-out during ingot solidification and subsequent hot rolling. Data is not available for continuous cast slabs/plate. Crutzen et al. (1997) also documents information related to expected flaw density in welds. These, and other similar studies (Doctor et al. 1998), seem to indicate that the choice of NDE method should also depend on the expected type of flaw. While radiography is capable of detecting planar flaws, the detection sensitivity (as described earlier) is clearly dependent on too many uncontrollable factors. The strength of radiography is clearly in detecting volumetric flaws, and therefore, RT may be best for welds produced using manual welding techniques (DeNale and Lebowitz 1990b). Studies also indicate that UT will probably result in many more indications than RT (for instance, see Goto et al. 2000) during fabrication inspection. The cost of resolving and dispositioning these indications (potentially using additional NDE inspections) may be high. However, this added cost is not expected to be significant, when compared to the potential cost in addressing the same flaws during pre-service and in-service inspection.
There is also a potential issue of performance demonstration for UT inspection of fabrication/ construction welds. The current performance demonstration process is set up for ISI, and it is not clear if the current requirements for performance demonstration are adequate for new construction, particularly because inspection volumes will change for construction versus pre-service inspection/ISI.

5.1
5.0 Summary and Gap Analysis
This section presents an overview of an evaluation of the published literature to assess if it is adequate to support making changes to volumetric NDE methods:
• Is replacement of RT with UT for production/fabrication weld inspection a viable proposition?
• Are performance-based criteria necessary for DRT or film RT?
• What are the technical gaps that need to be addressed?
5.1 Equivalence of Film and DRT
The major conclusions that may be drawn from the studies (Neundorf et al. 2000, 2002; Light 2004) comparing DRT with film RT are:
5.1.1 Inspection Setup • The overall procedure for DRT inspection is similar to the procedure for film RT, with some
differences in the details (such as exposure time, film-focus distance, etc.).
• Code requirements may need to be revised, if CR quality has to be equivalent to that of film RT. If anything, DRT needs very different inspection conditions (exposure, screens, magnification, source-target-detector distances, etc.) to achieve high-quality inspection. It is not clear that the available codes to date allow DRT to reach full potential and further study may be needed to update the codes for these new technologies. Reduced emphasis on spatial resolution may be necessary, with more attention paid to the exposure and material thicknesses, to achieve equivalency (or better) to film.
• Proper calibration and correct exposure setting are an important factor in achieving high-contrast sensitivity in DRT, even with lower spatial resolution.
• Conclusion: Inspection procedures (such as distance and exposure time) used in film RT cannot be applied directly to DRT, and will need to be determined for NPP applications.
5.1.2 Detection Sensitivity • Under favorable conditions, the detection sensitivity of DRT using digital detectors is equivalent to
(or better than) that of film RT. The sensitivity of current CR system is typically somewhat worse than that of film RT due to issues with lower resolution, reduced contrast sensitivity, and the potential for higher structural noise.
• The use of image processing tools with DRT has the potential to improve flaw detection rates. However, no systematic studies have been conducted to date that identify the best approaches and document the improvements or limitations of these tools.
• Conclusion: CR sensors need further development to match the detection capabilities of film RT.
• Conclusion: The detection performance of DRT will need to be quantified, particularly for NPP applications.

5.2
5.1.3 Cost • The total cost of using DRT is typically lower than that of film RT, primarily due to reduced need for
consumables, and the potential for faster inspections (shorter exposures, wider dynamic range enables a single exposure where film might require multiple exposures).
• The use of a microfocus x-ray system is necessary with current DRT detectors, if high sensitivity is needed. Without the use of a microfocus system, the system resolution (i.e., the smallest flaw that can be seen in the radiograph) will be much larger (on the order of 1 mm (0.04 in.) in length). Note that a microfocus system will increase the total cost of DRT.
• Conclusion: DRT results in cost savings over film RT. However, the up-front costs associated with DRT may be higher.
5.2 Replacement of RT with UT for Production/Fabrication Inspection
The key comparables that will be analyzed in the context of replacement include:
1. Detection reliability of planar and volumetric flaws
2. Sizing reliability
3. Issues with inspectability
4. Human factors and ease of operator interpretation of NDE measurements
5. Record keeping
6. Health issues
7. Cost
The available literature has been reviewed in the previous sections. Based on this review, the following observations may be made.
5.2.1 Reliability
• Detection of Planar Flaws: Under typical inspection conditions, UT detection rates and POD appear to be similar to or better than RT detection rates and POD for planar flaws. Flaw rejection rates based on UT are somewhat higher than that from RT. However, this is seen to be a function of the specific acceptance criteria that are used, and the equivalence relations may change with the acceptance criteria. The fundamental issue of selecting appropriate acceptance criteria for UT in a fabrication/construction environment must be resolved. Note that simply using RT acceptance criteria for this purpose will not work because of the differing physics of the two inspection methods.
– Conclusion: The relevant studies may not be applicable to weld geometries typical in legacy NPP. Equivalent acceptance criteria must be defined for the NPP welds.
• Detection of Volumetric Flaws: Under typical inspection conditions, UT detection rates appear to be similar to RT detection rates for volumetric flaws. Again, this is a function of the specific acceptance criteria that are used, and the equivalence relations may change with the acceptance criteria.
5.3
– Conclusion: UT in lieu of RT is feasible for volumetric flaw detection. However, equivalent acceptance criteria need to be defined for NPP weld geometries.
• Sizing: Depth sizing reliability of UT depends on the specific UT technique used, such as PE, TOFD, etc. However, depth sizing using RT is difficult. Locating a flaw in the through-thickness dimension is also difficult using single-shot RT (though this is relatively easier when using UT). Length sizing reliability of RT and UT are about equivalent.
– Conclusion: RT and UT have roughly equivalent capabilities for length sizing. UT has a distinct advantage in depth sizing and through-wall flaw location.
5.2.2 Inspectability Issues
• UT and RT each have problems with specific types of geometries and materials. UT has significant issues in inspecting coarse-grained structures, as well as extremely thick materials where the acoustic attenuation is higher. RT has difficulties in inspecting very thick sections as well, although it does not appear to be as affected by coarse-grained material.
• RT requires access to a narrow band of base metal and weld on both sides of the specimen. UT can be used with single-sided access for ferritic and two-sided access for austenitic material.
• Areas that are indicated as strength for RT may be addressed by changes in scanning and surface conditions for UT.
• Speed of inspection is roughly equivalent (based on experience, although no specific studies have been found to support this).
• Portability of UT equipment is better than that of RT equipment. Additionally, set-up of UT inspections is potentially faster than that of RT inspections.
– Conclusion: In most cases, UT can potentially be used in lieu of RT with reduced inspectability issues.
5.2.3 Human Factors
• RT inspection records are seen as easier to interpret (because the record is optical-quality images). UT data interpretation is somewhat more difficult. However, both require significant examiner training because all volumetric NDE is very skill-dependent. However, advances in computer algorithms are addressing this.
– Conclusion: Replacement of RT with UT for construction/fabrication welds may require additional operator training and qualification.
5.2.4 Record Keeping
• RT (film or DRT) results in a permanent record of the inspection.
– Conclusion: UT in lieu of RT will require the ability to create and maintain a permanent record of the inspection (including all the data and the interpretations). This can be potentially achieved using automated UT.

5.4
5.2.5 Health and Radiation
• RT (film or DRT) will result in exposure of the RT technicians and operators to harmful radiation. The potential for radiation exposure also means that the inspection area must be closed off to other activities until the RT inspection is complete. RT inspection is also influenced by residual radiation in operating plant components. Typical no-go areas are on the order of 200 feet in diameter and several stories high (Spanner 2005). The use of UT has not been associated with any specific health issues.
– Conclusion: Replacement of RT with UT can potentially reduce health hazards.
5.2.6 Cost
• The use of DRT will result in reduced cost (when compared to film RT). However, the detection sensitivities for DRT are not fully quantified, particularly for thick-section welds. The replacement of RT with UT will further reduce costs due to a reduction in consumables as well as improved productivity that is expected to result with other activities allowed in the inspection area.
• There is very little data on potential repair costs if UT is used in lieu of RT. Flaw rejection rates are generally higher when using UT (DeNale and Lebowitz 1990b) and can potentially impact repair costs.
– Conclusion: The use of UT in lieu of RT can potentially reduce overall costs.
5.3 Performance Demonstration for RT
The experiences with performance demonstration to date indicate that the use of performance-based criteria for ISI have improved the overall reliability of the inspection. The issues that brought up the need for performance demonstration in UT are equally present in RT. Contributions to RT reliability arise from the procedure, the detector, and the operator (Lapides 1983). RT is somewhat unique in that the inspection results in an optical-like image that can be visually interpreted. The use of a prescriptive code (ASME Section III) to some extent removes variations in reliability due to procedure, and film quality and processing (although the literature survey seems to indicate that room for improvement exists in the Code). It is also clear from the literature that variations in detection reliability exist for different operators. In some cases, this may be due to the radiograph not showing the flaw clearly (the prescriptive codes could be improved in this case). However, in many other cases, the difference in reliability is clearly due to incorrect interpretation or dispositioning. The literature is somewhat mixed on this question, but the key points seem to be:
• Operators can err in interpreting the radiograph (i.e., miss indications that are clearly present) due to incorrect procedures (inadequate lighting, etc.). The assumption, of course, is that the correct procedures for inspection and processing were followed, and the procedures were capable of detecting the indication.
• Operators correctly identify an indication, but err in dispositioning the indication (improperly determine the type or severity of the indication) (Reynolds and Crouse 2009). In many cases, this may be due to incorrect interpretation of the Codes or reference radiographs used, for instance, in casting inspection.

5.5
• Differences in POD exist between different operators. Such differences may be due to experience and/or training, although this is not confirmed from the published studies. The studies to date in the literature seem to indicate that a key component to improving detection performance and reliability in any inspection method should be the training received by the operators.
– Conclusion: Some form of performance demonstration may be necessary to ensure RT reliability in the field, particularly for DRT. This can potentially include a combination of appropriate training and qualification tests.
5.4 Technical Gaps
Several issues remain unanswered, even with the extensive literature survey. These technical gaps are discussed below.
5.4.1 Replacement of RT with UT for Production/Fabrication Weld Inspection
• Expected Flaw Types: The likely types, locations, sizes, and number of flaws that are expected in fabrication/construction welds in typical NPP components needs to be determined for new construction. This information will drive the choice of an inspection method and likely play a key role in determining whether RT replacement with UT is feasible.
• Acceptance Criteria: Equivalence of UT and RT will depend on acceptance criteria including tolerances. Thus, this equivalence needs to be established and appropriate criteria need to be identified for UT fabrication inspection of geometries typically found in proposed U.S. NPPs. This issue will need to be addressed in conjunction with determining the desired detection performance on the expected flaw types in repairs and new construction.
• Technical Advances in UT and RT: The equivalence (or superiority of UT) is also dependent on the type of UT technique and equipment. Recent Code Cases specify the use of automated equipment to record the raw UT data; the specifications for such systems will need to be determined for NPP use. Comparisons using recent advances in automated UT would be helpful in determining the extent of replacement that is feasible. In addition, recent advances in DRT will need to be evaluated to determine the extent to which RT can be replaced by UT.
• UT Flaw Discrimination Capability: Currently, the ability to discriminate (and interpret) between different fabrication flaws (i.e., determine whether the flaw is planar or volumetric, and if so, determine its location and size) from UT measurements is limited, particularly in the presence of high levels of acoustic noise. Techniques for accurate classification of indications detected by UT are necessary for improving the reliability of UT and potential expansion of UT to fabrication/ construction inspections.
• ASME Code: After review of the current standards for UT and RT, there are clearly gaps in the Codes where guidance is needed on acceptance of using UT in lieu of RT for nuclear applications. The technical basis for some of the Code Cases has also not been fully established.
5.6
• Performance Demonstration for Fabrication/Production Inspection: Appropriate performance demonstration requirements for construction/fabrication inspection using UT need to be determined, since the inspection volumes and flaw types are potentially very different from pre-service/in-service inspection.
5.4.2 Replacement of Film RT with DRT
• Applicability to NPP Welds: The assumption that DRT and film RT have similar (or even identical) detection rates is based on various studies described in the literature. However, the applicability of the studies to NPP geometries has not been demonstrated.
• Reliability: Characterization of DRT performance (POD and length sizing reliability) on a statistically large and representative set of flaws/samples is needed. (UT performance on the same set of samples can potentially give mini-round robin data.) Detection sensitivity in DRT is a complex function of several variables. Understanding how each of these variables impact the sensitivity is important to obtaining high-quality radiographs.
• Code Acceptance: Review of the current standards for DRT clearly indicates that there are gaps in the Codes where guidance is needed for both computed and digital radiography for nuclear applications.
5.4.3 Performance-Based Criteria for DRT
• Operator Influence on Reliability: RT system performance depends heavily on the individual operator. Variations in experimental procedures and/or experience/motivation, etc. appear to have a strong influence on detection rates. There have been very few human factors studies in this regard and thus this effect cannot be quantified.
• Impact of DRT: It is difficult to determine whether use of a digital RT system will make any difference in operator interpretability (i.e., if the operator is very experienced with film RT, then does this experience carry over to digital RT?). In theory, experience with film should be portable to DRT, because the inspection physics are the same. In practice, the availability of enhancement tools in DRT, and resolution and SNR differences, may impact interpretation reliability. So far, studies have focused on showing (visually) that film and DRT give identical results (or that DRT gives superior results). There does not seem to be a systematic, unbiased study on the effect of DRT on operator performance, as well as statistically based POD estimates for DRT.
• Training: Appropriate training regimen for DRT operators need to be determined. The hypothesis is that appropriate training incorporating elements of performance demonstration should improve reliability.

6.1
6.0 Conclusions and Recommendations
Based on the literature survey, the following conclusions may be drawn:
• The inspection parameters and the POD for DRT inspection of NPP welds need to be determined.
• UT replacement of RT is feasible; however, the techniques for UT have to be specified or a performance standard needs to be defined. Potential parameters may include: UT technique (automated UT, or computer-assisted UT), probe (pulse-echo vs. phased-array vs. pitch-catch), angle of inspection (normal, angle beam), scan direction (perpendicular to weld and parallel to weld, to catch both axial and circumferential flaws), etc.
• UT acceptance criteria for fabrication/construction weld inspection must be defined based on fitness for service and not workmanship standards. Using acceptance criteria based on RT criteria is not good practice, because the physics of the two processes are very different.
• Some form of training (at a minimum) is necessary to ensure DRT reliability.
Following are issues requiring additional data before conclusions can be drawn:
• Detection reliability of DRT in nuclear power plant inspection.
– Optimizing DRT inspection setup for typical NPP component geometries.
– Quantify typical and best-case detection sensitivity and POD of DRT systems. Understand how the different inspection variables impact the sensitivity.
– Establish the role of human factors and to determine the level of training necessary for DRT operators. Quantify the effect of operator reliability in detection reliability.
– Establish the conditions for equivalence of DRT and film RT in typical fitness-for-purpose geometries.
– Address gaps in the Codes where guidance is needed for computed and digital radiography for nuclear applications.
• Establish guidelines in the ASME Code for the interchangeability of UT in lieu of RT (DRT and film RT).
• One way to provide the needed information for the above items would be to perform a mini-round robin for typical NPP geometries with known flaws, using automated UT, film RT, and DRT. The operational parameters could be controlled with specific procedures for inspection, data recording, and interpretation. The data and results could then be applied to:
– Compare UT system performance for Appendix VIII qualified personnel, equipment, and procedures.
– Compare POD, rejection rates, and sizing accuracy of UT, film RT, and DRT systems.
– Propose appropriate UT acceptance criteria for fabrication/construction inspection. This information can potentially contribute to future ASME Code revisions.
– Investigate techniques for interpreting UT inspection data and assess the capability to determine the type of flaw from UT measurements.
6.2
• Need to identify equivalent acceptance criteria after factoring in sizing tolerances between UT and RT techniques.
• Evaluate the effect of human factors in RT and DRT.
– A better understanding of the role of human factors is needed to determine the level of training necessary for DRT operators. This information is needed before it can be determined whether performance demonstration requirements are needed for RT (and in particular for DRT).

7.1
7.0 References
Ahmed S, CR Batishko, M Flake, MS Good, R Matthews, M Morra, PD Panetta, AF Pardini, GA Sandness, B Tucker, D. Weier, RL Hockey, JN Gray, LJ Bond, JJ Saurwein, RA Lowden. 2006. Nuclear Energy Research Initiative Final Report-Innovative Approaches to Automating QA/QC of Fuel Particle Production Using On-Line Nondestructive Methods for Higher Reliability. PNNL-15668, Pacific Northwest National Laboratory, Richland, Washington.
Aldrin JC, EA Medina, DA Allwine, M QadeerAhmed, J Fisher, JS Knopp and EA Lindgren. 2006. “Probabilistic Risk Assessment: Impact of Human Factors on Nondestructive Evaluation and Sensor Degradation on Structural Health Monitoring.” In 33rd Annual Review of Quantitative Nondestructive Evaluation, Volume 26, pp. 1461-1468. July 30–August 4, 2006, Portland, Oregon. American Institute of Physics, Melville, New York.
Almeida RM, JMA Rebello, AA Carvalho and J Smid. 2007. “Reliability of Radiographic Inspection of Steel Pipeline Girth Welds.” In 34th Annual Review of Quantitative Nondestructive Evaluation, Volume 27, pp. 1724–1731. July 22–27, 2007, Golden, Colorado. American Institute of Physics, Melville, New York.
Ammirato F, FL Becker, F Carr, K Huffman and JC Spanner Jr. 1993. “Performance Demonstration Initiative: U.S. Implementation of ASME B&PV Code Section XI Appendix VIII.” In 12th International Conference on Structural Mechanics in Reactor Technology (SMiRT 12), pp. 279–284. August 15–20, 1993, Stuttgart, Germany. Elsevier Science Publishers B.V.
Anderson MT, SL Crawford, SE Cumblidge, KM Denslow and AA Diaz. 2007a. Assessment of Crack Detection in Heavy-Walled Cast Stainless Steel Piping Welds Using Advanced Low-Frequency Ultrasonic Methods. NUREG/CR-6933, PNNL-16292, U.S. Nuclear Regulatory Commission, Washington, D.C.
Anderson MT, SL Crawford, SE Cumblidge, KM Denslow, AA Diaz and SR Doctor. 2007b. Assessment of Crack Detection in Heavy-Walled Cast Stainless Steel Piping Welds Using Advanced Low-Frequency Ultrasonic Methods. NUREG/CR-6933, PNNL-16292, U.S. Nuclear Regulatory Commission, Washington, D.C.
Anderson MT, SL Crawford, SE Cumblidge, AA Diaz and SR Doctor. 2008. “A Comparison of Ultrasonic Flaw Responses as Observed through Austenitic Stainless Steel Piping Welds.” In Proceedings of the Sixth International Conference on NDE in Relation to Structural Integrity for Nuclear and Pressurised Components, pp. 798–806. October 8–10, 2007, Budapest, Hungary. European Communities.
ASME. 2007a. Power Piping, ASME Code for Pressure Piping, B31. ASME B31.1-2007, American Society of Mechanical Engineers, New York.
ASME. 2007b. “Rules For Construction of Nuclear Components - Section III, Division 1.” In ASME Boiler and Pressure Vessel Code - An International Code. American Society of Mechanical Engineers, New York.

7.2
Beckmann J, S Rachny, U Zscherpel and U Ewert. 2008. “Improved Procedure for Computed Radiography - A Comparative Study on Welded Tube Sections by Film Radiography and Computed Radiography.” In 17th World Conference on Nondestructive Testing. October 25–28, 2008, Shanghai, China.
Bell IP, BS Gray, RJ Hudgell and T Sargent. 1982. “Reliability Assessment of Austenitic Steel Ultrasonic Inspections--Progress Report on a UKAEA Programme.” In Advances in Non-destructive Examination for Structural Integrity, pp. 269–283. August 24–25, 1981, Paris, France.
Blakeley B and K Spartiotis. 2006. “Digital Radiography for the Inspection of Small Defects.” Insight-Non-Destructive Testing and Condition Monitoring 48(2):109–112.
Bollini GJ. 1994. “NDT Performance Demonstration in Spain.” International Journal of Pressure Vessels and Piping 60(3):213–216.
Brast G, HJ Maier, P Knoch and U Mletzko. 1998. “Progress Report on a NDT Round Robin on Austenitic Circumferential Pipe Welds; Fortschrittsbericht Ueber Einen Zfp-Ringversuch An Austenitischen Rohrleitungs-Rundschweissnaehten.” In Proceedings of the 23rd MPA Seminar, Vol. 2, pp. 42.1–42.16. October 1–2, 1997, Stuttgart, Germany. http://www.osti.gov/src/servlets/purl/667748-bxlRyX/webviewable/.
Brown L and R DeNale. 1991. Real-time Evaluation of Ultrasonic Weld Inspections. DTRC-SME-91/75, David Taylor Research Center, Bethesda, Maryland.
Cartz L. 1995. Nondestructive Testing. ASM International, Materials Park, Ohio.
Chapman RK. 1995. “Inspection Qualification: The Role of Theoretical Modeling.” Insight: Non-Destructive Testing and Condition Monitoring 37(3):169–174.
Charnock P, PA Connolly, D Hughes and BM Moores. 2005. “Evaluation and Testing of Computed Radiography Systems.” Radiation Protection Dosimetry 114(1–3):201–207.
Crawford SL, Cinson, A D, MT Anderson, AA Diaz and SE Cumblidge. 2009. Ultrasonic Flaw Detection of Intergranular Stress Corrosion Cracks as Observed in Austenitic Stainless Steel Piping Welds. PNNL-18334, Pacific Northwest National Laboratory, Richland, Washington.
Crutzen S, M Certo, P Dombret and R Murgatroyd. 1989. PISC II: Parametric Studies, Reactor Safety Programme 1985–1987, Summary of the PISC II Parametric Studies on the Effect of Dfect Characteristics (EDC), Summary Report. Report No. EUR 12435 EN, Commission of the European Communities, Luxembourg.
Crutzen S, TD Koble and P Lemaitre. 1997. “Defect Occurrence, Detection, Location and Characterization; Essential Variables of the LBB Concept Application to Primary Piping.” In Proceedings of the Seminar on Leak Before Break in Reactor Piping and Vessels, pp. 221–234. October 9–11, 1995, Lyon, France. U.S. Nuclear Regulatory Commission, Washington, D.C.
DeNale R. 1986. Ultrasonics as an Alternative to Radiography for Submarine Hull Weld Inspection: A Status Report. DTNSRDC/SME-86/84, David W. Taylor Naval Ship Research and Development Center, Bethesda, Maryland.

7.3
DeNale R and C Lebowitz. 1989. “A Comparison of Ultrasonics and Radiographys for Weld Inspection.” In Review of Progress in Quantitative Nondestructive Evaluation (QNDE), Volume 8B, pp. 2003–2010. July 31–August 5, 1988, La Jolla, California. Plenum, New York.
DeNale R and C Lebowitz. 1990a. “Detection and Disposition Reliability of Ultrasonics and Radiography for Weld Inspection.” In 16th Annual Review of Progress in Quantitative Nondestructive Evaluation, Volume 9B, pp. 1371–1378. July 24–28, 1989, Brunswick, Maine.
DeNale R and C Lebowitz. 1990b. Ultrasonics as an Alternative to Radiography for Submarine Hull Weld Inspection. DTRC-SME-90/30, Office of the Assistant Secretary of the Navy, Naval Sea System Command, David Taylor Research Center, Bethesda, Maryland.
Doctor SR. 1984. “NDE Reliability Assessment.” In Non-Destructive Examination for Pressurised Components, pp. 323–335. August 30–31, 1983, Monterey, California. Elsevier Applied Science Publishers, London.
Doctor SR. 2007. “Nuclear Power Plant NDE Challenges - Past, Present, and Future.” In 33rd Annual Review of Quantitative Nondestructive Evaluation, Volume 26, pp. 17–31. July 30–August 4, 2006, Portland, Oregon. American Institute of Physics, Melville, New York.
Doctor SR, GJ Schuster and AF Pardini. 1998. “SAFT Inspections for Developing Empirical Database of Fabrication Flaws in Nuclear Reactor Pressure Vessels.” In Nondestructive Evaluation of Materials and Composites II, pp. 74–83. March 31–April 1, 1998, San Antonio, Texas. International Society for Optical Engineering (SPIE), Bellingham, Washington.
Dombret P. 1989. PISC II: Parametric Studies, Reactor Safety Programme 1985–1987, Effect of Defect Characteristics on Immersion Focussing Probe Testing Results, Final Report. Report No. EUR 12433 EN, Commission of the European Communities, Luxembourg.
Donin AR. 1982. “Calculation of the Operative Characteristics in Radiographic Inspection.” Soviet Journal of Nondestructive Testing 18(4):306–310.
Dymkin GY and VN Konshina. 2000. “Systematics of NDE Reliability: A Practical Point of View.” In 15th World Conference on Nondestructive Testing. October 15–21, 2000, Rome, Italy. Available at http://www.ndt.net/article/wcndt00/papers/idn738/idn738.htm.
Enkvist J, A Edland and O Svenson. 2001. “Operator Performance in a Blind Test Piece Trial.” Materials Evaluation 59(4):531–536.
EPRI. 1988. EPRI Nondestructive Evaluation Center: Assessment of the Intergranular Stress Corrosion Cracking Training and Qualification Program: Interim Report. EPRI NP-5658, Project 1570-2, Electric Power Research Institute, Palo Alto, California.
Erhard A and U Ewert. 1999. “The TOFD Method - Between Radiography and Ultrasonic in Weld Testing “ Journal of Nondestructive Evaluation and Ultrasonics 4(9).
Ewert U. 2002. “Upheaval In Industrial Radiology.” Journal of Nondestructive Testing 7(12):1–13. Alternate version available online at NDT.net, December 2002, Vol. 7, No. 12 (http://www.ndt.net/v07n12.htm).

7.4
Ewert U, G-R Jaenisch, K Osterloh, U Zscherpel, C Bathias, M Hentschel, A Erhard, J Goebbels, H Hanselka, J Nuffer and W Daum. 2007a. “Performance Control and Condition Monitoring.” In Springer Handbook of Materials Measurement Methods. eds: H Czichos, T Saito and L Smith. Ch. 16. Springer, Berlin.
Ewert U and U Zscherpel. 2000. “Radiographic Testing - A Comparison of Standards for Classical and Digital Industrial Radiology.” In 15th World Conference on Nondestructive Testing. October 15–21, 2000, Rome, Italy. Available at http://www.ndt.net/article/wcndt00/papers/idn324/idn324.htm.
Ewert U, U Zscherpel and K Bavendiek. 2005. Replacement of Film Radiography by Digital Techniques and Enhancement of Image Quality. Available at http://www.ndt.net/article/v12n06/ewert.pdf.
Ewert U, U Zscherpel and K Bavendiek. 2008. “Strategies for Film Replacement in Radiography - Films and Digital Detectors in Comparison.” In 17th World Conference on Nondestructive Testing. October 25–28, 2008, Shanghai, China.
Ewert U, U Zscherpel, D Fratzscher and O Alekseychuk. 2007b. “Optimization of Digital Industrial Radiography (DIR) Techniques for Specific Applications: An IAEA Coordinated Research Project.” In 4th Pan American Conference for NDT (PANNDT 2007). October 2007, Buenos Aires.
Fletcher MJ. 1988. “Fully Automatic Inspection of Welds Now a Reality.” Welding and Metal Fabrication 56(2):70–72.
Ford J and RJ Hudgell. 1987. Final Report on the Performance Achieved by Non-Destructive Testing of Defective Butt Welds in 50mm Thick Type 316 Stainless Steel. IEE ND-R-1427(R), UKAEA, Risley, United Kingdom.
Forli O. 1979. “Reliability of Ultrasonic and Radiographic Weld Testing.” In Ninth World Conference on Non-Destructive Testing, Melbourne, Australia.
Forli O. 1990. “Development and Optimization of NDT for Practical Use: Reliability of Radiography and Ultrasonic Testing.” In 5th Nordic NDT Symposium. August 24, 1990, Helsinki, Finland.
Forli O. 1995. Guidelines for Replacing NDE Techniques with One Another. NT Techn Report 300, Nordtest Project Number 1159-94, Det Norske Veritas AS, Finland.
Forli O. 1998. Guidelines for NDE Reliability Determination and Description. NT Techn Report 394, Nordtest Project 1303-96, Nordisk InnovationsCenter, Oslo. Available at http://www.nordicinnovation.net/nordtest.cfm.
Forli O. 2002. “Qualification of AUT for Offshore Pipelaying and the Role of NDE Reliability.” In 3rd European-American Workshop on Reliability of NDE and Demining, Berlin, Germany.
Forli O and B Hansen. 1982. “Comparison of Ultrasonic and Radiografic Examination.” In Tenth World Conference on Non-Destructive Testing, pp. 221–225. August 26, 1982, Moscow, USSR.
Forli O and B Pettersen. 1985. “Performance of Conventional Ultrasonic and Radiographic Weld Examination.” British Journal of Non-Destructive Testing 27(6):364–366.
Forli O and KO Ronold. 1999. Guidelines for Development of NDE Acceptance Criteria. NT Techn Report 427, Nordtest Project Number 1415-98, Det Norske Veritas AS, Finland.
7.5
Fucsok F. 1998. “Experiences and Problems of a Manual Ultrasonic Round Robin Test.” In 7th European Conference on Non-destructive Testing. May 26–29, 1998, Copenhagen, Denmark. Available at http://www.ndt.net/article/ecndt98/weld/190/190.htm.
Fucsok F, C Muller and M Scharmach. 2002. “Reliability of Routine Radiographic Film Evaluation - An Extended ROC Study of the Human Factor.” The e-Journal of Nondestructive Testing 7(12). http://www.ndt.net/article/ecndt02/429/429.htm.
FWGIDR. 2009a. Guide for the Qualification of Digital Radiography Systems and Processes. Paper No. 002-09, Federal Working Group on Industrial Digital Radiography (FWGIDR). Available at http://www.dwgndt.org/fwgidr.htm.
FWGIDR. 2009b. Recommended Training Curriculum for Digital Radiography Personnel (Level III). Paper No. 001-09, Federal Working Group on Industrial Digital Radiography (FWGIDR). Available at http://www.dwgndt.org/fwgidr.htm.
Goto M, H Tanaka, H Nimura and CD Cowfer. 2000. “Study - Code Case 2235 Application of TOFD to Reactors.” In 2000 Pressure Vessels and Piping Codes and Standards, pp. 15–18. July 23–27, 2000, Seattle, Washington. American Society of Mechanical Engineers, New York.
Halmshaw R. 1987. “X-ray Real-Time Imaging for Weld Inspection: IIW 3rd Progress Report.” British Journal of Non-Destructive Testing 29(6):426–428.
Harara W. 2008. “Digital Radiography in Industry.” In 17th World Conference on Nondestructive Testing. October 25–28, 2008, Shanghai, China.
Heasler PG and SR Doctor. 2003. A Comparison of Three Round Robin Studies on ISI Reliability of Wrought Stainless Steel Piping. NUREG/CR-6795, PNNL-13873, U.S. Nuclear Regulatory Commission, Washington, D.C.
Heasler PG, TT Taylor and SR Doctor. 1993. Statistically Based Reevalutaion of PISC-II Round Robin Test Data. NUREG/CR-5410, PNL-8577, U.S. Nuclear Regulatory Commission, Washington, D.C.
Henry DO. 2008. “Field Experience with Code Case N-659: Ultrasonic Examination in Lieu of Radiography.” In Proceedings of the ASME Pressure Vessels and Piping Conference - 2007 - Volume 1, Codes and Standards, pp. 527–531. July 22–26, 2007, San Antonio, Texas. American Society of Mechanical Engineers, New York.
Higuchi S, Z Makihara, Y Nonaka and N Ooka. 2004. “Development of Flaw Sizing Technique by Radiographic Testing - Application of the ‘GUCHI’ Technique.” In Proceedings of the 11th Asian Pacific Conference on Nondestructive Testing - Advances in Nondestructive Evaluation, pp. 1316–1323. November 3–7, 2003, Jeju Island, Republic of Korea. Trans Tech Publications Ltd, Switzerland.
Howard BD. 2001. “Lens-Coupled, Area-Detector Digital Radiography versus Conventional Radiography of Fusion Bonded Pinch Welds: Are They Equivalent?” In Digital Imaging IV Topical Conference. August 6–8, 2001, Mashantucket, Connecticut. Available at http://www.osti.gov/src/servlets/purl/783028-f1k3tT/native/.
Jackson DA, SR Doctor, GJ Schuster and FA Simonen. 2001. “Developing a Generalized Flaw Distribution for Reactor Pressure Vessels.” Nuclear Engineering and Design 208(2):123–131.

7.6
Jaenisch GR, C Bellon and U Ewert. 2007. “Reliability Assessment by Simulation for High Energy Radiography.” In 33rd Annual Review of Progress in Quantitative Nondestructive Evaluation, Volume 26, pp. 1831–1838. July 30–August 4, 2006, Portland, Oregon. DOI 10.1063/1.2718186. American Institute of Physics, Melville, New York.
Jensen T and J Xu. 2003. “Computer Modeling of Digital X-ray Detector Response.” In Review of Quantitative Nondestructive Evaluation, Volume 23, pp. 507–514. July 27–August 1, 2003, Green Bay, Wisconsin. American Institute of Physics, Melville, New York.
Kim HM, IK Park, US Park, YW Park, SC Kang and JH Lee. 2004. “Statistical Reliability Assessment of UT Round-Robin Test Data for Piping Welds.” Key Engineering Materials 270–273, Part 3:1743–1748.
Klyuev VV and FR Sosnin. 1999. “The Current State of Digital X-ray Technology.” Russian Journal of Nondestructive Testing 35(4):297–305.
Lapides ME. 1983. Radiographic Detection of Intergranular Stress Corrosion Cracking: analysis, Qualification, and Field Testing. Report NP-3164-SR, Electric Power Research Institute, Palo Alto, California.
Lapides ME. 1984. “Radiographic Detection of Crack-Like Defects in Thick Sections.” Materials Evaluation 42(6):788–792.
Lee D-H, S-J Lee, J-H Lee and S-H Lee. 2007. “Analysis of Round Robin Test for Ultrasonic Thickness Measurement of Wall Thinned Pipe in Nuclear Power Plant.” In 34th Annual Review of Quantitative Nondestructive Evaluation, Volume 27, pp. 1732–1738. July 22–27, 2007, Golden, Colorado. American Institute of Physics, Melville, New York.
Light GM. 2004. Comparison of Imaging Capabilities Between Ultrasonics and Radiography. SwRI Project 14.07558, Southwest Research Institute, San Antonio, Texas.
Lozev M, R Spencer and D Hodgkinson. 2004. “Inspection of Thin-Walled Pipe Welds Using Mechanized Ultrasonic Techniques.” In International Pipeline Conference 2004 - The Power of Technology, Volume 2, pp. 935–943. October 4–8, 2004, Calgary, Alberta, Canada. American Society of Mechanical Engineers, New York. Paper ICP04-0447.
Lozev MG, RL Spencer and D Hodgkinson. 2005. “Optimized Inspection of Thin-Walled Pipe Welds Using Advanced Ultrasonic Techniques.” Transactions of the ASME, Journal of Pressure Vessel Technology 127(3):237–243.
Lu ZF, EL Nickoloff, JC So and AK Dutta. 2003. “Comparison of Computed Radiography and Film/Screen Combination Using a Contrast-Detail Phantom.” Journal of Applied Clinical Medical Physics 4(1):91–98.
MacDonald DE. 1985. IGSCC Detection in BWR Piping Using the MINAC. EPRI-NP-3828, J. A. Jones Applied Research Company, Charlotte, North Carolina.
MacDonald DE. 1987. “Piping Examinations for IGSCC With the MINAC.” In 8th International Conference on NDE in the Nuclear Industry, pp. 423–428. November 17–20, 1986, Kissimmee, Florida. ASM International, Metals Park, Ohio.
7.7
Marinho CA, RT Lopes and JMA Rebello. 2009. “Film Replacement by Digital Techniques in Weld Testing.” Materials Evaluation 67(5):529–539.
Miller C. 2008. Nondestructive Evaluation: A Review of NDE Performance Demonstrations - NDE Round Robin Report. Report No. 1016969, Electric Power Research Institute, Palo Alto, California.
Mishra D, R Venkatachalam and V Manoharan. 2007. “Digital Radiography for Non-destructive Testing.” In Computerized Tomography for Scientists and Engineers, pp. 176–213 ed: P Munshi. Ch. 15. CRC Press, Boca Raton, Florida.
Mohr GA and C Bueno. 2002. “GE a-Si Flat-Panel Detector Performance in Industrial Digital Radiography.” Insight (UK) 44(10):631–633.
Mohr GA and P Willems. 2008. “Factors Affecting Probability of Detection in Computed Radiography.” In 17th World Conference on Nondestructive Testing. October 25–28, 2008, Shanghai, China.
Moles M. 2007. “Nondestructive Evaluation: Now and in the Future.” Advanced Materials and Processes 165(1):33–36.
Moreira EV and HR Simeies. 2007. “Flat-Panel Detectors are Accepted for Digital Radiography in Place of Conventional Radiography in Pipeline Weld Inspection.” In CD-Proceedings, IV Pan American Conference for NDT (PANNDT 2007). October 2007, Buenos Aires, Argentina. Organized by the Argentine Society of Structural and NDT – AAENDE – www.aaende.org.ar. Available at http://www.ndt.net/search/pdf2html.php?url=article/panndt2007/papers/127.pdf.
Murgatroyd RA. 1994. PISC III Action 7 Human Reliability Studies, Results and Follow-Up. AEA Technology, Risley, United Kingdom. Presented at the PWG3/PIC MB Joint Venture Meeting, 10/19/94.
Murgatroyd RA, PJ Highmore, T Bann, SF Burch and AT Ramsey. 1989. PISC II: Parametric Studies, Reactor Safety Programme 1985–1987, Flaw Characterisation Using the TANDEM and TOFD Techniques, Final Report. Report No. EUR 12431 EN, Commission of the European Communities, Luxembourg.
Neundorf B, HJ Maier, U Mletzko and T Just. 2000. “Results of a Round Robin Test on NDT Methods for Austenitic Pipe Welds in Nuclear Power Plants.” In 2nd International Conference on NDE in Relation to Structural Integrity for Nuclear and Pressurized Components, pp. 78–80. May 24–26, 2000, New Orleans. Available at http://www.ndt.net/v05n08.htm.
Neundorf B, HJ Maier, U Mletzko and T Just. 2002. “Results of a Round Robin Test on NDT Methods for Austenitic Pipe Welds.” VGB PowerTech 82(2):78–80.
Nockemann C, C Bellon and S Nickisch. 1997. “Strategies of Validation in General Testing Compared to Experiences in NDE, Open Questions in Common Understanding of the Terms Reliability and Validation.” In Proceedings of the European-American Workshop Determination of Reliability and Validation Methods on NDE, pp. 19–31. June 18–20, 1997, Berlin, Germany.
Pincu R and O Kleinberger. 2009. “Digital Imaging - The Transition from Conventional Radiography to Digital Radiography.” Materials Evaluation 67(5):499–506.

7.8
PISC. 1993a. Evaluation of the Inspection Results of the PISC III Safe-end Assembly No. 20, Safe-ends Nos. 21 and 22. PISC III Report No. 20, EUR 15558 EN, Commission of the European Communities, Joint Research Centre, Ispra Site.
PISC. 1993b. Evaluation of the Inspection Results of the PISC III Safe-end Assembly No. 25. PISC III Report No. 25, EUR 15370 EN, Commission of the European Communities, Joint Research Centre, Ispra Site.
PISC. 1993c. Evaluation of the Inspection Results of the Safe-end Areas of the PISC III Assembly No. 24. PISC III Report No. 24, EUR 15369 EN, Commission of the European Communities, Joint Research Centre, Ispra Site.
PISC. 1993d. Evaluation of the Sizing Results of 12 Flaws of the Full Scale Vessel Installation. PISC III Report No. 26 – Action 2 – Phase 1, EUR 15371 EN, Commission of the European Communities, Joint Research Centre, Ispra Site.
PISC. 1998. PISC III Restuls on Action 3 ‘Nozzles and Dissimilar Welds’. PISC III Report No. 19, EUR 15557 EN, Commission of the European Communities, Joint Research Centre, Ispra Site.
Pollitt CG. 1962. “Radiographic Sensitivity.” British Journal of Non-Destructive Testing 4(3):71–80.
Quinn RA and CC Sigl, Eds. 1980. Radiography in Modern Industry. Eastman Kodak Company, Rochester, New York.
Ramuhalli P, J Kim, P Cui, R Polikar, L Udpa, T Trapp, M Novak, H Castner, R Spencer and R Kok. 2000. “Knowledge-Based Ultrasonic Weld Inspection System.” In Annual Review of Progress in Quantitative Nondestructive Evaluation, Volume 20. July 16–21, 2000, Ames, Iowa. American Institute of Physics, Melville, New York.
Rana M, O Hedden, D Cowfer and R Boyce. 2000. “Technical Basis for ASME Section VIII Code Case 2235 on Ultrasonic Examination of Welds in Lieu of Radiography.” In 2000 Pressure Vessels and Piping Codes and Standards, pp. 3–12. July 23–27, 2000, Seattle, Washington. American Society of Mechanical Engineers, New York.
Rebello JMA, AA Carvalho, LVS Sagrilo and SD Soares. 2006. “Reliability of the Ultrasonic Technique Applied to Detection of Pipe Weld Defects.” In 33rd Annual Review of Quantitative Nondestructive Evaluation, Volume 26, pp. 1839–1846. July 30–August 4, 2006, Portland, Oregon. American Institute of Physics, Melville, New York.
Redmer B, J Robbel, U Ewert and V Vengrinovich. 2002. “Mechanised Weld Inspection by Tomographic Computer-Aided Radiometry (TomoCAR).” Insight-Non-Destructive Testing and Condition Monitoring 44(9):564–567.
Reynolds G and B Crouse. 2009. “Reference Radiographs and RT Castings.” The NDT Technician 8(2):1–4.
Rudlin JR, CRA Schneider and GR Razmjoo. 2004. “Reliability of Inspection for Root Flaws in Riser Girth Welds.” In Proceedings of the 23rd International Conference on Offshore Mechanics and Arctic Engineering - OMAE, pp. 255–263. June 20–25, 2004, Vancouver, BC, Canada. American Society of Mechanical Engineers, New York.

7.9
Rummel WD. 2004. “Qualification and Validation of the Performance Capability (POD) For Nondestructive Inspection Procedures.” In 16th WCNDT 2004 - World Conference on NDT. August 30–September 3, 2004, Montreal, Canada. Available at http://www.ndt.net/article/wcndt2004/html/htmltxt/619_rummel.htm.
Schneider CRA, IJ Munns, GA Georgiou, RK Chapman and GS Woodcock. 1999. “Modelling the Radiography of Thick-Section Welds.” IEE Colloquium (Digest)(20):31–33.
Shackleton D. 1987. “Inspection and NDT in Welded Fabrication, Part 2: Adequacy and Limitations.” Welding Review International 6(1):61–63.
Shepard RR. 2006. “Practical Radiography - Digital Radiography and CMOS Flat Panel Detectors.” The NDT Technician 5(2):4–5.
Siewert TA, CN McCowan, D Polansky and TS Jones. 1992. “Quantitative Evaluation of Distributed Pores in Reference Radiographs.” Welding Journal 71(8):31–33.
Singh R. 2000. Three Decades of NDE Reliability Assessment. Karta-3510-99-01, Karta Technologies, Inc., San Antonio, Texas. Available at http://www.karta.com/POD.
Skala Z and J Vit. 2003. “Qualification of UT Methods and Systems Used for In-service Inspections of VVER 440 Vessels.” In Transactions of the 17th International Conference on Structural Mechanics in Reactor Technology (SMiRT 17), August 17–22, 2003, pp. 2880–2887; Paper # O01-2 Prague, Czech Republic.
Souza MP, RM Almeida, JMA Rebello and SD Soares. 2009. “Detection of Lack of Fusion Weld Defects by Radiography.” In Proceedings of the 35th Annual Review of Progress in Quantitative Nondestructive Evaluation, pp. 1174–1181. July 20–25, 2008, Chicago, Illinois. American Institute of Physics, Melville, New York.
Spanner J. 2005. “Effectiveness of Substituting Ultrasonic Testing for Radiographic Testing for Repair/Replacement.” In Proceedings of the 2005 ASME Pressure Vessels and Piping Conference, Volume 1 Codes and Standards, pp. 33–41. July 17–21, 2005, Denver, Colorado. American Society of Mechanical Engineers, New York. Paper PVP2005-71584.
Spanner JC, RW Badalamente, WL Rankin and TJ Triggs. 1986. Human Reliability Impact on Inservice Inspection, Phase 1 Summary Report. NUREG/CR-4436, PNL-5641, BHARC-400/85/016, Vol. 1, U.S. Nuclear Regulatory Commission, Washington, D.C.
Spanner JC, SR Doctor, TT Taylor and J Muscara. 1990. Qualification Process for Ultrasonic Testing in Nuclear Inservice Inspection Applications. NUREG/CR-4882, PNL-6179, U.S. Nuclear Regulatory Commission, Washington, D.C.
Spartiotis K, J Havulinna, A Leppanen, T Pantsar, K Puhakka, J Pyyhtia and T Schulman. 2004. “A CdTe Real Time X-ray Imaging Sensor and System.” Nuclear Instruments and Methods in Physics Research A 527:478–486.
Spartiotis K, A Leppanen, T Pantsar, J Pyyhtia, P Laukka, K Muukkonen, O Mannisto, J Kinnari and T Schulman. 2005. “A Photon Counting CdTe Gamma- and X-ray Camera.” Nuclear Instruments and Methods in Physics Research A 550:267–277.

7.10
Spartiotis K, J Pyyhtia, T Schulman, K Puhakka and K Muukkonen. 2003. “A Directly Converting High-Resolution Intra-Oral X-ray Imaging Sensor.” Nuclear Instruments and Methods in Physics Research A 501:594–601.
Stephens Jr. HM. 2000. “NDE Reliability - Human Factors - Basic Considerations.” In 15th World Conference on Nondestructive Testing. October 15–21, 2000, Rome, Italy. Available at http://www.ndt.net/article/wcndt00/papers/idn736/idn736.htm.
Thavasimuthu M, R Hemamalini, CV Subramanian, T Jayakumar, P Kalyanasundaram and B Raj. 1998. “Detectability of Mis-oriented Defects by Ultrasonic Examinations-A Few Observations.” Insight-Non-Destructive Testing and Condition Monitoring 40(11):766–768.
Triggs TJ, WL Rankin, RW Badalamente and JC Spanner. 1986. Human Reliability Impact on Inservice Inspection, Review and Analysis of Human Performance in Nondestructive Testing (Emphasizing Ultrasonics). NUREG/CR-4436, PNL-5641, BHARC-400/85/016, Vol. 2, U.S. Nuclear Regulatory Commission, Washington, D.C.
Wang Y, WQ Meeker and W Hassan. 2006. “Assessment of Components of Variance in NDE Data.” In 33rd Annual Review of Quantitative Nondestructive Evaluation, Volume 26, pp. 1783–1790. July 30–August 4, 2006, Portland, Oregon. American Institute of Physics, Melville, New York.
Wendt S, J Gray and C Zhou. 2003. “The Effect of Lead Intensification Screens on Film: Modeling and Experiment.” In Review of Quantitative Nondestructive Evaluation, Volume 23, pp. 530–537. July 27–August 1, 2003, Green Bay, Wisconsin. American Institute of Physics, Melville, New York.
Willetts AJ and FV Ammirato. 1987. “Objectives and Techniques for Performance Demonstration of In-Service Examination of Reactor Pressure Vessels.” In Performance and Evaluation of Light Water Reactor Pressure Vessels, pp. 79–86. June 28–July 2, 1987, San Diego, California.
Wooldridge AB, RK Chapman and GS Woodcock. 1997a. “Reliability of Radiography for Detection of Planar Manufacturing Defects in Thick-Section Welds.” Insight (UK) 39(3):139–147.
Wooldridge AB, RK Chapman, GS Woodcock, IJ Munns and GA Georgiou. 1997b. “Demonstrating the Capability of Radiogrpahy for Detection of Large Planar Defects in Thick-section Welds.” In Proceedings European-American Workshop Determination of Reliability and Validation Methods on NDE, pp. 157–168. June 18–20, 1997, Berlin, Germany.
Yeomans DK and GJ Davidson. 2004. “Code Case 2235: A Major Opportunity for Advanced Ultrasonic Inspection.” CINDE Journal 25(1):16–19.
Zapata J, R Ruiz and R Vilar. 2008. “An Automatic Welding Defects Classifier System.” In VISAPP 2008: Proceedings of the Third International Conference on Computer Vision Theory and Applications, Volume 2 pp. 260–263. January 22–25, 2008, Funchal, Madeira, Portugal. Institute for Systems and Technologies of Information, Control and Communication, Setubal, Portugal.
Zhukov YA, YK Karlov, YV Obidin, KV Petukhov, AK Potashnikov, VY Sartakov and SB Chashchin. 2008. “Computer Panoramic Tomography for Industrial Application.” Russian Journal of Nondestructive Testing 44(9):607–614.

Appendix A
Glossary of Key Radiographic Quantities


A.1
Appendix A
Glossary of Key Radiographic Quantities
Key quantities that relate to the performance of radiographic NDE (film or digital) include:
• Angle of inclination, or equivalently, beam direction. This is the angle between the incident radiation beam and the plane of a flaw (such as a crack) (Figure 3.3).
• Calibration. The process of compensating for unequal responses in the different pixels in digital RT detectors.
• Contrast sensitivity. The contrast (for film) is defined as the difference in film density between the object region and the background. For DRT, the contrast is the variation in gray-scale values between the object and background regions. Contrast sensitivity refers to the smallest detectable contrast in a radiograph.
• Contrast-to-noise ratio (CNR). This is the ratio of the contrast in a radiographic image to the noise power in the image. Noise power is typically calculated using the variation in gray-scale values (or film density) in the background region.
• Detection sensitivity. This is defined as the smallest flaw that is detectable (i.e., has sufficient contrast) in RT. The detection sensitivity is a function of the inspection parameters, film grade, and processing and operator interpretation.
• Detector quantum efficiency (DQE). This is sometimes called Detected or Detector Quantum Efficiency. This is a measure of the efficiency of the system. The QE is defined as the average fraction of input quanta used in the formation of the output signal. The DQE is defined as the ratio of the squared output SNR to the squared input SNR. This is a measure of the ratio between the output SNR (i.e., the SNR in the resulting output radiographic image) and the dose falling on the detector.
• Dynamic range. The dynamic range is the usable portion of the detector response curve. For film, the response curve relates dose to optical density, and typical dynamic ranges are between optical densities of 1.5 and 2.5. The dynamic range for digital detectors depends on the digitization capabilities, with 12-bit digitization having usable gray values between approximately 1000 and 16383.
• Exposure time. This is the time duration for which the detector is exposed to the incident radiation.
• Film density. Film density is a measure of the darkness of the image. This is typically measured by using the amount of light that can be transmitted through the exposed region on the film. The response of typical film is shown in Figure 2.8. With increasing dose (assuming exposure time is constant), the darkness of the exposed film increases. However, at low-dose values, the exposure is insufficient, and at high-dose values, the film is completely exposed. In either case, no useful analysis is possible. Film darkness ranges (or densities) in the 1.5–2.5 range are typical, although densities up to 4 are prescribed in the standards.
• Film-focus distance (or source-film distance). This is the distance between the radiographic source and the detector.

A.2
• Focal spot size. This is the size of the region where the x-rays are generated in an x-ray tube. Typical spot sizes will be several millimeters in each dimension. Microfocus x-ray systems use tubes with very small spot sizes (less than 1 mm in the largest dimension).
• Geometric unsharpness. The finite size of the source, with small source-detector distances, results in sharp edges in the test object appearing as a smooth change in gray levels in the radiographic image (see Figure 2.8). The smooth change in gray levels (from the object region to the background region) is due to the penumbra. The size of the penumbra is called the geometric unsharpness. This quantity results in blurring of the image, and limits the smallest feature sizes that can be discriminated in a radiographic image. In digital radiography, the geometric unsharpness competes with the spatial resolution (see below) in reducing the resolution of the image.
• IQI or penetrameters. Image quality indicators (IQI) or penetrameters are simple devices that are used to obtain a quantitative measure of radiographic image quality. These devices are placed on the test object, and the resulting radiograph contains an image of both the IQI as well as the test object. The radiographic image is considered to be of acceptable quality if the IQI image can be clearly seen (resolved) and has the desired density. Standard IQI include the ASTM hold standard (Ewert and Zscherpel 2000; Ewert et al. 2007a), the single wire standard, and the two-wire standard.
• Laser spot size. The spot dimensions of the scanning laser in CR.
• Limiting spatial resolution (LSR). This is a measure of the spatial frequency at which one can no longer see a high contrast structured periodic test pattern under favorable imaging conditions.
• Line spread function (LSF). The line spread function is a measure of the spatial spreading (or unsharpness) associated with the radiographic image of a thin line.
• Linearity. This is a measure of the detector response as a function of exposure. Ideally, the response should be linear over a wide range of exposure conditions. Digital detectors tend to have linear responses over a wider range when compared to CR detectors and film. However, the response of each pixel in a digital detector may not be identical, and a calibration procedure is usually necessary.
• Modulation transfer function (MTF). The MTF is the spatial frequency response of the RT system (or detector). The spatial frequency is typically represented in line pairs per millimeter (lp/mm). The MTF is usually normalized to 1 (or 100%) at low frequencies. At frequencies where the MTF is 100%, the image retains full contrast and the pattern is unattenuated (Figure 3.5). As the MTF is reduced, the contrast at the specific frequency drops. In general, the MTF is flat for low spatial frequencies and drops off at higher frequencies. Obviously, the larger the flat portion of the MTF, the finer the detail that is visible at high contrast. Note that the MTF may be used as a measure of the spatial resolution of the detector or complete system.
• Noise power spectrum (NPS). This is the average power of noise as a function of spatial frequency.
• Penetrameter sensitivity. Penetrameter sensitivity is defined as the “smallest change in thickness of a specified homogeneous object that can be detected in a radiograph, expressed as a percentage of the total thickness” (Pollitt 1962).
• Pixel pitch. Pixel pitch is the distance between adjacent pixels (usually measured as the distance between the centers of two adjacent pixels). This quantity is typically defined only for digital detectors. Often, the pixel pitch may be used as a measure of spatial resolution instead of the area of a pixel.

A.3
• Pixel. In digital detectors, the x-radiation is converted into charges within discrete regions. Each of these discrete regions is referred to as a pixel (picture element).
• Projection magnification. Typically, the source-object and object-detector distances are selected such that the radiographic image of a test object has the same size as the original image (1:1 magnification). If the source is placed close to the object, and the detector is placed further away, however, the apparent size of the object in the radiographic image is larger than the true size (1:2 or higher). This “magnification” may be shown through simple geometry (Figure 3.4), and is referred to as projection magnification. Note that the closer the source is to the object, the larger the geometric unsharpness. In digital detectors, as long as the geometric unsharpness is less than the basic spatial resolution, no additional information is lost. Thus, a balance must be achieved between the amount of projection magnification, the basic spatial resolution, and geometric unsharpness in digital RT.
• Resolution. The resolution is the smallest feature size on the text object that can be seen clearly (resolved) in the radiographic image. This is distinct from the spatial resolution (see below).
• Saturation. Very large doses (possibly in combination with large exposure times) can result in the detector output reaching a limiting value. This is termed saturation.
• SNR and normalized SNR (nSNR). In typical radiographic imaging systems, noise arises from electronics, inspected object, environment, recording device, source, etc. In digital RT, in particular, the image formation is dependent on conversion of photons to electrical charges, and fluctuations in the number of photons will result in noise. This may be overcome to some extent by increasing the dose (by using a more powerful source, by increasing the exposure time, or by averaging over several frames). In any case, a portion of the input photons may be considered to be useful in creating the useful signal (or image of the object under test). Variations in the dose received by individual sensors in the detector will result in the added noise. Other sources of noise include electronic noise in preamplifiers, intrinsic (thermal) noise in the a-Si or a-Se detectors, and digitization noise. The net ratio of signal power to noise power is called the SNR. The SNR normalized to detector area is referred to as nSNR.
• Spatial resolution. The spatial resolution is typically defined as the area of a pixel. In digital radiography, this quantity is also referred to as the basic spatial resolution (SRb). According to Codes (EN 444, EN 462-5, ASTM-E 2002) (Ewert et al. 2005) that attempt to limit the maximum geometric unsharpness, the basic spatial resolution is set to half the geometric unsharpness.

A.4


~ Pacific Northwest
NATIONAL LABORATORY
Proudly Operated by Banelle Since 1965
902 Battelle Boulevard P.O. Box 999 Richland, WA 99352 1-888-37S-PNNl (7665) www.pnl.gov