pogroms, networks and migration - eh.neteh.net/eha/wp-content/uploads/2013/11/spitzer.pdf · ·...
TRANSCRIPT

POGROMS, NETWORKS, AND MIGRATION
The Jewish Migration from the Russian Empire
to the United States 1881–1914*
Yannay Spitzer†
September 17, 2013
*I thank my committee members Joel Mokyr (chair), Igal Hendel, and Joseph Ferrie for their endless support andadvise. I am grateful for comments and suggestions from members of the economic history community of North-western University, numerous members of the department of economics at the Hebrew University of Jerusalem,and to seminar participants at Northwestern University, University of Michigan, Ann-Arbor, Stanford University,the International Cliometric Conference 2013, and the European Historical Economics Society Conference 2013.I have benefited from comments, discussions and correspondences with Ran Abramitzky, Martha Bailey, LeahBoustan, Andrew Godley, Drew Keeling, Yohannan Petrovsky-Shtern, Tiago Pires, Twan-Hwee Sng, Shaul Stampfer,Marlous van Waijenburg, and Steven Zipperstein. This work was enabled by material support from the EconomicHistory Association’s Sokoloff Fellowship, the Crown Family Fellowship of Northwestern University’s Crown Centerfor Jewish Studies, and Northwestern University Graduate School’s Graduate Research Grant, and the Technology-Enhanced Doctoral Research Award, as well as by several periods of hosting at the department of economics at theHebrew University of Jerusalem. Data used in this paper was constructed in fruitful collaboration with GennadyPolonetsky and Marcy Blattner. Research assistance was provided by Amanda Lerner, Annie Weiss, and VictoriaZak. I am thankful to Peg Zitko and the Statue of Liberty - Ellis Island Foundation for providing the Ellis Islandarrival records data, and to Andre Zerger and Joel Perlmann for sharing GIS data on the Russian Empire.
†Northwestern University, Department of Economics, email: [email protected], personal website: yan-nayspitzer.net.

Abstract
The migration of one and a half million Jews from the Russian Empire to the United States dur-ing the years 1881–1914 is commonly linked to two waves of pogroms, cases of anti-Jewish mobviolence, that mainly took place in two waves in 1881–1882 and in 1903–1906. This commonperception that pogroms were a major cause for Jewish migration is now doubted by histo-rians, but little quantitative evidence exists to support or refute it. I use a new data set thatmatches hundreds of thousands of Jewish immigrants to their respective hometowns in theRussian Empire over the years 1900-1914, and traces the evolution of migration networks overthe years 1861–1920 using incorporation records of 1,476 Jewish hometown-based associationsin New-York. Additionally, the locations of hundreds of pogroms that occurred during the twowaves were identified. Mapping the pogroms, as well as the yearly migration flows and networkgrowth of more than 200 districts provides a first close look into the geographic evolution of theJewish migration and the way it was affected by pogroms. I find no evidence that the migrationat its earliest stages was caused by the 1881–1882 pogroms; instead, post-1881 migration wasa continuation of the spatial trend of pre-1881 nascent migration. However, the second waveof pogroms did increase the rate of migration in the afflicted districts, although it caused littlechange to the demographic composition of the migrants. I interpret the finding as an indicationthat the timing of the beginning and the intensification of Jewish migration was chiefly deter-mined by spatial diffusion of chain-migration networks—victims of the first wave of pogromscould not react with migration because they were not linked to previous chains of migrationfrom their districts. This supports the diffusionist view on the European pattern of migration,in regards to the late arrival of mass migration from southern- and eastern-Europe.
2

1 Introduction
Jewish migration from the Russian Empire to the United States in the years 1881–1914 was oneof the most intense mass population movements in history. Over a single generation, morethan a quarter of the Jewish-Russian population was resettled overseas. The timing and the de-mographic characteristics of this migration was commonly thought to be linked to two wavesof pogroms, events of anti-Jewish mob violence, that took place in 1881–1882 and in 1903–1906. Historians now doubt the existence of such link, and quantitative evidence has recentlyemerged strengthening their suspicions. This paper provides systematic evidence on the localeffects of pogroms on migration using very large and informative data sets that have not beenfully used before.
This paper utilizes a new panel data set combining a number of sources. First, I have assembledinformation on local migration networks over the years 1861–1920 based on data on the incor-poration of 1,476 landsmanshaftn, Jewish hometown-based associations in New-York. Second,I have compiled individual-level data on migration through Ellis Island, covering hundredsof thousands of Jewish-Russian immigrants, the vast majority of the population of interest. Imatched these records to the towns from which the immigrants had come, yielding a uniquepanel covering migration from more than 200 districts over the period 1900–1914. Third, I col-lected and geo-coded lists of pogroms that cover most of the events that occurred during thetwo waves. It tests the hypothesis that the pogroms were a major cause of the Jewish mass mi-gration by providing evidence on the following questions: Did the 1881 pogroms start the Jewishmass migration? Did the second wave of pogroms increase its magnitude? And did the secondwave of pogroms affect its demographic composition and made it look more “permanent”, witha greater dependency ratio?
The empirical methodology uses a difference-in-differences approach to test whether pogroms-afflicted districts have produced a differentially greater and demographically different migra-tion after the pogroms had hit. For the first wave, no direct measures of migration are avail-able, and I use the landsmanshaftn data as a proxy for recent immigration. Nevertheless, theevidence for this early wave is based on very sharp patterns, and it is best presented by a se-ries of maps rather than by regression analysis. The geographical variation of both pogromsand migration before and after the second wave were much more mixed, and the effects of itspogroms are estimated using linear district-level difference-in-difference regressions, testingwhether the size and the composition of pogrom-districts migration during the (fiscal) years1906–1914 had differentially changed compared to the years 1900–1905.
The empirical analysis reveals unknown, sometimes surprising patterns. The onset of Jewishmass migration was unrelated to the 1881 pogroms; rather, post-1881 migration originatedfrom completely different areas and was a continuation of pre-1881 trends. Moreover, whilethe accepted view among historians was that the migration was led and pioneered by Lithua-nian Jews, whose standards of living were probably the lowest, the pioneering areas of Jewish-Russian emigration during the 1860s and 1870s were in fact located further to the west in arestricted strip of Congress Poland along the border with Germany. Only during the 1880s didthis emigration belt thicken and reached the Lithuanian provinces of Kovno, Vilnia, Minsk, andGrodno, that had been unaffected by the 1881 pogroms. The southwestern provinces of Vol-
3

hinia, Podolia, and Kiev, where some of the pogroms took place, lagged another decade behindLithuania, while the southern provinces in the region known as New-Russia, worse hit by thefirst wave of pogroms, were last to contract significant emigration and never caught up with thelevels of migration seen in the pogrom-free north.
The second wave of pogroms, however, did induce more emigrants to leave afflicted districts.The benchmark estimate is that a district that had experienced at least one pogrom in 1903–1906 had 23% more migrants arriving at Ellis Island during the years 1906–1914 compared toa similar district that did not experience a pogrom. Considering that regional spillover effectsof pogroms may have played a role in pushing residents of the entire region to migrate, thisestimate should be regarded as a lower bound to the actual marginal effect of the pogrom ex-perience. Attempts to identify heterogeneity in the effects of the pogroms fail to find consistentpatterns. Estimates of region-specific effects vary across specifications, and year-specific effectsgenerally indicate that while the effect was strongest in the first two years after the pogroms,there was a slight pre-pogrom effect, and a strengthening of the effect towards the later yearsprior to WWI, a pattern that is hard to rationalize. I find no strong indication that the demo-graphic composition of migration changed due to the pogroms, although this can not be ruledout and some evidence suggest that there might have been a weak effect increasing the shareof non-labor-force-participants. This paper does not deal directly with the effects of the gen-eral persecution of Jews, other than through pogroms, on the overall magnitude of the Jewish-Russian migration. However, I believe that the explanation I provide for the timing of the Jew-ish migration at least partly obliterates the need to resort to persecution as an explanation forit.
I interpret these findings as indicating that the spatial diffusion of chains of migration was a cru-cial determinant of the timing and the geographic evolution of the Jewish-Russian migration.Their gradual progression across space explains why certain regions strongly prone to producemass migration started doing so only a decade or two after the pioneering regions, and why thefirst wave of pogroms had no effect on migration from afflicted districts whereas the secondwave did. Thus, the question of the effects of pogroms on migration is given a complex answer,depending on time and place: migration can be related to pogroms, but only in areas wherechain migration had already existed by the time the violence struck.
The underlying claim is that chain-migration, or personal relations to friends and relatives whohad already migrated, is not only a factor facilitating migration; it is rather a nearly necessarycondition for migration. Individuals who do not have a forward link in the country of destina-tion are generally unable to migrate even if they are fully incentivized to do so. This lends sup-port to the disputed diffusionist view on the European pattern of transatlantic mass migration,that the different timing of the onset of mass migration in various regions is to a large degreeexplained by the slow process of diffusion of migration networks across space, often overridingthe effects of differences in local economic and demographic conditions.
4

2 Background
2.1 Jews in Imperial Russia: A Brief Overview
The Russian Empire was home to some 5.3 million Jews in 1897, approximately half of worldJewry. Almost all of them, 94 percent, were residing in a restricted territory known as the Paleof Settlement, comprising the 25 western provinces of the Russian Empire. Residence of Jewsbeyond the Pale was severely restricted by a set of laws and statutes enacted during the decadesfollowing the Polish Partitions and the Russian takeover of the lion’s share of the Polish-LithuanianCommonwealth (Klier, 1986). Within the Pale, the Jewish population was typically concentratedin small provincial market towns, known as shtetl (a townlet; shtetlach, in plural).1 They special-ized in certain occupational sectors: almost none were farmers, and about a third was employedin manufacturing. Another third was employed in trade and commerce, an occupational nicheJews dominated in absolute numbers, in spite of being a minority of only 9 percent of the Pale’spopulation.2
Under the Tsars, the Jewish population experienced a very rapid population growth, accordingto estimates as much as five-fold during the nineteenth century (Stampfer 1989). By the endof the century it is commonly described as being poverty-stricken, and for the most part on thelosing side of the transformations brought about by the advent of Russian and Polish industrial-ization, particularly in the northwestern region of Lithuania and the ten provinces of CongressPoland to the west. The south-west region and the southern region of New-Russia probably hadsomewhat improved standards of living. The relations between the Jewish population and theRussian Tsars, the bureaucracy, the Intelligentsia, and the people, were complex and at timestumultuous.3 The ever-pending Jewish Question had not met a solution by the end of the Impe-rial period.4 Never able to achieve the distant goal of equality of rights, above all the abolitionof the restriction of the Pale, many Jews felt threatened by constant attempts of a repressivemonarchy to encroach upon their communal autonomy and their traditional ways of life.
The 1881 crisis that followed the assassination of the relatively liberal-minded Tsar AlexanderII, and the ascendance to throne of his reactionary son Tsar Alexander III, is often considereda “turning point” in Jewish History.5 It marked the emergence of new political ideologies, suchas Zionism and revolutionary socialism, and not least, of mass overseas emigration. A wave ofpogroms, anti-Jewish mob violence, broke out that year in the southern city of Elizavetgrad andspread out to many other towns, mainly in New-Russia and the South-West. It was followed by
1 On the definition of shtetl see Klier (2000).2 For classical studies see Rubinow (1907) and Kahan (1986). More on the occupational distribution see
yannayspitzer.net/2012/09/30/jewish-occupations-in-the-pale-of-settlement/.3 Dubnow (1916) is the fundamental study of this topic, notwithstanding many revisions of views since its
publication. See also Baron (1976) for a general overview.4 Klier (1995) is a comprehensive coverage of the period 1855–1881. For the late-imperial period see Rogger
(1986).5 A thesis expounded by Frankel (1980). For a contrary gradualist view see Nathans (2002). Recently, Bartal
(2006, p. 5), concurred with a few reservations regarding Frankel’s thesis but reaffirmed 1881 as a “significantmilestone”. On the other hand, Klier (2011) forcefully rejected any notion that the 1881 crisis was a real turningpoint with lasting effects.
5

the notorious May Laws of 1882 and a series of anti-Jewish legislations that further restrictedthe rights of residence, education, occupation, and political representation of Russian Jews.The prevalent view that there has been some orchestration of these pogroms from the top orbehind the scenes was dismissed in a number of revisionist studies from the past generation.6
Nevertheless, there is little question that the pogroms and the anti-Jewish legislative surge havecontributed to the sense prevalent among Jews and other observers that the conditions of theJews in Russia had become intolerable. Emigration was one of the solutions that were availableon the shelf.
Two decades later, anti-Jewish violence broke out again throughout the Pale. First came theatrocities of the 1903 Kishinev Pogrom, where dozens of Jews were brutally massacred and thou-sands affected. Then followed a massive wave of hundreds of pogroms, mostly concentrated ina single week in October (o.s.), 1905. This time, the casualties and the damage were far greater,and it became clear that the Russian state was at best reluctant to take up the duty of defendingits Jewish subjects.7 A few more events took place in 1906, and while no more pogroms brokeuntil WWI, Russian Jews remained in precarious and uncertain political condition. This wasdemonstrated by the 1911–1913 Beilis Affair, a widely publicized blood libel.
2.2 Pogrom-Driven Migration?
Between 1881 and 1914, 1.5 million Jewish immigrants have migrated to the United States fromthe Pale of Settlement.8 It has been a commonly held view that this mass migration was di-rectly linked to the pogroms: 1881, the year pogroms erupted as a wide-spread movement, iscommonly seen as its starting point; the year 1906, after the second wave of pogroms, saw thegreatest flow, with 125 thousand U.S.-bound Jewish Russian migrants; and the demographiccomposition of Jewish migrants was much different than other ethnicities, with a far greaterdependency ratio, supposedly an indication for migration motivated by non-economic condi-tions.
The Brody Episode was a case in point and an example for a direct link between pogroms andemigration: the 1881 pogroms generated a flight of refugees that flocked across the Austrianborder and remained stranded in the Galician town of Brody. Jewish organizations from Rus-sia, western-Europe, and the United States were recruited to an international relief effort forpogrom victims; as they encountered the Brody refugees it was decided to provide support onthe ground, and a refugee camp was erected and managed by the Paris-based Alliance IsraéliteUniverselle. Rumors that refugees will be supported in emigration to America have uninten-tionally attracted thousands of additional border-crossers during 1881 and 1882. At times therewere more than ten-thousand refugees living on site. A few thousands of them were indeedsupported in migration to America until the camp was finally dispersed by 1883; thousands ofothers were resettled in Russia or found their way to other European countries.9
6 Rogger (1986), Aronson (1990), Rogger (1992), and most comprehensively Klier (2011).7 On the second wave of pogroms see Lambroza (1981) and Lambroza (1992).8 The most comprehensive quantitative study of the Jewish migration is Kuznets’s (1975) seminal work. Godley
(2001, Table 5.4)) revised Kuznets’s estimates for the years 1881–1898.9 Szajkowski (1942) and Klier (2011, Ch. 11). Szajkowski’s widely cited article carried the title “How the Mass
6

Significant examples in scholarly literature of the prevalence of the conception of pogrom-driven migration are numerous. The section of the Dillingham (1911, part III) Report dealingwith the Jewish immigration from Russia, one of the earliest and most important studies ofthe causes of this migration, rejected the idea that it was mainly driven by economic motives;instead, “Let but the pogroms cease and the emigration of the Jews will immediately and con-siderably diminish and will resume those insignificant proportions which it displayed until thepogrom of Kishinef [sic]” (p. 281). This view was also echoed in Mark Wischnitzer’s (1948) fun-damental study highlighting the institutional aspects of the Jewish immigration, as indicated byits title To Dwell in Safety. And hardly a decade ago, a survey of global migration stated that "TheJewish community in Russia was forced into emigration and flight", where "anti-Semitic dis-crimination and pogroms" headed the list of causes for this flight (Hoerder 2002, p. 341).
“It is hard to find a textbook which does not attribute this mass movement to the pogroms,physical and legislative, which befell the Jewish subjects of the Tsar”, wrote the prominentscholar John D. Klier (1996, p. 22), “There is just one problem for the historian: it does not work.”This view reflects what is, arguably, the current consensus among historians, differing with theconception of pogrom-driven migration. One of the main reasons to believe that pogroms didnot play a major role in inducing the migration is the widely held recognition that Jewish im-migrants from pogrom-free Lithuania were over-represented, while relatively fewer came fromthe southern provinces where most of the violence took place. This geographic pattern was al-ready speculated by Rubinow (1907), a speculation reiterated by Kuznets (1975).10 Since then,a number of studies have provided quantitative evidence approving it - Stampfer (1986), basedon the distribution of hometown-based associations; Godley (2001, Ch. 5), based on marriagerecords of Jewish immigrants in London; and Perlmann (2006), based on two cross-sectionalsamples from the Ellis Island records. However, Alroey (2008, Table 4, p. 51), reported a ratherproportional representation across the Pale’s regions, based on lists of applicants for support inemigration.
Following Kuznets (1975), most historians now believe that economic and demographic con-ditions were the main causes for the Jewish migration. Kuznets argued that endemic povertyin the Pale, particularly in Lithuania, exacerbated by exceptionally high demographic pressuresand harmful effects of the Polish and Russian industrialization, explain why and when the Jewsmigrated. Viewed against the backdrop of the European transatlantic migration, and in particu-lar the rising number of east-European immigrants, the majority of them non-Jews, there seemslesser need to resort to pogroms as a major explanation for the migration of Russian Jews. Bothnon-Jews, particularly Poles, from the Russian Empire, and Jews from Austrian Galicia who weregranted equality of rights and did not suffer pogroms, have migrated in great numbers as well.Indeed, Boustan (2007) demonstrated in a time series study that the variation in the scale of theJewish-Russian migration is largely explained by business cycle fluctuations, and that the effectof the pogrom years on the total number of migrants was a modest one.
Migration to America Began,” and stated that following the liquidation of the camp “The stream had begunto move and continued to flow of itself toward America” (p. 304).
10 Although “firm data to test the hypothesis of differential propensity toward emigration among the regions ofthe Pale are lacking” (p. 117). Indeed, in this ground-breaking paper, for which the adjective “comprehensive”would be a gross under-statement, the question of the geographic origins of the Jewish-Russian migration wasthe only stone left unturned.
7

However, previously amassed evidence is quite coarse. While the broad pattern of over-representationof Polish and Lithuanian provinces appears to be robust, it provides no more than an indirectand rough insight into the link between pogroms and migration. As I show, the variation inthe occurrences of pogroms was not only across regions, but also within regions, even withinprovinces. Understanding this link requires higher resolution of data, both temporal and geo-graphical. This paper contributes to the literature by utilizing the new district-year panel dataof pogroms, networks, and migrations. These data provide for the first time the opportunity tomap the evolution of the geographic origins of the Jewish migration over a long period of time,and to relate it to the occurrence of pogroms.
Moreover, all previous studies assumed that the leading role played by the northern provincescould only be a result of their comparatively disadvantageous standards of living. An alternativeexplanation was never considered, one relating this lead merely, or partly, to these provinces’position along the path through which migration networks had spread across space. An expla-nation of this sort was brought forward by Gould (1980b) and Baines (1995) for the late advent oftransatlantic mass migration from the eastern and southern periphery of Europe. According tothis hypothesis, gradual diffusion of migration networks across space was the main reason forwhich countries such as Italy and Russia have produced almost no transatlantic migration priorto the 1880s, in spite of being already significantly poorer than Britain, Germany, and Scandi-navia, where pre-1880s emigration was the strongest. This hypothesis was contested by Hattonand Williamson (1998, p. 15), in whose view migration networks were immensely important,but only in as far as they played a role in making the maturation of the national migration flowsinto full blown mass migration rather gradual.
In other words, there is some dispute regarding the causes of what may be called the Euro-pean Pattern of Transatlantic Mass Migration. According to the ‘internalist’ view, consistentwith Easterlin (1961) and Hatton and Williamson (1998), and applied to the case of the Jewishmigration by Kuznets (1975), the time in which European countries had begun to send largenumbers of migrants across the Atlantic was determined mainly by internal conditions, suchas the advent of industrialization, urbanization, or demographic pressures. The southern andeastern European periphery took decades longer to produce mass emigration because indus-trialization and other transformative processes have arrived there in late. On the other hand,according to Gould’s and Baines’s ‘diffusionist’ view, it is possible that the internal conditionsin the European periphery were ripe decades earlier, but mass migration was delayed simplybecause these countries were further away along the path through which European migrationnetworks have diffused across the continent. In the case of the Jewish migration, if indeed thenorthern provinces of the Pale produced more transatlantic migration, it may well be that thiswas due to their proximity to Germany, where Jewish migration was already happening duringthe 1850s–1870s !!!REFERENCE!!!, and not necessarily due to internal economic or demographicconditions.
Therefore, this paper makes another contribution to the understanding of the Jewish migrationby suggesting, for the first time, to apply to it the diffusionist view and by providing empiricalevidence to its validity. Furthermore, as the resolution and scale of the data created here is,on some dimensions, unprecedented in the study of European migration in general, this paperalso sheds light on the validity of the diffusionist view in regards to the causes for the European
8

Pattern of Transatlantic Mass Migration.
9

3 Data
3.1 Sources
3.1.1 Ellis Island Ship Manifests
The immigration data I use are based on the passenger lists submitted by shipping companiesto the Bureau of Immigration in Ellis Island, in which the personal details of all immigrantsarriving in the facility since 1892 were recorded. While passenger ships manifests have longbeen used as a source in the study of immigration, the records were only recently coded onto amachine readable file.11 The basic sample includes all East-European immigrants in the years1892–1924, more than 5.7 million individual records of migration. Among them are 2.33 millionimmigration records of passengers coming from the Russian Empire (or in later years, from theSoviet Union).
The first challenge pertaining to these data is to identify which of the passengers were Jewish.The problem is that even as the identification of Jews as a distinct ethnic group was required bylaw,12 too many Jews have gone unrecorded as such. Fortunately, I find that poor identificationwas rare—ship manifests either identified Jews, in which case they did it very well in almostall cases, or they did not identify Jews at all. The manifests that did identify Jews provide anArchimedean point to identify Jews systematically. I developed an algorithm predicting whethereach passenger was Jewish or not based on his or her first and last names. As a first stage, it usesthe manifests of ships that identified Jews to assign a measure of Jewishness to each first nameand last name, as well as to their first- and last-name Soundex groups. At the second stage,it predicts whether each passenger was likely to be Jewish based on his or her first and lastname. This algorithm yields very few false positives (i.e., cases in which a non-Jew is mistakenlyidentified as a Jew), while tagging almost all Jewish passengers as Jews.13
The second challenge is to determine the last place of residence reported by each passengerand link it to an actual town in the Pale of Settlement.This identification faces daunting difficul-ties: the towns typically had Slavic names; they were reported by Yiddish-speaking passengers;hand-written by a German, British, or Dutch shipping company clerk; and finally a centurylater, deciphered and transcribed onto a file by a volunteer ignorant of the geography of thePale. The strategy to address this problem was to tailor-fit a text condition for each and everytown, matching each passenger based on the text of the "last place of residence" field, whiletaking into account the following difficulties: (a) phonetic variations and errors; (b) graphicerrors; (c) different towns with similar names; and (d) towns with multiple names or variouspronunciation of the same name.14
11 Another study, and to the best of my knowledge the only one, that has made use of the coded Ellis Island datais Bandiera, Rasul, and Viarengo (2013)
12 It became practice to record immigrants’ ethnicities since mid-1899, and mandatory since 1903. See Weil(2000) and Perlmann (2001).
13 For more details on this algorithm see yannayspitzer.net/2012/11/24/who-is-a-jew-algorithm.14 Previously, Godley (2001) and Perlmann (2006) faced similar tasks of identifying the last place of residence
of London brides and grooms, and of immigrants from an Ellis Island sample. Both of them identified thelast place of residence observation-by-observation, which was challenging yet feasible when the size of the
10

At this point, the procedure has identified immigrants coming from the 426 largest Jewish com-munities, covering more than 3 million Jewish residents as of 1897, out of a total of 5 millionJews in the Pale (and 5.3 million in the Empire as a whole). The effective coverage is surelyhigher than that, since many Jews coming from small townlets tended to report a nearby largertown. Of the 2.33 million Russian immigrants in the file, 1.9 million have reported a potentiallyinformative last place of residence; 779,286 of which I identify as Jews; 602,144 of which havearrived during the fiscal years 1899–1913; and to 295,626 of them I was able to link a particulartown in the Russian Empire.
The town-based identified migrations are aggregated at the district level by year of migration,to form yearly-district measures of total migration. These measures are adjusted by multiplyingacross the board the migration counts of each year such that the yearly total across all identifiedtowns will equal the yearly Jewish-Russian immigration.15 The adjusted measures must, onaverage, be upward-biased, since not all districts contained towns that were among the largest426 Jewish communities. Furthermore, since the effective coverage rate certainly vary acrossdistricts, there is an additional upward or downward bias for each district. To the extent thatthese biases do not vary over the duration of the sample period, the main empirical results willnot be affected, as the benchmark specifications control for district fixed-effects—any constantdistrict-specific bias will be captured by them. These biases will distort the identification if theyhave changed over time, and particularly if the changes were correlated with the distribution ofpogroms. Since the same method was used to identify migration flows in each of the sampleyears, there is little reason to suspect that there are any time trends in these biases.
3.1.2 The 1897 Russian Census
The 1897 Russian Census was the only general census conducted prior to the Russian Revo-lution, and is renowned for its relatively high quality (Clem 1986). While summary tables andindividual figures were often cited from it, there remains a vast wealth of thousands of detailedtabulations, mostly at the district level, that have not been coded or utilized in economic stud-ies as of yet. Since many of the tables were cross-tabulated by ethnicities and religions, thiscensus is the best available data on any Jewish population prior to the formation of the state ofIsrael in 1948, capturing as much as half of world Jewry at that time.
First, a special volume within the census publications enables to map more than 85 percentof the Jewish population down to the level of the locality (TSentral’nyi Statisticheskii Komitet1905). It lists each and every locality in the Russian Empire in which there were more than 500inhabitants, and for each recorded locality it lists the populations of the religious minoritiesthat comprised more than 10 percent of the total population. Since Jews typically lived in smallprovincial market towns, in which they formed a majority of the population,16 this volume al-lows for a fine mapping of the Jewish population in the Pale down to the level of the locality, re-
sample was on the order of a few thousands. Unfortunately, this is not feasible in the current case wherethe size of the sample is on the order of hundreds of thousands, and some sort of an automated script isindispensable.
15 For the yearly Jewish-Russian immigration to the U.S. I use the measures corrected by Godley (2001, p. 73).16 On the patterns of Jewish settlement in the Pale see Rowland (1986).
11

fining the nearly complete district-level mapping provided by the provincial volumes describedbelow. A graphic representation of these data could be seen in the map on Figure 1.
The shtetlach data set was generated from this volume by coding each and every town in Eu-ropean Russia in which a Jewish community was listed. A graphic representation of these datacould be seen in the map in Figure 1.17 It is used to identify the towns that were to be linked tothe Ellis Island arrival records, and it also links each town to its pertaining district, allowing thedistrict-level aggregation of the immigration data.
The census publications contain a series of guberniia- (province) level volumes, one for eachof the empire’s provinces. For each of the 60 provinces of European Russia and the Kingdomof Poland, which include the 25 provinces of the Pale, I coded cross tabulations of ethnicities,age groups, literacy rates, and occupations. I use the tabulations of age groups for the Jewishpopulation in each district to interpolate the size of each cohort in each district as of 1897.18
I use occupational data, enumerating the number of Jews employed in each trade of a list of65 different occupations, to calculate a district-level measure of the ratio of Jews employed incommerce and trade to the number of Jews employed in manufacturing. Since no systematicwage data exists, the commerce-manufacturing ratio uses as a proxy for the level of income ofthe Jewish population in each district.19
3.1.3 Pogroms
Data on the 1881 pogroms was geocoded using the list in Aronson (1990, pp. 50–56), and thepartial mapping of Aronson’s list with a few additional cases in Klier (2011, pp. 22–24). The spo-radic pogroms of 1882–1884 were not available as a comprehensive list, but they were fewer innumber and they did not occur in provinces that were pogrom-free in 1881. Data on the loca-tion and the severity of pogroms during the second wave of 1903–1906 was collected from twosources. Motzkin (1910) is a detailed report including chronologies of dozens of major events,alongside lists of hundreds of relatively minor pogroms. It was based on an extensive groundwork by surveyors sent by the office of the Zionist Organization in Berlin, under the leadershipof the prominent Russian Zionist activist Leo Motzkin. Since the report was partly based ondata that were meant to asses the damage caused by the pogroms to facilitate the funneling ofrelief funds to the victims, each pogrom entry included comparable measures that enable anassessment of pogroms’ severity: Numbers of casualties, severely and lightly wounded, familiesaffected, houses destroyed, shops destroyed, and total damage assessment in Ruble.
Motzkin’s report was completed by another less detailed list published in the 1906/7 AmericanJewish Year Book (Szold 1906), also including some measures of damage caused by the pogroms.It is less accurate, but is nevertheless an important complementary source as it contains a few
17 See a discussion of this map on yannayspitzer.net/2012/07/22/a-new-map-of-jewish-communities-in-the-russian-empire.
18 The interpolation uses polynomial splines to back out yearly cohorts from the 10-years age groups.19 On the correlation between this ratio and the standards of living of the Jews in the Pale see Rubinow (1907),
Kuznets (1975), and Kahan (1986). On the relation between employment in commerce and manufacturingand migration to the U.S., see the critical view of Perlmann (2000);
12

cases in regions that were not covered by Motzkin’s surveyors. I took care to identify errors, du-plicate cases within the AJYB report, as well as repetitions of cases reported by both sources.Altogether the pogroms data includes 388 individual towns whose Jewish communities wereknown to have been hit at least once. According to Lambroza (1981), who collected informa-tion from additional archival sources,20 Motzkin’s list is nearly comprehensive and is largelyoverlapping with the additional archival sources to which I had no access.
3.1.4 Hometown Based Associations (Landsmanshaftn)
The landsmanshaftn data is used to measure the evolution of district-level migration networksover time, and to map pre-1900 migration, prior to the registration of the last place of birth inthe immigration manifests, on which there is no direct evidence. A landsmanshaft is a genericname for hometown-based associations, prevalent in New-York and other large cities in the U.S.since the time of the migration and active well into the second half of the twentieth century.While in many historical cases of mass migration it was customary for immigrants who camefrom a particular region to form associations of mutual benefit or other purposes in the newcountry, the extent to which that was done by East-European Jewish immigrants in New-Yorkwas unprecedented.21 A survey conducted for the 1919–1920 American Jewish Year Book hascounted over 5,000 Jewish organizations with over 1 million memberships, of which 2,421 were“fraternal orders and mutual benefits associations” with 574,163 memberships.22
The landsmanshaftn were the main way of Jewish immigrants to continue the operation ofsome of the traditional social and economic roles previously assumed by the old-country close-knitted kehilah (a corporate Jewish community encompassing all the Jewish population in atown and its vicinity). At the same time they were adapted to provide mutual support in thenew circumstances in America.23 One of their most important roles was to provide social andmaterial support for recent immigrants from the same town.
I use a list of 3,014 hometown-based associations that were incorporated in the New-York Countycourt during the period 1848–1920.24 As general a rule, the name of the pertaining hometownappears as a part of the name of the association, so that in most cases it is straight forwardto link the associations to their hometowns. The court records note the year of incorporation.When immigrants from a particular town had incorporated an association in a particular year,I take it as an indication that around that time the network supporting immigrants from therespective town had thickened.25
20 Unfortunately, I was told in personal communication with Shlomo Lambroza that the file generated for hisdoctoral dissertation and was coded on punch-cards has been lost.
21 In a comparative study of immigrants hometown-based associations, Moya (2005) noted that the Yiddishterm landsmanshaft became an accepted synonym for hometown associations in the historical literature.
22 See Schneiderman (1919, p. 303).23 See Soyer (1997). For a case study on the associations formed by the town of Proskurov see Milamed (1986).24 I am thankful to Ada Green, a volunteer genealogist who created the online version of
this list and was helpful and forthcoming in answering my questions. The list is avail-able online on www.jgsny.org/landsmanshaft/ajhs.htm. Details on its origins are onwww.jgsny.org/landsmanshaft/ajhsintro.htm.
25 Stampfer (1986) used a similar shorter list from Rontch’s (1938) directory to learn about the geographic origins
13

The landsmanshaftn list is not comprehensive. Association that were never incorporated, orwere incorporated outside New-York County could not have reached this list.26 Additionally,it is impossible to differentiate within the list an act of association from an act of changing thename of an association. Also, it appears that on occasions, the same group of recent immigrantsregistered two separate associations around the same time, such as a religious congregationand a mutual benefit association. The names of some associations appear in two separate en-tries, once under a Yiddish, Hebrew, or German name, and again in an English name which wastypically, but not always, a literal translation of the former. I made every effort to avoid double-counting. In particular I used the file number which is available on the list as an indicator forwhether two entries are in fact one, as well as a comparison of the literal sense of the associa-tions’ names in the four languages to spot repeated entries. The task of linking the associationsto their respective towns brought similar challenges as with the Ellis Island records, but this listis of a finite size and allows an observation-by-observation treatment. Moreover, these associ-ations left extensive online paper-trail that facilitated identification.27 While it is too hopefulto expect the problems of over- and under-enumeration to have been eliminated, there is littlereason to suspect that these potential biases are in any way correlated with the characteristicsof the districts.
3.2 Descriptive Statistics
The descriptive statistics of the sample of identified immigrants are reported in Table 1. Panel Areports district-level statistics. The sample covers 215 districts, among them 208 out of the 236district of the Pale of Settlement. These districts had 426 towns whose emigrants were identifiedfrom the Ellis Island records of the period FY 1900–1914.28 This means that on average eachdistrict is represented by almost two towns, where the Jewish population in these towns covered59 percent of the Jewish population of their districts. To the extent that Jewish migrants whocame from smaller localities tended to report the nearest large town, the effective coverage rateis greater than the share of Jews living in identified towns. In the region of New-Russia, thecoverage rate was the greatest, 77 percent, due to the fact that on average Jews in the southlived in larger localities. This may bias upwards the measurement of Jewish migration from thisregion, but as discussed above, as long as the extent of this bias did not change over the sampleperiod, the results presented in the next section should not be affected.
According to the 1897 census an average district in the sample had just over 180 thousand resi-dents, with 12 percent of the population recorded as Jewish by their mother tongue. The densityof the Jewish population did vary - within districts there were many small towns in which Jewscomprised the majority of the population. But there were no districts where their share was
of the Jewish Russian immigrants, but his analysis did not include a time dimension, although the foundingdate of each association was available in the directory.
26 New-York County overlapped with the borough of Manhattan; it did not New-York’s other boroughs.27 In particular, I found the various databases on www.jewishgen.org immensely helpful, and I also relied on
Schwartz and Milamed (1986).28 The few districts beyond the Pale are mainly in the province of Courland, bordering the Lithuanian province
of Kovno on the north. This province had formerly been part of the Pale but officially removed, and manyJewish communities have continued to exist there.
14

lower than 2.5 percent, and in no district it amounted to more than 29 percent of the popula-tion (see also map on Figure 1). The share of Jews employed in commerce to those employedin manufacturing, which stands as a rough proxy for the local standards of living, was lowest inLithuania and highest in the southern regions.
The uneven distribution of pogroms is evident. While 13 percent of the districts had at leastone pogrom reported in 1881, Lithuania had none, and with the exception of the Warsaw 1881Christmas pogrom neither did Poland. The clustered pattern of the first wave can be seen onthe map on Figure 2, where pogroms typically spread from cities to the near countryside.29 Inthe second wave of 1903–1906, half of the districts had at least one pogrom reported, and a ma-jor pogrom was recorded in 30 percent of them.30 This time, however, Polish and Lithuaniandistricts did experience violence, albeit to a lesser degree than southern provinces (see also themap on Figure 3).31 Interestingly, the Lithuanian pogroms mainly took place in the western Be-lorussian provinces of Mogilev and Vitebsk. As we shall see, these provinces in fact had lessermigration than other provinces in Lithuania. This hints that the intra-regional pattern of neg-ative correlation between pogroms and migration may be echoed by a similar inter-regionalpattern; the next section will show that this, on the contrary, is generally not the case.
The bottom rows of Panel A report the measures of network build-up during 1861–1920 and ofmigration during FY 1900–1914. The measure of networks is the average number of landsman-shaftn linked to each district per year, divided by the district’s Jewish population. The measureof migration is the adjusted count of Jewish immigrants aged 16-50 in each year, divided by thesize of their respective cohorts as of 1897. The average yearly-district migration was 13.4 and14.4 per thousand, but importantly, there was great year-to-year volatility, with the rates of mi-gration soaring in 1905 and 1906, then plummeting following the recession of 1907. Even whileconsidering that this measure is restricted to the ages 16-50, this is still one of the highest ratesof European U.S.-bound migration at that period.32
Panel B reports the demographic characteristics of the Russian migrants. The difference be-tween Jews and non-Jews is quite stark (Columns 1 and 2), and, as has already been pointedout in the past,33 may characterize the Jewish migration as "family" or "permanent" migrationdriven partly by non-economic factors. Jewish migrants came in larger family groups, and hadmuch higher rates of females, children, and elderly people, groups that are less likely to be-come gainfully employed. Among the non-Jewish migrants the ratio of married adult malesto married adult females was over three to one, suggesting that most non-Jewish males mi-grated with the intention of returning. In sharp contrast, the number of adult Jewish marriedmales and females was almost equal, consistent with an inclination to permanent migration.34
29 See Aronson (1990, Ch. 7).30 A major pogrom is an arbitrary definition used here, an indicator that in at least one pogrom in the district
there were either casualties (wounded or dead) or large damage (at least 100 families or 500 persons affected,or damage of over 20,000 Rubles).
31 On the question why the provinces of Lithuania were less prone to pogroms see Staliunas (2004), Sirutaviciusand Staliunas (2010), and Le Foll (2010).
32 Compare to Hatton and Williamson (2008, Table 4.2). Also, recall that the adjustment process should havegenerated, on average, an upward bias of these counts.
33 Kuznets (1975, pp. 94–100).34 Sarna (1981) claimed that Jewish return migration was more prevalent than had been thought, but pro-
15

A Comparison of these characteristics across regions shows that the demographic compositionof Jewish migration was quite universal. A minor pattern emerges with the Jewish migrationfrom the Polish provinces being somewhat more "economic" in nature, and the migrants fromNew-Russia having the highest dependency ratios. But considering the magnitude of the dif-ferences between Jews and non-Jews, within-Jewish differences appear small. Whether thesepatterns were sensitive to the occurrence of pogroms will be studied in the next section.
vided no quantitative evidence. Gould (1980a, Table 3) showed that it was the lowest of all ethnicities. Re-cent evidence on return migration by Bandiera, Rasul, and Viarengo (2013), as well as indirect evidence byAbramitzky, Boustan, and Eriksson (2012), indicate that Russia stood out as the country with the lowest ratesof return migration, probably due to the large proportion of Jews among the Russian immigrants.
16

4 Results
4.1 The First Wave of Pogroms: 1881–1882
4.1.1 Pre-Pogroms Migration
As discussed earlier, the first wave of pogroms has been associated with the onset of Jewish massemigration from Russia. Although the existence of such strong link is doubted by historians, theavailable quantitative evidence is still mixed and incomplete. The purpose of this section is thusto examine the evidence on the relation between the first wave of pogroms and the beginningof mass migration, using new evidence on the geographic distribution of pogroms and the in-corporation of landsmanshaftn.
It was suggested that prior to 1881 there had already been a trickle of Jewish migration fromRussia.35 This early flow of migration is clearly captured in the landsmanshaftn data. The mapon Figure 4 marks the locations of the hometowns of landsmanshaftn that were incorporatedduring the years 1861–1880 in the New York County court. A very clear pattern emerges—ifthe landsmanshftn are broadly representative of the local origins of Jewish immigrants, thena very restricted set of provinces had provided the pioneering cohorts of migrants. CongressPoland was clearly the main source: practically all pioneering landsmanshaftn originated there,a handful in Lithuania, and none in the south (seed also Table 1, Panel A, Columns 3–7). Fur-thermore, within Poland migration was concentrated mostly in the northern provinces border-ing with Germany. This pattern has not been identified before. In fact, a rather detailed guessby Jacob Lestschinsky (1961), a prominent scholar who spent much of his life studying Jewishdemographics and migration, on the geographic origins of pre-pogroms migration, had it thatthe pioneers of the Jewish-Russian immigration were Lithuanian Jews fleeing the famine of thelate 1860s: “[...] most of the residents in the Jewish quarters of New York and Chicago in thisdecade [1870s] were Lithuanians. [...] The number of Polish Jews was at first not very great” (p.68).36
4.1.2 Alternative Explanation for the pre-Pogroms Pattern
It is hard to come up with explanations for this pattern wholly based on internal economicconditions. As we shall see, the northern provinces of Poland have continued to provide large
35 Kuznets (1975) estimated the number of Jewish immigrants from the Russian empire during the 1870s at 15-20 thousand, as opposed to 139.5 thousand during the 1880s. Diner (1995) claimed the migration had beenbuilding up since the 1860s and 1870s, and Alroey (2008) reported figures suggesting Kuznets had under-estimated the volume of earlier migration.
36 To be fair, the province of Suwalki, that was administratively part of Congress Poland and appeared to havebeen one of the main sources of early immigration, was in fact "Lithuanian" in the terms of the cultural geog-raphy of the Pale. Its immigrants would have probably been identified as true "Litvaks". However, Lestschin-sky was specifically referring to the 1869 Kovno famine as the driver of early Lithuanian migration (p. 54, also,see below), yet the province of Kovno itself was clearly a late-comer. Later attempts to identify the geographicorigins of the Jewish-Russian migration have failed to pick up this early pattern reported here because theyrelied on post-1900 evidence, or evidence bundling the pre- and post-1900 periods.
17

cohorts of immigrants in subsequent decades as well, but one would be hard pressed to findcauses that made conditions there so much more conducive to immigration in the 1870s com-pared to neighboring Lithuanian provinces, which in the following decades have more thancaught up with the Polish levels of migration. There is no way to measure whether western-Lithuania was worse- or better-off than northern-Congress Poland in terms of standards of liv-ing. But it is a convention in the historical literature that the Lithuanian provinces of Grodno,Kovno and Vilna were the epitome of Jewish-Russian poverty.37
Neither is there a strong case for attributing the geographic distribution of early migration totransformative processes of industrialization or urbanization; early migration did not comeparticularly from the large urban and industrial centers of the north-west. Lodz ("Polish Manch-ester"), the Pale’s third largest Jewish urban community in 1897, did not incorporate an associ-ation in New-York until 1888. Bialistock, another very large center of Jewish industrial labor inthe province of Grodno, had two landsmanshaftn prior to 1881, as did did Warasw, the world’slargest Jewish urban center at the time. Vilna and Minsk, the Pale’s fourth and sixth largest Jew-ish urban communities, had one each. In contrast, all the remaining 42 pre-1881 landsman-shaftn were founded by communities of under 10 thousand Jews (as of 1897), 33 of them bycommunities under 5 thousand, and many of these founded more than one association.
Moreover, if one would look for a local economic shock driving migration from particular ar-eas during the 1870s, the immediate suspect would be the Kovno famine of 1869, mentionedabove. This event gained the attention of western Jewish communities and reports on tens ofthousands of casualties and thousands of refugees have precipitated a founding of a relief com-mittee, that eventually directed and supported several hundred Jewish refugees in migration tothe U.S.38 However, communities from the province of Kovno had founded only a single lands-manshaft prior to 1881. While the province of Suwalki was also hit by this famine, and did in-deed produce a large number of associations, other northern-Polish provinces which were thesource of much of pre-pogroms migration were not mentioned as suffering famine. In otherwords, the famine crisis may have induced many Suwalki Jews to emigrate, but could not havebeen the crucial difference explaining why the early migration came from northern-Poland andnot from western-Lithuania.
Proximity to the border could have played a role in facilitating the migration from border provinces,simply by reducing the costs of travel within Russia en route to the German ports. Undoubtedlythe costs of travel toward the border were burdensome, probably reducing the benefits of mi-gration on the margin, but they could not have been a bottleneck preventing migration fromregions further from the border. First, as we shall see below, provinces that were distanced fromthe border did produce mass emigration in later years. One might suspect that this could beattributed to declining costs of internal transportation, but in fact, Russian Jews migrated overgreat distances within the Pale throughout the nineteenth century. Not the least testimony fortheir resilience to long-range travel within the Pale is found in the more than 700 thousand Jew-ish residents of the provinces of New-Russia, where hardly any Jewish settlement had existeda century earlier, most of them believed to be immigrants or descendants of immigrants from
37 For a classical study on the condition of Jewish workers in Lithuania see Mendelsohn (1970).38 On this episode see Wischnitzer (1948, pp. 28–36), who saw in it the first organized migration that opened the
door to subsequent chain migration.
18

Lithuania.39. Many of these migrations took place decades before railways were available any-where in Russia.
Instead, I argue that a plausible explanation for this pattern is that the previous existence ofmigration networks is a nearly-necessary condition for migration, and that these networks taketime to diffuse across regions. Consistent with Gould’s (1980b) hypothesis on the Europeanpattern of migration, these networks had only started to diffuse during the 1860s and 1870sfrom the German border, where the overseas migration of the neighboring formerly-Polish now-Prussian Jews, mainly from the province of Posen, was already well established during the thirdquarter of the nineteenth century (Diner 1995). Russian Jews living in proximity to the Germanborder stood in contact with their Prussian brethren, and thus became the first to migrate fromwithin the Pale. While positive proof for this assertion is hard to come by, I believe that this, andfurther evidence presented below, are consistent with it. On the other hand, explanations thatattribute the patterns of Jewish migration to internal economic and demographic conditionsalone are insufficient.
This view is supported by statistics that were collected on the immigrants’ relations to personsalready living in the U.S. In the years 1908–1914, of a sample of 656 Jewish immigrants, 62.2 per-cent reported that their ticket was paid by a relative or another person. 94.2 percent reportedthat they were joining a relative, and 4 percent reported joining a friend. The rest, 1.8 percent,reported that they were not joining anyone.40 One way to interpret these figures is that beinglinked to a person already living in the country of destination was a virtual necessary conditionfor migration. All immigrants were linked because an unlinked person could not migrate. Onthe other hand, it may be that by 1908 the networks were already well saturated, such that al-most every prospective migrant could name a relative or a friend in America upon arrival to theU.S. port of entry, whether his arrival depended on this link or not.
4.1.3 Post-1881 Migration
The maps on Figure 5 show landsmanshaftn incorporated during the decade following the 1881pogroms. The disjoint between the two areas is so stark that no statistical analysis is requiredbeyond eyeballing: The post-1881 migrants did not come from areas that had experiencedpogroms. Instead, the migration that immediately followed the pogroms was a rather smoothcontinuation and expansion of previous trends, where the neighboring western-Lithuanianprovinces of Kovno, Vilnia, Grodno, and Minsk have contracted emigration. The handful ofpioneering southern landsmanshaftn was an exception rather than the rule. Again, Lestschin-sky (1961) had it wrong: “The pogroms of the 1880s brought mostly Ukrainian Jews” (p. 68;the south-west and New-Russia regions were roughly equivalent to the Ukrainian territories ofthe Russian Empire). It was only later during the 1890s and early 1900s that evidence of largescale emigration appeared in the south (Figure 6), mainly from the south-western provincesof Volhinia, Podolia, and Kiev, but even then not necessarily from places that had experiencedpogroms. Over all, the rate of landsmanshaftn incorporation during the entire period 1882–
39 On internal Jewish migration within the Pale see Stampfer (1995).40 Kuznets (1975, Table XIII).
19

1905 was around four times greater in Poland and Lithuania compared to the pogrom-strickensouth (Table 1, Panel A).
As strong as this evidence may be, it does not yet rule out that pogroms, and more broadlypersecution, induced migration. It is still possible that migration during the 1880s and 1890s,although coming from different regions, was boosted by the general country-wide shock of the1881 crisis and the ensuing “legislative pogroms”. However, there is little in the data indicat-ing 1881 as a country-wide turning point—the increase in the volume of migration around thattime could be regarded as a natural continuation of the process that had budded during the1870s, which might have occurred even if the pogroms had never happened. The rising num-bers of migrants during the 1880s compared to the previous decade may well be attributed togeographic expansion of the migration base rather than to an increase in the rate of migrationin the already exposed districts.
But the case for a local effect of pogroms is not lost. The pogrom victims in the south may havereceived a very strong incentive to emigrate, but not having been linked to a chain of migration,they did not have the opportunity to respond to those incentives. The Brody Episode is a perfectdemonstration of this case, where thousands of victims directly affected by pogroms wanted tobecome migrants but were not able to do so. The demand curve may have shifted outwards, butthe supply curve was perfectly inelastic at close to zero—emigration was not yet in the choiceset of pogrom victims.
4.2 The Second Wave of Pogroms: 1903–1906
4.2.1 Main Patterns
If there ever was a local effect of pogroms, it should be sought following the second wave,when most regions had already experienced emigration to some degree, and moving to theUnited States had entered the choice set of victims. The maps on Figure 7 plot the 1903–1906pogroms alongside the landsmanshaftn incorporated during the following decade, and reveala more mixed pattern.41 Pogroms became more widespread, reaching Poland and the easternprovinces of Lithuania, as well as previously little-affected areas in the south, such as Bessarabiaand northern Chernigov province. Nevertheless, the south again took a greater hit: 89 percentand 70 percent of the districts of New-Russia and the southwest were affected by a pogrom,compared to 55 percent and 22 percent in Lithuania and Poland (see Table 1, Panel A, Columns3-6).
The post-1906 landsmanshaftn build-up was still stronger in Poland and Lithuania, but thesouthwest was experiencing a formidable increase of over 80 percent in 1906–1920 comparedto the previous 25 years. While the average rates of northern emigration during 1906–1914 haveslightly declined compared to 1900–1905, emigration from the southwest increased by morethan 70 percent and surpassed those of Poland with 14.46 migrants per 1,000. Interestingly,emigration from the region that was hardest-hit, New-Russia, seemed to have remained the
41 On Period there already exist direct migration data from Ellis Island; the maps show landsmanshaftn insteadof actual migration measures in order to facilitate comparability to the previous maps.
20

lowest with a lesser post-pogroms increase than the southwest. To advance beyond the cruderegional patterns, district-level difference-in-differences regressions will address the questionat stake: whether a district that had suffered at least one pogrom has subsequently producedmore emigration than a similar unharmed district.
4.2.2 The Determinants of Pogroms
But first, pogroms were by no means randomly assigned. The main danger to identificationwould be if the allocation of pogroms was correlated with differential trends in migration. Forexample, if pogroms were more likely to occur in districts that came late into migration but werecatching up, and therefore experienced a rising trends compared to other districts regardless ofthe pogroms, this will show as a spurious correlation between pogroms and migration. Whetherpogroms were correlated with such trends can not be tested here directly, but the followinganalysis informs on the extent of the problem of non-random allocation of pogroms.
Table 2 reports OLS district-level regressions of pogroms on possible determinants. The re-gional pattern was already noted, and as reported in Columns 2 and 3 it is clearly reflectedagain in the regressions: New-Russia was hit the hardest, followed by the southwest, Lithuania,and finally Poland (the omitted category). Column 3 adds district characteristics to the controlvariables. Importantly, there does not seem to be any correlation at all between total 1900–1905emigration and the probability to suffer a pogrom. The coefficient on the log of prior migrationis -0.014, meaning that a 10 percent greater emigration in 1900–1905 is associated with 0.14percent lower probability to experience pogroms, and it is statistically insignificant. Being thecapital district of the province has a strong, positive, and statistically significant correlation withpogroms probability, a 30.5 percent increase, possibly due to the presence of a large city withinthis district. The commerce-manufacturing ratio does not have a significant effect. Addingprovince fixed-effects (Column 4) improves the prediction, but does not change the qualitativeresults.
There is a strong unconditional correlation between having experienced a pogrom in 1881 andin 1903–1906 (Column 1), reflecting the fact that the first wave occurred only in the south, andthe later mostly there as well. But this correlation is wiped out as soon as the regional indica-tors are added: within regions, a 1881 pogrom does not help predict pogroms in the secondwave.42 It is reassuring that after controlling for district characteristics and province fixed-effects pogroms were uncorrelated with emigration in the years 1900–1905, and it partly alle-viates the fear of differential trends. It is nevertheless important to control for anything thatmight change across time and space while trying to identify the effects of the pogroms on sub-sequent migration.
42 For evidence to the contrary over a very long range of time, linking medieval pogroms to persecution of Jewsin Weimar- and Third-Reich-Germany, see Voigtländer and Voth (2012).
21

4.2.3 Effects of Pogroms on Migration
Table 3 reports a series of Difference-in-Differences OLS regressions over the sample of district-years predicting the level of (log) yearly rate of migration. Column 1 first reports a plain differ-ence regression of migration on a district-level pogrom indicator, effectively comparing pogromdistricts with non-pogrom districts. Surprisingly, although the regional correlation of pogromsand migration was negative, pogrom-districts have on average had no different rates of mi-gration compared to other districts over the period 1900–1914. Column 2 reports a basic un-controlled DID regression of migration on indicators of pogrom-districts, after-pogrom indi-cator (year 1906 and above), and an interaction term between the two. The coefficient on theinteraction term is large and statistically significant, suggesting that post-pogrom emigrationwas 0.266 log points (30.47 percent) greater in pogrom-districts. Adding district characteristics,year-dummies and a set of province fixed-effects (Column 3) does not change the estimatedeffects. Capital districts are strongly correlated with more migration, and that could be relatedeither to the above mentioned potential upward estimation of migration from district that hadthe same name as their province, or to the greater tendency of urban cohorts to migrate. Thissuggests that further control may be warranted.
The regression reported in Column 4 replaces the district controls with district fixed-effects, andadds a set of year-region dummies. This is a far reaching control that is meant to take account ofall district-invariable characteristics, as well as region effects that are allowed to change freelyyear by year. It will be regarded as the baseline specification. Accordingly, the R-squared of theregression increases sharply with 79 percent of the variance explained by the predictions of theregression. The pogrom effect is somewhat weakened, but it is still economically and statisti-cally significant—pogrom-districts have had a post-pogrom effect of increasing migration by0.211 log points (23.4 percent) over the nine years following the second wave.
The last regression on Column 5 is an "overkill" specification, adding a set of province-yeardummies. The identification is derived from the yearly within-province differences in the de-viations from the district-specific averages between pogrom and non-pogrom districts. To theextent that there are within-province spill-over effects of pogroms, the estimate will be down-ward biased. And indeed, the estimate of the pogrom effect decreases to almost half its sizein previous regressions. While it is still, arguably, economically significant (0.122 log points, or12.9 percent), it is no longer statistically significant.
4.3 Heterogenous Effects
The estimates presented in the previous section assume that the effects of the pogroms wereuniform, both across space, and over the post-pogrom period. However, one may suspect thatthis may not be the case. For example, it could be that the effect of the pogroms was stronger inregions in which more districts were hurt, or that it varied with standards of living. Also, if thepogroms were a temporary shock that subsided within a few years, as local Jewish communitiesrealized it might have been a one-off event, then the effect should decline over time.
22

4.3.1 Regional-Specific Effects
Table 4 tests for region-specific effects, by adding to the last three specifications of Table 3 aregion-specific DID term. Unfortunately, the patterns are not perfectly consistent across speci-fications, and therefore it is hard to take away a clear conclusion from this exercise. The baselinespecification (Column 2), indicates that the pogrom effect was the strongest in Lithuania (0.512log points, or 66.9 percent), and non-existing in Poland and New-Russia. It is hard to rationalizethis pattern, and furthermore, the more basic specification in Column 1 estimates an equallystrong effect in both Lithuania and New-Russia, while the "overkill" specification (Column 3)has New-Russia with the strongest effect, although statistically insignificant.
4.3.2 Year-Specific Effects
Table 5 reports a similar exercise, in which the pogrom effects are separated by years.43 Twobroad patterns are emerging here. First, in all specifications the effect seems to weaken verygradually from 1906 onward, but then to re-surge in 1914. Again, it is hard to come up with anexplanation for the 1914 effect, but at any rate it does not seem that the pogrom shock was aone-off effect. Second, in the benchmark and the "overkill" specifications (Columns 2 and 3),the year in which the pogrom effect was strongest was FY 1904, which was prior to the occur-rence of almost all pogroms. This may be a case of a random outlying year, or if taken at facevalue, an indication that some pogrom-districts had experienced a local crisis already priorto the eruption of the second wave of pogroms, and that this crisis had caused both the pre-pogrom emigration and the pogrom itself. If the latter is true, then the interpretation givenabove to the pogrom coefficients as a causal relation must be discounted.
4.4 Pogroms and Demographic Composition
The claim that the Jewish migration was pogrom- or persecution-driven is supported by its ob-served peculiar demographic composition—a large proportion of non-labor force participantsis regarded as a sign that the intention is resettlement and that the lure of the American labormarket was not the only factor inducing migration. But was the demographic composition in-deed sensitive to pogroms? We can test that at the local level, by estimating the differences inthe changes in demographics of migrants between pogrom-districts and non-pogrom-districts.In other words, was there a differential trend towards more permanent migration in districtsthat have suffered violence?
Table 6 addresses this question by reporting the results of a set of DID regressions of demo-graphic characteristics on pogroms, using the same specifications as in Tables4 and 5. In allspecifications, all the coefficients with the exception of the share of elderly people have theexpected sign, according to the hypothesis that pogroms make the migration look more "per-manent". For example, in the baseline specification (Column 2) the estimate of the effect ofpogrom on the share of females is an increase of 3 percentage points in their share among all
43 In Columns 2 and 3, one effect has to be omitted and 1900 serves as an omitted category.
23

migrants; the estimates for the effect on the share of children, adult females, and on the house-hold size, are all positive, and the estimated effects on the share of adult males and the share ofmarried males-to-females are negative. But almost all the coefficients are statistically insignifi-cant, and their magnitudes are by no means spectacular. The most likely scenario is that therewas some local effect on the composition of migrants, but that the pogroms did not producedistinct local flows of immigrants that look like refugees in the following years.
Neither was there a dramatic Pale-wide change in the demographic composition of the Jewishmigrants following the second wave of pogroms. Table 7, Panel A, reports average demographicsof all Jewish-Russian migrants by periods. Comparing FY 1898–1904 (Column 1) with FY 1906–1914 (Column 3), there does seem to be an increase in the share of females, which went upby 4 percentage points, and a decline in the ratio of married males to married females. Butother indicators such as the number of children and the size of the average household remainedunchanged.
However, Table 7 also shows that the demographic composition was sensitive to events otherthan the second wave of pogroms. First, Column 4 reports the post-WWI migration. As Kuznets(1975, p. 99) has already noted, this was a truly “refugee or relief immigration”, with almost 60percent females, an average household size of 2.9 aboard the ship, and a ratio of 0.41 marriedmales to married females(!). No doubt, these are families of refugees from the far worst pogromsof the revolutionary period, many of them reuniting with a male head of household after yearsof separation in which migration was discontinued.
A second finding is that FY 1905 was dramatically exceptional. In particular, the share of adultmales went up to 51.9 percent, compared to 38.6 percent before and 34.5 percent after; theratio of married males to married female rose to roughly double its regular level; the averagesize of migrating household went down; and the share of all groups other than adult malesdeclined. No such pattern appears in other years (except, to a smaller extent, in FY 1904), andno equivalent trend characterizes the non-Jewish migration (Panel B.). In all likelihood, thisreflects the flight of thousands of young adult Jewish males from conscription to the army inview of the 1904–1905 Russo-Japanese war by migration to the U.S.44
According to the official figures there were 92,388 Jewish-Russian immigrants during FY 1905.Assuming that absent the war the share of adult Jewish males would have remained the same asin the previous seven years, as many as additional 20 thousand adult male immigrants can beregarded as wartime migrants avoiding conscription during that year. To the extent that someof the immigrants pushed by the prospects of conscription were joined by members of theirfamilies who were not adult males, this estimate should be regarded as a lower bound.
Beyond the interest of these particular episodes, the lesson from the cases of the Russo-Japanesewar and the post-WWI years is the following: when Russian-Jews migrated as refugees, this isreflected in the data through changes in their demographic composition. Indeed, it can notbe ruled out that the pogroms had some composition effect, or that over the entire period thepeculiar demographic patterns of the Jewish migration could be partly attributed to repression
44 The war lasted from February 1904 to September 1905, including the latter part of FY 1904, the entire FY 1905,and the beginning of FY 1906.
24

and the prospects of violence and persecution.45 But as far as the demographic composition isregarded, the second wave of pogroms was no turning point - neither in the country as a wholenor in the affected districts.
45 In future versions of this paper, this question will be addressed by comparing Russian-Jews to Austrian-Jewsmigrating from Galicia.
25

5 Conclusion
The main empirical findings presented in the paper are the following: Pre-1881 emigration tookplace in a confined area in Congress Poland, along the German border. From these regions itgradually spread out to neighboring provinces, reaching western Lithuania during the 1880sand the southwest only in the late 1890s. By the turn of the century, Jewish migration becamemore evenly spread across the Pale, except for New-Russia which was still under-represented.The 1881 pogroms cannot be related in any visible and direct way to subsequent migration—the post-1881 trend was a direct continuation of the pre-1881 trend and did not involve migra-tion from pogrom areas. The second wave of pogroms was more evenly distributed across thePale, and pogroms may have produced local effects that increased the level of migration. Thebaseline estimate is that a pogrom-district had 23.4 percent more migration than similar non-pogrom-districts during the next nine years, and to the extent that there was a country-wideshock, or spillover effects across districts, this should be regarded as a lower bound. It doesnot seem that this was a one-off effect concentrated in the year of the pogroms and the onefollowing it, and the evidence for heterogeneous region-specific effects is mixed. There is weaksupport at best to the claim that the second wave of pogroms generated more complete familymigrations, and if it did it was a rather small change.
These findings help creating an updated narrative of the Jewish migration from the Pale of Set-tlement and provide a relevant lesson for our understanding of the European pattern of transat-lantic mass migration. The way through which the landsmanshaftn evolved during the last thirdof the nineteenth century is a substantial affirmation of the hypothesis expounded by Gould(1980b) and Baines (1995), according to which gradual diffusion of migration networks acrossspace was largely responsible to the rather late arrival of mass emigration to southern and east-ern Europe. Little else can explain why the western Lithuanian provinces, by all accounts thePaleâAZs poorest, have entered mass emigration with more than a decade lag behind Poland,and why the south-western provinces of Volhinia, Podolia, and Kiev took a decade longer. Thetiming of the onset of Jewish mass migration had little to do with the crisis of 1881, and althoughpogroms may have well affected the inclination to migrate, this inclination could not have ma-terialized in 1881 as it did in 1905 because the victims were not yet linked to previous chains ofmigration. The growth in Jewish migration during the 1880s was likely on the extensive margin,a result of a broadening of the geographical base of emigration, rather than on the intensivemargin, stronger migration from provinces that were already sending migrants before.
Internal circumstances—pogroms, persecution, industrialization, declining costs of transporta-tion, supposed absolute or relative declines in the standards of living, and demographic pressures—all of these have been mentioned as explanations for the timing of the Jewish mass migration.Economic conditions, such as real wages and employment prospects certainly did matter, and Istudy their effects on the Jewish migration on Spitzer (2013). But I find previous explanations forthe timing of the Jewish mass migration incomplete. I argue that the long time that migrationchains took to diffuse across space was a key factor, possibly the chief factor that determinedwhen, where, and how the Jewish mass migration was to occur. This claim is consistent witheverything that we observe, and too much is left unexplained without it.
26

References
Abramitzky, Ran, Leah Platt Boustan, and Katherine Eriksson (2012), A Nation of Immigrants:Assimilation and Economic Outcomes in the Age of Mass Migration, Working Paper 18011,National Bureau of Economic Research.
Alroey, Gur (2008), The Quiet Revolution: Jewish Emigration from the Russian Empire 1875-1924(in Hebrew), Jerusalem: The Zalman Shazar Center for Jewish History.
Aronson, Irwin M. (1990), Troubled Waters: The Origins of the 1881 Anti-Jewish Pogroms in Rus-sia, Pittsburgh, PA: University of Pittsburgh Press.
Baines, Dudley (1995), Emigration from Europe 1815-1930, Cambridge: Cambridge UniversityPress.
Bandiera, Oriana, Imran Rasul, and Martina Viarengo (2013), “The Making of Modern America:Migratory Flows in the Age of Mass Migration”, Journal of Development Economics 102.
Baron, Salo W. (1976), The Russian Jew under Tsars and Soviets, New York, NY: Macmillan.Bartal, Israel (2006), The Jews of Eastern Europe, 1772-1881, Philadelphia, PA: University of Penn-
sylvania Press.Boustan, Leah Platt (2007), “Were Jews Political Refugees or Economic Migrants? Assessing the
Persecution Theory of Jewish Emigration, 1881–1914”, in The New Comparative EconomicHistory: Essays in Honor of Jeffrey G. Williamson, ed. by Timothy J. Hatton, Kevin H. O’Rourke,and Alan M. Taylor, Cambridge, Mass: MIT Press.
Clem, Ralph S., ed. (1986), Research Guide to the Russian and Soviet Censuses, Studies in SovietHistory and Society, Ithaca: Cornell University Press.
Dillingham, William Paul (1911), Emigration Conditions in Europe, United States ImmigrationCommission (1907-1910), U.S. Government Printing Office.
Diner, Hasia (1995), “Before the Promised City: Eastern European Jews in America Before 1880”,in An Inventory of Promises: Essays on American Jewish History in Honor of Moses Rischin, ed.by Jeffrey Gurock and Marc L. Raphael, New York, NY: Carlson.
Dubnow, Simon (1916), History of the Jews in Russia and Poland, from the Earliest Times Un-til the Present Day, trans. by Israel Friedlaender, Philadelphia: Jewish Publication Society ofAmerica.
Easterlin, Richard A. (1961), “Influences in European Overseas Emigration before World War I”,Economic Development and Cultural Change 9:3.
Godley, Andrew (2001), Jewish Immigrant Entrepreneurship in New York and London 1880-1914,New York, NY: Palgrave Macmillan.
Gould, John D. (1980a), “European Inter-Continental Emigration. The Road Home: Return Mi-gration from the U.S.A.”, Journal of European Economic History 9:1.
— (1980b), “European Inter-Continental Emigration: The Role of ’Diffusion’ and ’Feedback’”,Journal of European Economic History 9:2.
Hatton, Timothy J. and Jeffrey G. Williamson (1998), The Age of Mass Migration: Causes andEconomic Impact, New York, NY: Oxford University Press.
27
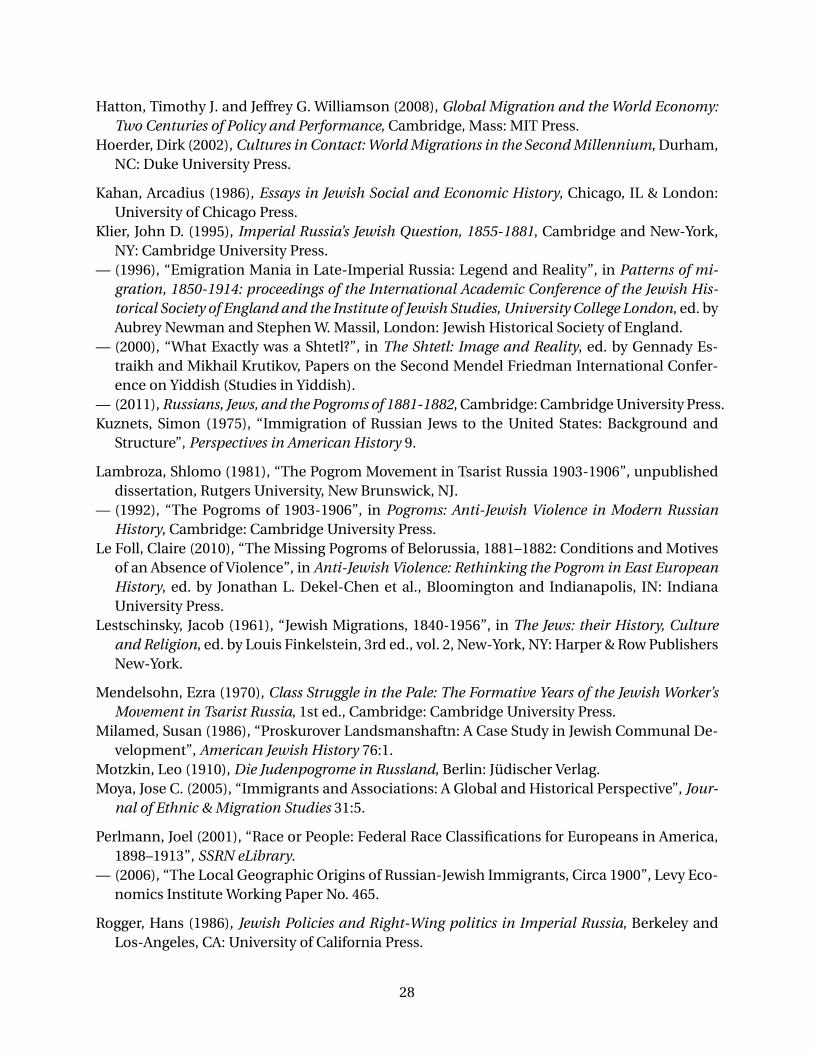
Hatton, Timothy J. and Jeffrey G. Williamson (2008), Global Migration and the World Economy:Two Centuries of Policy and Performance, Cambridge, Mass: MIT Press.
Hoerder, Dirk (2002), Cultures in Contact: World Migrations in the Second Millennium, Durham,NC: Duke University Press.
Kahan, Arcadius (1986), Essays in Jewish Social and Economic History, Chicago, IL & London:University of Chicago Press.
Klier, John D. (1995), Imperial Russia’s Jewish Question, 1855-1881, Cambridge and New-York,NY: Cambridge University Press.
— (1996), “Emigration Mania in Late-Imperial Russia: Legend and Reality”, in Patterns of mi-gration, 1850-1914: proceedings of the International Academic Conference of the Jewish His-torical Society of England and the Institute of Jewish Studies, University College London, ed. byAubrey Newman and Stephen W. Massil, London: Jewish Historical Society of England.
— (2000), “What Exactly was a Shtetl?”, in The Shtetl: Image and Reality, ed. by Gennady Es-traikh and Mikhail Krutikov, Papers on the Second Mendel Friedman International Confer-ence on Yiddish (Studies in Yiddish).
— (2011), Russians, Jews, and the Pogroms of 1881-1882, Cambridge: Cambridge University Press.Kuznets, Simon (1975), “Immigration of Russian Jews to the United States: Background and
Structure”, Perspectives in American History 9.
Lambroza, Shlomo (1981), “The Pogrom Movement in Tsarist Russia 1903-1906”, unpublisheddissertation, Rutgers University, New Brunswick, NJ.
— (1992), “The Pogroms of 1903-1906”, in Pogroms: Anti-Jewish Violence in Modern RussianHistory, Cambridge: Cambridge University Press.
Le Foll, Claire (2010), “The Missing Pogroms of Belorussia, 1881–1882: Conditions and Motivesof an Absence of Violence”, in Anti-Jewish Violence: Rethinking the Pogrom in East EuropeanHistory, ed. by Jonathan L. Dekel-Chen et al., Bloomington and Indianapolis, IN: IndianaUniversity Press.
Lestschinsky, Jacob (1961), “Jewish Migrations, 1840-1956”, in The Jews: their History, Cultureand Religion, ed. by Louis Finkelstein, 3rd ed., vol. 2, New-York, NY: Harper & Row PublishersNew-York.
Mendelsohn, Ezra (1970), Class Struggle in the Pale: The Formative Years of the Jewish Worker’sMovement in Tsarist Russia, 1st ed., Cambridge: Cambridge University Press.
Milamed, Susan (1986), “Proskurover Landsmanshaftn: A Case Study in Jewish Communal De-velopment”, American Jewish History 76:1.
Motzkin, Leo (1910), Die Judenpogrome in Russland, Berlin: Jüdischer Verlag.Moya, Jose C. (2005), “Immigrants and Associations: A Global and Historical Perspective”, Jour-
nal of Ethnic & Migration Studies 31:5.
Perlmann, Joel (2001), “Race or People: Federal Race Classifications for Europeans in America,1898–1913”, SSRN eLibrary.
— (2006), “The Local Geographic Origins of Russian-Jewish Immigrants, Circa 1900”, Levy Eco-nomics Institute Working Paper No. 465.
Rogger, Hans (1986), Jewish Policies and Right-Wing politics in Imperial Russia, Berkeley andLos-Angeles, CA: University of California Press.
28
Rogger, Hans (1992), “Conclusion and Overview”, in Pogroms: Anti-Jewish Violence in ModernRussian History, ed. by John D. Klier and Shlomo Lambroza, Cambridge and New-York, NY:Cambridge University Press.
Rontch, Issac E., ed. (1938), Di Idishe Landsmanshaft.n fun Nyu York. (The Jewish Landsman-schaften of New York), New-York, NY: I. L. Peretz Yiddish Writers’ Union.
Rowland, Richard H. (1986), “Urbanization and Migration Data in Russian and Soviet Cen-suses”, in Research Guide to the Russian and Soviet Censuses, Ithaca, NY: Cornell UniversityPress.
Rubinow, Isaac M. (1907), “Economic Condition of the Jews in Russia”, U.S. Bureau of LaborBulletin 15.
Sarna, Jonathan D. (1981), “The myth of no return: Jewish return migration to Eastern Europe,1881-1914”, American Jewish History 71:2.
“Jewish National Organizations in the United States” (1919), American Jewish Year Book 21, ed.by Harry Schneiderman.
Schwartz, Rosaline and Susan Milamed (1986), A Guide to YIVO’s Landsmanshaftn Archive, YIVOInstitute for Jewish Research.
Sirutavicius, Vladas and Darius Staliunas (2010), “Was Lithuania a Pogrom-Free Zone? 1881-1940”, in Anti-Jewish Violence: Rethinking the Pogrom in East European History, ed. by JonathanL. Dekel-Chen et al., Bloomington and Indianapolis, IN: Indiana University Press.
Soyer, Daniel (1997), Jewish Immigrant Associations and American Identity in New York, 1880-1939, Cambridge, Mass: Harvard University Press.
Spitzer, Yannay (2013), “The Dynamics of Mass Migration: The Economics of the Jewish Exodusfrom the Pale of Settlement in Tsarist Russia”.
Staliunas, Darius (2004), “Anti-Jewish Disturbances in the North-Western Provinces in the Early1880s”, East European Jewish Affairs 34:2.
Stampfer, Shaul (1986), “The Geographic Background of East European Jewish Migration to theUnited States before World War I”, in Migration Across Time and Nations: Population Mobilityin Historical Contexts, ed. by Ira A. Glazier, New York: Holmes and Meier.
— (1989), “The 1764 Census of Polish Jewry”, Annual of Bar-Ilan University Studies in Judaicaand the Humanities 24–25.
— (1995), “Patterns of Internal Jewish Migration in the Russian Empire”, in Jews and Jewish Lifein Russia and the Soviet Union, ed. by Yaacov Ro’i, Illford, Essex: Frank Cass.
Szajkowski, Zosa (1942), “How the Mass Migration to America Began”, Jewish Social Studies 4:4.Szold, Henrietta (1906), “From Kishineff to Bialystok: A Table of Pogroms from 1903 to 1906”,
American Jewish Year Book 8.
TSentral’nyi Statisticheskii Komitet, [Central Statistical Committee] (1905), Naselennyia mestaRossiiskoi Imperii v 500 i bolee zhitelei s ukazaniem vsego nalichnago v nikh naseleniia ichisla zhitelei preobladaiushchikh veroispovedanii, po dannym Pervoi vseobshchei perepisinaseleniia 1897 g. St. Peterburg: Tip. Obshchestvennaia pol’za.
Voigtländer, Nico and Hans-Joachim Voth (2012), “Persecution Perpetuated: The Medieval Ori-gins of Anti-Semitic Violence in Nazi Germany”, The Quarterly Journal of Economics 127:3.
Weil, Patrick (2000), “Races at the Gate: A Century of Racial Distinctions in American Immigra-tion Policy (1865-1965)”, Georgetown Immigration Law Journal 15.
29

Wischnitzer, Mark (1948), To Dwell in Safety: The Story of Jewish Migration Since 1800, Philadel-phia, PA: Jewish Publication Society of America.
30

31

Table 1: Descriptive statistics
(1) (2) (3) (4) (5) (6) (7)
A. Districts Average St. Dev. Poland Lithuania Southwest New-Rus. Inner Rus.
Total population (1,000s) 181.45 109.15 115.64 186.03 233.78 276.26 73.06Jewish population (1,000s) 21.75 21.21 16.34 26.32 24.99 25.60 4.45Number of towns identified 1.98 1.23 1.51 2.06 2.69 1.96 1.00Coverage 0.59 0.26 0.55 0.50 0.60 0.77 0.99Commerce-to-manufacturing -0.13 0.93 -0.14 -0.86 0.51 0.22 -0.67Pogroms
1881 0.13 0.01 0.00 0.28 0.44 0.001903-1906 0.50 0.22 0.55 0.70 0.89 0.141903-1906, major 0.30 0.11 0.25 0.44 0.74 0.00
Landsmanshaftn (per 100k-year)1861-1881 0.09 0.36 0.25 0.01 0.00 0.00 0.001882-1905 0.68 0.94 1.02 0.90 0.26 0.23 0.421906-1920 0.99 1.09 1.44 1.04 0.75 0.35 0.16
Migration (per k.-year)FY 1900-1905 13.36 21.28 13.03 19.06 8.44 6.44 38.39FY 1906-1914 14.39 11.68 12.58 17.93 14.46 8.99 26.98
Observations 215 74 53 54 27 7
(1) (2) (3) (4) (5) (6) (7)
B. Immigrants Demographics Non-Jews Jews Poland Lithuania Southwest New-Rus. Inner Rus.
Female 0.293 0.459 0.442 0.467 0.460 0.481 0.489Child (under 16) 0.122 0.287 0.283 0.289 0.299 0.309 0.286Elderly (over 44) 0.028 0.063 0.055 0.064 0.064 0.084 0.101Adult female 16-44 0.225 0.281 0.269 0.290 0.273 0.278 0.290Adult male 16-44 0.625 0.369 0.393 0.357 0.364 0.328 0.324Adult male 16-30 0.484 0.292 0.312 0.289 0.281 0.254 0.254Married mal./married fem. 3.225 1.175 1.251 1.078 1.243 0.948 1.018Household size 1.585 2.375 2.248 2.309 2.553 2.724 2.688
Observations 996,315 602,144 61,022 133,799 73,154 42,685 9,810
Regional Averages
Regional Averages (Jews)
Notes: Panel A. Coverage is the proportion of Jews within the district residing in the towns for which migration was identified. Commerce-to-manufacturing is the log of ratio of Jews employed in commerce to Jews employed in manufacturing, normalized to have mean zero and st.dev. one across all districts in the pale (the mean and the st. dev. are therefore slightly different in the current sample). A major pogrom in1903-1906 is one in which either there were casualties or great damage reported. Landsmanshaftn is the number of associations pertaining tothe districts over the period, divided by the district population. Migration is the number of immigrants in ages 16-50 in each year divided bythe size of their respective cohorts in 1897, adjusted by the yearly ratio of observed migration to total Jewish-Russian migration. Migration ismeasured by Fiscal Years (e.g., FY 1904 went from July 1, 1905 to June 30, 1905).Panel B. The sample in Columns (1) and (2) includes all immigrants during FY 1900-1914 who reported a last place of residence that did notindicate a place outside Russia. The sample in Columns (3)–(7) includes all predicted-Jews whose last place of residence was identified.
32

Table 2: Determinants of pogroms 1903–1906
Dep. Var.: Pogrom 1903-1906 (1) (2) (3) (4)
Pogrom 1881 0.326 0.030 0.005 -0.019(0.099) (0.102) (0.102) (0.114)
Lithuania 0.331 0.357(0.079) (0.083)
Southwest 0.479 0.486(0.083) (0.085)
New-Russia 0.660 0.654(0.108) (0.108)
Inner-Russia -0.073 -0.050(0.174) (0.174)
Commerce/manufacturing 0.018 -0.056(0.041) (0.061)
Capital district 0.305 0.258(0.098) (0.101)
Migration 1900-1905 -0.014 0.005(0.027) (0.033)
Constant 0.460 0.216 0.203 0.457(0.036) (0.051) (0.069) (0.066)
Province F.E.
R-squared 0.048 0.248 0.282 0.388P-value of F-test 0.001 0.000 0.000 0.019
Note: The table reports the outcomes of OLS regressions over a indicator for a pogrom occuring in the district during the wave of 1903–1906.The omitted category among the regions is Poland. Commerce-to-manufacturing is the standardized log of the ratio of Jews employed incommerce to those employed in manufacturing. Capital district is a dummy for the main district of the province, upon which the provinceis typically named. Migration is the mean of yearly migration of the cohorts ages 16-50 over FY 1900–1905, adjusted for the ratio betweenobserved and official Jewish-Russian migration. Standard errors are in parentheses. In all specifications N = 215.
33

Table 3: Difference-in-Differences effects of pogroms on migration
Dep. Var.: Migration (1) (2) (3) (4) (5)
After pogrom 0.266 0.266 0.211 0.122(0.086) (0.086) (0.093) (0.088)
Pogrom 0.067 -0.092 0.007(0.138) (0.170) (0.147)
After 0.341(0.064)
Commerce/manufacturing -0.234(0.121)
Capital district 0.762(0.153)
Landsmanshaftn 1899 0.021(0.009)
Time F.E. YearYear
RegionYearProv.
Geographic F.E. Province District District
R-squared 0.001 0.038 0.455 0.791 0.840P-value of F-test 0.628 0.000 0.000 0.000 0.000
Notes: Each observation is district×year. Pogrom is a district-level indicator for experiencing a pogrom in 1903–1906, After is an indicator foryears from 1905, and After×pogrom is their interaction. Commerce-to-manufacturing is the log of ratio of Jews employed in commerce to Jewsemployed in manufacturing, normalized to have mean zero and st. dev. one across all districts in the pale. Capital district is a dummy for themain district of the province, upon which the province is typically named. Landsmanshaftn 1899 is the effective measure of network thicknessas of 1899 (see details in text). Standard errors, clustered by district, are in parentheses. In all specifications, the number of observations is3,225.
34

Table 4: Difference-in-Differences effects of pogroms on migration, by region
Dep. Var.: Migration (1) (2) (3)
Poland 0.254 -0.023 -0.022(0.246) (0.164) (0.139)
Lithuania 0.280 0.512 0.161(0.139) (0.183) (0.171)
South-west 0.233 0.206 0.194(0.128) (0.147) (0.171)
New-Russia 0.312 -0.067 0.347(0.130) (0.267) (0.283)
Inner-Russia 0.168 -0.073 -0.073(0.429) (0.164) (0.173)
Time F.E. YearYear
RegionYearProv.
Geographic F.E. Province District District
District controls
R-squared 0.455 0.793 0.840P-value of F-test 0.000 0.000 0.000
Notes: The reported coefficients are for the region-specific interaction terms with after×pogrom. Specifications (1)-(3) correspond to spec-ifications (4)-(6) in the DID regressions on Table 3. The district controls include commerce-manufacturing, capital-district indicator, andLandsmanshaftn 1899. Standard errors, clustered by district, are in parentheses. In all specifications, the number of observations is 3,225.
35

Table 5: Difference-in-Differences effects of pogroms on migration, by year
A. Before (1) (2) (3) B. After (1) (2) (3)
1900 -0.217 1906 0.455 0.338 0.228(0.189) (0.141) (0.154) (0.153)
1901 -0.178 -0.173 -0.109 1907 0.334 0.376 0.326(0.176) (0.134) (0.143) (0.142) (0.184) (0.198)
1902 0.042 0.010 -0.038 1908 0.260 0.338 0.252(0.173) (0.171) (0.184) (0.142) (0.160) (0.167)
1903 -0.101 0.081 0.089 1909 0.211 0.325 0.245(0.164) (0.149) (0.151) (0.140) (0.169) (0.179)
1904 0.266 0.398 0.289 1910 0.222 0.274 0.121(0.162) (0.166) (0.174) (0.140) (0.181) (0.189)
1905 0.230 0.304 0.216 1911 0.183 0.249 0.119(0.136) (0.162) (0.171) (0.137) (0.176) (0.171)
1912 0.181 0.263 0.116(0.150) (0.186) (0.187)
1913 0.251 0.312 0.162(0.134) (0.202) (0.205)
1914 0.359 0.349 0.197(0.137) (0.189) (0.176)
Time F.E. YearYear
RegionYearProv.
Geog. F.E. Province District District R-squared 0.458 0.793 0.841Dist. conts. P-val. F 0.000 0.000 0.000
Notes: Panel B reports the same regressions as Panel A, its columns being continuations of the respective columns in Panel A, separated forconvenience by before and after years. The reported coefficients are year-specific DID effects, interaction of year×pogrom. Specifications(1)-(3) correspond to specifications (4)-(6) in the DID regressions on Table 3. The district controls include commerce-manufacturing, capital-district indicator, and Landsmanshaftn 1899. Standard errors, clustered by district, are in parentheses. In all specifications, the number ofobservations is 3,225.
36

Table 6: Difference-in-Differences effects of pogroms on migrants demographics
Dep. Vars. (1) (2) (3)
Female 0.020 0.029 0.020(0.013) (0.016) (0.017)
Child (under 16) 0.024 0.012 0.009(0.012) (0.013) (0.014)
Elderly (over 44) -0.001 -0.003 -0.003(0.006) (0.007) (0.008)
Adult female 16-44 0.010 0.026 0.020(0.011) (0.015) (0.015)
Adult male 16-44 -0.033 -0.036 -0.026(0.016) (0.020) (0.020)
Adult male 16-30 -0.028 -0.030 -0.028(0.015) (0.018) (0.018)
Married mal./married fem. -0.091 -0.059 -0.075(0.083) (0.083) (0.078)
Household size 0.111 0.046 0.058(0.063) (0.070) (0.068)
Time F.E. YearYear
RegionYearProv.
Geographic F.E. Province District District
District controls
Notes: Each coefficient is derived from a separate regression, where the dependent variable is a demographic statistics and each column hasa different specification, corresponding to specifications (4)-(6) in the Table 3. Married male/Married female is the (log) ratio of married adultmales to married adult women; where no married adult males were counted the value is set to the (log) minimum ratio over the entire sample;where no married adult females are counted, missing value was assigned. Household size is averaged over individuals (not over households).In all specifications, each observation is district×year, the number of observations is 3,225, except for the regressions on the (log) share ofmarried-males to married-women, where n=2,900 due to cases with zero married-females.
37

Table 7: Demographics by periods and ethnicity
(1) (2) (3) (4)
A. Jews 1898-1904 1905 1906-1914 1920-1925
Age 21.398 22.402 21.003 24.847Female 0.438 0.347 0.479 0.591Child (under 16) 0.296 0.228 0.293 0.330Elderly (over 44) 0.061 0.038 0.067 0.151Adult female 16-44 0.257 0.215 0.295 0.327Adult male 16-44 0.386 0.519 0.345 0.192Adult male 16-30 0.295 0.399 0.277 0.151Married mal./married fem. 1.250 2.229 1.031 0.410Household size 2.367 2.077 2.418 2.895
Observations 127,684 49,973 444,742 131,818
(1) (2) (3) (4)
B. Non-Jews 1898-1904 1905 1906-1914 1920-1925
Age 23.318 23.838 23.331 24.809Female 0.296 0.268 0.296 0.562Child (under 16) 0.159 0.130 0.114 0.270Elderly (over 44) 0.031 0.024 0.028 0.093Adult female 16-44 0.208 0.196 0.232 0.387Adult male 16-44 0.602 0.649 0.627 0.250Adult male 16-30 0.460 0.478 0.489 0.126Married mal./married fem. 2.396 3.305 3.399 0.808Household size 1.880 1.575 1.526 2.169
Observations 213,095 56,116 758,805 64,793
Notes: The table reports averages of demographic characteristics for all immigrants of Russian nationality who reported a last place of residencenot indicating a place outside Russia, excluding the earlier years FY 1893–1897 and the WWI period FY 1915–1919 (when the number of immi-grants passing through Ellis Island was very small). The periods are in terms of fiscal years, and ethnicity is determined by the who-is-a-Jewalgorithm. Married male/Married female is the (log) ratio of married adult males to married adult females.
38

Fig
ure
1:Je
wis
hC
om
mu
nit
ies
inth
ePa
leo
fSet
tlem
ent1
897
No
te:
Th
em
apin
clu
des
all
loca
litie
sin
the
Pale
of
Sett
lem
ent
inw
hic
h(a
)th
eto
tal
po
pu
lati
on
was
atle
ast
500;
and
(b)
Th
eJe
wis
hp
op
ula
tio
nw
asat
leas
t10
per
cen
to
fth
eto
tal.
Th
eso
urc
efo
rth
en
ames
and
the
po
pu
lati
on
sis
TSe
ntr
al’n
yiSt
atis
tich
eski
iK
om
itet
(190
5).
Geo
grap
hic
coo
rdi-
nat
esan
dad
dit
ion
alco
mm
un
itie
so
fu
nkn
own
size
,ty
pic
ally
of
very
smal
llo
cali
ties
,h
ave
bee
nad
ded
fro
mJe
wis
hG
en’s
Jew
ish
Co
mm
un
itie
sD
atab
ase
(ww
w.je
wis
hge
n.o
rg/c
om
mu
nit
ies/
sear
ch.a
sp).
Rem
ain
ing
coo
rdin
ates
wer
ead
ded
usi
ng
vari
ou
so
nlin
eso
urc
es.
39

Fig
ure
2:T
he
Po
gro
ms
of1
881
40

Fig
ure
3:T
he
Po
gro
ms
of1
903-
1906
41

Fig
ure
4:T
he
Po
gro
ms
of1
881
and
Lan
dsm
ansh
aftn
Inco
rpo
rati
on
by
1880
42
(a) Landsmanshaftn Incorporated during 1881–1885
(b) Landsmanshaftn Incorporated during 1886–1890
Figure 5: The Pogroms of 1881 and Landsmanshaftn Incorporation during 1881–190043

(a) Landsmanshaftn Incorporated during 1891–1895
(b) Landsmanshaftn Incorporated during 1896–1900
Figure 6: The Pogroms of 1881 and Landsmanshaftn Incorporation during 1891–190044

(a) Landsmanshaftn Incorporated during 1906–1910
(b) Landsmanshaftn Incorporated during 1911–1915
Figure 7: The Pogroms of 1903–1906 and Landsmanshaftn Incorporation during 1906–191545