point of connection charges and losses …cercind.gov.in/2013/minutes/second_presentation.pdfpoint...
TRANSCRIPT

Point of Connection Charges and Losses Computation
(April 2013 ‐ June 2013)( p )
Meeting of the Validation CommitteeDate : 08th February 2013Date : 08th February 2013Venue: NLDC, New Delhi
ContentsInput Data for PoC Computation for H2 Case (Oct’12‐Mar’13)
Comparison of Generation and Demand for H2 Case: Projected vs Actual
Variation in Transmission Lines CommissioningVariation in Transmission Lines Commissioning
Variation in LTA
PoC Computation for Q1 Case (April’13‐June’13)PoC Computation for Q1 Case (April 13 June 13)Data from DICs
Scaling Requirement
Load Generation Balance
Inter‐Regional Flows
Points for Discussion

Input Data for PoC ComputationInput Data for PoC Computation for H2 Case (Oct’12‐Mar’13)

Comparison of Generation for H2 Case: Projected vs Actual
Generation(MW)
Region Taken in Act al Difference % Change in Region H2Case Actual Difference gGeneration
NR 30996 29243 -1753 -5.66%
ER 18067 16660 -1407 -7.79%
WR 38487 35782 -2706 -7 03%WR 38487 35782 -2706 -7.03%
NER 997 1004 7 0.68%
SR 26538 21381 -5157 -19.43%
ALL INDIA 115085 104069 -11015 -9.57%
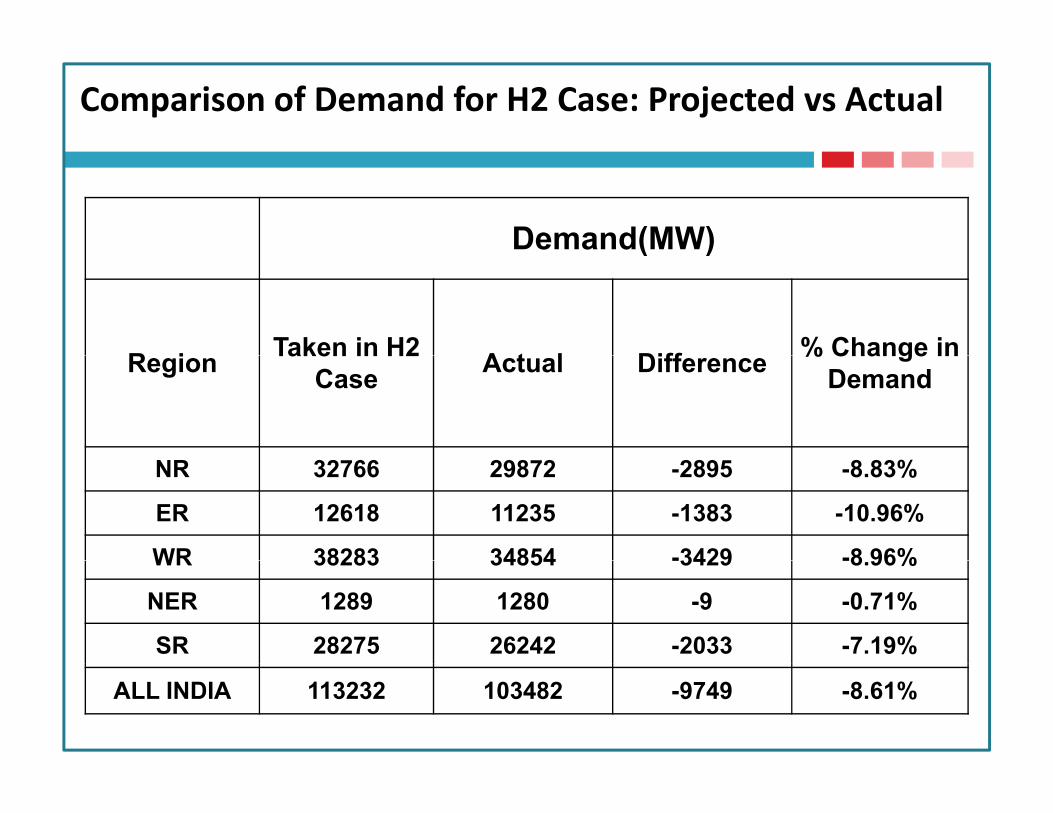
Comparison of Demand for H2 Case: Projected vs Actual
Demand(MW) ( )
R i Taken in H2 A t l Diff % Change inRegion Taken in H2 Case Actual Difference % Change in
Demand
NR 32766 29872 -2895 -8.83%
ER 12618 11235 -1383 -10.96%
WR 38283 34854 -3429 -8 96%WR 38283 34854 -3429 -8.96%
NER 1289 1280 -9 -0.71%
SR 28275 26242 -2033 -7.19%
ALL INDIA 113232 103482 -9749 -8.61%
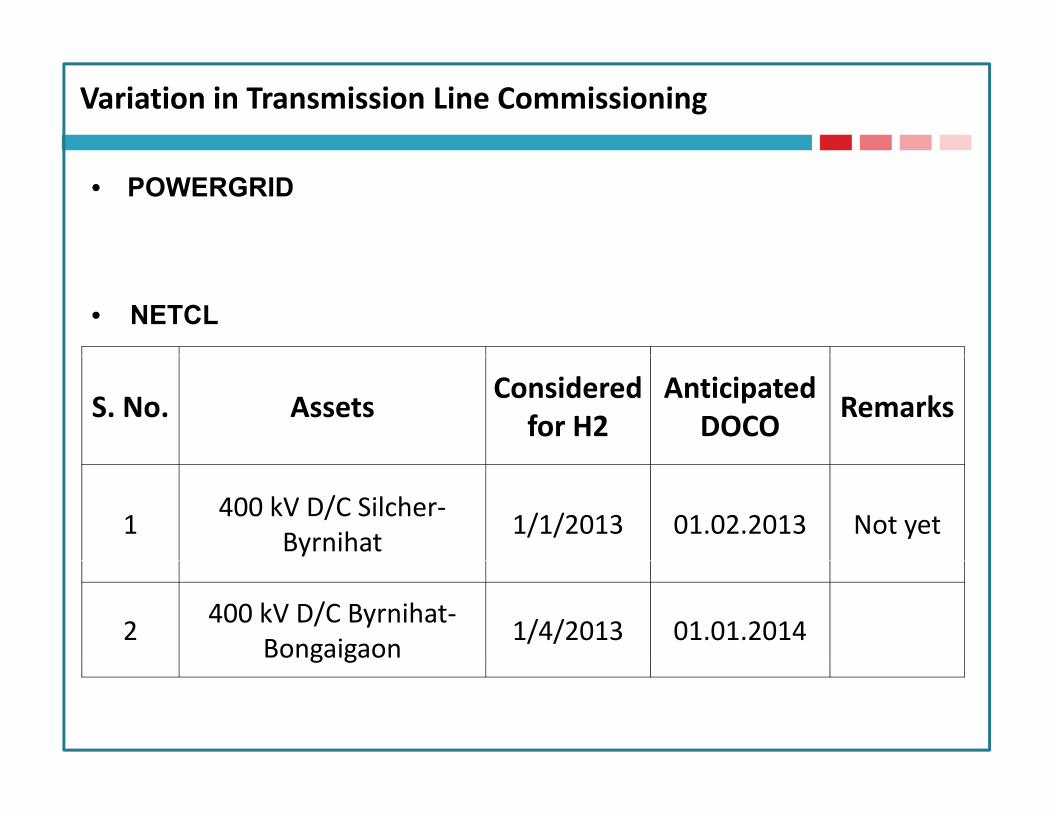
Variation in Transmission Line Commissioning
• POWERGRID
• NETCL
S. No. AssetsConsidered
for H2Anticipated
DOCORemarks
1400 kV D/C Silcher‐
Byrnihat 1/1/2013 01.02.2013 Not yet
2400 kV D/C Byrnihat‐
Bongaigaon1/4/2013 01.01.2014

Variation in Transmission Line Commissioning ‐ RPTL
S.No. Project Name Assets Considered for H2
Likely DOCO
1 WRSSS Project-C 400 kV D/C Rajgarh Karamsad (length: 243 KM) 1/12/2012 1/6/2013Karamsad (length: 243 KM)
2 WRSSS Project-B 400 kV D/C Parli-Pune 1/12/2012 1/4/2013j
3 WRSSS Project-B 400 kV D/C Pune- 1/3/2013 1/5/20133 WRSSS Project B Aurangabad 1/3/2013 1/5/2013
4 WRSSS Project B LILO of 400 kV Lonikhand- 1/11/2012 1/3/20134 WRSSS Project-B Kalwa ckt 2 1/11/2012 1/3/2013
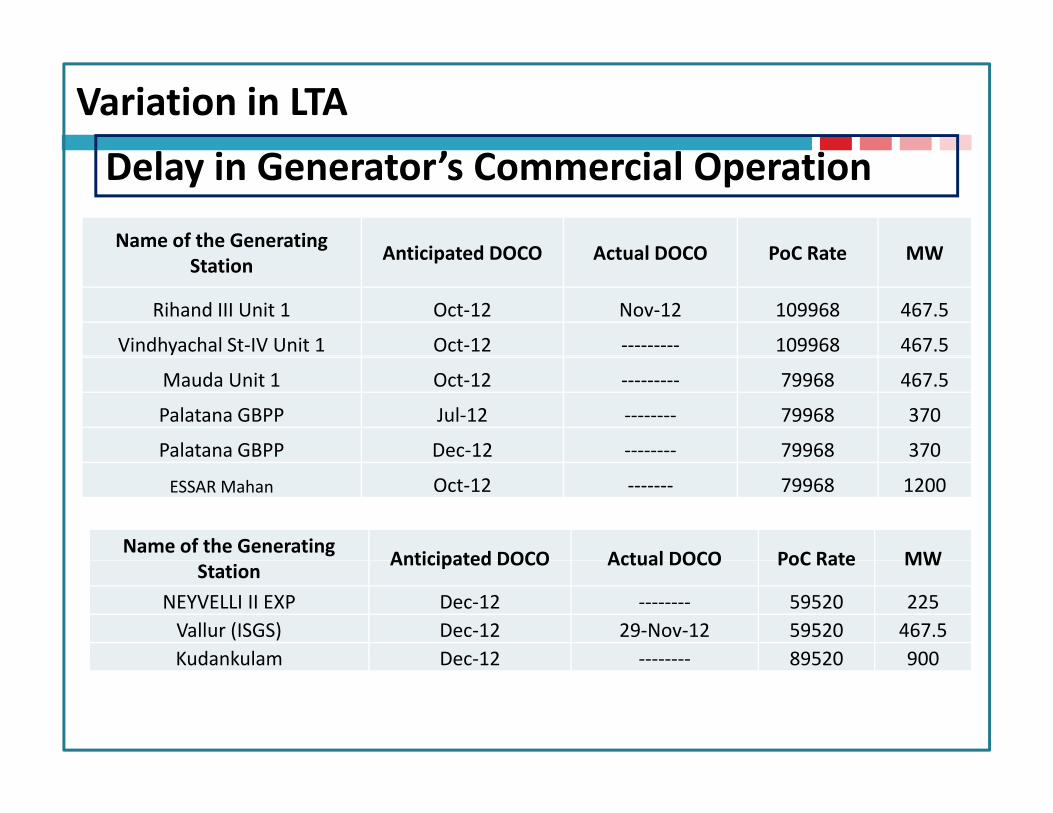
Variation in LTA
Name of the Generating Anticipated DOCO Actual DOCO PoC Rate MW
Delay in Generator’s Commercial Operation
StationAnticipated DOCO Actual DOCO PoC Rate MW
Rihand III Unit 1 Oct‐12 Nov‐12 109968 467.5
Vindhyachal St‐IV Unit 1 Oct‐12 ‐‐‐‐‐‐‐‐‐ 109968 467.5
Mauda Unit 1 Oct‐12 ‐‐‐‐‐‐‐‐‐ 79968 467.5
Palatana GBPP Jul‐12 ‐‐‐‐‐‐‐‐ 79968 370
Palatana GBPP Dec‐12 ‐‐‐‐‐‐‐‐ 79968 370
ESSAR Mahan Oct‐12 ‐‐‐‐‐‐‐ 79968 1200
Name of the Generating Anticipated DOCO Actual DOCO PoC Rate MW
StationAnticipated DOCO Actual DOCO PoC Rate MW
NEYVELLI II EXP Dec‐12 ‐‐‐‐‐‐‐‐ 59520 225Vallur (ISGS) Dec‐12 29‐Nov‐12 59520 467.5Kudankulam Dec‐12 ‐‐‐‐‐‐‐‐ 89520 900Kudankulam Dec 12 89520 900

PoC Computation for Q1 CasePoC Computation for Q1 Case (April’13‐June’13)
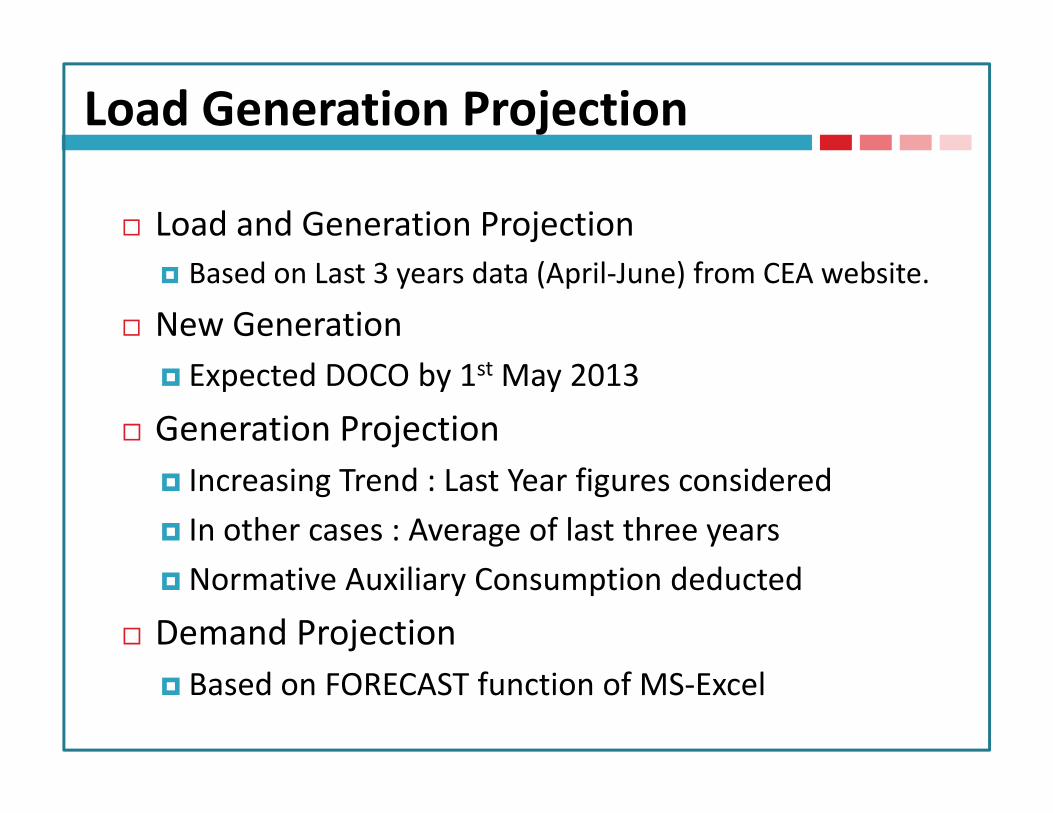
Load Generation Projection
Load and Generation ProjectionBased on Last 3 years data (April‐June) from CEA website.
New GenerationExpected DOCO by 1st May 2013
Generation ProjectionIncreasing Trend : Last Year figures consideredIn other cases : Average of last three yearsNormative Auxiliary Consumption deducted
Demand ProjectionBased on FORECAST function of MS‐Excel
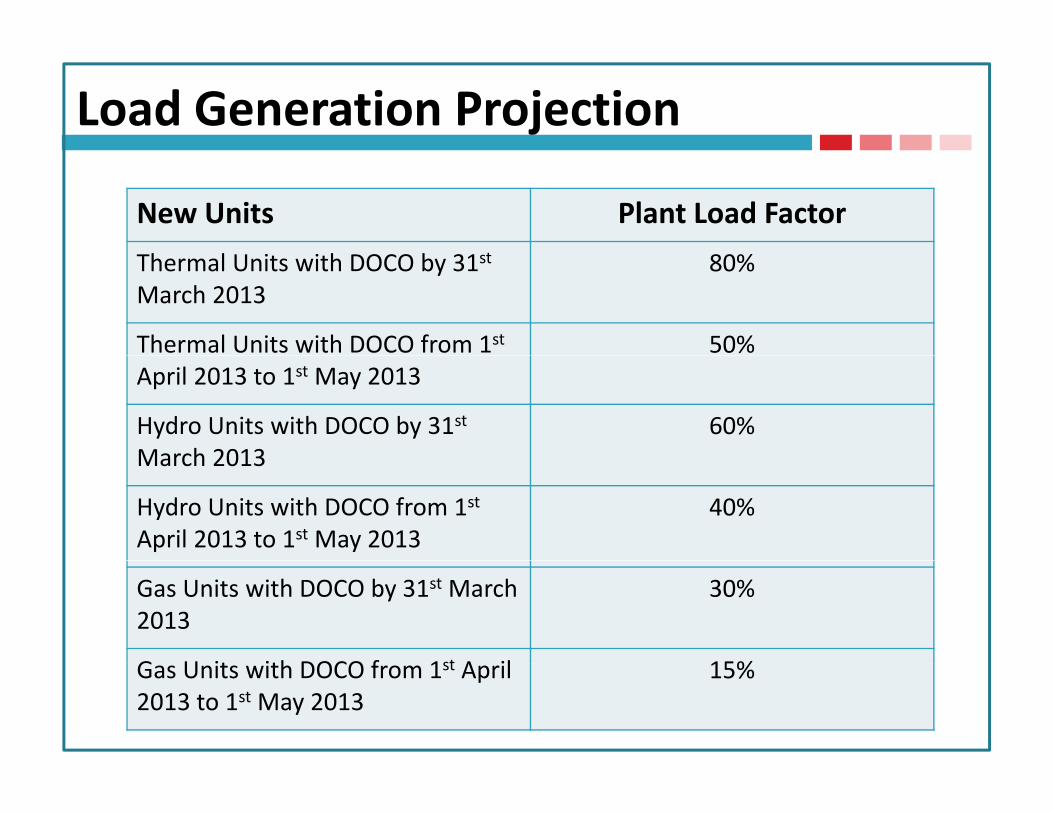
Load Generation Projection
New Units Plant Load FactortThermal Units with DOCO by 31st
March 201380%
Thermal Units with DOCO from 1st 50%April 2013 to 1st May 2013
Hydro Units with DOCO by 31st
March 201360%
March 2013
Hydro Units with DOCO from 1st
April 2013 to 1st May 201340%
Gas Units with DOCO by 31st March 2013
30%
G U it ith DOCO f 1st A il 15%Gas Units with DOCO from 1st April 2013 to 1st May 2013
15%

Data Collection for PoC Computation (Q1) … (1)
S. No. DIC Format I A Format I B Format II Format III A Format IIIB
√ √ √1 Jaypee Powergrid Ltd. √ √ √ - -
2 Torrent Power Grid Ltd. √ √ - -
√ √ √3 RPTL √ √ √ - -
4 NETCL √ √ - -
√ √5 POWERGRID √ √ - -
6 NPCIL Kudankulam - - √
NPCIL MAPS √ √7 NPCIL MAPS - - √ √
8 NPCIL KAPS - - √ √ √
9 NPCIL TAPS √ √9 NPCIL TAPS - - √ √
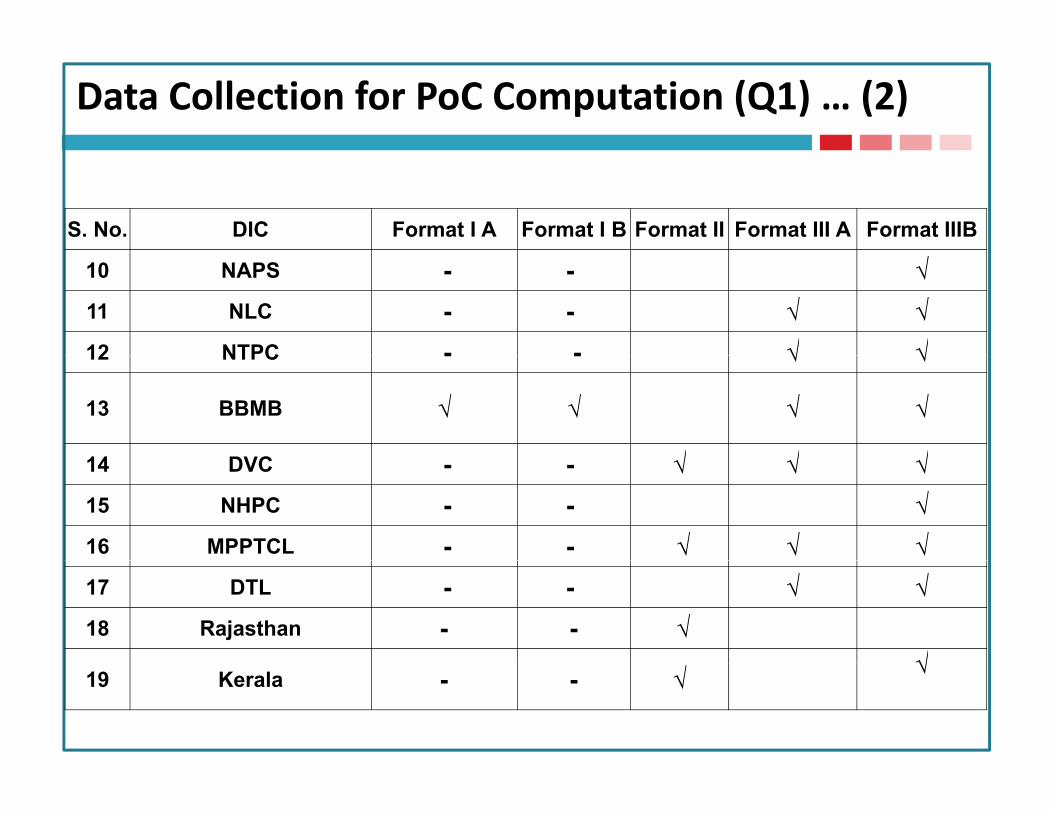
Data Collection for PoC Computation (Q1) … (2)
S. No. DIC Format I A Format I B Format II Format III A Format IIIB
10 NAPS - - √11 NLC - - √ √12 NTPC - - √ √12 NTPC - - √ √
13 BBMB √ √ √ √
14 DVC √ √ √14 DVC - - √ √ √15 NHPC - - √ 16 MPPTCL - - √ √ √17 DTL - - √ √18 Rajasthan - - √
√19 Kerala - - √ √

Scaling Requirement in NEW Grid
•Total Generation: 92247 MW•Total Demand: 84227 MW•Losses: 2890 MWE t th h T l h K l I t t 276 MW•Export through Talcher‐Kolar Inter‐connector:276 MW
•Export through Bhadrawati: 800 MW•Export through Gajuwaka : 0 MWExport through Gajuwaka : 0 MW
•Scaling Required : 3950 MW

Scaling Requirement in SR Grid
•Total Generation : 31120 MWTotal Generation : 31120 MW•Total Demand : 29902 MW•Losses : 1006 MWLosses : 1006 MW•Import from Talcher : 2000 MW•Import from Bhadrawati : 800 MWImport from Bhadrawati : 800 MW
•Scaling Required : 212 MWScaling Required : 212 MW

Demand figures for Q1 Case
Northern RegionNorthern Region
Eastern Region
Western RegionWestern Region
North‐Eastern Region
S th R iSouthern Region

Generation Figures for Q1 Case
Northern RegionNorthern Region
Eastern Region
Western RegionWestern Region
North‐Eastern Region
S th R iSouthern Region
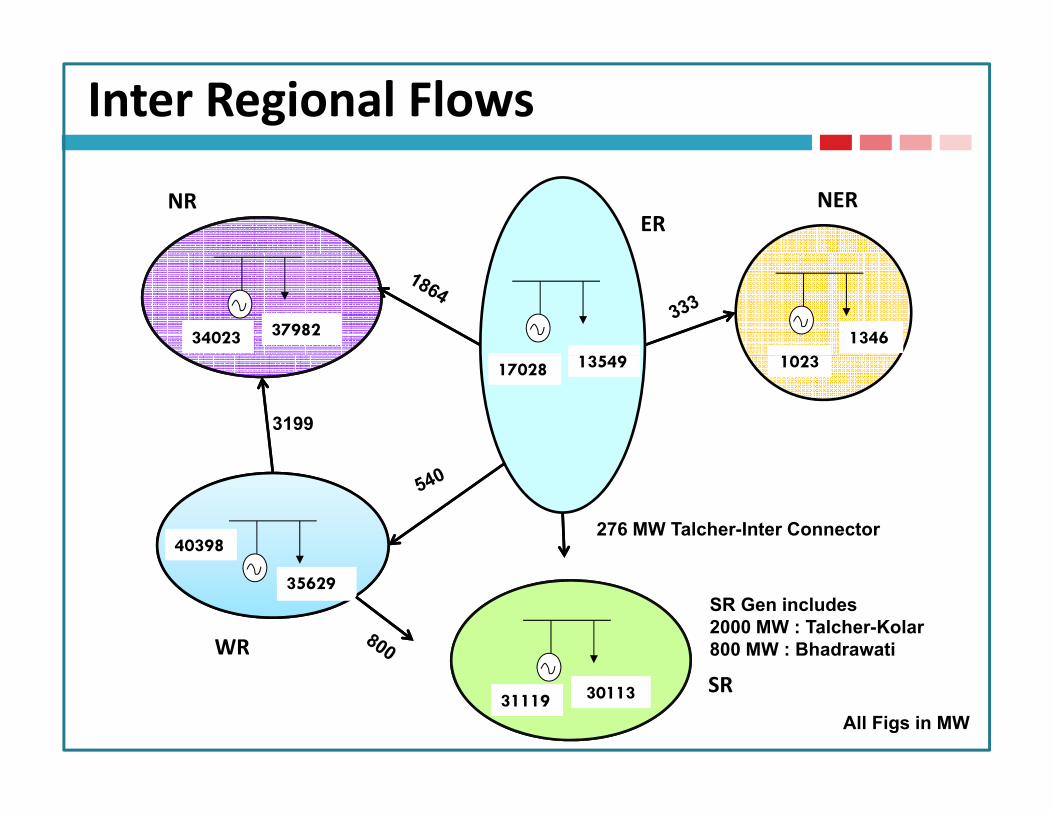
Inter Regional Flows
NRER
NER
3798234023 13462102317028 13549
3199
40398276 MW Talcher-Inter Connector
WR
35629SR Gen includes2000 MW : Talcher-Kolar800 MW : Bhadrawati
3011331119SR
All Figs in MW

Points for Discussion
Activities for Computation of PoC Results for Q1 Case(1) In sub clause (i) of clause (1) of Regulation 7 of the Principal(1) In sub‐clause (i) of clause (1) of Regulation 7 of the Principal Regulations, the words "not later than 15th of December in each financial year", shall be substituted as under, namely:
"three months before the revision of the YTC in accordance with first proviso to sub‐clause (l) of clause (1) of this regulation".
Date for Submission of Yearly Transmission Charges (YTC) by LicenseesSubmission of Results

Thank You !!Thank You !!

Demand figures – Northern RegionB kBack
S. No. StatesProposed Demand
( )
IncrementalDemand (MW)
Scaled Demand
( )(MW) Demand (MW) (MW)
1 Chandigarh 229 0 229
2 D lhi 4980 (As per 10 4 9902 Delhi 4980 (As per DTL) 10 4,990
3 Haryana 4720 345 5,065
4 Hi h l P d h 1119 21 1 1394 Himachal Pradesh 1119 21 1,139
5 Jammu & Kashmir 1263 319 1,582
6 Punjab 5551 203 5 7546 Punjab 5551 203 5,754
7 Rajasthan 6053 254 6,307
8 Uttar Pradesh 10333 1108 11 4418 Uttar Pradesh 10333 1108 11,441
9 Uttarakhand 1412 61 1,474

Demand figures – Eastern Region
Back
I t l S l dS.No. States Proposed
Demand (MW)
IncrementalDemand
(MW)
Scaled Demand
(MW)
17 Bihar 1559 208 1,768
18 DVC 1914 103 2,017
19 Jharkhand 900 (As per MoM1st VC Meeting) 24 924
20 Orissa 2904 147 3,051
21 West Bengal 5458 50 5,508
22 Sikkim 60 (As per MoM 0 6022 Sikkim 1st VC Meeting) 0 60
23 Bhutan 0 0 0

Demand figures – Western Region
Back
Proposed I t l Scaled S.No. States
pDemand
(MW)
IncrementalDemand (MW) Demand
(MW)
10 Chattisgarh 2334 26 2 36010 Chattisgarh 2334 26 2,360
11 Gujarat 10841 (As per WRLDC) 21 10,862
12 Madhya Pradesh 4881 411 5,292
13 Maharashtra 15629 461 16,090
14 Daman & Diu 182 14 196
15 Dadra Nagar Haveli 430 57 486 16 Goa-WR 245 14 259

Demand Figures – North‐Eastern Region
Back
Proposed Incremental Scaled S.No. States Proposed
Demand (MW)Incremental
Demand (MW) Demand (MW)
24 Arunachal Pradesh 72 4 7624 Arunachal Pradesh 72 4 76
25 Assam 726 44 770
26 Manipur 48 2 51
27 Meghalaya 186 33 219
28 Mizoram 43 3 46
29 Nagaland 53 3 56
30 Tripura 121 5 126

Demand Figures – Southern Region
Back
Proposed ScaledS.No. States
Proposed Demand
(MW)
IncrementalDemand (MW)
Scaled Demand
(MW)
1 Andhra Pradesh 10200 (As per AP) 72 10272
2 Karnataka 7445 46 74912 Karnataka 7445 46 7491
3 Kerala 2486 (As per Kerala) 5 2491
9397 (As per4 Tamil Nadu 9397 (As per TN) 90 9487
5 Pondicherry 293 0 294
6 Goa-SR 80 80

Generation Figures – Northern Region
S.No. Entity
Projections based on 3 Years Data
New Generation
_H2
New Generation
_Q1TOTAL
Figure as per
Comments
Considered in the
Basecase
(MW) (MW) (MW) (MW) (MW) (MW)1 UP 4396 1509 5905 62052 Delhi 1198 1198 1350 13503 H 2092 2092 20923 Haryana 2092 2092 20924 Uttarakhand 589 0 589 5895 Punjab 2433 2433 24336 Rajasthan 3135 832 0 3967 42976 Rajasthan 3135 832 0 3967 42977 Himachal Pradesh 433 433 4338 Jammu & Kashmir 559 27 585 5599 BBMB 1240 1240 1240
10 Chandigarh 0 0 011 Railways 0 0 012 Dadri Thermal 1383 1383 138313 Rihand 1718 374 2092 209213 Rihand 1718 374 2092 209214 Singrauli 1661 1661 166115 Unchahar 883 883 883

Generation Figures – Northern Region …(2)
S.No.
Projections based on 3 Years Data
New Generation
_H2
New Generation
_Q1TOTAL
Figure as per
Comments
Considered in the
Basecase
16 Auraiya 435 435 43517 Dadri CCPP 625 625 62518 NAPS 239 239 23918 NAPS 239 239 23919 Jhajjar 935 374 1309 130920 DHAULIGANGA 140 140 14021 Tanakpur 47 47 4721 Tanakpur 47 47 4722 Koteshwar 123 123 12323 Tehri 292 292 29224 Anta 290 290 29025 RAAP A,B,C 749 749 74926 AD Hydro 92 92 9227 Everest 32 32 3228 Karcham Wangtoo 573 573 57329 Bairasul 137 137 137

Generation Figures – Northern Region …(3)Back
S.No
Projections based on 3
New Generation
New Generation TOTAL
Figure as per
Considered in the No. Years Data _H2 _Q1
pComments Basecase
30 Chamera 1 392 392 392
31 Chamera 2 236 236 23631 Chamera 2 236 236 236
32 Chamera 3 29 91 120 120
33 Naptha Jhakri 1078 1078 1078
34 L B dhil 13 13 1334 Lanco Budhil 13 13 13
35 DULHASTI 338 338 338
36 Salal 502 502 502
37 Sewa-II 59 59 59
38 URI 1 HPS 467 467 467
39 URI II HPS 143 143 143
40 Sree Cement 220 220 220
41 Parbati III 154 154 154
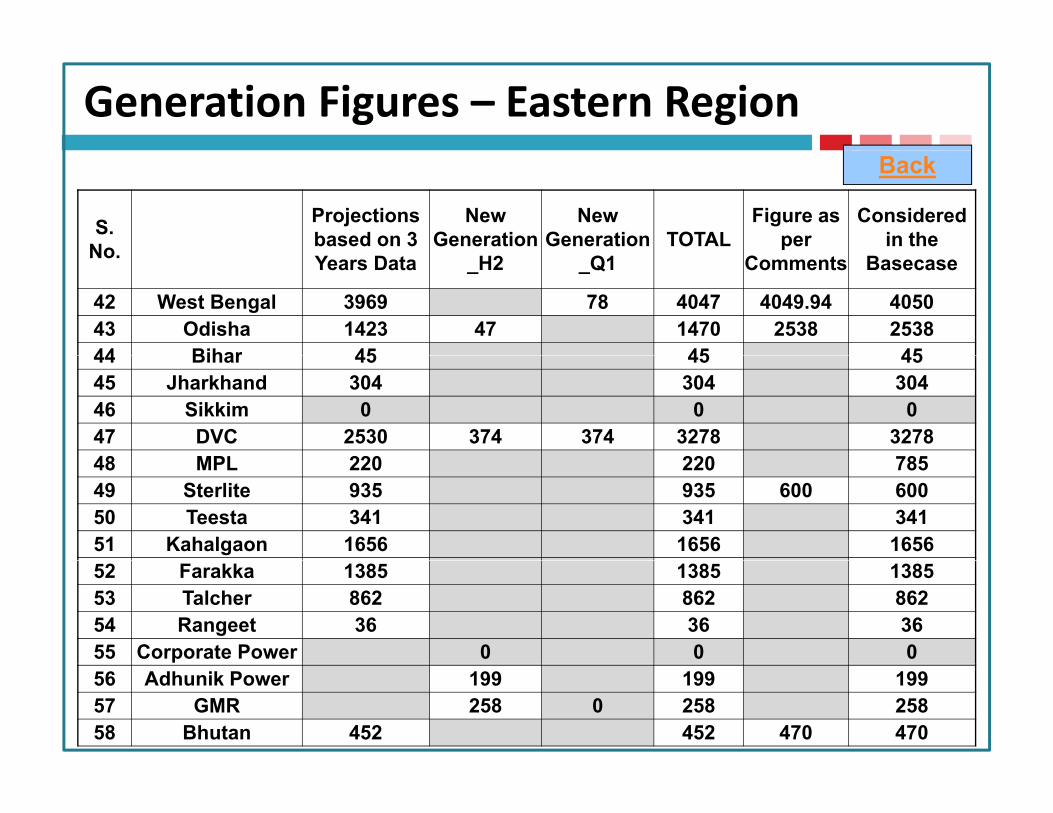
Generation Figures – Eastern RegionBack
S.No
Projections based on 3
New Generation
New Generation TOTAL
Figure as per
Considered in the No. Years Data _H2 _Q1 Comments Basecase
42 West Bengal 3969 78 4047 4049.94 405043 Odisha 1423 47 1470 2538 253844 Bihar 45 45 4544 Bihar 45 45 4545 Jharkhand 304 304 30446 Sikkim 0 0 047 DVC 2530 374 374 3278 327848 MPL 220 220 78548 MPL 220 220 78549 Sterlite 935 935 600 60050 Teesta 341 341 34151 Kahalgaon 1656 1656 165652 Farakka 1385 1385 138553 Talcher 862 862 86254 Rangeet 36 36 3655 Corporate Power 0 0 056 Adhunik Power 199 199 19957 GMR 258 0 258 25858 Bhutan 452 452 470 470

Generation Projection – Western Region…(1)
S.No.
Projections based on 3 Years Data
New Generation
_H2
New Generation
_Q1TOTAL
Figure as per
Comments
Considered in the
Basecase
59 MP 2500 184 184 2868 2868
60 Maharashtra 8702 221 1213 10135 10135
61 Chattisgarh 1440 1440 1440
62 Gujarat 7236 587 51 7874 8657
63 Goa 34 34
64 D&D 0 0 064 D&D 0 0 0
65 DNH 0 0 0
66 Vindhyachal 2823 374 3197 3197
67 Ratnagiri Dabhol 1257 1257 1257
68 TAPS (1,2,3,4) 1155 1155 1155
69 JINDAL 905 905 905
70 ESSAR Mahan 449 449
71 Sasan UMPP 494 494
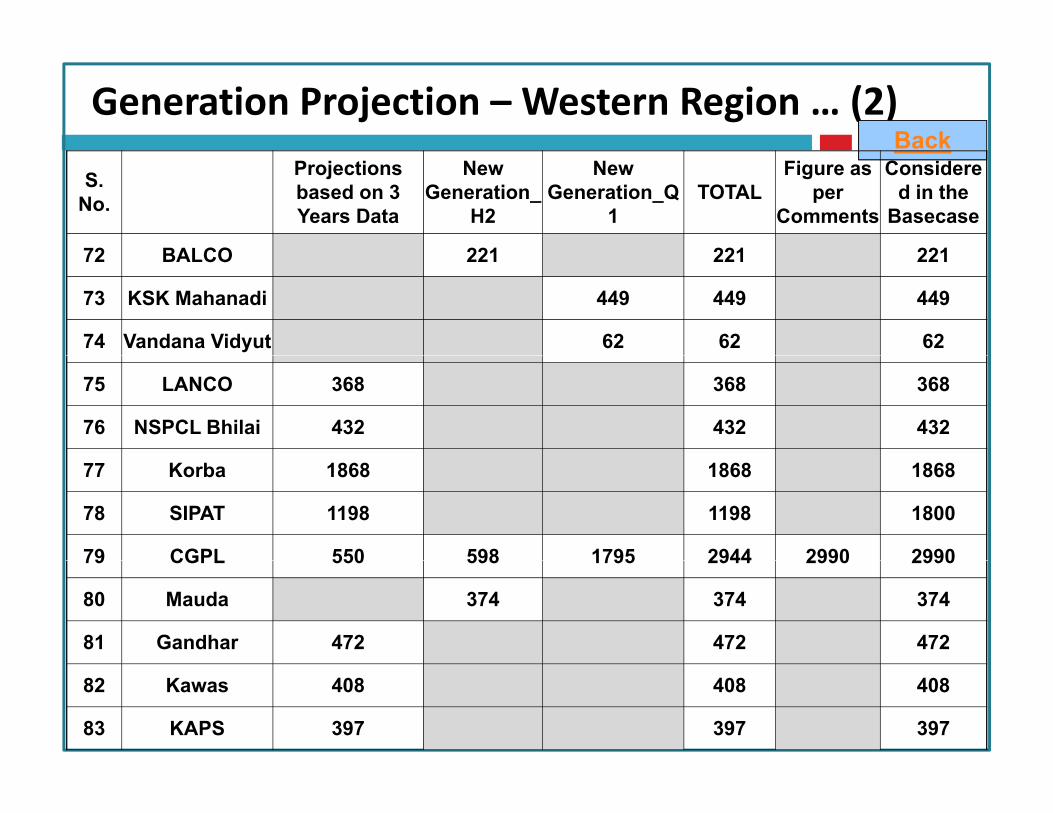
Generation Projection – Western Region … (2)Back
S.No.
Projections based on 3 Years Data
New Generation_
H2
New Generation_Q
1TOTAL
Figure as per
Comments
Considered in the
Basecase
72 BALCO 221 221 22172 BALCO 221 221 221
73 KSK Mahanadi 449 449 449
74 Vandana Vidyut 62 62 62
75 LANCO 368 368 368
76 NSPCL Bhilai 432 432 432
77 Korba 1868 1868 1868
78 SIPAT 1198 1198 1800
79 CGPL 550 598 1795 2944 2990 299079 CGPL 550 598 1795 2944 2990 2990
80 Mauda 374 374 374
81 Gandhar 472 472 472
82 Kawas 408 408 408
83 KAPS 397 397 397
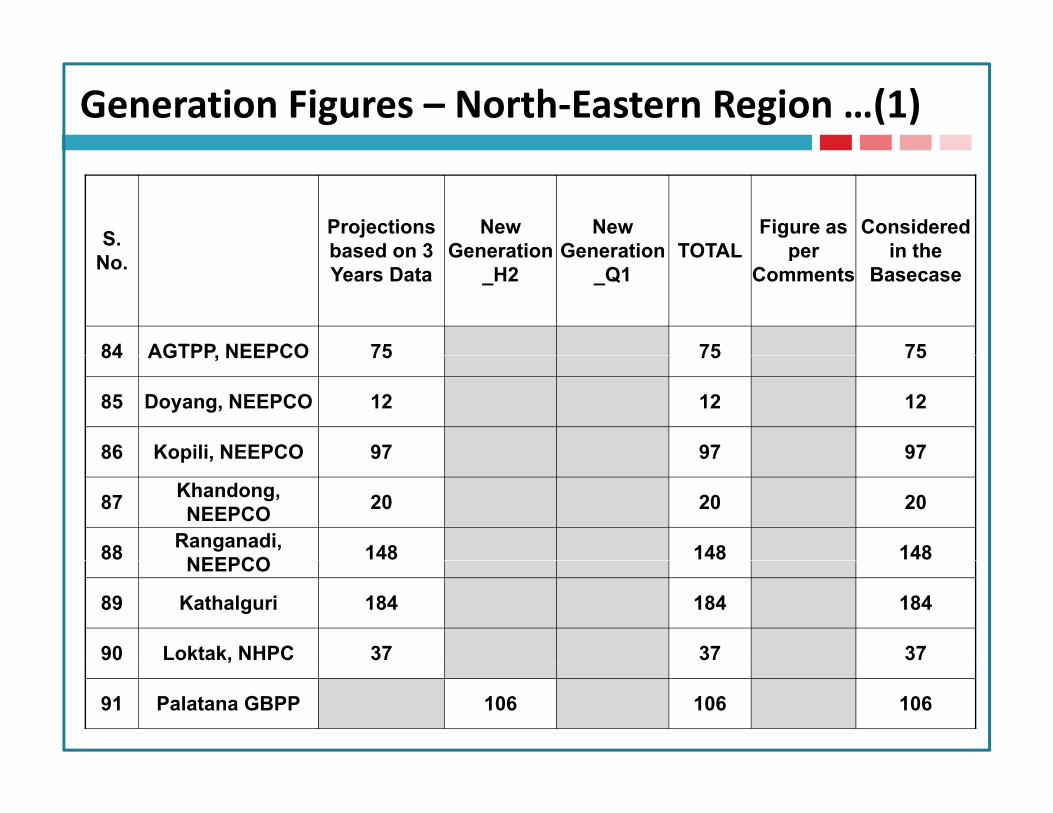
Generation Figures – North‐Eastern Region …(1)
S. Projections based on 3
New Generation
New Generation TOTAL
Figure as per
Considered in theNo. based on 3
Years DataGeneration
_H2Generation
_Q1TOTAL per
Commentsin the
Basecase
84 AGTPP, NEEPCO 75 75 7584 AGTPP, NEEPCO 75 75 75
85 Doyang, NEEPCO 12 12 12
86 Kopili, NEEPCO 97 97 9786 Kopili, NEEPCO 97 97 97
87 Khandong, NEEPCO 20 20 20
88 Ranganadi, NEEPCO 148 148 148NEEPCO
89 Kathalguri 184 184 184
90 Loktak, NHPC 37 37 37,
91 Palatana GBPP 106 106 106
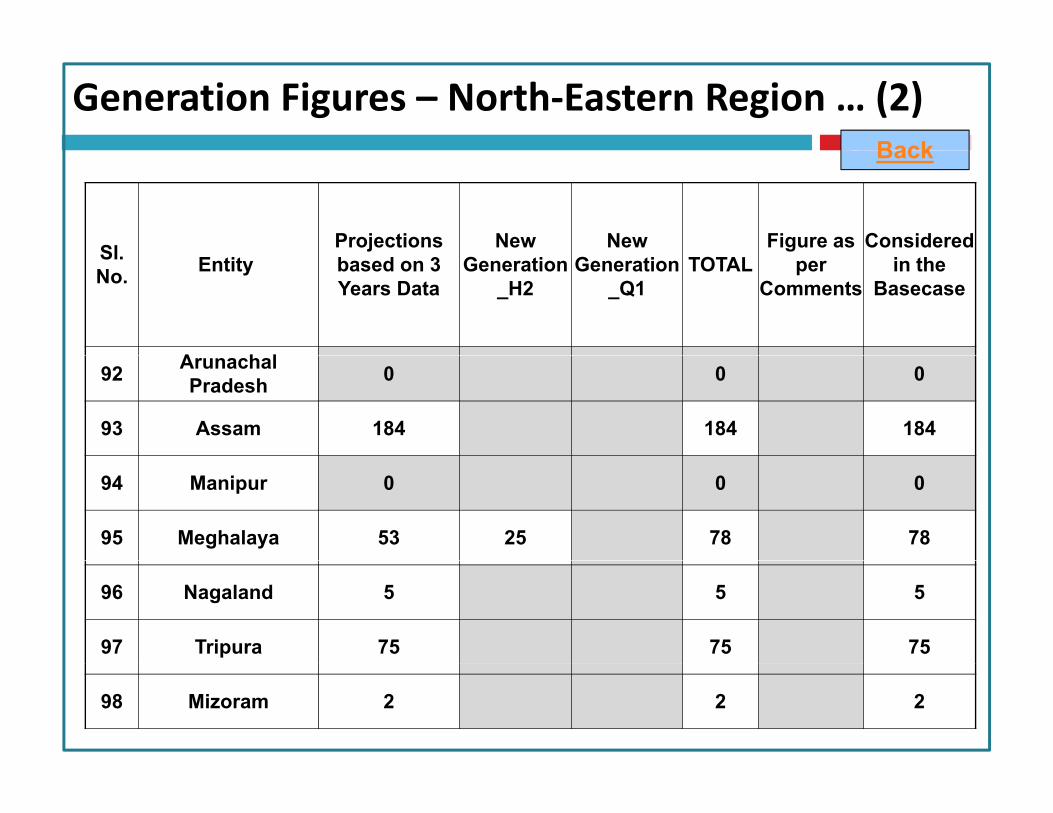
Generation Figures – North‐Eastern Region … (2)BackBack
Sl Projections New New Figure as Considered Sl.No. Entity based on 3
Years DataGeneration
_H2Generation
_Q1TOTAL per
Commentsin the
Basecase
A h l92 Arunachal Pradesh 0 0 0
93 Assam 184 184 184
94 Manipur 0 0 0
95 Meghalaya 53 25 78 78
96 Nagaland 5 5 5
97 Tripura 75 75 75
98 Mizoram 2 2 2

Generation Figures – Southern Region Back
S.No. Entity
Projections based on 3 Years Data
New Generation
_H2
New Generation
_Q1TOTAL
Figure as per
Comments
Considered in the
Basecase99 Andhra Pradesh 7773 7773 7400 7400100 Karnataka 4700 823 5523 6037 6037101 Kerala 1049 1049 1292 1292102 Tamil Nadu 7006 898 7903 6514 6514103 Pondy 29 29 29104 Ramagundam 2280 2280 2280105 Simhadri 423 374 797 797106 SEPL (U it 1) 101 110 211 211106 SEPL (Unit 1) 101 110 211 211107 Lanco Kondapalli 188 188 188108 Kaiga 589 589 589109 NEYVELI ( EXT) TPS 364 364 364110 NEYVELI TPS-II 1227 1227 1227111 NEYVELI TPS-II EXP 0 180 180 180112 MAPS 272 272 272113 Vallur 374 374 748 748113 Vallur 374 374 748 748114 Meenakhshi 110 110 221 221115 Import from Talcher 1724 1724 2000 2000