point of connection charges and losses computation
TRANSCRIPT

Point of Connection Charges and Losses Computation
(April 2013 ‐ June 2013)( p )
Meeting of the Validation CommitteeDate : 15th January 2013Date : 15th January 2013Venue: NLDC, New Delhi
Contents
Input Data for PoC Computation for H2 Case (Oct’12‐Mar’13) Variation in Generation CommissioningVariation in Transmission Lines Commissioning
PoC Computation for Q1 Case (April’13‐June’13)Demand & Generation ProjectionNew GenerationNew Transmission LinesPoints for Discussion

Input Data for PoC Computation for H2 Case (Oct’12‐Mar’13)
Variation in Generation CommissioningVariation in Generation Commissioning
Variation in Transmission Lines CommissioningVariation in Transmission Lines Commissioning
Load Generation Projection
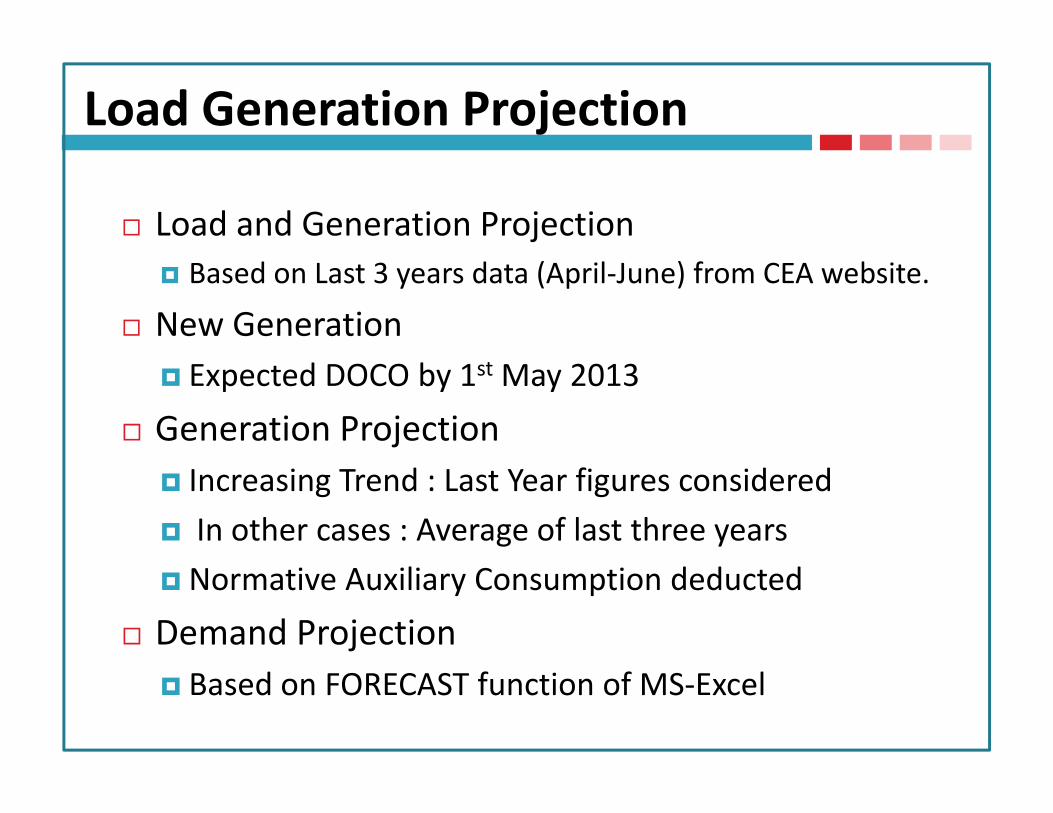
Load and Generation ProjectionBased on Last 3 years data (April‐June) from CEA website.
New GenerationExpected DOCO by 1st May 2013
Generation ProjectionIncreasing Trend : Last Year figures consideredIn other cases : Average of last three yearsNormative Auxiliary Consumption deducted
Demand ProjectionBased on FORECAST function of MS‐Excel

Load Generation Projection
New Units Plant Load FactortThermal Units with DOCO by 31st
March 201380%
Thermal Units with DOCO from 1st 50%April 2013 to 1st May 2013
Hydro Units with DOCO by 31st
March 201360%
March 2013
Hydro Units with DOCO from 1st
April 2013 to 1st May 201340%
Gas Units with DOCO by 31st March 2013
30%
G U it ith DOCO f 1st A il 15%Gas Units with DOCO from 1st April 2013 to 1st May 2013
15%
Demand Projection
Northern RegionNorthern Region
Eastern Region
Western RegionWestern Region
North‐Eastern Region
S th R iSouthern Region
Generation Projection
Northern RegionNorthern Region
Eastern Region
Western RegionWestern Region
North‐Eastern Region
S th R iSouthern Region
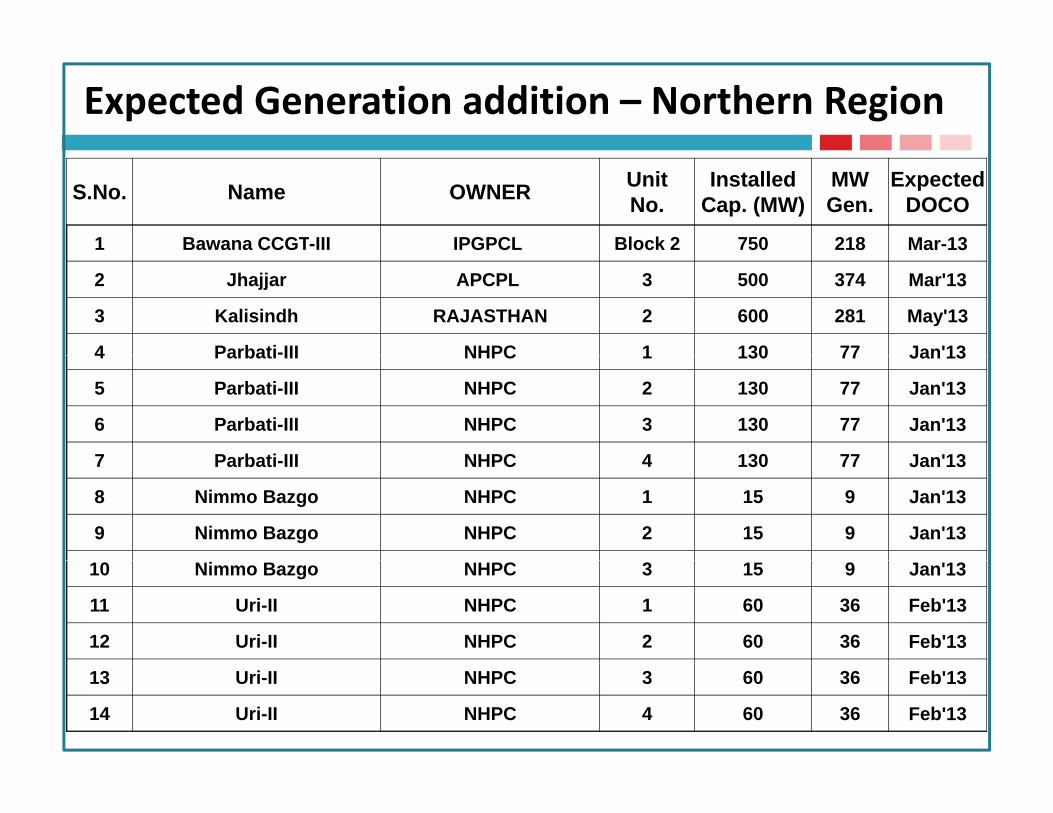
Expected Generation addition – Northern Region
S.No. Name OWNER UnitNo.
Installed Cap. (MW)
MW Gen.
Expected DOCO
1 Bawana CCGT-III IPGPCL Block 2 750 218 Mar-13
2 Jhajjar APCPL 3 500 374 Mar'13
3 Kalisindh RAJASTHAN 2 600 281 May'13
4 Parbati-III NHPC 1 130 77 Jan'134 Parbati III NHPC 1 130 77 Jan 13
5 Parbati-III NHPC 2 130 77 Jan'13
6 Parbati-III NHPC 3 130 77 Jan'13
7 Parbati III NHPC 4 130 77 Jan'137 Parbati-III NHPC 4 130 77 Jan'13
8 Nimmo Bazgo NHPC 1 15 9 Jan'13
9 Nimmo Bazgo NHPC 2 15 9 Jan'13
10 Nimmo Bazgo NHPC 3 15 9 Jan'13
11 Uri-II NHPC 1 60 36 Feb'13
12 Uri-II NHPC 2 60 36 Feb'13
13 Uri-II NHPC 3 60 36 Feb'13
14 Uri-II NHPC 4 60 36 Feb'13

Expected Generation addition – Western Region
S.No. Name OWNER UnitNo.
Installed Cap. (MW) MW Gen. Expected
DOCO15 Swastik TPP ACB ( India) Ltd 1 25 18 Mar'13
16 Pipavav-CCPP GSPC PIPAVAV 2 351 51 Mar'1316 Pipavav CCPP Power Co.Ltd. 2 351 51 Mar 13
17 Jayprakash Bina Power TP Jayprakash PowerVentures 2 250 184 Mar'13
18 Tiroda TPP Ph I Adani Power Maharashtra Ltd 2 660 309 Jan'13Maharashtra Ltd.
19 Tiroda TPP Ph II “ 1 660 309 Mar'1320 Tiroda TPP Ph II “ 2 660 309 Mar'13
21 Coastal Gujarat Power Ltd Tata Power Co. 3 800 598 Actual COD in Oct 12j Oct-12
22 Coastal Gujarat Power Ltd ” 4 800 598 Jan'1323 Bela TPP IEPL 1 270 124 Mar'1324 EMCO, Warora TPP Ph I & II EMCO Energy Ltd. 1 300 221 Mar'1325 EMCO, Warora TPP Ph I & II “ 2 300 221 Mar'1326 Marwa TPP Chhatisgarh 1 500 374 Mar-1327 Satpura TPP Extn. MPPGCL 10 250 184 Mar-13
V d Vid t TPP V d Vid t28 Vandana Vidyut TPP-Chattisgarh
Vandana VidyutLtd. 1 135 62 Mar-13
29 Bhusawal II 2 500 COD Not intimated
COD date not known

Expected Generation addition – Eastern Region
I t ll d C MW E tS.No. Name OWNER Unit No. Installed Cap. (MW)
MW Gen.
Expected DOCO
30 Koderma TPP DVC 2 500 234 Jan-13
31 Adhunik Power TPP Adhunik Power Co. Ltd. 2 270 199 Mar'13
32 Corporate Power Corporate Power Ltd. 2 270 124 May'13

Expected Generation addition – Southern Region
S.No. Name OWNER Unit
No.Installed
Cap. (MW)MW Gen.
Expected DOCO
33 Vallur TPP Ph1 NTECL 2 500 374 Mar-13
34 Meenakshi Meenakshi Energy Pvt. Ltd 2 150 110 Feb-13

Data Collection for PoC Computation (Q1)
Letter to DICs for Furnishing Technical & Commercial Data for Q1 (Apr’13‐Jun’13) dated 13th December 2012
Data Received from:MPPTCL
NTPCNTPC
NHPC
POWERGRID
POWERLINKS
DVC
BBMBBBMB
NPCIL –MAPS, Kudankulam
Jaypee Powergrid Ltd.
NLC
RPTL

Points for Discussion
Date for considering New Assets & Generation for Quarter‐wise Computation of PoC
Activities for Computation of PoC Results for Q1 Case(1) In sub‐clause (i) of clause (1) of Regulation 7 of the Principal Regulations, the words "not later than 15th of December in each financial year", shall be substituted as under, namely:
"three months before the revision of the YTC in accordance withthree months before the revision of the YTC in accordance with first proviso to sub‐clause (l) of clause (1) of this regulation".
Date for Submission of Technical Data by DICsDate for Submission of Technical Data by DICsDate for Submission of Yearly Transmission Charges (YTC) by Licensees
d l d2nd Validation Committee MeetingSubmission of Results

Thank You !!Thank You !!

Demand Projection – Northern Region
Entity Demand (MW)
Back
UP 10,333
Delhi 3,484
Haryana 4 720Haryana 4,720
Uttarakhand 1,412
Punjab 5,551
Rajasthan 6,053
Himachal Pradesh 1,119
J & K h i 1 290Jammu & Kashmir 1,290
Chandigarh 229

Demand Projection – Eastern Region
Entity Demand (MW)
Back
Entity Demand (MW)
West Bengal5,458
2 904Odisha
2,904
Bihar1,559
Jharkhand777
Sikkim46
DVC1,914

Demand Projection – Western Region
Entity
Back
Entity Demand (MW)
MP 4,881
Maharashtra 15,629
Chattisgarh 2,334
Gujarat 10,541
Goa 325
D&D 182
DNH 430

Demand Projection – North‐Eastern Region
Back
Entity Demand (MW)
Arunachal Pradesh 72
Assam 726
Manipur 48
Meghalaya 186
Mizoram 43Mizoram 43
Nagaland 53
Tripura 121Tripura 121

Demand Projection – Southern Region
Back
Entity Demand (MW)
Andhra Pradesh 10,458 ,
Karnataka 7,445
Kerala 2,535
Tamil Nadu 8,625
Pondicherry 293

Generation Projection – Northern Region
Entity Generation (MW)
UP 4392
Delhi 1191
Haryana 2092
Uttarakhand 589
Punjab 2435Punjab 2435
Rajasthan 3146
Himachal Pradesh 437Himachal Pradesh 437
Jammu & Kashmir 559
BBMB 1240

Generation Projection – Northern Region …(2)
Entity Generation (MW)Dadri Thermal 1383Dadri Thermal 1383
Rihand 1718
Singrauli 1661
Unchahar 883
Auraiya 435
Dadri CCPP 625
NAPS 239
Jhajjar 935
DHAULIGANGA 140
Tanakpur 47
Koteshwar 123
Tehri 292Tehri 292
Anta 290

Generation Projection – Northern Region …(3)
Entity Generation (MW)RAAP A,B,C 749
Back
AD Hydro 92
Everest 32
Karcham Wangtoo 573g
Bairasul 137
Chamera 1 392
Chamera 2 236Chamera 2 236
Chamera 3 (Unit 1) 29
Naptha Jhakri 1078
DULHASTI 338
Salal 502
Sewa-II 59
URI 1 HPS 467
Sree Cement 220

Generation Projection – Eastern Region
Entity Generation (MW)
Back
West Bengal 3971
Odisha 1300
Bihar 45
Jharkhand 304
Sikkim 0
DVC 2531
MPL 220
Sterlite 935
Teesta 341
Kahalgaon 1656Kahalgaon 1656
Farakka 1385
Talcher (Stg I) 862
Rangeet 36Rangeet 36
Bhutan 452

Generation Projection – Western Region…(1)
EntityGeneration (MW)
MP 2508
Maharashtra 8781
Chattisgarh 1440
Gujarat 7282
Goa 34

Generation Projection – Western Region … (2)
Entity Generation (MW)
Back
Entity Generation (MW)Vindhyachal 2823
Ratnagiri Dabhol 1257
TAPS (1 2 3 4) 1155TAPS (1,2,3,4) 1155
JINDAL 905
LANCO 368
NSPCL Bhil i 432NSPCL Bhilai 432
Korba 1868
SIPAT 1198
CGPL (Unit 1) 550
Gandhar 472
Kawas 408
KAPS 397
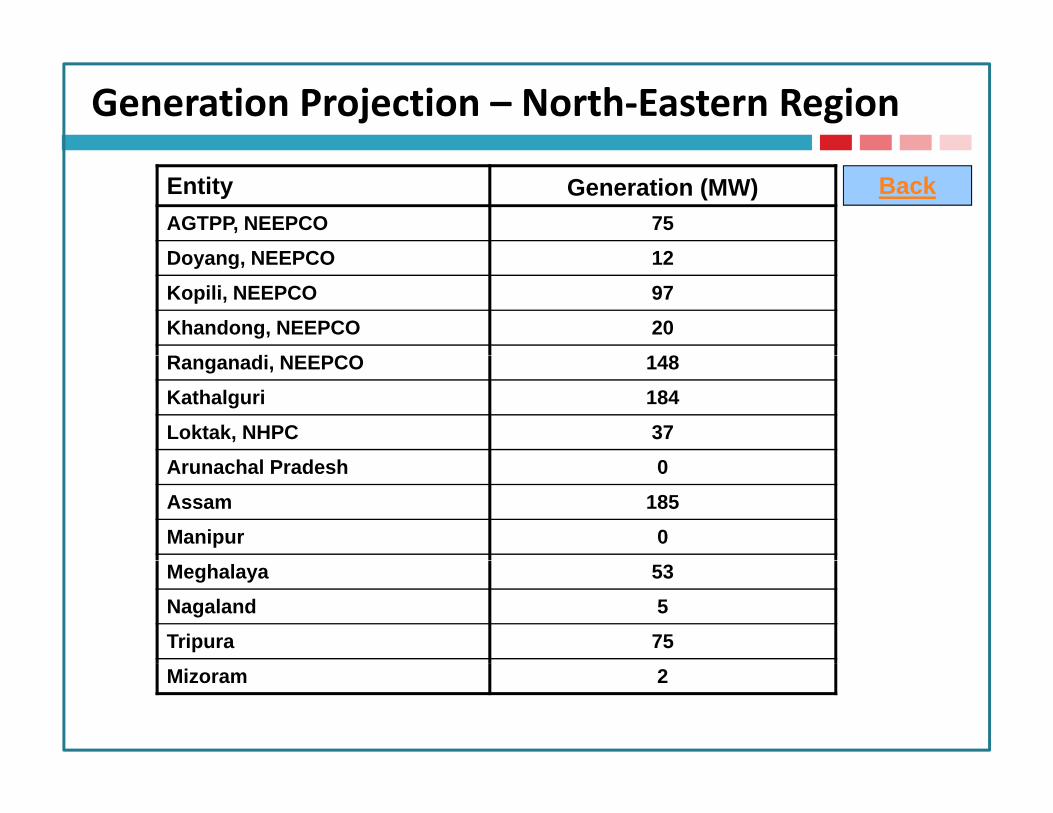
Generation Projection – North‐Eastern Region
Entity Generation (MW)AGTPP, NEEPCO 75
D NEEPCO 12
Back
Doyang, NEEPCO 12
Kopili, NEEPCO 97
Khandong, NEEPCO 20
R di NEEPCO 148Ranganadi, NEEPCO 148
Kathalguri 184
Loktak, NHPC 37
Arunachal Pradesh 0
Assam 185
Manipur 0
Meghalaya 53
Nagaland 5
Tripura 75
Mizoram 2

Generation Projection – Southern Region
Entity Generation (MW)Andhra Pradesh 5887
Back
Karnataka 4107Kerala 1047Tamil Nadu 3890Pondicherry 29Pondicherry 29Ramagundam 2280
NEYVELI ( EXT) TPS 364
NEYVELI TPS-II 1227NEYVELI TPS-II 1227
NEYVELI TPS- II EXP
Kaiga 589Lanco Kondapalli 188Simhadri 1268
SEPL (Unit -1) 101
Talcher (Stg II) 1724
TNWIND
KA-WIND