point of connection charges and losses computation (april
TRANSCRIPT

Point of Connection Charges and Losses Computation
April 2014 - June 2014 (Q1)
Meeting of the Validation CommitteeDate : 07th March 2014
Venue: NRPC, New Delhi

Assumptions
Extant PoC Regulations adopted
NEW and SR Grid Synchronization Simulation to be carried out for entire country
Charges of HVDC links to be socialised
Average generation and load scenario based on CEA data

Contents
PoC Computation for Q1 Case (Apr’14-Jun’14)
Demand & Generation Projection
New Generation
Points for Discussion

Demand Generation Projection
Demand and Generation Projection
Based on Last 3 years data (April-June) from CEA website.
New Generation
Expected DOCO by 31st March 2014
Generation Projection
Increasing Trend : Last Year figures considered
In other cases : Average of last three years
Normative Auxiliary Consumption deducted
Demand Projection
Based on FORECAST function of MS-Excel
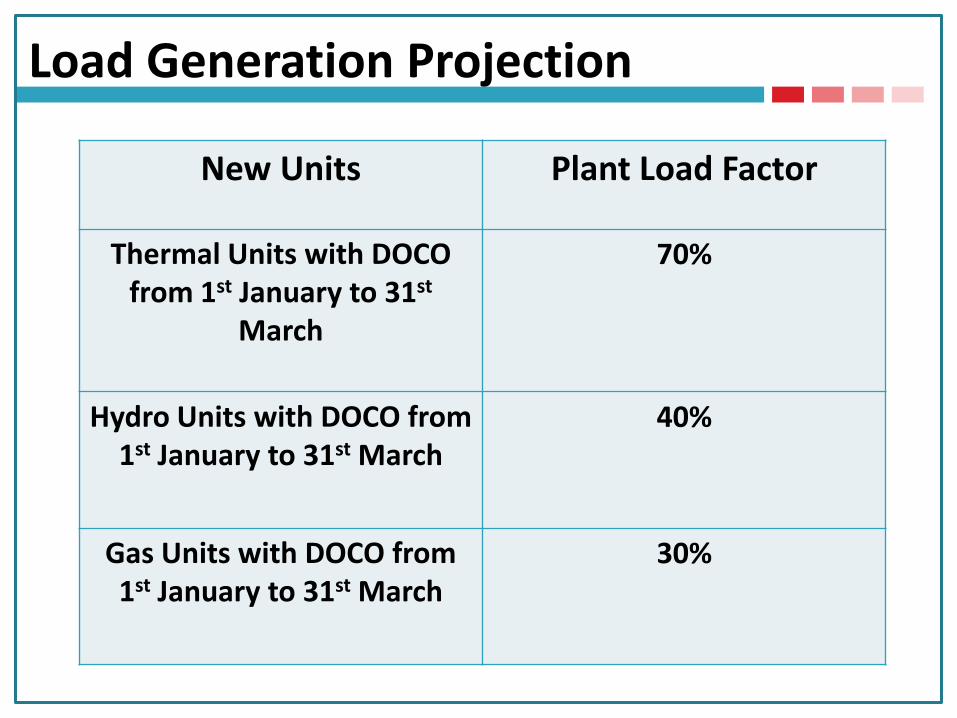
Load Generation Projection
New Units Plant Load Factor
Thermal Units with DOCO from 1st January to 31st
March
70%
Hydro Units with DOCO from 1st January to 31st March
40%
Gas Units with DOCO from 1st January to 31st March
30%

Demand and GenerationQ4 (Jan-Mar’14) Q1 (Apr-Jun’14)
Demand
(MW)
Generation
(MW)
Demand
(MW)
Generation
(MW)
NR 31055 29946 36502 34217
ER 12046 16130 13507 16353
WR 36180 41735 37685 39884
NER 1235 1230 1304 1282
SR 28569 29992 29778 28896
NEW Grid 80516 89041
All India 109085 119033 118776 120632

Comparison of Demand for Q3_2013-14
Northern Region
State/Region/System Projected Demand
(MW)Actual Demand (MW)
UP 9010 8776
Delhi 2615 2549
Haryana 4389 4405
Uttarakhand 1263 1257
Punjab 4007 4231
Rajasthan 7379 6847
Himachal Pradesh1047 952
Jammu & Kashmir 1485 1491
Chandigarh 148 148

Eastern Region
State/Region/System Projected Demand
(MW)Actual Demand (MW)
West Bengal 4981 4284
Odisha 2700 2439
Bihar 1600 1726
Jharkhand 825 835
Sikkim 52 49
DVC 2000 1849
Western RegionMP 8058 6470
Maharashtra 14000 14368
Chattisgarh 2312 2009
Gujarat 12814 9761
Goa 235 351
D&D 172 246
DNH 451 641
Contd...

Southern Region
State/Region/System Projected Demand
(MW)Actual Demand (MW)
Andhra Pradesh 9882 9786
Karnataka 7088 6720
Kerala 2470 2432
Tamil Nadu 9373 9526
Pondy 250 251
North Eastern Region
Arunachal Pradesh 74 60
Assam 763 807
Manipur 75 61
Meghalaya 200 193
Nagaland 67 61
Tripura 139 140
Mizoram 51 53
Contd..

Demand Projection
Northern Region
Eastern Region
Western Region
North-Eastern Region
Southern Region

Generation Projection (Including New Generation)
Northern Region
Eastern Region
Western Region
North-Eastern Region
Southern Region

Data Collection for PoC Computation (Q1)
Letter to DICs for Furnishing Technical & Commercial Data for Q1 (Apr’14-Jun’14) dated 09.01.2014
Data Received from:
MPPTCL GETCO
Essar Hazira Karnataka
Haryana APTRANSCO
Kerala DB Power
NAPS GRIDCO
DTL Chattisgarh
TAPS
Tamil Nadu
NHPC
THDC India Ltd.
SJVN Ltd.

YTC Data received from Transmission Licensees
Jaypee Powergrid Limited
BDTCL
POWERLINKS
RPTL

Points for Discussion
Provisional Tariff for new assets
Tariff for other assets

Thank You !!

Demand Projection – Northern Region
EntityQ4 (Jan-Mar’14)
(MW)
Q1 (Apr-Jun’14)
(MW)
Chandigarh 148 209
Delhi 2362 3458
Haryana 4049 5630
Himachal Pradesh 1022 1163
Jammu & Kashmir 1510 1344
Punjab 4643 6201
Rajasthan 7319 6642
Uttar Pradesh 8759 10437
Uttarakhand 1244 1417
Back

Demand Projection – Eastern Region
EntityQ4 (Jan-Mar’14)
(MW)
Q1 (Apr-Jun’14)
(MW)
Bihar 1573 1870
DVC 2030 2057
Jharkhand 877 856
Odisha 2700 3043
West Bengal 4825 5634
Sikkim 42 47
Back

Demand Projection – Western Region
EntityQ4 (Jan-Mar’14)
(MW)
Q1 (Apr-Jun’14)
MW)
Chhattisgarh 2478 2612
Gujarat 13639 12028
Madhya Pradesh 8090 5772
Maharashtra 13237 15488
Daman & Diu 244 253
Dadra Nagar Haveli 555 614
Goa 407 419
ESIL Hazira 515 500
Back

Demand Projection – North-Eastern Region
EntityQ4 (Jan-Mar’14)
(MW)
Q1 (Apr-Jun’14)
(MW)
Arunachal Pradesh 63 57
Assam 665 780
Manipur 58 56
Meghalaya 214 169
Mizoram 45 47
Nagaland 58 59
Tripura 133 136
Back

Demand Projection – Southern Region
EntityQ4 (Jan-Mar’14)
(MW)
Q1 (Apr-Jun’14)
(MW)
Andhra Pradesh 10064 10019
Karnataka 7189 7000
Kerala 2486 2442
Tamil Nadu 8559 10058
Pondicherry 272 296
Back

Generation Projection – Northern Region
S.No.
Entity
Projections based on 3 Years Data
(A)
Generationaddition during
1st Jul’13 –15th Feb'14
(B)
Expected Generation
16th Feb'14-31st Mar'14
(C )
TOTALD=A+B+C
Comments/ Comments From DICs
(if any)
Figure as per
Comments
(MW) (MW) (MW) (MW) (MW)
1 UP 5219 1320 - 6539 - -
2 Delhi 1135 - - 1135 - -
3 Haryana 2029 - - 2029 - -
4 Uttarakhand 603 10 - 612 - -
5 Punjab 2311 - 458 2769 - -
6 Rajasthan 3413 1334 47 4794 - -
7Himachal Pradesh
436 - - 436 - -
8Jammu & Kashmir
538 - - 538 - -
9 BBMB 1332 - - 1332 - -

Generation Projection – Northern Region …(2)
S.No.
Entity
Projections based on 3 Years Data
(A)
Generationaddition during
1st Jul’13 –15th Feb'14
(B)
Expected Generation
16th Feb'14-31st Mar'14
(C )
TOTALD=A+B+C
Comments/ Comments From DICs
(if any)
Figure as per
Comments
(MW) (MW) (MW) (MW) (MW)
12 Dadri Thermal 1458 - - 1458 - -13 Rihand 2015 - - 2015 - -14 Singrauli 1617 - - 1617 - -15 Unchahar 830 - - 830 - -16 Auraiya 333 - - 333 - -17 Dadri CCPP 511 - - 511 - -18 NAPS 269 - - 269 - -19 Jhajjar 508 - - 508 - -
20 DHAULIGANGA 138 - - 138 - -
21 Tanakpur 48 - - 48 - -
22 Koteshwar 172 - - 172 - -23 Tehri 352 - - 352 - -24 Anta 245 - - 245 - -
25 RAAP A,B,C 849 - - 849 - -
26 AD Hydro 118 - - 118 - -27 Everest 49 - - 49 - -

Generation Projection – Northern Region …(3)Back
S.No.
Entity
Projections based on 3 Years Data
(A)
Generationaddition during
1st Jul’13 –15th Feb'14
(B)
Expected Generation
16th Feb'14-31st Mar'14
(C )
TOTALD=A+B+
C
Comments/ Comments From DICs
(if any)
Figure as per
Comments
(MW) (MW) (MW) (MW) (MW)
28 Karcham Wangtoo 709 - - 709 - -
29 Bairasul 125 - - 125 - -
30 Chamera 1 408 - - 408 - -
31 Chamera 2 237 - - 237 - -
32 Chamera 3 154 - - 154 - -
33 Naptha Jhakri 1063 - - 1063 - -
34 Lanco Budhil 33 - - 33 - -
35 DULHASTI 326 - - 326 - -
36 Salal 498 - - 498 - -
37 Sewa-II 84 - - 84 - -
38 URI I HPS 468 - - 468 - -
39 URI II HPS - 71 24 95 - -
40 Sree Cement 220 - - 220 - -
41 Parbati III - 51 51 103 - -

Generation Projection – Eastern Region…(1)
S.No.
Entity
Projections based on 3 Years Data
(A)
Generationaddition during
1st Jul’13 –15th Feb'14
(B)
Expected Generation
16th Feb'14-31st
Mar'14(C )
TOTALD=A+B+
C
Comments/ Comments From
DICs (if any)
Figure as per
Comments
(MW) (MW) (MW) (MW) (MW)
42 West Bengal 3810 52 - 3862 - -
43 Odisha 1409 - 225 1634 Share from sterlite 2354
44 Bihar 18 - - 18 - -
45 Jharkhand - - 0 - -
46 Sikkim - - - 0 - -
47 Chujachan - 22 - 22 - -
48 DVC 3047 655 - 3701 - -
49 MPL 734 - - 734 - -
50 Sterlite 1220 - - 1220500 is Odisha
Share; 720

Generation Projection – Eastern Region…(2)Back
S.No.
Entity
Projections based on 3 Years Data
(A)
Generationaddition during
1st Jul’13 –15th Feb'14
(B)
Expected Generation
16th Feb'14-31st Mar'14
(C )
TOTALD=A+B+C
Comments/ Comments From DICs
(if any)
Figure as per
Comments
(MW) (MW) (MW) (MW) (MW)
51 Teesta 351 - - 351 - -
52 Kahalgaon 1470 - - 1470 - -
53 Farakka 1215 - - 1215 - -
54 Talcher 796 - - 796 - -
55 Rangeet 37 - - 37 - -
56 Corporate Power - - - 0 - -
57 Adhunik Power - 348 - 348 - -
58 Barh - - 432 432 - -
59 Bhutan 513 - - 513 - -

Generation Projection – Western Region…(1)
S.No.
Entity
Projections based on 3 Years Data
(A)
Generationaddition during
1st Jul’13 –15th Feb'14
(B)
Expected Generation
16th Feb'14-31st Mar'14
(C )
TOTALD=A+B+
C
Comments/ Comments From DICs
(if any)
Figure as per
Comments
(MW) (MW) (MW) (MW) (MW)60 MP 2641 1037 - 3678 - -61 Maharashtra 8423 1622 10045 - -62 Chattisgarh 1430 671 393 2493 - -63 Gujarat 7172 327 - 7499 - -64 Goa 30 - - 0 - -65 D&D - - - 0 - -66 DNH - - - 0 - -67 Vindhyachal 3044 327 3371 - -
68RatnagiriDabhol
982 - - 982 - 0
69 TAPS (1,2,3,4) 959 - - 959 - -70 JINDAL 901 - - 901 - -71 LANCO 329 - - 329 - -72 NSPCL Bhilai 406 - - 406 - -73 Korba 2007 - - 2007 - -74 SIPAT 1896 - - 1896 - -

Generation Projection – Western Region … (2)Back
S.No.
Entity
Projections based on 3 Years Data
(A)
Generationaddition during
1st Jul’13 –15th Feb'14
(B)
Expected Generation
16th Feb'14-31st Mar'14
(C )
TOTALD=A+B+C
Comments/ Comments From DICs
(if any)
Figure as per
Comments
(MW) (MW) (MW) (MW) (MW)
75 CGPL 2625 - 2625 - -
76 Mauda - 327 - 327 - -
77 Gandhar 396 - - 396 - -
78 Kawas 333 - - 333 - -
79 KAPS 388 - - 388 - -
80 Essar Mahan - 300 - 300 - -
81 BALCO - - 193 193 - -82 KSK Mahanadi - 393 - 393 - -
83 Vandana Vidyut - - 87 87 - -
84 Sasan UMPP - 864 - 864 - -
85 Tamnar TPP - - 393 393

Generation Projection – North-Eastern Region
Back
S.No.
Entity
Projections based on 3 Years Data
(A)
Generationaddition during
1st Jul’13 –15th Feb'14
(B)
Expected Generation
16th Feb'14-31st
Mar'14(C )
TOTALD=A+B+C
Comments/ Comments From DICs
(if any)
Figure as per
Comments
(MW) (MW) (MW) (MW) (MW)86 AGTPP, NEEPCO 73 - - 73 - -
87 Doyang, NEEPCO 15 - - 15 - -
88 Kopili, NEEPCO 64 - - 64 - -
89 Khandong, NEEPCO 34 - - 34 - -
90 Ranganadi, NEEPCO 125 - - 125 - -
91 Kathalguri 196 - - 196 - -
92 Loktak, NHPC 38 - - 38 - -
93 Palatana GBPP - 310 - 310 - -94 Arunachal Pradesh 0 - - 0 - -
95 Assam 195 - - 195 - -
96 Manipur 0 - - 0 - -
97 Meghalaya 95 46 - 140 - -98 Nagaland 9 - - 9 - -
99 Tripura 79 - - 79 - -
100 Mizoram 3 - - 3 - -
Back

Generation Projection – Southern Region…(1)
S.No.
Entity
Projections based on 3 Years Data
(A)
Generationaddition during
1st Jul’13 –15th Feb'14
(B)
Expected Generation
16th Feb'14-31st Mar'14
(C )
TOTALD=A+B+C
Comments/ Comments From DICs
(if any)
Figure as per Comments
(MW) (MW) (MW) (MW) (MW)
101 Andhra Pradesh 6641 - - 6641 - -
102 Karnataka
4546 (excluding
wind generation)
- - 4546 - 6000
103 Kerala 910 - - 910 - -
104 Tamil Nadu 5860 393 393 6645 - -
105 Pondy 29 - - 0 - -
106 Ramagundam 2231 - - 2231 - -
107 Simhadri 552 - - 552 - -
108 SEPL 218 - 97 314 - -
109Lanco
Kondapalli- - - - - -

Generation Projection – Southern Region…(2)Back
S.No.
Entity
Projections based on 3 Years Data
(A)
Generationaddition during
1st Jul’13 –15th Feb'14
(B)
Expected Generation
16th Feb'14-31st
Mar'14(C )
TOTALD=A+B+
C
Comments/ Comments From DICs
(if any)
Figure as per
Comments
(MW) (MW) (MW) (MW) (MW)
109 Kaiga 690 - - 690 - -
110 NEYVELI ( EXT) TPS 360 - - 360 - -
111 NEYVELI TPS-II 1239 - - 1239 - -
112 NEYVELI TPS-II EXP - - - 0 - -
113 MAPS 223 - - 223 - -
114 Vallur - 327 327 655 - -
115 Meenakhshi - 193 - 193 - -
116 Kudankulam - - 910 910 - 650
117Import from
Talcher1592 - - 1592 - -
Back

Expected Generation addition – Northern Region (1)Back
Generation After 1st July’13 till 15th February'14Expected Generation Likely to be declared
Commercial from 16th February'2014 to 31st Mach'2014
Entity Bus NameUnit No.
Installed Capacity
Gen. considered
Total Bus NameUnit No.
Installed Capacity
Gen. considered
Total
(MW) (MW) (MW) (MW) (MW) (MW)
UP
Harduaganj 8 250 161
1320
Harduaganj 9 250 161Paricha 5 250 161Paricha 6 250 161
Rosa-II TPS 1 300 193Rosa-II TPS 2 300 193
Bajaj 450 290
UttarakhandBhilangana 1 8 3
10Bhilangana 2 8 3Bhilangana 3 8 3
Punjab Rajpura TPP 1 700 458 458
Rajasthan
Rajwest 5 135 87
1334
Ramgarh GT 1 160 47
47
Rajwest 6 135 87Rajwest 7 135 87Rajwest 8 135 87
Chhabra-II 1 250 161Kawai 2 660 432
Kalisindh 1 600 393

Expected Generation addition – Northern Region…(2)
Back
Generation After 1st July’13 till 15th February'14Expected Generation Likely to be declared
Commercial from 16th February'2014 to 31st Mach'2014
Entity Bus Name Unit No.Installed Capacity
Gen. considered
Total Bus NameUnit No.
Installed Capacity
Gen. considered
Total
(MW) (MW) (MW) (MW) (MW) (MW)
URI II HPS
Uri II1 60 24
71Uri II 4 60 24 24Uri II
2 60 24
Uri II3 60 24
Parbati III Parbati III 1 130 51 51 Parbati III 2 130 51 51
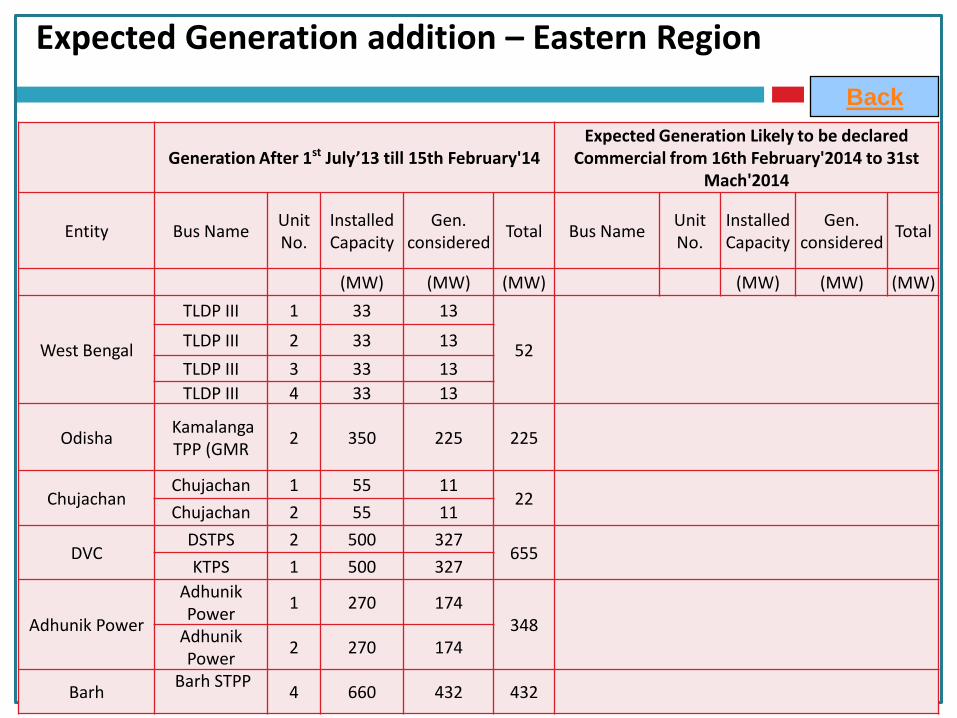
Expected Generation addition – Eastern Region
Back
Generation After 1st July’13 till 15th February'14Expected Generation Likely to be declared
Commercial from 16th February'2014 to 31st Mach'2014
Entity Bus NameUnit No.
Installed Capacity
Gen. considered
Total Bus NameUnit No.
Installed Capacity
Gen. considered
Total
(MW) (MW) (MW) (MW) (MW) (MW)
West Bengal
TLDP III 1 33 13
52TLDP III 2 33 13
TLDP III 3 33 13
TLDP III 4 33 13
OdishaKamalangaTPP (GMR
2 350 225 225
ChujachanChujachan 1 55 11
22Chujachan 2 55 11
DVCDSTPS 2 500 327
655KTPS 1 500 327
Adhunik Power
Adhunik Power
1 270 174348
Adhunik Power
2 270 174
Barh Barh STPP
4 660 432 432

Expected Generation addition – Western Region…(1)Back
Generation After 1st July’13 till 15th February'14Expected Generation Likely to be declared
Commercial from 16th February'2014 to 31st Mach'2014
Entity Bus NameUnit No.
Installed Capacity
Gen. considered
Total Bus Name Unit No.Installed Capacity
Gen. considere
dTotal
(MW) (MW) (MW) (MW) (MW) (MW)
MP
JP Bina Power TP 1 250 161
1037
JP Bina Power TP 2 250 161
Satpura TPP Extn. 10 250 161
Satpura TPP Extn11 250 161
Malwa1 600 393
Maharashtra
Vidarbha Power Ltd.
2 300 193
1622
Bela TPP 1 270 174EMCO, Warora 1 300 193
Bhusawal II 2 500 327India Bulls Amravati
1 270 174
Nasik(Sinner) (india-bulls)
1 270 174
EMCO Warora 2 300 193Dhariwal TPP
1 300 193
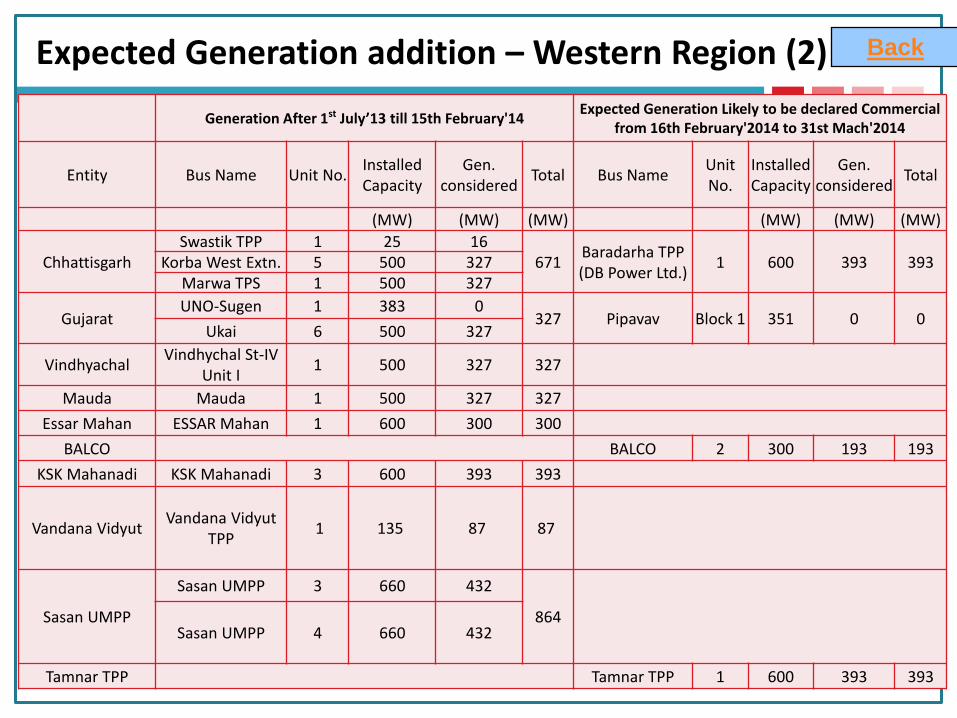
Expected Generation addition – Western Region (2) Back
Generation After 1st July’13 till 15th February'14Expected Generation Likely to be declared Commercial
from 16th February'2014 to 31st Mach'2014
Entity Bus Name Unit No.Installed Capacity
Gen. considered
Total Bus NameUnit No.
Installed Capacity
Gen. considered
Total
(MW) (MW) (MW) (MW) (MW) (MW)
ChhattisgarhSwastik TPP 1 25 16
671Baradarha TPP (DB Power Ltd.)
1 600 393 393Korba West Extn. 5 500 327Marwa TPS 1 500 327
GujaratUNO-Sugen 1 383 0
327 Pipavav Block 1 351 0 0Ukai 6 500 327
VindhyachalVindhychal St-IV
Unit I1 500 327 327
Mauda Mauda 1 500 327 327
Essar Mahan ESSAR Mahan 1 600 300 300
BALCO BALCO 2 300 193 193
KSK Mahanadi KSK Mahanadi 3 600 393 393
Vandana VidyutVandana Vidyut
TPP1 135 87 87
Sasan UMPP
Sasan UMPP 3 660 432
864Sasan UMPP 4 660 432
Tamnar TPP Tamnar TPP 1 600 393 393

Expected Generation addition – Southern Region Back
Generation After 1st July’13 till 15th February'14Expected Generation Likely to be declared
Commercial from 16th February'2014 to 31st Mach'2014
Entity Bus NameUnit No.
Installed Capacity
Gen. considered
Total Bus NameUnit No.
Installed Capacity
Gen. considere
dTotal
(MW) (MW) (MW) (MW) (MW) (MW)
Tamil NaduMettur Stg III
1 600 393 393North
Chennai Stg II1 600 393 393
SEPL SEPL 3 150 97 97
Vallur
Vallur TPP Ph1 1 500 327
655Vallur TPP Ph1
2 500 327
MeenakhshiMeenakshi 1 150 97
193Meenakshi 2 150 97
Kudankulam Kudankulam 1 1000 910 910

Expected Generation addition –North Eastern Region Back
Generation After 1st July’13 till 15th February'14Expected Generation Likely to be declared
Commercial from 16th February'2014 to 31st Mach'2014
Entity Bus NameUnit No.
Installed Capacity
Gen. considered
Total Bus NameUnit No.
Installed Capacity
Gen. consider
edTotal
(MW) (MW) (MW) (MW) (MW) (MW)
Palatana GBPP Palatana GBPP 1 363 310 310
Meghalaya
Leshka HPP 3 42 17
46Meghalaya Power Limited
2 45 29