poland’s economy in 2020
TRANSCRIPT
during Covid-19 crisis
Poland’s economy in 2020
January 2020

Strenghts of Poland’s economy
2 www.gov.pl/development
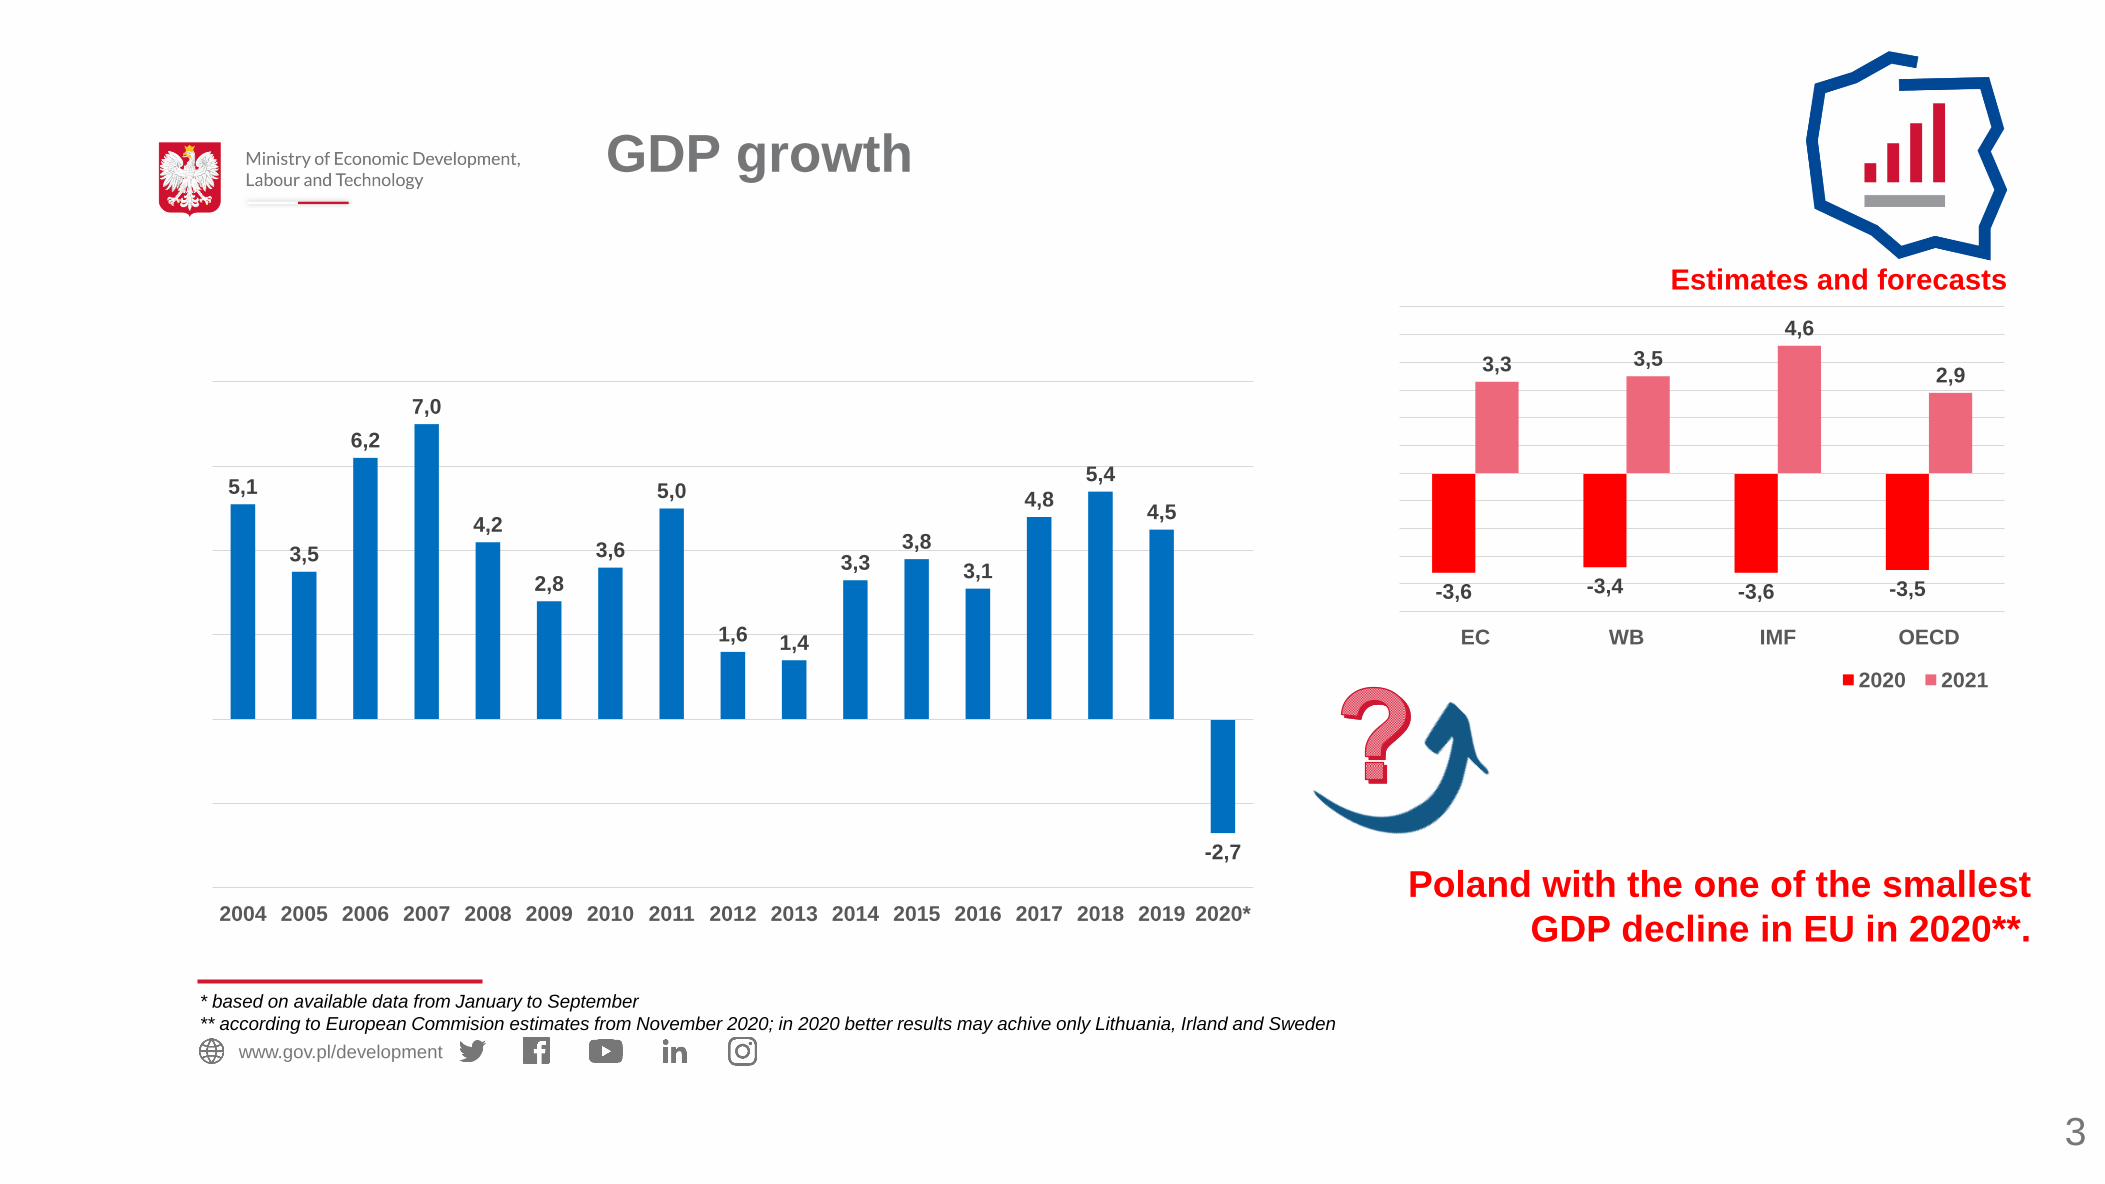
GDP growth
3
www.gov.pl/development
5,1
3,5
6,2
7,0
4,2
2,8
3,6
5,0
1,6 1,4
3,3 3,8
3,1
4,8
5,4
4,5
-2,7
2004 2005 2006 2007 2008 2009 2010 2011 2012 2013 2014 2015 2016 2017 2018 2019 2020*
-3,6 -3,4 -3,6 -3,5
3,3 3,5
4,6
2,9
EC WB IMF OECD
2020 2021
Poland with the one of the smallest
GDP decline in EU in 2020**.
* based on available data from January to September
** according to European Commision estimates from November 2020; in 2020 better results may achive only Lithuania, Irland and Sweden
Estimates and forecasts
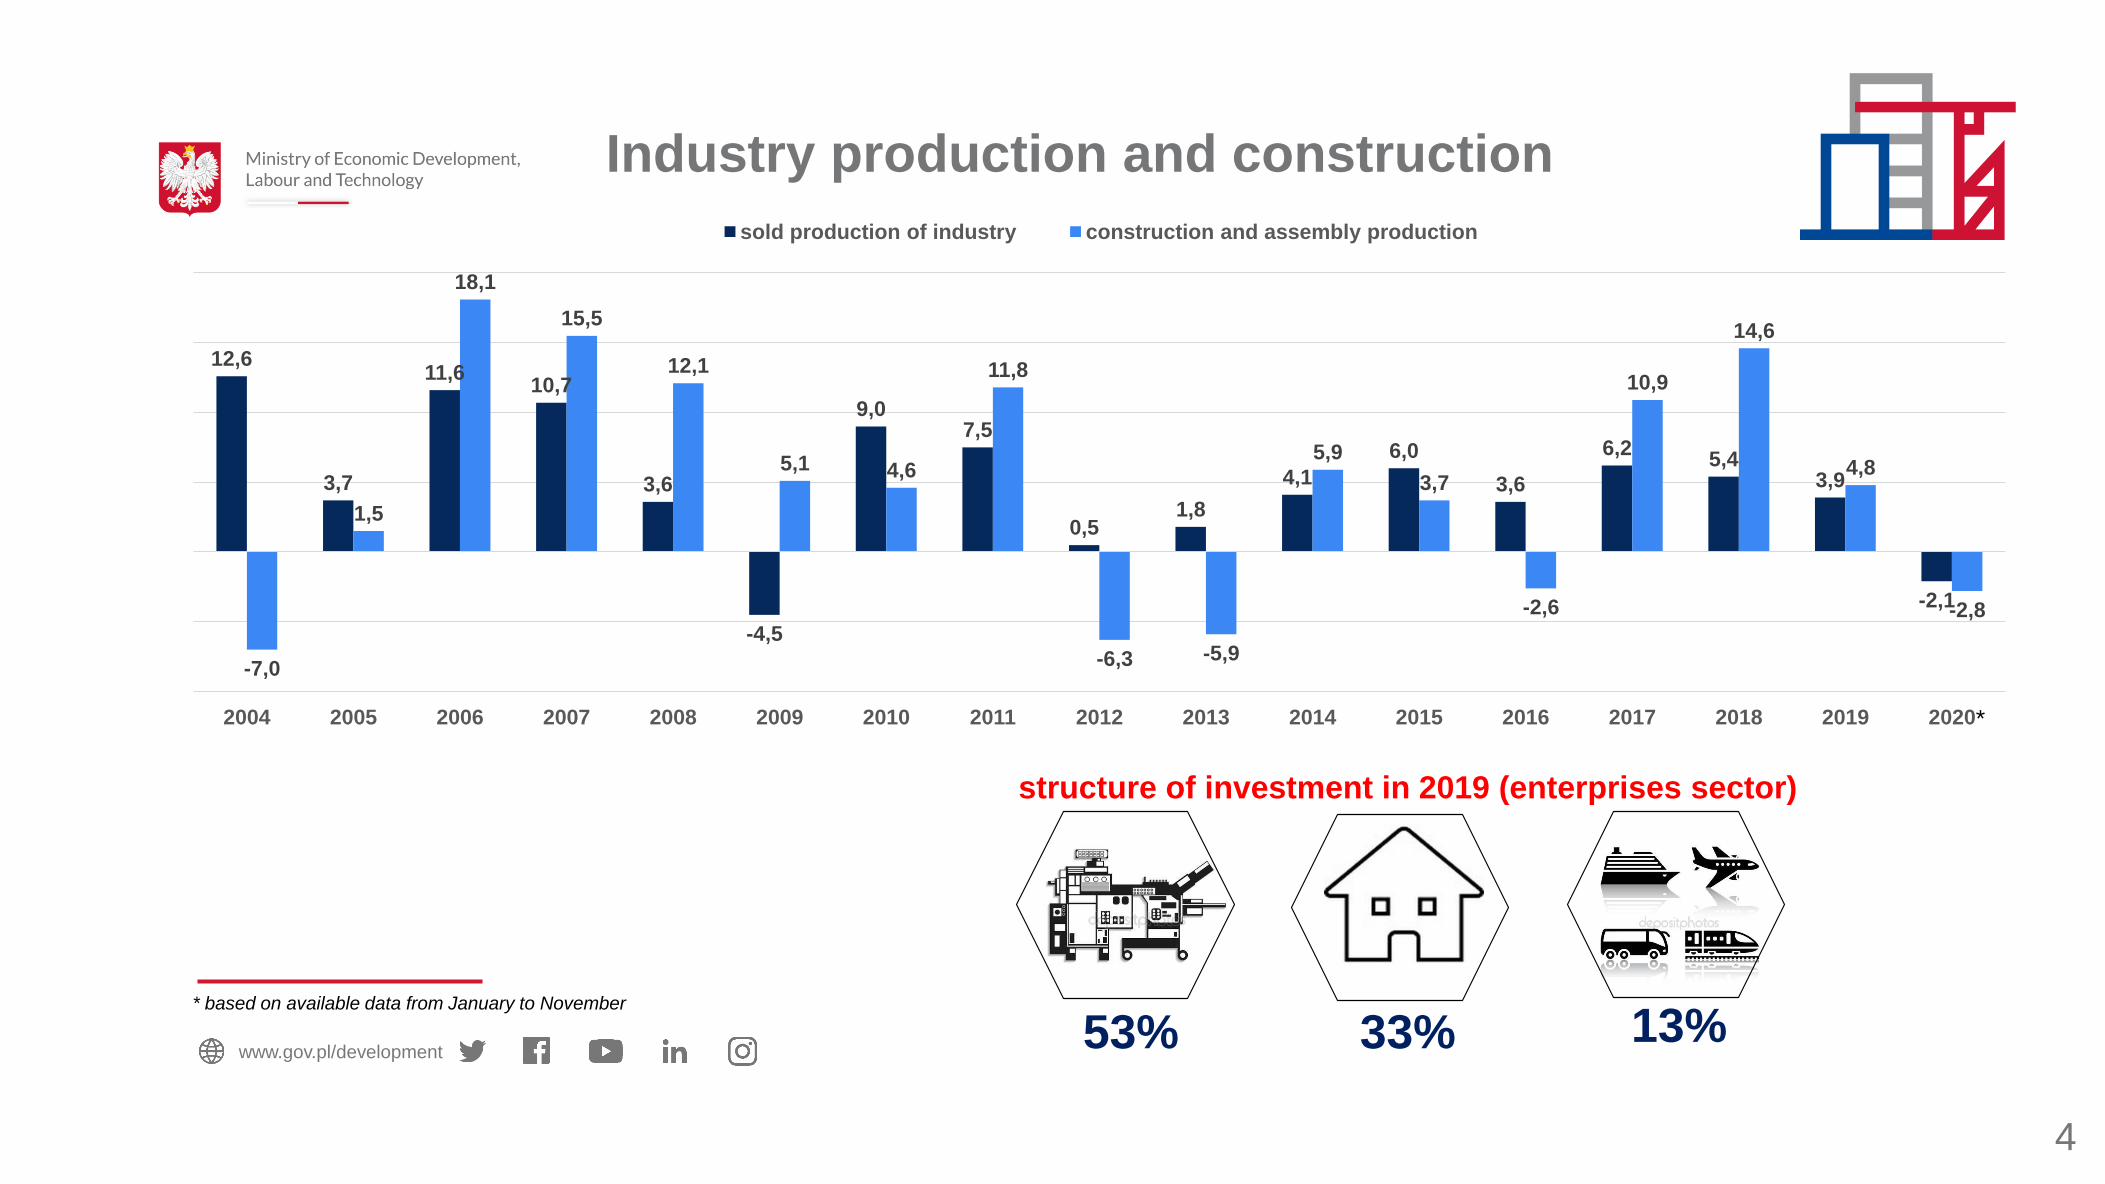
Industry production and construction
4
www.gov.pl/development
12,6
3,7
11,6 10,7
3,6
-4,5
9,0 7,5
0,5 1,8
4,1
6,0
3,6
6,2 5,4
3,9
-2,1
-7,0
1,5
18,1
15,5
12,1
5,1 4,6
11,8
-6,3 -5,9
5,9
3,7
-2,6
10,9
14,6
4,8
-2,8
2004 2005 2006 2007 2008 2009 2010 2011 2012 2013 2014 2015 2016 2017 2018 2019 2020
sold production of industry construction and assembly production
structure of investment in 2019 (enterprises sector)
53% 33% 13%
*
* based on available data from January to November
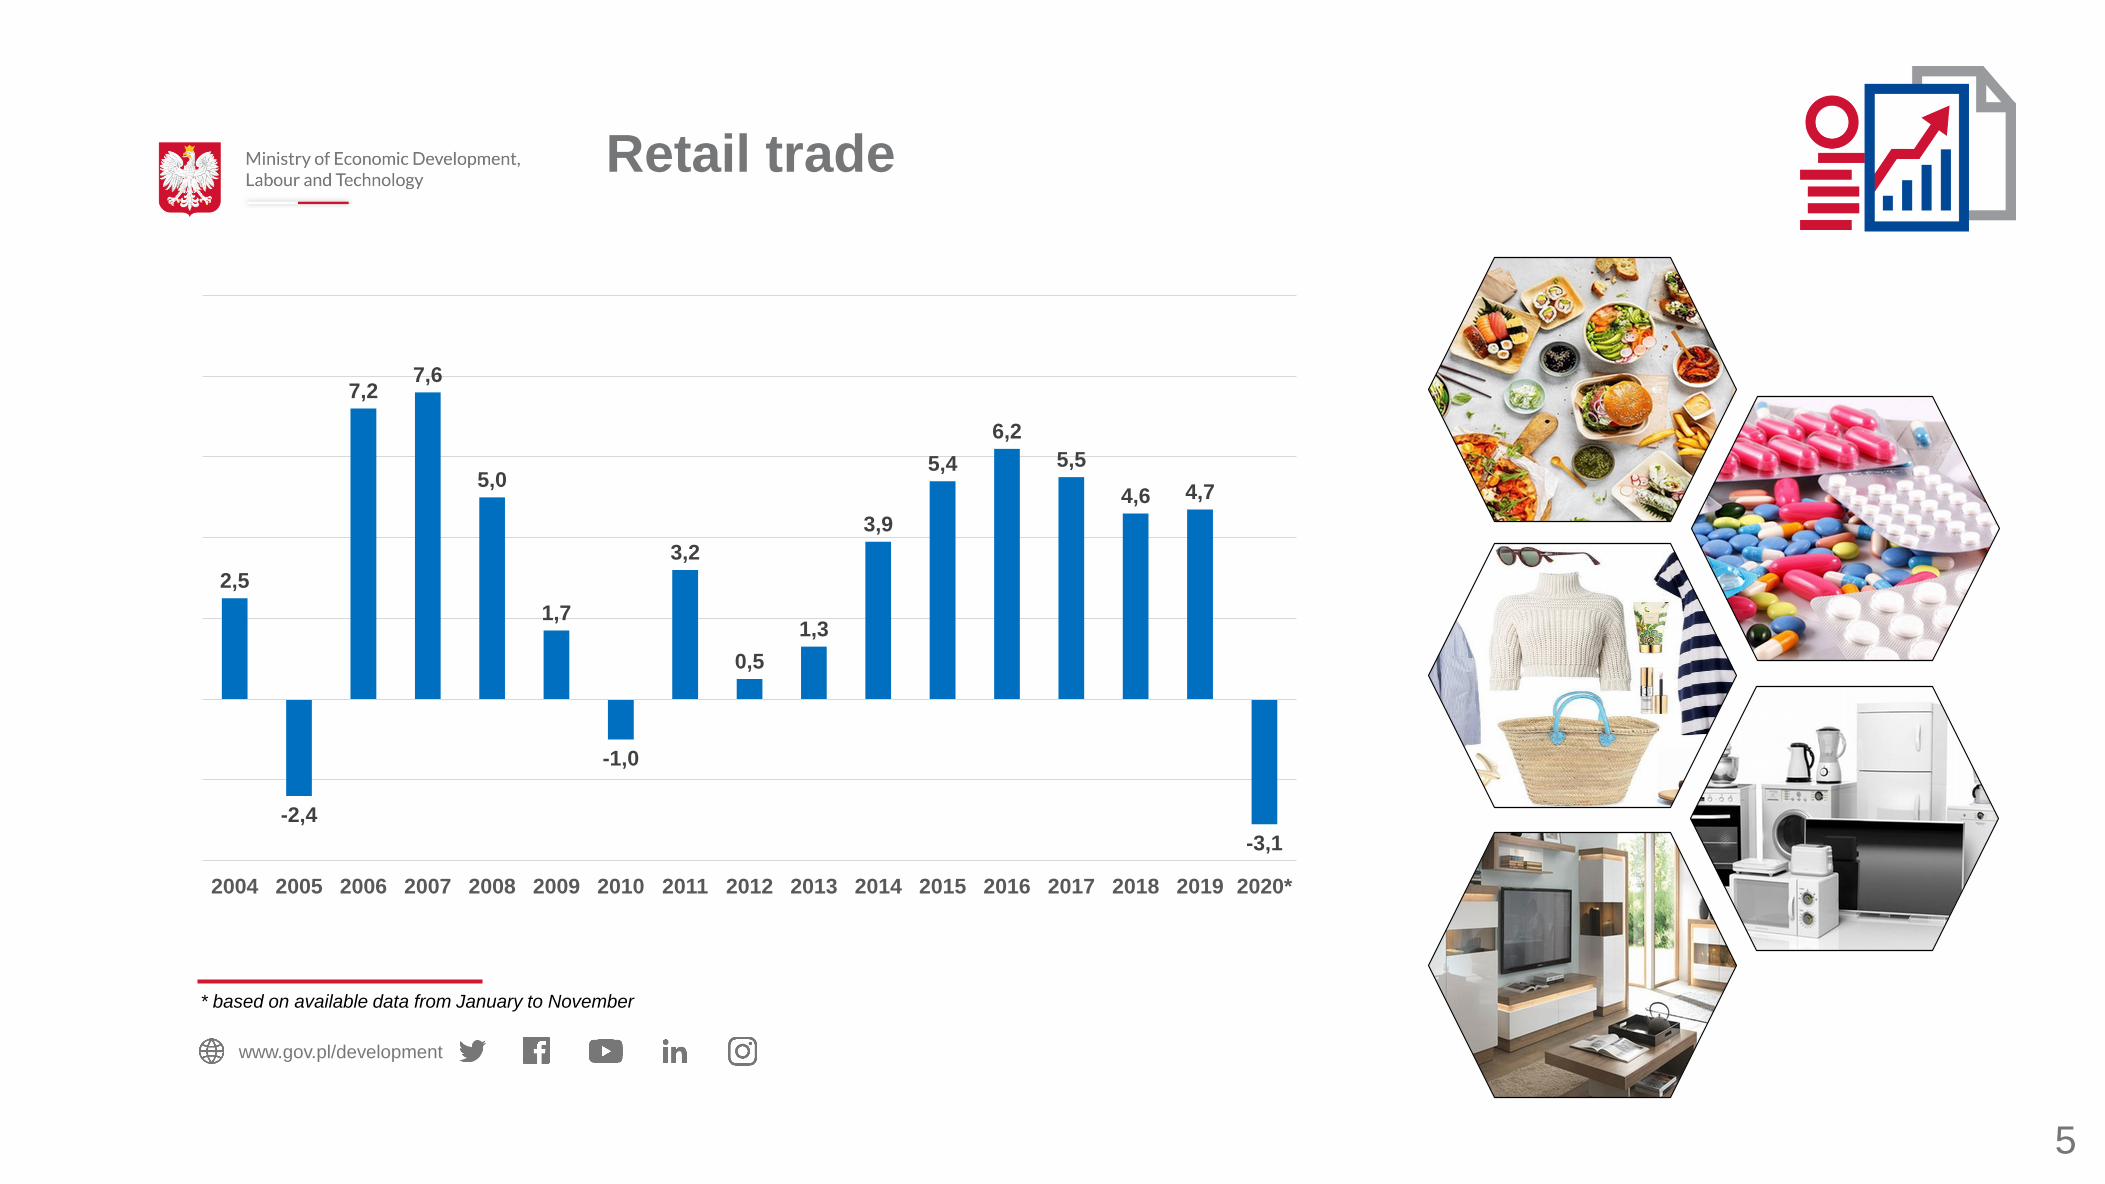
Retail trade
5
www.gov.pl/development
2,5
-2,4
7,2 7,6
5,0
1,7
-1,0
3,2
0,5
1,3
3,9
5,4
6,2
5,5
4,6 4,7
-3,1
2004 2005 2006 2007 2008 2009 2010 2011 2012 2013 2014 2015 2016 2017 2018 2019 2020*
* based on available data from January to November
Kliknij, aby edytować
styl
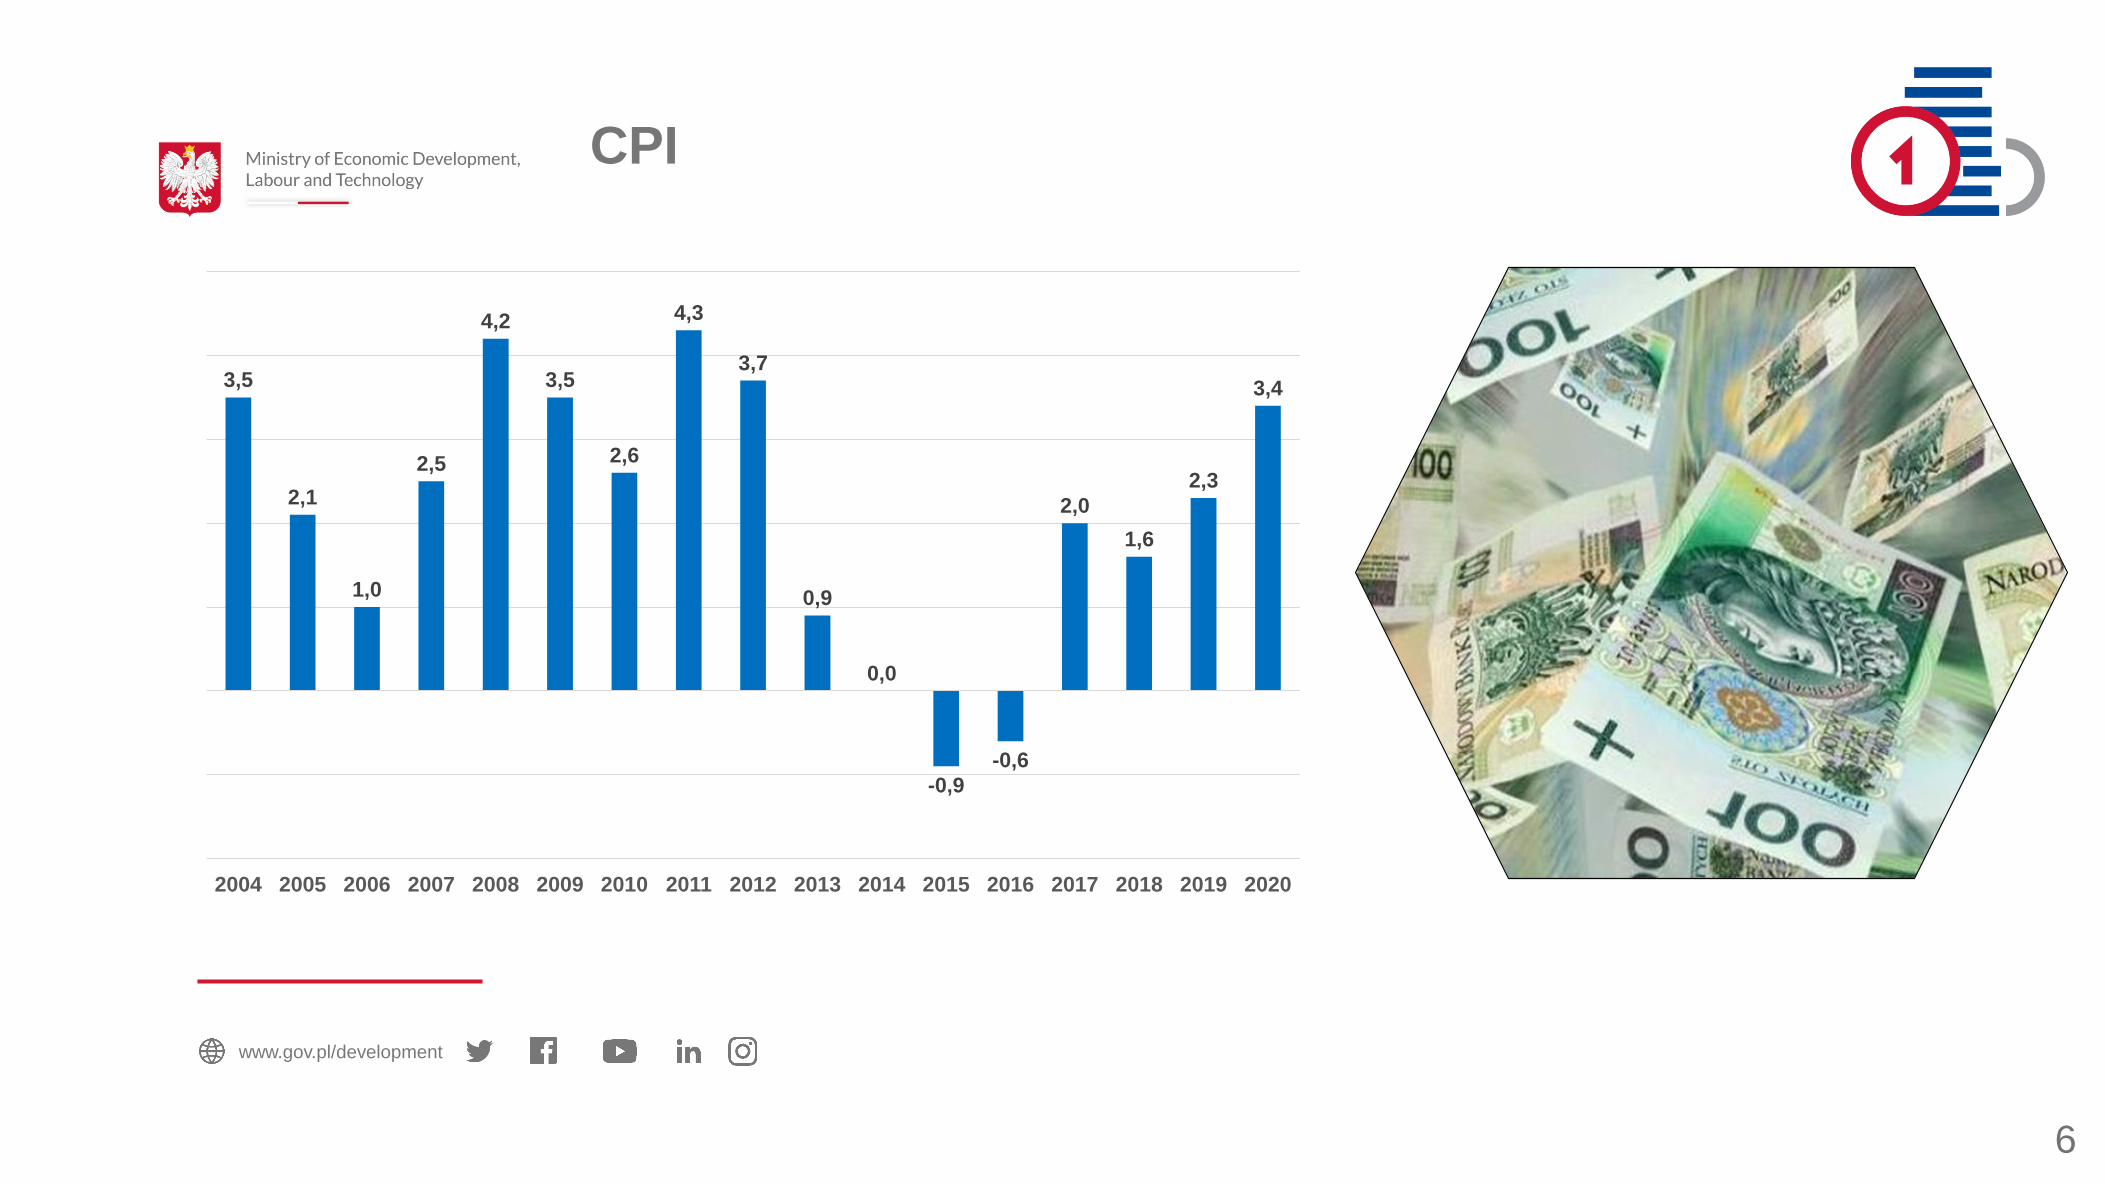
CPI
www.gov.pl/development
3,5
2,1
1,0
2,5
4,2
3,5
2,6
4,3
3,7
0,9
0,0
-0,9
-0,6
2,0
1,6
2,3
3,4
2004 2005 2006 2007 2008 2009 2010 2011 2012 2013 2014 2015 2016 2017 2018 2019 2020
6
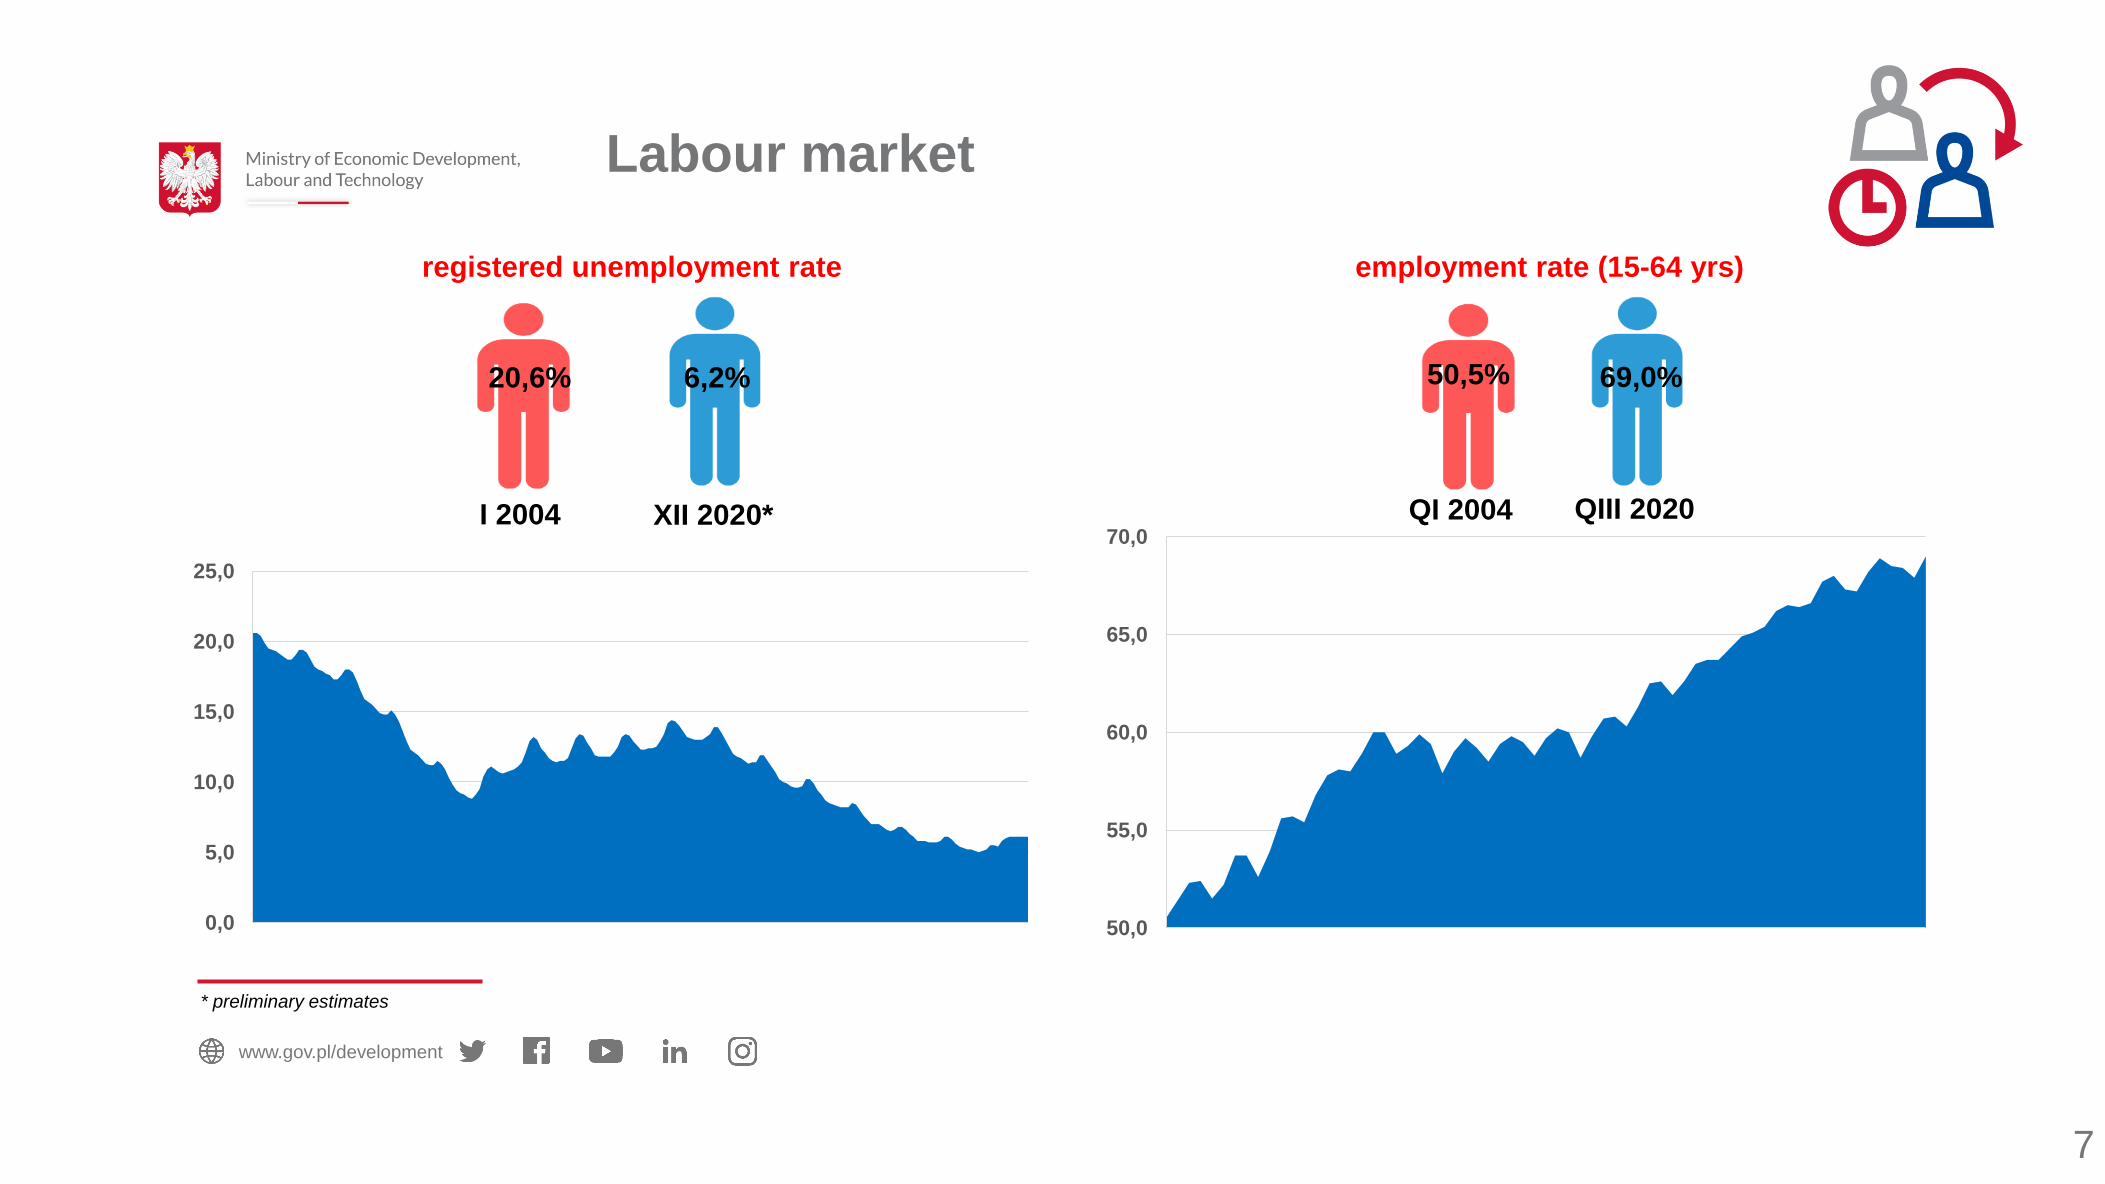
Labour market
7
www.gov.pl/development
0,0
5,0
10,0
15,0
20,0
25,0
registered unemployment rate
50,0
55,0
60,0
65,0
70,0
employment rate (15-64 yrs)
20,6% 6,2% 50,5% 69,0%
QIII 2020 XII 2020* QI 2004 I 2004
* preliminary estimates
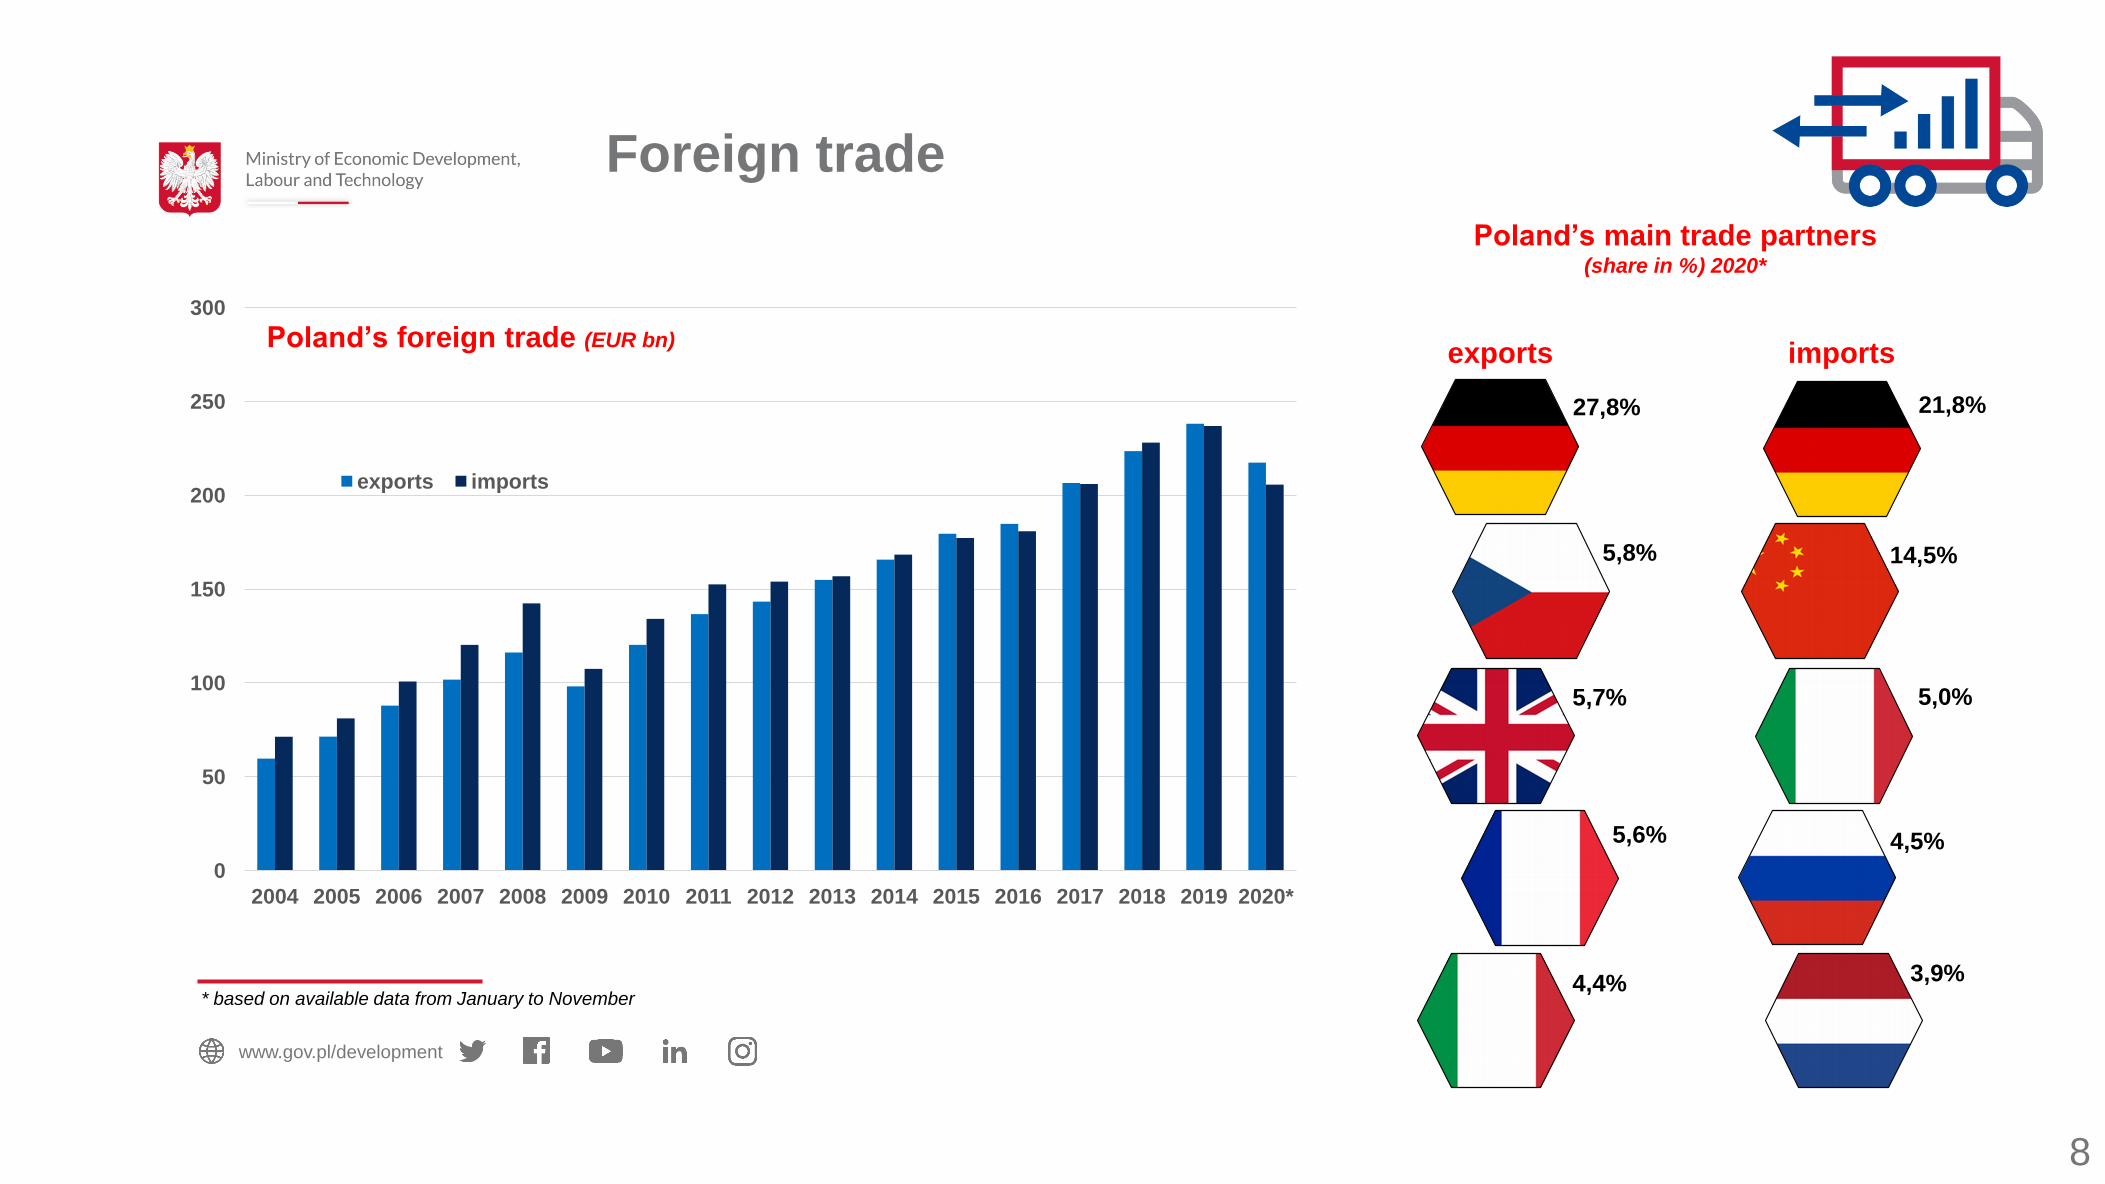
Foreign trade
8
www.gov.pl/development
0
50
100
150
200
250
300
2004 2005 2006 2007 2008 2009 2010 2011 2012 2013 2014 2015 2016 2017 2018 2019 2020*
exports imports
Poland’s foreign trade (EUR bn)
Poland’s main trade partners (share in %) 2020*
exports
imports
27,8%
5,7%
5,6%
4,4%
21,8%
14,5%
5,0%
4,5%
3,9%
5,8%
* based on available data from January to November
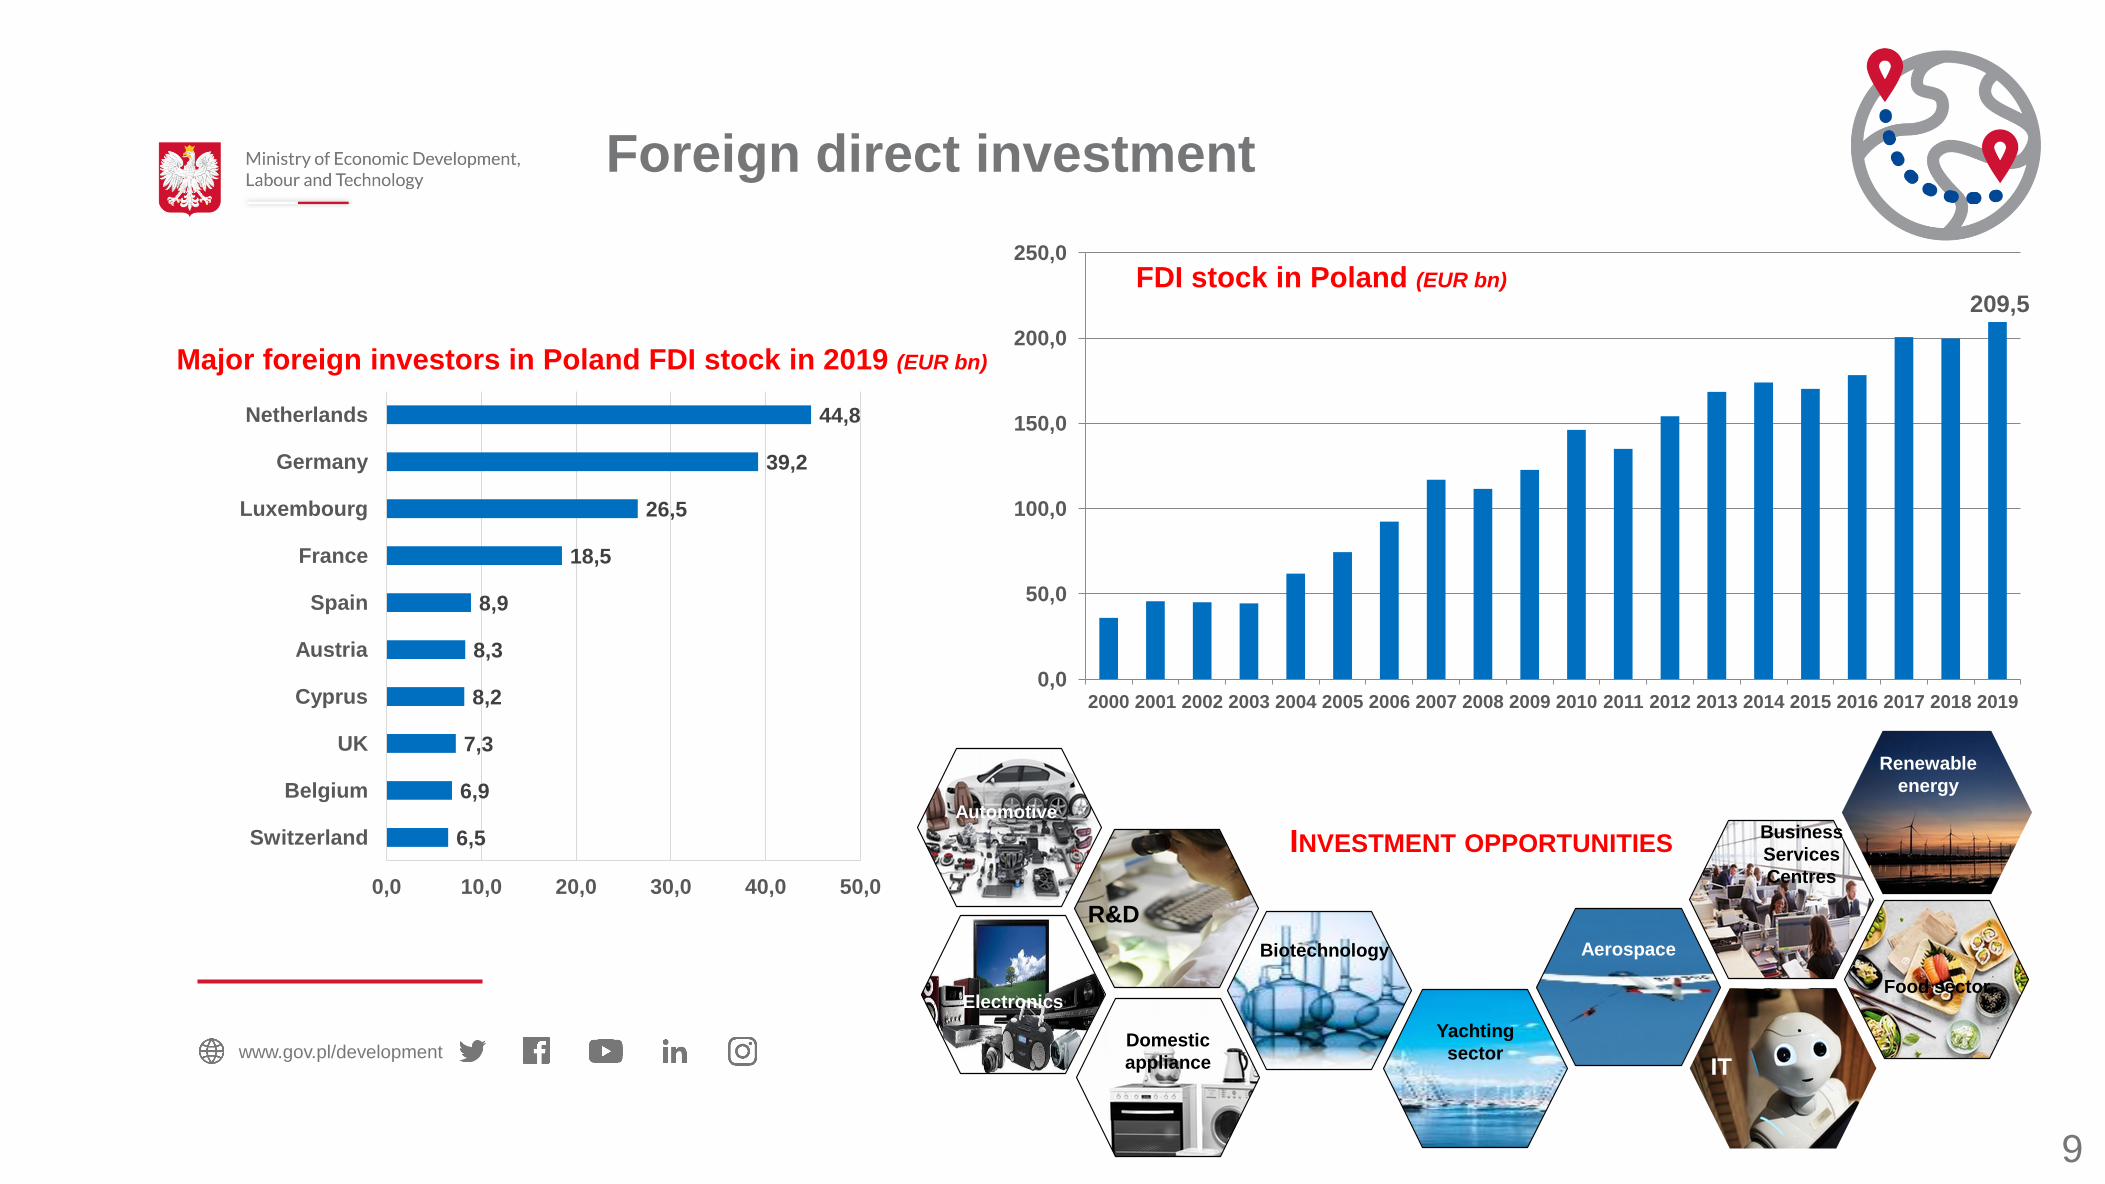
Foreign direct investment
9
www.gov.pl/development
FDI stock in Poland (EUR bn)
Major foreign investors in Poland FDI stock in 2019 (EUR bn)
6,5
6,9
7,3
8,2
8,3
8,9
18,5
26,5
39,2
44,8
0,0 10,0 20,0 30,0 40,0 50,0
Switzerland
Belgium
UK
Cyprus
Austria
Spain
France
Luxembourg
Germany
Netherlands
INVESTMENT OPPORTUNITIES
Automotive
Electronics
Domestic
appliance
Yachting
sector
Aerospace
Food sector
Renewable
energy
IT
R&D
Business
Services
Centres
Biotechnology
0,0
50,0
100,0
150,0
200,0
250,0
2000 2001 2002 2003 2004 2005 2006 2007 2008 2009 2010 2011 2012 2013 2014 2015 2016 2017 2018 2019
209,5
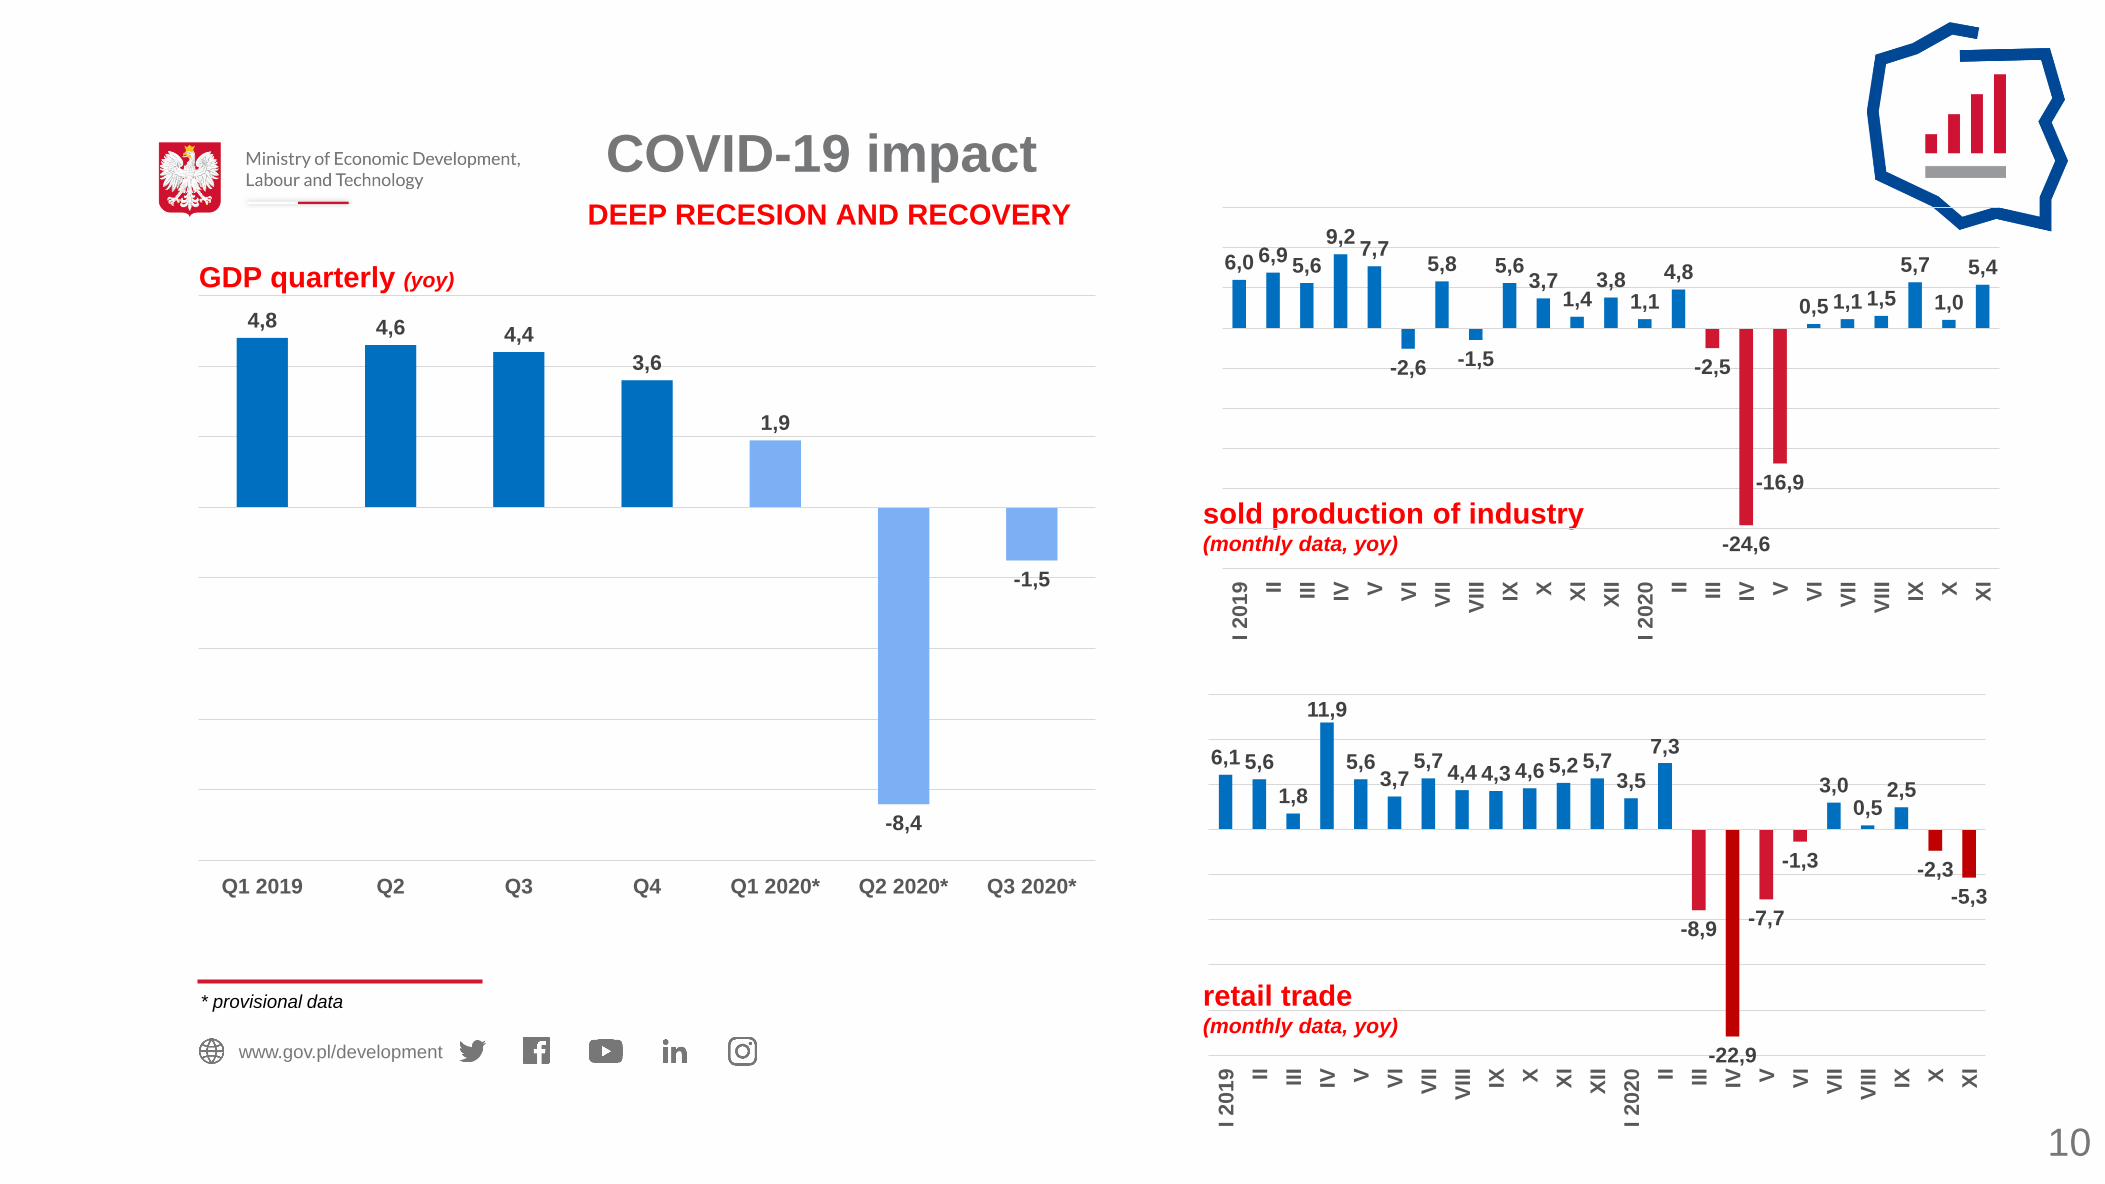
COVID-19 impact
10
www.gov.pl/development
4,8 4,6 4,4
3,6
1,9
-8,4
-1,5
Q1 2019 Q2 Q3 Q4 Q1 2020* Q2 2020* Q3 2020*
DEEP RECESION AND RECOVERY
GDP quarterly (yoy)
sold production of industry (monthly data, yoy)
retail trade (monthly data, yoy)
6,1 5,6
1,8
11,9
5,6 3,7
5,7 4,4 4,3 4,6 5,2 5,7
3,5
7,3
-8,9
-22,9
-7,7
-1,3
3,0 0,5
2,5
-2,3
-5,3
I 2019
II
III
IV
V
VI
VII
VIII
IX
X
XI
XII
I 2020
II
III
IV
V
VI
VII
VIII
IX
X
XI
* provisional data
6,0 6,9 5,6
9,2 7,7
-2,6
5,8
-1,5
5,6 3,7
1,4 3,8
1,1
4,8
-2,5
-24,6
-16,9
0,5 1,1 1,5
5,7
1,0
5,4
I 2019
II
III
IV
V
VI
VII
VIII
IX
X
XI
XII
I 2020
II
III
IV
V
VI
VII
VIII
IX
X
XI