policy brief on biomass based ddg projects · project tara policy brief on biomass based ddg ... of...
TRANSCRIPT

TARA
POLICY BRIEF ONBIOMASS BASED DDG PROJECTS
Village Electrification through Sustainable use of Renewable Energy (VE-SuRE)

Contributor
S.C. Rajshekar, Symbiotec Research Associates
Reviewers
Dr. Shirish Sinha, Swiss Agency for Development and Cooperation
Acknowledgment
We place on record our gratitude to the Swiss Agency for Development and
Cooperation for providing the financial and institutional support, National
Thermal Power Corporation (NTPC) and TARA field team for providing field
support, local communities of the project villages, local NGOs for their untiring
work and enabling us
to broaden our understanding of field realities.
Branding and Designing Guidance
Ranjeeta Ghosh, Jay Vikash, Development Alternatives Group
Disclaimer
The views, analysis, interpretations and conclusions expressed herein are those of
the contributors and do not necessarily reflect the view of the Swiss Agency for
Development and Cooperation (SDC) or NTPC. The information contained herein
has been obtained from sources and consultations, which the Contributors
believe to be reliable and accurate. The Contributors, editor and the supporting
agency associated with the policy brief are not liable for any unintended errors or
omissions, opinions expressed herein. The contents of this report may be used by
anyone providing proper acknowledgement.
TARA
STAGES IN SETTING UPA MINI/MICRO HYDELPROJECT
TARA
POLICY BRIEF ONBIOMASS BASED DDG PROJECTS
Symbiotec Research Associates
Village Electrification through Sustainable use of Renewable Energy (VE-SuRE)

SECTION 1
1.1 Background 3
1.2 Objective 3
1.3 Status of Electrification in India 4
1.4 Framing the Issues for the Study 6
SECTION 2
2.1 What is meant by DDG? 9
2.2 DDG within the Policy Framework 10
2.3 Implementation of DDG in India 12
SECTION 3
3.1 Performance of Biomass DDG Projects in India 19
3.2 Location of the Projects Analyzed 20
3.3 Technical Performance of Biomass DDG Projects 21
3.4 Financial Performance of Biomass DDG Projects 27
3.5 Managerial Performance of the Biomass DDG Projects 32
3.6 Institutional Arrangements in the Biomass DDG Projects 34
SECTION 4
4.1 Key Learnings 41
4.2 Proposal for Making DDG Viable for Village Electrification 43
4.3 Advantages of a Distribution Level Grid Connected DDG Plant 44
4.4 Issues Facing the Proposal 45
4.5 Building a Local and Sustainable Biomass Supply Solution 47
4.6 Next Steps 48
ANNEX 1: SUMMARY OF KEY DDG PROGRAMMES IN INDIA 53
ANNEX 2: PROFITABILITY OF VESP PROJECTS (BASE CASE) 54
ANNEX 3: PROFITABILITY OF VESP PROJECTS (BREAK-EVEN CASE) 54
ANNEX 4: PROFITABILITY OF HUSK POWER PROJECTS (BASE CASE) 55
Table of Contents

LIST OF TABLES
Table 1.1: Installed Renewable Energy Capacity in India 3
Table 2.1: Lessons from VESP 12
Table 3.1: Classification of Biomass DDGS 17
Table 3.2: Sample of Biomass DDG Projects Studied 17
Table 3.3: Technical Performance of Biomass DDG Plants 20
Table 3.4: Vesp- Increased Uptimes 21
Table 3.5: Typical Operating Conditions of VESP Plant 26
Table 3.6: Investments, Operating Costs & Tariffs - VESP 26
Table 3.7: Break-even Analysis for VESP DDG Plants 27
Table 3.8: Profits/month Husk Power Vs. VESP 28
Table 3.9: Attractiveness of Profits VESP Vs. Husk Power 29
Table 4.1: Comparison of VESP, Husk Power & Beri Model of DDG 40
LIST OF FIGURES
Figure 1.1: Source-wise Installed Generation Capacity 2
Figure 2.1: Definitions of DDG 7
Figure 2.2: Ddg in Nep, 2005 & Rep, 2006 9
Figure 2.3: VESP Institutional Model 11
Figure 3.1: Dicholi - Remoteness, Inaccessibility & Commitment Defined 18
Figure 3.2: Motor Costs More Than Flour Mill - Chopan Vesp Project 21
Figure 3.3: Cost of Doing Simple Things in Remote Locations 22
Figure 3.4: Dedicated After Sales Service - Secret of Better Uptimes 23
Figure 3.5: Tree Based Farming - An Innovative Approach to Biomass Supply 24
Figure 3.6: Dicholi: Could You Not Have Just Given Us Solar Lights? 30
Figure 3.7: Feedback from Mr. Satheesh, Md, Enzen on DDGS 35
Figure 4.1: Schematic of Remote Area Electrification Thru Distribution Grid
Connected DDG 42
Figure 4.2: Public-private-panchayat Partnership for Biomass Supply 45
Sect
ion
1
• Background to the policy brief paper
• Objectives of the study
• Status of electrification in India
• Framing the issues for the study

1.1 Background
The Climate Change and Development Division, Embassy of Switzerland in
partnership with the National Thermal Power Corporation (NTPC) aims to engage
with the Government of India in a positive dialogue by supporting up renewable
energy based off grid pilot projects for further up scaling through the through its
“Village Electrification through Sustainable Use of Renewable Energy (VE-SuRE)”
project. An outcome envisaged of this project is that decentralized, renewable
power gains prominence in electricity policies and Rural Electricity Plans at the
state and national level through experiences, lessons learnt and knowledge
created through the project.
"Technology and Action for Rural Advancement" (TARA) has been identified as the
“Project Management Unit" (PMU). The PMU is responsible for the overall project
implementation and demonstration of sustainable Decentralised Distributed
Generation (DDG) projects. The PMU commi-ssioned Symbiotec Research
Associates (SRA) to carry out a study titled “Policy Brief on Management of
biomass based generation projects for their commercial viability, including role
of Franchisees as per the existing regulatory framework”. This report is based on
the study carried out by Symbiotec Research Associates during February-July,
2012.
1.2 Objective
The Government of India, through the Ministry of Power has been implementing
the Rajiv Gandhi Gramin Vidyuthikaran Yojana (RGGVY) to electrify unelectrified
villages in the country. The RGGVY has a provision to support Decentralized
Distributed Generation (DDG) projects to electrify a village. However, despite
making available a capital subsidy of upto 90% of the project cost, there are hardly
any entrepreneurs coming forward to take up such projects.
The objective of this paper is
• To understand why response from entrepre-neurs to biomass based
DDG projects under RGGVY has been poor and
• To understand what possible solutions to make the venture more
attractive to ensure that the vast potential for biomass based DDG
projects in rural electrification is realized.
Section 1
Policy Brief on Biomass Based DDG Projects pg. 1

Section 1
Policy Brief on Biomass Based DDG Projectspg. 2
1.3 Status of Electrification in India
thIndia is the 5 largest generator of electricity in the world with a total 1installed generation capacity of 214,679 MW as of February, 2013 .
Thermal power generation accounts for 67% of the installed capacity
followed by hydro (19%), renewable sources (12%) and nuclear energy
(2%). Share of renewable energy sources in the generation mix has
increased from a paltry 2% in 2002 to 12% in 2013. What is impressive is
that this growth in share has happened even as the installed capacity in
the country doubled during the same period growing from 105,046 MW in
2002 to 214,679 MW in 2013.
However, despite such impressive growth in installed capacity, all is not
hunky dory on the electrifica-tion front in India. As of November, 2012,
94% of the 593,732 villages in India have been electrified and only 34,887 2villages are yet to be connected to the grid . A majority of these villages
are in Uttar Pradesh, Bihar and Odisha. However, a whopping 75 million
rural and 6.5 million urban households had no access to grid electricity in
the country. A further 33% faced under-electrification; just 50 units of
power/household/ month were available to them. This transla-tes to just
10 units/capita/ month or an annual supply of 120 units/capita as against 3the national average of 746 units/ capita/ annum .
RES2585612%
Nuclear47802%
Hydro3949919%
Thermal144544
67%
Source: Central Electricity Authority, 2013
Figure 1.1:Source-wise Installed Generation Capacity
1 http://www.cea.nic.in/reports/monthly/executive_rep/feb13/8.pdf2 http://www.cea.nic.in/reports/monthly/dpd_div_rep/village_electrification.pdf3 Even this is very low as compared to
Policy Brief on Biomass Based DDG Projects pg. 3
To further compound matters, the country faces a peak demand deficit of
10.3% with many highly electrified states such as Maharashtra facing peak
demand deficit of upto 22%. To manage this, most DISCOMs follow a
policy of diverting power from rural areas to urban areas, leaving rural
areas with even less reliable power. This implies that connection to an
electric grid does not guarantee that a rural household would enjoy use of
the electricity, simply because in many cases there may not be enough
electricity to supply! There is a growing realization that decentralized
distributed generation of electricity is the answer to ensure supply of
electricity to rural households, especially for those that are at the tail-end
of the grid. Renewable energy sources, especially solar PV and biomass-
based technologies have been identified as being highly suitable for
deployment as DDG. Further given the wide-spread suitability of the
country in producing biomass, power generation technologies based on
biomass have been assess-ed as having a very high potential in improving
access to electricity for rural households in the country.
4However, as Table 1.1 shows , the promise of biomass has been as yet
largely unfulfilled. Only 15% of the total potential has been exploited so
far as against 38% for wind and 24% for small hydro power..
Section 1
Table1.1: Installed Renewable Energy Capacity in India
Wind power
Resource
Small Hydro Power
Source: MNRE, 2013
Solar Power
Bio Power (including cogen)
Estimated Potential
(MW)
48,500
15,000
23,700
220-30 per km
Cumulative till
February, 2013
18635
3552
3660
1447
4 http://mnre.gov.in/mission-and-vision-2/achievements/

Section 1
Policy Brief on Biomass Based DDG Projectspg. 2
1.3 Status of Electrification in India
thIndia is the 5 largest generator of electricity in the world with a total 1installed generation capacity of 214,679 MW as of February, 2013 .
Thermal power generation accounts for 67% of the installed capacity
followed by hydro (19%), renewable sources (12%) and nuclear energy
(2%). Share of renewable energy sources in the generation mix has
increased from a paltry 2% in 2002 to 12% in 2013. What is impressive is
that this growth in share has happened even as the installed capacity in
the country doubled during the same period growing from 105,046 MW in
2002 to 214,679 MW in 2013.
However, despite such impressive growth in installed capacity, all is not
hunky dory on the electrifica-tion front in India. As of November, 2012,
94% of the 593,732 villages in India have been electrified and only 34,887 2villages are yet to be connected to the grid . A majority of these villages
are in Uttar Pradesh, Bihar and Odisha. However, a whopping 75 million
rural and 6.5 million urban households had no access to grid electricity in
the country. A further 33% faced under-electrification; just 50 units of
power/household/ month were available to them. This transla-tes to just
10 units/capita/ month or an annual supply of 120 units/capita as against 3the national average of 746 units/ capita/ annum .
RES2585612%
Nuclear47802%
Hydro3949919%
Thermal144544
67%
Source: Central Electricity Authority, 2013
Figure 1.1:Source-wise Installed Generation Capacity
1 http://www.cea.nic.in/reports/monthly/executive_rep/feb13/8.pdf2 http://www.cea.nic.in/reports/monthly/dpd_div_rep/village_electrification.pdf3 Even this is very low as compared to
Policy Brief on Biomass Based DDG Projects pg. 3
To further compound matters, the country faces a peak demand deficit of
10.3% with many highly electrified states such as Maharashtra facing peak
demand deficit of upto 22%. To manage this, most DISCOMs follow a
policy of diverting power from rural areas to urban areas, leaving rural
areas with even less reliable power. This implies that connection to an
electric grid does not guarantee that a rural household would enjoy use of
the electricity, simply because in many cases there may not be enough
electricity to supply! There is a growing realization that decentralized
distributed generation of electricity is the answer to ensure supply of
electricity to rural households, especially for those that are at the tail-end
of the grid. Renewable energy sources, especially solar PV and biomass-
based technologies have been identified as being highly suitable for
deployment as DDG. Further given the wide-spread suitability of the
country in producing biomass, power generation technologies based on
biomass have been assess-ed as having a very high potential in improving
access to electricity for rural households in the country.
4However, as Table 1.1 shows , the promise of biomass has been as yet
largely unfulfilled. Only 15% of the total potential has been exploited so
far as against 38% for wind and 24% for small hydro power..
Section 1
Table1.1: Installed Renewable Energy Capacity in India
Wind power
Resource
Small Hydro Power
Source: MNRE, 2013
Solar Power
Bio Power (including cogen)
Estimated Potential
(MW)
48,500
15,000
23,700
220-30 per km
Cumulative till
February, 2013
18635
3552
3660
1447
4 http://mnre.gov.in/mission-and-vision-2/achievements/

Policy Brief on Biomass Based DDG Projectspg. 4
Section 1
1.4 Framing the Issues for the Study
Given that the problem to be addressed is:
Despite the high potential assessed for biomass based DDGs and the high
capital and operating subsidies offered under the RGGVY-DDG scheme, no
biomass based DDGs have taken off. What are the reasons?
A priori, for entrepreneurs to make investments, a project must provide
adequate and attractive returns on the investments, managerial efforts
and the risks taken by the entrepreneurs. This is influenced by the
performance of the project, the enabling or disabling environment
created by policy and by institutional capacities needed to execute and
sustain the project.
Accordingly, this paper examines issues that affect biomass based DDG
projects at the policy, project and institutional level and presents a way
forward. These findings and insights are based on desk review of policies,
regulations and programmes of the Ministry of Power (MoP) and Ministry
for New and Renewable Energy (MNRE) and extensive project level
performance reviews and discussions with owners/ operators/facilitators 5of selected biomass DDG plants .
5 The plants were selected largely from VESP (Village Energy Security Programme of MNRE). They also covered a UNDP-GEF supported tail-end DDG plant
Sect
ion
2
• Definition of DDG
• Policy context for DDG in India
• Implementation of DDG through schemes and programme by Govt. of India

Policy Brief on Biomass Based DDG Projects pg. 7
Section 2
2.1 What is meant by DDG?
Decentralized Distributed Generation has been defined differently by 6different people and entities. CIGRE (Interna-tional Council on Large
Electricity Systems) defines distributed genera-tion as all generation
units with a maximum capacity of 50 MW to 100 MW, that are usually
connected to the distribution network and that are neither centrally
planned nor dispatched.
The IEEE (Institute of Electronic and Electrical Engineers) defines
distributed generation as the generation of electricity by facilities that
are sufficiently smaller than central generating plants so as to allow
interconn-ection at nearly any point in a power system.
7Dondi et al define distributed generation as a small source of electric
power generation or storage (typically ranging from less than a kW to
tens of MW) that is not a part of a large central power system and is
located close to the load.
Some common elements emerge from a reading of the above three
definitions. DDG systems:
• Have a plant capacity range
that is smaller than a central
power generating plant
• A r e c o n n e c t e d t o t h e
distribution network
• Closer to the load centre
Figure 2-1 provides a definition that
comprehensively includes all these
features and serves wel l as a 8working definition of DDG and will
be used as such in this paper.
6CIRED, 1999. Dispersed generation, Preliminary report of CIRED working group WG04, June, p. 9+Appendix (p.30).7Dondi et al. (2002) define distributed generation as a small source of electric power generation or storage (typically ranging from less than a kW to tens of MW) that is not a part of a large central power system and is located close to the load. 8 Ackermann, T., Andersson, G., Soder, L., 2001. Distributed generation: a definition. Electric Power Systems Research 57, 195–204.
Figure 2.1: Definitions of DDG
Ackermannetal. (2001), define distributed generation in terms of connection and location rather than in terms of generation capacity. They define a distributed generation source as an electric p o w e r g e n e r a t i o n s o u r c e c o n n e c t e d d i r e c t l y t o t h e distribution network or on the customer side of the meter.

Policy Brief on Biomass Based DDG Projectspg. 8
Section 2
2.2 DDG within the Policy Framework
The impetus for DDG comes from the enactment of the Electricity Act
(EA), 2003 and the National Electricity Policy (NEP), 2005 and the Rural
Electrification Policy (REP), 2006. Specifically, the EA, 2003 has the
following legislative provisions to promote rural electrification:
• Section 6–which obligates the state government to supply
electricity to all areas, including villages and hamlets.
• Section 13–which exempts the need for a distribution, transmiss-
ion, and trading licence based on recommen-dation of the state
government for local authority, Panchayath institution, co-
operative society, or franchisees.
• Section 14–which exempts licence to a person who intends to
generate and distribute electricity in a rural area notified by the
state government. Furthermore, a person exempted under the 8th
Proviso of Section 14 as above would also be free from purview of
appropriate commissions in matters pertaining to determi-nation
of tariffs.
• The retail tariffs for such exempted persons would be based on
mutual agreements between such persons and the consumers.
A reading of the above sections reveals that the EA, 2003 provides several
enabling conditions to promote DDGs for rural electrification. However,
while it allows the retail tariff to be mutually fixed between the generator
and the consumers, at the ground level, such operators have to often
compete with very low priced grid electricity, however unreliable the
supply of power from the grid may be.
Grid tariffs for rural areas are set very low because they are cross
subsidized by higher tariffs being charged for other customers using the
grid, especially industrial and commercial users. Such an arrangement is
usually, not available to DDG power plants therefore, their tariffs tend to
be higher.
Policy Brief on Biomass Based DDG Projects pg. 9
Section 2
Further, as Figure 2-2 shows the NEP, 2005 (Section 5.1.2 (d)) and the REP,
2006 (Para 3.2) state that DDG plants are the preferred choice for rural
electrification where grid extension (GE) is not technically feasible or
economically viable. Typically, such villages tend to be in remote and
inaccessible locations with low and scattered populations and very low
level of economic activities. In short, DDG is the preferred choice where
ESCOMs would not like to go because GE may not be techno-economically
unattractive.
Such an approach leads to DDG plants that are tiny in scale and located in
remote areas with very low demand for electricity other than for lighting.
Indeed, “DDG” would draw up in most minds an image of a tiny plant (1-
10kW) that is operating in a remote forest village or in an inaccessible
mountainous area in a stand-alone mode. A review of the DDG
programmes of the MNRE and the MoP show that policy makers have
indeed, viewed and restricted DDG to “small-scale off-grid remote
applications, run by local entities”.
Figure 2.2: DDG in NEP, 2005 & REP, 2006
“Wherever above is not feasible (it is neither cost effective nor the optimal solution to provide grid connectivity) decentral ized distributed generation facilities together with local distribution network would be provided so that every household gets access to electricity.” NEP, 2005 5.1.2(d)
“For villages and habitations where grid connectivity would not be feasible or not cost-effective, off-grid solutions based on standalone systems may be taken up...” REP, 2006 Para 3.2

Policy Brief on Biomass Based DDG Projectspg. 10
Section 2
2.3 Implementation of DDG in India
Policy orientation towards DDG described in the preceding section is
amply demonstrated by the DDG programmes that have been / are being
implemented by the MoP and the MNRE.
Remote Village Electrification (RVE) programme is being implemented by
the MNRE in remote areas that have a population of <100. The
programme aims to cover 10,000 villages. While the guidelines state that
the most adequate technology would be used, >95% of all RVE
installations have been Solar Home Lighting systems (SHLS). The
programme is being implemented in each state through the State Nodal
Agency (SNA). The RVE provides 90% subsidy on capital costs which also
includes the cost of a 5 year Annual Maintenance Contract.
Village Energy Security Programme (VESP) was implemented by MNRE
and covered all unelectrified remote villages that had 50-100 Households.
The overall goal of the Programme was to provide energy to the villages
through locally available biomass resources with full participation and
ownership of the community and ensure enhanced livelihoods and
improved quality of life. The emphasis of the VESP was on energy security
at the village level with a further thrust on micro-enterprise development
for enhancing employment opport-unity and economic viability of the
Programme projects.
Based on a community-centred approach (see Fig 4-3), the Programme
provided a one-time grant (up to 90 percent of the investment cost) to a
village community (only in remote villages that are unlikely to be
connected with grid electricity) for providing energy systems capable of
meeting local energy demands. The villagers were expected to provide an
equity contribution either in cash or kind. The Programme included
several biomass based energy technologies of which biomass gasifier
systems was the dominant application. VESP also mandated raising and
managing dedicated planta-tions as feedstock in biomass gasifiers.
Policy Brief on Biomass Based DDG Projects pg. 11
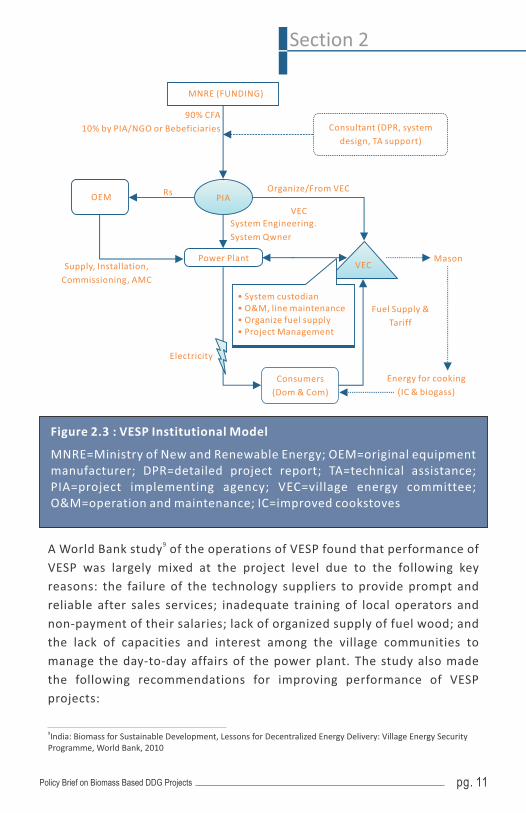
Section 2
Figure 2.3 : VESP Institutional Model
MNRE=Ministry of New and Renewable Energy; OEM=original equipment manufacturer; DPR=detailed project report; TA=technical assistance; PIA=project implementing agency; VEC=village energy committee; O&M=operation and maintenance; IC=improved cookstoves
9A World Bank study of the operations of VESP found that performance of
VESP was largely mixed at the project level due to the following key
reasons: the failure of the technology suppliers to provide prompt and
reliable after sales services; inadequate training of local operators and
non-payment of their salaries; lack of organized supply of fuel wood; and
the lack of capacities and interest among the village communities to
manage the day-to-day affairs of the power plant. The study also made
the following recommendations for improving performance of VESP
projects:
9India: Biomass for Sustainable Development, Lessons for Decentralized Energy Delivery: Village Energy Security Programme, World Bank, 2010
MNRE (FUNDING)
90% CFA
10% by PIA/NGO or Bebeficiaries
Power Plant
OEM PIA
Supply, Installation,
Commissioning, AMC
Rs Organize/From VEC
System Engineering.
System Qwner
VEC
• System custodian• O&M, line maintenance• Organize fuel supply• Project Management
VECMason
Fuel Supply &
Tariff
Energy for cooking
(IC & biogass)
Consumers
(Dom & Com)
Electricity
Consultant (DPR, system
design, TA support)
Policy Brief on Biomass Based DDG Projectspg. 10
Section 2
2.3 Implementation of DDG in India
Policy orientation towards DDG described in the preceding section is
amply demonstrated by the DDG programmes that have been / are being
implemented by the MoP and the MNRE.
Remote Village Electrification (RVE) programme is being implemented by
the MNRE in remote areas that have a population of <100. The
programme aims to cover 10,000 villages. While the guidelines state that
the most adequate technology would be used, >95% of all RVE
installations have been Solar Home Lighting systems (SHLS). The
programme is being implemented in each state through the State Nodal
Agency (SNA). The RVE provides 90% subsidy on capital costs which also
includes the cost of a 5 year Annual Maintenance Contract.
Village Energy Security Programme (VESP) was implemented by MNRE
and covered all unelectrified remote villages that had 50-100 Households.
The overall goal of the Programme was to provide energy to the villages
through locally available biomass resources with full participation and
ownership of the community and ensure enhanced livelihoods and
improved quality of life. The emphasis of the VESP was on energy security
at the village level with a further thrust on micro-enterprise development
for enhancing employment opport-unity and economic viability of the
Programme projects.
Based on a community-centred approach (see Fig 4-3), the Programme
provided a one-time grant (up to 90 percent of the investment cost) to a
village community (only in remote villages that are unlikely to be
connected with grid electricity) for providing energy systems capable of
meeting local energy demands. The villagers were expected to provide an
equity contribution either in cash or kind. The Programme included
several biomass based energy technologies of which biomass gasifier
systems was the dominant application. VESP also mandated raising and
managing dedicated planta-tions as feedstock in biomass gasifiers.
Policy Brief on Biomass Based DDG Projects pg. 11
Section 2
Figure 2.3 : VESP Institutional Model
MNRE=Ministry of New and Renewable Energy; OEM=original equipment manufacturer; DPR=detailed project report; TA=technical assistance; PIA=project implementing agency; VEC=village energy committee; O&M=operation and maintenance; IC=improved cookstoves
9A World Bank study of the operations of VESP found that performance of
VESP was largely mixed at the project level due to the following key
reasons: the failure of the technology suppliers to provide prompt and
reliable after sales services; inadequate training of local operators and
non-payment of their salaries; lack of organized supply of fuel wood; and
the lack of capacities and interest among the village communities to
manage the day-to-day affairs of the power plant. The study also made
the following recommendations for improving performance of VESP
projects:
9India: Biomass for Sustainable Development, Lessons for Decentralized Energy Delivery: Village Energy Security Programme, World Bank, 2010
MNRE (FUNDING)
90% CFA
10% by PIA/NGO or Bebeficiaries
Power Plant
OEM PIA
Supply, Installation,
Commissioning, AMC
Rs Organize/From VEC
System Engineering.
System Qwner
VEC
• System custodian• O&M, line maintenance• Organize fuel supply• Project Management
VECMason
Fuel Supply &
Tariff
Energy for cooking
(IC & biogass)
Consumers
(Dom & Com)
Electricity
Consultant (DPR, system
design, TA support)

Policy Brief on Biomass Based DDG Projectspg. 12
Section 2
Table 2.1: Lessons from VESP
Build a robust aftersales services networkof third party localservice providers
• Every state must identify and train local service providers, such as diesel mechanics and electricians before project implementation.
• Develop contractual obligations between the project and trained local service providers.
Improving technical performance
Impart modular and graded training to develop specific skills and knowledge
• Provide innovative and hands-on training to entrepreneurs, operators and selected village community representatives.
Improving financial performance
Make viability gap funding an incentive for better performance
• Viability gap funding should be used to attract entrepreneurs.
• However, this support should be gradually phased out so that entrepreneurs are encouraged to secure other revenue streams for commercial viability.
Secure convergence and revenue streams of VESP at a policy level
• Convergence is necessary to enhance loads and secure additional revenue streams.
• A system should be instituted to secure the cooperation of state and district officials from the relevant departments to the VESP.
Sustainable plantations and improving biomass supply
Monetize biomass supply • Voluntary contributions of biomass on a non-payment basis have not worked.
• Village level systems should be in place to provide a cash incentive to villagers who deliver biomass to the power plant.
Emphasize sustainable biomass plantations
• Every project should secure biomass supply by dedicated plantations on private and public lands, contracting with village forest committees and forest departments.
• At a policy level, central and state governments should promote incentives for biomass plantations in individual and community lands with assured buy-back and forge systematic and large-scale convergence with forest department programs.
Decentralized Distributed Generation (DDG) Scheme of the MoP is being
implemented under the RGGVY and tries to address several of the
shortcomings found in the VESP. It is technology neutral and focuses only on
providing electricity in remote villages (where grid would not be extended) with
Policy Brief on Biomass Based DDG Projects pg. 13
Section 2
100 or more households. The Project Implementing Agency could be
SNAs/State Deptt./State Utilities/ Identified CPSUs. Ownership unlike other
programmes will be vested with the state government. PIAs are expected to
invite Project Developers (PD) to set up projects and run them for a period of
5 years and then hand them over to the state govt. PDs could be NGOs,
Panchayaths, entrepreneurs, etc. Tariffs would be decided by the PIA and
should not be lower than the grid tariff prevailing in adjoining areas.
Although, the programme was launched in 2006-07, no significant progress
has been recorded.
Jawaharlal Nehru National Solar Mission (JNNSM) is the latest programme of
MNRE which has a small component for off-grid generation through SPV
technology. It provides capital subsidy of upto 30% and is being implemented
through SNAs and Akshay Urja shops. The maximum capacity per site (for
individual homes) is 100kWp and 250kWp for microgrid applications.
As can be seen from the preceding paragraphs, of the 4 programme that have
DDG as a key strategy for rural electrification, only one has biomass based
DDGs as it dominant technology option, namely, VESP. Of the remaining,
RGGVY-DDG is yet to progress while the other two are focused mainly on SPV
lighting.
Further, all programmes have identified DDG for electrifying only remote,
inaccessible villages with small populations and as will be seen in the next
section, tiny loads. The net result is that DDG has become restricted to “small-
scale off-grid remote applicati-ons” as articulated in policy.
In contrast, many villages that have been electrified through grid extension
under RGGVY are yet to receive electricity supply because there is simply no
power to supply! It is estimated that nearly 20,000MW of additional capacity 10needs to be created to meet demand generated through RGGVY . DDG can be
a potential solution!
Realignment of DDG policy to focus on tail-end generation will help to make
good use of the REDB (Rural Electricity Distribution Backbone) and the VEI
(Village Electricity Infrastructure) that has been setup in RGGVY. In turn, this
would unleash the potential for DDG and at the same time unpack the
economic development of rural India which was the driving force for rolling
out RGGVY.
10Vidyasagar, K. (2007, July 15). Presentation: Universal Service Obligation in Rural Electrification - RGGVY. 14th Steering Committee Meeting, South Asia Forum for Infrastructure Regulation. New Delhi.

Sect
ion
3
• Commercial performance of biomass-based DDGs
3 Description of sample biomass-based DDGs selected for study
3 Performance analysis of sample projects
n Technical performance
n Financial performance
n Managerial performance
n Institutional performance

Sect
ion
3
• Commercial performance of biomass-based DDGs
3 Description of sample biomass-based DDGs selected for study
3 Performance analysis of sample projects
n Technical performance
n Financial performance
n Managerial performance
n Institutional performance

3.1 Performance of Biomass DDG Projects in India
In the preceding sections we have seen how policy has restricted the
scope for DDG. In this section we will look at biomass DDG projects in
India and analyse their performance from an entrepreneurs/ commercial
entities point of view. An entrepreneur takes risks in anticipation of
adequate and attractive returns. Therefore, for entrepreneurs to invest
their time and money in biomass DDG, the project must be attractive.
Biomass DDG projects may be classified based on their location and
connectivity to grid as shown in Table 3.1
As a part of this study, the following projects were covered either through
a field visit or through a review of secondary sources. Table 3.2 gives brief
details of the sample chosen for study.
Grid Connected
Table 3.1: Classification of Biomass DDGs
DDG System Grid Area Off-Grid Area
Stand Alone
BERI Built for future gridconnectivity?
Husk Power, Desi Power VESP Projects
Table 3.2: Sample of Biomass DDG Project Studied
Projects covered Source ofinformation
Plant Size
Households Implementedby
Dicholi, Satara dist,Maharahstra
Field visit 10 kW 85 NGO, under VESP
Bhingara & Chalistapari,Buldana dist, Chopan &Bharitakheda, Amravatidist, Maharashtra
Field visit 20 kW &10 kW
80-181 NGO, under VESP
Biomass Energy forRural India (BERI),Tumkur dist,Karnataka
Field visit 3 x 100kW+ 1 x
200kW(500kW)
Gridconnected
BERI Society withsupport from Dept. ofRural Development &
Panchyati Raj,Govt. of Karnataka,
UNDP-GEF,ICEF & MNRE
Policy Brief on Biomass Based DDG Projects pg. 17
Section 3

Policy Brief on Biomass Based DDG Projectspg. 18
Section 3
Husk Power, Bihar Secondarysources
~32kW 400-1000 Husk Power Systems,a private company
Bhalupani,Mayurbhanj dist, Orissa
Field visit 10kW 50 NGO, under VESP
Bhaliaguda,Mayurbhanj dist, Orissa
10kW
The sample covers all categories of DDG projects mentioned in Table 4.1
except projects built for future grid connectivity in currently off-grid
areas and thus is fairly representative of the current biomass DDG
scenario in India.
3.2 Location of the Projects Analyzed
Remoteness and inaccessibility are
key site characteristics of a typical
VESP project. Often, more than the
distance from the nearest grid-
connected village, it is the sheer
physical remoten-ess due to huge
geographical hurdles that has left
these villages bereft of even simple
infra structural services that can
vastly improve the quality of their
lives, if not, their economic status.
The projects represen-ted a wide
range of terrain: from deep dense
forests (as in Bhalupani, Chopan &
Bharita-kheda), to an island (as in
Dicholi) and to inaccessible hill tops
(as in Bhingara & Chalistapari). Thus,
t h e s e p r o j e c t s a r e f a i r l y
representative of what a typical
VESP project is all about. This is
what the World Bank report on VESP
had to say about the difficulties of a
VESP project:
Figure 3.1: Dicholi-Remot-eness, Inaccess ib i l i ty & Commitment Defined
Dicholi is located in the backwa-ters of the Koyna dam. Ironically, while the dam produces electricity in thousands of mega watts, Dicholi does not receive any since it is an island and it is expensive to draw the grid across 10–15 km of water. Added to this, the village is situated on a hill, the way to which is through a dense forest and up a steep slope. Thus, the only way to reach the villages is by an hour-and-a-half motorboat ride followed by a steep climb of about 45–60 minutes. In Dicholi, when the gasifier engine arrived at Koyna town, the local community had to help the supplier to disassemble the engine and take it by boat to the boat jetty at Dicholi, from where each part was carried as a head load up the hill or s lung from bamboo poles and carried on the shoulders of teams of 10–20 persons.
Policy Brief on Biomass Based DDG Projects pg. 19
Section 3
“All these villages become completely inaccessible during the monsoons
when roads turn into slushy stretches and the only way to reach a village is
on foot, that too when the weather permits. The degree of difficulty in
installing, operating and servicing a biomass-based power plant in such
locations can easily be visualized. Therefore, it needs fierce commitment, 11great ingenuity and persistence to implement a VESP project.”
In contrast, both Husk Power Projects and the BERI are located in more
easily accessi-ble location with none of the difficulties associated with
VESP projects that are imposed due to terrain. BERI is located in Kabbiere
village of Tumkur district about 120km from Bengaluru and is a connected
to the 11kv grid line that comes from a substation that is about 5 km away.
Thus, as long as the grid line is functional, the BERI project can pump
power into it and is in turn purchased by the local ESCOM through a Power
Purchase Agreement.
Husk Power Systems works mainly in Bihar and parts of Uttar Pradesh. It
installs a 32kW gasifier based power system that works on rice husk. It is a
standalone system that lays its own distribution lines and does not
interact with the grid. It sells power to domestic and commercial (shops,
petty businesses) customers.
3.3 Technical Performance of Biomass DDG Projects
3.3.1 Uptime
Remoteness and inaccessibility are key site characteristics of a typical
VESP project.
A key question to measure technical performance is, “Did the project
supply the electricity that it was designed to supply? If yes, to what
extent? ” This is measured by “Uptime” which is defined as:
11Ibid 6
Uptime for the electricity generating system: This is the number of units of power actually supplied during a period of operation compared to the number of units estimated to be supplied in the village energy plan. This ratio is expressed as a percentage and is called 'uptime.
No. of units of power actually supplied in a periodUptime = x 100
No. of units of power that the plant designed to supply during that period

Table 3.3: Technical Performance of Biomass DDG Plants
Projectscovered
Plantsize
SFCkg/kWh
LoadkW
Uptime Hours ofoperation
CUF Biomasskg/day
Dicholi 10 kW 1.767.8 84% 4 11% 55
Chopan &Bharitakheda
20 kW 1.6712 73% 5 9% 100
BERI, 500kW 1.36340 44% 5.3 8% 2451
Bhalupani 10kW 1.676 59% 6 9% 50
Husk Power ~32kW 2.6319 90% 6 21% 300
Bhaliaguda, 2 x 10kW
15 Yet to be commissioned
Table 3.4: VESP- Increased Uptimes
Projects Uptime (WorldBank Study, 2009)
Uptime (CurrentStudy, 2012)
Bhalupani 24% 59%
Dicholi 50% 84%
Policy Brief on Biomass Based DDG Projectspg. 20
Section 3
In addition, other factors such as load, Capacity Utilization Factor (CUF),
etc. have also been assessed to analyze the performance.
Of the 7 VESP plants visited during field visit, Dicholi & Bhalupani have
been in operation for the last 4-5 years while Chopan & Bharitakheda and
Bhingara and Chalistapari were 1-2 years old. The VESP plant in 12Bhaliaguda was yet to be commissioned at the time of our visit. BERI
plants were commissioned and connected to the grid in 2006-07 and have
been in operations since then. However, data for analysis was for the
period May 2010-2011. For Husk Power data was based on secondary 13sources.
Table 3.3 gives details of the technical performance of biomass DDG
Plants. Uptime ranges from a high of 90% for Husk Power systems to a low
of just 44% for BERI. Uptime for VESP projects range from 60% to 84%. In
contrast, the World Bank study shows that uptimes for VESP projects
ranged from 23% to 50% (Dichol i ) 1-2 years after they were 14commissioned. Thus, clearly, uptimes have not only improved for older
VESP projects, but also newer projects are now operating at higher
uptimes within 1-2 years of commissioning.
12Data accessed from BERI website http://bioenergyindia.in/ 13http://www.forumofregulators.gov.in/Data/Reports/CWF%20Off-grid%20final%20report%20nov%202011_Latest_feb2012.pdf14Ibid 6
Policy Brief on Biomass Based DDG Projects pg. 21
Section 3
However, load, hours of operations and therefore the Capacity Utilization
Factor have more or less remained the same for these VESP projects,
thereby having an impact on the financial returns to a potential
entrepreneur. For example, in Dicholi and Bhalupani where the DDG
plants have been working for more than 4 years, the load has remained
unchanged despite vastly improved uptimes. Similarly, hours of operation
have remained unchanged from 4-6 hours. These two data sets reveal that
despite improved regularity of supply of power from the DDG plant,
demand for electricity has not increased, either from existing customers
or from newer ones. Further, no commercial loads have come up in any of
the 6 villages where VESP has been implemented, excepting in Bhalupani
where a honey proce-ssing unit was in existence before VESP was
implemented. In Chopan and Bharitakheda a flour mill has been set up as
a part of the VESP and is facing stiff competition from diesel engine based
flour mills, despite lower cost to customers. In Dicholi, no one has come
forward to operate a flour mill based on power from the DDG plant. Thus,
in addition to poor load growth, no commercial loads have come up in the
last 4-5 years in these VESP projects. And this has a significant impact on
financial viability of such operations.
Figure 3.2: Motor costs more than flour mill - Chopan VESP Project
In Chopan the operator is interested in running the power plant because he wants to run the flour mill, off which he is making Rs.2000-3000/month. The flour mill itself was a part of the VESP package and it is a moot point if he would have made the investment in a flour mill himself if the VESP package had not included it.
The flour mill that came with the package has a motor-drive which runs on electricity that is generated by the DDG plant. Thus, mechanical energy produced by the gasifier engine is converted into electricity to run the motor which converts this energy into mechanical energy again to run the flour mill! Undoubtedly, this wastes energy. The motor itself costs nearly 2-3 times the cost of the flour mill, which could have been run on the gasifier engine through a pulley and belt, as other diesel engine flour mills in the area do.

Policy Brief on Biomass Based DDG Projectspg. 22
Section 3
3.3.2 Main reasons for down time & its Management
Several factors contribute to downtime in VESP projects. Chief among
them are:
• Lack of water Chalistapari and Bhalupani were both not operational
at the time of our visit, because the well /bore well on which they
were dependent for water had gone dry. In Bhalupani, operators
stated that every year between March and June they shut down the
plant for lack of water. In Chalistapari, although there is water source
nearby, the Forest department has objected to it being used to run
the gasifier plant.
• No biomass supply or wet biomass is a frequently mentioned cause
for the plant being shut down. This is mainly because of the ad hoc
manner in which biomass is being procured in all these projects and
lack of a biomass plantation to ensure supply. This will be discussed in
greater detail in the sections that follow.
• Breakdown of parts, especially broken cutter blades and drained
batteries. The latter is more frequent when the plant has been newly
commissioned and operators are greenhorns. Usually, batteries get
drained because operators crank the engine well before the gasifier
has started generating producer gas of requisite quality and quantity.
In Dicholi, the cost of getting a drained out battery charged was nearly
Rs.500-750 since it had to be taken by boat to the nearest town and
brought back after a day or two. Now, they have changed the original
battery and also keep a battery on standby, so that a battery can be
used to start the engine, when the other fails. Since the plant is
operating and generating electricity, the drained out battery is now
charged on site instead of going to the nearest town.
• Poor After-Sales Service, especially from equipment manufacturers
who were bound by an AMC to provide prompt after sales service. The
World Bank study on VESP identified this as a major cause for poor
technical performance of VESP which in turn also had a severe impact on
financial and institutional performa-nce of VESP.
Figure 3.3: Cost of doing simple things in remote locations
In Bhingara, the plant is not operational since the cutter blades are broken. Another cutter machine is available to do the job but it is lying about 4 km from the plant at the base of the hill and it costs about Rs.1000 to hire a tractor to bring it up the hill to the plant.
As analysis in the next section reveals, this amount is almost equal to the gross monthly profit for this scale of operation. The terrain magnifies the cost of doing simple things in such remote villages.
Policy Brief on Biomass Based DDG Projects pg. 23
Section 3
Figure 3.4: Dedicated After Sales Service - Secret of Better Uptimes
VESP projects in Chopan, Bharitakheda, Chalisatapari and Bhingara are being serviced by Bluegum Diesel System which is based in Nagpur which is nearly 250km from these villages. The firm has deployed two well trained technicians and opened a local office to provide prompt after sales service.
These technicians are responsi-ble for repair and maintenance of the plants as well as for training the operators. They provide support through mobile telepho-nes as well as by making site visits.
The monthly costs are nearly Rs.22000 covering salary and travel costs of these technicians.
A key reason for improved uptimes in older VESP projects and high
uptimes in even newer VESP projects is localization of after sales service
and close handholding of operators.
Key reasons for downtime in BERI was related to lack of biomass,
breakdown of engine, cleaning of gas filtration systems and not being able
to evacuate power due to grid being down. Repairs and maintenance in
BERI are being managed with help from the Combustion Gasification &
Propulsion Lab (CGPL), Indian Institute of Science (IISc.) which is the
technology developer and by hiring appropriate vendors on a case to case
basis.
Husk Power provides all technical backup to its own plants as well as to its
franchisees for fee of Rs.15000 per month/plant. Uptimes in Husk Power
plants are high because not only do they provide dedica-ted technical
assistance to plant operators but they also ensure biomass supply and
thus take away a key cause that has been often the cause for downtime in
other plants.

Policy Brief on Biomass Based DDG Projectspg. 24
Section 3
Figure 3.5: Tree Based Farming - An Innovative Approach to Biomass Supply
BERI adopted the Tree Based Farming System on private farming lands to grown biomass for the power plant. TBFS, the farmer digs trenches along farm bunds and across contours. Soil from the trenches is piled on to the bunds thus, strengthening them. Timber species such as teak, acacia, silver oak , s i sum, casur ina etc . are planted at the rate of 2-3/trench. Fuel, fodder and other species such as subabul, Cassia siamea, drum stick are planted on the farm bunds such that an acre has about 200-300 plants. Someti-mes even plants such as papaya are planted on the bunds.
The main crop land is planted with fruit trees such as mango, sapota, guava, etc., depending on the choice of the farmer. In between these trees, the normal agricultural crop of the farmer is taken.
Along the border of the plot, live fence in the form of Euphorbia, Glyricidia, etc. are planted to p r o v i d e p r o t e c t i o n t o t h e p l a n t a t i o n s f r o m g r a z i n g . I n addition, these also provide a ready source of green leaf for manure and fodder purposes.
Thus an acre of land is planted with 400-500 trees without significantly reducing the area under the main agricultural crop.
3.3.3 Management of Biomass Supply in
Projects
In VESP projects biomass supply was
unorganized. Usually, the operator hired
a labourer or two to cut wood from
surrounding forest areas and supply to
the plant. Typically, a labourer was paid
Rs.100 and he brought in about 40-50kg
of wood in a single trip in a day. Usually,
such labourers did only one trip in a 15day . Often finding such labourers is
difficult task because very few people
want to do this on a regular basis as this
invariably brings them into conflict with
Forest department officials. Although,
biomass plantations were funded and
set up under VESP package, none of
them are in existence. In Bhalupani and
Dicholi each household contributes a
fixed quantity of biomass, however, the
source is again the nearby forests.
In BERI, nearly 30-50% of the biomass
comes from project plantations which
included plantation on common land,
forest land (through VFC) and on private
land. The rest comes f rom forest
department and other commercia l
sources. The average landed cost of
biomass in BERI is ~Rs.2/kg. Another
Re.0.3 to Re.0.5/kg is incurred for
cutting it to the requisite size. Thus, the
cost of biomass ready for use in the
power plant is ~Rs.2.5/kg.
15This means that cost of biomass at the plant is Rs.2-2.5/kg as against the common assumption that biomass in such areas would cost less than a rupee.
Policy Brief on Biomass Based DDG Projects pg. 25
Section 3
Husk Power plants use rice husk as their only fuel and Husk Power
Systems ensures its supply to its plants by tying up with rice millers in the
area.
3.3.4 Takeaways from Analysis of Technical Performance
VESP projects have significan-tly improved their uptimes, which indicate
that the techno-logy has turned the corner in terms of local operators
running these plants. However, loads have remained unchanged.
Very low CUF means that investments made in plant capacity is being
wasted. Plants are unable to increase CUF for want of local loads and since
they are not grid connected, they cannot sell it outside the village. For
example, if Rs.1.2 lacs are invested in building a 10kW DDG plant and only
10% of the plant capacity is being utilized annually, it represents an
investment of 90% being wasted.
Biomass supply continues to remain an issue for concern as also after
sales service which is still either too costly for commercial plant 16operations to sustain or is too project specific to be easily scaled up.
In contrast, Husk Power installations seem to have overcome these issues
as reflected in their high uptimes (upto 90%). However, the terrain in
which these plants operate are easily accessible with high concentration
of loads as compared to the VESP plants.
3.4: Financial Performance of Biomass DDG Projects
This section examines the financial viability of VESP projects (the kind of
projects that the RGGVY-DDG programme wants to promote) by carrying
out a breakeven analysis at current levels of operations and also contrasts
this with financial performance of Husk Power plants.
3.4.1 Key Operating Conditions of a VESP Power Plant
Table 3.5 provides details of typical operating conditions of a VESP plant.
Each household is provided with 40W of load. Street lighting is also
underta-ken as part of VESP. Including all these loads, the CUF is about
12% only.
16The after sales support being provided by Bluegum Diesels is not commercially sustainable and is also not likely to be replicated easily. It represents an approach that is driven purely by Mr.Abhay Bhure's passion for making VESP projects work.

Policy Brief on Biomass Based DDG Projectspg. 26
Section 3
3.4.2 Typical Investments, Operating Costs and Tariffs of a VESP Power
Plant
Table 3.6 shows investments, operating costs and tariffs in a typical VESP
project. It enjoys a capital subsidy of 90% from MNRE. The rest comes in
the form of investments from the PIA, the VEC or the SNA. For making a
commercial assessment, we have assumed that the rest of the investment
comes in the form of equity and debt in the ratio of 30:70.
Maintenance costs include AMC and consumables. Tariff collected from
households is Rs.50-75/month/household. No payments are received for
street lighting from the Pancha-yath which is responsible for the
payment.
Table 3.6: Investments,operating costs & tariffs - VESP
Capital cost Rs. 1200000
Subsidy 90% 1080000
Debt 70% 84000
Equity 30% 36000
Interest 14% 11760
Maintenance Rs. /annum 36000
Fuel Rs./kg 2
SFC kg/kWh 1.8
Operators (2) salary Rs. /month 6000
Tariff domestic Rs. /month 72
Tariff domestic Rs./kWh 12
Tariff street lighting Rs./month 0
Tariff street lighting Rs./kWh 0
Escalation % 5%
Table 3.5: Typical OperatingConditions of VESP Plant
Plant Size kW 10
Plant life Years 10
Auxiliary load kW 10%
No. of connections No. 80
Load/connection W 40
Operating load domestic kW 3.2
Operating load street lighting kW 2
Operations/day hr 6
Operations/year days 300
Capacity Utilization Factor % 11.90%
Policy Brief on Biomass Based DDG Projects pg. 27
Section 3
3.4.3 Break-even Analysis at Current Levels of Operations
Table 3.7 shows how the VESP project fares financially at current level of 17operations. It also presents a breakeven scenario .
At current level of operations the project is unable to generate enough
contribution margin to cover fixed costs. It needs to increase the no. of 18units sold by a factor of 6.8 times, i.e., from 9360 units to 64,372 units . In
turn this means that at current tariffs, the CUF has to increase from 11.9%
to 82%, a tall order considering that even domestic loads have not
increased significantly in the last 4 years in Dicholi and Bhalupani.
17For the base case a tariff of Rs.72/household/month is assumed with no revenue coming in from street lighting services. For the breakeven case a tariff of Rs.120/household/month and Rs.3000/month from street lighting is assumed. In both cases it is assumed that 100% collection would be made.18Breakeven no. of units (64372) divided by units being sold currently (9360)
iii) Administrative Expenses 7200072000
ii) Depreciation 1200012000
Total Fixed Expenses 9576095760
Profit Before Taxes 244-81836
5. BREAK EVEN POINT (value) 150815.716475361.333
6. CASH BREAK EVEN POINT (value) 131916.5415792.24
Cash Breakeven Point (Units) 8166.2656305.20
Breakeven Point Units 9336.2164371.85
Table 3.7: Break-even Analysis for VESP DDG Plants
Break-even caseBase case
Units Sold/Annum 1.769360
Break-even case691201. NET SALES PROCEEDS
Net Sales Proceeds/Unit 16.27.4
2. VARIABLE EXPENSES
i) O & M Expenses 5169651696
ii) Interest on working capital 35003500
Total Variable Expenses 5519655196
Variable Expenses/Unit 5.95.9
3. CONTRIBUTION (1-2) 9600413924
Unit Contribution Margin 10.261.49
4. FIXED EXPENSES
i) Interest on term Loan 1176011760
ii) Depreciation 1200012000

Policy Brief on Biomass Based DDG Projectspg. 28
Alternatively, the tariff can be for domestic consumers from Rs.12/unit to
Rs.20/unit (Rs.72/ month/households to Rs.120/ month/household) and
payment collected from the Panchayath for street lighting @ Rs.10/unit
(Rs.3000/month). At this level, the plant would just breakeven even at
11.9% CUF and at current levels of no. of units being sold. However, given
the situation in most VESP villages, where people are paying even the
Rs.50-75/month/house-hold, it seems unlikely that they would agree to
pay Rs.120/ month/household. Further, at this level the plant would only
breakeven. That means to make profits, the tariff will have to be higher or
the CUF has to be increased significantly.
3.4.4 Comparison of VESP with Husk Power Plants in Terms of
Operational Profits
Analysis similar to the one presented for VESP in the preceding section
was carried out for Husk Power and the profits before interest and taxes
(PBIT) calculated for Husk Power and VESP in two scenarios viz., Base case
and Breakeven Case. Table 3.8 shows that Husk Power gives the
entrepreneur a profit before interest and taxes of Rs.27433 every month
in the base case and even at breakeven point Rs.10,603/month. In
contrast, VESP gives a loss of Rs.4548/ month at a profit of Rs.2292/
month at breakeven point, which we saw was difficult to reach at current
CUF levels.
Table 3.8: Profits/month Husk Power vs. VESP
All figures inRs./month
Husk(Base case)
Husk(Break-even)
VESP(Base case)
VESP(Break-even)
Sale 66660 49830 5760 12600
O&M 15000 15000 1500 1500
Fuel 12226 12226 2808 2808
Salary 12000 12000 6000 6000
PBIT 27433 10603 -4548 2292
Policy Brief on Biomass Based DDG Projects pg. 29
Table 3.9: Attractiveness of Profits VESP vs. Husk Power
Parameters VESP Husk Power
Plant size kW 10 3219Investments after subsidy (Rs.) 120000 1120000
Returns (Base Case) -54576 329196
Returns (Breakeven Case) 27504 127236
Hours of operation/day 6 6
ROI Base Case -45.5% 29.4%
ROI Breakeven Case 22.9% 11.4%
To understand this better let us compare scale of operations, investments
and returns at base case and breakeven case for both projects. Table 3.9
shows that not only does the Husk Power plant give a higher Return on
Investment (ROI) in the base case but is the quantum of profit is also large
enough to sustain interest. In contrast, even at breakeven point (which we
have seen is not easy to achieve), the VESP project gives a return that is
not large enough. To put it in perspective, at breakeven point, Husk Power
projects give the entrepreneur Rs.10,603/ month as against a paltry
Rs.2292/month for VESP. At the base case this is even better for Husk
Power, Rs.27,433/month.
In short, not only is VESP not breaking even at current levels of
operations, but even if it were to reach breakeven the absolute volume of
profits would not be attractive for an entrepreneur to spend 8-10 hours
every day to manage the plant in a remote location. On the other hand,
although the Husk Power entrepreneur makes a larger investment, for the
same 8-10hours of work in managing the plant, even at base case, he
manages to earn Rs.27,433/ month.
19VESP has a 90% capital subsidy while Husk Power gets 30% only.
Section 3 Section 3
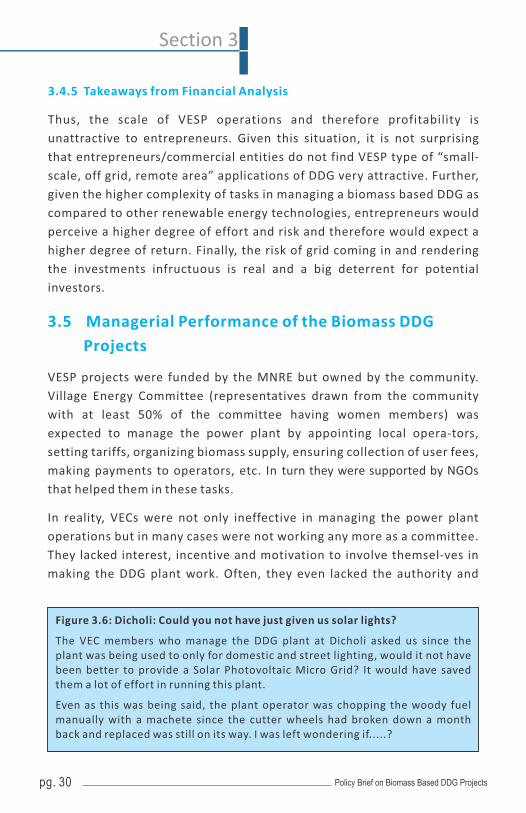
Policy Brief on Biomass Based DDG Projectspg. 30
3.4.5 Takeaways from Financial Analysis
Thus, the scale of VESP operations and therefore profitability is
unattractive to entrepreneurs. Given this situation, it is not surprising
that entrepreneurs/commercial entities do not find VESP type of “small-
scale, off grid, remote area” applications of DDG very attractive. Further,
given the higher complexity of tasks in managing a biomass based DDG as
compared to other renewable energy technologies, entrepreneurs would
perceive a higher degree of effort and risk and therefore would expect a
higher degree of return. Finally, the risk of grid coming in and rendering
the investments infructuous is real and a big deterrent for potential
investors.
3.5 Managerial Performance of the Biomass DDG
Projects
VESP projects were funded by the MNRE but owned by the community.
Village Energy Committee (representatives drawn from the community
with at least 50% of the committee having women members) was
expected to manage the power plant by appointing local opera-tors,
setting tariffs, organizing biomass supply, ensuring collection of user fees,
making payments to operators, etc. In turn they were supported by NGOs
that helped them in these tasks.
In reality, VECs were not only ineffective in managing the power plant
operations but in many cases were not working any more as a committee.
They lacked interest, incentive and motivation to involve themsel-ves in
making the DDG plant work. Often, they even lacked the authority and
Figure 3.6: Dicholi: Could you not have just given us solar lights?
The VEC members who manage the DDG plant at Dicholi asked us since the plant was being used to only for domestic and street lighting, would it not have been better to provide a Solar Photovoltaic Micro Grid? It would have saved them a lot of effort in running this plant.
Even as this was being said, the plant operator was chopping the woody fuel manually with a machete since the cutter wheels had broken down a month back and replaced was still on its way. I was left wondering if.....?
Policy Brief on Biomass Based DDG Projects pg. 31
stature to discharge their duties, since they were not the natural leaders
in the community. Many VEC members even asked, why they needed to
spend their time and effort for ensuring that the plant ran or for ensuring
biomass supply, when they got no returns (especially financial). In a few
villages, though, 1 or 2 motivated members of the VEC were actually 20found running the power plant . In Chopan, since the plant was also
connected to a flour mill, the operator had an incentive to run the plant
regularly.
However, in all the projects collection of user fees was very poor. Most of
the operators (also VEC members) lamented that people did not pay for
the power used, when they went to ask for user fees. They felt that only an
outsider (in this case the supporting NGO) could actually do it. Currently,
operators are being paid from the O&M fund that was given for managing
operations for 2 years in the VESP package. In Dicholi, collection of user
fees is being linked to payments that are made through the local milk
cooperative. Since the whole village has households that belong to just
two large related families and they have a high degree of community
cohesion (mainly due to their extreme isolation), they are able to collect
enough from the house-holds to pay the operators to keep them doing the 21job. However, for repairs, they take money from the Gram Panchayath .
Overall, management of VESP power plants by the VEC as an institution is
ineffective and in many cases non-existent. In places where the plants are
running it is because of highly motivated individuals and also the fact that
the O&M fund is being used to pay these individuals to operate the plants.
Thus, the operations of the plants are not linked in any way to any form of
financial sustainability. Therefore, it is a moot point as to how long these
plants would continue to be operated.
Husk Power plants are either run by Husk Power Systems or by their
franchisees. Since they are run by entrepreneurs they are guided by
commercial performance and the high uptime and higher level of returns
20In Chopan, Bharitakheda and Bhingara, either the President or the Vice-president of the VEC was also working as the operator and managing the plant operations including hiring labour to procure biomass.21Dicholi is the only village in the Dicholi Gram Panchayath, hence decisions on spending money to get the DDG plant repaired is relatively easier as compared to other GPs where a no. of villages would be competing for funds.
Section 3 Section 3

indicate their effect ive-ness. S ince Husk Power Systems takes
responsibility for ensuring fuel supply and plant uptime, the entrepreneur
has to only ensure that he runs the plant regularly and collects payment
promptly from users, unlike VESP projects, where the operators (or VEC)
has to ensure biomass supply, interact with various service providers to
ensure that the plant is repaired in time, ensure that users receive power
regularly and they pay for it as well. All this has to be managed against the
backdrop of difficult terrain, remoteness (both physical and telephonic)
and unattractive returns.
Further, the skill set of these local operators (even if they were considered
and treated as entrepreneurs) is limited and inadequate when confronted
with the range and complexity of the tasks. However, for entrepreneurs
with requisite skills to take up these operati-ons, the financials are not
attractive as compared to the time and effort needed.
3.6 Institutional Arrangements in the Biomass DDG
Projects
This section examines how these projects are rolled out and what support
is provided to them, who could be entrepreneurs, etc.
VESP (and also RGGVY-DDG) was conceived, funded and rolled out by the
central govt ministries through several state level govt departments such
as SNAs, Forest Deptt., etc. Often, in these arrangements, ESCOMs which
actually grid electrify and distribute power in the local area are not
consulted other than for taking a declara-tion that they would not extend
the grid to these village within the next 5 years. These, declaration, as
many PIAs found were flouted with impunity and grid was extended to the
village within 1-2 years, rendering the DDG plant irrelevant.
The onus of project preparation, seeking permissions from Forest
department, ESCOMs, etc. was left to the PIA (mostly NGOs in the case of
VESP) with hardly any help coming in from the SNAs. Even technical
support was not forthcoming from any of the govt. institutions and often
the PIA and the VEC had to work directly with the equipment supplier or
find local service providers.
Policy Brief on Biomass Based DDG Projectspg. 32 Policy Brief on Biomass Based DDG Projects pg. 33
Even during operations, when the water source dried out or the Forest
guards created hurdles, the VEC and the NGO had to fight their own
battles. No financial help was forthcoming other than the initial capital
grant and an O&M grant which was supposed to cover costs of operations
and normal maintenance. For larger costs, the VEC was expected to find
its own means. For example, the VEC at Dicholi incurred a total expense of
Rs.80,000 in 4 years of operati-ons in repair and maintenance. This
included replacement of batteries, pumps, repairs to engines and the
gasifier itself. They had no O&M funds because the VESP package had no
such provision when the Dicholi project was sanctioned. As seen from the
financial analysis, such profits are not generated from these plants. They
managed to fund the repairs by seeking grants from the Panchayat as well
as contri-butions from every user family.
Thus, institutionally, the project does not receive any significant support
once it has been installed and commissioned. Even during the project
preparation, installation and commissioning the support from other govt.
institutions is limited. Finally, if the grid is extended, no government
agency including MNRE can help. In such a scenario, it is no wonder that
entrepreneurs are reluctant to come in.
Finally, who can be entrepre-neurs in such projects? The World Bank 22study on VESP makes the following observa-tion in this regard:
“The entrepreneur could be an individual or groups of individuals, NGOs, or self-help
groups, that were chosen based on an appropriate process of selection. Given the very tiny
scale of operations in a typical VESP project, it is very unlikely that entrepreneurs from far
off places would be attracted on purely commercial terms. Therefore, it is very likely that the
entrepreneur would be from the project village itself or from neighbouring villages. An
entrepreneur who is already running a flourmill or an oil expeller in the village using diesel
engines, for example, could be the first choice because the person would have the necessary
technical and business skills to manage the power plant.”
Thus, it is clear that no commer-cial entity is likely to invest in these plants
for purely commer-cial reasons. At the same t ime even local
entrepreneurs do not find the project attractive given the poor monthly
earnings. As against the monthly earning of about Rs.2000-4000 (Rs.65-
130/day) expected from these plants, even a daily labourer would earn at
least Rs.100/day without having to manage so many issues and tasks.
22Ibid 8
Section 3 Section 3

Policy Brief on Biomass Based DDG Projectspg. 34
3.6.1 RGGVY Distribution Franchisees' Perception of the DDG
Opportunity
Following reforms in the electricity sector, many ESCOMs have hived off
some of their distribution responsibi-lities such as meter reading, billing,
and user fee collection to franchisees, who are paid a commission to
undertake these tasks. In more advanced levels of engagement, ESCOMS
hand over the distribution infrastruc-ture to a franchisee and bill them
only for the bulk power that they receive from the ESCOM. The franchisee
is responsible for distributing the power in its area, repairing and
maintaining the distribution infrastructure, augmenting it when needed,
collecting dues from the users, etc. Such franchisees are called Input
Based Franchisees (IBF).
In several RGGVY areas, ESCOMs have engaged with franchisees to just do
billing and bill collection or as IBF. Given that the task of DDG plant
operation (as seen in the preceding sections) involved not only generation
but distribution management as well, it was felt that they could be
potential candidates for being entrepreneurs to take up biomass based
DDGs. Accor-dingly, this study spoke with several of them from UP and
Bihar as well as with a large distribution franchisee com-pany, Enzen Ltd.,
Bengaluru.
The RGGVY franchisees that we spoke to were apprehensive about the
shift to IBF for their current areas of operations. They were not aware of
RGGVY-DDG scheme details but felt that operations in remote areas
would be difficult and costly and people would not pay for power.
Figure 3.7: Feedback from Mr.Satheesh, MD, Enzen on DDGs
Off grid DDGs usually are done in remote, backward regions of the country and the scales do not offer a business case for commercial entities to manage the power plant
However, such locations do need power. Entrepreneur who would go there would be social entrepreneurs who should be liberally supported to not only put up the power plant and supply power, but also develop livelihoods that would increase use of power.
He felt that the current focus of MoP on attracting entrepreneurs to do this on commercial terms and bidding basis is too premature and not likely to work
Sect
ion
4
• Key learnings
• Way forward
Section 3

Policy Brief on Biomass Based DDG Projects pg. 39
Section 4
4.1 Key Learnings
We find from the preceding sections that policy has limited the scope of
DDG applications to small-scale, off grid remote areas.
Analysis of projects (VESP) based on these policies have shown that while
the technical performance of these projects have improved vastly as
compared to the time when the VESP was launched, serious issues related
to sustainability of biomass supply, after sales service and its costs and
lack of increase in loads and utter lack of commercial loads continue.
Financially, these projects are unattractive compared to the effort and
risks that an entrepreneur would be exposed to. It is unlikely that
commercial entities would take up such projects on commercial terms
given the small-scale and unattractive returns. Even local entrepreneurs
may not be interested given the limited earning currently and poor scope
for enhancing it in the short to medium term. Finally, given the
uncertainty about grid extension, commercial investors would shy away
from such projects.
Husk Power projects fared better on all these issues. The combination of
entrepreneurs closely backed by Husk Power for technical issue and
ensuring biomass supply is working well in ensuring attractive returns to
the investor. Since these projects are in dense population areas, load is
not an issue. Further, these projects have not only domestic loads but also
light commercial loads. Customers in these areas are willing to pay a
higher tariff than those in the remote, off grid location and thus, these
projects are financially viable. However, these projects face the threat of
improvements in grid supply leading to dwindling demand. Also, if their
tariffs come under the purview of regulators, as is being discussed in the
Forum of Regulators, then it is likely that their margins will be under
severe pressure. Finally, while the Husk Power model has worked in areas
of high load densities, in easily accessible areas, it is unlikely that it would
work in locations where VESP kind of DDGs are being deployed.
The BERI project as a concept addresses several of these issues that
plague the VESP and the Husk Power Model. The plant is a 500kW
generating station that is connected at 11kV to a substation that is 4-5km
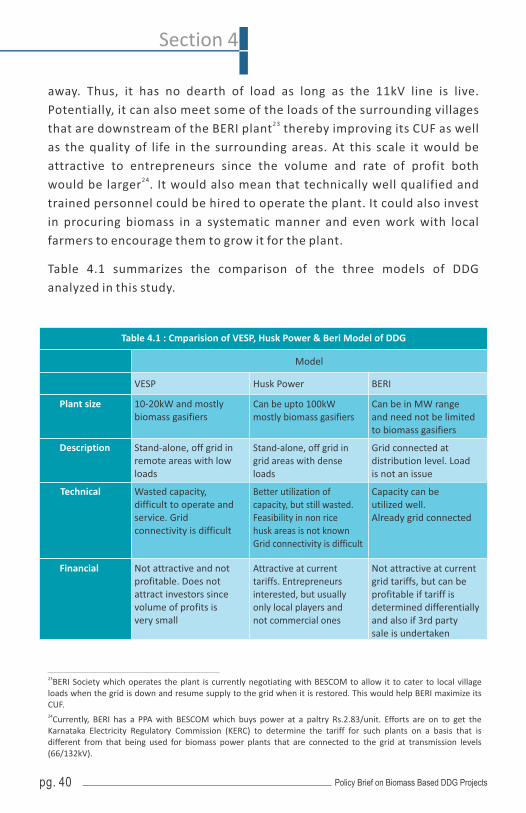
Policy Brief on Biomass Based DDG Projectspg. 40
Section 4
away. Thus, it has no dearth of load as long as the 11kV line is live.
Potentially, it can also meet some of the loads of the surrounding villages 23that are downstream of the BERI plant thereby improving its CUF as well
as the quality of life in the surrounding areas. At this scale it would be
attractive to entrepreneurs since the volume and rate of profit both 24would be larger . It would also mean that technically well qualified and
trained personnel could be hired to operate the plant. It could also invest
in procuring biomass in a systematic manner and even work with local
farmers to encourage them to grow it for the plant.
Table 4.1 summarizes the comparison of the three models of DDG
analyzed in this study.
23BERI Society which operates the plant is currently negotiating with BESCOM to allow it to cater to local village loads when the grid is down and resume supply to the grid when it is restored. This would help BERI maximize its CUF.24Currently, BERI has a PPA with BESCOM which buys power at a paltry Rs.2.83/unit. Efforts are on to get the Karnataka Electricity Regulatory Commission (KERC) to determine the tariff for such plants on a basis that is different from that being used for biomass power plants that are connected to the grid at transmission levels (66/132kV).
Table 4.1 : Cmparision of VESP, Husk Power & Beri Model of DDG
Model
VESP Husk Power BERI
Plant size 10-20kW and mostlybiomass gasifiers
Can be upto 100kWmostly biomass gasifiers
Can be in MW rangeand need not be limitedto biomass gasifiers
Description Stand-alone, off grid inremote areas with lowloads
Stand-alone, off grid ingrid areas with denseloads
Grid connected atdistribution level. Loadis not an issue
Technical Wasted capacity,difficult to operate andservice. Gridconnectivity is difficult
Better utilization ofcapacity, but still wasted. Feasibility in non ricehusk areas is not knownGrid connectivity is difficult
Capacity can beutilized well.Already grid connected
Financial Not attractive and notprofitable. Does notattract investors sincevolume of profits isvery small
Attractive at currenttariffs. Entrepreneursinterested, but usuallyonly local players andnot commercial ones
Not attractive at currentgrid tariffs, but can beprofitable if tariff isdetermined differentiallyand also if 3rd partysale is undertaken
Policy Brief on Biomass Based DDG Projects pg. 41
Section 4
Managerial Not manageable locallyand not attractive tooutsiders
Can be managed locallybut not very attractive tooutsiders
Cannot be managedlocally, but may be attractive to commercial entities
Biomass Supply Usually local and notorganized. Currentlyworks only on woodybiomass
Organized by HuskPower. In non rice huskareas, not known
Can be from a widerarea and othercommercial suppliers
4.2 Proposal for Making DDG Viable for Village
Electrification
Small-scale DDG (10kW) in remote location is not justified financially,
especially if grid extension is expected in the next 5-6 years. Even
economi-cally, the benefits to the community from purely lighting loads
do not justify investments in DDG for just 5 years. With no commercial
loads coming up there is a need to rethink this policy.
Medium scale plants (20-100kW) in stand-alone minigrids are feasible in
dense load areas and not in low load remote areas. Further, they would
become unviable if grid improves and also are not very feasible to connect
to the grid.
Larger scale plants (500kW to 2 MW) in grid connected mode at
distribution level are feasible and viable, but cannot serve un-electrified
villages since these villages are not connected to the distribution network of
the grid.
Therefore, extend the grid by incurring a one-time capital cost and set up
the DDG at such a scale and location that it is able to cater to the existing
load of the un-electrified villages and is able to pump surplus power in to
the grid.
In short, instead of taking the power plant to a village, take only power.
In VESP projects in Maharashtra, the grid was only 7km away and the
substation 20km. In Orissa, grid was less than 500m away!
Figure 4-1 presents a schematic representation of a grid connected
biomass DDG plant that helps extend the grid to remote areas while also
feeding surplus power to the grid through an existing substation.

Policy Brief on Biomass Based DDG Projectspg. 42
Section 4
Figure 4.1 :Schematic of Remote Area Electrification thru Distribution Grid Connected DDG
Remote
area
Grid
extension to
cover new
villages in
remote area 2-way metering
at new biomass
DDG plant
Existing
Substation
Existing
distribution
line
Existing grid
connected
village
New Grid
Connected
Biomass DDG
Plant
Newly grid
connected remote
village
4.3 Advantages of a Distribution Level Grid Connected
DDG Plant
A DDG plant that is connected to the grid at the distribution level meets
the definition of DDG that we discussed in section 2.1 (Ackermann et al).
Since the grid provides a large load, the DDG plant can operate at higher
CUFs. Pumping power at the tail-end of the distribution network improves
quality of power delivered to consumers and since now more power is
available, the grid can be extended to cover more areas.
At larger scales (especially 1-3MW) scale other biomass technologies
especially biomass combustion also becomes feasible. Further, these
technologies can use a variety of biomass fuel unlike current models of
gasifiers which need only woody fuel or biomass briquettes. This would
increase the sources from which biomass could be procured for operating
these plants.
Users in remote areas can now be brought under grid tariffs and on par
with existing rural grid customers, thus address-ing issues of equity.
Policy Brief on Biomass Based DDG Projects pg. 43
Section 4
25However, tariff for DDG generation would have to be determined
separately from existing basis for biomass power projects since the
operating conditions (especially PLF is likely to be significantly lower)
would be vastly different and the scale of operations would also be very 26different .
At this scale commercial entities would be attracted especially since grid
extension is part of the solution and not the problem! The same model
may be used even in existing distribution networks (as BERI is doing) to
strengthen tail-end supply. Finally, unlike in existing DDG projects,
generation and distribution need not be vested with the DDG plant
operator alone. However, if both operations are combined the operator
gets an incentive to minimize distribution losses and increase his profits.
4.4 Issues Facing the Proposal
Among the various stakeholders, buy-in from ESCOMs and Forest
department (especially for remote forest villages) would be crucial for
making this idea work.
From an ESCOM's point of view working with this model entails capital 27expenditure for extending the grid to remote locations, purchase of power
at higher tariffs than even existing tariffs for non-conventional energy
sources from the DDG plant, having to supply power to more villages and
for longer hours. With cost of supply already exceeding the revenue from
even existing villages, the ESCOM would be averse to increasing supply to
them leave alone actually adding more such villages to its distribution
network. Therefore, a financial mechanism for compensating the ESCOM
should be put in place, if the goal for providing electricity for all has to be
achieved in substantive terms and not as a token by providing lighting for
a few hours.
The Forest department is likely to have concerns with allowing
distribution lines being drawn through forest areas in the proposed
25Such plants may need to be compensated for providing reactive power as well for having to operate at lower PLFs.26A good bench-mark for setting a tariff for an operator who generates and distributes power is the existing cost of supply to the village by the ESCOM less the gains from reduction in T&D losses + adequate Return on Equity27This can be mitigated by funding through RGGVY

Policy Brief on Biomass Based DDG Projectspg. 44
Section 4
model. This is a genuine concern. However, in our opinion, the option of
putting up biomass DDG plants in remote villages is worse than putting a
larger plant in a more accessible location and only drawing distribution
lines to such villages. DDG plants in remote villages are managed by local
operators who source biomass from nearby forests, often illegally. It is
unlikely that, they will invest in organized biomass production and supply,
especially given their skills, scale of operations and its profitability. On
the other hand a larger grid connected biomass DDG can source biomass
from a variety of sources and a larger area. Given their scale of opera-
tions, they can invest in contract farming and more organized biomass
procure-ment and supply. Further, the Forest department will not have to
monitor numerous biomass DDG plant at many remote villages.
From a DDG project promoter point of view reliable and adequate 28financial returns, sustainable and cost effective biomass supply and
simple and clear technical standards and norms for connecting to the grid
are required to reduce project risks.
4.5 Building a Local and Sustainable Biomass Supply
Solution
Figure 4-2 shows a way for building a local and sustainable biomass supply
solution.
28Financial returns may be through Feed In Tariff and other means including competitively determined viability gap funding.
Policy Brief on Biomass Based DDG Projects pg. 45
Section 4
3P - Partnership for DDG
Funds for biomassdevelopment
Sale of biomass
RDPR
Share ofprofits
GramPanchayatDevelopsBiomass
resource park
Biomass development costand land is GP equity
EntrepreneurInvests, installs
& operatesbiomass power
plant
GP invited & selectsentrepreneur
Figure 4.2 :Public-Private-Panchayat Partnership for Biomass Supply
Often power plants set in rural areas aim to procure biomass by targeting
existing sources which are often already being used for other purposes.
Sometimes, existing sources, especially agri-residues are dependent on
the crop pattern and the performance of the crop itself leading to huge
changes in supply. Therefore, it would be prudent for biomass power
plants to invest in creating backward linkages for creating a biomass
source and supply chain.
From a rural community point of view, the only assets they have for
making an earning is labour, land and the knowledge to grow plants,
trees, etc. The Gram Panchayat has funds for taking up plantations under
various schemes and also has funds for providing wage employment to
rural folks under MNREGA.
Thus, if all these three (Public-Private-Panchyat, P3) decide to
collaborate, biomass can be grown on public and private lands with
funding for these plantations coming from the Panchayat, while the
power plant can offer a buy-back guarantee as paper and match-stick
making companies do. This would not only ensure a sustainable source of
biomass to the power plant but also ensure better quality power to the
villages since the power plant is a DDG connected to the distribution line.
A more intense form of P3 partnership could be when the Gram Panchayat
creates “Biomass Parks” by using funds at its disposal to carryout
plantations (on public and private lands) and invites biomass power
project develo-pers to set up the plant with a guaranteed supply of
biomass in return for a share of the profits to compensate for the
investments in biomass development. The villagers who are the biomass
growers would also get paid for the quantity of biomass that they supply.
Thus, such an arrangement would help the biomass power plant operator
in a quick start up and also lower project risks significantly. In addition, if
the Gram Panchayat is also able to ensure that the “Biomass Park” has
land identified for setting up the power plant the turnaround time for the
biomass DDG plant is reduced further.
4.6 Next Steps
This idea may be piloted in a cluster of RGGY villages that have been
connected to the grid but are receiving little or no power. A biomass based

Policy Brief on Biomass Based DDG Projectspg. 46
Section 4
DDG plant of appropriate size (taking into account local loads and scale
needed for attracting investments) may be set up in a grid connected
mode at distribution voltage.
The local ESCOM needs to be on board at the very outset of the project for
its success. Therefore, it would be essential to ensure that irrespective of
the project funding source, the ESCOM is made a party to the project.
To ensure that the plant is run on a commercial basis, entrepreneurs may
be selected on a competitive basis to partner with the ESCOM/
Government department on a cost and risk sharing basis to build and
operate the plant. At the end of predetermined period, the operator may
be given the option of buying out the government stake or having it
converted into a debt. This would ensure that the entrepreneur would
have a longer term interest in operating the plant than just the project
period.
At the policy level, the scope for DDGs should be expanded to include tail-
end generation, especially to deliver power to rural areas by making use
of the infrastructure that has been created under RGGVY. At a regulatory
level, appropriate basis for setting the FIT for such DDG plants is required.
Appro-priate technical standards and norms, including metering and
billing methodology for operations of grid connected DDGs should be
developed so that ESCOMs and DDG project promoters are clear on how
to implement such projects.
Anne
x
• Annex 1
• Annex 2
• Annex 3
• Annex 4

Policy Brief on Biomass Based DDG Projects pg. 51
Annex
5 Annex 1: Summary of Key DDG Programmes in India
En
erg
yA
pp
licat
ion
s
Pro
gra
mm
e
Elig
ibili
tyC
on
dit
ion
(s)
Ph
ysic
al t
arg
et
Ach
ieve
men
ts
Res
po
nsi
bili
ty
Tech
no
log
yP
refe
ren
ce
Dec
isio
ns
on
Tari
ff
Imp
lem
enta
tio
nA
gen
cy
Ow
ner
ship
S
tru
ctu
re
Fin
anci
alA
rran
gem
ent
& M
RVEP,2003
Villageswith apopulationof 100inhabitants
6446remotevillagesand 1587remotehamletshave beenelectrifiedso far.
MNRETo electrifyabout10000remotevillages
Mostappropriateenergytechnology(no clearguideline). However95 % ofthe villageselectrifiedare throughsolar phot-ovoltaicsystems
Lighting StateImplementingAgencies.Financialgrant includesa five yearAnnualMaintenanceContract withthe supplier
PIA StateNodalAgencies
Community 90 % ofthe capitalsubsidyfromMNRE
VESP Villageshould bea minimumof 50 andmaximumof 400HHs
700 kW ofcapacityhas beencreated.
MNRETo electrify\remoteand inacc-essible1000villagesand meetthe totalenergyneeds ofvillages
Biomassgasification&Bioenergyisprioritized
Totalenergyrequire-mentsofcooking,electricityandmotivepower
O & MSupport fundto cover2 years ofoperation andmanagement.It shall be10 % of thetotal projectcost
VECandprojectimplem-enting agencieswilldecidetariff
Govt.Deptt(e.g.ForestDeptt.)NGOs
VillageEnergyCommittee/communityownership
One timegrant upto90 % ofthe projectcostsubject toRs 20,000per bene-ficiary.Rest asequitycontribu-tion interms ofcash orkind (Usercharges)
DDG,2009
More than100 HHs
Noinformationavailable
MOPNo clearguideline
Technologyneutral buta hierarchyissuggested
Lighting Cost ofspares for fiveyears aftercommissioning(excluding thecost ofconsumablesand labour) isincluded asthe projectcost
Tariffswill bedecidedby theimplem-entingagency
SREDAs/State Deptt./StateUtilities/dentifiedCPSUs
StateGovernm-ent
90 % ofthe projectcost assubsidyand rest10 % willbearrangedby theimpleme-ntingagency

Policy Brief on Biomass Based DDG Projectspg. 52
Annex
JNNSM,2009-10
Variousoff-gridsolarphotovol-taic systems/applicati-ons up tomaximumcapacity of100 kWpper site.For mini-grid,amaximumcapacity of250 kWwill besupported
33 MWhas beensanctionedbyJan 2011.300villageshave beenelectrifiedand 7000HHs havebeenprovidedhomelightingsystems.
MNREThe progr-amme willbe a partof the RVEP andtargets toelectrify10000remotevillages
Solar Lighting/electricity/power,heating/cooling
O & MSupport fundto cover2 years ofoperation andmanagement.It shall be10 % of thetotal projectcost
No clearguideline
StateNodalAgencies/AkshayUrjaShops
Community MNRE willprovide30 % ofthebenchmarkcosts ascapitalsubsidyand 50 %of thebenchmarkcosts (Rs. 150/Wp)will beeligible fora loan at5 % perannum.The usermust paya downpaymentto the tuneof 20 % ofthebenchmarkcost.
6 Annex 2: Profitability of VESP Projects (Base Case)
Years
1Units 0 2 3 4 5 6 7 8 9 10
Sales domestic 5760kWh 5760 5760 5760 5760 5760 5760 5760 5760 5760
Sales street lighting 3600kWh 3600 3600 3600 3600 3600 3600 3600 3600 3600
Sales 69120Rs. 72576 76205 80015 84016 88217 92627 97259 102122 107228
Expenses
Fuel 33696Rs. 35381 37150 39007 40958 43006 45156 47414 49784 52274
O&M 18000Rs. 18900 19845 20837 21879 22973 24122 25328 26594 27924
Operator salary 72000Rs. 75600 79380 83349 87516 91892 96487 101311 106377 111696
Interest oncapital loan
11760Rs. 8820 5880 2940 0 0 0 0 0 0
Depreciation 12000Rs. 12000 12000 12000 12000 12000 12000 12000 12000 12000
Interest onworking capital
3500Rs. 3500 3500 3500 3500 3500 3500 3500 3500 3500
Total expenses 150956Rs. 154201 157755 161634 165853 173371 181264 189553 198255 207393
PBIT -66576Rs. -69305 -72170 -75179 -78337 -81654 -85137 -88794 -92634 -96665
ROI -6%%
Profit before Tax -81836Rs. -81625 -81550 -81619 -81837 -85154 -88637 -92294 -96134 -100165
PBT/month -6820Rs. -6802 -6796 -6802 -6820 -7096 -7386 -7691 -8011 -8347
Source: Field visit to VESP sites, 2012
Policy Brief on Biomass Based DDG Projects pg. 53
Annex
7 Annex 3: Profitability of VESP Projects (Break-even Case)
Years
1Units 0 2 3 4 5 6 7 8 9 10
Sales domestic 5760kWh 5760 5760 5760 5760 5760 5760 5760 5760 5760
Source: Field visit to VESP sites, 2012
Sales street lighting 3600kWh 3600 3600 3600 3600 3600 3600 3600 3600 3600
Sales 151200Rs. 158760 166698 175033 183785 192974 202622 212754 223391 234561
Expenses
Fuel 33696Rs. 35381 37150 39007 40958 43006 45156 47414 49784 52274
O&M 18000Rs. 18900 19845 20837 21879 22973 24122 25328 26594 27924
Operator salary 72000Rs. 75600 79380 83349 87516 91892 96487 101311 106377 111696
Interest oncapital loan
11760Rs. 8820 5880 2940 0 0 0 0 0 0
Interest onworking capital
3500Rs. 3500 3500 3500 3500 3500 3500 3500 3500 3500
Depreciation 12000Rs. 12000 12000 12000 12000 12000 12000 12000 12000 12000
Total expenses 150956Rs. 154201 157755 161634 165853 173371 181264 189553 198255 207393
PBIT 15504Rs. 16879 18323 19839 21431 23103 24858 26701 28636 30668
ROI 1%%
Profit before Tax 244Rs. 4559 8943 13399 17931 19603 21358 23201 25136 27168
PBT/month 20Rs. 380 745 1117 1494 1634 1780 1933 2095 2264
8 Annex 4: Profitability of Husk Power Projects (Base Case)
Years
1Units 0 2 3 4 5 6 7 8 9 10
Sales domestic 23760kWh 23760 23760 23760 23760 23760 23760 23760 23760 23760
Expenses
Sales street lighting 13860kWh 13860 13860 13860 13860 13860 13860 13860 13860 13860
Sales 799920Rs. 839916 881912 926007 972308 1020923 1071969 1125568 1181846 1240938
Fuel 146718Rs. 154054 161757 169844 178337 187253 196616 206447 216769 227608
O&M 180000Rs. 189000 198450 208373 218791 229731 241217 253278 265942 279239
Interest oncapital loan
109760Rs. 82320 54880 27440 0 0 0 0 0 0
Interest onworking capital
3500Rs. 3500 3500 3500 3500 3500 3500 3500 3500 3500
Source: Based on published case study in “POLICY AND REGULATORY INTERVENTIONS TO SUPPORT COMMUNITYLEVELOFF-GRID PROJECTS, 2011
Depreciation 12000Rs. 12000 12000 12000 12000 12000 12000 12000 12000 12000
Total expenses 595978Rs. 592074 589347 587855 587661 616269 646307 677847 710965 745738
PBIT 317202Rs. 333662 350945 369092 388147 408154 429162 451220 474381 498700
ROI 19.8%%
Profit before Tax 203942Rs. 247842 292565 338152 384647 404654 425662 447720 470881 495200
PBT/month 16995Rs. 20654 24380 28179 32054 33721 35472 37310 39240 41267

Policy Brief on Biomass Based DDG Projectspg. 52
Notes

Policy Brief on Biomass Based DDG Projectspg. 52
Notes

Climate Change and DevelopmentChandragupta Marg, ChankayapuriNew Delhi - 110021Phone: +91 11 4995 9570Email: [email protected]: www.swiss-cooperation.admin.ch/india
TARA
B-32, Tara CrescentQutub Institutional AreaNew Delhi - 110016 (India)Tel.: +91-11-26544100E-mail: [email protected]: www.devalt.org