policy changes, trade tensions & disputes: focus on grains & pulses policy disputes...
TRANSCRIPT
Policy Changes, Trade Policy Changes, Trade Tensions & Disputes: Focus on Tensions & Disputes: Focus on
Grains & PulsesGrains & Pulses
Policy Disputes Information Consortium
April 23-26, 2003
Montreal, Quebec
Parr Rosson & Flynn Adcock
Texas A&M University
OverviewOverview
• Grain & Pulse Trade: Focus on World & North American Trends
• Farm Program Provisions Related to Pulses
• Potential for Trade Disputes– Corn– Pulses– Dry Beans
• Conclusions & Implications
Intra-NAFTA Share of Total NAFTA Grain & Pulse Trade, 1993 & 2002
8.89.6
17.8
10.7
Grains Pulses0
5
10
15
20
Percent
1993 2002

Intra-NAFTA & ROW Grain Trade
10.920.7
112.3
95.3
123.2116.0
1993 20020.0
20.0
40.0
60.0
80.0
100.0
120.0
140.0
1,000 Metric Tons
NAFTA ROW Total
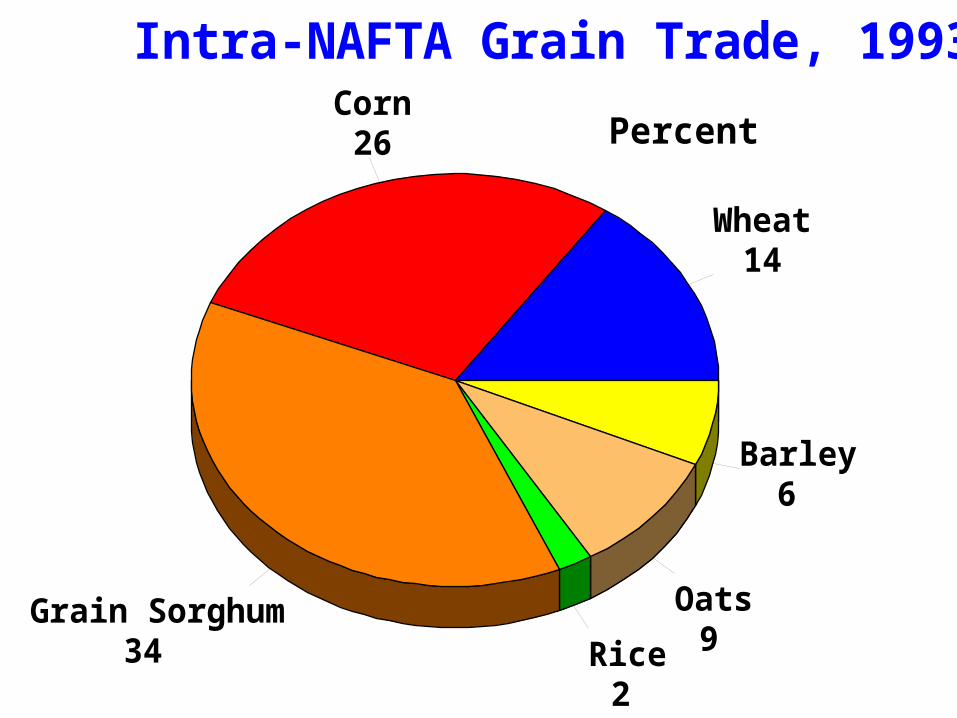
Intra-NAFTA Grain Trade, 1993
Percent
Wheat14
Corn26
Grain Sorghum34 Rice
2
Oats9
Barley6

Intra-NAFTA Grain Trade, 2002
Percent
Wheat11
Corn44
Grain Sorghum20 Rice
4
Oats4
Barley4

Mexican Corn Production
SAGARPA
11
10
12
1010
12 12
11
12 1312
13
34
5
89
66
76
5 5
3
1990 1995 20000
2
4
6
8
10
12
14
Million Metric Tons
Rainfed Irrigated

Intra-NAFTA & ROW Pulse Trade
144350
1359
2910
1503
3260
1993 20020
500
1000
1500
2000
2500
3000
3500
4000
1,000 Metric Tons
NAFTA ROW Total

U.S. Corn Exports to Mexico
Zahniser and Link, ERS, USDA and U. S. Census Bureau.
2.5 2.6 2.6 2.7 2.8 2.9 3.0 3.1 3.23.5
1.3 1.1
0.3
3.1 2.9
6.3
2.6
5.2 5.1 5.25.7
5.3
1990 1994 2000 20020.0
1.0
2.0
3.0
4.0
5.0
6.0
7.0
Million Metric Tons
TRQ Imports

U.S. Corn Exports to Canada
US Census Bureau
0.7
0.2
0.8 0.8 0.71.0
0.91.0 1.2
1.0
1.5
3.0
4.1
1990 1994 2000 20020.0
1.0
2.0
3.0
4.0
5.0
Million Metric Tons

Intra-NAFTA Pulse Trade, 1993
Percent
Dry Beans50.4%
Dry Peas41.2%
Lentils8.4%
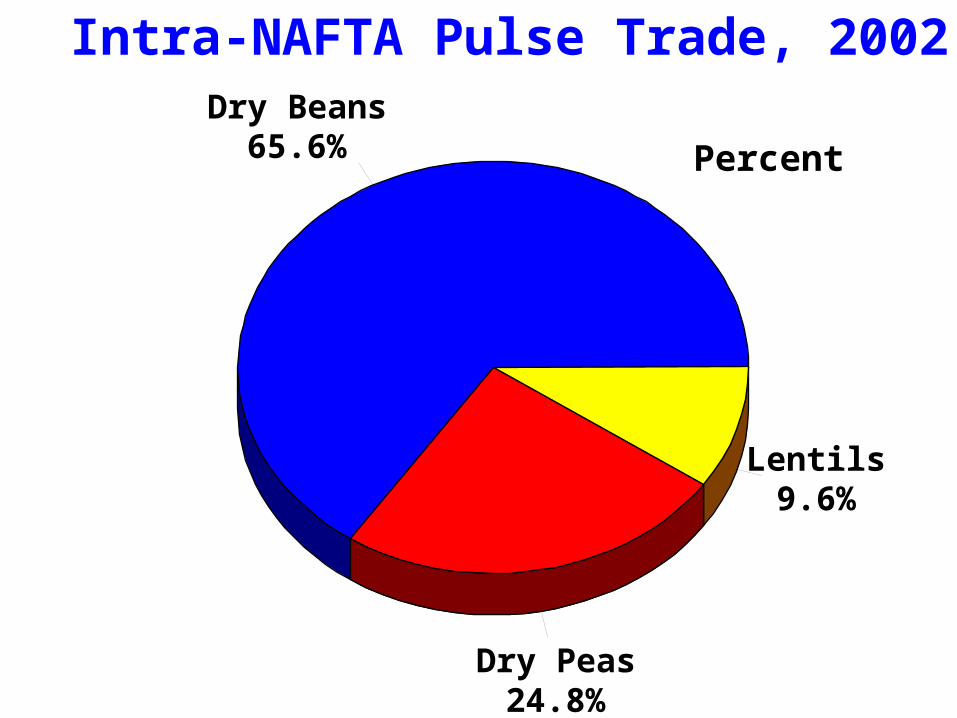
Intra-NAFTA Pulse Trade, 2002
Percent
Dry Beans65.6%
Dry Peas24.8%
Lentils9.6%
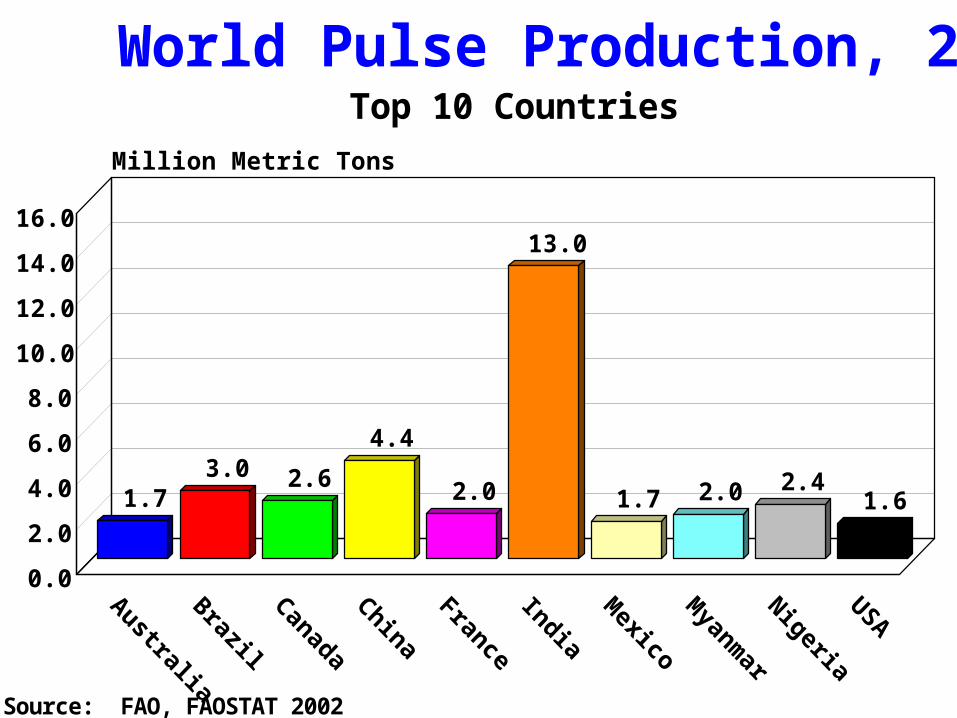
World Pulse Production, 2002Top 10 Countries
Source: FAO, FAOSTAT 2002
1.73.0 2.6
4.4
2.0
13.0
1.7 2.0 2.41.6
0.0
2.0
4.0
6.0
8.0
10.0
12.0
14.0
16.0
Million Metric Tons
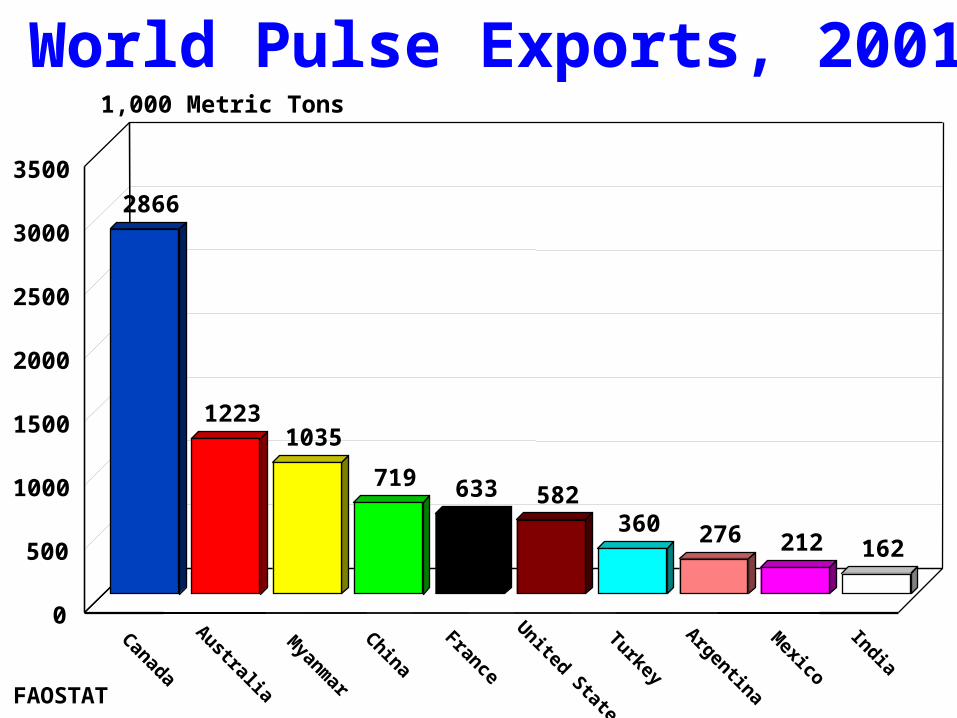
World Pulse Exports, 2001
FAOSTAT
2866
12231035
719 633 582360 276 212 162
Canada
Australia
Myanm
ar
China
France
United States
Turkey
Argentina
Mexico
India
0
500
1000
1500
2000
2500
3000
3500
1,000 Metric Tons

World Pulse Imports, 2001
FAOSTAT
2424
768
451 421 371 371 319 235 228 219
IndiaSpain
Belgium
ItalyPakistan
Egypt
Bangladesh
China
Netherlands
U.S.
0
500
1000
1500
2000
2500
3000
1,000 Metric Tons

World Pulse Trade & OutputWorld Pulse Trade & Output• Canada Dominates World Pulse
Exports, Volumes Nearly Triple Australia, Myanmar
• India Dominates Imports, EU, Middle East, United States
• China, France, United States Are Second Tier Exporters
• India Dominates Production, Triple China, Four Times Brazil

NAFTA Pulse Yields
Source: FAO, FAOSTAT Database
19901991
19921993
19941995
19961997
19981999
20002001
2002
0
0.5
1
1.5
2
2.5
Metric Tons per Hectare
Canada Mexico USA

NAFTA Pulse Production
Source: FAO, FAOSTAT Database
0
1
2
3
4
5
Million Metric Tons
Canada Mexico USA

NAFTA Yields & OutputNAFTA Yields & Output• Pulse Yields in Canada & U.S.
Double Yields in Mexico
• Influences of Ejidatarios on Technology Adoption, Productivity
• Inelastic Supply Response Hypothesis for Mexico
• Role of Mexico’s Farm Policy– $43/acre payment for < 5 hectares

NAFTA Pulse Imports
Source: FAO, FAOSTAT Database
19901991
19921993
19941995
19961997
19981999
20002001
0
50
100
150
200
250
300
350
400
1000 Metric Tons
Canada Mexico USA

NAFTA Pulse Exports
Source: FAO, FAOSTAT Database
19901991
19921993
19941995
19961997
19981999
20002001
0
500
1000
1500
2000
2500
3000
1000 Metric Tons
Canada Mexico USA

NAFTA Pulse TradeNAFTA Pulse Trade• Canada Dominates Trade: 80% of
Exports• U.S. & Mexico Growing as
Importers• U.S. Prices on Downward Trend
Over Most of 1990s• Drought in Canada & Stronger
Export Demand Stimulated Recent Price Increases

U.S. Farm Price for Pulses, 1994-03
ERS, USDA, Vegetables/Melons Outlook, VGS-295, Feb. 25, 2003
1994 1997 2000 2003$0.00
$5.00
$10.00
$15.00
$20.00
$25.00
Lentils Yellow Peas Dry Beans Green Peas
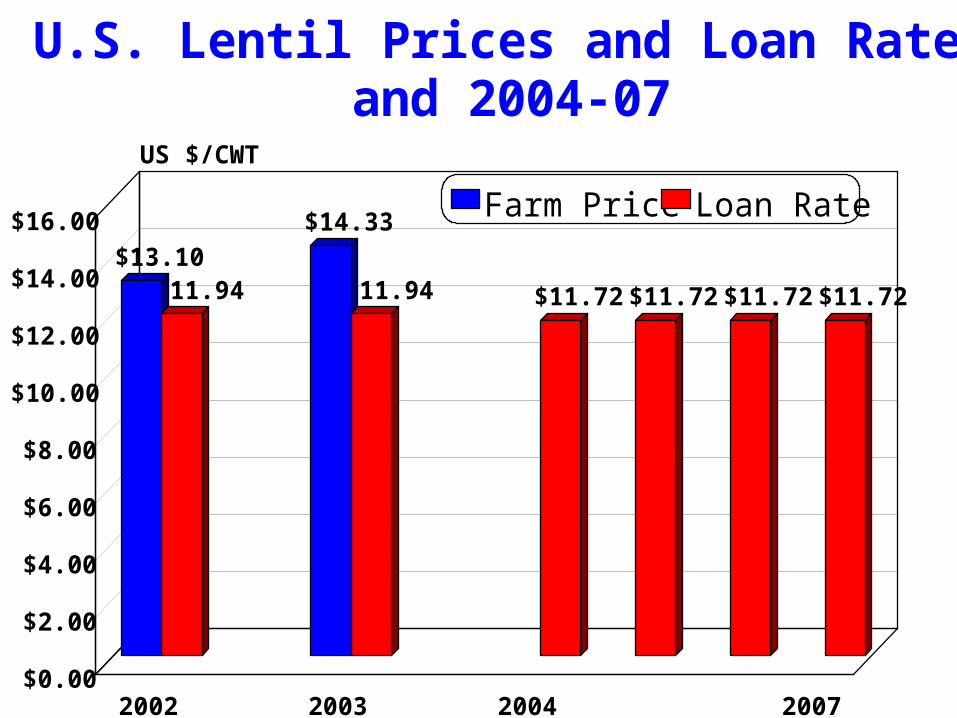
U.S. Lentil Prices and Loan Rates, 2002-03 and 2004-07
$13.10
$14.33
$11.94 $11.94 $11.72 $11.72 $11.72 $11.72
2002 2003 2004 2007$0.00
$2.00
$4.00
$6.00
$8.00
$10.00
$12.00
$14.00
$16.00
US $/CWT
Farm Price Loan Rate

U.S. Dry Pea Prices and Loan Rates, 2002-03 and 2004-07
$8.13$8.43
$6.33 $6.22 $6.22 $6.22 $6.22 $6.22
2002 2003 2004 2007$0.00
$2.00
$4.00
$6.00
$8.00
$10.00
US $/CWT
Farm Price Loan Rate
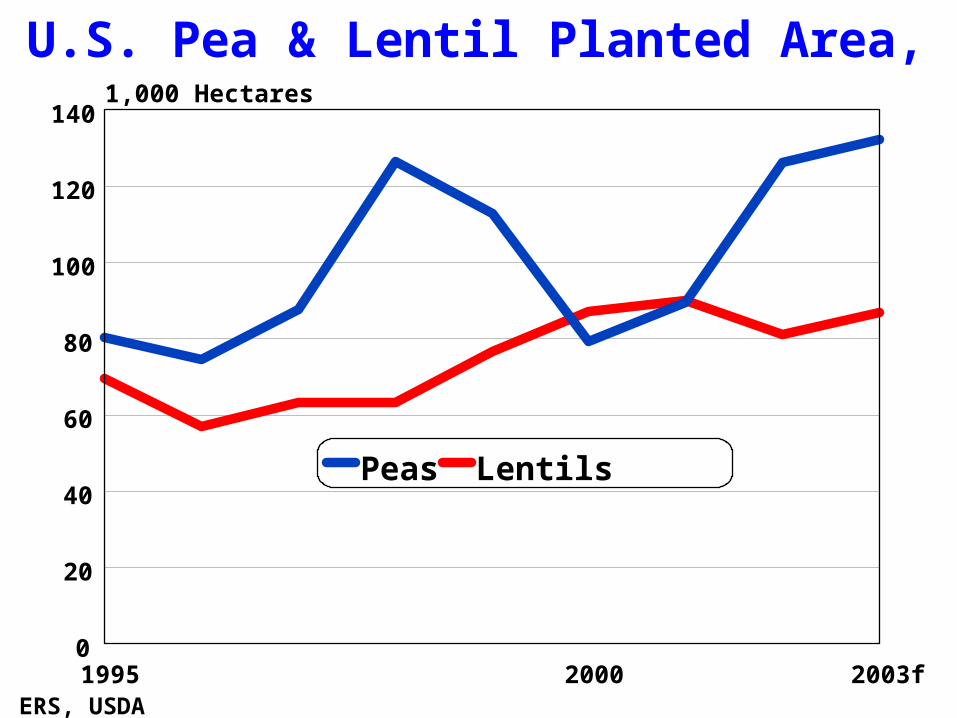
U.S. Pea & Lentil Planted Area, 1995-2003f
ERS, USDA1995 2000 2003f0
20
40
60
80
100
120
1401,000 Hectares
Peas Lentils

U.S. Lentil/Pea and Dry Bean Area
ERS, USDA, 4/17/03 & FAOSTAT: Dry Beans are Planted Area, others are Harvested Area.
1995 2000 2003f0
200
400
600
800
1000
1,000 Hectares
Total Lentils & Peas Dry Beans
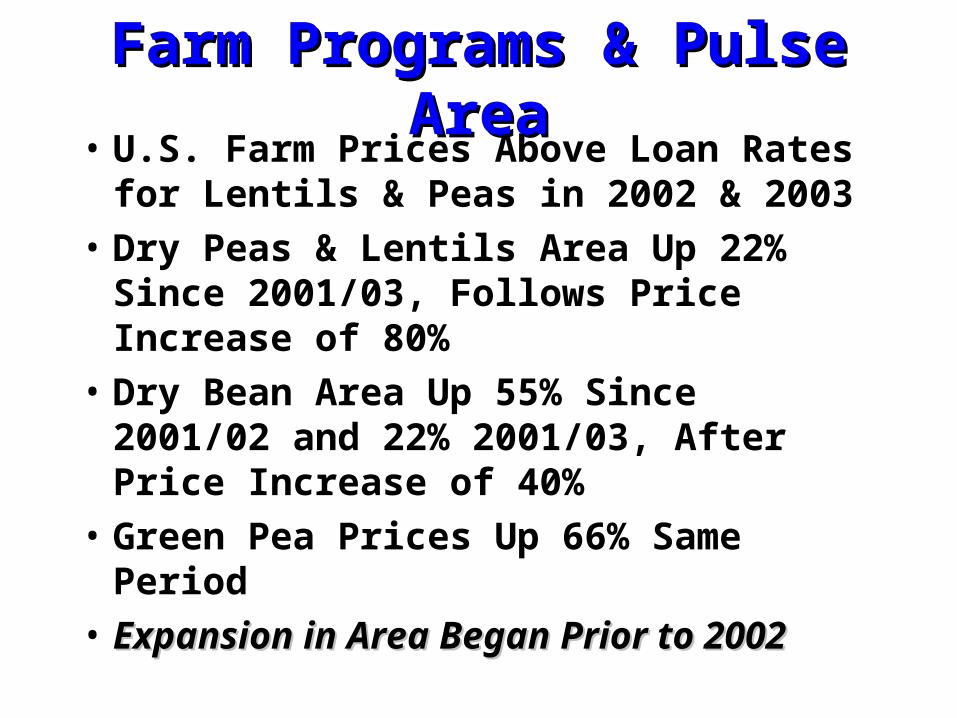
Farm Programs & Pulse AreaFarm Programs & Pulse Area• U.S. Farm Prices Above Loan Rates for
Lentils & Peas in 2002 & 2003
• Dry Peas & Lentils Area Up 22% Since 2001/03, Follows Price Increase of 80%
• Dry Bean Area Up 55% Since 2001/02 and 22% 2001/03, After Price Increase of 40%
• Green Pea Prices Up 66% Same Period
• Expansion in Area Began Prior to 2002Expansion in Area Began Prior to 2002

Potential for Trade Disputes• Corn in Mexico: NAFTA Ten Year
Anniversary– U.S. Corn Exports Up 5 Fold since early 1990s– Social Unrest, But Duties Still 90.8%– Mexican Corn Output Down 6% Since 1993– Rainfed Corn Up 22%– Irrigated Corn Down 37%
• Prices in Mexico Down 38% since 1993• 30% of Rainfed Corn is Grown on Ejidos
– Rainfed Corn Represents 70-80% of Total
• 20% Tax on Soft Drinks Made w/HFCS
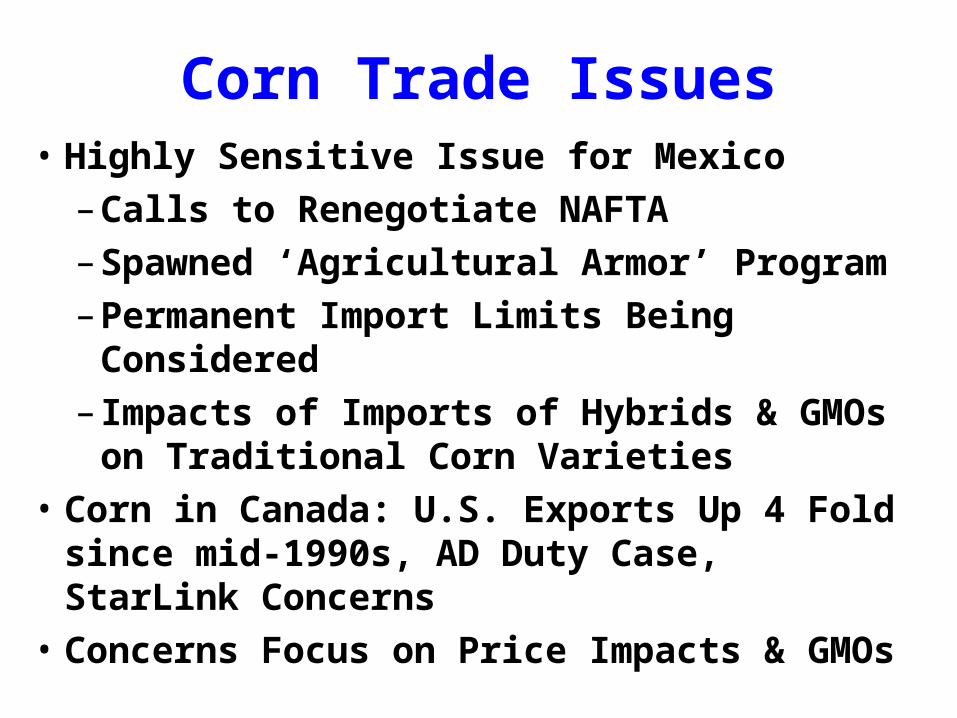
Corn Trade Issues• Highly Sensitive Issue for Mexico
– Calls to Renegotiate NAFTA
– Spawned ‘Agricultural Armor’ Program
– Permanent Import Limits Being Considered
– Impacts of Imports of Hybrids & GMOs on Traditional Corn Varieties
• Corn in Canada: U.S. Exports Up 4 Fold since mid-1990s, AD Duty Case, StarLink Concerns
• Concerns Focus on Price Impacts & GMOs

Pulse Crops in Farm ProgramPulse Crops in Farm Program
• U.S. Loan Rates Below Market
• Most of Area Expansion Driven by Higher Market Prices
• Drought in Canada & Increased Exports Stimulated Output
• Dry Beans & Peas Traded Most
• Situation Could Change Rapidly

Pulse Trade IssuesPulse Trade Issues• Crop Substitution or Rotation Appear Most
Likely if Pulse Area Expands• Limiting Factors:
– High Market Prices for Pulses & Program Crops– Loan Rates for U.S. No. 1 Quality– Specialized Handling & Market Information– Cultural Practices
• Positive Factors:– Loan Rates Set Lower Limit– Pulses Fix Nitrogen, so Used in Rotation– Cattle Prices
• No Immediate Expansion, Long Term More Difficult to Predict

Dry BeansDry Beans• Mexico Has Doubled Dry Bean Imports
– NAFTA Primary Source: 60-70%
• Prices Down 10-25%
• Expanding World Output Placed Downward Pressure on Prices
• Mexico Supports Dry Beans with Area Payments: $38/acre or $43/acre

Dry Bean Trade IssuesDry Bean Trade Issues• Dry Beans Used in Rotation to Fix
Nitrogen, Improve Soil Structure
• If Wheat, Corn Area Expand Due to U.S. Farm Programs, Will that Stimulate Dry Bean Area?
• Phytosanitary Issues & Under Invoicing by Exporters Noted As Problems by Mexico

Conclusions & ImplicationsConclusions & Implications
• Extent of Trade Disputes/Disruptions– Crop Substitution– Cattle Production Cycles, Herd Rebuilding
& More Normal Weather– Uses of Pulses in Rotation & as Animal
Feeds
• Farm Program Changes in Mexico & Canada May Mitigate Whatever Impacts Occur
• Can’t Ignore World Supply/Demand Balance

Conclusions & ImplicationsConclusions & Implications• Environmental Issues Important
– GMO Concerns– Maintaining Traditional Mexican Corn
Varieties• Protectionist Sentiment is Growing in NAFTA• Farm Programs But One Factor
– Weather, SPS, Exchange Rates• Very Surprised If Trade Disputes Don’t
Increase in Frequency