policy evolution in the chinese ppp market: the shifting
TRANSCRIPT
sustainability
Article
Policy Evolution in the Chinese PPP Market:The Shifting Strategies of GovernmentalSupport Measures
Yubo Guo 1 , Igor Martek 2 and Chuan Chen 1,*1 Business School, Sichuan University, Chengdu 610065, China2 School of Architecture and Built Environment, Deakin University, Geelong, Victoria 3220, Australia* Correspondence: [email protected]
Received: 16 August 2019; Accepted: 31 August 2019; Published: 6 September 2019�����������������
Abstract: Much attention has been paid world-wide to the advancement of policy with regard topublic–private partnerships (PPPs). Though PPPs continue to play a major role in the developmentof China’s national economy, capital projects and infrastructure upgrade, little work has been done tounderstand the evolution of Chinese governmental policy with regard to PPPs. This paper addressesthis lack and sets out the trajectory of Chinese PPP policy maturation over the period of 1986 to2018. Policy documents were retrieved from official government websites, such as the Ministryof Finance and National Development and Reform Commission, with some 205 policy statementsdeemed relevant to PPPs. These were then classified by type and submitted to regression analysis.Five major instruments in support of PPPs were identified, including fiscal, financial, taxation,land and operations support. Moreover, four historical policy phases can be identified in the ChinesePPP market, including ‘try’, ‘explore’, ‘expand’ and ‘consolidate’. While governmental policy maynow be considered sophisticated, deficiencies remain, including insufficient policy coordinationbetween departments, lack of financial incentives and poor transparency and disclosure supervision.These observations will inform policy makers as they look to continue advancement of PPP policymeasures, and help practitioners in assessing the pitfalls of operating in the Chinese PPP market.
Keywords: PPP policy; PPP market; policy evolution; policy impacts; China; Chinese PPP projects
1. Introduction
Public–private partnerships (PPPs) have been discussed in several academic articles, and manyresearchers and practitioners define PPP in various concepts [1–3]. In China, partnerships identifiedas PPP are generally defined as a ‘long-term cooperation’ between government at all levels and ofsocial capital [4,5]. Although PPP is delivered in various forms, providing public facilities or servicesis the core of China’s PPP. Therefore, PPP is defined in the present study as ‘a long-term cooperationbetween government and social capital, for providing public assets or services, in which both sidesshare risks and benefits.’ In comparison to traditional public procurement, PPP can accomplish‘the optimum combination of whole life costs and quality’, which also means value for money (VFM)for infrastructure projects [6,7].
PPP has been widely applied in infrastructure development in developed and developingcountries [8]. In the U.K. and Australia, the government encourages PPP as a delivery form ofinfrastructure. For example, a total of 715 current Private Finance Initiative (PFI) and Private Finance 2(PF2) projects have been managed as of 31 March 2017 in the U.K. [9,10]. In addition, PPP is popular andhas been utilised widely for the development of infrastructure projects in many developing countriesbecause of the strained financial situation [11]. In China, a total of 4815 projects have been managed,with an investment of ¥7.3 trillion by the end of 31 January 2019 [12].
Sustainability 2019, 11, 4872; doi:10.3390/su11184872 www.mdpi.com/journal/sustainability

Sustainability 2019, 11, 4872 2 of 24
PPP development in China has gone through several stages [13]. Such development has affectedpolicymaking and has been seemingly impacted by government policy. Over the exploration period,open market policies attracted foreign investors. Policies on local debt management and franchisingaffected the initiation of PPP projects in the expansion and fluctuation phase. Moreover, this interactionwas particularly striking when PPP was in the boom and normative development phases. For example,PPP projects had explosive growth after the policy document ‘Notice on issues related to the promotionand application of public–private partnerships’ was published [5]. Then, the China Public–PrivatePartnerships Center (CPPPC) was established to promote PPP development and collect data of PPPprojects in China [14]. PPP policy has a remarkable impact on the PPP market because of certainspecial features of PPP development in China. Such features include PPP projects mainly initiated bythe government, state-owned enterprise (SOE) participation and infrastructure project institutions ofChina [12]. Local finance was not enough to construct infrastructure and meet the needs of economicdevelopment in many places. More than 90% of PPP projects were initiated by local governmentsin China [12]. SOEs are subject to PPP policies or other aspects. Local governments and SOEs aresensitive to policies, especially national-level policies.
The study of policy has a long history, and researchers focus on the comprehensive impact ofpolicy in different areas. However, studies on PPP policy are limited [15–19]. PPP policy is one ofthe critical factors for PPP success, and PPP performance is affected by the institution and politicalbackground [20–22]. Good government credibility supported by a clear law and policy system isconducive to the formulation and implementation of long-term PPP commitments [23]. Osei–Kyeiand Chan declared that proper policy actions, strong government commitments and clear regulatoryguidelines were necessary to realise PPP’s full applicability [24]. On the one hand, understandingthe impacts can help policymakers make good decisions on issuing PPP-related policies. On theother hand, knowledge of what kinds of measures play important roles and how policies work canhelp private sectors, including SOEs, make good decisions on whether, when and how to invest PPPprojects. However, students and practitioners rarely pay attention to the impacts of policies on thePPP market. One of the important aims of this research is to answer how PPP policies impact China’sPPP project market. Considering the continuity and source of each policy, policies over each phase ofPPP development should be analysed from the evolutionary perspective in an effort to answer howpolicies impact the PPP market. As a point of departure from the earlier work of Chen et al., detailedpolicy measures and PPP market performance should be taken into account [25]. Therefore, the twoobjectives of this article are as follows:
1. What were the drivers of Chinese PPP policy evolution between 1986 and 2018, as evidenced inChina-based policy documents and regulatory measures?
2. How do PPP policies impact the PPP market in China?
The first objective is to illustrate how PPP policies begin, and how these policies evolve into thestatus quo. The relationship of PPP policy evolution and the macro market environment can be furtherunderstood within the study process of this objective. In this study, an advanced analytical frameworkbased on previous studies was adopted. Considering the inherent nature, policies were dividedinto two parts ‘policy documents’ and ‘policy measures’, both of which were subdivided into fourdimensions ‘policy types’, ‘policy issuing departments’, ‘policy measure types’ and ‘policy measurestrengths’. These four dimensions were utilised to analyse the evolution of PPP policies between 1986and 2018. Notably, the main research material of the current study is central-government PPP policydocuments. The second research objective is to explore what kinds of policy measures remarkablyimpact the PPP market and whether these impacts are positive or negative. Multiple regressiontechnology was applied to this objective.
Sustainability 2019, 11, 4872 3 of 24
2. Literature Review
Scholars have reached a consensus in regard to the PPP policy that a conducive legal, policy andinstitutional framework can support PPP development and implementation [20,23,26,27]. The needto study PPP policies has been confirmed by Petersen, Reeves, Greve and Hodge, and Klijn andTeisman [28–31]. For example, the impact of PPP practices on sustainable development is evidentlya necessary area of PPP research [32–34]. Following the evolution of PPP in the 1980s, a differentspectrum of PPP models has been implemented in China [35,36]. Such various terms of PPP literallytranslate as the cooperation between governments and social capitals in China, both of which areadjusted by PPP-related policies issued by the government. Many studies on PPP pay attention to thesetopics, including financing, risk allocation, critical success factors and others [37]. Literature focusingon PPP policy is limited. However, many PPP-related studies mention PPP policy in a certain way.
Petersen reviewed studies about PPP policies and regulation aspects and adopted the multiplestreams model method to conclude the policy evolution in Denmark and Ireland [28]. However,China is different from Denmark or Ireland because of the socialist market economy system andstrong government. A reasonable amount of studies about PPP policy evolution come from the publicmanagement and political research area. Willems and Van Dooren pointed out that PPP policies aregoing to evolve into having a depoliticisation tendency [38]. However, this conclusion is based onthe analysis of western democratic countries. Similarly, Mouraviev and Kakabadse put forward aPPP policy paradigm on the basis of policy paradigm theory and Russian practice. Such a paradigmincludes ideas, government responsibilities and institutional capacities [39]. Almost all of thesestudies were established in the western electoral politics context. The particular background of highlycentralised China is not the main theme of these studies. Although certain scholars pay attentionto China’s PPP policies, a research gap exists in PPP policy evolution, that is, the macroeconomicenvironment is almost ignored. Chen et al. studied the evolution of China’s PPP-related policies froma sustainable perspective [25]. In another paper, the PPP policy evolution is understood from thepolicy-learning pattern perspective [40]. Ke et al. reviewed China’s PPP policies between 2014 and2017 through the content analysis method and pointed out that the application of three policy tools isunbalanced [41]. This article does not provide a complete explanation of this phenomenon, althoughquantitative analysis of the policy text by coding is a valuable approach. Wang also conducted a similarstudy [42]. No answer is given for how China’s PPP policies evolve on the macroeconomic aspect andhow policymakers adjust these policies facing feedback of the PPP market. Cheng et al. adopted afour-phase division to illustrate the evolution of PPP in China [13]. However, this division was basedon the number change of PPP projects, whereas policy documents were not considered in the evolutionof PPP. Moreover, the evolution of China’s PPP policies was divided into three phases on the basis ofthe number change of PPP policy documents through two analysis dimensions (PPP for sustainabledevelopment and PPP via a sustainable approach) [25]. Factors of the centralised Chinese governmentand domestic macroeconomic environment should be considered when dividing the stages of PPPpolicy evolution.
Studies on the evaluation of PPP policy impact are limited. However, considerable researchfocuses on other areas, such as electricity, innovation and photovoltaic industry policies [15,18,43–46].Regulatory impact assessment (RIA) has been adopted by the EU, the USA and other developedcountries to evaluate the impact of laws and policies in an ex-ante or ex-post way [47,48]. Economic,social and environmental impacts are the central aspects and cost-effectiveness or risk analysis used tobe applied in this approach. However, this method is often used to evaluate an isolated policy and nota series of policies on the same theme [47,49]. Policy documents are the main research materials incertain studies [24,27,28,38,39,50–52]. Rothwell and Zegveld put forward a 3D (demand, environmentand supply) analytical framework [53]. This framework, based on policy content, has been used bycertain scholars to study policy impact [46]. Ke et al. combined this 3D analytical framework with PPPproject stages to analyse China’s PPP policy content [41]. The limitation of such analytical dimensionsbased on policy content is that these dimensions do not fully reflect the message of policy documents.
Sustainability 2019, 11, 4872 4 of 24
Schneider and Ingram pointed out that policy context should play an important role in analysing policyimpact [54]. Garcez adopted a simplified analytical framework, including three steps: policy context,design and evaluation [44]. However, the difference of each policy document was ignored, whereas theintegrity of a series of policy contexts about distributed electricity generation was considered. Hence,policy content and background have become the basis of evaluating PPP policy impact, and policyis seen as a combination of documents and measures. According to policy content and background,Wang et al. divided wind power policy measures of China into three types and 12 subtypes [55].Furthermore, they adopted the COPA (policy contents, outlook, power and authorities) framework toanalyse these policies. Similarly, Long et al. adopted four types and 14 subtypes of China’s photovoltaicindustry policy [56]. They all focused on nation-level policies published by the central governmentand its ministries. This feature is a common character between PPP and other policies inside thesestudies. In addition, Geddes and Wagner concluded 13 elements of PPP laws, but this division wasbased on local state laws [57]. Departments of policy, types or ranks of policy, policy elements ormeasures based on policy content are the key dimensions in policy impact evaluation framework inthese studies. Table 1 shows the analytical dimensions applied in the present study.
Table 1. Analytical dimensions applied in this article.
Analytical Dimensions Brief Description Modified By
Policydocuments
Policy types Representing official ranks of eachpolicy effectiveness.
Policy outlook [55], policy efforts [58]and policy type [56].
Policy issuingdepartments
The signed departments of thepolicy document.
Policy authorities [55] and policyissuing departments [56,59,60].
Policymeasures
Policy measuretypes
Classified by policy contents,including specification measures(SM), industrial supervisionmeasures (ISM), governmentincentive and pilot measures(GIPM) and governmentsupporting measures (GSM).
Industrial policy category [61],central government policy types [62],policy tool [41], key provisions of PPPlaws [51,57] and policymeasures [63,64]
Policy measurestrengths
Representing the strengths of eachmeasure from experts’ comments.
Policy strengths [55,56] and policyeffectiveness [65].
3. Research Methodology
The study was conducted in three steps. Firstly, policy documents and PPP market data werecollected. Secondly, the evolution of policies in each analytical dimension was investigated. Finally,the impacts of PPP policies on the PPP market were evaluated through four dimensions based onmultiple regression technology. Figure 1 shows the detailed research steps.
3.1. Data Collecting
Data collection proceeded as a two-step process. Firstly, PPP policies, as issued by the Chinesegovernment, were retrieved from all available websites and source outlets. In the following step, thesepolicies were analysed by type, issuing department, and the measures being enacted. The process isset out below.
3.1.1. PPP Policy Documents
China’s PPP policies were retrieved and collected. Such policies were published in official websitesof the State Council (SC), Ministry of Finance (MoF) and National Development and Reform Commission(NDRC) between 1986 and 2018. Certain keywords were used to search on the ‘Policy Release’ section(or other sections with similar function) of the official websites to ensure the relativity of policies and PPP.These keywords included the following: PPP, public–private partnerships; built-operate-transfer (BOT);built-transfer (BT); transfer-operate-transfer (TOT); other Chinese words translated as government

Sustainability 2019, 11, 4872 5 of 24
debt; private capital and so on. Once any keyword was in a policy document, such a keyword wouldbe recorded in the initial list. Then, apparently unrelated policies were eliminated by browsing throughthe policy text. Finally, 205 policy documents were accessed into further analysis. The filtered criteriaare as follows:
• National PPP policies issued by the SC and its constituent departments were selected.Hence, provincial and regional policies were not included.
• Regulations, opinions and other formal policy documents (i.e., notifications) were selected.Thus, reports and other informal documents were not included.
• Policies which are related to PPP development, either direct or significant indirect relationships,were selected.
Sustainability 2019, 11, x FOR PEER REVIEW 5 of 24
Keyword Search
Initial Policies
Target Policies
Policy Impacts
Policy Evolution
PPP Market Data
CPPPC Database
Web Crawler
Analytical dimensions
Visual Examination
Policy Publish Module on Government Official Website
Policy data
Descriptive Statistics and Qualitative Analysis
Multiple Regression
Figure 1. The steps throughout this research (modified by [66,67]). CPPPC: China Public–Private
Partnerships Center, PPP: public–private partnership.
3.1. Data Collecting
Data collection proceeded as a two-step process. Firstly, PPP policies, as issued by the Chinese government, were retrieved from all available websites and source outlets. In the following step, these policies were analysed by type, issuing department, and the measures being enacted. The process is set out below.
3.1.1. PPP Policy Documents
China’s PPP policies were retrieved and collected. Such policies were published in official websites of the State Council (SC), Ministry of Finance (MoF) and National Development and Reform Commission (NDRC) between 1986 and 2018. Certain keywords were used to search on the ‘Policy Release’ section (or other sections with similar function) of the official websites to ensure the relativity of policies and PPP. These keywords included the following: PPP, public–private partnerships; built-operate-transfer (BOT); built-transfer (BT); transfer-operate-transfer (TOT); other Chinese words translated as government debt; private capital and so on. Once any keyword was in a policy document, such a keyword would be recorded in the initial list. Then, apparently unrelated policies were eliminated by browsing through the policy text. Finally, 205 policy documents were accessed into further analysis. The filtered criteria are as follows:
• National PPP policies issued by the SC and its constituent departments were selected. Hence, provincial and regional policies were not included.
• Regulations, opinions and other formal policy documents (i.e., notifications) were selected. Thus, reports and other informal documents were not included.
• Policies which are related to PPP development, either direct or significant indirect relationships, were selected.
3.1.2. PPP Market Data
Total investment data were derived from CPPPC, which established a national comprehensive PPP project information platform on the website. The information platform has an ‘administrative database’, including active PPP projects and a ‘reserve database’, including preparing projects. The
Figure 1. The steps throughout this research (modified by [66,67]). CPPPC: China Public–PrivatePartnerships Center, PPP: public–private partnership.
3.1.2. PPP Market Data
Total investment data were derived from CPPPC, which established a national comprehensive PPPproject information platform on the website. The information platform has an ‘administrative database’,including active PPP projects and a ‘reserve database’, including preparing projects. The ‘administrativedatabase’ became the data resource to reduce the influence of inactive projects on data reliability. Theamount of investment in each quarter was added up to form time-series data as an explained variableof regression equation according to the initiating time of each project.
3.2. Analytical Dimensions
3.2.1. Policy Types
According to different ranks of policy effectiveness and different statements on the title of policydocuments, four types were defined as follows: (1) notifications that do not possess the followingtaxonomic characteristics; (2) opinions, outlines, planning and handbook and interim provisions issuedby each ministry and commission (‘measures’ for short); (3) interim regulations and rules promulgated
Sustainability 2019, 11, 4872 6 of 24
by the SC, including the regulations, rules, decisions and measures of ministries (‘opinions and rules’for short); (4) regulations issued by the SC and the orders of ministries (‘regulations and orders’ forshort). Similar to policy measures, policy type was also valued by a dummy binary variable. If a policybelongs to a type, then the variable was assigned a value of 1; otherwise, a value of 0 was assigned.
3.2.2. Policy Issuing Departments
Dozens of departments issued PPP-related policies, but most of them barely released even a fewpolicies. Meanwhile, the SC, MoF and NDRC issued approximately 80% of the policies. Consideringthis situation, these three departments became the main policy issuing department variables. Otherdepartments (OD) were collectively set as variable OD in the regression estimation. When estimatingregression equation, this dimension had four variables, namely, SC, MoF, NDRC and OD. Similar topolicy measures and types, the virtual variable was also valued by binary variable (0 or 1). Moreover,certain policies were published by multiple departments, but usually a certain department takes thelead in the policy issuing process. Hence, the issuing department of each policy was only set by theleading department as the variable.
3.2.3. Policy Measure Types
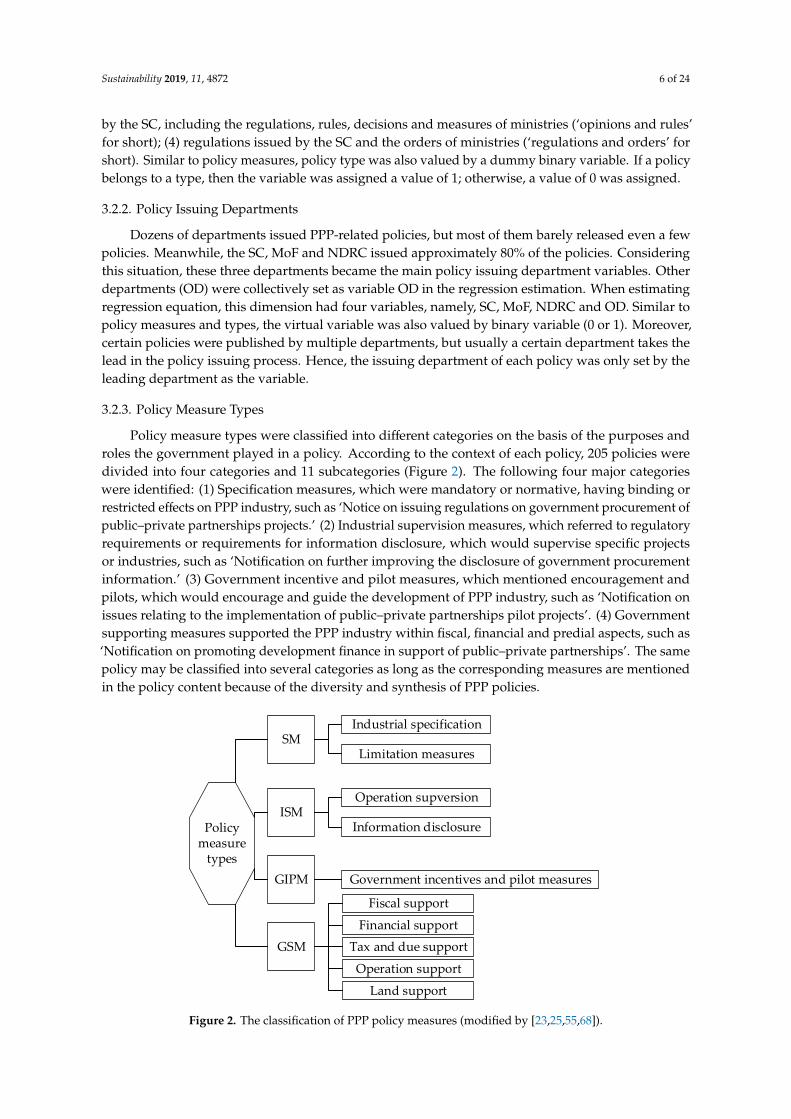
Policy measure types were classified into different categories on the basis of the purposes androles the government played in a policy. According to the context of each policy, 205 policies weredivided into four categories and 11 subcategories (Figure 2). The following four major categorieswere identified: (1) Specification measures, which were mandatory or normative, having binding orrestricted effects on PPP industry, such as ‘Notice on issuing regulations on government procurement ofpublic–private partnerships projects.’ (2) Industrial supervision measures, which referred to regulatoryrequirements or requirements for information disclosure, which would supervise specific projectsor industries, such as ‘Notification on further improving the disclosure of government procurementinformation.’ (3) Government incentive and pilot measures, which mentioned encouragement andpilots, which would encourage and guide the development of PPP industry, such as ‘Notification onissues relating to the implementation of public–private partnerships pilot projects’. (4) Governmentsupporting measures supported the PPP industry within fiscal, financial and predial aspects, such as‘Notification on promoting development finance in support of public–private partnerships’. The samepolicy may be classified into several categories as long as the corresponding measures are mentionedin the policy content because of the diversity and synthesis of PPP policies.Sustainability 2019, 11, x FOR PEER REVIEW 7 of 24
Industrial specification
Limitation measures
Operation supversion
Information disclosure
Operation support
Land support
Tax and due support
Financial support
Fiscal support
ISM
GIPM
SM
Government incentives and pilot measures
Policy measure
types
GSM
Figure 2. The classification of PPP policy measures (modified by [23,25,55,68]).
Policy measures were valued by a dummy binary variable to estimate the regression equation for step 3. If one kind of measure was adopted in a policy, then the variable was assigned a value of 1; otherwise, a value of 0 was assigned.
3.2.4. Policy Measure Strengths
Diverse policy measures had different levels of details and different degrees of correlations between a measure and PPP industry. Therefore, a standard was used on basis of details and correlations of measures. In addition, considering the policy effect sustained to subsequent periods until abolished or changed by another, policy strength was given in Equations (1) and (2). In both equations, i represents the quarter ( 𝑖 ∈ postive real number set 𝑅 ) and j represents policy measure (j ∈ 𝑅 ). 𝑄𝑀 𝑆 represents the quarterly measure’s strength of measure j in quarter i. 𝐴𝑀 𝑆 represents the accumulative measure’s strength of measure j up to quarter i. 𝑄𝑆 represents the quarterly strength of all measures in quarter i, and 𝐴𝑆 represents the accumulative strength of all measures up to quarter i. 𝐴𝑀 𝑆 = 𝑄𝑀 𝑆 + 𝑄𝑀 𝑆 , (1) 𝐴𝑆 = 𝑄𝑆 + 𝑄𝑆 . (2)
3.3. Multiple Regression Technology
The regression model was applied by Menz and Vachon [68]. They used this method to study the effectiveness of policy regimes for promoting wind power in the U.S. Another similar study determined the impacts of distributed electricity generation policy on the number and spatial distribution of the projects across states in Brazil through multiple regression technology [44]. Peng et al. used distributed lag regression with the help of the Cobb–Douglas production function model, and multiple regression was utilised by other literature [58]. All these studies have adopted a regression model method to evaluate policy impacts. The regression model is a proper method to measure policy impact. Moreover, in the PPP research area, no quantitative method has evaluated PPP policy impact, although Geddes and Reeves studied the impact of PPP policy on PPP investments [23]. They adopted a case study method, which is a good approach but lacks the evidence for quantitative data analysis.
Figure 2. The classification of PPP policy measures (modified by [23,25,55,68]).

Sustainability 2019, 11, 4872 7 of 24
Policy measures were valued by a dummy binary variable to estimate the regression equation forstep 3. If one kind of measure was adopted in a policy, then the variable was assigned a value of 1;otherwise, a value of 0 was assigned.
3.2.4. Policy Measure Strengths
Diverse policy measures had different levels of details and different degrees of correlations betweena measure and PPP industry. Therefore, a standard was used on basis of details and correlations ofmeasures. In addition, considering the policy effect sustained to subsequent periods until abolished orchanged by another, policy strength was given in Equations (1) and (2). In both equations, i representsthe quarter (i ∈ postive real number set R+) and j represents policy measure ( j ∈ R+). QM jSi representsthe quarterly measure’s strength of measure j in quarter i. AM jSi represents the accumulative measure’sstrength of measure j up to quarter i. QSi represents the quarterly strength of all measures in quarter i,and ASi represents the accumulative strength of all measures up to quarter i.
AM jSi = QM jSi−1 + QM jSi, (1)
ASi = QSi−1 + QSi. (2)
3.3. Multiple Regression Technology
The regression model was applied by Menz and Vachon [68]. They used this method to study theeffectiveness of policy regimes for promoting wind power in the U.S. Another similar study determinedthe impacts of distributed electricity generation policy on the number and spatial distribution of theprojects across states in Brazil through multiple regression technology [44]. Peng et al. used distributedlag regression with the help of the Cobb–Douglas production function model, and multiple regressionwas utilised by other literature [58]. All these studies have adopted a regression model method toevaluate policy impacts. The regression model is a proper method to measure policy impact. Moreover,in the PPP research area, no quantitative method has evaluated PPP policy impact, although Geddesand Reeves studied the impact of PPP policy on PPP investments [23]. They adopted a case studymethod, which is a good approach but lacks the evidence for quantitative data analysis.
3.3.1. Variables and Data
Considering the following facts, multiple regression was adopted in the present study, and thedata scope of explanatory and explained variables was adopted between the third quarter of 2014and the second quarter of 2018. Firstly, the policy effective date was easily acquired because thedate of PPP projects could be searched. Starting date refers to the time the project was initiallyconsidered for promotion, neutralising the hysteresis effect of the policy. In addition, 2014 was awatershed. Few policies existed before 2014, and considerable policies existed after 2014. However,obtaining project data before 2014 was difficult. Even in a private–public infrastructure advisoryfacility, only financially closed PPI project data are available [69]. From the data processing perspective,many zeroes existed in explanatory variables before 2014, thus affecting the accuracy of regressionresults. At the same time, the research objective was to explore how China’s PPP policies impact thePPP industry. This regression method and data selection already meet the requirements.
The evaluation of China’s PPP policies on the PPP market was also initiated from those fourdimensions. Generally, total investments were used to described projects’ market status [10,69]. Whileother indicators have been used in similar studies [44,65], in executing this study, a major considerationwas data availability. Here, quarterly total investment was selected for each regression equation’sexplanatory variable, being suitable, consistent with precedent and, importantly, retrievable. Moreover,the degree of total investment is indicative of the level of financing and stakeholder involvement,and is thus a suitable reflection of PPP market conditions. The virtual variable of policy measures thattotalled up in quarters served as the explanatory variable, and the policy type and issuing departments

Sustainability 2019, 11, 4872 8 of 24
were similar. Furthermore, the scored policy strength variable was acquired by calculation. Table 2shows the list of variables used by regression mode.
Table 2. List of variables. INV: independent variable, SC: State Council, MoF: Ministry of Finance,NDRC: National Development and Reform Commission, OD: other departments.
Variable Brief Description Data Source
Dependent variables
INV Quarterly total investments of PPP projects in China CPPPC Database
Independent variables
N/M/OR/RO Quarterly total number of notices/measures/opinionsand rules/regulations and orders on PPP policies inChina.
Government officialwebsite
MoF/NDRC/SC/OD Quarterly total number of PPP policies issued byMoF/NDRC/SC/OD.
Government officialwebsite
SMIS/SMLM/ISMOS/ISMID/GIPM/GSMFS/GSMFIS/GSMTDS/GSMLS/GSMOS
Quarterly total frequency of Industrialspecification/limitation/operationsupervision/information disclosure/governmentincentive and pilot measures/fiscal support/financialsupport/tax and due support/land support/operationsupport measures mentioned by PPP policies.
Government officialwebsite
SSMIS/SSMLM/SISMOS/SISMID/SGIPM/SGSMFS/SGSMFIS/SGSMTDS/SGSMLS/SGSMOS
Accumulative quarterly strength of industrialspecification/limitation/operationsupervision/information disclosure/governmentincentive and pilot measures/fiscal support/financialsupport/tax and due support/land support/operationsupport measures.
Expert comments
3.3.2. Model Estimation
The forms of the model estimated in the analysis can be written as follows, in Equation (3) throughEquation (6):
Ln (INV) = βt0 + βt1N + βt2M + βt3OR + βt4RO + εt, (3)
where N, M, OR and RO are the variables discussed in the table above. βt is the beta coefficient,indicating the effect of the independent variable on the dependent variable (INV), while maintainingall other factors constant. For example, βt1 indicates that the dependent variable (INV) changes by100 × βt % for each unit change of the independent variable, N, while maintaining all other factorsconstant. εt is the error term.
Ln (INV) = βid0 + βid1MoF + βid2NDRC + βid3SC + βid4OD + εid, (4)
where MoF, NDRC, SC and OD are the variables discussed in the table above. βid is the beta coefficient,indicating the effect of the independent variable on the dependent variable (INV), while maintainingall other factors constant. For example, βid1 indicates that the dependent variable (INV) changes by100 × βid % for each unit change of the independent variable, MoF, while maintaining all other factorsconstant. εid is the error term.
Ln (INV) = βmt0 + βmt1SMIS + βmt2SMLM + βmt3ISMOS + βmt4ISMID + βmt5GIPM +
βmt6GSMFS + βmt7GSMFIS + βmt8GSMTDS + βmt9GSMLS + βmt10GSMOS + εmt,(5)
where SMIS, SMLM, ISMOS, ISMID, GIPM, GSMFS, GSMFIS, GSMTDS, GSMLS and GSMOS arethe variables discussed in the table above. βmt, is the beta coefficient, indicating the effect of theindependent variable on the dependent variable (INV), while maintaining all other factors constant.
Sustainability 2019, 11, 4872 9 of 24
For example, βid1 indicates that the dependent variable (INV) changes by 100 × βmt % for each unitchange of the independent variable, MoF, while maintaining all other factors constant. εmt is theerror term.
Ln (INV) = βms0 + βms1SSMIS + βms2SSMLM + βms3SISMOS + βms4SISMID +
βms5SGIPM + βms6SGSMFS + βms7SGSMFIS + βms8SGSMTDS + βms9SGSMLS +
βms10SGSMOS +εms,(6)
where SSMIS, SSMLM, SISMOS, SISMID, SGIPM, SGSMFS, SGSMFIS, SGSMTDS, SGSMLS andSGSMOS are the variables discussed in the table above. βms is the beta coefficient, indicating theeffect of the independent variable on the dependent variable (INV), while maintaining all other factorsconstant. For example, βid1 indicates that the dependent variable (INV) changes by 100 × βms % foreach unit change of the independent variable, MoF, while maintaining all other factors constant. εms isthe error term.
For the independent variable, (INV), natural logarithms were adopted for the estimated models.This was because quarterly total investments are huge, exceeding millions of yuan, and therefore manyorders of magnitude above the comparable variables. Coefficients were estimated using ordinary leastsquares (OLS) methods. The software ‘Eviews’ was used in the regression estimation.
4. Data Analysis
The first step in analysing the data is to consider the vehicle of the policy itself—how remarkable itspotential impact is. Policies conveyed as notices, measures, opinions, rules or regulations have varyingdegrees of bearing on the Chinese PPP market. Similarly, each department has different concernsunder its jurisdictions. Hence, the departments issuing the policies also elicit variable attention fromthe marketplace. Finally, the nature of the measures, whether financial or operational, critically shapeschange in the market. These three steps are considered in the following analysis.
4.1. PPP Policy Types
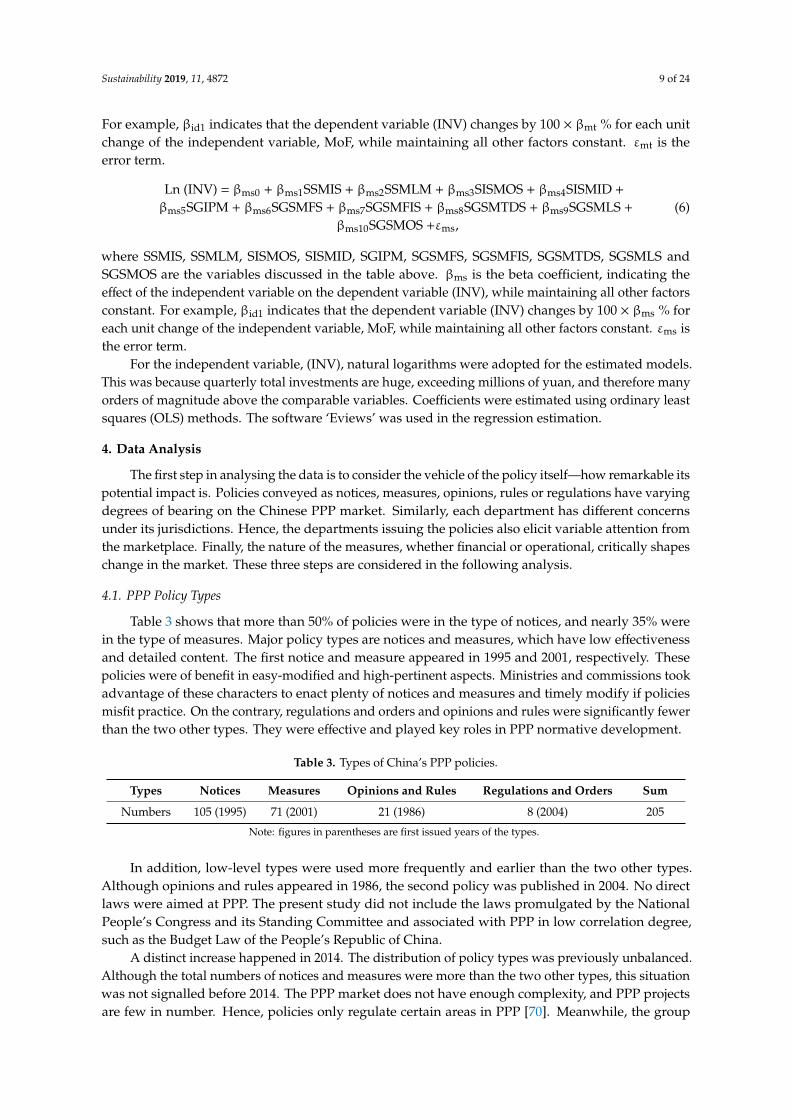
Table 3 shows that more than 50% of policies were in the type of notices, and nearly 35% werein the type of measures. Major policy types are notices and measures, which have low effectivenessand detailed content. The first notice and measure appeared in 1995 and 2001, respectively. Thesepolicies were of benefit in easy-modified and high-pertinent aspects. Ministries and commissions tookadvantage of these characters to enact plenty of notices and measures and timely modify if policiesmisfit practice. On the contrary, regulations and orders and opinions and rules were significantly fewerthan the two other types. They were effective and played key roles in PPP normative development.
Table 3. Types of China’s PPP policies.
Types Notices Measures Opinions and Rules Regulations and Orders Sum
Numbers 105 (1995) 71 (2001) 21 (1986) 8 (2004) 205
Note: figures in parentheses are first issued years of the types.
In addition, low-level types were used more frequently and earlier than the two other types.Although opinions and rules appeared in 1986, the second policy was published in 2004. No directlaws were aimed at PPP. The present study did not include the laws promulgated by the NationalPeople’s Congress and its Standing Committee and associated with PPP in low correlation degree,such as the Budget Law of the People’s Republic of China.
A distinct increase happened in 2014. The distribution of policy types was previously unbalanced.Although the total numbers of notices and measures were more than the two other types, this situationwas not signalled before 2014. The PPP market does not have enough complexity, and PPP projectsare few in number. Hence, policies only regulate certain areas in PPP [70]. Meanwhile, the group
Sustainability 2019, 11, 4872 10 of 24
of different policy types was enough to manage the PPP market of those years. However, in 2013,the central committee of the Communist Party of China decided to let the market play a decisive rolein the allocation of resources and allow the government play a better role than before [71]. This eventtriggered many private sectors of infrastructure and public service. Notices and measures rapidlyincreased to deal with a series of problems produced by the constantly emerging new projects. The twoother types of PPP policy were also in modest growth after 2014.
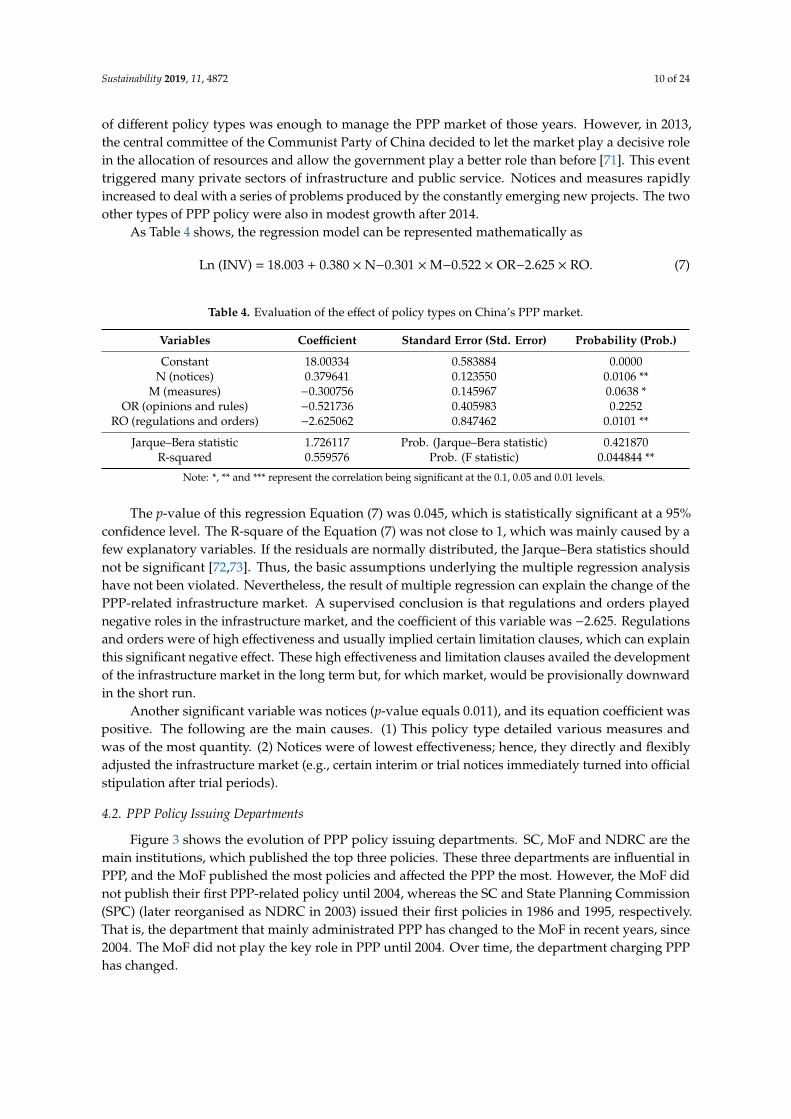
As Table 4 shows, the regression model can be represented mathematically as
Ln (INV) = 18.003 + 0.380 × N−0.301 ×M−0.522 × OR−2.625 × RO. (7)
Table 4. Evaluation of the effect of policy types on China’s PPP market.
Variables Coefficient Standard Error (Std. Error) Probability (Prob.)
Constant 18.00334 0.583884 0.0000N (notices) 0.379641 0.123550 0.0106 **
M (measures) −0.300756 0.145967 0.0638 *OR (opinions and rules) −0.521736 0.405983 0.2252
RO (regulations and orders) −2.625062 0.847462 0.0101 **
Jarque–Bera statistic 1.726117 Prob. (Jarque–Bera statistic) 0.421870R-squared 0.559576 Prob. (F statistic) 0.044844 **
Note: *, ** and *** represent the correlation being significant at the 0.1, 0.05 and 0.01 levels.
The p-value of this regression Equation (7) was 0.045, which is statistically significant at a 95%confidence level. The R-square of the Equation (7) was not close to 1, which was mainly caused by afew explanatory variables. If the residuals are normally distributed, the Jarque–Bera statistics shouldnot be significant [72,73]. Thus, the basic assumptions underlying the multiple regression analysishave not been violated. Nevertheless, the result of multiple regression can explain the change of thePPP-related infrastructure market. A supervised conclusion is that regulations and orders playednegative roles in the infrastructure market, and the coefficient of this variable was −2.625. Regulationsand orders were of high effectiveness and usually implied certain limitation clauses, which can explainthis significant negative effect. These high effectiveness and limitation clauses availed the developmentof the infrastructure market in the long term but, for which market, would be provisionally downwardin the short run.
Another significant variable was notices (p-value equals 0.011), and its equation coefficient waspositive. The following are the main causes. (1) This policy type detailed various measures andwas of the most quantity. (2) Notices were of lowest effectiveness; hence, they directly and flexiblyadjusted the infrastructure market (e.g., certain interim or trial notices immediately turned into officialstipulation after trial periods).
4.2. PPP Policy Issuing Departments
Figure 3 shows the evolution of PPP policy issuing departments. SC, MoF and NDRC are themain institutions, which published the top three policies. These three departments are influential inPPP, and the MoF published the most policies and affected the PPP the most. However, the MoF didnot publish their first PPP-related policy until 2004, whereas the SC and State Planning Commission(SPC) (later reorganised as NDRC in 2003) issued their first policies in 1986 and 1995, respectively.That is, the department that mainly administrated PPP has changed to the MoF in recent years, since2004. The MoF did not play the key role in PPP until 2004. Over time, the department charging PPPhas changed.

Sustainability 2019, 11, 4872 11 of 24
Sustainability 2019, 11, x FOR PEER REVIEW 11 of 24
4.2. PPP Policy Issuing Departments
Figure 3 shows the evolution of PPP policy issuing departments. SC, MoF and NDRC are the main institutions, which published the top three policies. These three departments are influential in PPP, and the MoF published the most policies and affected the PPP the most. However, the MoF did not publish their first PPP-related policy until 2004, whereas the SC and State Planning Commission (SPC) (later reorganised as NDRC in 2003) issued their first policies in 1986 and 1995, respectively. That is, the department that mainly administrated PPP has changed to the MoF in recent years, since 2004. The MoF did not play the key role in PPP until 2004. Over time, the department charging PPP has changed.
MoCon(4)
NDRC(42)
SPC(2)
SC(47)
MoFTEC(1)
MoF(63)
MoC(2)
MoHURD(9)
MoCom(1)
CBRC(3)
MoT(4)MoCA(3)
MoLR(3)
MoCul(1)CSRC(7)
SASAC(2)
MoIIT(1)
MoA(3)
MoNR(0)
CIRC(3)
MoARA(0)
CBIRC(1)
MoCT(1)PBC(1)
1986
1995
2002
2004
2005
2007
2014
2015
2016
2017
2018
NEA(1)
2010
Note: 1. The date on the left refers to the year of the first policy issued by the right corresponding department; 2. The dotted line indicates the departments’ evolution, the tip of the arrow points to the existing department; 3. The figures in parentheses are the number of policies issued by the department inside the box; 4. The abbreviation of the department’s name: The State Council (SC), State Planning Commission (SPC), Ministry of Foreign Trade and Economic Cooperation (MoFTEC), Ministry of Construction (MoCon), Ministry of Finance (MoF), Ministry of Communications (MoCom), Ministry of Commerce (MoC), National Development and Reform Commission (NDRC), China Banking Regulatory Commission (CBRC), Ministry of Transport (MoT), China Securities Regulatory Commission (CSRC), People’s Bank of China (PBC), National Energy Administration (NEA), Ministry of Civil Affairs (MoCA), State-owned Assets Supervision and Administration Commission (SASAC), Ministry of Housing and Urban-Rural Development (MOHURD), Ministry of Land and Resources (MOLR), Ministry of Natural Resources (MoNR), Ministry of Industry and Information Technology (MoIIT), China Insurance Regulatory Commission (CIRC), China Banking and Insurance Regulatory Commission (CBIRC), Ministry of Agriculture (MoA), Ministry of Agriculture and Rural Affairs (MoARA), Ministry of Culture (MoCul), Ministry of Culture and Tourism (MoCT).
Figure 3. Evolution of policy issuing departments between 1986 and 2018.
In 1986, the SC published the first policy, though it was not directly corresponding to PPP. At that time, nearly no concept of PPP in China existed. In the policy named ‘Rules about encouraging foreign investment’, various measures, including tax reduction and exemption, preferential loans and preferential land, were proposed to stimulate foreign investment. Certain foreign investors discovered opportunities in China; such a policy was basic and supported foreign capital entering
Figure 3. Evolution of policy issuing departments between 1986 and 2018. Note: 1. The date on theleft refers to the year of the first policy issued by the right corresponding department; 2. The dottedline indicates the departments’ evolution, the tip of the arrow points to the existing department; 3.The figures in parentheses are the number of policies issued by the department inside the box; 4. Theabbreviation of the department’s name: The State Council (SC), State Planning Commission (SPC),Ministry of Foreign Trade and Economic Cooperation (MoFTEC), Ministry of Construction (MoCon),Ministry of Finance (MoF), Ministry of Communications (MoCom), Ministry of Commerce (MoC),National Development and Reform Commission (NDRC), China Banking Regulatory Commission(CBRC), Ministry of Transport (MoT), China Securities Regulatory Commission (CSRC), People’s Bankof China (PBC), National Energy Administration (NEA), Ministry of Civil Affairs (MoCA), State-ownedAssets Supervision and Administration Commission (SASAC), Ministry of Housing and Urban-RuralDevelopment (MOHURD), Ministry of Land and Resources (MOLR), Ministry of Natural Resources(MoNR), Ministry of Industry and Information Technology (MoIIT), China Insurance RegulatoryCommission (CIRC), China Banking and Insurance Regulatory Commission (CBIRC), Ministry ofAgriculture (MoA), Ministry of Agriculture and Rural Affairs (MoARA), Ministry of Culture (MoCul),Ministry of Culture and Tourism (MoCT).
In 1986, the SC published the first policy, though it was not directly corresponding to PPP. Atthat time, nearly no concept of PPP in China existed. In the policy named ‘Rules about encouragingforeign investment’, various measures, including tax reduction and exemption, preferential loans andpreferential land, were proposed to stimulate foreign investment. Certain foreign investors discoveredopportunities in China; such a policy was basic and supported foreign capital entering China. The firstPPP project of China was Shajiao B Power Plant in Shenzhen in 1984, which was invested by a HongKong-based company [13]. However, no other PPP-related policy was established until 1995. The nextpolicy named ‘Notice on issues concerning the absorption of foreign investment in the form of BOT’was issued by the Ministry of Foreign Trade and Economic Cooperation (MoFTEC) (later reorganisedas Ministry of Commerce in 2003). This policy accelerated the development of BOT in the infrastructurearea, the Laibin B Power Plant Project and the Chengdu No. 6 Water Plant B Project, while other projectswere initiated gradually [74,75]. The SC, SPC, MoFTEC and Ministry of Construction (later reorganised

Sustainability 2019, 11, 4872 12 of 24
as Ministry of Housing and Urban–Rural Development (MoHURD) in 2008) played key roles in theexploration phase.
In 2004, MoF published ‘Administrative measures on bidding and tendering for governmentprocurement of goods and services’, which set up a series of procedures for government procurement.Although the policy was revised in 2017, the MoF successively issued a large number of policies from2004 to now, including several milestone policies. In addition, Figure 3 illustrates that the MoFTEC wasnot longer a key department in the PPP area since 2005. After 2004, the MoF became an indispensablepart for PPP development. One piece of evidence was that the PPP implementation handbook, VFMevaluation guideline and public fiscal capacity evaluation guideline were all published by the MoF.
As Cheng et al. called this phase ‘new boom’ from the end of 2013, PPP development suddenlysped up [13]. For example, ‘Opinions on strengthening the management of local government debt’published by the SC in 2014 was a key policy in PPP development history. Such a policy clearlyproposed permitting private sectors (known as ‘social capital’ in China) to participate in the investmentand operation of urban infrastructure through franchise and other means. Except for the SPC,which issued two policies in 1995 and 2001, the NDRC did not publish the next policy until 2014. The‘Guiding opinion on implementing public–private partnerships’ issued by the NDRC identified thescope of application of the PPP model and proposed a general PPP contract guideline. The NDRCbecame an important part of PPP development, except for the MoF. These two departments often jointlypublished PPP-related policies; at other times, policies issued by both departments were discrepant.For example, ‘Notice on regulating the administration of PPP contracts’ published by the MoF alsoattached a PPP contract guideline. These two guidelines were followed by projects administratedrespectively by the two departments.
Moreover, the OD issued certain important policies, such as the MoHURD’s published‘Measures for the administration of franchising of municipal public utilities (revised in 2014).’ The policyregulates municipal PPP projects in the areas of urban water, gas and heat supply, public transportation,sewage treatment, garbage treatment among others.
As Table 5 shows, the regression model can be represented mathematically as
Ln (INV) = 17.622−0.071 ×MoF + 0.323 × NDRC−0.340 × SC + 0.034 × OD. (8)
Table 5. Evaluation of the effect of policy issuing departments on China’s PPP market.
Variables Coefficient Std. Error Prob.
Constant 17.62152 0.925422 0.0000MoF −0.070559 0.197475 0.7276
NDRC 0.322681 0.286638 0.2842SC −0.340450 0.226993 0.1618OD 0.033544 0.126243 0.7954
Jarque–Bera statistic 3.311730 Prob. (Jarque–Bera statistic) 0.190927R-squared 0.272961 Prob. (F statistic) 0.433242
The result of regression estimation (Equation (8)) on policy issuing departments was insignificant.The residual series were normally distributed. The following results are explained: (1) The study hadto regard departments, except for MoF, NDRC and SC, as OD that caused inadequate data points andrestricted the number of regression variables. (2) The issuing department of each policy was only setby the leading department as the variable. With regard to one policy, not only one leading departmentmay exist. All departments of a policy may be counted in variables, as several policies have dozens ofissuing departments yet not all of them matter. (3) Issuing departments might not play important rolesin the infrastructure market in essence.
Sustainability 2019, 11, 4872 13 of 24
4.3. PPP Policy Measure Types
Table 6 shows that government incentive and pilot measures (GIPM), specification measures(SM)–industrial specifications (SMIS) and government supporting measures (GSM)–financial support(GSMFIS) have been the top three measures for over 32 years.
Table 6. Measures of China’s PPP policies.
Measures Numbers Initial Issuing Year
SMSMIS (industrial specification) 66 2004SMLM (limitation measures) 22 2010
ISMISMOS (operation supervision) 23 1995ISMID (information disclosure) 17 2002
GIPM Government incentive and pilot measures 106 1986
GSM
GSMFS (fiscal support) 23 2010GSMFIS (financial support) 37 1995
GSMTDS (tax and due support) 11 1986GSMLS (land support) 11 2015
GSMOS (operation support) 18 1995
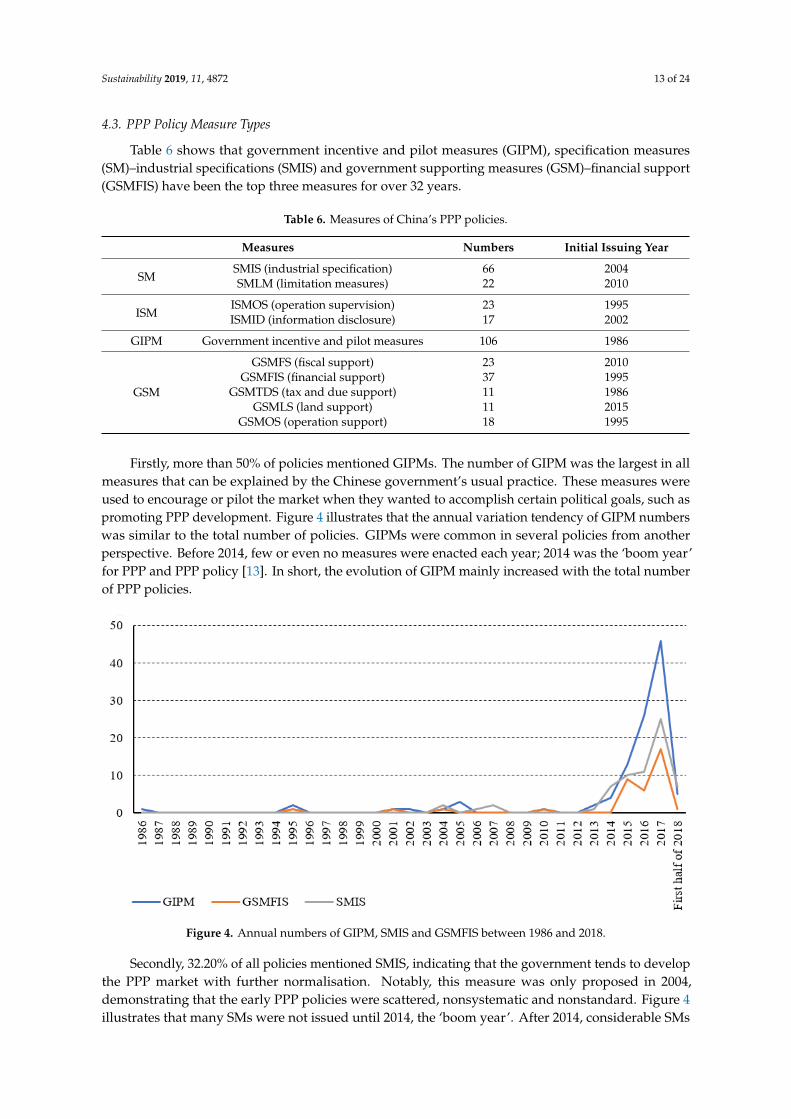
Firstly, more than 50% of policies mentioned GIPMs. The number of GIPM was the largest in allmeasures that can be explained by the Chinese government’s usual practice. These measures wereused to encourage or pilot the market when they wanted to accomplish certain political goals, such aspromoting PPP development. Figure 4 illustrates that the annual variation tendency of GIPM numberswas similar to the total number of policies. GIPMs were common in several policies from anotherperspective. Before 2014, few or even no measures were enacted each year; 2014 was the ‘boom year’for PPP and PPP policy [13]. In short, the evolution of GIPM mainly increased with the total numberof PPP policies.
Sustainability 2019, 11, x FOR PEER REVIEW 13 of 24
one leading department may exist. All departments of a policy may be counted in variables, as several policies have dozens of issuing departments yet not all of them matter. (3) Issuing departments might not play important roles in the infrastructure market in essence.
4.3. PPP Policy Measure Types
Table 6 shows that government incentive and pilot measures (GIPM), specification measures (SM)–industrial specifications (SMIS) and government supporting measures (GSM)–financial support (GSMFIS) have been the top three measures for over 32 years.
Firstly, more than 50% of policies mentioned GIPMs. The number of GIPM was the largest in all measures that can be explained by the Chinese government’s usual practice. These measures were used to encourage or pilot the market when they wanted to accomplish certain political goals, such as promoting PPP development. Figure 4 illustrates that the annual variation tendency of GIPM numbers was similar to the total number of policies. GIPMs were common in several policies from another perspective. Before 2014, few or even no measures were enacted each year; 2014 was the ‘boom year’ for PPP and PPP policy [13]. In short, the evolution of GIPM mainly increased with the total number of PPP policies.
Table 6. Measures of China’s PPP policies.
Measures Numbers Initial Issuing Year
SM SMIS (industrial specification) 66 2004 SMLM (limitation measures) 22 2010
ISM ISMOS (operation supervision) 23 1995 ISMID (information disclosure) 17 2002
GIPM Government incentive and pilot measures 106 1986
GSM
GSMFS (fiscal support) 23 2010 GSMFIS (financial support) 37 1995
GSMTDS (tax and due support) 11 1986 GSMLS (land support) 11 2015
GSMOS (operation support) 18 1995
Figure 4. Annual numbers of GIPM, SMIS and GSMFIS between 1986 and 2018.
Secondly, 32.20% of all policies mentioned SMIS, indicating that the government tends to develop the PPP market with further normalisation. Notably, this measure was only proposed in 2004, demonstrating that the early PPP policies were scattered, nonsystematic and nonstandard. Figure 4 illustrates that many SMs were not issued until 2014, the ‘boom year’. After 2014,
Figure 4. Annual numbers of GIPM, SMIS and GSMFIS between 1986 and 2018.
Secondly, 32.20% of all policies mentioned SMIS, indicating that the government tends to developthe PPP market with further normalisation. Notably, this measure was only proposed in 2004,demonstrating that the early PPP policies were scattered, nonsystematic and nonstandard. Figure 4illustrates that many SMs were not issued until 2014, the ‘boom year’. After 2014, considerable SMs

Sustainability 2019, 11, 4872 14 of 24
were proposed and applied in practice. Certain technical specifications, such as the ‘VFM Guideline’,played an important role in PPP development. In 2017, 25 policies specified certain aspects of the PPPindustry. The number, 25, was more than the total number of any other measures, except for the topthree measures. The government has a strong desire to establish a complete, systematic and normativepolicy environment to promote the PPP market.
Thirdly, 37 policies initially issued from 1995 adopted GSMFIS to support measures. Differentfrom the increasing trend of GIPM and SMIS before 2017, the number of GSMFIS in 2016 was smallerthan that in 2015. Such a finding can be explained by the decreased support for PPP. Similar to GSMFIS,less was mentioned of GSMFS (GSM fiscal support) and GSMTDS (GSM tax and due support) measuresin 2016 than in 2015. The number of GSMLS (GSM land support) was equally issued between 2015and 2016. The number of GSMOS (GSM operation support) was only more than 1 in 2016 comparedwith 2015.
Finally, GIPM and GSMTDS were proposed in the first PPP policy in 1986 from the perspectiveof the initial issuing year of measures. Taxes and dues are the frequently used tools to developthe infrastructure market. In the early days, the government did not have enough fiscal budget.Moreover, SMLM (SM limitation measures), GSMFS and GSMLS appeared a bit later than in the otherforms, yet these measures were also familiar in infrastructure development. At least two reasonswere provided to explain such late appearances. Firstly, inchoate PPP projects were too isolatedin the infrastructure market to fiscal policies or land support measures that were published by thelocal government. The study accumulated a national-level policy, not including the regional-levelpolicy. Secondly, limitation measures concentrated on regulating and limiting PPP development inthe infrastructure market. Hence, this kind of measure was only issued when PPP developed to acertain extent.
As Table 7 shows, the regression model can be represented mathematically as
Ln (INV) = 19.513 − 0.091 × SMIS − 0.989 × SMLM + 0.286 × ISMOS − 0.370 × ISMID− 0.094 × GIPM − 0.197 × GSMFS + 1.063 × GSMFIS − 1.688 × GSMTDS + 0.314 ×
GSMLS − 0.687 × GSMOS.(9)
Table 7. Evaluation of the effect of policy measure types on China’s PPP market.
Variables Coefficient Std. Error Prob.
Constant 19.51259 0.743845 0.0000SMIS −0.091272 0.174583 0.6234
SMLM −0.988573 0.216428 0.0060 ***ISMOS 0.285754 0.580029 0.6431ISMID −0.369532 0.355135 0.3458GIPM −0.093883 0.064410 0.2048
GSMFS −0.197034 0.330773 0.5773GSMFIS 1.062868 0.305468 0.0177 **GSMTDS −1.687890 0.603556 0.0381 **GSMLS 0.313995 0.327739 0.3820GSMOS −0.687137 0.307323 0.0756 *
Jarque–Bera statistic 0.632259 Prob. (Jarque–Bera statistic) 0.728965R-squared 0.932359 Prob. (F statistic) 0.022932 **
Note: *, ** and *** represent the correlation being significant at the 0.1, 0.05 and 0.01 levels.
Table 7 shows the evaluation results of the effectiveness of policy measures. Equation (9) wassignificant (p-value = 0.023) and had high goodness of fit. The basic assumptions underlying themultiple regression analysis were not violated (Jarque–Bera statistic equals 0.632). Three measureswere significant, namely, SMLM, GSMFIS and GSMTD, but their effect differs. As expected, SMLMhad negative effects, and GSMFIS was positive. The infrastructure market can be negatively affectedby limitation measures, and the total investment of initial PPP projects can decrease. On the contrary,

Sustainability 2019, 11, 4872 15 of 24
industrial specification, as the other SM, was insignificant. One of the possible explanations is thatcertain SMs with detailed clauses can be enforced well, but those without specific clauses cannot.GSMFIS can evidently accelerate infrastructure investment because financial support is in favour ofresolving the major problem of PPP projects, that is, the financial problem. Another negative significantvariable is GSMTDS. This result was unexpected because tax preference and due discount are generallyconsidered favourable measures for the infrastructure market. One possible explanation is that certainproblems exist in the enforcement process of tax preference measures. A huge change of the taxenvironment has been observed in China in the past few years, referred to as ‘yinggaizeng’ in Chinese.The word means ‘replacing business tax with value-added tax.’ A huge impact of this reform on theconstruction and infrastructure market causes various detailed problems in the enforcement process.
The numbers of SMIS and GIPM measures were the top two in these 10 measures. However,they were insignificant. The negative effect of certain limitation measures implied in specificationclauses may be the cause of this result. As for GIPM, analogous-slogan government incentive measuresdid not really matter for participators and investors in the infrastructure market. In addition, pilotmeasures that the Chinese government used to adopt had significant differences within differentstrength levels. For example, demonstration PPP projects, as a kind of pilot measure proposed in‘Notice on issues concerning the implementation of demonstration PPP projects’, can become themarket’s ‘wind vane.’ Such an effect is significant, but certain pilot measures only mentioned inselected paragraphs of policy text play a minimal role in the infrastructure market. In addition, ISM isinsignificant in the categories of the four measures that may be caused by the low maturity of thesetwo measures.
4.4. PPP Policy Measure Strengths
A distinct change happened in 2014 wherein accumulative scores of PPP policy strength increased.The increase rate of accumulative strength scores suddenly magnified, and its absolute number wasmore than 100. Figure 5 displays another turning point in 2002. Few policies existed between 1986 and2002 because in such years, the number of policies increased, and the strength of policies was enhanced.Sustainability 2019, 11, x FOR PEER REVIEW 16 of 24
Figure 5. Annual accumulative strength of China’s PPP policies.
As Table 8 shows, the regression model can be represented mathematically as
Ln (INV) = 22.894 + 0.013 × SSMIS−0.207 × SSMLM + 0.111 × SISMOS−0.137 × SISMID−0.086 × SGIPM + 0.004 × SGSMFS + 0.220 × SGSMFIS−0.160 × SGSMTDS +
0.063 × SGSMLS + 0.090 × SGSMOS. (10)
Table 8. Evaluation of the effect of policy measures strengths on China’s PPP market.
Variables Coefficient Std. Error Prob. Constant 22.89377 0.811712 0.0000 SSMIS 0.012871 0.023209 0.6031 SSMLM −0.206886 0.038045 0.0029 *** SISMID −0.136828 0.072243 0.1168 SISMOS 0.110800 0.081233 0.2308 SGIPM −0.086152 0.027881 0.0272 ** SGSMFS 0.003909 0.069632 0.9574 SGSMFIS 0.220012 0.041979 0.0034 ** SGSMTDS −0.160435 0.149297 0.3317 SGSMLS 0.062894 0.088836 0.5106 SGSMOS 0.090062 0.039059 0.0693 * Jarque–Bera statistic 1.376660 Prob. (Jarque–Bera statistic) 0.502414
R-squared 0.974887 Prob. (F statistic) 0.002181 *** Note: *, ** and *** represent the correlation being significant at the 0.1, 0.05 and 0.01 levels.
The basic assumptions underlying the multiple regression analysis have not been violated (JB statistic = 0.632). Table 8 displays that the regression results of policy strengths are similar to those of policy measures, but a certain difference exists in these two dimensions. Firstly, SMLM and GSMFIS were significant. The negative effect of SMLM’s strength confirmed that of limitation measures. The Chinese infrastructure market is sensitive to policies if they are sharply restrictive. GSMFIS had a positive correlation with the development of the infrastructure market. Hence, financial support is crucial to the development of PPP projects. Secondly, different from the regression result of policy measures, GIPM had a significant negative correlation with the explained variable. This finding contributed to the result that regression estimation distinguished different strength levels of pilot measures, and a certain numerical value of high-strength policies were amplified remarkably. The negative correlation can be explained by the effects of the analogous slogan government incentive
Figure 5. Annual accumulative strength of China’s PPP policies.
GIPM and GSMTDS appeared in the first policy in 1986, but their strength rate only scored 1.The situation improved until 1995 for GIPM; beyond that, only four measures appeared in policies,and they all did not have high strength before 2002. Figure 5 shows a few policies and low strength in

Sustainability 2019, 11, 4872 16 of 24
the exploration phase. Notably, SMLM, GSMFS and GSMLS appeared in policies quite late, but theirstrength scores were not low. One of the explanations was that limitation measures included thecontext of limiting local government debt. Hence, these measures were published in 2010 after the2008 worldwide financial crisis. As for fiscal support, measures should appear in the stage of awell-developed and large-scale infrastructure market. PPP projects increased more than 10 times overthe past, and the land problems became acute at the time of infrastructure construction. Therefore,the strength of GSMLS scored 9, which was initially proposed in 2015.
In terms of accumulative strength, SMIS and GIPM were the top two measures, but they weredifferent because SMIS was used until 2004. GIPM was beloved by the government because thesemeasures were not only used the earliest but also accumulated the highest strength. Moreover,GSMTDS acquired the smallest accumulative strength score, although they were adopted the earliest.The reason for this finding is that the role of these measures is relatively simple but indispensable.
As Table 8 shows, the regression model can be represented mathematically as
Ln (INV) = 22.894 + 0.013 × SSMIS−0.207 × SSMLM + 0.111 × SISMOS−0.137 ×SISMID−0.086 × SGIPM + 0.004 × SGSMFS + 0.220 × SGSMFIS−0.160 × SGSMTDS +
0.063 × SGSMLS + 0.090 × SGSMOS.(10)
Table 8. Evaluation of the effect of policy measures strengths on China’s PPP market.
Variables Coefficient Std. Error Prob.
Constant 22.89377 0.811712 0.0000SSMIS 0.012871 0.023209 0.6031
SSMLM −0.206886 0.038045 0.0029 ***SISMID −0.136828 0.072243 0.1168SISMOS 0.110800 0.081233 0.2308SGIPM −0.086152 0.027881 0.0272 **
SGSMFS 0.003909 0.069632 0.9574SGSMFIS 0.220012 0.041979 0.0034 **SGSMTDS −0.160435 0.149297 0.3317SGSMLS 0.062894 0.088836 0.5106SGSMOS 0.090062 0.039059 0.0693 *
Jarque–Bera statistic 1.376660 Prob. (Jarque–Bera statistic) 0.502414R-squared 0.974887 Prob. (F statistic) 0.002181 ***
Note: *, ** and *** represent the correlation being significant at the 0.1, 0.05 and 0.01 levels.
The basic assumptions underlying the multiple regression analysis have not been violated(JB statistic = 0.632). Table 8 displays that the regression results of policy strengths are similar tothose of policy measures, but a certain difference exists in these two dimensions. Firstly, SMLMand GSMFIS were significant. The negative effect of SMLM’s strength confirmed that of limitationmeasures. The Chinese infrastructure market is sensitive to policies if they are sharply restrictive.GSMFIS had a positive correlation with the development of the infrastructure market. Hence, financialsupport is crucial to the development of PPP projects. Secondly, different from the regression resultof policy measures, GIPM had a significant negative correlation with the explained variable. Thisfinding contributed to the result that regression estimation distinguished different strength levels ofpilot measures, and a certain numerical value of high-strength policies were amplified remarkably.The negative correlation can be explained by the effects of the analogous slogan government incentivemeasures. Thirdly, GSMTDS differed from the regression results of measures, which were insignificant.One of the explanations is the limited number of data points.
Notably, the coefficients of SMLM and GSMFIS were smaller than those in the regression resultsof measures. The government has realised that SMLM negatively affects the infrastructure market.As a result, the strength of subsequent policies will be decreased. The result of GSMFIS indicates that
Sustainability 2019, 11, 4872 17 of 24
the stretched finances of local governments have weakened the enforcement strength of such policies,including financial support measures.
5. Findings and Discussions
Findings of this study, along with a discussion of the implications, follow.
5.1. Evolution of PPP Policies in China
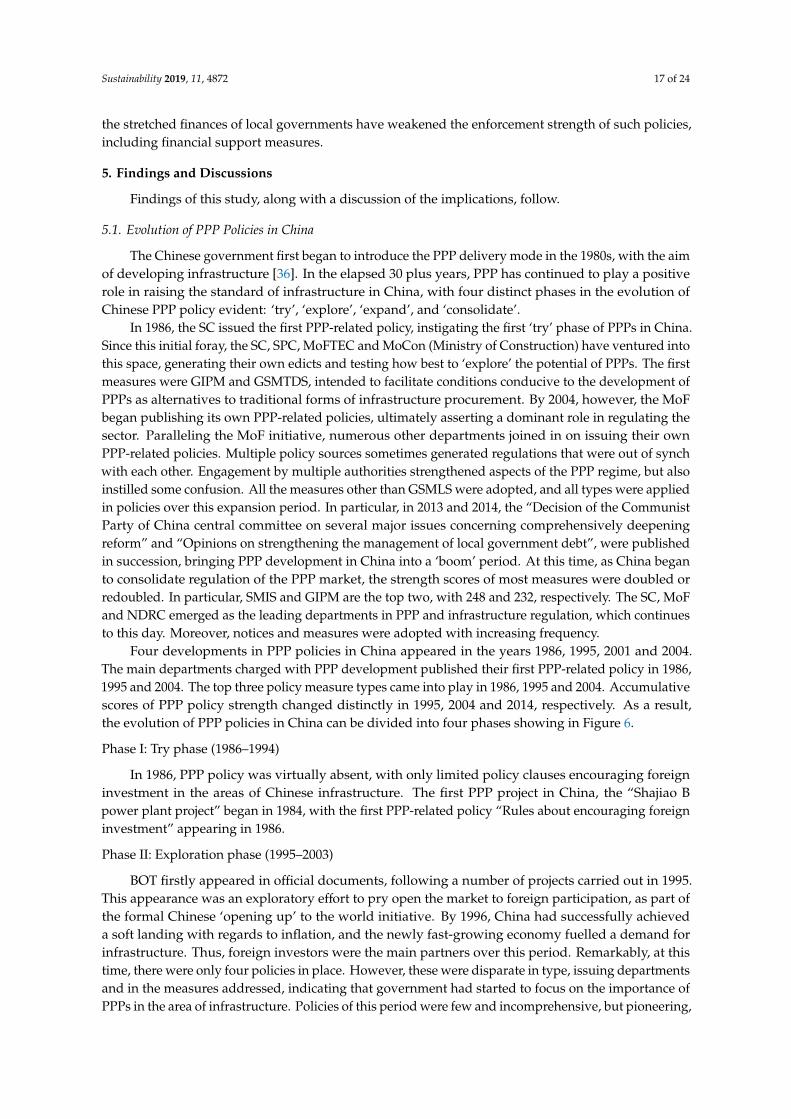
The Chinese government first began to introduce the PPP delivery mode in the 1980s, with the aimof developing infrastructure [36]. In the elapsed 30 plus years, PPP has continued to play a positiverole in raising the standard of infrastructure in China, with four distinct phases in the evolution ofChinese PPP policy evident: ‘try’, ‘explore’, ‘expand’, and ‘consolidate’.
In 1986, the SC issued the first PPP-related policy, instigating the first ‘try’ phase of PPPs in China.Since this initial foray, the SC, SPC, MoFTEC and MoCon (Ministry of Construction) have ventured intothis space, generating their own edicts and testing how best to ‘explore’ the potential of PPPs. The firstmeasures were GIPM and GSMTDS, intended to facilitate conditions conducive to the development ofPPPs as alternatives to traditional forms of infrastructure procurement. By 2004, however, the MoFbegan publishing its own PPP-related policies, ultimately asserting a dominant role in regulating thesector. Paralleling the MoF initiative, numerous other departments joined in on issuing their ownPPP-related policies. Multiple policy sources sometimes generated regulations that were out of synchwith each other. Engagement by multiple authorities strengthened aspects of the PPP regime, but alsoinstilled some confusion. All the measures other than GSMLS were adopted, and all types were appliedin policies over this expansion period. In particular, in 2013 and 2014, the “Decision of the CommunistParty of China central committee on several major issues concerning comprehensively deepeningreform” and “Opinions on strengthening the management of local government debt”, were publishedin succession, bringing PPP development in China into a ‘boom’ period. At this time, as China beganto consolidate regulation of the PPP market, the strength scores of most measures were doubled orredoubled. In particular, SMIS and GIPM are the top two, with 248 and 232, respectively. The SC, MoFand NDRC emerged as the leading departments in PPP and infrastructure regulation, which continuesto this day. Moreover, notices and measures were adopted with increasing frequency.
Four developments in PPP policies in China appeared in the years 1986, 1995, 2001 and 2004.The main departments charged with PPP development published their first PPP-related policy in 1986,1995 and 2004. The top three policy measure types came into play in 1986, 1995 and 2004. Accumulativescores of PPP policy strength changed distinctly in 1995, 2004 and 2014, respectively. As a result,the evolution of PPP policies in China can be divided into four phases showing in Figure 6.
Phase I: Try phase (1986–1994)
In 1986, PPP policy was virtually absent, with only limited policy clauses encouraging foreigninvestment in the areas of Chinese infrastructure. The first PPP project in China, the “Shajiao Bpower plant project” began in 1984, with the first PPP-related policy “Rules about encouraging foreigninvestment” appearing in 1986.
Phase II: Exploration phase (1995–2003)
BOT firstly appeared in official documents, following a number of projects carried out in 1995.This appearance was an exploratory effort to pry open the market to foreign participation, as part ofthe formal Chinese ‘opening up’ to the world initiative. By 1996, China had successfully achieveda soft landing with regards to inflation, and the newly fast-growing economy fuelled a demand forinfrastructure. Thus, foreign investors were the main partners over this period. Remarkably, at thistime, there were only four policies in place. However, these were disparate in type, issuing departmentsand in the measures addressed, indicating that government had started to focus on the importance ofPPPs in the area of infrastructure. Policies of this period were few and incomprehensive, but pioneering,

Sustainability 2019, 11, 4872 18 of 24
while these early PPP projects in transportation, energy and water resulted in mixed success as aconsequence of these incompletely formulated regulations [76].
Phase III: Expansion and fluctuations phase (2004–2013)
From 2004, policy development grew substantially, but it did so in fits and starts. In 2001, Chinaformally joined the world trade organization (WTO), spurring an economic boom [77]. Many privateinvestors took a great interest in the opportunities of China’s opening-up market. 2004, 2005 and2010 saw publication of three significant policies. 2013, also saw an important milestone with anew generation of Chinese leadership coming to power. This coincided with the “Decision of theCommunist Party of China central committee on several major issues concerning comprehensivelydeepening reform.” In this document, private investment was encouraged to participate in infrastructuredevelopment, which greatly raised the number of PPP starts in the following years. Similarly, policieswithin this phase continued to be published at an increasing rate.
Phase IV: Boom and consolidation phase (2014–present)
As Figure 6 shows, a clear policy boom period occurred from 2014, and continues to the present.Mirroring this, the number of projects has also been rising solidly. With the ongoing development ofPPPs as an instrument of infrastructure procurement, policies of a normative nature were publishedby various departments over this time. An important example is the “Notice on the issuance of theinterim measures on the financial management of PPP projects”, in 2016, which restricts the applicationof non-normative PPP projects, such as illegal-guarantee projects. The policies of this phase werenumerous, diverse and relatively well-developed.Sustainability 2019, 11, x FOR PEER REVIEW 18 of 24
Figure 6. Evolution phases of China's PPP policies.
Phase I: Try phase (1986–1994)
In 1986, PPP policy was virtually absent, with only limited policy clauses encouraging foreign investment in the areas of Chinese infrastructure. The first PPP project in China, the “Shajiao B power plant project” began in 1984, with the first PPP-related policy “Rules about encouraging foreign investment” appearing in 1986.
Phase II: Exploration phase (1995–2003)
BOT firstly appeared in official documents, following a number of projects carried out in 1995. This appearance was an exploratory effort to pry open the market to foreign participation, as part of the formal Chinese ‘opening up’ to the world initiative. By 1996, China had successfully achieved a soft landing with regards to inflation, and the newly fast-growing economy fuelled a demand for infrastructure. Thus, foreign investors were the main partners over this period. Remarkably, at this time, there were only four policies in place. However, these were disparate in type, issuing departments and in the measures addressed, indicating that government had started to focus on the importance of PPPs in the area of infrastructure. Policies of this period were few and incomprehensive, but pioneering, while these early PPP projects in transportation, energy and water resulted in mixed success as a consequence of these incompletely formulated regulations [76].
Phase III: Expansion and fluctuations phase (2004–2013)
From 2004, policy development grew substantially, but it did so in fits and starts. In 2001, China formally joined the world trade organization (WTO), spurring an economic boom [77]. Many private investors took a great interest in the opportunities of China’s opening-up market. 2004, 2005 and 2010 saw publication of three significant policies. 2013, also saw an important milestone with a new generation of Chinese leadership coming to power. This coincided with the “Decision of the Communist Party of China central committee on several major issues concerning comprehensively
Figure 6. Evolution phases of China’s PPP policies.
Sustainability 2019, 11, 4872 19 of 24
5.2. PPP Policy Impact on PPP Market in China
For a long period, there was a lack of laws in the area of PPPs in China. In addressing this,since the period of opening-up, there has been a concerted central government response to develop anational PPP policy. The aim has been achieved, up to a point; China’s PPP plan was aggressive, but itsimplementation was poor [50]. Notices, regulations and orders played both positive and negativeroles on the PPP market. Low rank policies are more flexible, and are adjusted in response to markets,causing immediate positive impact. However, the impact of regulations and orders have a short-termdampening effect, and should be considered as aiming to regulate the market more coherently over thelonger-term. Verhoest et.al pointed out that there is a weak correlation between government supportand PPP implementation [20].
A significant finding of this paper is that the impacts of some support measures on PPP marketshave been significant and strong. This is illustrated in the results of the policy measures’ regression,where the GSMFIS was the most positive measure in the development of the infrastructure market.The requirement caused a depression of PPPs in California, USA, where the private sector raised the fullamounts necessary to privately finance PPP projects [23]. This confirms the positive impact of GSMFIS.On the other hand, GSMLS played a negative role when developing PPP projects. Limiting measurescan of course be expected to reduce the total amount of PPPs undertaken, but these measures mayenhance the quality of those remaining PPP projects [78]. Supervision measures, however, did not playthe desired role, but may still positively impact the market in the future [79,80]. There were notableresults in the measures’ and strengths’ regression estimation on GIPM. Considering the measures’strength, GIPM became significant but negative, illustrating that overuse of incentive measures arenot in fact beneficial. The consequence of too much GIPM was that many projects were initiated,but quite a few of them were of low-quality [81]. However, GIPM may play a key role of PPP in openinnovation [82]. This kind of effect on open innovation may be connotative [83,84].
6. Conclusions and Policy Implications
The evolution of China’s PPP policies has gone through four phases: try, explore, expand andconsolidate. Though, by world standards, China began late in adopting PPPs, it has made up for thislate start with a great profusion of PPP projects, paralleling China’s unprecedented period of a quartercentury of high economic growth. Even so, China’s development of PPP policy is far from over, with stillmore need evident for further evolution and refinement. Most evidently, investors are falling off, andpolicy makers should provide greater support to private investors in a bid to keep them engaged.Moreover, policy makers should pay attention to the enforcement of supervision measures so that thesemeasures will bite as intended. The private sector should also actively engage with the government tofollow through with enforcement of regulations. This would include securing government financialsupport, as well as the vetting of non-profitable projects. Some policy implications suggested by thisresearch are as follows:
• Policies issued by different departments should be coordinated, rather than left to potentiallycontradict each other. A coordination mechanism between departments initiated as a higher levelis needed.
• Although PPP legislation has attempted to curb undesirable practices through heavy restrictivemeasures, this has also had the effect of stifling infrastructure investment more broadly.Thus, corrective legislation of this sort should be considered more holistically so as to notdetract from needed further infrastructure investment.
• Financial support measures should be applied more broadly than other support measures,and should be calibrated to have sufficient motivational strength.
• Chinese supervision measures including information disclose and operation supervision measuresare not mature. These should be systematic and comprehensive so as to facilitate further openingup of PPP interest.

Sustainability 2019, 11, 4872 20 of 24
• Ineffective incentives measures, such as government sloganeering, should be supplanted bygenuine market stimuli.
7. Limitations and Future Research
Data deficiency is the main limitation of this article, with market data drawn from between 2014and the first half of 2018 used in the regression process. More evidence from more complete data, if thisbecomes available, should be used in any follow-up research. In addition, this article only consideredthe total scale of the market. Future research could concentrate on the impact of PPP policy on thequality of PPP projects as well.
Author Contributions: Conceptualization, Y.G. and C.C.; methodology, Y.G. and I.M.; software, Y.G.; validation,Y.G.; writing—original draft preparation, Y.G.; writing—review and editing, I.M. and Y.G.; supervision, C.C.
Funding: This research was funded by National Natural Science Foundation of China, grant number 71971147.
Acknowledgments: The authors wish to thank Dr. Yao Yu for her encourage and assistance.
Conflicts of Interest: The authors declare no conflict of interest.
References
1. Cuttaree, V.; Mandri-Perrott, C. Public-Private Partnerships in Europe and Central Asia: Designing Crisis-ResilientStrategies and Bankable Projects, 1st ed.; The World Bank Group: Washington, DC, USA, 2011; pp. 2–24.
2. Khanom, N.A. Conceptual issues in defining public private partnerships (PPPs). Int. Rev. Bus. Res. Pap.2010, 6, 150–163.
3. Carter, L.; Kaga, R.; Maier, T.; Heathcote, C.; Aguerre, J.A.; Abdelwahab, W.; Alter, R.; Hamilton, G.; Akhtar, S.The PPP Reference Guide, 3rd ed.; The World Bank Group: Washington, DC, USA, 2017; pp. 1–67.
4. National Development and Reform Commission. Guiding Opinion on Implementation Public-PrivatePartnerships. Available online: http://www.ndrc.gov.cn/gzdt/201412/t20141204_651014.html (accessed on2 December 2014). (In Chinese)
5. Ministry of Finance. Notice on Issues Related to the Promotion and Application of Public-Private PartnershipsModel. Available online: http://jrs.mof.gov.cn/zhengwuxinxi/zhengcefabu/201409/t20140924_1143760.html(accessed on 23 September 2014). (In Chinese)
6. Treasury Officer of Accounts. Regularity, Propriety and Value for Money, 1st ed.; HM Treasury: London, UK,2004; pp. 9–14.
7. De Clerck, D.; Demeulemeester, E. Creating a more competitive PPP procurement market: Game theoreticalanalysis. J. Manag. Eng. 2016, 32, 04016015. [CrossRef]
8. Garvin, M.J.; Bosso, D. Assessing the effectiveness of infrastructure public—Private partnership programsand projects. Public Work. Manag. Policy 2008, 13, 162–178. [CrossRef]
9. Department of Treasury and Finance. Partnerships Victoria-Excellence in Public Private Partnerships, 1st ed.;Doculink: Melbourne, Australia, 2017; pp. 2–3.
10. HM Treasury and Infrastructure and Projects Authority. Private Finance Initiative and Private Finance 2 Projects:2017 Summary Data, 1st ed.; HM Treasury and Infrastructure and Projects Authority: London, UK, 2017;pp. 6–9.
11. Harris, C. Private Participation in Infrastructure in Developing Countries: Trends, Impacts, and Policy Lessons,1st ed.; The World Bank Group: Washington, DC, USA, 2003; pp. 6–37.
12. China Public Private Partnerships Center. Quarterly Report of National PPPs Projects Development.Available online: http://www.cpppc.org/zh/pppjb/7846.jhtml (accessed on 1 March 2019). (In Chinese)
13. Cheng, Z.; Ke, Y.; Lin, J.; Yang, Z.; Cai, J. Spatio-temporal dynamics of public private partnership projects inChina. Int. J. Proj. Manag. 2016, 34, 1242–1251. [CrossRef]
14. Ministry of Finance. The Ministry of Finance Has Set Up a PPP Centre. Available online: http://jrs.mof.gov.cn/ppp/gzdtppp/201412/t20141202_1162189.html (accessed on 4 December 2014). (In Chinese)
15. Rahim, N.A.; Selvaraj, J.; Hasanuzzaman, M.; Malek, A.B.M.A.; Nahar, A. Global prospects, progress, policies,and environmental impact of solar photovoltaic power generation. Renew. Sustain. Energy Rev. 2015, 41,284–297.
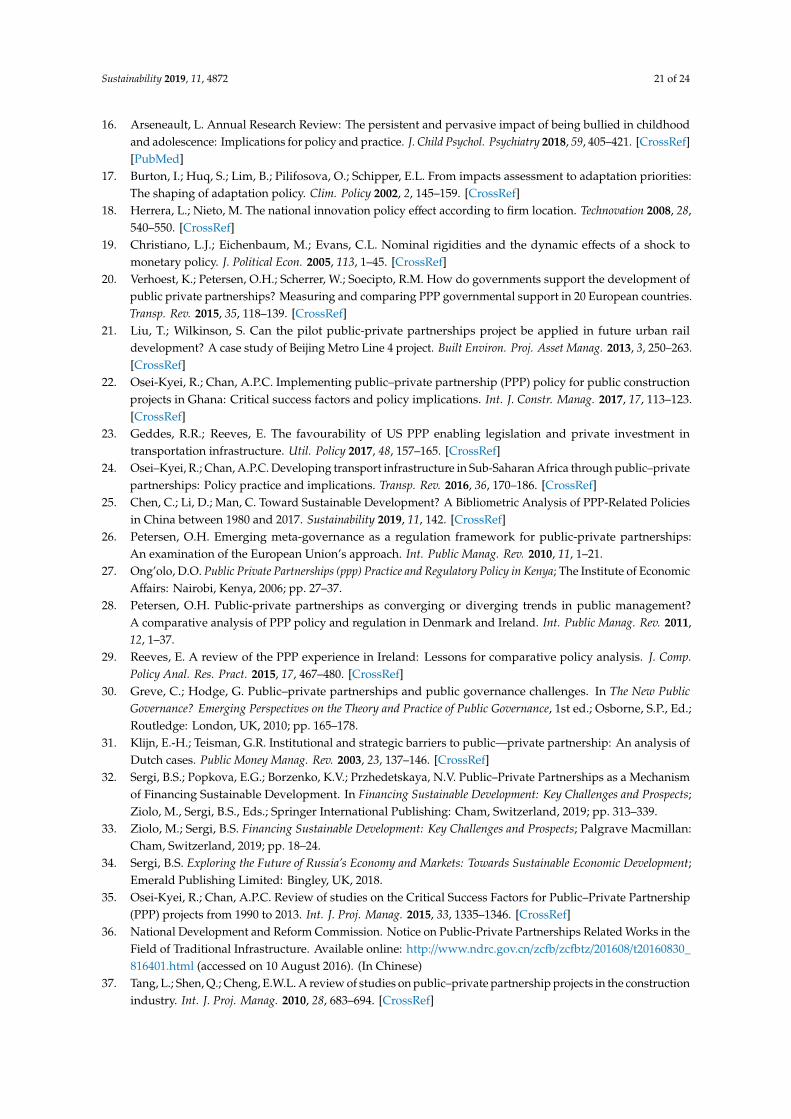
Sustainability 2019, 11, 4872 21 of 24
16. Arseneault, L. Annual Research Review: The persistent and pervasive impact of being bullied in childhoodand adolescence: Implications for policy and practice. J. Child Psychol. Psychiatry 2018, 59, 405–421. [CrossRef][PubMed]
17. Burton, I.; Huq, S.; Lim, B.; Pilifosova, O.; Schipper, E.L. From impacts assessment to adaptation priorities:The shaping of adaptation policy. Clim. Policy 2002, 2, 145–159. [CrossRef]
18. Herrera, L.; Nieto, M. The national innovation policy effect according to firm location. Technovation 2008, 28,540–550. [CrossRef]
19. Christiano, L.J.; Eichenbaum, M.; Evans, C.L. Nominal rigidities and the dynamic effects of a shock tomonetary policy. J. Political Econ. 2005, 113, 1–45. [CrossRef]
20. Verhoest, K.; Petersen, O.H.; Scherrer, W.; Soecipto, R.M. How do governments support the development ofpublic private partnerships? Measuring and comparing PPP governmental support in 20 European countries.Transp. Rev. 2015, 35, 118–139. [CrossRef]
21. Liu, T.; Wilkinson, S. Can the pilot public-private partnerships project be applied in future urban raildevelopment? A case study of Beijing Metro Line 4 project. Built Environ. Proj. Asset Manag. 2013, 3, 250–263.[CrossRef]
22. Osei-Kyei, R.; Chan, A.P.C. Implementing public–private partnership (PPP) policy for public constructionprojects in Ghana: Critical success factors and policy implications. Int. J. Constr. Manag. 2017, 17, 113–123.[CrossRef]
23. Geddes, R.R.; Reeves, E. The favourability of US PPP enabling legislation and private investment intransportation infrastructure. Util. Policy 2017, 48, 157–165. [CrossRef]
24. Osei–Kyei, R.; Chan, A.P.C. Developing transport infrastructure in Sub-Saharan Africa through public–privatepartnerships: Policy practice and implications. Transp. Rev. 2016, 36, 170–186. [CrossRef]
25. Chen, C.; Li, D.; Man, C. Toward Sustainable Development? A Bibliometric Analysis of PPP-Related Policiesin China between 1980 and 2017. Sustainability 2019, 11, 142. [CrossRef]
26. Petersen, O.H. Emerging meta-governance as a regulation framework for public-private partnerships:An examination of the European Union’s approach. Int. Public Manag. Rev. 2010, 11, 1–21.
27. Ong’olo, D.O. Public Private Partnerships (ppp) Practice and Regulatory Policy in Kenya; The Institute of EconomicAffairs: Nairobi, Kenya, 2006; pp. 27–37.
28. Petersen, O.H. Public-private partnerships as converging or diverging trends in public management?A comparative analysis of PPP policy and regulation in Denmark and Ireland. Int. Public Manag. Rev. 2011,12, 1–37.
29. Reeves, E. A review of the PPP experience in Ireland: Lessons for comparative policy analysis. J. Comp.Policy Anal. Res. Pract. 2015, 17, 467–480. [CrossRef]
30. Greve, C.; Hodge, G. Public–private partnerships and public governance challenges. In The New PublicGovernance? Emerging Perspectives on the Theory and Practice of Public Governance, 1st ed.; Osborne, S.P., Ed.;Routledge: London, UK, 2010; pp. 165–178.
31. Klijn, E.-H.; Teisman, G.R. Institutional and strategic barriers to public—private partnership: An analysis ofDutch cases. Public Money Manag. Rev. 2003, 23, 137–146. [CrossRef]
32. Sergi, B.S.; Popkova, E.G.; Borzenko, K.V.; Przhedetskaya, N.V. Public–Private Partnerships as a Mechanismof Financing Sustainable Development. In Financing Sustainable Development: Key Challenges and Prospects;Ziolo, M., Sergi, B.S., Eds.; Springer International Publishing: Cham, Switzerland, 2019; pp. 313–339.
33. Ziolo, M.; Sergi, B.S. Financing Sustainable Development: Key Challenges and Prospects; Palgrave Macmillan:Cham, Switzerland, 2019; pp. 18–24.
34. Sergi, B.S. Exploring the Future of Russia’s Economy and Markets: Towards Sustainable Economic Development;Emerald Publishing Limited: Bingley, UK, 2018.
35. Osei-Kyei, R.; Chan, A.P.C. Review of studies on the Critical Success Factors for Public–Private Partnership(PPP) projects from 1990 to 2013. Int. J. Proj. Manag. 2015, 33, 1335–1346. [CrossRef]
36. National Development and Reform Commission. Notice on Public-Private Partnerships Related Works in theField of Traditional Infrastructure. Available online: http://www.ndrc.gov.cn/zcfb/zcfbtz/201608/t20160830_816401.html (accessed on 10 August 2016). (In Chinese)
37. Tang, L.; Shen, Q.; Cheng, E.W.L. A review of studies on public–private partnership projects in the constructionindustry. Int. J. Proj. Manag. 2010, 28, 683–694. [CrossRef]

Sustainability 2019, 11, 4872 22 of 24
38. Willems, T.; Van Dooren, W. (De)politicization dynamics in public–private partnerships (PPPs): Lessonsfrom a comparison between UK and Flemish PPP policy. Public Manag. Rev. 2016, 18, 199–220. [CrossRef]
39. Mouraviev, N.; Kakabadse, N.K. Public-private partnerships in Russia: Dynamics contributing to an emergingpolicy paradigm. Policy Stud. 2014, 35, 79–96. [CrossRef]
40. Chen, C.; Li, D. Policy Change and Policy Learning in China’s Public-Private Partnership: ContentAnalysis of PPP Policies between 1980 and 2015. Chin. Public Adm. 2017, 102–107. Available online:https://kns.cnki.net/KCMS/detail/detail.aspx?dbcode=CJFQ&dbname=CJFDLAST2017&filename=ZXGL201702020&uid=WEEvREcwSlJHSldRa1FhdkJkVG1ERERDdzA2bENVNXZDYjQ4S3dWdXBoYz0=$9A4hF_YAuvQ5obgVAqNKPCYcEjKensW4IQMovwHtwkF4VYPoHbKxJw!!&v=MjcxMTRqbVc3L1BQelhNWXJHNEg5Yk1yWTlIWklSOGVYMUx1eFlTN0RoMVQzcVRyV00xRnJDVVJMT2ZidVpyRnk= (accessed on 1 March2019). (In Chinese)
41. Ke, H.; Wang, M.; Du, Y. Text Analysis of Public—Private Partnership Policies from the Perspective of PolicyTool: Based on PPP National Policy during 2014–2017. J. Intell. 2018, 37, 81–88. (In Chinese)
42. Wang, Y. Quantitative research on PPP policy text from the perspective of policy tool. China Collect. Econ.2018, 76–78. Available online: https://kns.cnki.net/KCMS/detail/detail.aspx?dbcode=CJFQ&dbname=CJFDLAST2018&filename=ZJTG201810041&uid=WEEvREcwSlJHSldRa1FhdkJkVG1ERERDdzA2bENVNXZDYjQ4S3dWdXBoYz0=$9A4hF_YAuvQ5obgVAqNKPCYcEjKensW4IQMovwHtwkF4VYPoHbKxJw!!&v=MDI4NTdXTTFGckNVUkxPZmJ1WnJGeWpuVUxyS1B5ZmZhYkc0SDluTnI0OUJaWVI4ZVgxTHV4WVM3RGgxVDNxVHI= (accessed on 1 March 2019). (In Chinese)
43. Sneum, D.M.; Sandberg, E.; Koduvere, H.; Olsen, O.J.; Blumberga, D. Policy incentives for flexible districtheating in the Baltic countries. Util. Policy 2018, 51, 61–72. [CrossRef]
44. Garcez, C.G. Distributed electricity generation in Brazil: An analysis of policy context, design and impact.Util. Policy 2017, 49, 104–115. [CrossRef]
45. Khanna, N.Z.; Zhou, N.; Fridley, D.; Ke, J. Quantifying the potential impacts of China’s power-sector policieson coal input and CO2 emissions through 2050: A bottom-up perspective. Util. Policy 2016, 41, 128–138.[CrossRef]
46. Cheng, H.; Qian, F. Research on the relationship between innovation performance and the power, stabilityand instruments of policy—Empirical analysis based on 2000-2009 industry panel data. Sci. Res. Manag.2013, 34, 103–108. (In Chinese)
47. De Carvalho, B.E.; Marques, R.; Netto, O. Regulatory Impact Assessment (RIA): An Ex-Post Analysis ofWater Services by the Legal Review in Portugal. Water Resour. Manag. 2018, 32, 675–699. [CrossRef]
48. Rodrigo, D. Regulatory Impact Analysis in OECD Countries Challenges for developing countries.In Proceedings of the 2005 International Conference on Reforming the Business Environment, Cairo,Egypt, 28 November–1 December 2005.
49. Emery, S.B.; Mulder, H.A.J.; Frewer, L.J. Maximizing the Policy Impacts of Public Engagement: A EuropeanStudy. Sci. Technol. Hum. Val. 2015, 40, 421–444. [CrossRef]
50. Petersen, O.H. Regulation of public–private partnerships: The Danish case. Public Money Manag. 2010, 30,175–182. [CrossRef]
51. Reeves, E.; Palcic, D. Getting back on track: The expanded use of PPPs in Ireland since the global financialcrisis. Policy Stud. 2017, 38, 339–355. [CrossRef]
52. Shi, L.; He, Y.; Onishi, M.; Kobayashi, K. Efficiency analysis of government subsidy and performanceguarantee policies in relation to PPP infrastructure projects. Math. Probl. Eng. 2018, 2018, 6196218. [CrossRef]
53. Rothwell, R.; Zegveld, W. Government regulations and innovation—Industrial Innovation and Public Policy.In Industrial Innovation Public Policy; Frances Printer: London, UK, 1981; pp. 116–147.
54. Schneider, A.; Ingram, H. Systematically pinching ideas: A comparative approach to policy design. J. PublicPolicy 1988, 8, 61–80. [CrossRef]
55. Wang, X.; Peng, Z.; Gao, W.; Ji, S. The policy evolution and effect evaluation of wind power industry inChina. Stud. Sci. 2016, 34, 1817–1829. (In Chinese)
56. Long, R.; Cui, W.; Li, Q. The Evolution and Effect Evaluation of Photovoltaic Industry Policy in China.Sustainability 2017, 9, 2147. [CrossRef]
57. Geddes, R.R.; Wagner, B.L. Why do US states adopt public–private partnership enabling legislation? J. UrbanEcon. 2013, 78, 30–41. [CrossRef]

Sustainability 2019, 11, 4872 23 of 24
58. Peng, J.; Sun, W.; Zhong, W. The evolution of Chinese technological and innovational policies and theempirical research on the performance (1978–2006). Sci. Res. Manag. 2008, 29, 134–150. (In Chinese)
59. Dou, L.; Chen, C.; Zhao, R.; Sun, M.; Chen, G.; Wang, Y.; Chang, F.; Lu, J. Public Hospital Reform PolicyAnalysis of National Level in China. Chin. Hosp. Manag. 2015, 35, 1–4. (In Chinese)
60. Xi, Z.; Chi, K.; Yang, F. Construction of Theoretical Framework on Regional Scientific and TechnologicalInnovation Policy Design: Bibliometric Analysis Based on Files of Shandong Province. Sci. Technol. Prog.Policy 2014, 31, 39–44. (In Chinese)
61. Yin, H.; Pan, Z.; Lu, M. Our Measurement of China’s Industrial Policy for Foreign Direct Investment andour Study of the Efficiency of this Policy: From 1979 to 2003. Manag. Rev. 2006, 34–45. Available online:https://kns.cnki.net/KCMS/detail/detail.aspx?dbcode=CJFQ&dbname=CJFD2006&filename=GLSJ200607005&uid=WEEvREcwSlJHSldRa1FhdkJkVG1ERERDdzA2bENVNXZDYjQ4S3dWdXBoYz0=$9A4hF_YAuvQ5obgVAqNKPCYcEjKensW4IQMovwHtwkF4VYPoHbKxJw!!&v=MjY0OTkxRnJDVVJMT2ZidVpyRnlqblViM0pJaUhZWkxHNEh0Zk1xSTlGWVlSOGVYMUx1eFlTN0RoMVQzcVRyV00= (accessed on 1 March 2019).(In Chinese)
62. Yin, H.; Lu, M. Research on the effectiveness of China Policy for Attractting Foreign Direct Investment. Manag.Rev. 2004, 39–45. Available online: https://kns.cnki.net/kcms/detail/detail.aspx?filename=GLSJ200401006&dbcode=CJFD&dbname=CJFD2004&v= (accessed on 1 March 2019). (In Chinese)
63. Möser, G.; Bamberg, S. The effectiveness of soft transport policy measures: A critical assessment andmeta-analysis of empirical evidence. J. Environ. Psychol. 2008, 28, 10–26. [CrossRef]
64. Nahrin, K. Urban development policies for the provision of utility infrastructure: A case study of Dhaka,Bangladesh. Util. Policy 2018, 54, 107–114. [CrossRef]
65. Wan, C.; Shen, G.Q.; Yu, A. The role of perceived effectiveness of policy measures in predicting recyclingbehaviour in Hong Kong. Resour. Conserv. Recycl. 2014, 83, 141–151. [CrossRef]
66. Yu, Y.; Chan, A.P.C.; Chen, C.; Darko, A. Critical risk factors of transnational public–private partnershipprojects: Literature review. J. Infrastruct. Syst. 2017, 24, 04017042. [CrossRef]
67. Ke, Y.; Wang, S.; Chan, A.P.C.; Cheung, E. Research trend of public-private partnership in constructionjournals. J. Constr. Eng. Manag. 2009, 135, 1076–1086. [CrossRef]
68. Menz, F.C.; Vachon, S. The effectiveness of different policy regimes for promoting wind power: Experiencesfrom the states. Energy Policy 2006, 34, 1786–1796. [CrossRef]
69. The World Bank Group. Private Participation in Infrastructure Database. Available online: http://ppi.worldbank.org/data (accessed on 27 June 2018).
70. Wu, S.; Li, S. An Input-output-based Assessment of China’s Economic Complexity and Evolution. Manag. Rev.2013, 25, 3–11,17. (In Chinese)
71. Cai, X.; Gao, F.; Zhang, J.; Geng, H. (Eds.) The third plenary session of the 18th CPC central committee,Decisions of The CPC Central Committee on Several Major Issues Concerning Comprehensively DeepeningReform. People’s Daily, 16 November 2013; 001. (In Chinese)
72. Jarque, C.M.; Bera, A.K. A test for normality of observations and regression residuals. Rev. Int. Stat. 1987, 55,163–172. [CrossRef]
73. Chan, S.L.; Park, M. Project cost estimation using principal component regression. Constr. Manag. Econ.2005, 23, 295–304. [CrossRef]
74. Chen, C. Can the pilot BOT Project provide a template for future projects? A case study of the ChengduNo. 6 Water Plant B Project. Int. J. Proj. Manag. 2009, 27, 573–583. [CrossRef]
75. Wang, S.; Tiong, L. Case study of government initiatives for PRC’s BOT power plant project. Int. J. Proj.Manag. 2000, 18, 69–78. [CrossRef]
76. Zhang, T.; Liu, E. A New Financing Pattern in the Development of Institutional Infrastructure Project—PPP.Port Eng. Technol. 2003, 32–34. Available online: https://kns.cnki.net/KCMS/detail/detail.aspx?dbcode=
CJFQ&dbname=CJFD2003&filename=GAOG200304011&uid=WEEvREcwSlJHSldRa1FhdkJkVG1ERERDdzA2bENVNXZDYjQ4S3dWdXBoYz0=$9A4hF_YAuvQ5obgVAqNKPCYcEjKensW4IQMovwHtwkF4VYPoHbKxJw!!&v=MDM4NDNFYWJHNEh0TE1xNDlFWllSOGVYMUx1eFlTN0RoMVQzcVRyV00xRnJDVVJMT2ZidVpyRnlqblZiN01JaXo= (accessed on 1 March 2019). (In Chinese)

Sustainability 2019, 11, 4872 24 of 24
77. Wang, Y. The Evolution and Innovation of China’s Macroeconomic Policy in the past 40 years.China Policy Rev. 2018, 17–21. Available online: https://kns.cnki.net/KCMS/detail/detail.aspx?dbcode=
CJFQ&dbname=CJFDLAST2019&filename=JJBG201812006&uid=WEEvREcwSlJHSldRa1FhdkJkVG1ERERDdzA2bENVNXZDYjQ4S3dWdXBoYz0=$9A4hF_YAuvQ5obgVAqNKPCYcEjKensW4IQMovwHtwkF4VYPoHbKxJw!!&v=MjcxNTkxRnJDVVJMT2ZidVpyRnlqblZidklMeWZKYWJHNEg5bk5yWTlGWW9SOGVYMUx1eFlTN0RoMVQzcVRyV00= (accessed on 1 March 2019). (In Chinese)
78. Ye, X.; Xu, C. Review and Research on PPP Pattern in China. Soft Sci. 2013, 27, 6–9. (In Chinese)79. Wang, S.; Liu, T. PPP Project Supervision: Domestic and Foreign Experience and Policy Suggestions. Sub Natl.
Fisc. Res. 2014, 7–12,25. (In Chinese)80. Yu, W. Research on the legislation of PPP regulation-from the science of law and policy perspective.
Contemp. Law Rev. 2016, 30, 77–91. (In Chinese)81. Guo, P.; Long, F. Problem and Suggestions in the Process of PPP Model Promotion. Constr. Econ. 2015, 36,
11–14. (In Chinese)82. Yun, J.; Won, D.; Park, K. Dynamics from open innovation to evolutionary change. J. Open Innov. Technol.
Mark. Complex. 2016, 2, 7. [CrossRef]83. Yun, J.J.; Won, D.; Park, K. Entrepreneurial cyclical dynamics of open innovation. J. Evol. Econ. 2018, 28,
1151–1174. [CrossRef]84. Yun, J.J. How do we conquer the growth limits of capitalism? Schumpeterian Dynamics of Open Innovation.
J. Open Innov. Technol. Mark. Complex. 2015, 1, 17. [CrossRef]
© 2019 by the authors. Licensee MDPI, Basel, Switzerland. This article is an open accessarticle distributed under the terms and conditions of the Creative Commons Attribution(CC BY) license (http://creativecommons.org/licenses/by/4.0/).