policy on establishing and posting speed limits on the ... · pdf file04.11.2016 ·...
TRANSCRIPT

E N G IN E E R S | A R C H IT E C T S | S U R V E Y O R S | S C IE N T IS T S
2709 McGraw Dr ive
B loom ington, I l l i no is 61704
p 309.663.8435 f 309.663. 1571
www. f -w.com | www.g reennav igat ion .com
November 4, 2016 Mr. Kevin Kothe, PE
City Engineer
City of Bloomington – Public Works Department
P.O. Box 3157
Bloomington, IL 61702-3157
Attention: Mr. Luke Thoele, PE Subject: Hershey Road Speed Studies and Sight Distance Review Dear Mr. Thoele:
As requested, Farnsworth Group has completed speed studies based upon IDOT Guidelines presented in the document Policy on Establishing and Posting Speed Limits on the State Highway System at three locations along Hersey Road between Rainbow Avenue and College Avenue. In addition, the existing intersection sight distance at the entrance to the Village of Spring Ridge subdivision on the west side of Hershey Road between GE Road and Jumer Drive was analyzed based on the IDOT Bureau of Local Roads and Streets Manual criteria for intersection sight distance. Below, please find a summary of the results of these studies and analysis.
Speed Studies
Speed measurements were taken at the following three locations on October 13 and 14, 2016 (See Location Map in Exhibit 1):
1) Southern segment: approximately 500’ north of Rainbow Avenue (650’ south of GE Road)
2) Middle segment: approximately 450’ south of the entrance to the Village of Spring Ridge subdivision (1,000’ north of GE Road)
3) Northern segment: approximately 400’ north of Jumer Drive (650’ south of College Avenue)
The above locations were chosen to minimize the effects of the traffic signals at the GE Road and College Avenue intersections on the free flowing traffic speeds. During the measurements, the weather was sunny with temperatures ranging between 45 and 60 degrees. The pavement was completely dry. A radar gun in a concealed location was used to measure the traffic speed. Per IDOT guidelines, the speeds of at least 100 vehicles per lane were obtained. While there is a traffic signal at GE Road to split the study area into distinct southern and middle segments, there is no traffic control device on Hershey Road at Jumer Dive preventing the middle and northern segments from functioning as a single segment. Therefore, a fourth evaluation was

Mr. Kevin Kothe, PE November 4, 2016 Page 2
E N G IN E E R S | A R C H IT E C T S | S U R V E Y O R S | S C IE N T IS T S
completed for the entire segment between GE Road and College Avenue. Please see Exhibit 2 for data tables and calculations for these four segment analyses. Below is a summary of the results:
Segment Current Posted Speed
Posted Speed to North/South
85th Percentile
Speed
Upper Limit 10 MPH
Pace
Adjusted Prevailing
Speed
1. Rainbow to GE (Southern)
30/35 mph* 30 mph to south
39 mph 41 mph 36 mph
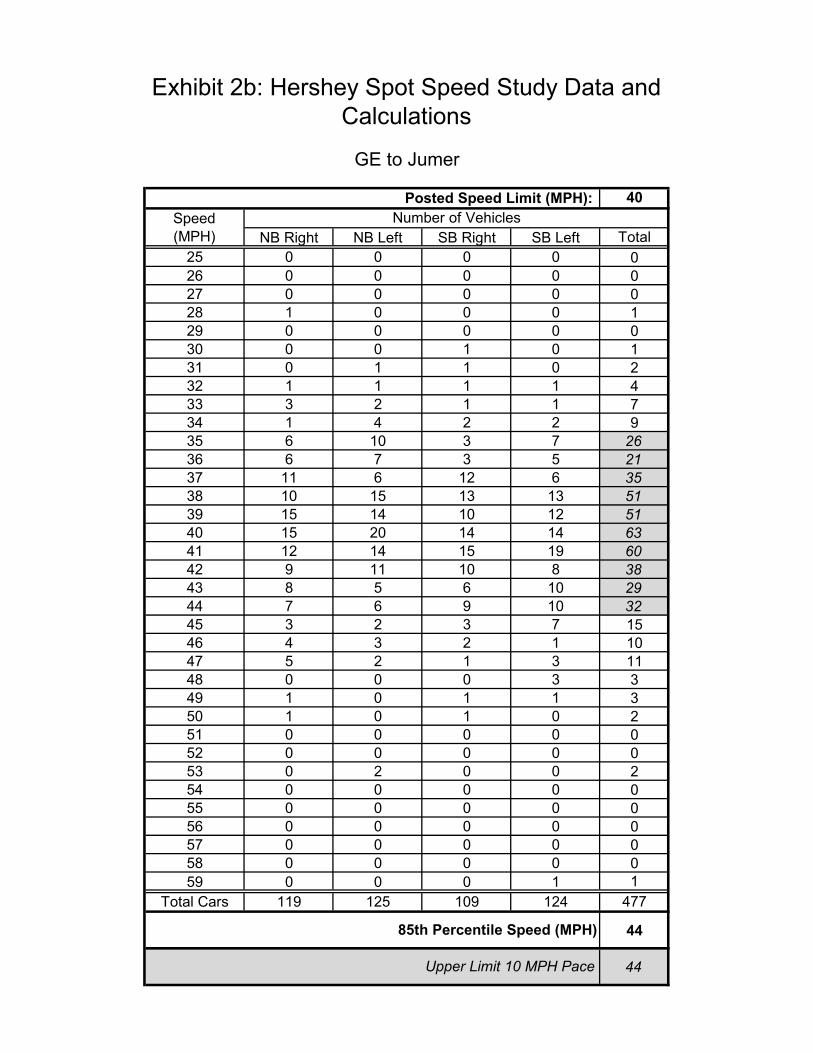
2. GE to Jumer (Middle)
40 mph -- 44 mph 44 mph 44 mph
3. Jumer to College (Northern)
40 mph 40 mph to north
42 mph 42 mph 38 mph
4. GE to College (Middle and Northern)
40 mph 40 mph to north
43 mph 43 mph 41 mph
* Posted at 35 mph for the north half of the segment and 30 mph for the south half of the segment (change is located immediately south of the entrance to La Petite Academy and north of the entrance to County Companies)
The southern section has an Adjusted Prevailing Speed of 36 mph. This is consistent with the 35 mph posted speed of the northern half of this segment. However, a posted speed of 35 mph would result in an Anticipated Violation Rate of 56%, which is slightly above the 50% maximum threshold and would suggest an alteration upward to 40 mph. A 40 mph Posted Speed would result in an acceptable Anticipated Violation Rate of 9%. It should be noted that the current Posted Speed south of this segment (and even for a portion of the segment itself) is only 30 mph. This segment currently functions as a transition segment between the 40 mph Posted Speed to the north and the 30 mph Posted Speed to the south. According to State guidelines, Posted Speeds are allowed to be transitioned in 10 mph increments, allowing this segment to be posted at 40 mph adjacent to the Posted 30 mph section to the south. Given the “transitional” nature of this segment, and since the Anticipated Violation Rate is only slightly above the 50% maximum threshold, it could be feasible to post this segment at 35 mph. Since there is not currently a traffic device stopping traffic along Hershey Road at Rainbow Avenue, it is possible that the Prevailing Speeds south of Rainbow Court are noticeably in excess of the Posted 30 mph speed. It may be beneficial to further evaluate speeds on Hershey Road to the south and look as this segment as part of a larger section.
The middle segment has an Adjusted Prevailing Speed of 44 mph. This would typically correspond to posting this segment at 45 mph. However, there are several reasons based on engineering judgment to keep this section posted at 40 mph. First, Hershey Road to the north has a prevailing speed consistent with a posted speed of 40 mph and to the south has a prevailing speed consistent with a posted speed of 35 mph. Increasing the posted speed for this relatively short intermittent section could raise the likelihood for higher travel speeds inconsistent with the segments to the north and south since it would be higher than either of these other segments. In addition, since Hershey Road is a north-south corridor through

Mr. Kevin Kothe, PE November 4, 2016 Page 3
E N G IN E E R S | A R C H IT E C T S | S U R V E Y O R S | S C IE N T IS T S
Bloomington-Normal, having varying speed limits posted throughout the corridor could lead to confusion regarding the legal speed limit as drivers travel through the corridor. Finally, this segment of Hershey Road consists of four lanes with no median and two back to back curves in opposite directions creating a winding alignment throughout the segment that is more suited for lower rather than higher speeds. Posting the speed limit at 40 mph would result in an Anticipated Violation Rate of 43%, which is below the threshold of 50% that would suggest an alteration upward.
The northern segment has an Adjusted Prevailing Speed of 38 mph. This is consistent with the speed to the north and south of this segment and suggests a Posted Speed of 40 mph based on the data gathered.
When the middle and northern segments are analyzed as a single segment stretching between GE Road and College Avenue, the Adjusted Prevailing Speed is 41 mph. This is consistent with the speed to the north of this segment and suggests a Posted Speed of 40 mph based on the data gathered.
In summary, based on the speed data gathered, Hershey Road between Jumer Drive and College Avenue should have a Posted Speed of 40 mph. Similarly, when taking engineering judgment into account as well as analyzing it together with the section to the north, Hershey Road between GE Road and Jumer Drive, Avenue should have a Posted Speed of 40 mph. Based solely on Adjusted Prevailing Speed modified for an acceptable Anticipated Violation Rate, Hershey Road between GE Road and Rainbow Avenue should have a Posted Speed of 40 mph; however, this may be reduced to 35 mph if desired. It is suggested that additional data gathering may be beneficial to the south of Rainbow Avenue and this segment re-evaluated in the context of a larger study area.
Sight Distance Evaluation
Intersection Sight Distance (ISD) was reviewed at the entrance to the Village of Spring Ridge subdivision on the west side of Hershey Road between GE Road and Jumer Drive on October 17, 2016 (See Location Map in Exhibit 1). Criteria from the Illinois Department of Transportation Bureau of Local Roads and Streets Manual (BLRS), Chapter 28 was initially used in evaluating the Intersection Sight Distance. However, due to Hershey Road having four total lanes, the BLRS Manual indicated the Bureau of Design and Environment Manual (BDE) should be used and this is the Manual referenced below. Sight distances were reviewed by visual line of sight checks in the field documented via photograph.
The posted speed at this location is currently 40 mph. To account for vehicles traveling over or under the posted speed limit, Intersection Sight Distance was evaluated for speeds ranging from 20 to 55 mph. The primary focus was on Passenger Cars (PC) as the design vehicle per Figure 36-6.C (see Exhibit 3) since the number of trucks per day at the entrance is likely well below 40 per day. However, for reference, sight distance for Single-Unit Trucks (SU) and Multiple-Unit Truck (MU) was also calculated. The height of eye and height of object were both taken to be 3.5 feet. The eye height was not adjusted for SU or MU vehicles since the lower 3.5-foot height is more conservative. The Eye Location was located 14.4 feet from the Hershey Road edge of traveled way. Gap times from Figure 36-6.D were used to calculate the distance along Hershey Road as shown in Exhibit 3. Note that the Gap times were increased as indicated in Note 1

Mr. Kevin Kothe, PE November 4, 2016 Page 4
E N G IN E E R S | A R C H IT E C T S | S U R V E Y O R S | S C IE N T IS T S
since Hershey Road is a multilane road without a median. Since the entrance approach is flatter than 3%, the gap times in Figure 36-6.D were not further modified.
The required ISD for the PC design vehicle ranged from 221 feet (20 mph) to 551 feet (50 mph) looking to the left (north) and from 235 feet (20 mph) to 588 feet (50 mph) looking to the right (south). Required ISD ranged from 338 feet (20 mph) to 845 feet (50 mph) looking to the left (north) and from 359 feet (20 mph) to 897 feet (50 mph) looking to the right (south) for the MU vehicle.
See Exhibit 4 for photos taken showing the intersection line of sight for the various speeds. As all of the distances corresponding to the lower speeds are also met for the higher speeds, photos are only presented starting with the PC @ 40 mph distances. In each photo, the person in the yellow vest (highlighted with a bright blue circle) is standing at the specified distance. The 3.5-foot object height is approximately at the stomach of the person. Due to the relatively flat terrain through the area of study along Hershey Road, ISD was never limited vertically; it was always restricted due to horizontal obstructions such as trees.
Intersection Sight Distance to the left (north) is critical for vehicles making a right turn onto Hershey Road. As illustrated in Photos 1 through 4, there is adequate ISD for PC (551 feet) and MU (845 feet) vehicles for speeds under 50 mph, which should cover the 99% of the traffic on Hershey Road per the above speed study. In addition, the maximum ISD was observed in the field to be 856 feet as seen in Photo 5. This equates to the ISD required for a PC with speeds on Hershey Road of approximately 75 mph and an MU with speeds of approximately 50 mph on Hershey Road. It should be noted that due to the curvature of Hershey Road, there may be periods during which northbound traffic will block the view of southbound traffic for several seconds, effectively reducing the ISD to around 450 feet, which is still adequate for 40 mph speeds. This can be best illustrated in Photo 1. However, this temporary reduction in ISD will be very brief as the northbound traffic clears the area and at worse, should only cause a small additional number of seconds of delay for vehicles attempting to turn onto Hershey Road.
Intersection Sight Distance to the right (south) is critical for vehicles making a left turn onto Hershey Road. As illustrated in Photos 6 through 8 there is adequate ISD for PC (588 feet) vehicles for speeds under 50 mph, which should cover the 99% of the traffic on Hershey Road per the above speed study. In addition, the maximum ISD was observed in the field to be 870 feet as seen in Photo 10. This equates to the ISD required for a PC with speeds on Hershey Road of approximately 74 mph and an MU with speeds of approximately 48 mph on Hershey Road. In this direction, the ISD for an MU vehicle does not quite reach the 50 mph speeds for Hershey Road due to the presence of a large utility box located along the west edge of Hershey Road. There is a small gap between the utility box and the start of the tree line as seen in Photos 11 and 12 large enough to allow an advance vehicle to be seen. This gap allows an ISD of 897, which is sufficient for an MU vehicle when traffic speeds on Hershey Road are 50 mph. While relying on this gap is not ideal, given that the number of MU vehicles expected to be exiting from the residential development is expected to be very low, and that speeds of 48 mph (for which there is adequate ISD) are likely to cover 98% of the traffic on Hershey (per the above speed study), this should be acceptable.
In summary, intersection sight distances were reviewed by visual line of sight checks in the field at the entrance to the Village of Spring Ridge subdivision on the west side of Hershey Road. Sight distance is available for approximately 856 feet to the left (north)

Mr. Kevin Kothe, PE November 4, 2016 Page 5
E N G IN E E R S | A R C H IT E C T S | S U R V E Y O R S | S C IE N T IS T S
along Hershey Road and for approximately 870 feet to the right (south). This is adequate ISD for both PC and MU vehicles for traffic coming from the left at speeds under 50 mph (99% of vehicles per above speed study) and from the right at speeds under 48 mph (98% of vehicles per the above speed study). For PC vehicles turning onto Hershey (the vast majority of vehicles exiting the residential subdivision), there is sufficient distance to the left for Hersey Road travel speeds up to approximately 75 mph and to the right for speeds up to 74 mph.
We appreciate the opportunity to complete this study for the City. Please feel free to contact me should you have any questions or comments.
Sincerely,
FARNSWORTH GROUP, INC.
Philip S. Allyn, PE, PTOE

N.T.S.
2709 McGRAW DRIVE
BLOOMINGTON, ILLINOIS 61704
(309) 663-8435 / [email protected]
GROUP
Date: 10/25/16
Reviewed by: PSA
Drawn by: DRR
COLLEGE AVE
GE ROAD
HERSHEY ROAD SPEED STUDY
BLOOMINGTON, ILLINOIS
EXHIBIT 1: STUDY LOCATION MAP
HE
RS
HE
Y
RO
AD
Spot Speed StudyApproximate Location 3
Spot Speed StudyApproximate Location 2
Spot Speed StudyApproximate Location 3
Intersection SightDistance Review Location

12
ESTABLISHMENT OF SPEED ZONE
DISTRICT
ROUTE: FROM: TO: LENGTH: CITY: COUNTY: I SPOT SPEED STUDIES (Attached) V ACCESS CONFLICTS
RESIDENTIAL DRIVES: X 1 = SMALL BUSINESS DRIVES: X 5 = LARGE BUSINESS DRIVES: X10 = ACCESS CONFLICT NO. TOTAL: STUDY LENGTH: = (MILES) CONFLICTS / MILE
II TEST RUNS VI MISC. FACTORS
PEDESTRIAN VOLUME: HIGH-CRASH LOCATION: YES NO PARKING PERMITTED: YES NO
III PREVAILING SPEED VII PREVAILING SPEED ADJUSTMENT
IV EXISTING SPEED LIMIT VIII REVISED SPEED LIMIT
CHECK NO.
85TH %
UPPER LIMIT 10 MPH PACE
RUN NO. AVG. SPEED
DIRECTION
1
2
3
4
5
85TH % AVG. : MPH UPPER LIMIT OF 10 MPH PACE: MPH TEST RUN AVE. : MPH PREVAILING SPEED: MPH
DRIVEWAY ADJUSTMENT: % PEDESTRIAN ADJUSTMENT: % CRASH ADJUSTMENT: % TOTAL (MAX 20%): % MPH X % = (Prevailing Speed) (adjust.) (Max. 9 MPH) ADJUSTED PREVAILING SPEED:
ZONE BEING STUDIED: MPH VIOLATION RATE: % ADJACENT ZONE N or W: MPH LENGTH: MILES ADJACENT ZONE S or E: MPH LENGTH: MILES
RECOMMENDED SPEED LIMIT: MPH ANTICIPATED VIOLATION RATE: % RECOMMENDED BY: DATE: APPROVED BY: DATE:
FIVE
Hershey Road Rainbow Avenue
GE Road
Bloomington McLean
1 39 mph 41 mph
N.A. (Short Segment)
39
41N.A.40
2
03
01520
35
0.218 161
XX
Negligable observed during data gathering
35/30*
* Posted at 35 mph for the north half of the segment and 30 mph for the south half of the segment (change is located immediately south of the entrance to La Petite Academy and north of the entrance to County Companies)
40
300.893
1.120
96% (30) 56% (35)
100010
40 10 4 mph
36 mph
35 / 40 **
0.218 miles
56 / 9** See report for discussion
EXHIBIT 2a

35/30
NB Right NB Left SB Right SB Left Total
25 0 0 0 0 0
26 0 0 0 0 0
27 0 1 1 0 2
28 2 0 1 0 3
29 3 1 2 0 6
30 4 1 5 0 10
31 3 6 8 2 19
32 4 4 5 2 15
33 8 11 8 5 32
34 11 13 16 9 49
35 19 18 25 14 76
36 14 12 13 20 59
37 13 9 10 17 49
38 15 11 13 19 58
39 6 12 12 8 38
40 3 10 5 8 26
41 3 5 6 7 21
42 0 1 3 3 7
43 1 0 0 2 3
44 0 4 0 0 4
45 1 1 0 0 2
46 1 0 0 0 1
47 1 1 0 2 4
48 1 0 0 0 1
49 0 0 0 0 0
50 0 0 0 0 0
51 0 0 0 0 0
52 0 0 0 0 0
53 0 0 0 0 0
54 0 1 0 0 1
55 0 0 0 0 0
56 0 0 0 0 0
57 0 0 0 0 0
58 0 0 0 0 0
59 0 0 0 0 0
Total Cars 113 122 133 118 486
39
41Upper Limit 10 MPH Pace
Exhibit 2a: Hershey Spot Speed Study Data and
Calculations
Rainbow to GE
Posted Speed Limit (MPH):
Speed
(MPH)
Number of Vehicles
85th Percentile Speed (MPH)

12
ESTABLISHMENT OF SPEED ZONE
DISTRICT
ROUTE: FROM: TO: LENGTH: CITY: COUNTY: I SPOT SPEED STUDIES (Attached) V ACCESS CONFLICTS
RESIDENTIAL DRIVES: X 1 = SMALL BUSINESS DRIVES: X 5 = LARGE BUSINESS DRIVES: X10 = ACCESS CONFLICT NO. TOTAL: STUDY LENGTH: = (MILES) CONFLICTS / MILE
II TEST RUNS VI MISC. FACTORS
PEDESTRIAN VOLUME: HIGH-CRASH LOCATION: YES NO PARKING PERMITTED: YES NO
III PREVAILING SPEED VII PREVAILING SPEED ADJUSTMENT
IV EXISTING SPEED LIMIT VIII REVISED SPEED LIMIT
CHECK NO.
85TH %
UPPER LIMIT 10 MPH PACE
RUN NO. AVG. SPEED
DIRECTION
1
2
3
4
5
85TH % AVG. : MPH UPPER LIMIT OF 10 MPH PACE: MPH TEST RUN AVE. : MPH PREVAILING SPEED: MPH
DRIVEWAY ADJUSTMENT: % PEDESTRIAN ADJUSTMENT: % CRASH ADJUSTMENT: % TOTAL (MAX 20%): % MPH X % = (Prevailing Speed) (adjust.) (Max. 9 MPH) ADJUSTED PREVAILING SPEED:
ZONE BEING STUDIED: MPH VIOLATION RATE: % ADJACENT ZONE N or W: MPH LENGTH: MILES ADJACENT ZONE S or E: MPH LENGTH: MILES
RECOMMENDED SPEED LIMIT: MPH ANTICIPATED VIOLATION RATE: % RECOMMENDED BY: DATE: APPROVED BY: DATE:
FIVE
Hershey Road
Jumer Drive
Bloomington McLean
1 44 mph 44 mph
N.A. (Short Segment)
44
44N.A.44
1
00
0010
10
0.402 25
XX
Negligable observed during data gathering
40
40
350.129
0.717
0000
44 0 0 mph
44 mph
40 / 45 **
0.402 miles
43 / 7
GE Road
43 ** See report for discussion
EXHIBIT 2b
40
NB Right NB Left SB Right SB Left Total
25 0 0 0 0 0
26 0 0 0 0 0
27 0 0 0 0 0
28 1 0 0 0 1
29 0 0 0 0 0
30 0 0 1 0 1
31 0 1 1 0 2
32 1 1 1 1 4
33 3 2 1 1 7
34 1 4 2 2 9
35 6 10 3 7 26
36 6 7 3 5 21
37 11 6 12 6 35
38 10 15 13 13 51
39 15 14 10 12 51
40 15 20 14 14 63
41 12 14 15 19 60
42 9 11 10 8 38
43 8 5 6 10 29
44 7 6 9 10 32
45 3 2 3 7 15
46 4 3 2 1 10
47 5 2 1 3 11
48 0 0 0 3 3
49 1 0 1 1 3
50 1 0 1 0 2
51 0 0 0 0 0
52 0 0 0 0 0
53 0 2 0 0 2
54 0 0 0 0 0
55 0 0 0 0 0
56 0 0 0 0 0
57 0 0 0 0 0
58 0 0 0 0 0
59 0 0 0 1 1
Total Cars 119 125 109 124 477
44
44Upper Limit 10 MPH Pace
Exhibit 2b: Hershey Spot Speed Study Data and
Calculations
GE to Jumer
Posted Speed Limit (MPH):
Speed
(MPH)
Number of Vehicles
85th Percentile Speed (MPH)

12
ESTABLISHMENT OF SPEED ZONE
DISTRICT
ROUTE: FROM: TO: LENGTH: CITY: COUNTY: I SPOT SPEED STUDIES (Attached) V ACCESS CONFLICTS
RESIDENTIAL DRIVES: X 1 = SMALL BUSINESS DRIVES: X 5 = LARGE BUSINESS DRIVES: X10 = ACCESS CONFLICT NO. TOTAL: STUDY LENGTH: = (MILES) CONFLICTS / MILE
II TEST RUNS VI MISC. FACTORS
PEDESTRIAN VOLUME: HIGH-CRASH LOCATION: YES NO PARKING PERMITTED: YES NO
III PREVAILING SPEED VII PREVAILING SPEED ADJUSTMENT
IV EXISTING SPEED LIMIT VIII REVISED SPEED LIMIT
CHECK NO.
85TH %
UPPER LIMIT 10 MPH PACE
RUN NO. AVG. SPEED
DIRECTION
1
2
3
4
5
85TH % AVG. : MPH UPPER LIMIT OF 10 MPH PACE: MPH TEST RUN AVE. : MPH PREVAILING SPEED: MPH
DRIVEWAY ADJUSTMENT: % PEDESTRIAN ADJUSTMENT: % CRASH ADJUSTMENT: % TOTAL (MAX 20%): % MPH X % = (Prevailing Speed) (adjust.) (Max. 9 MPH) ADJUSTED PREVAILING SPEED:
ZONE BEING STUDIED: MPH VIOLATION RATE: % ADJACENT ZONE N or W: MPH LENGTH: MILES ADJACENT ZONE S or E: MPH LENGTH: MILES
RECOMMENDED SPEED LIMIT: MPH ANTICIPATED VIOLATION RATE: % RECOMMENDED BY: DATE: APPROVED BY: DATE:
FIVE
Hershey Road Jumer Drive
College Avenue
Bloomington McLean
1 42 mph 42 mph
N.A. (Short Segment)
42
42N.A.42
1
01
0510
15
0.195 77
XX
Negligable observed during data gathering
40
40
400.402
1.120
100010
42 10 4 mph
38 mph
40
0.195 miles
2626
EXHIBIT 2c

40
NB Right NB Left SB Right SB Left Total
25 0 0 0 0 0
26 0 0 0 0 0
27 0 0 0 0 0
28 1 0 0 0 1
29 0 0 0 0 0
30 2 0 1 2 5
31 3 0 3 2 8
32 4 1 3 4 12
33 3 1 6 4 14
34 2 4 5 3 14
35 8 4 8 7 27
36 12 5 5 4 26
37 10 16 10 7 43
38 15 15 14 11 55
39 13 12 16 9 50
40 12 16 17 15 60
41 12 8 6 15 41
42 3 7 7 9 26
43 1 4 4 4 13
44 1 7 3 3 14
45 0 1 0 1 2
46 3 1 0 1 5
47 1 4 0 0 5
48 0 1 0 0 1
49 0 0 0 1 1
50 0 0 0 0 0
51 0 1 0 0 1
52 0 0 0 0 0
53 0 0 0 0 0
54 0 0 0 0 0
55 0 0 0 0 0
56 0 0 0 0 0
57 0 0 0 0 0
58 0 0 0 0 0
59 0 0 0 0 0
Total Cars 106 108 108 102 424
42
42Upper Limit 10 MPH Pace
Exhibit 2c: Hershey Spot Speed Study Data and
Calculations
Jumer to College
Posted Speed Limit (MPH):
Speed
(MPH)
Number of Vehicles
85th Percentile Speed (MPH)

12
ESTABLISHMENT OF SPEED ZONE
DISTRICT
ROUTE: FROM: TO: LENGTH: CITY: COUNTY: I SPOT SPEED STUDIES (Attached) V ACCESS CONFLICTS
RESIDENTIAL DRIVES: X 1 = SMALL BUSINESS DRIVES: X 5 = LARGE BUSINESS DRIVES: X10 = ACCESS CONFLICT NO. TOTAL: STUDY LENGTH: = (MILES) CONFLICTS / MILE
II TEST RUNS VI MISC. FACTORS
PEDESTRIAN VOLUME: HIGH-CRASH LOCATION: YES NO PARKING PERMITTED: YES NO
III PREVAILING SPEED VII PREVAILING SPEED ADJUSTMENT
IV EXISTING SPEED LIMIT VIII REVISED SPEED LIMIT
CHECK NO.
85TH %
UPPER LIMIT 10 MPH PACE
RUN NO. AVG. SPEED
DIRECTION
1
2
3
4
5
85TH % AVG. : MPH UPPER LIMIT OF 10 MPH PACE: MPH TEST RUN AVE. : MPH PREVAILING SPEED: MPH
DRIVEWAY ADJUSTMENT: % PEDESTRIAN ADJUSTMENT: % CRASH ADJUSTMENT: % TOTAL (MAX 20%): % MPH X % = (Prevailing Speed) (adjust.) (Max. 9 MPH) ADJUSTED PREVAILING SPEED:
ZONE BEING STUDIED: MPH VIOLATION RATE: % ADJACENT ZONE N or W: MPH LENGTH: MILES ADJACENT ZONE S or E: MPH LENGTH: MILES
RECOMMENDED SPEED LIMIT: MPH ANTICIPATED VIOLATION RATE: % RECOMMENDED BY: DATE: APPROVED BY: DATE:
FIVE
Hershey Road Jumer Drive
College Avenue
Bloomington McLean
1 (middle) 44 mph 44 mph
N.A. (Short Segment)
43
43N.A.43
2
01
0520
25
0.597 42
XX
Negligable observed during data gathering
40
40
350.129
1.120
5005
43 5 2 mph
41 mph
40
0.597 miles
3535
2 (north) 42 mph 42 mph
EXHIBIT 2d

Looking
Right Looking Left
Looking
Right Looking Left
PC 20 8 7.5 235 221
SU 20 10.2 9.5 300 279
MU 20 12.2 11.5 359 338
PC 25 8 7.5 294 276
SU 25 10.2 9.5 375 349
MU 25 12.2 11.5 448 423
PC 30 8 7.5 353 331
SU 30 10.2 9.5 450 419
MU 30 12.2 11.5 538 507
PC 35 8 7.5 412 386
SU 35 10.2 9.5 525 489
MU 35 12.2 11.5 628 592
PC 40 8 7.5 470 441
SU 40 10.2 9.5 600 559
MU 40 12.2 11.5 717 676
PC 45 8 7.5 529 496
SU 45 10.2 9.5 675 628
MU 45 12.2 11.5 807 761
PC 50 8 7.5 588 551
SU 50 10.2 9.5 750 698
MU 50 12.2 11.5 897 845
Exhibit 3
Intersection Sight Distance Values
Gap Acceptance Time
(seconds)
Sight Distance
(feet)Design Vehicle
Design
Speed

Illinois INTERSECTIONS September 2010
36-6.5 HARD COPIES UNCONTROLLED
20-Year ADT of Tractor/ Semitrailers on Exit Ramp
or Crossroad
Approaching Vehicle on Mainline(2)
Stopped Design Vehicle on Crossroad (1)
ADT 40 Passenger Car
h2 = 3.5 ft (h2 = 1080 mm)
Passenger Car h2 = 3.5 ft
(h1 = 1080 mm)
40 < ADT 100 Passenger Car
h2 = 3.5 ft (h2 = 1080 mm)
Single Unit (SU) or Bus h1 = 6 ft
(h1 = 1.8 m)
ADT > 100 Passenger Car
h2 = 3.5 ft (h2 = 1080 mm)
Tractor/Semitrailers (MU) h1 = 8 ft
(h1 = 2.5 m)
Notes: 1. h1 - Assumed height of eye for stopped motorist. 2. h2 - Assumes 9 in (225 mm) of top of approaching vehicle can readily be seen by
stopped motorist. 3. Where a mainline crest vertical curve lies close to an intersection of a crossroad or
ramp, it may be necessary to increase the length of the vertical curve (designed for either existing or proposed stopping sight distance) or to reduce the grades in order to obtain the proper ISD in the vertical plane.
DESIGN VEHICLES USED TO DETERMINE AVAILABLE ISD ALONG A CROSSROAD
Figure 36-6.C
EXHIBIT 3

Illinois INTERSECTIONS September 2010
36-6.6 HARD COPIES UNCONTROLLED
Design Vehicle Gap Acceptance Time (tc) (sec)
Passenger Car 7.5
Single-Unit Truck 9.5
Tractor/Semitrailer 11.5
Note: Times are for turns onto a two-lane highway without a median and may require
adjustments to the base time gaps. Adjustments: 1. Multilane Highways. The following will apply:
For left turns onto two-way multilane highways without a median, add 0.5 seconds for passenger cars or 0.7 seconds for trucks for each additional lane from the left, in excess of one, to be crossed by the turning vehicle. See discussion in Section 36-6.03(a) for additional guidance.
For right turns, no adjustment is necessary.
2. Minor Road Approach Grades. If the approach grade on the minor road exceeds +3%, the
following will apply:
For right turns, multiply 0.1 seconds times the actual percent grade on the minor road approach and add this number to the base time gap.
For left turns, multiple 0.2 seconds times the actual percent grade on the minor
approach and add this number to the base time gap. 3. Major Road Approach Grade. Major road grade does not affect calculations.
GAP ACCEPTANCE TIMES (Left and Right Turns From Minor Road)
Figure 36-6.D
EXHIBIT 3

Exhibit 4: Sight Distance Photos
Photo 1: Looking Left to 441 feet (PC @ 40 mph)

Exhibit 4: Sight Distance Photos
Photo 2: Looking Left to 496 feet (PC @ 45 mph)

Exhibit 4: Sight Distance Photos
Photo 3: Looking Left to 551 feet (PC @ 45 mph) 50
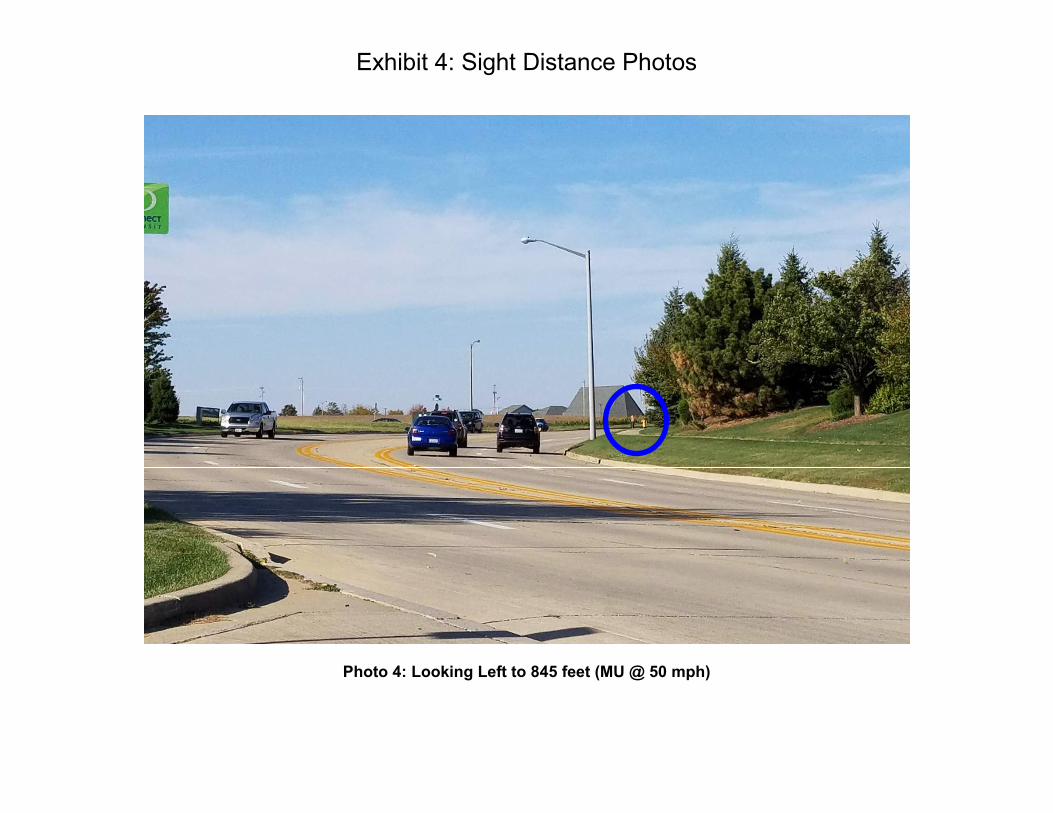
Exhibit 4: Sight Distance Photos
Photo 4: Looking Left to 845 feet (MU @ 50 mph)

Exhibit 4: Sight Distance Photos
Photo 5: Looking Left to 856 feet (MAX visible distance = PC @ ~75 mph, MU @ ~50 mph)

Exhibit 4: Sight Distance Photos
Photo 6: Looking Right to 470 feet (PC @ 40 mph)

Exhibit 4: Sight Distance Photos
Photo 7: Looking Right to 529 feet (PC @ 45 mph)

Exhibit 4: Sight Distance Photos
Photo 8: Looking Right to 588 feet (PC @ 50 mph)

Exhibit 4: Sight Distance Photos
Photo 9: Looking Right to 870 feet (MAX distance of continuous sight = PC @ ~74 mph, MU @ ~48 mph)

Exhibit 4: Sight Distance Photos
Photo 10: Looking Right to 897 feet (MU @ 50 mph) Visible Gap Between Utility Cabinet and Trees
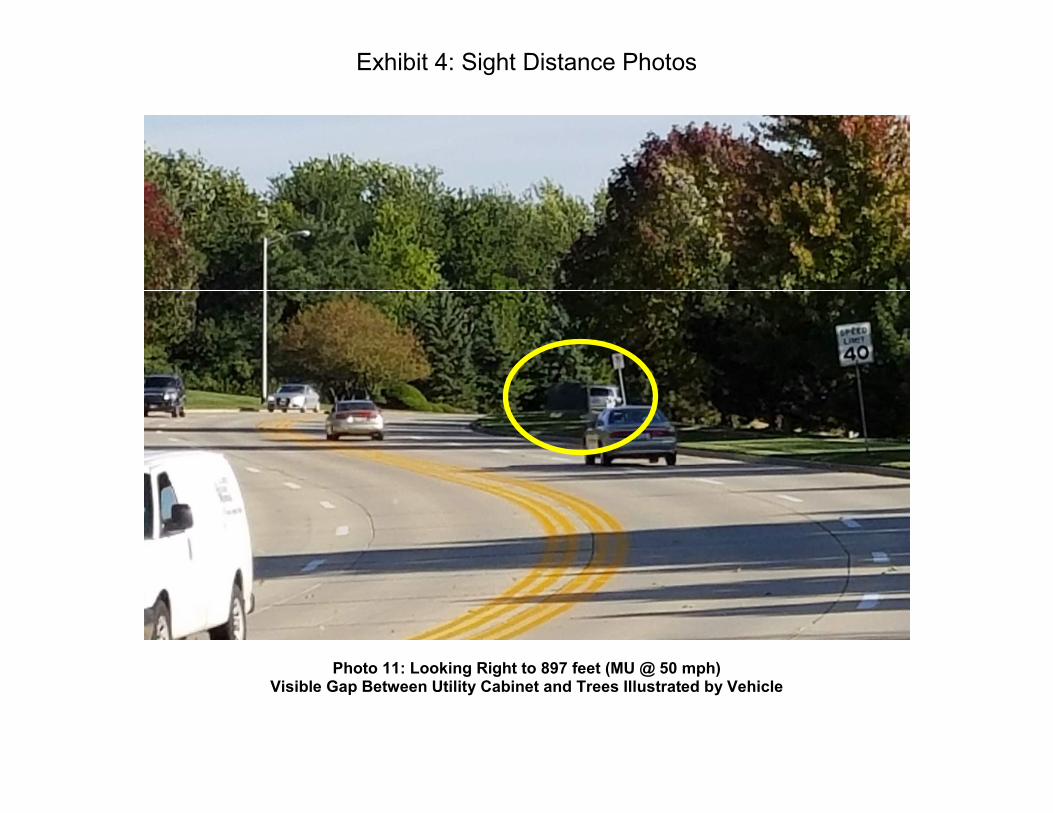
Exhibit 4: Sight Distance Photos
Photo 11: Looking Right to 897 feet (MU @ 50 mph) Visible Gap Between Utility Cabinet and Trees Illustrated by Vehicle