political economy of service delivery: monitoring versus ... · political economy of service...
TRANSCRIPT

Political Economy of Service Delivery: Monitoring versus Contestation
Kjell Hausken and Mthuli Ncube
No 172 – May 2013

Correct citation: Hausken, Kjell and Ncube, Mthuli (2013), Political Economy of Service Delivery: Monitoring
versus Contestation, Working Paper Series N° 172 African Development Bank, Tunis, Tunisia.
Steve Kayizzi-Mugerwa (Chair) Anyanwu, John C. Faye, Issa Ngaruko, Floribert Shimeles, Abebe Salami, Adeleke Verdier-Chouchane, Audrey
Coordinator
Working Papers are available online at
http:/www.afdb.org/
Copyright © 2013
African Development Bank
Angle de l’avenue du Ghana et des rues
Pierre de Coubertin et Hédi Nouira
BP 323 -1002 TUNIS Belvédère (Tunisia)
Tel: +216 71 333 511
Fax: +216 71 351 933
E-mail: [email protected]
Salami, Adeleke
Editorial Committee Rights and Permissions
All rights reserved.
The text and data in this publication may be
reproduced as long as the source is cited.
Reproduction for commercial purposes is
forbidden.
The Working Paper Series (WPS) is produced
by the Development Research Department
of the African Development Bank. The WPS
disseminates the findings of work in progress,
preliminary research results, and development
experience and lessons, to encourage the
exchange of ideas and innovative thinking
among researchers, development
practitioners, policy makers, and donors. The
findings, interpretations, and conclusions
expressed in the Bank’s WPS are entirely
those of the author(s) and do not necessarily
represent the view of the African Development
Bank, its Board of Directors, or the countries
they represent.

Political Economy of Service Delivery: Monitoring versus
Contestation
Kjell Hausken and Mthuli Ncube1
1 Kjell Hausken and Mthuli Ncube are respectively Professor, Faculty of Social Sciences, University of Stavanger
([email protected]) and Chief Economist and Vice President of the African Development Bank, Tunis, Tunisia
([email protected]). The authors gratefully acknowledge the data from the AERC and World Bank on service delivery in
Tanzania and Senegal.
AFRICAN DEVELOPMENT BANK GROUP
Working Paper No. 172 May 2013
Office of the Chief Economist

Abstract
Many communities suffer limited public
goods provision due to civil servants
(doctors, teachers, etc) supplementing
their low income with moonlighting
activities. Monitors of civil servants
commonly also earn low salaries from
monitoring and may prefer political
contestation for power and prestige. We
determine an internal equilibrium for
how monitors strike a balance between
monitoring and political contestation.
We also determine a corner solution
where an unresourceful monitor does
not monitor. A variety of characteristics
including the intensity of political
contestation are accounted for. Survey
data from Tanzania and Senegal are
used to show the significance of poor
service delivery within education and
healthcare services.
JEL Codes: C72, D72, D74
Keywords: Monitoring, public good, production, risk, game, conflict

1
1 Introduction
Many communities experience low effort or inefficiency by public officials in delivering public
services to the population at the local level. One reason is political contestation at the local authority
levels which then results in more time being spent on fighting rather than in the provision of public
goods. For example, at the individual level, doctors in Tanzania may spend ½ an hour per a day with
patients because no one is monitoring them, and teachers in Senegal may teach only about 3 hours a
day, which is less than ¾ of the required time.
Examples of professionals providing public goods to their communities are doctors and teachers. In
most countries these are more commonly publicly employed than privately employed. In many
countries governments provide too low salaries to such professions. Although individuals providing
public goods are often idealistic, limits to idealism exist. When such limits are approached or exceeded,
doctors and teachers earning too low salaries may be induced or forced to shirk on their responsibilities
to make ends meet. They may increasingly "moonlight" elsewhere to supplement their income. They
may even experience delays in receiving their salary payments, as evidence from Tanzania and Senegal
reveals. They may do something not related to their profession, or something related to their profession
through a private arrangement (e.g. private lessons for teachers or private medical services in case of
doctors). The extent of such moonlighting depends on the extent to which authorities monitor such
professionals adequately. In many communities monitoring by the authorities is lacking or absent.
At the level of doctors and teachers, they merely face an individual resource allocation problem in the
face of poor monitoring. The challenging game is at the level of the monitors. At the local level (or
indeed at the national level) monitors are involved in political contestation that absorbs their energies
and focus, resulting in poor monitoring of civil servants such as teachers and doctors. Monitors
commonly also earn low public salaries and may find it more rewarding to fight for power and position.
An example of a monitoring institution, with multiple individual monitors, in a local authority is a
council, or a body that has a strong political character, for example in a rural district in South Africa. In
this district, the ruling party members and opposition members in the council, operating as monitors,
may commonly be involved in political contestation. These monitors are thus not focusing on
monitoring but on power retention and fighting. Consequences are that professionals such as teachers
and doctors go unmonitored and shift to other activities for extra income. This causes lack of public
goods provision from which communities at large suffer.
The decentralization of government delivery channels creates local government structures and local
bureaucracies that fail to deliver the required level of services to the local population. Such local
government structures may involve various levels such as the municipal level, district level, council
level, and province level. The objectives for decentralization are to transfer real power to the districts
and improve accountability at the local level; to bring political power and administrative control over
services at the local level; to establish a stronger link between payment of taxes by citizens and
provision of services; and to capacitate the local governments in planning, financing and managing the
delivery of services to their respective constituencies. Such services include primary health care,
education, water and road infrastructure, agricultural extension services, and some elements of security
and law and order.

2
In this paper we capture this phenomenon in a model of power contestation at the local level which
results in low service delivery. Each monitor has an available resource that can be allocated to
monitoring or political contestation. Monitoring gives a salary proportional to the amount of
monitoring. Political contestation gives a fraction of power, expressed as a rent, determined by the
relative amount of political contestation exerted by all monitors.
For the model we assume a one-to-one mapping from the monitors to the teachers or doctors. That is, if
a monitor monitors x% of his time, the teacher or doctor being monitored spends x% of his time
teaching or delivering medical services. To justify this, first consider the extremes. With 100%
monitoring, assuming that the system of monitoring is set up such that it operates adequately if all
monitors do what they are supposed to do, then we can reasonably assume that the teachers and doctors
being monitored experience the monitoring regularly, and respond by doing what they are supposed to
do, that is teach and practice medicine 100% of the time. Conversely, with 0% monitoring, teachers and
doctors are left to do as they please. Additionally, they observe the dysfunctional situation where
monitors don’t monitor, which is contagious, and we can expect 0% teaching and medical practicing.
For intermediate degrees of monitoring, between 0% and 100%, we assume proportionality so that the
degree of monitoring maps directly over to the degree of teaching and the delivery of medical services.
Earlier research has been conducted by Collins and Green (1994), Kullenberg and Porter (1999),
Prud’homme (1995). Golola (2001) presents empirical analysis on the impact of decentralization and
local bureaucracies on service delivery. The theoretical frameworks for understanding the institutional
dynamics at play that impact on service delivery are analyzed by Acemoglu and Robinson (2012).
Hanushek (2003) provides some evidence on delivery of education services. Some literature has used
randomized trials in analyzing the impact of various service delivery initiatives. Case and Deaton
(1999) show, using a natural experiment in South Africa, that the impact of increasing school
resources, as measured by the student-teacher ratio, has the effect of raising academic achievement
among black students. Duflo (2001), in her study in Indonesia, finds that a school construction policy
was effective in increasing the quantity of education. By using a randomized evaluation in India,
Banerjee et al (2000) find that provision of additional teachers in non-formal education centers
increases school participation of girls. However, a series of randomized evaluations in Kenya indicate
that the only effect of textbooks on outcomes was among the better students (Glewwe and Kremer,
2006; Glewwe, Kremer and Moulin, 2002). More recent evidence from natural experiments and
randomized evaluations also indicate some potential positive effect of school resources on outcomes,
but not uniformly positive (Duflo 2001; Glewwe and Kremer 2006, Björkman, Martina, and Jakob
Svensson 2009).
Section 2 presents the model. Section 3 analyzes the model. Section 4 tests the model empirically. Section
5 concludes.
2 The Model
In the quest to deliver quality services, the process of decentralization seeks to achieve certain goals.
The goals include the desire to involve the local populations in the running of their affairs thereby
democratizing the decision-making process; mobilizing resources at the local level, to achieve more
efficiency and low costs in delivery of services, and improved accountability for service delivery to the
target local population. Often these desired goals are not achieved due to political dynamics at the local

3
level. In the model we aim to capture the nature of such political dynamics and show how they impede
service delivery objectives.
Consider n monitors. Each monitor i has a resource ri which can be considered as the number of hours
the monitor can work in a given time period, or work capacity combined with political power and other
factors relevant for monitoring and political contestation for status. Each monitor allocates his resource
into monitoring pi≥0 at unit cost ai>0, and political contestation fi≥0 at unit cost bi>0,
i i i i ir a p b f (1)
Monitoring pi generates a public good, but it also generates a basic salary to the monitor which we
assume is proportional to pi with proportionality parameter vi>0, thus causing utility pivi. For political
contestation fi we apply the ratio form contest success function (Tullock 1980). Monitor i gets a
fraction
1
1/ 0 1,...,i
m
iin m
jj
n if f for all i n
fqotherwise
f
(2)
of the status, which can be perceived as a rent R>0, where m≥0 is a contest parameter, /i iq f >0,
/i jq f <0 when i≠j. If one monitor gets higher status, the other monitors get lower status. If one
monitor captures the entire rent R through political contestation, he becomes a dictator with maximum
status, and the other monitors get no status. Conversely, without contestation the monitors share the
status equally each earning R/n. When m=0, political contestation fi has no impact on qi. No monitor
can easily get an upper hand, for example due to culture, individual abilities, or technological factors.
Examples are when chance or uncontrolled conditions impact status distribution, or in egalitarian
societies. 0<m<1 gives a disproportional advantage of exerting less political contestation than the other
monitors. When m=1, political contestation by each monitor has proportional impact on qi. m>1 gives a
disproportional advantage of exerting more political contestation than the other monitors (economies of
scale). Finally, m= gives a step function where “winner-takes-all”. Examples are highly competitive
or volatile environments, cultures with insufficiently developed institutional arrangements and
procedures, or non-egalitarian societies allowing dominant monitors or dictators to emerge.2
Assuming that monitoring and political contestation impact utility additively, ui=pivi+qiR,
each monitor’s utility is
1
m
i i i ii i n m
i jj
r b f fu v R
a f
(3)
where we have inserted (1) and (2). No binding agreements between the agents are allowed, which
means that the game is non-cooperative.
3 Solving the Model
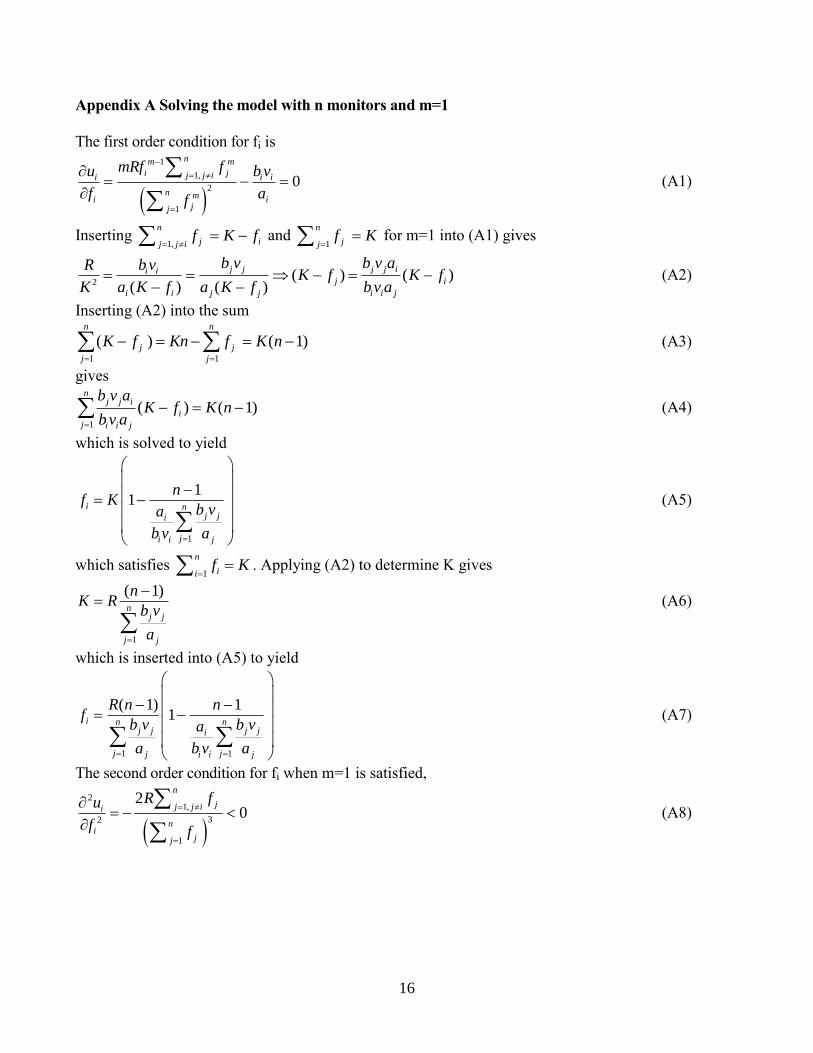
3.1 Solving the model with n monitors and m=1
Appendix A solves for Nash equilibrium to determine the efforts and utilities
2 Equation (2) is extensively used in the rent seeking literature. It expresses agents’ success in securing a rent dependent on
efforts exerted. See Tullock (1980) for the use of m, Skaperdas (1996) for an axiomatization where m plays a role, Nitzan
(1994) for a review, Hirshleifer (1995) for an illustration of the usefulness of the function for a variety of application areas,
and Hausken (1995) for recent literature.

4
1 1 1 1
1 1
( 1) 1 ( 1) 11 1
,
( 1) 11
i
n n n nj j j j j j j ji ii
ij j j jj i i j j i i j
i
i
i i i i
n nj j j jii i i
j jj i i j
R n n r R n nwhen i
b v b v b v b va abf
a b v a a b v a
rotherwise
b
r b f r R n nwhen
b v b vap a b
a b v a
,
0
i i i i
iu p v f R
otherwise
(4)
The first lines for fi and pi are the interior solution. The logic of the ratio form contest success function
is that each monitor always contests (Skaperdas 1996), i.e. exerts at least negligible effort on political
contestation, and thus fi>0.
Proposition 1. (a) If
1 1
( 1) 11i
n nj j j jii
j jj i i j
r R n ni
b v b vab
a b v a
and
ji
i i j j
aa
b v b v i,j, i≠j, then
1
( 1)i j n
j j
j j
R nf f
b vn
a
, /if n <0, /if R >0, /i if a >0, /i if b <0, /i if v <0. (b) If
1 1
( 1) 11i
n nj j j jii
j jj i i j
r R n ni
b v b vab
a b v a
,
j i ii
j i j j
a b vK f
K f a b v
where
1
( 1)n
j j
j j
nK R
b v
a
. (c) If
1 1
( 1) 11i
n nj j j jii
j jj i i j
r R n ni
b v b vab
a b v a
, pi=0 and fi=ri/bi.
Proof. Follows from (4) and (A2).
Proposition 1a assumes the interior solution and a specific sense in which the monitors are equivalent,
i.e. 1j j i ii
i i j j i j j
a a b va
b v b v a b v which implies equal political contestation by all monitors since 1i
j
K f
K f
.
Then political contestation decreases in the number of monitors. The reason is that competing with
many monitors for a fixed amount R of status is costly and efforts are beneficially shifted towards
monitoring instead. Intuitively, monitor i’s political contestation intuitively increases in the rent R.

5
Further, political contestation increases in his unit cost ai of monitoring, which makes political
contestation relatively more profitable, decreases in his unit cost bi of political contestation, which
enables generating the same level of political contestation at a lower cost, and decreases in his
proportionality parameter vi for his salary from monitoring, which makes monitoring relatively more
profitable.
For the interior solution in Proposition 1b, assume a low ratio i
j
K f
K f
<1, which means that monitor 1
engages more in political contestation than monitor 2, fi>fj. This event occurs when ai>aj, bi<bj, or
vi<vj. That is, monitor 1 engages more in political contestation than monitor 2 when his unit cost ai of
monitoring is high, his unit cost bi of political contestation is low, or his proportionality parameter vi
for his salary from monitoring is low. For the corner solution in Proposition 1c, where the monitor’s
interior equilibrium resource expenditure bifi from political contestation exceeds the monitor’s resource
ri, the monitor does not monitor, pi=0, and transforms his entire resource into political contestation,
fi=ri/bi. Interestingly, the monitor engages exclusively in political contestation when he is not
resourceful, that is, when ri is low. A large resource ri, and a low unit cost ai of monitoring, induces the
monitor to increase his monitoring pi.
3.2 Solving the model with n=2 monitors and general m
Appendix B solves for Nash equilibrium to determine the efforts and utilities
1 2 2 1 2 2
2 1 1 2 1 1
2 2
1 2 2 1 2 2
2 1 1 2 1 1
1 2 2
2 1 1
,1 1
m m
i i
i
m mi
i i i i i
i
i
m
i
i i i i
i ii
i
a b v a b va mR a mR
a b v a b vrwhen i
ba b v a b vf b v b va b v a b v
rotherwise
b
a b va mR
a b vr b f rwhen
a bpb v
2
1 2 21 2
2 1 1
,1
0
mm i
i i i m m
i
i fu p v Ra b v
f fa b v
otherwise
(5)
The second order condition (Appendix B) is satisfied when 1/
1/ 1/1 2 2 1 2 2
2 1 1 2 1 1
1( 1) ( 1)
1
m
m ma b v m a b vand m m
a b v m a b v
(6)
which holds for a range of parameter values around a common benchmark such as 1 2 2
2 1 1
a b v
a b v=m=1.
Equation (6) always holds when m≤1.
In Proposition 2 we determine how monitor 1’s political contestation f1, without loss of generality,
increases versus decreases as a function of the various parameters.

6
Proposition 2. Assume
1 2 21
2 1 11
2
11 2 2
1 1
2 1 1
1
m
m
a b va mR
a b vr
ba b v
b va b v
. (a) 1 1 2 2
2 2 1 1
f a b v
f a b v , 1 /f R >0. (b) Assume
1/ 1/1 2 2
2 1 1
( 1) ( 1)m ma b vm m
a b v . 1 1/f a >0, 1 1/f b <0, 1 1/f v <0. (c) Assume 1 2 2
2 1 1
a b v
a b v>1. 1 2/f a >0,
1 2/f b <0, 1 2/f v <0. (d) 1 / 0f m 1 2 2 1 2 2 1 2 2
2 1 1 2 1 1 2 1 1
1 1 0
m m
a b v a b v a b vm Ln
a b v a b v a b v
Proof. Follows from (B1) and from determining the sign of the first order derivative of f1 in (5) with
respect to the parameters a1,a2,b1,b2,v1,v2,R.
The political contestation ratio f1/f2 in Proposition 2a equals the ratio in Proposition 1b when n=2 and
fi+fj=1. Monitor 1’s political contestation increases in the rent R. Proposition 2b assumes what is
already assumed for the second order condition in (6) to hold. The results for the three derivatives are
the same as in the last three derivatives in Proposition 1a. In Proposition 2c monitor 1 prefers higher
political contestation than monitor 2 because he has a higher unit cost a1 of monitoring, or a lower unit
cost b1 of political contestation, or a lower proportionality parameter v1 for his salary from monitoring.
This has three implications for monitor 1’s political contestation. First, it increases if monitor 2’s unit
cost a2 of monitoring increases, thus matching monitor 2’s increased political contestation. Second, it
decreases if monitor 2’s unit cost b2 of political contestation increases, thus matching monitor 2’s
decreased political contestation. Third, it decreases if monitor 2’s proportionality parameter v2 for his
salary from monitoring increases, thus also matching monitor 2’s decreased political contestation.
The impact of the intensity parameter m is to amplify the role of 1 2 2
2 1 1
m
a b v
a b v
, where 1 2 2
2 1 1
a b v
a b v>1 causes
1 2 2
2 1 1
m
m
a b vLim
a b v
and 1 2 2
2 1 1
a b v
a b v<1 causes 1 2 2
2 1 1
0
m
m
a b vLim
a b v
. Proposition 2d implies 1 / 0f m for
the benchmark 1 2 2
2 1 1
a b v
a b v=m=1 which means that monitor 1 increases his political contestation when the
intensity parameter m increases. This result also holds for a certain range outside the benchmark. But,
when m is very large, the result may not hold for two opposite cases. First, when 1 2 2
2 1 1
a b v
a b v<1, the
logarithmic function is negative multiplied with a positive term. Second, when 1 2 2
2 1 1
a b v
a b v>1, the
logarithmic function is positive multiplied with a negative term. To illustrate, 1 2 2
2 1 1
a b v
a b v<1 when a1=a2 and
v1=v2 means that monitor 1 is disadvantaged with a high unit cost b1 of political contestation, and

7
conversely when 1 2 2
2 1 1
a b v
a b v>1. That 1 / 0f m does not hold when monitor 1 is disadvantaged means
that monitor 1 is too inferior to increase his political contestation when the intensity m increases. That
1 / 0f m does not hold when monitor 1 is advantaged means that monitor 1 is so superior that
increasing his political contestation when the intensity m increases is not worthwhile.
3.3 Corner solution when n=2, m=1, and f1=r1/b1
Assume without loss of generality that
1 2 21
2 1 11
2
11 2 2
1 1
2 1 1
1
m
m
a b va mR
a b vr
ba b v
b va b v
so that monitor 1 allocates his entire
resource on political contestation, f1=r1/b1, p1=0. The Nash equilibrium (Appendix C) is
1 2 1 2 1 1 2 1 2
1 2 2 1 2 2 1 1 2 2 1 2
2 2 1 1 2 1 22
2 2 2 1 1 2 2 1 2
2 1
2 2 1
2 2 2 2 1 1 2 1
2 2 2 1 1 2 2 1
2
,
0
r a R r a R r r a R r rwhen and
b b v b b v b b b v b b
r a R r r a R r rf when and
b b v b b b v b b
a R rwhen
b v b
r b f a R r r a R rwhen and
a b v b b b v b
p
2
2
2 1 1 2 1 2
2 2 1 1 2 2 1 2 1 2
2 2 1
2 2 2 1
0 ,m
ii i i m m
r
b
a R r r a R r r fwhen and u p v R
b v b b b v b b f f
r a R rwhen
b b v b
(7)
Proposition 3. Assume n=2, m=1, and without loss of generality that
1 2 21
1 2 1 1
2
11 2 2
1 1
2 1 1
1
a b va R
r a b v
b a b vb v
a b v
. Then
p1=r1/b1 and p2=0. If 2 1 1 2 1 2
2 2 1 1 2 2 1 2
a R r r a R r rand
b v b b b v b b
, monitor 2 strikes a balance between
monitoring and political contestation. If 2 1 1 2 1 2
2 2 1 1 2 2 1 2
a R r r a R r rand
b v b b b v b b
, monitor 2 is not
resourceful and engages exclusively in political contestation. If 2 1
2 2 1
a R r
b v b monitor 2 focuses
exclusively on monitoring.

8
Proof. Follows from (7).
The first solution in (7) expresses that monitor 2 jointly monitors and engages in political contestation.
It presupposes that monitor 2 is sufficiently resourceful, and that the rent is high, or his unit cost of
monitoring is high, or his unit cost of political contestation is low, or his proportionality parameter for
his salary from monitoring is low, compared with monitor 1’s ratio of resource to unit cost of political
contestation. In the second solution monitor 2 engages exclusively in political contestation. It
presupposes the same as the first solution except that monitor 2 is sufficiently unresourceful. In the
third solution, where the rent is low, or monitor 2’s unit cost of monitoring is low, or monitor 2’s unit
cost of political contestation is high, or monitor 2’s proportionality parameter for his salary from
monitoring is high, compared with monitor 1’s ratio of resource to unit cost of political contestation,
then monitor 2 focuses exclusively on monitoring. If the rent is high, this third solution is unlikely.
4 Empirical Observations
In this section we present some findings from a survey on service delivery in education and healthcare
in two African countries, namely Tanzania and Senegal, as reported in a study by the African
Economic Research Consortium (AERC) and World Bank (2011). In Senegal 151 facilities each for
healthcare and education were surveyed. In Tanzania, 175 facilities were surveyed in healthcare and
180 in education.
Table 1: Final sample of facilities by sector in the pilot countries
Senegal Tanzania
Rural Urban Total Rural Urban Total
Health 102 49 151 135 40 175
Education 92 59 151 132 48 180
Source: AERC and World Bank (2001)
Poor service delivery behavior shows up in teacher-absenteeism, as measured by the Absence rate. The
observations are in figure 1.
Figure 1: Absence rate: Tanzania and Senegal. Source: AERC and World Bank (2001)

9
From figure 1, about one in five teachers in Senegal, and one in four in Tanzania, are absent from
school on any given school day. The absence rate in urban schools in Tanzania is significantly higher
than in rural schools.
Next we focus on the time that children spend being taught in the classroom. Here we calculate the
scheduled hours of teaching adjusted for the time teachers are absent from the classroom on average.
Finally, from the classroom observation sessions we can measure to what extent the teacher is actually
teaching when he/she is in the classroom. Here, we use information from the classroom observations
done outside of the classroom. Specifically, the enumerator recorded every 5 minutes (for a total of 15
minutes) if the teacher remained in the classroom to teach, broadly defined, or if he/she left the
classroom. The results are in figure 2.
Figure 2: Time Children are in School being taught: Tanzania and Senegal. Source: AERC and World
Bank (2011).
Tanzanian students, on average, are taught 2 hours and four minutes a day, and half an hour less in
urban areas compared to rural areas. In Senegal students are taught 3 and a quarter hours a day, which
is higher than that for Tanzania, and this difference between the two countries persists for both urban
and rural schools. The scheduled time for teaching in Tanzania is 5 hours and 12 minutes and that for
Senegal is 4 hours and 36 minutes. Therefore the Tanzania results are too far below the scheduled
teaching time!
One of the reasons for poor service delivery by teachers is the delays in their salaries. Such delays in
salary-payments, may have an adverse effect on staff morale and therefore on the quality of service, is
measured as the proportion of teachers whose salary has been overdue for more than two months. The
data is collected directly from teachers at the school. This information captured in figure 3.

10
Figure 3: Delays in teacher Salary payments: Tanzania and Senegal. Source: AERC and World Bank
(2011).
Significant (over two months) delays in salaries do not appear to be a common problem, especially in
Senegal. In Tanzania, about 2% of the teaching staff report more than 2 months’ delay in salary, and
this happens exclusively in rural schools.
We now present the results for healthcare services. We begin with the absence rate for healthcare staff
not being in the clinic during one unannounced visit.
Figure 4: Absence rate for Healthcare Workers from Clinic: Tanzania and Senegal. Source: AERC and
World Bank (2011).
Absenteeism among healthcare workers is widespread in both Tanzania and Senegal, as shown in
figure 4. While one fifth of the healthcare workers are not in the clinic during the random spot check in
both countries, the ratio reaches one third in urban areas in Tanzania and is significantly higher than in
rural areas.
We now consider the time spent counseling patients per clinician. Clinicians were observed during a
two-hour period. The results are in figure 5.

11
Figure 5: Time Spent Counseling Patients per Clinician: Tanzania and Senegal. Source: AERC and
World Bank (2011).
For Tanzania, the average time spent counseling patients is only 29 minutes a day! For Senegal the
average time spent is 39 minutes, with more time spent in the urban areas of 1hr 35 minutes. Assuming
that a normal working day for a doctor is 8 hours, in Tanzania the doctor spends 6 % of the allocated
time counseling patients, and 8% in Senegal.
Just like the case of the teachers, there are delays in the payment of salaries for clinicians. Such delays
are likely to impact on their delivery of healthcare services. Figure 6 summaries the results.
Figure 6: Delays in the payment of salaries for Clinicians: Tanzania and Senegal. Source: AERC and
World Bank (2011).
The delay is measured as the proportion of healthcare workers whose salary is overdue for more than
two months. From figure 6, we notice that 2 percent of healthcare workers in Tanzania reported delays
in the payment of their salaries, while the figure for Senegal is higher at 5 percent. This is likely to
impact on the quality of service provision in the healthcare sector.

12
5 Example(s) linking the empirics to the model
For teachers, Figure 2 gives the ratios 0.40 and 0.71 of scheduled teaching for Tanzania and Senegal,
respectively. We assume the same ratios for the n monitors which, using (1), gives
(aipi/ri,bifi/ri)=(0.40,0.60) and (aipi/ri,bifi/ri)=(0.71,0.29), for Tanzania and Senegal, respectively. Many
different combinations of parameter values can give this equilibrium solution. To illustrate, we first
consider the solution where the two unit costs ai and bi and the proportionality parameter vi satisfy
ai/(bivi)=aj/(bjvj) i,j, i≠j for the n monitors, as in Proposition 1a, which implies
1
( 1)i i i
nj ji
i
j j
b f b R n
b vrrn
a
,
which can equal 0.6 or 0.29, for Tanzania and Senegal, respectively. Assuming equivalent monitors
across all parameters, i.e. ri=r, ai=a, bi=b, vi=v, fi=f, and n=2 monitors, give 4
bf aR
r rv , and a=r gives
4
bf R
r v . This expression equals 0.6 for Tanzania when the ratio R/v of status R to the proportionality
parameter v for salary equals 2.4, and equals 0.29 for Senegal when R/v=1.16. The different results can
thus as one hypothesis be explained by more than twice as high importance of status in Tanzania
compared with Senegal.
The difference between the degrees 0.6 and 0.29 of fighting in Tanzania and Senegal, respectively, can
be explained by the fact that in Tanzania the quality of monitoring teachers is ineffective. The
difference may also be due to the fact in Tanzania parents are not involved as much as in Senegal in the
schools where their children are pupils. The lower participation by parents reduces pressure on teachers
to be held accountable for the quality of their services. Tanzania also shows a higher level of delays in
the payment of salaries for teachers compared to Senegal (see figure 3) which would then impact on the
quality of teaching.
For doctors Figure 5 gives the ratios 0.06 and 0.08, i.e. (aipi/ri,bifi/ri)=(0.06,0.94) and
(aipi/ri,bifi/ri)=(0.08,0.92), for Tanzania and Senegal, respectively. Assuming as above, ri=r=ai=a, bi=b,
vi=v, fi=f, n=2, for doctors the ratios are R/v = 3.76 for Tanzania and 3.68 for Senegal. These results
are quite similar for Tanzania and Senegal, and can be interpreted such that monitors within medicine
assign between three and four times as much value to status compared with the proportionality
parameter v for salary. Other value choices for the parameters can also explain these results. For
Tanzania and Senegal the situation is more dysfunctional for doctors than for teachers.
5 Conclusion
We develop a model where n monitors allocate their resources into monitoring versus political
contestation for a rent. This applies for example for members of a council, with a strong political
character, in various rural districts. Monitoring consists in supervising civil servants such as doctors
and teachers such that they provide public goods. Political contestation consists in fighting with other
monitors within a monitoring institution for power and position. Monitoring generates a public good
for society at large and the recipients of monitoring, and generates a salary for the monitor which is
commonly low. Lack of monitoring causes civil servants, who are commonly also underpaid, to go
unmonitored, and they may seek income elsewhere. This causes communities to suffer decreased
public goods provision. Political contestation enhances the power of the monitor which may potentially
13
be quite lucrative. We determine how monitors strike a balance between monitoring and political
contestation.
We find that a monitor engages more in political contestation than other monitors when his unit cost of
monitoring is high, his unit cost of political contestation is low, or his proportionality parameter for his
salary from monitoring is low. We also determine a corner solution. An unresourceful monitor does not
monitor. Detrimentally, the monitor does not monitor when his interior equilibrium resource
expenditure from political contestation exceeds his resource capability. As the monitor becomes more
resourceful, he monitors to some extent if his unit cost of monitoring is low. Intuitively, a monitor
engages more in political contestation as the rent obtainable through political contestation becomes
more valuable.
We next assume that monitor 1 prefers higher political contestation than monitor 2 because he has a
higher unit cost of monitoring or a lower unit cost of political contestation, or a lower proportionality
parameter for his salary from monitoring. This implies that monitor 1’s political contestation (1)
increases if monitor 2’s unit cost of monitoring increases, (2) decreases if monitor 2’s unit cost of
political contestation increases, and (3) decreases if monitor 2’s proportionality parameter for his salary
from monitoring increases.
The intensity of political contestation amplifies the ratio between the monitors’ unit costs of monitoring
and political contestation and the proportionality parameters for their monitoring salaries. For common
benchmark parameter values, where the monitors are equally matched, increased intensity causes
higher political contestation. When the monitors are unequally matched, increased intensity may cause
lower political contestation due to strength or weakness.
We finally determine an additional corner solution. Assume that one monitor engages exclusively in
political contestation due to being unresourceful. The second monitor chooses between three strategies.
First, and unlikely, he engages exclusively in monitoring if the rent is low, or monitor 2’s unit cost of
monitoring is low, or monitor 2’s unit cost of political contestation is high, or monitor 2’s
proportionality parameter for his salary from monitoring is high, compared with monitor 1’s ratio of
resource to unit cost of political contestation. Second and third, if these unlikely conditions are not
satisfied, monitor 2 jointly monitors and engages in political contestation when resourceful, and
focuses exclusively on political contestation when unresourceful.
One implication of the model is that political contestation cannot be eradicated, but its role can be
reduced if one is aware of the logic of which factors impact how monitors allocate their resources
between monitoring and political contestation.
We have used data for Tanzania and Senegal, both African countries, to show how serious poor service
delivery is. The data are for the education and healthcare services sectors. In both sectors, and for both
countries, teachers spend far less than the designated time teaching students, and clinicians spend very
little time with patients, per day.

14
References
Acemoglu, D. and Robinson, J. (2012), Why Nations Fail: The Origins of Power, Prosperity, and
Poverty, Crown Publishers, 2012.
Amin, Samia and Nazmul Chaudhury (2008) “An Introduction to Methodologies for Measuring
Service Delivery in Education” in Amin, Samia, Das Jishnu and Marcus Goldstein (editors) Are
you Being Served? New Tools for Measuring Service Delivery, The World Bank, Washington,
D.C.
Banerjee, Abhijit, Angus Deaton and Esther Duflo (2004), “Wealth, Health, and Health Service
Delivery in Rural Rajasthan”, American Economic Review Papers and Proceedings 94(2): 326–
30.
Banerjee, Abhijit, and Esther Duflo (2005), “Addressing Absence”, Journal of Economic Perspectives
20(1): 117–32.
Besley, Timothy and Maitreesh Ghatac (2006) “Reforming Public Service Delivery”, Journal of
African Economics 16(1): 127-156.
Björkman, Martina, and Jakob Svensson (2009), “Power to the People: Evidence from a Randomized
Field Experiment on Community-based Monitoring in Uganda”, Quarterly Journal of
Economics 124(2): 735-769.
Case, Anne and Angus Deaton (1999) “School Inputs and Educational Outcomes in South Africa,”
Quarterly Journal of Economics 114(3): 1047-1085.
Chaudhury, Nazmul, Jeffrey Hammer, Michael Kremer, Karthik Muralidharan and Halsey Rogers
(2006) “Missing in Action: Teacher and Health Worker Absence in Developing Countries”,
Journal of Economic Perspectives 20(1): 91-116.
Collins, C. and A. Green (1994) Decentralization and Primary Healthcare: Some Negative Implications in
Developing Countries, International Journal of Health Services 24(3): 459-475.
Das, Jishnu, and Jeffrey Hammer, (2005) “Which Doctor? Combining Vignettes and Item-Response to
Measure Doctor Quality,” Journal of Development Economics 78: 348-383.
Das J, Hammer J, and Leonard K (2008). “The Quality of Medical Advice in Low-Income Countries”.
Journal of Economic Perspectives 22(2): 93-114.
Duflo, Esther (2001) “Schooling and Labor Market Consequences of School Construction in Indonesia:
Evidence from an Unusual Policy Experiment,” American Economic Review, 91(4): 795-814.
Filmer, Deon and Lant H. Pritchett (1999) “The Impact of Public Spending on Health: Does Money
Matter?” Social Science and Medicine, 58: 247-258.
Gauthier, Bernard and Waly Wane (2009) “Leakage of Public Resources in the Health Sector: An
Empirical Investigation of Chad”, Journal of African Economies (18): 52-83.
Glewwe, Paul and Michael Kremer, (2006) “Schools, Teachers, and Education Outcomes in
Developing Countries,” in Hanushek, E and F. Welch (editors) Handbook on the Economics of
Education, Chap 16, North Holland.
Glewwe, Paul, Michael Kremer, and Sylvie Moulin (2002) “Textbooks and Test Scores: Evidence from
a Randomized Evaluation in Kenya,” Development Research Group, World Bank, Washington,
DC.
Golola, M.L. (2001) Decentralization, Local Bureaucracies and Service Delivery in Uganda,
Discussion paper no 2001/115, UNWIDER, Helsinki.
Hanushek, Eric (2003) “The Failure of Input-Based Schooling Policies,” Economic Journal,
113(February): F64-F98.
Hausken K. (2005), “Production and conflict models versus rent seeking models,” Public Choice 123,
1, 59-93.
Hirshleifer, J. (1995), “Anarchy and Its Breakdown,” Journal of Political Economy 103, 1, 26-52.

15
Kullenberg L. and D. Porter (1999) Decentralization and Accountability: Recent Experiences from
Uganda, Agriculture and Development, 6, 1,
Leonard K., M.C. Masatu, and A. Vialou (2007) “Getting doctors to do their best”, The Journal of
Human Resources 42: 682-700.
Maestad, Ottar, Gaute Torsvik and Arild Aakvik (2010) “Overworked? On the Relationship Between
Workload and Health Worker Performance”, Journal of Health Economics 29: 686-698.
Nitzan, S. (1994), “Modelling Rent-Seeking Contests,” European Journal of Political Economy 10,
Prud’homme, R. (1995) The Dangers of Decentralization”, World Bank Research Observer, 10, 2, August.
Skaperdas, S. (1996), “Contest Success Functions,” Economic Theory 7, 283-290.
Tan, Jee-Peng, Julia Lane, and Paul Coustere (1997) “Putting Inputs to Work in Elementary Schools:
What Can Be Done in the Philippines?” Economic Development and Cultural Change, 45(4):
857-879.
Tullock, G. (1980), “Efficient Rent-Seeking,” in Buchanan, J.M., Tollison, R.D., and Tullock, G.,
Toward a Theory of the Rent-Seeking Society, Texas A. & M. University Press, College
Station, 97-112.
16
Appendix A Solving the model with n monitors and m=1
The first order condition for fi is
1
1,
2
1
0
nm m
i jj j ii i i
n mi ijj
mRf fu b v
f af
(A1)
Inserting 1,
n
j ij j if K f
and
1
n
jjf K
for m=1 into (A1) gives
2( ) ( )
( ) ( )
j j j j ii ij i
i i j j i i j
b v b v aR b vK f K f
K a K f a K f b v a
(A2)
Inserting (A2) into the sum
1 1
( ) ( 1)n n
j j
j j
K f Kn f K n
(A3)
gives
1
( ) ( 1)n
j j i
i
j i i j
b v aK f K n
b v a
(A4)
which is solved to yield
1
11i n
j ji
ji i j
nf K
b va
b v a
(A5)
which satisfies 1
n
iif K
. Applying (A2) to determine K gives
1
( 1)n
j j
j j
nK R
b v
a
(A6)
which is inserted into (A5) to yield
1 1
( 1) 11i n n
j j j ji
j jj i i j
R n nf
b v b va
a b v a
(A7)
The second order condition for fi when m=1 is satisfied,
21,
32
1
20
n
jj j ii
ni
jj
R fu
f f
(A8)

17
Appendix B Solving the model with n=2 monitors and general m
Solving (A1) for n=2 gives
1 2 22
2 1 1 1 2 22 1 22
2 1 11 2 2
2 2
2 1 1
,
1
m
m
a b va mR
a b v a b vf f f
a b va b v
b va b v
(B1)
The second order condition is
22
2 3
( 1) ( 1)0
( )
m m m m
i j i ji
m m
i i j
mRf f f m f mu
f f f
(B2)
Appendix C Corner solution when n=2, m=1, and f1=r1/b1
The first and second order conditions for f2 are 2
2 1 1 2 2 2 1 1
2 2 3
2 2 1 1 2 2 2 1 1
/ 2 /0, 0
( / ) ( / )
u Rr b b v u Rr b
f f r b a f f r b
(C1)

18
Recent Publications in the Series
nº Year Author(s) Title
171 2013 Therese F. Azeng & Thierry U. Yogo
Youth Unemployment And Political Instability In Selected
Developing Countries
170 2013 Alli D. Mukasa, Emelly Mutambatsere,
Yannis Arvanitis, and Thouraya Triki Development of Wind Energy in Africa
169 2013 Mthuli Ncube and Eliphas Ndou Monetary Policy and Exchange Rate Shocks on South African
Trade Balance
168 2013 Anthony Musonda Simpasa Competition and Market Structure in the Zambian Banking
Sector
167 2013 Ferdinand Bakoup Promoting economic reforms in developing countries
Rethinking budgetary aid?
166 2012 Sosthene Gnansounou and Audrey
Verdier-Chouchane
Misalignment of the real effective exchange rate: When will
the CFA need to be devalued again?
165 2012 Ahmed Moummi Mobilization of fiscal resources in Niger and its impact on
households’ living standards
164 2012 Ousman Gajigo Closing the Education Gender Gap: Estimating the Impact of
Girls’ Scholarship Program in The Gambia
163 2012
Christopher Adam, David Kwimbere,
Wilfred Mbowe and Stephen O’Connell
Food Prices and Inflation in Tanzania
162 2012
Evans Osabuohien, Uchenna R. Efobi
and Adeleke Salami
Planning to Fail or Failing to Plan: Institutional Response to
Nigeria’s Development Question
