political freedom and economic prosperity
TRANSCRIPT
8/7/2019 political freedom and economic prosperity
http://slidepdf.com/reader/full/political-freedom-and-economic-prosperity 1/56
Political and Economic Freedoms and Prosperity
by
Richard Roll and John Talbott*
June 19, 2003
.
Roll Talbott
AddressAnderson School, UCLA110 Westwood PlazaLos Angeles, CA 90095-1481
2260 El Cajon Boulevard#201San Diego, CA 92110
Voice 310-825-6118 619-772-3849Fax 310-206-8404 619-295-5036
E-Mail [email protected] [email protected] * We thank The Heritage Foundation (especially Gerald O’Driscoll, Aaron Schavey and AnaEiras) for compiling the data used in their Index of Economic Freedom. Thanks are due also toFreedom House, The World Bank and Angus Maddison for painstaking data compilation. DaronAcemoglu pointed us to some very useful historical data. Larry Diamond helped us immensely bycorrecting our sample of democratic and anti-democratic events. We are also grateful for constructive comments and suggestions from Jagdish Bhagwati, Eric de Bodt, Alfredo Eisenberg,Milton Friedman, Dominique Hanssens, Ross Levine, Steven Lippman, Alan Meltzer, Larry Press,Robert Putnam, Dani Rodrik, Stephen Ross, David Rothman, Zane Spindler, Avanidhar Subrahmanyam, and participants at the 2002 Alamos Alliance, the UCLA Marschak Colloquium
and the development workshop in the UCLA department of economics.
8/7/2019 political freedom and economic prosperity
http://slidepdf.com/reader/full/political-freedom-and-economic-prosperity 2/56
Political and Economic Freedoms and Prosperity
Abstract
Across the countries of the world, annual GNI/capita varies by a factor of almost 100, from $440 inSierra Leone to $41,230 in Luxembourg (in 1999.) Past literature has often associated countrywealth with culture, geography, history and religion, but nothing can be done about such influencesover a short horizon, and probably little can be done over generations. We seek instead to uncover the “deep” determinants of wealth; i.e., those macroeconomic, structural, political and institutionalconditions realistically amenable to change. We find surprisingly good news; more than 80% of
the international variation in GNI/capita can be explained by mutable determinants. Fourteencandidate determinants are examined over five recent years (1995-99 inclusive.) Property rights(+) and black market activity (-) have the highest levels of significance. Also contributing to theexplanation are regulation (-), inflation (-), civil liberties (+), political rights (+), press freedom (+),government expenditures (+) and trade barriers (-) (but not trade levels.). To check that thesevariables represent causes and are not the effects of high income, we also trace the trajectories of GNI/capita before and after political liberalizations or dictatorial retrenchments over the past half-century. Liberalizations are, on average, followed by dramatic improvement in country income,
while substantial reductions in growth typically follow anti-democratic events. We conclude thatcountries can develop faster by enforcing strong property rights, fostering an independent judiciary,attacking corruption, dismantling burdensome regulation, allowing press freedom, and protectingpolitical rights and civil liberties. These features define a healthy environment for economicactivity
8/7/2019 political freedom and economic prosperity
http://slidepdf.com/reader/full/political-freedom-and-economic-prosperity 3/56
Political and Economic Freedoms and Prosperity
I. Introduction
The great disparity in the wealth of nations is common knowledge. For a long time,
economists have tried to understand why some countries are rich, while others are poor.
Why do some countries have healthy and growing economies, while others stagnate at low
levels of output? Why are only a few of the developing countries really developing?
There is little variation in human DNA across countries of the world and thus little
variation in basic human nature. This suggests that the enormous economic differences are
caused, at least to some extent, by politically determined local conditions.
Judging solely by the amount of academic research in this area, it is an issue of obviousfascination to economists. More important, it is critical for our planet. Approximately
80% of the human race lives in poverty. At the very bottom, roughly one billion live on
less than $1 per day, and about half, or three billion, live on less than $2 per day.
Many studies have attempted to explain country economic growth rates with a variety of factors. Unfortunately, it is very difficult to find meaningful and significant correlations
between economic growth rates and candidate explanatory variables. There are a number
of reasons. Growth rates within each country vary considerably from year to year, or even
within the same year, (Easterly et al. [1993]). This inherent noise masks the correlation of
growth with even strong explanatory variables. Moreover, many countries, especially
developing countries, do not always report economic statistics timely or accurately. Time
slippage between the dependent and independent variables attenuates any correlation that
might otherwise be observed. Finally, big, successful, wealthy, developed countries just
don’t grow that fast in percentage terms They have more critical mass to move which

8/7/2019 political freedom and economic prosperity
http://slidepdf.com/reader/full/political-freedom-and-economic-prosperity 4/56
In this study, we use GNI per capita, rather than economic growth, as a measure of
economic well-being. GNI per capita is much more stable than growth. And, as noted
earlier, there is enormous variation in income per capita across the countries of the world.
Robert Hall and Charles Jones [1999] first pointed out the benefits of using levels, rather
than growth rates, in studying this issue. Their study achieved significant results, which
we will discuss in more detail below.
We would like to answer a very practical question: What can governments do to speed
economic development? In seeking an answer, it is senseless to consider physical
exogenous variables such as latitude, or to advise reformation of religious beliefs,
ethnicity, and culture, or to wring our hands about past events such as colonialism and war.
For a similar reason, we will not spend time on obvious correlates with income such as
capital investment, human capital, and technology. High levels of physical and human
capital, and advanced technology are indeed associated with wealth. But no government
bent on improving wealth would be grateful for the advice, “increase capital and
technology.” In a sense, explaining wealth by capital and technology is explaining wealth
by wealth itself. It provides no guide to action. Instead, we must focus on
macroeconomic, structural, political and institutional conditions that can be manipulated
by a government to achieve maximum incomes per capita within the constraints of its
immutable circumstances. We must try to uncover the deep determinants of development
that actually drive more proximate factors.
A helpful analogy is to the forces driving a common stock’s price movement. An amateur day-trader might mention supply and demand as “proximate” determinants. On the other
hand, a finance professional might argue that the stock price is determined by deeper
influences such as the company’s prospective net cash flow. Although both are correct, the
8/7/2019 political freedom and economic prosperity
http://slidepdf.com/reader/full/political-freedom-and-economic-prosperity 5/56
Our primary types and sources of data are the components of The Index of Economic
Freedom published by The Heritage Foundation; political, civil and press freedom
statistics compiled by Freedom House; income per capita data from The World Bank and
Maddison [2001]; and political events from the CIA Factbook. These sources provide
fourteen different candidates for deep determinants of GNI/capita. Non-linear
transformations of the basic variables are also employed here because we lack an a priori
opinion about functional form. Substantial cross-correlations among some of these
variables is controlled by standard econometric methods.
The results are robust. The adjusted R square is between 81% and 85% for each of the five
sample years, and nine of the original 14 explanatory variables are significant in every
year, with t-statistics (absolute values) from 2 to12.
Property Rights (+), Black Market Activity (-) and Regulation (-) have the highest levels of
significance. This points to the importance of knowing the rules of the game and being
confident that the rules will be enforced. Political Rights (+), Civil Liberties (+) and
Freedom of the Press (+) are also highly significant, supporting the view originally
promulgated by Milton Friedman [1962]; economic development seems to go hand in hand
with political freedom. Three other variables are also significant: Monetary Policy or
Inflation (-), Trade Barriers (-) and Government Expenditures (+) as a percentage of GDP.
Surprisingly, though Trade Barriers represent a significant drag on GNI per capita, actual
trade levels (exports as a percentage of GDP) are insignificant. This seems to suggest thattrade barriers proxy for factors unrelated to trade itself. Corruption comes to mind because
trade barriers distort import and export prices, thereby providing an opportunity for
enrichment through smuggling. Smugglers who befriend government officials probably
8/7/2019 political freedom and economic prosperity
http://slidepdf.com/reader/full/political-freedom-and-economic-prosperity 6/56
It appears that the critical ingredient of a successful development policy is a fair and just
system that invites profitable economic exchange among participants, with no risk of
expropriation or repudiation. Effective good government is essential, as the significant
explanatory variables reflect collective actions that no individual entrepreneur can provide
alone. Once a developing country government establishes the rules to a fair game and
ensures their enforcement, it would be well advised to stand back and enjoy the self-
generating growth.
II. Review of the Literature.
The existing literature has investigated a variety of possible determinants of country
growth rates or income per capita. These include but are not limited to, democracy, trade
barriers, property rights, corruption, monetary policy, political instability, civil liberties,
religion, colonization, geographic location, and cultural values. The following summary
based on Aron (2000) covers some, but not all, of the academic papers and books on the
subject. The list is organized by explanatory factor.
Democracy
Kormendi and Mequire (1985); Scully (1988); Sachs and Warner (1995); Savvides (1995);
Alesina et al. (1996); Barro (1996); Ghura et al. (1996); Perotti (1996); Isham et al.
(1997); Easterly and Levine (1997); Temple and Johnson (1998); De Vanssay and Spindler
(1992); Helliwell (1994); Goldsmith (1995); Dawson (1998).
Trade BarriersNg and Yeats (1999); Bhagwati (1988); Krueger (1983); Sachs and Warner (1995);
Frankel and Romer (1999).
Property Rights

8/7/2019 political freedom and economic prosperity
http://slidepdf.com/reader/full/political-freedom-and-economic-prosperity 7/56
Corruption
Mauro (1995); Clague et al. (1996); Helliwell (1996a); Knack and Keefer (1997a).
Monetary Policy
Green (1986); McKinnon (1973); Van Wijnbergen (1983); Arrieta (1988).
Political Instability
Clague et al. (1996); Alesina and Rodrik (1994); Persson and Tabellini (1994), Alesina et
al. (1996); Isham et al. (1997); Barro (1991); Murphy et al. (1991); Ojo and Oshikoya
(1994); Sachs and Warner (1995); Caselli et al. (1996); Levine et al. (1996); Easterly and
Levine (1997); Hassan and Sarna (1996); Perotti (1996); Collier (1999).
Civil Liberties
Collier (1996); Scully (1998); Levine and Renelt (1992); Helliwell (1994); Sachs and
Warner (1995); Savvides (1995); Alesina et al. (1996); Barro (1996); Ghura et al. (1996);
Perotti (1996); Isham et al. (1997); Spindler (1991); Dawson (1998).
Culture and Society
Inglehart (1994); Helliwell (1996a, 1996b); Knack and Keefer (1997b); Helliwell and
Putnam (1995); Mauro (1995); Perotti (1996); Eaterly and Levine (1997).
Many of these studies begin with a simple theoretical production function format of the
form
O= f ( K, L, P )
Where O=Output, K=Investment Capital, L=Human Capital and P=Productivity.
Following the work of Solow [1956], Barro [1991] and Mankiw, Romer and Weil [1992],
this leads to a typical regression of the form:
Growth in Income = B0 + B1(Initial Income) + B2(Human Capital) + B3(Physical
Capital) + B4(Population) + B5(Variable to be Tested) + ε.
8/7/2019 political freedom and economic prosperity
http://slidepdf.com/reader/full/political-freedom-and-economic-prosperity 8/56
olds who have graduated from high school.1 The “variable to be tested” is usually one or
several of the variables taken from the list above.
There are several difficulties with this approach, in addition to its use of growth rates rather
than levels. First, both sides are essentially measuring the same thing. The left side
measures a flow from wealth, while the physical and human capital variables on the right
side measure the stock of wealth. Obviously, if one regresses wealth on wealth plus some
“true” determinant of wealth, the latter doesn’t have much opportunity to be detected as
significant.
Moreover, human capital improvements seem likely to be partly the result of increasing
technology because workers in more advanced economies will find employment difficult
to secure if they are not relatively skilled. This suggests that a technology-adjusted
measure of human capital might provide a better predictor of its true influence on wealth.
In an effort to test this idea, we conducted a simple experiment. We regressed human
capital (average years of schooling of 25+ year olds) on a measure of technological
development, the number of R&D researchers per thousand people in the country. There
were 72 countries in our sample that reported both items during 1999. The adjusted R-
square for the regression was 57.8% and the t-statistic for the technology variable was
9.92. The residuals from that regression were taken as a technology-adjusted indication of
human capital and used as the explanatory variable in a second regression with 1999
GNI/capita as the dependent variable. To our surprise, technology-adjusted human capital
(i.e., the residuals) had zero explanatory power (Adjusted R square 0.9%.)
2
Admittedly, this conflicts to some extent with Barro [2001], who examines real per capita
GDP growth rates in three separate decades and about 100 countries. Among his
8/7/2019 political freedom and economic prosperity
http://slidepdf.com/reader/full/political-freedom-and-economic-prosperity 9/56
and a measure of inflation. He also includes the initial level of log(GDP) and its square
plus measures of education, fertility, and investment. His main focus, education, turns out
to have mixed effects on growth. For example, educational attainment at higher levels by
females is unrelated to growth, which Barro suggests might indicate that “women are not
well utilized in the labor markets of many countries,” p. 16. When educational quality is
measured by “internationally comparable examinations in science, mathematics and
reading…,” Barro finds that science tests in particular are strongly related to growth.
Regardless of whether education causes technology to improve, or whether increased
technology requires job applicants to achieve greater schooling, our residual analysis above
implies that education has little correlation with country income beyond the correlation
between income and technological prowess. Because technological prowess is so closely
related to productivity, and output per worker is so highly related to GNI/capita, there can
be little probative value from including human capital measures in an explanatory model
whose findings are destined to guide practical reforms. The relationship is, at best,
proximate and self-evident, and at worst not even causal, but a result of a greater demand
in advanced countries for higher-skilled and better-educated workers.
Many previous papers tested only a few variables at a time and, of course, this does not
allow for cross-correlations among all candidate independent variables and could
conceivably result in spurious inferences. An included variable could be proxying through
correlation for the truly causative but omitted factor. Levine and Renelt [1992] recognized
this problem and developed a method to test all possible explanatory variables against eachother for significance. The shear number of reasonable candidates, estimated at over 50 by
Levine and Renelt, made one large multiple regression impossible, given the number of
countries that reported data for all the variables.
8/7/2019 political freedom and economic prosperity
http://slidepdf.com/reader/full/political-freedom-and-economic-prosperity 10/56
robust in explaining the dependent variable. Unfortunately, they conclude that none of the
independent variables tested, including many that had previously been reported as
significant, turn out to be robust. In their terminology, all appear extremely fragile for
explaining growth.
Xavier Sala-i-Martin took a new approach to this same problem in his wonderfully named
paper “I Just Ran Two Million Regressions.” [1997]. Sala-i-Martin exhibited dramatic
personal productivity improvements of his own, as his working paper on this subject was
titled, “I Just Ran Four Million Regressions.” He recognized that Levine and Renelt’s test
was so strong that almost no variable could pass it. Rather than assigning a variable a
robust or fragile label based on its ability to pass every regression test, he reports an ex
post level of confidence for a variable’s significance. Sala-i-Martin examined 60 variables
that had previously been reported as significant in explaining growth, and found 21 that
really were according to his procedure. These include geographic, political, and religious
variables, openness to trade and ideas, and others.
Doppelhofer, Miller and Sala-i-Martin [2000] applied a novel Bayesian approach to the
same problem. By 2000, the list of possible explanatory variables had increased “to the
hundreds.” They limited testing to variables that (a) did not change during the period
examined, thus eliminating corruption, bureaucracy and other potential important factors;
(b) fit theoretical models such as Solow’s; and (c) had many data points reported. This
reduced the list of examined variables to 32.
After ten million regressions, (a slippage in personal productivity for Sala-i-Martin), the
authors found that four variables were strongly and robustly related to growth. They were
the initial level of GDP per capita, the percentage of GDP in mining activities, the Sachs
8/7/2019 political freedom and economic prosperity
http://slidepdf.com/reader/full/political-freedom-and-economic-prosperity 11/56
While we applaud the authors’ thoroughness and diligence, we have a number of concerns.
First, endemic multicollinearity can reduce measured statistical significance even when the
examined variables are proxying for something relevant. Second, potentially important
variables were omitted by insistence on a constant number of observations over time.
Third, the inclusion of clearly exogenous variables such as latitude, continent dummies and
religion, masks other potentially meaningful influences yet provides no information to a
country’s government about which course of action might offer the greatest opportunity for
accelerated development. Unless one believes that countries should begin preaching
Confucianism to encourage economic growth, such information is quaint but irrelevant.
Finally, the authors restricted their analysis to linear relations.
Using variables such as continent dummies or latitude could represent a subtle form of data
mining; i.e., it might be based on the researcher’s casual and personal world observations.
Everyone knows that much of the tropics, whether Asia, Africa or Latin America, lags in
development. Consequently, latitude correlates well with wealth, though the counter-
example of Singapore suggests that latitude is not truly causative. Besides, even if latitude
really is causative, one cannot easily move a country to a cooler climate.
In our opinion, one of the best recent papers on this subject is Hall and Jones [1999]. They
focus attention on output levels, rather than growth rates. They devise a composite
variable they call “social infrastructure”. It is the average of two indices, the first
measuring the degree of government anti-diversion policies including such activities asmaintaining law and order, preventing corruption, maintaining bureaucratic quality, and
avoiding risk of appropriation and government repudiation of contracts. The second index
is a measure of a country’s openness to international trade. This index, taken from Sachs
8/7/2019 political freedom and economic prosperity
http://slidepdf.com/reader/full/political-freedom-and-economic-prosperity 12/56
Hall and Jones achieve admirable statistical significance in explaining levels of output; the
coefficient of social infrastructure variable has (absolute) t-statistics from 5 to 8 across
various specifications. In an attempt to control for possible feedback from the dependent
variable, the authors introduce latitude, predicted trade share and fraction of population
speaking English or a European language as exogenous instruments. They conclude that
social infrastructure is meaningfully correlated with output, and that social infrastructure is
largely “determined historically by location and other factors in part captured by
language.”
Hall and Jones’ methods are sophisticated and their results are encouraging. By
subsuming many different variables in a single index they avoid the lack of reported
significance induced by multicollinearity. But by employing only one composite index,
they leave open questions about the relative importance of each component. For example,
is corruption more important than trade openness, bureaucracy more critical than property
rights?
The measure of trade openness developed by Sachs and Warner [1995] that comprises half
of Hall and Jones’ index of social infrastructure, has come under attack recently by
Rodriguez and Rodrik (R&R) [2000]. They argue that after further analysis, it is not the
components reflecting trade openness, namely trade tariffs and non-tariff barriers that
explain the openness index’ ability to predict growth. Instead, the most important index
sub-component turns out to be the black market premium on the country’s exchange rate.
R&R correctly point out that black market premiums could actually indicate governmentcorruption rather than trade openness. This is because artificially constrained exchange
rates provide government leaders the opportunity to reward friends and associates with
sweetheart deals on currency conversions at the so-called official rate.
8/7/2019 political freedom and economic prosperity
http://slidepdf.com/reader/full/political-freedom-and-economic-prosperity 13/56
caution. These instruments (e.g., latitude, fraction of population speaking a European
language) are certainly correlated with the historical development of social infrastructures.
But it would be a mistake to think of them as pre-requisites for development. Assuming,
as we do, that people are pretty much the same the world over regardless of language,
latitude, or religion, just because hundreds of years ago thousands of card-carrying
European capitalists settled in more moderate climates does not prevent tropical countries
today from benefiting tremendously by adopting feasible policies favorable to
development.
Rodrik’s [2001] recent working paper asks what are the “deep determinants” of economic
performance across countries. He states that “on the empirical front, the search for
correlates of growth has gone beyond economic variables (such as physical and human
capital, and price distortions)” to examine more fundamental influences. In his view,
investment capital, human capital and productivity changes are “proximate” determinants
at best. He believes the deeper determinants are three-fold: geography, trade integration
and institutions. Although we may disagree as to what the deep determinants are, we
admire Rodrik’s distinction between proximate and deep determinants and we adopt his
terminology henceforth in our analysis.
III. Data.
Our data are described in Table 1. They are all available on the internet at the websites of the individual sources. For ease of interpretation, we reversed the scale of four variables,
Property Rights, Political Rights, Civil Liberties and Freedom of the Press, from their
original source, so that now a larger value is associated intuitively with a higher degree of
8/7/2019 political freedom and economic prosperity
http://slidepdf.com/reader/full/political-freedom-and-economic-prosperity 14/56
We also broke the Heritage Foundation’s Fiscal Burden Index into its two constituents,
Taxes and Government Expenditures, in order to check their separate influences.
Heritage’s Fiscal Burden index is the simple average of two of its own sub-indices, the
first measuring levels of personal and corporate tax rates, and the second reflecting levels
of government expenditures as a percentage of GDP. Heritage’s summary tax rating is our
Taxes variable, and their raw government expenditures as a percentage of GDP is our
Government Expenditures variable. We selected raw percentages for the Government
Expenditures variable, because Heritage’s summary rating score is based on different
scales for developed versus developing countries.
For four countries, GNI/capita data are not reported by the World Bank, but we were able
to find them in the CIA World Factbook. Depending on the year, approximately nine
countries were missing data on Government Expenditures. Following a procedure
employed by Hall and Jones [1999], we regressed government expenditures on all the
other explanatory variables, using countries with complete data, and then filled in the
missing countries using the regression estimates in each year. We did not use the
dependent variable, GNI/capita, in this construction. By filling in this one missing
variable, an additional nine countries could be included in the final sample.
For the supplemental investigation of cause and effect in Section VI, we collected country
background information from the 2001 CIA Factbook [2001] and historical GNI/capita
data from Maddison [2001].
IV. The Cross-Sectional Evidence.
8/7/2019 political freedom and economic prosperity
http://slidepdf.com/reader/full/political-freedom-and-economic-prosperity 15/56
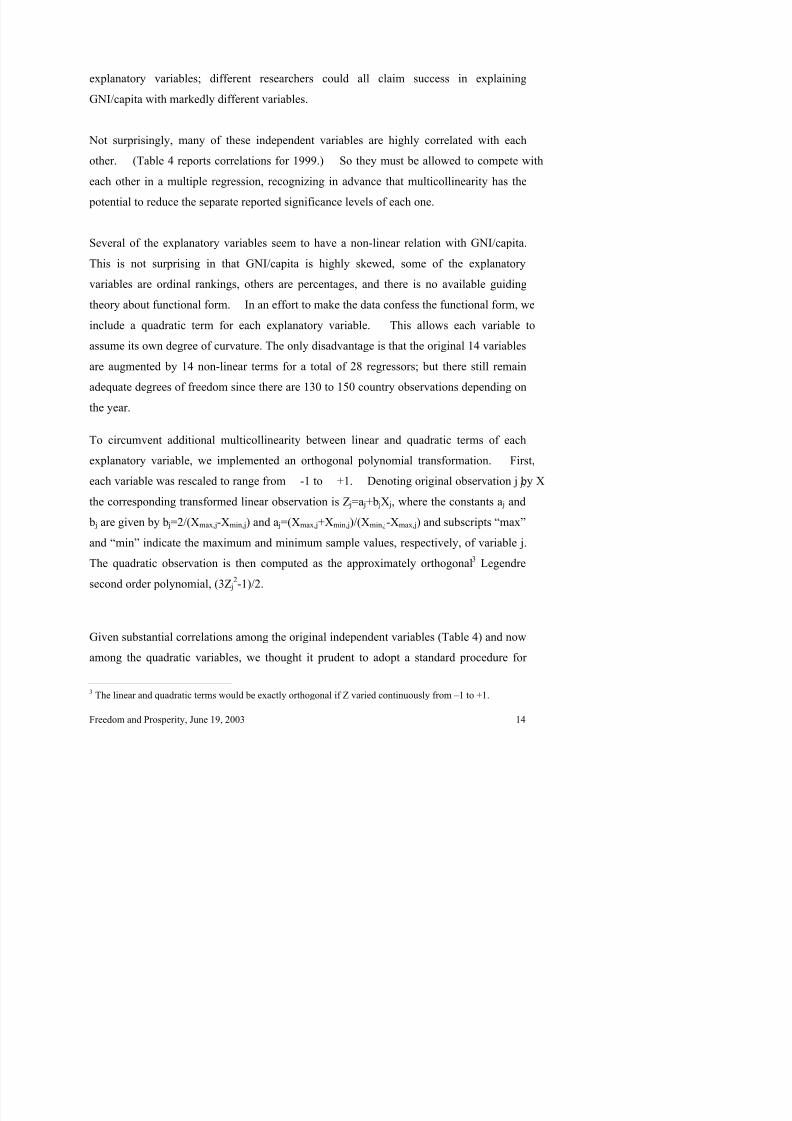
explanatory variables; different researchers could all claim success in explaining
GNI/capita with markedly different variables.
Not surprisingly, many of these independent variables are highly correlated with each
other. (Table 4 reports correlations for 1999.) So they must be allowed to compete with
each other in a multiple regression, recognizing in advance that multicollinearity has the
potential to reduce the separate reported significance levels of each one.
Several of the explanatory variables seem to have a non-linear relation with GNI/capita.
This is not surprising in that GNI/capita is highly skewed, some of the explanatory
variables are ordinal rankings, others are percentages, and there is no available guiding
theory about functional form. In an effort to make the data confess the functional form, we
include a quadratic term for each explanatory variable. This allows each variable to
assume its own degree of curvature. The only disadvantage is that the original 14 variables
are augmented by 14 non-linear terms for a total of 28 regressors; but there still remain
adequate degrees of freedom since there are 130 to 150 country observations depending on
the year.
To circumvent additional multicollinearity between linear and quadratic terms of each
explanatory variable, we implemented an orthogonal polynomial transformation. First,
each variable was rescaled to range from -1 to +1. Denoting original observation j by Xj,
the corresponding transformed linear observation is Zj=aj+bjXj, where the constants aj and
bj are given by bj=2/(Xmax,j-Xmin,j) and aj=(Xmax,j+Xmin,j)/(Xmin,j-Xmax,j) and subscripts “max”
and “min” indicate the maximum and minimum sample values, respectively, of variable j.
The quadratic observation is then computed as the approximately orthogonal3 Legendre
second order polynomial, (3Zj2-1)/2.
8/7/2019 political freedom and economic prosperity
http://slidepdf.com/reader/full/political-freedom-and-economic-prosperity 16/56
multicollinearity, regression on principal components (Cf. Judge, et. al. [1985, pp. 909-
912]). In the present instance, this procedure can be justified theoretically because the
explanatory variables are merely proxies for the underlying, but unobservable, latent
conditions that bring higher country incomes. It seems likely that the total number of such
conditions is less than the number of proxy variables available. An examination of the
eigenvalues from the 28X28 correlation matrix of the explanatory variables, however,
indicates the presence of quite a few latent variables. The first principal component
explains about 30% of the variance and the percentage explained reaches 90% only around
the 14th principal component. Consequently, we decided to simply cut the dimensionality
in half by employing the first fourteen principal components as regressors.
The fourteen estimated regression coefficients were then transformed back into the original
28-dimensional space, thereby producing a coefficient and a t-statistic for each original
variable. This well-known procedure is tantamount to OLS regression subject to a set of
linear restrictions corresponding to the eigenvectors of the regressor correlation matrix.
Because of these restrictions, the standard errors can often be disentangled precisely even
in the presence of multicollinearity.
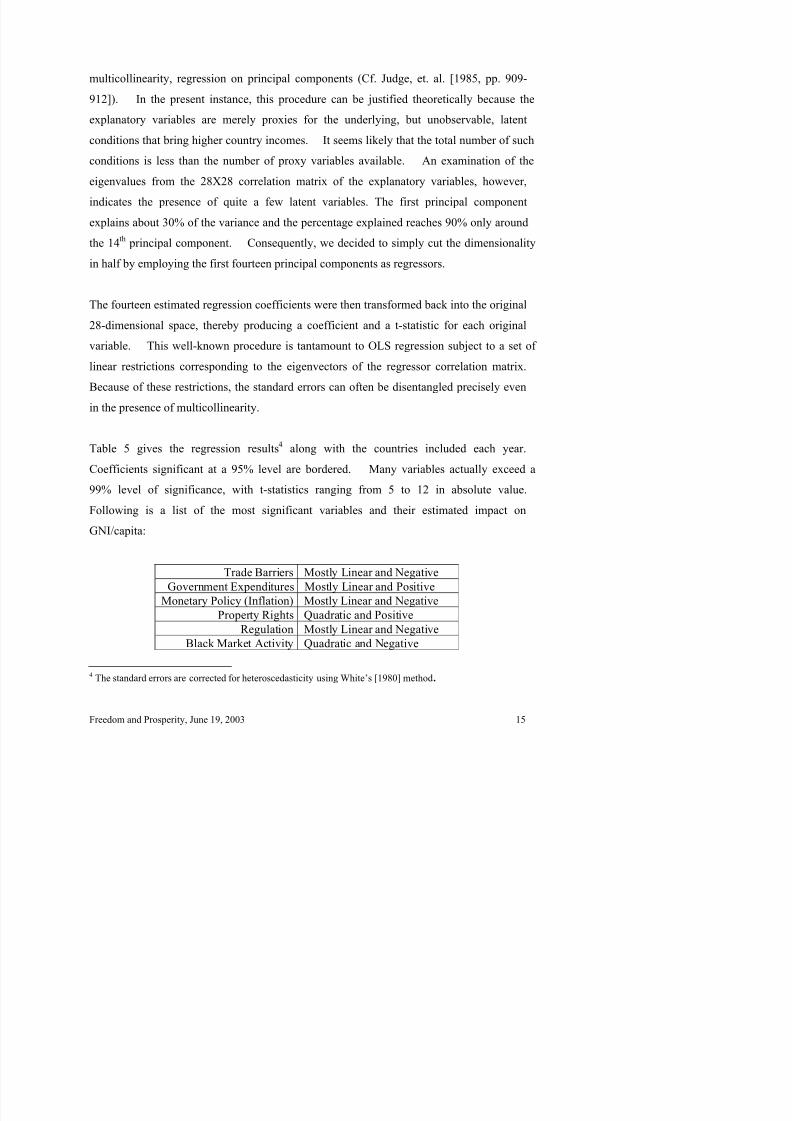
Table 5 gives the regression results4 along with the countries included each year.
Coefficients significant at a 95% level are bordered. Many variables actually exceed a
99% level of significance, with t-statistics ranging from 5 to 12 in absolute value.
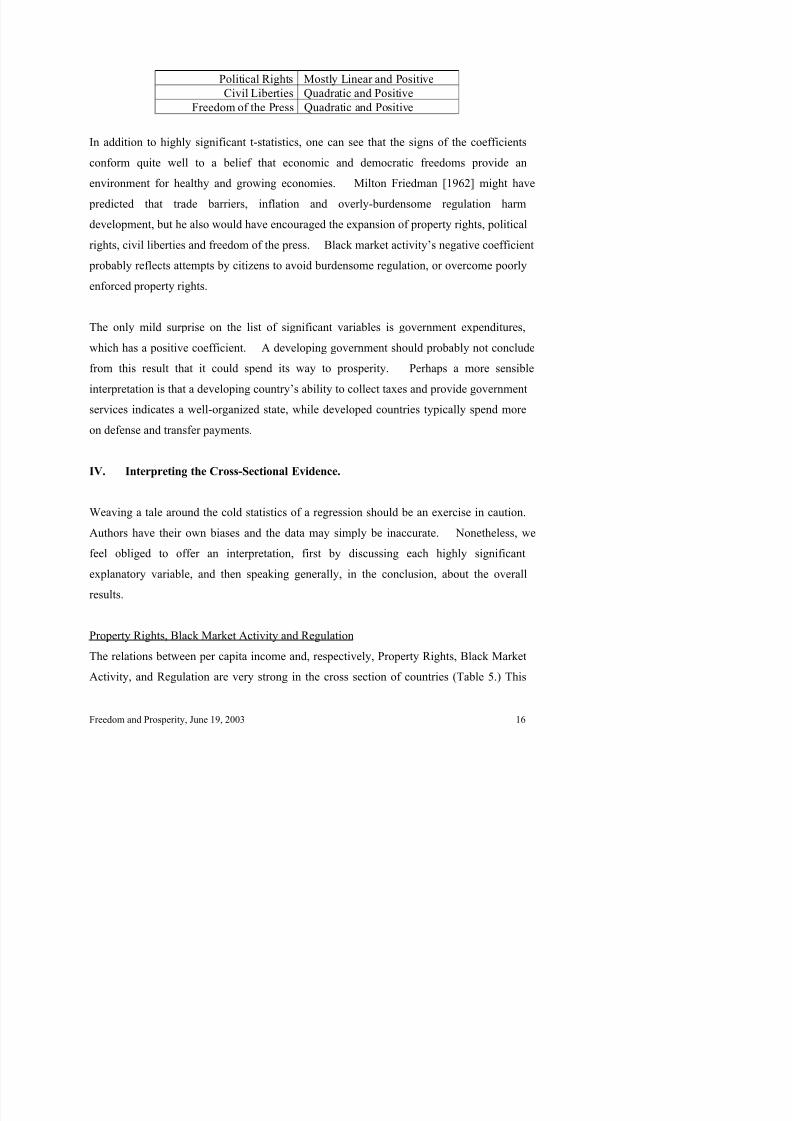
Following is a list of the most significant variables and their estimated impact on
GNI/capita:
Trade Barriers Mostly Linear and Negative
Government Expenditures Mostly Linear and Positive
Monetary Policy (Inflation) Mostly Linear and Negative
8/7/2019 political freedom and economic prosperity
http://slidepdf.com/reader/full/political-freedom-and-economic-prosperity 17/56
Political Rights Mostly Linear and Positive
Civil Liberties Quadratic and Positive
Freedom of the Press Quadratic and Positive
In addition to highly significant t-statistics, one can see that the signs of the coefficients
conform quite well to a belief that economic and democratic freedoms provide an
environment for healthy and growing economies. Milton Friedman [1962] might have
predicted that trade barriers, inflation and overly-burdensome regulation harm
development, but he also would have encouraged the expansion of property rights, political
rights, civil liberties and freedom of the press. Black market activity’s negative coefficient
probably reflects attempts by citizens to avoid burdensome regulation, or overcome poorly
enforced property rights.
The only mild surprise on the list of significant variables is government expenditures,
which has a positive coefficient. A developing government should probably not conclude
from this result that it could spend its way to prosperity. Perhaps a more sensible
interpretation is that a developing country’s ability to collect taxes and provide government
services indicates a well-organized state, while developed countries typically spend more
on defense and transfer payments.
IV. Interpreting the Cross-Sectional Evidence.
Weaving a tale around the cold statistics of a regression should be an exercise in caution.
Authors have their own biases and the data may simply be inaccurate. Nonetheless, wefeel obliged to offer an interpretation, first by discussing each highly significant
explanatory variable, and then speaking generally, in the conclusion, about the overall
results.
8/7/2019 political freedom and economic prosperity
http://slidepdf.com/reader/full/political-freedom-and-economic-prosperity 18/56
brings up an interesting issue; many researchers have recommended increased capital
investment and accelerated human capital development to improve the lot of developing
countries. But if the criticisms of world aid programs voiced by Easterly [2001] are well
founded, throwing money at the problem may not be the solution.
With strong property rights and a well functioning judicial system, enterprising
entrepreneurs could probably find adequate labor and capital. A lack of capital would
represent an unusual profit opportunity for an aggressive and clever entrepreneur. With
adequate property rights, developing countries might not require much external assistance.
Their economies could percolate up from the inside. If the rulebook of capitalism is fixed
and fair and enforced, perhaps energetic self-interest will find the path of accelerated
development.
Because property rights are weak in many developing countries, foreigners, fearful of
expropriation, eschew direct capital investment. Smugglers resort to the black market for
imported goods. Multinationals are slow to build factories and plants for fear that they will
be nationalized.
There is another explanation of how weak property rights can retard development. Many
believe small business is the major engine of economic growth. In the US, for example,
more than 2/3 of the new jobs established each year are created in industries dominated by
small businesses. To motivate entrepreneurs, the creators of small businesses, their efforts
must be protected and rewarded by a strong property rights system. The Peruvian
economist, Hernando de Soto [2000], articulates this idea as follows:
The poor inhabitants of these (developing) nations - five-sixths of humanity - dohave things, but they lack the process to represent their property and createcapital. They have houses but not titles; crops but not deeds; businesses but not
8/7/2019 political freedom and economic prosperity
http://slidepdf.com/reader/full/political-freedom-and-economic-prosperity 19/56
De Soto goes on to say that these people live in an informal, or black market, economy.
Without proper title to their homes and their businesses, they cannot secure a loan, cannot
find insurance, cannot hook-up utilities, and have no incentive to improve their property
because they cannot realize a fair price from selling their homes or businesses.
It is interesting to note that in addition to Property Rights and Black Market Activity, one
of the other statistically relevant variables in our analysis is Regulation. De Soto [1989]
explains that excessive regulation forces individuals to conduct business informally. De
Soto talks of the 728 bureaucratic steps required in Lima, Peru for someone to acquire
legal title to his or her home. It takes 280 days to register a business in Peru, something
that takes an afternoon in the US. Such excessive regulation may be a collusive attempt by
existing middle class business owners and government employees to restrain the poor from
competing in their lines of business.
How large is this informal sector? Worldwide, De Soto [2000] estimates it at $9.3 trillion.
Not only is this number staggeringly large, and outside the national accounting system of
the countries, (so it would not appear in official GNI/capita calculations), but because of
problems with achieving legal ownership, it is destined to stagnate. Growth cannot comewithout capital, and capital will not come without formal ownership.
Political Rights, Civil Liberties and Freedom of the Press
Perhaps not surprisingly, the above three variables are highly correlated with each other
(Table 4), for each is a hallmark of an open, democratic society. They are not, however, all
measuring the exact same thing for their t-statistics (Table 5) reveal that each one has an
independent strong positive influence on country income.
8/7/2019 political freedom and economic prosperity
http://slidepdf.com/reader/full/political-freedom-and-economic-prosperity 20/56
possible for people to become better educated and more involved in their government. In
other words, higher incomes can cause democracy.
Why might the reverse actually be true? William Talbott [2001], discussing the
universality of human rights, argues that democratic institutions and freedom of the press
are important information mechanisms. They allow citizens to provide feedback to
government leaders about the effectiveness of policies and their impact on general welfare.
Talbott argues that dictators, surrounded by yes men, are cut off from meaningful
information about how they are doing. In an autocratic world with no independent news
editorials, no street protests and no second party voting, a careless dictator remains
blissfully uninformed. You just don’t regularly see monarchs walking down the street, like
Ed Koch did in New York, asking average citizens the question he made famous, “How’m
I doin’?”
Out-of-touch leaders are an ancient and continuing political phenomenon. Feedback is
essential to assure that government adopts policies benefiting citizens. To the extent that
government policies have a material impact on the economy, such feedback is a significant
element driving growth. Nobel Laureate Amartya Sen [1981] [1999], made one of themost startling economic discoveries of our generation when he found that no democracy in
history had ever suffered a famine. His first point is that famines are economic events, not
natural disasters like droughts. Second, he proposed that even the most horrific economic
events could be avoided if the leaders of a country have sufficient, effective and timely
feedback from their citizens about real or perceived threats to their well-being. Only open,
democratic systems can provide leaders this constant and important feedback.
In addition to information feedback provided by open conditions, democratic institutions
8/7/2019 political freedom and economic prosperity
http://slidepdf.com/reader/full/political-freedom-and-economic-prosperity 21/56
become a prime diverter itself, resulting in government expropriation of property and
government repudiation of contracts.
In an autocratic world with few democratic rights, a leader is not constrained from multiple
forms of diversion. Protecting monopolistic positions in certain industries, doling out
foreign currency at artificially determined official exchange rates, imposing limits on
domestic agriculture prices, providing overstaffed and overpaid government jobs, and
outright bribery, extortion and corruption are all methods used by autocrats to tax average
citizens and transfer wealth to friends. Many developing countries have a powerful
constituency of government employees, protected industry participants and landed
aristocrats, that conspire to keep the existing system in place, to the detriment of
democratic reform and economic development.
War is a more immediate and disastrous economic result of maintaining too much power in
too few hands. A dictator can send his country to war over the slightest infraction or insult
to his ego. The average citizen, the one at risk, has no voice. By contrast, in a democracy,
the immediate families at risk decide whether to fight.
A curious, and rather small subset of autocracies have a “benevolent dictator,” one who is
not motivated by his, or his friends’ welfare; but who has only his citizen’s interests at
heart. Four problems: First, there is no assurance that a benevolent dictator today will be
benevolent tomorrow, and once political rights are surrendered, they can be very difficult
to reacquire [W. Talbott 2001]; Second, many non-benevolent dictators, who are doing
great harm to their economies and their citizenry, hide behind the false label of
benevolence; Third, even if a dictator has the best intentions, without the feedback
mechanisms of open democracy, he will not have easy access to the information essential
8/7/2019 political freedom and economic prosperity
http://slidepdf.com/reader/full/political-freedom-and-economic-prosperity 22/56
Other Significant Variables
There are three other significant variables in our model. Monetary Policy is the weighted
average of a country’s inflation rate for the last ten years. Excessive inflation is typically a
sign that a country is printing excess currency, usually in an attempt to fund a government
deficit. To the extent that a significant budget deficit results from a poorly managed
federal government, or reflects either an excessively large government or a corrupt
government unable to control spending - then high inflation rates can be a proxy for poor
government.
There is another possible explanation of inflation’s explanatory power: It might have
something to do with measuring costs of living across countries; i.e., it might be acting as a
proxy for possible measurement error in translating GNI/capita data across countries.
Trade Barriers is also a statistically significant variable. This is no surprise, as many, (e.g.,
including Sachs and Warner [1995]) have stressed the importance of openness in achieving
the comparative advantages of trade, and exposing a country to new ideas and new
technologies. We are not convinced, however, that the impact of trade barriers is actually
attributable to trade itself. Using 1999 data, a simple bivariate regression of GNI/capita ontrade levels (measured as exports as a percentage of GDP) has an adjusted R-square of
6.5% and a t-statistic of 3.26, (139 countries.) But when the trade variable is added as
another regressor in our multivariate model, its t-statistic is -1.03 (134 countries.) The
coefficient is negative and insignificant, so it seems doubtful that a country can export its
way to growth.
The significance of trade barriers and the insignificance of trade levels suggest that the
former is simply an indicator of poor government policies. Trade barriers, such as high
8/7/2019 political freedom and economic prosperity
http://slidepdf.com/reader/full/political-freedom-and-economic-prosperity 23/56
Perhaps surprisingly, the linear coefficient for Government Expenditures is positive and
significant. At first, this might appear to debunk the view that government spending and
taxation are impediments to a free market and growth. In advanced societies with
substantial entitlement programs and transfer payments, governments might be a brake on
economic activity. But many developing countries have just the opposite problem. They
have too little government spending. Until they establish an efficient tax collection
process, they cannot generate enough revenue to provide basic services and infrastructure.
The quadratic coefficient for government spending is negative in most years and
marginally significant in two years. The overall evidence suggests that government
spending at low levels is proxying for efficient government organization (such as in tax
collecting and providing basic services), but that it is attenuated at the high end by its drag
on the economy.
VI. Checking for Possible Mis-specification in the Cross-Country Model.
The regressions in Table 5 have adjusted R-squares between 81% and 85% and similar
patterns of significance across the five sample years. Although pleased with the power andconsistency, we recognize that every cross-sectional analysis has shortcomings.
VI.A. Cause and Effect.
First and foremost among the list of possible problems is the issue of endogeneity; i.e.,
higher country income could conceivably cause larger values of the explanatory variables
rather than the reverse. The true direction of causality is not only of scientific interest; it is
critical for policy. Unfortunately, there is no sure way to identify cause and effect using
8/7/2019 political freedom and economic prosperity
http://slidepdf.com/reader/full/political-freedom-and-economic-prosperity 24/56
In every case, we have chosen candidate variables amenable to policy control, so a future
confirming experiment is possible. But to date, no country has offered itself as the guinea
pig for such an experiment. There remain several possible methods such as employment of
panel data5
and instrumental variables6. We choose, however, an econometrically simpler
but more intuitive alternative: examine what happened in the past to country incomes when
they independently made policy changes.
Conditions that might plausibly be effects of higher incomes, rather than causes, include
those associated with economic and political freedoms, i.e., those that are characteristics of
free markets and democracy. The basic question is whether political and market reforms
bring about economic conditions that lead to more rapid economic development; or
conversely, whether exogenous improvements in income precede and precipitate better
education and more informed citizens yearning for democracy.
In an effort to resolve this issue, we borrowed the events study method used widely in
financial economics for isolating the impact of a particular corporate event. The first
events study was Fama, Fisher, Jensen and Roll [1969] who examined the impact of splits
on the market prices of stocks. Hundreds of other events studies have since beenpublished.
The event of interest here is a material change in a country’s economic and/or political
freedom for better or worse. The two possible directions of change define distinct event
categories. The first category includes events such as free elections being held for the first
time, the overthrow of dictators, the addition of second party voting, etc. For want of a
better term, we call these “democratic” events. The second category includes events such
as military coups, dictatorial takeovers, or the suspension of a constitution, which we term
8/7/2019 political freedom and economic prosperity
http://slidepdf.com/reader/full/political-freedom-and-economic-prosperity 25/56
Diamond, we refined the list to include only what we jointly agreed were truly democratic
and anti-democratic events. Recognizing the possibility that there could be considerable
disagreement about assigning such labels, we opt for full disclosure and report the
resulting event sample by type and country in Table 6.
GNI/capita data were taken from Maddison [2001], who has compiled them over at least
the last 50 years. All GNI data are reported in 1990 Geary-Khamis constant international
dollars, (Cf. Maddison [1995], pp. 164-179.) In collecting the sample of events, we
included all identifiable countries without any consideration whatsoever of their historical
patterns of income.
The event study approach lines up countries by date relative to the event date, which in our
case is denoted as Year 0. GNI/capita for each country was tabulated from ten years
before the event to 20 years after, whenever possible. However, three decades of data are
not always available, often because the event happened recently, or too soon after GNI data
became available. In some instances, the country simply failed to report GNI in one or
more years.
Each country’s GNI/capita data were used to compute year-to-year percentage changes
relative to the event year (Year 0.) This allows us to take cross-country averages of
percentage changes each relative year thereby weighting countries equally, regardless of
their initial state of prosperity. It also permits the depiction of a typical GNI/capita pattern
over all three decades even though some countries are missing data.
Table 7 reports average annual growth rates of GNI/capita for different time periods and
event categories. To depict the time path of GNI/capita, we first linked growth rate
8/7/2019 political freedom and economic prosperity
http://slidepdf.com/reader/full/political-freedom-and-economic-prosperity 26/56
relatives before and after Year 0, then rescaled the resulting numbers so that GNI/capita is
the actual cross-country average in Year 0.7
The result appears as Figure 1.
As the Table and Figure show, political and economic freedom (“democratic”) events have
been followed by significant increases in GNI/capita. The average sample country was
experiencing little real growth in the decade prior to the event, less than one percent per
annum, so there is little evidence of prior prosperity that might have triggered a move to
democracy. After the event, these same countries began to grow rapidly. In the first five
years, they accelerated to an annual rate of 2.2%. This was followed by a 1.7% annual
growth rate in the next five years and then to 2.7% in the subsequent decade. The right
panel of Table 7 shows that these differences are generally statistically significant.8
To conclude that the event itself was not causative, one would be forced to rely on a truly
convoluted story; viz., that the mere anticipation of future prosperity impelled citizens to
hector their government into reforming. Moreover, the quantitative impact is enormous.
To put it in perspective, a 3.8% annual real growth is sufficient to double per capita real
income every 18.6 years. To the extent that such reforms remain effective today, all the
countries of the world could be out of poverty within the lifetimes of their youngestchildren.
Countries in the “anti-democratic” event sample had been experiencing modest growth,
about 1.5%, during the decade prior to the event. Afterward, growth declined to less than
1% per annum in the second five-year period (years +6 to +10.) During the second decade
after the event, these countries had only about half as much growth on average as they
experienced in the decade prior to the event. Moreover, in no sub-period did their growth
rate approach the level enjoyed by countries that experienced a democratic event. The
8/7/2019 political freedom and economic prosperity
http://slidepdf.com/reader/full/political-freedom-and-economic-prosperity 27/56
pattern displayed in Figure 1 and the statistical tests in Table 7 constitute compelling
evidence that democracy-related changes by a country’s government cause changes in per
capita income.
For several reasons, the two event categories need not be mirror images. One reason is that
countries in the anti-democratic sample had generally lower wealth prior to the event,
possibly due to negative prior experiences such as colonization or civil war, which also
might have precipitated the accession of dictators. In addition, democratic features such as
a free press and civil liberties are not the only causative factors behind rapid development;
trade barriers, monetary policy, and government expenditures have some explanatory
power. Nor is an anti-democratic event inevitably followed by uniformly poor policy
choices. A good example is Chile, whose democratically elected Marxist government was
ousted in 1973. Chile thereafter had a dictator, but a rare one who adopted relatively
enlightened economic policies including a respect for property rights.
The average sample country experiencing a democratic event had approximately 80%
higher income prior to the event than the average sample country experiencing an anti-
democratic event. It might be argued that a threshold level of income, and possiblyeducation, must be attained before democratic events are likely. We admit this is a
compelling argument, but it does not negate our findings about causality. Whenever such
events occur for whatever reason, more rapid economic development follows soon
thereafter. True, democratic events might be easier to bring about in richer countries, but
wealth is clearly not a theoretically necessary condition and Table 6 shows that many
democratic events actually have occurred in poor countries.
VI.B. Missing Determinants.
8/7/2019 political freedom and economic prosperity
http://slidepdf.com/reader/full/political-freedom-and-economic-prosperity 28/56
cross-country variation in GNI/capita. Nonetheless, we provide in the Appendix an
investigative search because significant omitted variables could conceivably alter the
pattern of significance of the variables already included.
As explained in detail in the appendix, it appears that something has indeed been
overlooked. Given the events study just described, one obvious candidate for an omitted
variable is the elapsed time since a country has undergone a democratic event. Such events
precipitate rapid growth, but it still takes time to achieve a high level of GNI/capita. The
appendix confirms that the total time since a democratic event is indeed a significant
additional factor in the cross-sectional model.
Inclusion of the elapsed time since a democratic event weakens, but does not eliminate, the
statistical significance of the three other democracy-related variables, political rights, civilliberties, and press freedom. Given that all four variables measure democratic conditions,
this is not too surprising, and it does not, of course, moderate the basic conclusion that
democratic conditions cause high incomes. None of the other significant variables is
affected; in particular, trade barriers, property rights, black market activities, regulation,
monetary policy, and government spending are all virtually unaltered.
Although we cannot prove it unequivocally, we strongly suspect that another seemingly
omitted variable involves measurement error in GNI itself. The GNI/capita data were
adjusted in the original sources in an effort to portray true standards of living across
countries. This is, of course, an exceedingly difficult task. Fortunately, since pure
measurement error is random noise, it is not likely to affect the coefficients or statistical
significance of other explanatory variables. In partial confirmation, the appendix shows
that proxies for measurement error do not materially influence the significance pattern of

8/7/2019 political freedom and economic prosperity
http://slidepdf.com/reader/full/political-freedom-and-economic-prosperity 29/56
VII. Conclusion.
Data for 1995 through 1999 indicate that more than eighty percent of the cross-country
variation in wealth (GNI/capita) can be explained by nine separate influences. The most
significant and consistent positive influences are strong property rights, political rights,
civil liberties, press freedom, and government expenditures. The negative significant
influences include excessive regulation, poor monetary policy, black market activity and
trade barriers.
When countries undertake a democratic change such as deposing a dictator, they enjoy a
dramatic spurt in economic growth, which persists for at least two decades. In contrast, an
anti-democratic event is followed by a reduction in growth. This verifies that democratic
conditions really are causes of cross-country differences in wealth and not the endogenouseffects of wealth. There are indeed crucial local conditions for economic development,
conditions that can actually be established by a progressive government on behalf of its
citizens.
Each statistically significant variable in our model contributes to the explanation of cross-country differences in per capita income. What do these seemingly disparate variables
share in common? How could the absence of salubrious conditions prevent an otherwise
healthy country from developing?
Their commonality is twofold. First, these variables represent institutions and policies that
promulgate clearly understood and enforced laws and rules. The rules must be applied
equitably and consistently. The underlying rulebook principals are fairness and justice.
Economic participants cannot save in a world of inflationary government-sponsored
8/7/2019 political freedom and economic prosperity
http://slidepdf.com/reader/full/political-freedom-and-economic-prosperity 30/56
future profits in a world devoid of property rights. And they cannot prosper without
economic and personal freedoms.
Second, our explanatory variables measure cooperative solutions to collective action
problems. Individuals can do little by themselves to maintain stable currencies, organize
property rights systems, or establish fair and independent judiciaries. Cooperative effort is
required, which for countries usually comes in the form of government. Governments can
enforce contracts. Governments can title property and protect against seizure.
Establishing and maintaining a democracy with its system of guaranteed political rights,
civil liberties and press freedoms, is itself an eternal collective action effort.
Ours is a happy message. We did not dream of it when beginning this study. Political
freedom is highly desired in and of itself by most people on this earth. But there is icingon the cake. Freedom also brings economic prosperity and eventual wealth. What could
be better?
References
Acemoglu, Daron, Simon Johnson and James A. Robinson. 2001. “The Colonial Origins of Comparative Development: An Empirical Investigation.” American Economic Review,(forthcoming). On http://econ-ww.mit.edu/faculty/acemoglu/files/papers. Alesina, Alberto, and Roberto Perotti. 1996. “Income Distribution, Political Instability, andInvestment.” European Economic Review 40, 6 (June), 1203 –28.
Alesina, Alberto, and Dani Rodrik. 1994. “Distributive Politics and Economic Growth.”Quarterly Journal of Economics 109 (May), 465 –90. Aron, Janine. 2000. “Growth and Institutions, A Review of the Evidence.” The World Bank Research Observer 15 1 (February) 99-135
8/7/2019 political freedom and economic prosperity
http://slidepdf.com/reader/full/political-freedom-and-economic-prosperity 31/56
. 1996. “Democracy and Growth.” Journal of Economic Growth 1, 1, 1 –27. Barro, Robert J., 2001, Human Capital and Growth, American Economic Review, AEAPapers and Proceedings 91, 2 (May), 12-17. Beck, Thorsten, Ross Levine and Norman Loayza, 2000, Finance And The Sources Of Growth, Journal of Financial Economics 58, 1-2 (January), 261-300. Bhagwati, Jagdish. 1988. “Export-Promoting Trade Strategy: Issues and Evidence.” The
World Bank Research Observer 3, 1, (January), 27-57. Borner, Silvio, Aymo Brunetti, and Beatrice Weder. 1995. Political Credibility and Economic Development . New York: St. Martin’s Press. Brunetti, Aymo, Gregory Kisunko, and Beatrice Weder. 1998. “Credibility of Rules andEconomic Growth: Evidence from a Worldwide Survey of the Private Sector.” The World
Bank Economic Review 12, 3, 353-384.
Caselli, Francesco, Gerard Esquivel, and Fernando Lefort. 1996. “Reopening theConvergence Debate: A New Look at Cross-Country Empirics.” Journal of Economic
Growth 1, 3 (September), 363-369. Central Intelligence Agency. 2001. CIA World Factbook . Washington, D. C.: CentralIntelligence Agency; Supplier of Documents.
Clague, Christopher, Philip Keefer, Stephen Knack, and Mancur Olsen. 1995. “Contract-Intensive Money: Contract Enforcement, Property Rights, and Economic Performance.”Economics Department, University of Maryland, College Park. . 1996. “Property and Contract Rights in Autocracies and Democracies.” Journal of
Economic Growth 1, 2 (June), 243-276. Collier, Paul. 1996. “The Role of the African State in Building Agencies of Restraint.” In
J. Mats Lundahl and Benno Ndulu, eds., New Directions in Development Economics:Growth, Environmental Concerns, and Government in the 1990s, pp. 282 –98. Studies inDevelopment Economics 3. New York: Routledge. . 1999. “On the Economic Consequences of Civil War.” Oxford Economic 51, 1,
8/7/2019 political freedom and economic prosperity
http://slidepdf.com/reader/full/political-freedom-and-economic-prosperity 32/56
De Soto, Hernando. 1989. The Other Path: The Invisible Revolution in the Third World .New York: Harper and Row. ______. 2000. The Mystery of Capital . Why Capitalism Triumphs in the West and FailsEverywhere Else. New York: Basic Books -Perseus Books Group. De Vanssay, Xavier, and Zane A. Spindler. 1992. “Freedom and Growth: Do ConstitutionsMatter?” Economics Department, Simon Fraser University, Vancouver, B. C., Canada. Doppelhofer, Gernot, Ronald I. Miller and Xavier Sala-i-Martin. 2000. “Determinants of
Long-Term Growth: A Bayesian Averaging of Classical Estimates (BACE) Approach”.National Bureau of Economic Research Working Paper 7750, June 2000. Easterly, Willliam R. 2001. The Elusive Quest for Growth: Economists’ Adventures and Misadventures in the Tropics. Cambridge, MA: MIT Press 2001
Easterly, William, and Ross Levine. 1997. ”Africa’s Growth Tragedy: Policies and EthnicDivisions.” Quarterly Journal of Economics 112, 4 (November), 1203–1250.
Easterly, William, Michael Kremer, Lant Pritchett, and Lawrence Summers. 1993. “GoodPolicy or Good Luck? Country Growth Performance and Temporary Shocks.”Journal of Monetary Economics 32 (December), 459-483. Fama, E., L. Fisher, M. Jensen and R. Roll. 1969. “The Adjustment of Stock Prices to NewInformation.” International Economic Review, 10, 1 (February), 1-21.
Frankel, Jeffrey A. and David Romer. 1999. “Does Trade Cause Growth?” The AmericanEconomic Review 89, 3 (June), 379-399. Friedman, Milton. 1962. Capitalism and Freedom. Chicago, IL: University of ChicagoPress. Ghura, Dhaneshwar, and Michael T. Hadjimichael. 1996. “Growth in Sub-Saharan Africa.”International Monetary Fund Staff Papers 43, 3 (September), 605 –34.
Goldsmith, Arthur A. 1995. “Democracy, Property Rights and Economic Growth.” TheJournal of Development Studies 32, 2 (December), 157-174. Green, Steven L. 1986. “Monetary Policy in Developing Countries and the New Monetary
8/7/2019 political freedom and economic prosperity
http://slidepdf.com/reader/full/political-freedom-and-economic-prosperity 33/56
Hassan, Fareed, and Naveen Sarna. 1996. ”Economic Growth and Institutions in Africa: ACross-Country Time Series Analysis.” Europe and Central Asia Department I, WorldBank, Washington, D. C. Helliwell, John F. 1994. “Empirical Linkages between Democracy and EconomicGrowth.” British Journal of Political Science 24, 2 (April), 225-248. . 1996a. “Do Borders Matter for Social Capital, Economic Growth and CivicCulture in U. S. States and Canadian Provinces.” NBER Working Paper 5863. National
Bureau of Economic Research, Cambridge, Mass.
. 1996b. “Economic Growth and Social Capital in Asia.” NBER Working Paper 5470. National Bureau of Economic Research, Cambridge, Mass. Helliwell, John F., and Robert Putnam. 1995. “Social Capital and Economic Growth inItaly.” Eastern Economic Journal 21, 3, 295 –307. Inglehart, Ronald. 1994. “The Impact of Culture on Economic Development: Theory,
Hypotheses, and Some Empirical Tests.” Department of Political Science, University of Michigan, Ann Arbor. Isham, Jonathan, Daniel Kaufmann, and Lant Pritchett. 1997. “Civil Liberties, Democracy,and the Performance of Government Projects.” The World Bank Economic Review 11, 2,219–242. Judge, George C., W. E. Griffiths, R. Carter Hill, Helmut Lütkepohl, and Tsoung-Chao
Lee, 1985, The Theory and Practice of Econometrics, (New York: Wiley. ) Knack, Stephen. 1996. “Institutions and the Convergence Hypothesis: The Cross-NationalEvidence.” Public Choice 87 (3–4), 207 –28. Knack, Stephen, and Philip Keefer. 1995. “Institutions and Economic Performance: Cross-Country Tests Using Alternative Institutional Measures.” Economics and Politics 7 (3),207–227.
______. 1997a. “Why Don’t Poor Countries Catch Up? A Cross-National Test of anInstitutional Explanation.” Economic Inquiry 35 (July), 590-602 . 1997b. “Does Social Capital Have an Economic Payoff?A Cross-Country
8/7/2019 political freedom and economic prosperity
http://slidepdf.com/reader/full/political-freedom-and-economic-prosperity 34/56
Krueger, Anne O. 1983. Trade and Employment in Developing Countries, Volume 3:Synthesis and Conclusions. Chicago: University of Chicago Press.
Lane, Philip R., and Aaron Tornell. 1996. “Power, Growth, and the Voracity Effect.”Journal of Economic Growth 1, 2 (June), 213–241. La Porta, Rafael, Florencio Lopez-de-Silanes, Andrei Shleifer and Robert Vishny. 1998.“The Quality of Government.” National Bureau of Economic Research Working Paper 6727, (September). Leamer, Edward E. 1985. “Sensitivity Analyses Would Help.” American EconomicReview, June 1985, 57, 3, 308-313. Levine, Ross, and David Renelt. 1992. “A Sensitivity Analysis of Cross-CountryRegressions.” American Economic Review 82, 4 (September), 942–963. Levine, Ross, and Sara Zervos. 1996. “Stock Market Development and Long-RunGrowth.” The World Bank Economic Review 10, 2, 323-42.
Levine, Ross, Norman Loayza, and Thorsten Beck, 2000, Financial Intermediation AndGrowth: Causality And Causes, Journal of Monetary Economics 46, 1 (August), 31-77. Maddison, Angus, 1995, Monitoring the World Economy, 1820-1992, Paris: OECDDevelopment Centre. Maddison, Angus. 2001. The World Economy: A Millenial Perspective. Paris, France:
Development Centre of the Organization for Economic Cooperation and Development. Mankiw, N. Gregory, David Romer, and David N. Weil. 1992. “A Contribution to theEmpirics of Economic Growth.” Quarterly Journal of Economics, (May), 407-37. Mauro, Paolo. 1995. “Corruption and Growth.” Quarterly Journal of Economics 110, 3(August), 681–712.
McKinnon, R. I. 1973. Money and Capital in Economic Development . Washington D. C. :The Brookings Institution. Murphy, Kevin M., Andrei Shleifer, and Robert W. Vishny. 1991. “The Allocation of Talent: Implications for Growth.” Quarterly Journal of Economics 106, 2 (May), 503 –30.
8/7/2019 political freedom and economic prosperity
http://slidepdf.com/reader/full/political-freedom-and-economic-prosperity 35/56
Ojo, Oladeji, and Temitope Oshikoya. 1994. “Determinants of Long-Term Growth: SomeAfrican Results.” Journal of African Economies 4, 2, 163-191.
Perotti, Roberto. 1996. “Growth, Income Distribution, and Democracy: What the DataSay.” Journal of Economic Growth 1 (June), 149-187. Persson, Torsten, and Guido Tabellini. 1994. “Is Inequality Harmful for Growth? Theoryand Evidence.” American Economic Review 84, 3 (June), 600 –21. Przeworski, Adam, and Fernando Limongi. 1993. “Political Regimes and EconomicGrowth.” Journal of Economic Perspectives 7, 3, 51 –69. Rodriguez, Francisco and Dani Rodrik. 2000. “Trade Policy and Economic Growth: ASkeptic’s Guide to the Cross-National Evidence.” Macroeconomics Annual 2000, eds. BenBernanke and Kenneth S. Rogoff, MIT Press for NBER, Cambridge, MA, 2000 Rodrik, Dani. 2001. “Institutions, Integration, and Geography: In Search of the DeepDeterminants of Economic Growth.” Center for International Development, John F.
Kennedy School Of Government, Harvard University, (September.)
Sachs, Jeffrey D., and Andrew M. Warner. 1995. “Economic Reform and the Process of Global Integration.” Brookings Papers on Economic Activity 95, 1, 1–118. Sala-i-Martin, Xavier. 1997. “I Just Ran Two Million Regressions,” American EconomicReview 87, 2, (May), 178-183.
Savvides, Andreas. 1995. “Economic Growth in Africa.” World Development 23, 3, 449– 458.
Scully, Gerald W. 1988. “The Institutional Framework and Economic Development.”Journal of Political Economy 96, 3, 652–662. Sen, Amartya Kumar. 1981. Poverty and Famines : An Essay on Entitlement and
Deprivation. New York: Oxford University Press.
_______. 1999. Development As Freedom. New York: Knopf Publishing/Random House. Solow, Robert. 1956. “A Contribution to the Theory of Economic Growth.” Quarterly
Journal of Economics, (February).
8/7/2019 political freedom and economic prosperity
http://slidepdf.com/reader/full/political-freedom-and-economic-prosperity 36/56
Temple, Jonathan, and Paul Johnson. 1998. “Social Capability and Economic Growth.”Quarterly Journal of Economics 113, 3, 965-990.
Van Wijnbergen, S. 1983. “Interest Rate Management in LDC’s.” Journal of Monetary
Economics 12 (September). White, H., 1980. A Heteroskedasticity-Consistent Covariance Matrix Estimator and aDirect Test for Heteroskedasticity, Econometrica 48, 817-838.
8/7/2019 political freedom and economic prosperity
http://slidepdf.com/reader/full/political-freedom-and-economic-prosperity 37/56
Appendix
Searching for Omitted Determinants
When cross-sections are available in several years as they are here, there is a simple way to
test for missing variables. The omission of a significant variable would likely induce
correlation across years in the regression’s residuals. Panel A of Table A-1 reveals that the
residuals from the Table 5 regressions are highly correlated from one year to next; the
correlations range from 84% to 92%. Something is indeed missing.
To estimate the number of missing influences implied by the high correlations, we
computed the principal components of the 5X5 matrix of residual covariances for the 129
countries with complete data in all five years. As can be seen in the Panel B of Table A-1,
the data strongly suggest there is just one major omitted factor or “missing link”; the firsteigenvalue is very large relative to the next one. Almost 88% of the covariation among the
residuals is explained by the first principal component. This suggests that identifying and
including the omitted variable could conceivably raise the total explanatory power of the
cross-sectional model to the neighborhood of 95%.
The existence of a “missing link” is not surprising for a number of reasons. Remember
that we intentionally omitted some non-mutable or proximate variables that had been
linked to country development in previous research. One of them could well be the
missing link.
A.1. Measurement Error in GNI.
GNI and other variables must be converted to a common currency (here, it’s the US$)
before making any cross-country comparisons. Several alternative methods are available
8/7/2019 political freedom and economic prosperity
http://slidepdf.com/reader/full/political-freedom-and-economic-prosperity 38/56
construct comparable measures of living standards. Because the true level of well-being is
the objective of cross-country comparisons, it is important that the currency translation
captures differences in costs of living. Historically, this has proved a difficult task.
As a rough and ready check on an exchange rate explanation of the missing link, we
repeated the cross-sectional regressions from 1996 through 19999
using the Atlas-adjusted
GNI/capita and then compared the residuals with those obtained earlier using PPP-adjusted
GNI/capita. If the currency adjustment method were the missing link, the two sets of
residuals might turn out to be only weakly correlated. The results are displayed in the
Panel C of Table A-1.
For a given calendar year, the Atlas- and PPP-based residuals are quite correlated but,
interestingly, they are less correlated than either the Atlas or PPP residual correlations arewith themselves across adjacent years, (Panel A of Table A-1 and the right side of Panel
C.) This seems to imply that the GNI adjustment method contributes at least a small part
to the missing link. But the remaining correlations are too high for a complete explanation.
Perhaps neither the PPP nor the Atlas adjustment adequately captures the true cost of
living and their measurement errors are correlated.
Given the large number of non-mutable conditions such as latitude, languages, and
religions investigated in previous research, some of them might happen by chance to
correlate with measurement error induced by an imperfect standard of living adjustment.
To check this, we collected information on a number of such possible proxies and
computed their relations with the residuals from the Table 5 regressions. The results are
displayed in Table A-2.

8/7/2019 political freedom and economic prosperity
http://slidepdf.com/reader/full/political-freedom-and-economic-prosperity 39/56
Other variables, though insignificant, have consistently signed correlations across all years;
English, French, Hindu, Muslim, and Protestant are negative while Confucian and Jewish
are positive.
Multiple regressions of residuals on these variables are very weak. As reported in Panel B
of Table A-2, there is not a single significant t-statistic in any year for any variable and
four of the five adjusted R-squares are negative. The lack of individual significance is not
attributable to multicollinearity. Most of these variables have low correlations with each
other; the highest (.67) is between Spanish language and Catholic and the next highest
(.41) is between Protestant and Absolute Latitude. The largest negative correlation is
between Muslim and Catholic (-.56.) The number of observations is larger in the simple
regressions of Panel A than in the multiple regressions of Panel B. In the latter, all the
variables had to be jointly available for each country. This might partly explain why avariable such as absolute latitude is significant in Panel A but not in Panel B.10
The multiple regressions almost make it appear that the six allegedly significant
correlations in Panel A are spurious and only slightly more than one would expect at the
95% level out of the 55 different coefficients computed. But latitude seems too consistent
for such a surmise to be unquestioned and we wondered whether its inclusion would have
an impact on our earlier cross-sectional results (in Table 5.) So we repeated the cross-
sectional analysis while adding a linear and quadratic term for absolute latitude as an
additional explanatory variable. The results are reported as Regression B of Table A-3 for
calendar year 1999.11 Regression A of Table A-3 repeats the 1999 results from Table 5
(i.e., without latitude) for ease of comparison.
The addition of latitude increases the adjusted R-square marginally, from .846 to .856.
8/7/2019 political freedom and economic prosperity
http://slidepdf.com/reader/full/political-freedom-and-economic-prosperity 40/56
other variables retain their levels of significance and the sign patterns are identical.
Latitude’s strong significance combined with the impressive stability of the other variables
suggests that the missing link is not closely related to any of our original fourteen
determinants. Measurement error in GNI/capita as an indicator of standard of living would
have precisely that feature.
A.2. Measurement error in the explanatory variables.
Measurement error in the explanatory variables is another possible explanation of the
correlation amongst the residuals across time. For many of our explanatory variables, a
research analyst assigns a country rating each year. It would be only human for the
analyst to compare the current proposed rating against those assigned in earlier years. If,
as a result, prior mistaken ratings were not fully corrected, measurement error in the
explanatory variable would be correlated across time, thereby inducing a corresponding(but spurious) correlation in the regression residuals. Lacking an independent set of
ratings, we can think of no method of checking this possibility.
A.3. A missing regressor: Time since a democratic event.
The results of our event study above imply yet a different candidate for the missing
influence. A country begins to grow rapidly after a “democratic” event, but it would still
take a long time for a poor country to attain a high absolute level of income. The cross-
country regression model ignores this fact. Indeed, if one took the model literally, a poor
country that adopted strongly democratic conditions overnight would wake up rich the next
morning. This is a nonsensical feature of a static cross-sectional model.
The cross-country regression model could be made more dynamic, however, by a simple
stratagem: include as another determinant the elapsed time since a country experienced a
8/7/2019 political freedom and economic prosperity
http://slidepdf.com/reader/full/political-freedom-and-economic-prosperity 41/56
Each country in our sample was therefore assigned to one of three categories: (1) Countries
with a democratic event during the past fifty years, as listed in Table 6, and no subsequent
non-democratic events (2) Countries with no democratic event listed in Table 6 and no
long history of democracy,12
and (3) Long term democracies. For countries in category 1,
we counted the actual elapsed time in years between the event and the year when
GNI/capita was measured for the cross-sectional regression. For category 2, we assigned a
value of zero and for Category 3 we assigned a value of 50 (years).13
In table A-3, the resulting variable, “Years Since Democratic Event,” is included as an
additional explanatory variable in Regression C. For calendar year 1999, it is strongly
significant and positive (both the linear and quadratic terms.)14 The R-square improves by
more than one percentage point between regressions A and C. Without this variable, there
are sixteen coefficients in 1999 significant at the 95% level or better. They are indicated
with borders. Most of them remain highly significant and two new coefficients join them,
banking restrictions (linear) and government expenditures (quadratic.)
There is, however, a noticeable impact on the democracy-related variables. Political
Rights, Civil Liberties, and Freedom of the Press all have smaller t-statistics and the
quadratic Political Rights variable falls to insignificance. This might have been anticipated
because the elapsed time since a democratic event is also a measure of political freedom,
perhaps an even better measure because long tenure is synonymous with stability and
strength. Notice that Property Rights and Black Market Activity are virtually unaltered by
the inclusion of Years Since a Democratic Event. This points to the fact that even a
benevolent dictator could conceivably enforce a strong system of property rights and rootout corruption.
Finally, Regression D of Table A-3 present the cross-country results for 1999 with both
8/7/2019 political freedom and economic prosperity
http://slidepdf.com/reader/full/political-freedom-and-economic-prosperity 42/56
report this simply to affirm that most of the original coefficients retain their significance,
with the exception of the democracy-related variables as discussed above. The unadjusted
R-square between observed and predicted GNI/Capita indicates that the total explanatory
power is now over 88%.
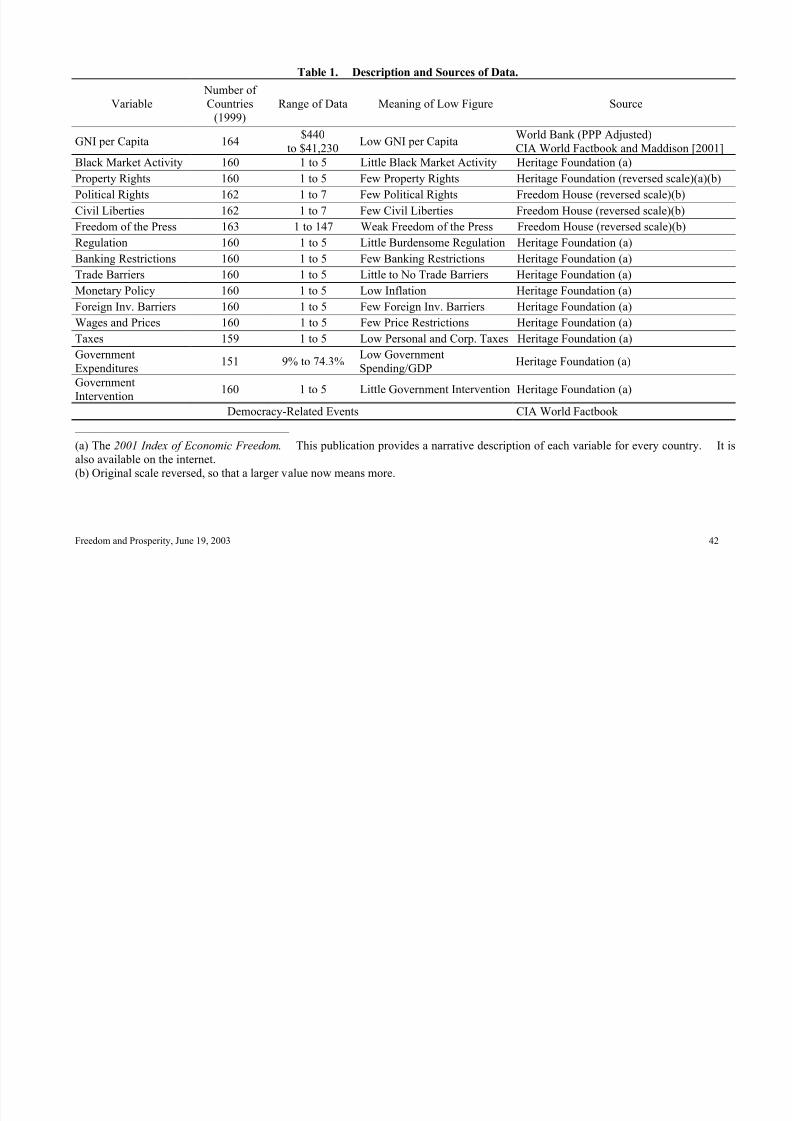
8/7/2019 political freedom and economic prosperity
http://slidepdf.com/reader/full/political-freedom-and-economic-prosperity 43/56
Freedom and Prosperity, June 19, 2003 42
Table 1. Description and Sources of Data. Variable
Number of Countries
(1999)
Range of Data Meaning of Low Figure Source
GNI per Capita 164$440
to $41,230Low GNI per Capita
World Bank (PPP Adjusted)CIA World Factbook and Maddison [2001]
Black Market Activity 160 1 to 5 Little Black Market Activity Heritage Foundation (a)
Property Rights 160 1 to 5 Few Property Rights Heritage Foundation (reversed scale)(a)(b)
Political Rights 162 1 to 7 Few Political Rights Freedom House (reversed scale)(b)
Civil Liberties 162 1 to 7 Few Civil Liberties Freedom House (reversed scale)(b)
Freedom of the Press 163 1 to 147 Weak Freedom of the Press Freedom House (reversed scale)(b)Regulation 160 1 to 5 Little Burdensome Regulation Heritage Foundation (a)
Banking Restrictions 160 1 to 5 Few Banking Restrictions Heritage Foundation (a)
Trade Barriers 160 1 to 5 Little to No Trade Barriers Heritage Foundation (a)
Monetary Policy 160 1 to 5 Low Inflation Heritage Foundation (a)
Foreign Inv. Barriers 160 1 to 5 Few Foreign Inv. Barriers Heritage Foundation (a)
Wages and Prices 160 1 to 5 Few Price Restrictions Heritage Foundation (a)
Taxes 159 1 to 5 Low Personal and Corp. Taxes Heritage Foundation (a)
GovernmentExpenditures
151 9% to 74.3%Low GovernmentSpending/GDP
Heritage Foundation (a)
GovernmentIntervention
160 1 to 5 Little Government Intervention Heritage Foundation (a)
Democracy-Related Events CIA World Factbook
___________________________________________
(a) The 2001 Index of Economic Freedom. This publication provides a narrative description of each variable for every country. It isalso available on the internet.(b) Original scale reversed, so that a larger value now means more.
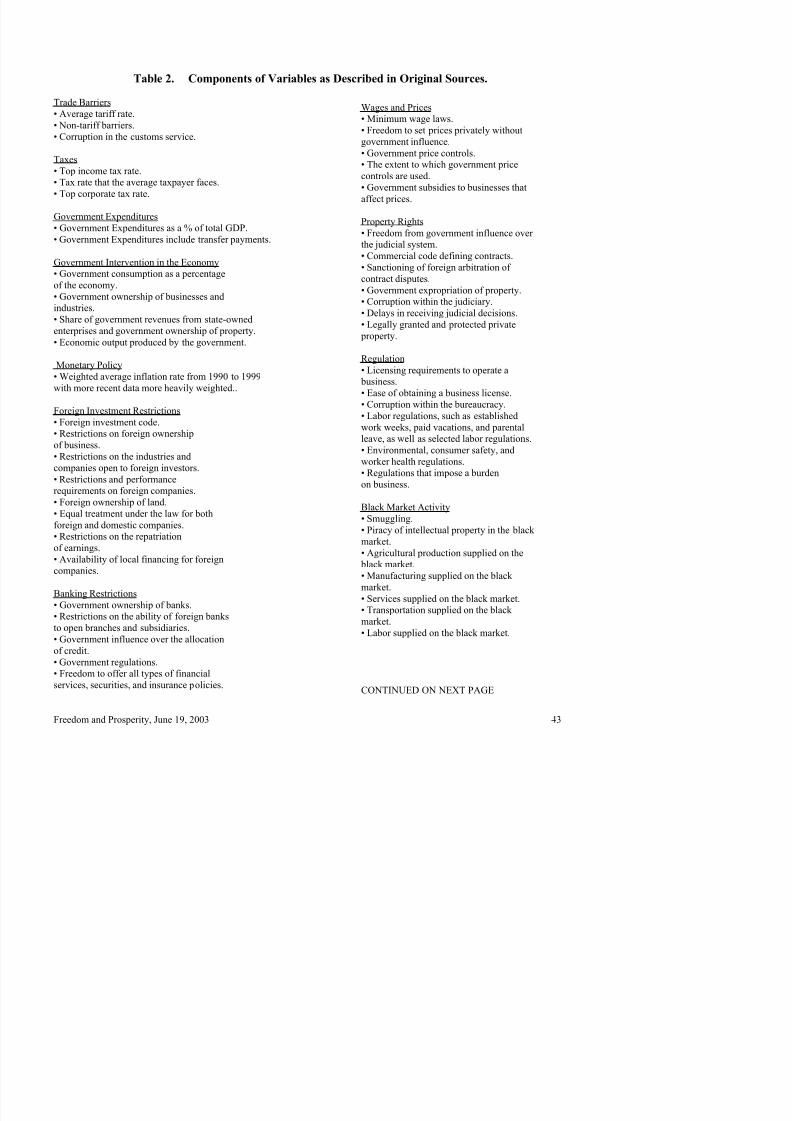
8/7/2019 political freedom and economic prosperity
http://slidepdf.com/reader/full/political-freedom-and-economic-prosperity 44/56
Table 2. Components of Variables as Described in Original Sources.
Trade Barriers
• Average tariff rate.• Non-tariff barriers.• Corruption in the customs service. Taxes• Top income tax rate.• Tax rate that the average taxpayer faces.• Top corporate tax rate. Government Expenditures
• Government Expenditures as a % of total GDP.• Government Expenditures include transfer payments. Government Intervention in the Economy• Government consumption as a percentageof the economy.• Government ownership of businesses andindustries.• Share of government revenues from state-owned
enterprises and government ownership of property.• Economic output produced by the government. Monetary Policy• Weighted average inflation rate from 1990 to 1999with more recent data more heavily weighted.. Foreign Investment Restrictions• Foreign investment code.
• Restrictions on foreign ownershipof business.• Restrictions on the industries andcompanies open to foreign investors.• Restrictions and performancerequirements on foreign companies.• Foreign ownership of land.• Equal treatment under the law for bothforeign and domestic companies.• Restrictions on the repatriation
of earnings.• Availability of local financing for foreigncompanies. Banking Restrictions• Government ownership of banks.
Wages and Prices
• Minimum wage laws.• Freedom to set prices privately withoutgovernment influence.• Government price controls.• The extent to which government pricecontrols are used.• Government subsidies to businesses thataffect prices.
Property Rights• Freedom from government influence over the judicial system.• Commercial code defining contracts.• Sanctioning of foreign arbitration of contract disputes.• Government expropriation of property.• Corruption within the judiciary.• Delays in receiving judicial decisions.• Legally granted and protected privateproperty. Regulation• Licensing requirements to operate abusiness.• Ease of obtaining a business license.• Corruption within the bureaucracy.• Labor regulations, such as establishedwork weeks, paid vacations, and parental
leave, as well as selected labor regulations.• Environmental, consumer safety, andworker health regulations.• Regulations that impose a burdenon business. Black Market Activity• Smuggling.• Piracy of intellectual property in the black
market.• Agricultural production supplied on theblack market.• Manufacturing supplied on the black market.• Services supplied on the black market.
T t ti li d th bl k
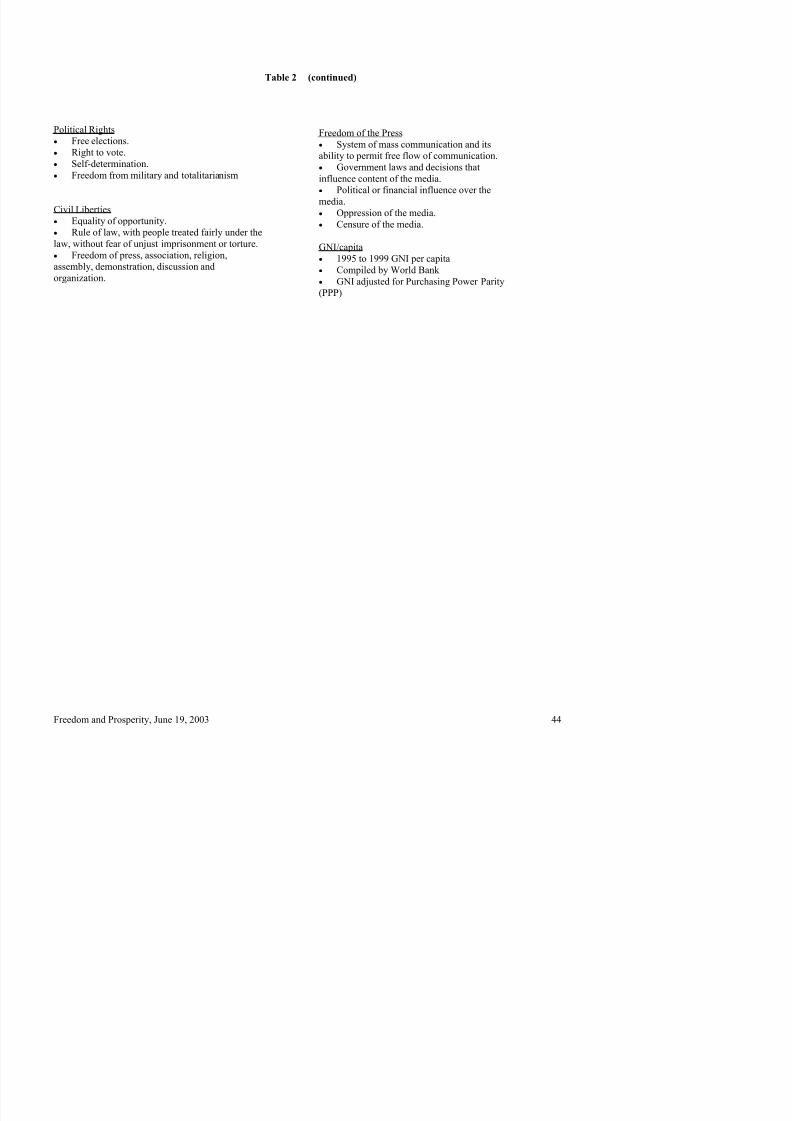
8/7/2019 political freedom and economic prosperity
http://slidepdf.com/reader/full/political-freedom-and-economic-prosperity 45/56
Table 2 (continued)
Political Rights• Free elections.• Right to vote.• Self-determination.• Freedom from military and totalitarianism Civil Liberties•
Equality of opportunity.• Rule of law, with people treated fairly under thelaw, without fear of unjust imprisonment or torture.• Freedom of press, association, religion,assembly, demonstration, discussion andorganization.
Freedom of the Press• System of mass communication and itsability to permit free flow of communication.• Government laws and decisions thatinfluence content of the media.• Political or financial influence over themedia.• Oppression of the media.
• Censure of the media. GNI/capita• 1995 to 1999 GNI per capita• Compiled by World Bank • GNI adjusted for Purchasing Power Parity(PPP)
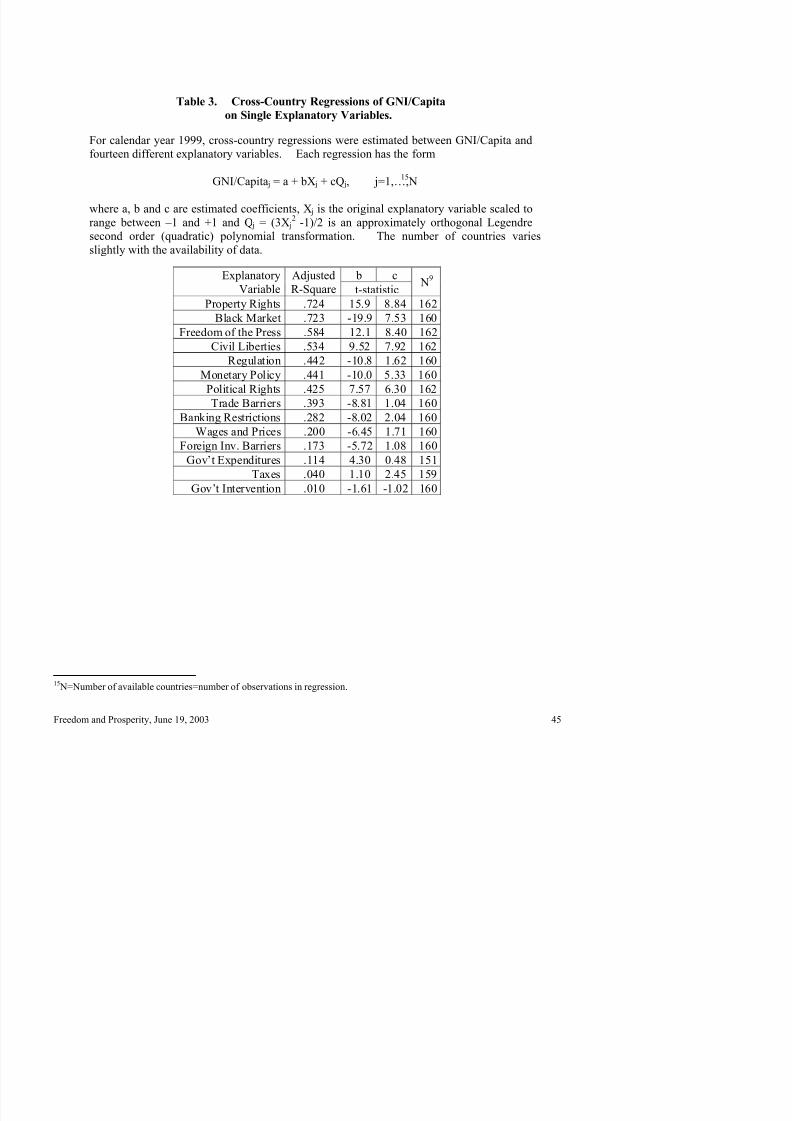
8/7/2019 political freedom and economic prosperity
http://slidepdf.com/reader/full/political-freedom-and-economic-prosperity 46/56
Table 3. Cross-Country Regressions of GNI/Capita
on Single Explanatory Variables.
For calendar year 1999, cross-country regressions were estimated between GNI/Capita andfourteen different explanatory variables. Each regression has the form
GNI/Capitaj = a + bXj + cQj, j=1,…,N15
where a, b and c are estimated coefficients, Xj is the original explanatory variable scaled to
range between –1 and +1 and Qj = (3Xj
2
-1)/2 is an approximately orthogonal Legendresecond order (quadratic) polynomial transformation. The number of countries variesslightly with the availability of data.
b cExplanatoryVariable
AdjustedR-Square t-statistic
N9
Property Rights .724 15.9 8.84 162
Black Market .723 -19.9 7.53 160
Freedom of the Press .584 12.1 8.40 162Civil Liberties .534 9.52 7.92 162
Regulation .442 -10.8 1.62 160
Monetary Policy .441 -10.0 5.33 160
Political Rights .425 7.57 6.30 162
Trade Barriers .393 -8.81 1.04 160
Banking Restrictions .282 -8.02 2.04 160
Wages and Prices .200 -6.45 1.71 160
Foreign Inv. Barriers .173 -5.72 1.08 160
Gov’t Expenditures .114 4.30 0.48 151
Taxes .040 1.10 2.45 159
Gov’t Intervention .010 -1.61 -1.02 160
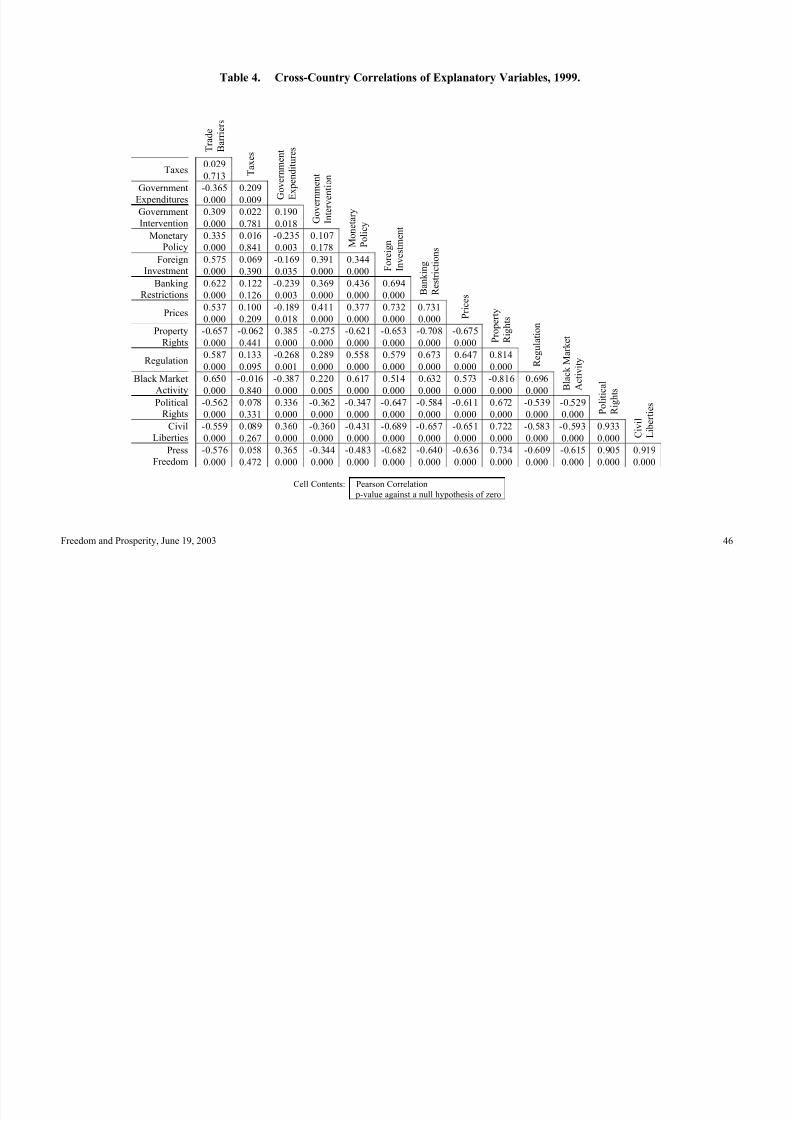
8/7/2019 political freedom and economic prosperity
http://slidepdf.com/reader/full/political-freedom-and-economic-prosperity 47/56
Freedom and Prosperity, June 19, 2003 46
Table 4. Cross-Country Correlations of Explanatory Variables, 1999.
Trade
Barriers
0.029Taxes
0.713 Taxes
-0.365 0.209GovernmentExpenditures 0.000 0.009 G
overnment
Expenditures
0.309 0.022 0.190Government
Intervention 0.000 0.781 0.018Government
Intervention
0.335 0.016 -0.235 0.107MonetaryPolicy 0.000 0.841 0.003 0.178 M
onetary
Policy
0.575 0.069 -0.169 0.391 0.344ForeignInvestment 0.000 0.390 0.035 0.000 0.000 F
oreign
Investment
0.622 0.122 -0.239 0.369 0.436 0.694BankingRestrictions 0.000 0.126 0.003 0.000 0.000 0.000 B
anking
Restrictions
0.537 0.100 -0.189 0.411 0.377 0.732 0.731Prices
0.000 0.209 0.018 0.000 0.000 0.000 0.000 Prices
-0.657 -0.062 0.385 -0.275 -0.621 -0.653 -0.708 -0.675PropertyRights 0.000 0.441 0.000 0.000 0.000 0.000 0.000 0.000 Pro
perty
Rig
hts
0.587 0.133 -0.268 0.289 0.558 0.579 0.673 0.647 0.814Regulation
0.000 0.095 0.001 0.000 0.000 0.000 0.000 0.000 0.000 Regulatio
n
0.650 -0.016 -0.387 0.220 0.617 0.514 0.632 0.573 -0.816 0.696Black MarketActivity 0.000 0.840 0.000 0.005 0.000 0.000 0.000 0.000 0.000 0.000 B
lack Market
Activity
-0.562 0.078 0.336 -0.362 -0.347 -0.647 -0.584 -0.611 0.672 -0.539 -0.529PoliticalRights 0.000 0.331 0.000 0.000 0.000 0.000 0.000 0.000 0.000 0.000 0.000 P
olitical
Rights
-0.559 0.089 0.360 -0.360 -0.431 -0.689 -0.657 -0.651 0.722 -0.583 -0.593 0.933Civil
Liberties 0.000 0.267 0.000 0.000 0.000 0.000 0.000 0.000 0.000 0.000 0.000 0.000Civil
Liberties
-0.576 0.058 0.365 -0.344 -0.483 -0.682 -0.640 -0.636 0.734 -0.609 -0.615 0.905 0.919PressFreedom 0.000 0.472 0.000 0.000 0.000 0.000 0.000 0.000 0.000 0.000 0.000 0.000 0.000
Cell Contents: Pearson Correlationp-value against a null hypothesis of zero
Table 5. Cross-Country Multiple Regressions of GNI/Capita on Fourteen Determinants.
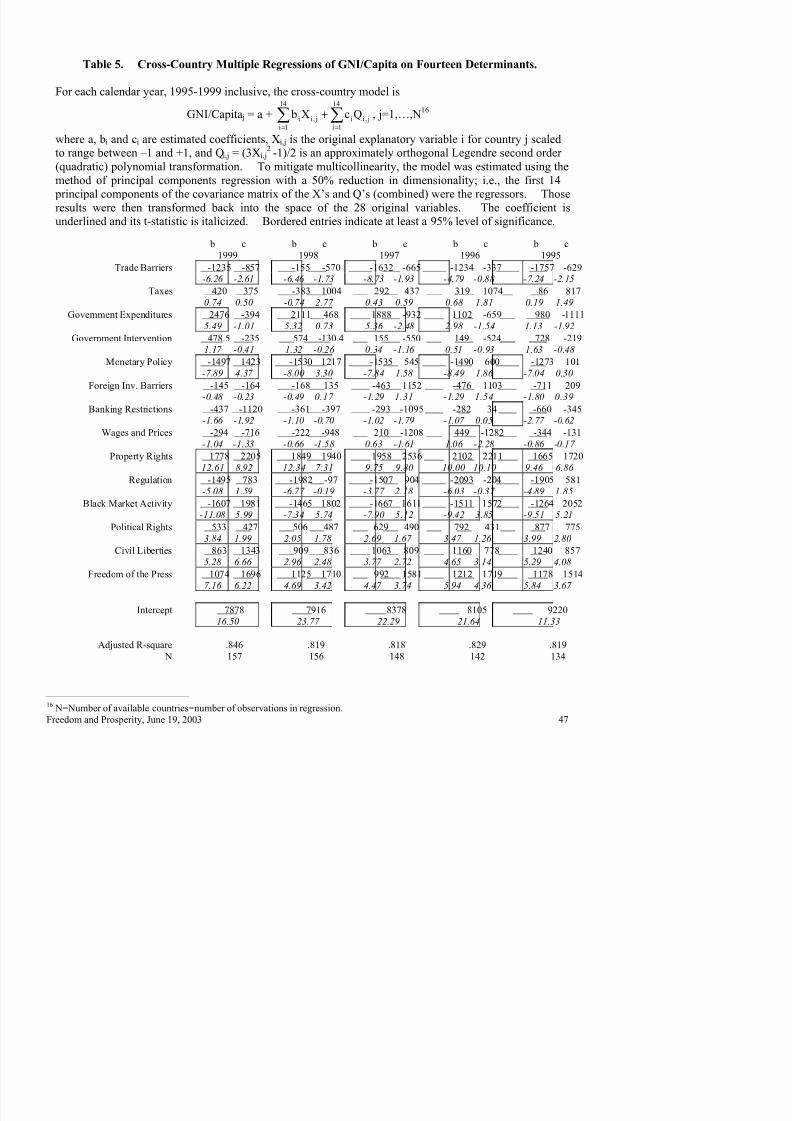
8/7/2019 political freedom and economic prosperity
http://slidepdf.com/reader/full/political-freedom-and-economic-prosperity 48/56
y p g p
For each calendar year, 1995-1999 inclusive, the cross-country model is
GNI/Capitaj = a + ∑ ∑= =
+
14
1i
14
1ij,iij,ii QcXb , j=1,…,N
16
where a, bi and ci are estimated coefficients, Xi,j is the original explanatory variable i for country j scaledto range between –1 and +1, and Qi,j = (3Xi,j
2 -1)/2 is an approximately orthogonal Legendre second order
(quadratic) polynomial transformation. To mitigate multicollinearity, the model was estimated using themethod of principal components regression with a 50% reduction in dimensionality; i.e., the first 14principal components of the covariance matrix of the X’s and Q’s (combined) were the regressors. Thoseresults were then transformed back into the space of the 28 original variables. The coefficient is
underlined and its t-statistic is italicized. Bordered entries indicate at least a 95% level of significance. b c b c b c b c b c
1999 1998 1997 1996 1995
Trade Barriers -1235 -857 -155 -570 -1632 -665 -1234 -337 -1757 -629-6.26 -2.61 -6.46 -1.73 -8.73 -1.93 -4.79 -0.88 -7.24 -2.15
Taxes 420 375 -383 1004 292 437 319 1074 86 8170.74 0.50 -0.74 2.77 0.43 0.59 0.68 1.81 0.19 1.49
Government Expenditures 2476 -394 2111 468 1888 -932 1102 -659 980 -11115.49 -1.01 5.32 0.73 5.36 -2.48 2.98 -1.54 1.13 -1.92
Government Intervention 478.5 -235 574 -130.4 155 -550 149 -524 728 -2191.17 -0.41 1.32 -0.26 0.34 -1.16 0.51 -0.93 1.63 -0.48
Monetary Policy -1497 1423 -1530 1217 -1535 545 -1490 600 -1273 101-7.89 4.37 -8.00 3.30 -7.84 1.58 -8.49 1.86 -7.04 0.30
Foreign Inv. Barriers -145 -164 -168 135 -463 1152 -476 1103 -711 209-0.48 -0.23 -0.49 0.17 -1.29 1.31 -1.29 1.54 -1.80 0.39
Banking Restrictions -437 -1120 -361 -397 -293 -1095 -282 34 -660 -345-1.66 -1.92 -1.10 -0.70 -1.02 -1.79 -1.07 0.05 -2.77 -0.62
Wages and Prices -294 -716 -222 -948 210 -1208 449 -1282 -344 -131-1.04 -1.33 -0.66 -1.58 0.63 -1.61 1.06 -2.28 -0.86 -0.17
Property Rights 1778 2205 1849 1940 1958 2536 2102 2211 1665 172012.61 8.92 12.34 7.31 9.75 9.80 10.00 10.10 9.46 6.86
Regulation -1495 783 -1982 -97 -1507 904 -2093 -204 -1905 581-5.08 1.59 -6.77 -0.19 -3.77 2.18 -6.03 -0.37 -4.89 1.85
Black Market Activity -1607 1981 -1465 1802 -1667 1611 -1511 1572 -1264 2052-11.08 5.99 -7.34 5.74 -7.90 5.12 -9.42 3.85 -9.51 5.21
Political Rights 533 427 506 487 629 490 792 431 877 7753.84 1.99 2.05 1.78 2.69 1.67 3.47 1.26 3.99 2.80
Civil Liberties 863 1343 909 836 1063 809 1160 778 1240 8575.28 6.66 2.96 2.48 3.77 2.72 4.65 3.14 5.29 4.08
Freedom of the Press 1074 1696 1125 1710 992 1581 1212 1719 1178 15147.16 6.22 4.69 3.42 4.47 3.74 5.94 4.36 5.84 3.67
I t t 7878 7916 8378 8105 9220
Table 5, (Continued).
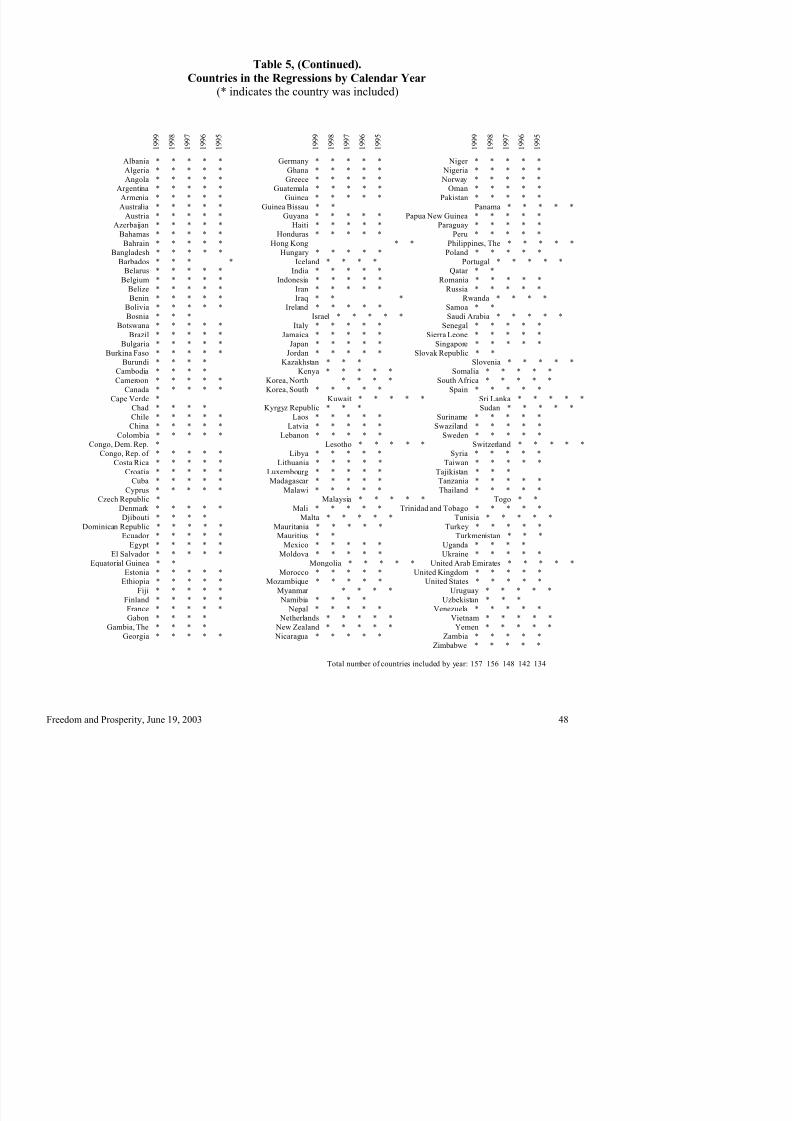
8/7/2019 political freedom and economic prosperity
http://slidepdf.com/reader/full/political-freedom-and-economic-prosperity 49/56
Countries in the Regressions by Calendar Year
(* indicates the country was included)
1999
1998
1997
1996
1995
1999
1998
1997
1996
1995
1999
1998
1997
1996
1995
Albania * * * * * Germany * * * * * Niger * * * * *Algeria * * * * * Ghana * * * * * Nigeria * * * * *Angola * * * * * Greece * * * * * Norway * * * * *
Argentina * * * * * Guatemala * * * * * Oman * * * * *Armenia * * * * * Guinea * * * * * Pakistan * * * * *Australia * * * * * Guinea Bissau * * Panama * * * * *
Austria * * * * * Guyana * * * * * Papua New Guinea * * * * *
Azerbaijan * * * * * Haiti * * * * * Paraguay * * * * *Bahamas * * * * * Honduras * * * * * Peru * * * * *Bahrain * * * * * Hong Kong * * Philippines, The * * * * *
Bangladesh * * * * * Hungary * * * * * Poland * * * * *Barbados * * * * Iceland * * * * Portugal * * * * *
Belarus * * * * * India * * * * * Qatar * *Belgium * * * * * Indonesia * * * * * Romania * * * * *
Belize * * * * * Iran * * * * * Russia * * * * *Benin * * * * * Iraq * * * Rwanda * * * *
Bolivia * * * * * Ireland * * * * * Samoa * *Bosnia * * * Israel * * * * * Saudi Arabia * * * * *
Botswana * * * * * Italy * * * * * Senegal * * * * *
Brazil * * * * * Jamaica * * * * * Sierra Leone * * * * *Bulgaria * * * * * Japan * * * * * Singapore * * * * *
Burkina Faso * * * * * Jordan * * * * * Slovak Republic * *Burundi * * * * Kazakhstan * * * Slovenia * * * * *
Cambodia * * * * Kenya * * * * * Somalia * * * * *Cameroon * * * * * Korea, North * * * * South Africa * * * * *
Canada * * * * * Korea, South * * * * * Spain * * * * *Cape Verde * Kuwait * * * * * Sri Lanka * * * * *
Chad * * * * Kyrgyz Republic * * * Sudan * * * * *Chile * * * * * Laos * * * * * Suriname * * * * *China * * * * * Latvia * * * * * Swaziland * * * * *
Colombia * * * * * Lebanon * * * * * Sweden * * * * *Congo, Dem. Rep. * Lesotho * * * * * Switzerland * * * * *
Congo, Rep. of * * * * * Libya * * * * * Syria * * * * *Costa Rica * * * * * Lithuania * * * * * Taiwan * * * * *
Croatia * * * * * Luxembourg * * * * * Tajikistan * * *Cuba * * * * * Madagascar * * * * * Tanzania * * * * *
Cyprus * * * * * Malawi * * * * * Thailand * * * * *Czech Republic * Malaysia * * * * * Togo * *
Denmark * * * * * Mali * * * * * Trinidad and Tobago * * * * *Djibouti * * * * Malta * * * * * Tunisia * * * * *
Dominican Republic * * * * * Mauritania * * * * * Turkey * * * * *Ecuador * * * * * Mauritius * * Turkmenistan * * *
Egypt * * * * * Mexico * * * * * Uganda * * * *El Salvador * * * * * Moldova * * * * * Ukraine * * * * *
Equatorial Guinea * * Mongolia * * * * * United Arab Emirates * * * * *Estonia * * * * * Morocco * * * * * United Kingdom * * * * *
Ethiopia * * * * * Mozambique * * * * * United States * * * * *Fiji * * * * * Myanmar * * * * Uruguay * * * * *
Finland * * * * * Namibia * * * * Uzbekistan * * *France * * * * * Nepal * * * * * Vene ela * * * * *
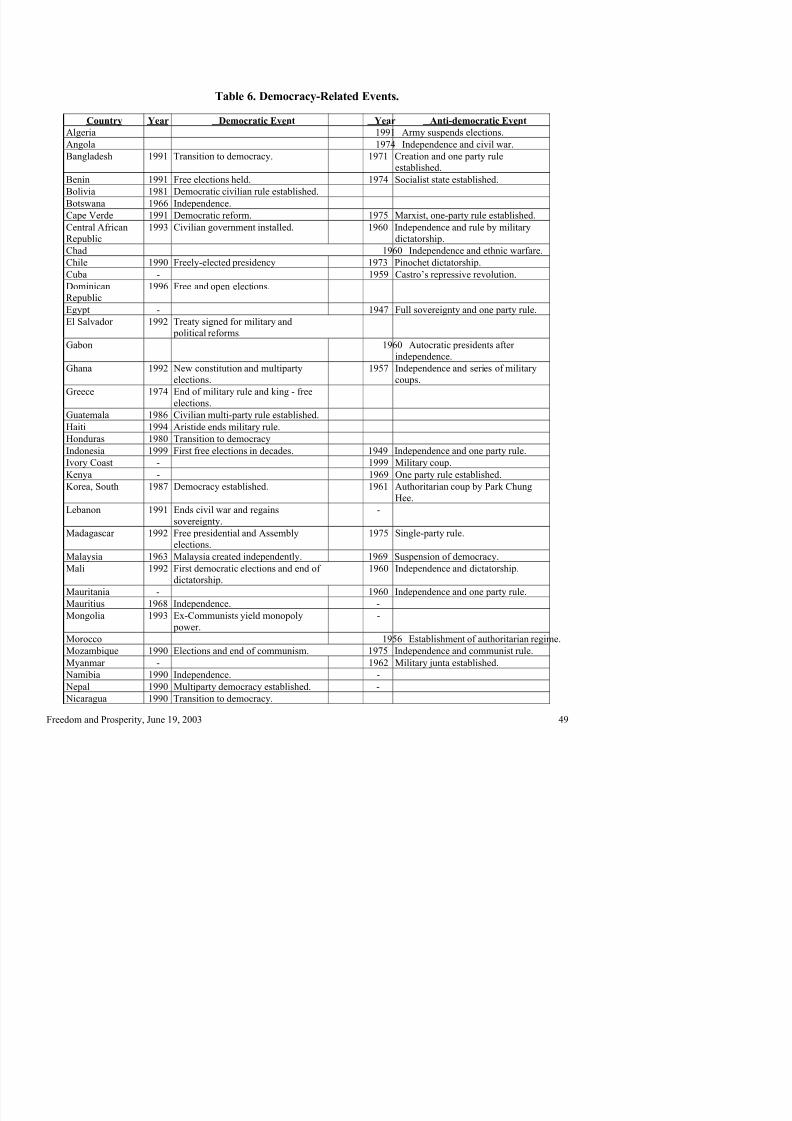
8/7/2019 political freedom and economic prosperity
http://slidepdf.com/reader/full/political-freedom-and-economic-prosperity 50/56
Table 6. Democracy-Related Events.
Country Year Democratic Event Year Anti-democratic EventAlgeria 1991 Army suspends elections.
Angola 1974 Independence and civil war.
Bangladesh 1991 Transition to democracy. 1971 Creation and one party ruleestablished.
Benin 1991 Free elections held. 1974 Socialist state established.
Bolivia 1981 Democratic civilian rule established.
Botswana 1966 Independence.
Cape Verde 1991 Democratic reform. 1975 Marxist, one-party rule established.
Central AfricanRepublic
1993 Civilian government installed. 1960 Independence and rule by militarydictatorship.
Chad 1960 Independence and ethnic warfare.
Chile 1990 Freely-elected presidency 1973 Pinochet dictatorship.
Cuba - 1959 Castro’s repressive revolution.
DominicanRepublic
1996 Free and open elections.
Egypt - 1947 Full sovereignty and one party rule.
El Salvador 1992 Treaty signed for military and
political reforms.
Gabon 1960 Autocratic presidents after independence.
Ghana 1992 New constitution and multipartyelections.
1957 Independence and series of militarycoups.
Greece 1974 End of military rule and king - freeelections.
Guatemala 1986 Civilian multi-party rule established.
Haiti 1994 Aristide ends military rule.
Honduras 1980 Transition to democracyIndonesia 1999 First free elections in decades. 1949 Independence and one party rule.
Ivory Coast - 1999 Military coup.
Kenya - 1969 One party rule established.
Korea, South 1987 Democracy established. 1961 Authoritarian coup by Park ChungHee.
Lebanon 1991 Ends civil war and regainssovereignty.
-
Madagascar 1992 Free presidential and Assembly
elections.
1975 Single-party rule.
Malaysia 1963 Malaysia created independently. 1969 Suspension of democracy.
Mali 1992 First democratic elections and end of dictatorship.
1960 Independence and dictatorship.
Mauritania - 1960 Independence and one party rule.
Mauritius 1968 Independence. -
Niger 1999 Civilian rule established. 1960 Independence, but no free elections.
Nigeria II 1960 Independence under democracy 1966 Military coup
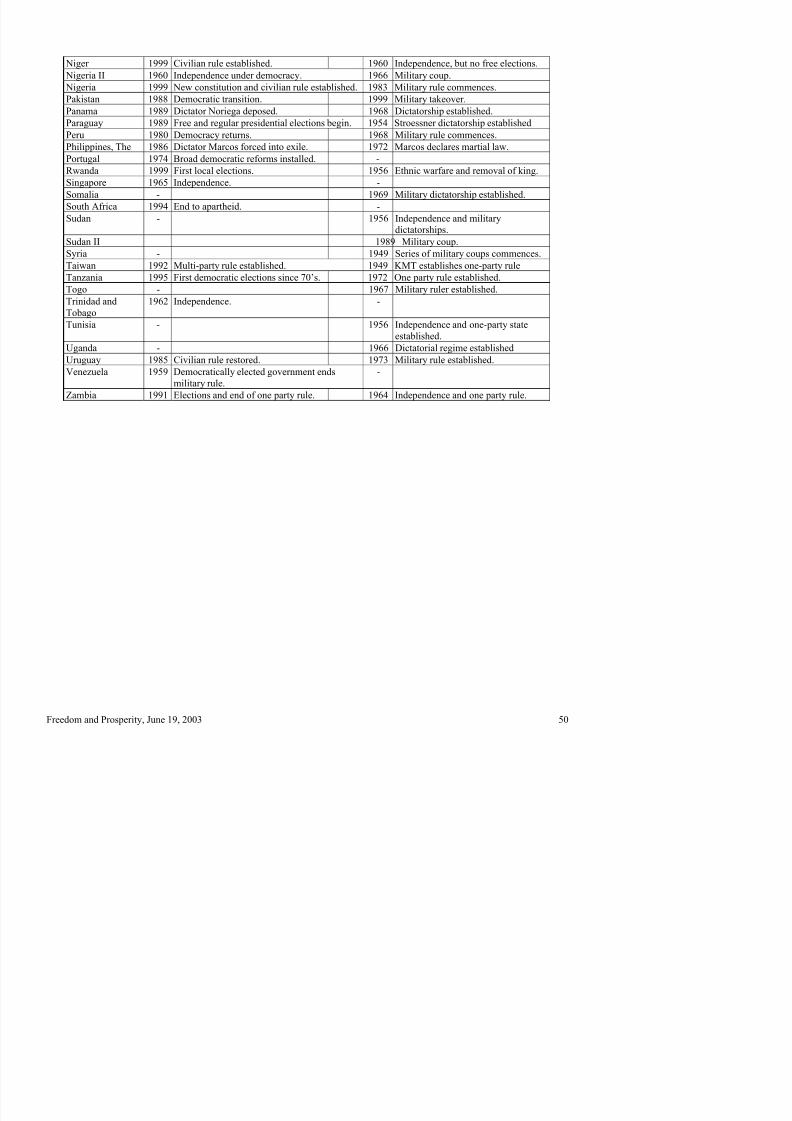
8/7/2019 political freedom and economic prosperity
http://slidepdf.com/reader/full/political-freedom-and-economic-prosperity 51/56
Nigeria II 1960 Independence under democracy. 1966 Military coup.
Nigeria 1999 New constitution and civilian rule established. 1983 Military rule commences.
Pakistan 1988 Democratic transition. 1999 Military takeover.
Panama 1989 Dictator Noriega deposed. 1968 Dictatorship established.
Paraguay 1989 Free and regular presidential elections begin. 1954 Stroessner dictatorship establishedPeru 1980 Democracy returns. 1968 Military rule commences.
Philippines, The 1986 Dictator Marcos forced into exile. 1972 Marcos declares martial law.
Portugal 1974 Broad democratic reforms installed. -
Rwanda 1999 First local elections. 1956 Ethnic warfare and removal of king.
Singapore 1965 Independence. -
Somalia - 1969 Military dictatorship established.
South Africa 1994 End to apartheid. -
Sudan - 1956 Independence and military
dictatorships.Sudan II 1989 Military coup.
Syria - 1949 Series of military coups commences.
Taiwan 1992 Multi-party rule established. 1949 KMT establishes one-party rule
Tanzania 1995 First democratic elections since 70’s. 1972 One party rule established.
Togo - 1967 Military ruler established.
Trinidad andTobago
1962 Independence. -
Tunisia - 1956 Independence and one-party state
established.Uganda - 1966 Dictatorial regime established
Uruguay 1985 Civilian rule restored. 1973 Military rule established.
Venezuela 1959 Democratically elected government endsmilitary rule.
-
Zambia 1991 Elections and end of one party rule. 1964 Independence and one party rule.

8/7/2019 political freedom and economic prosperity
http://slidepdf.com/reader/full/political-freedom-and-economic-prosperity 52/56
Freedom and Prosperity, June 19, 2003
51
Table 7. Real GNI/Capita Before and After Democracy-Related Events.
Real GNI/Capita is traced for ten years prior to a democracy-related event and twenty years thereafter. Events occurred on variousdates within the past half-century and are listed in Table 6. Mean growth refers to the arithmetic average percentage change in annualGNI/capita over all countries with available data during the indicated sub-period. Compound growth first averages yearly GNI/capitagrowth rates across available countries then compounds the average over the sub-period. The event year is denoted Year zero.Statistical tests compare sub-periods after and before the event; %>0 gives the percentage of countries whose GNI/capita growth rateincreased after the event. The accompanying number in parenthesis is the p-value for a one-sided test that the true percentage is 50%.The t-statistic is based on the cross-country mean difference in annual percentage growth rates between selected sub-periods (after theevent less before.) The standard error of the mean is computed from the cross-section of differences.
Sub-Period (Years relative to Event) Tests for Change in Growth Rate
After Event
-10 to -1 -5 to -1 +1 to +5 +6 to 10 +11 to +20
+1 to +5vs. -5 to -1
+6 to +10vs. -5 to -1
+11 to +20vs. -10 to -1
Democratic Events
Mean Growth (%/annum) 0.821 0.670 2.164 1.673 2.733 %>0 62.2 (.051) 41.2 (.685) 80.0 (.031)
Compound Growth (%/annum) 0.818 0.668 2.160 1.667 2.723 t-statistic 1.636 -0.079 2.526
Average Number of Countries 38.5 43.0 38.8 25.2 9.7 N17
37.0 17.0 5.0
Anti-Democratic Events
Mean Growth (%/annum) 1.562 1.349 1.733 0.864 0.850 %>0 39.4 (.148) 34.4 (.055) 26.3 (.032)
Compound Growth (%/annum) 1.557 1.346 1.722 0.858 0.845 t-statistic -0.129 -1.056 -3.270Average Number of Countries 30.8 37.4 40.4 40.2 34.2 N 33.0 32.0 19.0
17 N is the number of countries available in both of the sub-periods being compared.
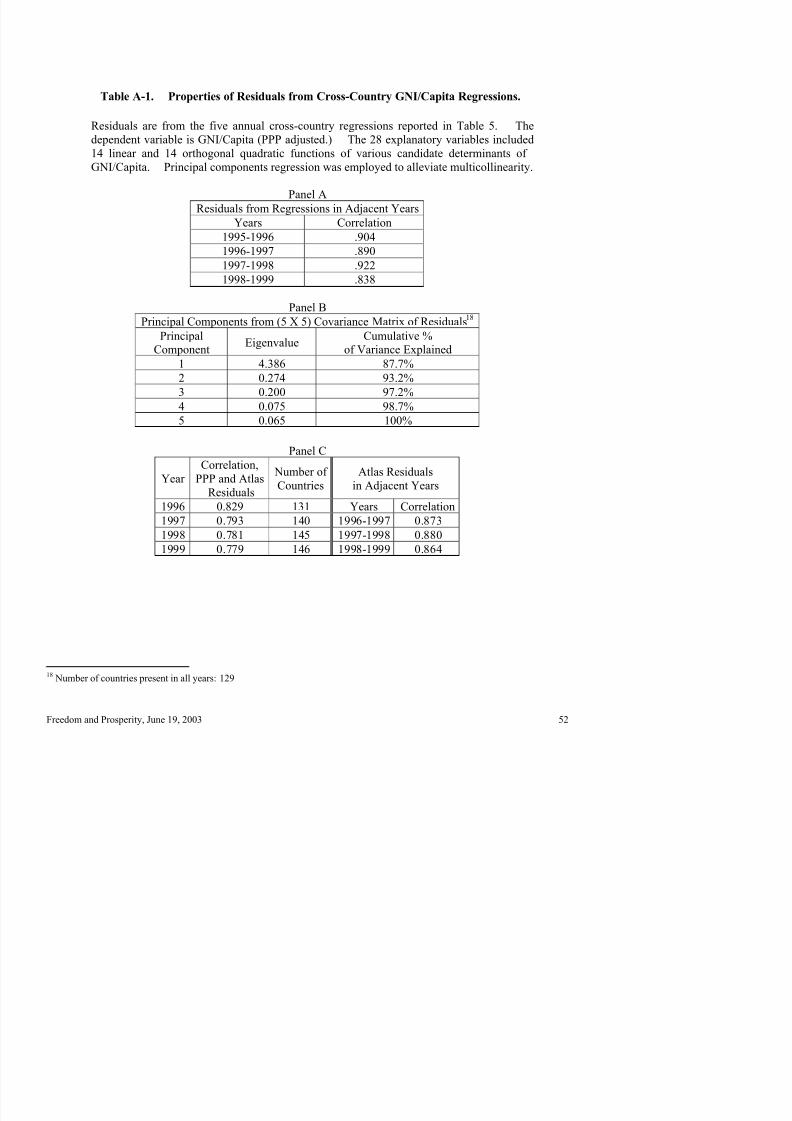
8/7/2019 political freedom and economic prosperity
http://slidepdf.com/reader/full/political-freedom-and-economic-prosperity 53/56
Table A-1. Properties of Residuals from Cross-Country GNI/Capita Regressions.
Residuals are from the five annual cross-country regressions reported in Table 5. Thedependent variable is GNI/Capita (PPP adjusted.) The 28 explanatory variables included14 linear and 14 orthogonal quadratic functions of various candidate determinants of GNI/Capita. Principal components regression was employed to alleviate multicollinearity.
Panel A
Residuals from Regressions in Adjacent Years
Years Correlation1995-1996 .904
1996-1997 .890
1997-1998 .922
1998-1999 .838
Panel B
Principal Components from (5 X 5) Covariance Matrix of Residuals18
PrincipalComponent
Eigenvalue Cumulative %of Variance Explained
1 4.386 87.7%
2 0.274 93.2%
3 0.200 97.2%
4 0.075 98.7%
5 0.065 100%
Panel C
Year Correlation,
PPP and AtlasResiduals
Number of Countries
Atlas Residualsin Adjacent Years
1996 0.829 131 Years Correlation
1997 0.793 140 1996-1997 0.873
1998 0.781 145 1997-1998 0.880
1999 0.779 146 1998-1999 0.864

8/7/2019 political freedom and economic prosperity
http://slidepdf.com/reader/full/political-freedom-and-economic-prosperity 54/56
Freedom and Prosperity, June 19, 2003
53
Table A-2. Exogenous Income Correlates vs. Residuals
from Cross-Country Regressions of GNI/Capita on Mutable Determinants
Residuals from the cross-country regressions in Table 5 are related to geographic, linguistic, and religious variables. Simplebivariate correlations are underlined in Panel A. Their t-statistics are italicized. Correlations significant at the 95% level or higher are bordered. Panel B gives summary statistics for multiple regressions of the residuals against all the exogenous correlates.
Panel A
% of population speaking % of population who avow they areYear
Absolute
Latitude English French Spanish Buddhist Catholic Confucian Hindu Jewish Muslim Protestant
N19
0.170 -0.125 -0.060 0.027 -0.066 0.227 0.021 -0.116 0.145 -0.156 -0.1121995
1.977 -1.311 -0.619 0.280 -0.683 2.425 0.215 -1.212 1.527 -1.643 -1.174110
0.131 -0.081 -0.078 0.038 0.027 0.227 0.090 -0.060 0.141 -0.174 -0.1281996
1.568 -0.862 -0.836 0.405 0.288 2.481 0.957 -0.640 1.510 -1.875 -1.374115
0.166 -0.114 -0.002 0.022 0.023 0.174 0.053 -0.061 0.109 -0.106 -0.1001997
2.029 -1.222 -0.022 0.229 0.239 1.875 0.564 -0.648 1.170 -1.131 -1.063115
0.198 -0.085 -0.045 0.020 0.025 0.193 0.077 -0.055 0.164 -0.144 -0.09919982.505 -0.917 -0.483 0.217 0.267 2.132 0.838 -0.592 1.798 -1.569 -1.079
119
0.187 -0.134 -0.034 -0.002 0.024 0.149 0.057 -0.006 0.146 -0.086 -0.1021999
2.372 -1.458 -0.365 -0.026 0.262 1.622 0.614 -0.062 1.590 -0.934 -1.100118
Panel B
Year 1995 1996 1997 1998 1999
t-statistics > 1.96 0 0 0 0 0Adjusted R-Square 0.22 -.022 -.056 -.013 -.031
19 N=Number of countries with available language and religion data. For absolute latitude, the number of observations is the same as the number of countries in Table 5.
Table A-3. Alternate Specifications: Cross-Country Multiple Regressions of GNI/Capita.
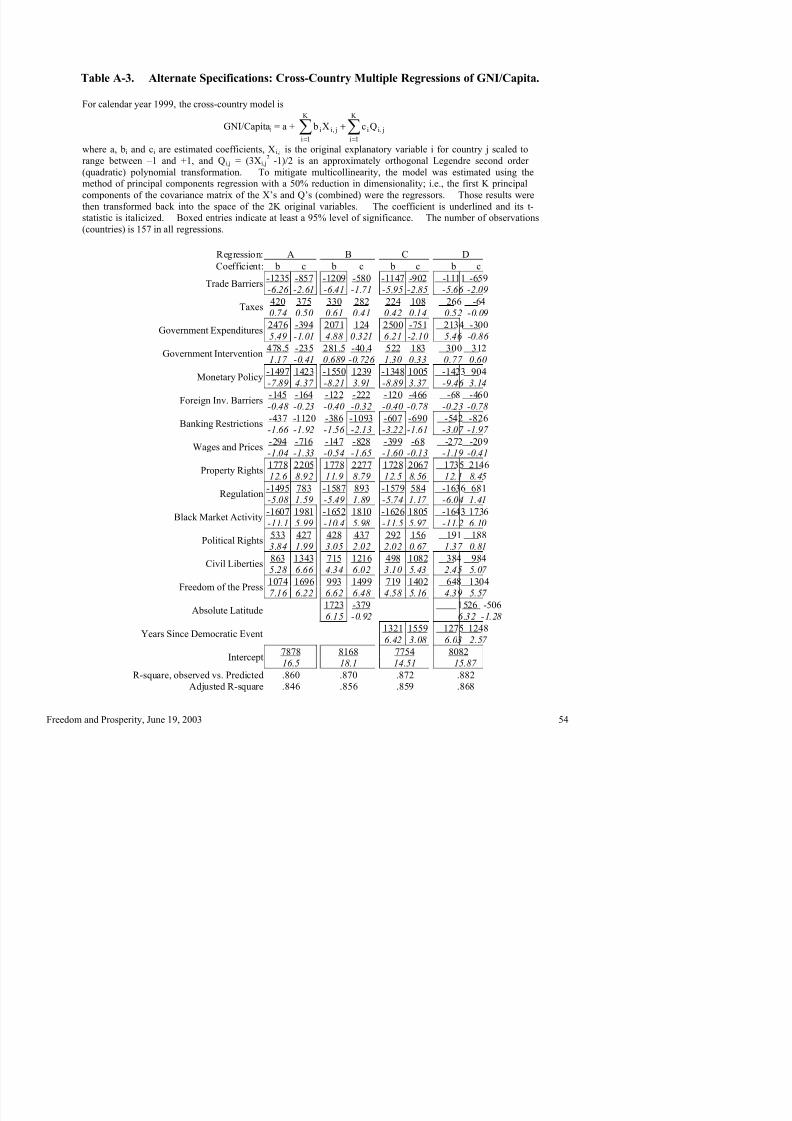
8/7/2019 political freedom and economic prosperity
http://slidepdf.com/reader/full/political-freedom-and-economic-prosperity 55/56
Table A 3. Alternate Specifications: Cross Country Multiple Regressions of GNI/Capita.
For calendar year 1999, the cross-country model is
GNI/Capitaj = a + ∑ ∑= =
+
K
1i
K
1i
j,iij,ii QcXb
where a, bi and ci are estimated coefficients, Xi,j is the original explanatory variable i for country j scaled torange between –1 and +1, and Qi,j = (3Xi,j
2 -1)/2 is an approximately orthogonal Legendre second order
(quadratic) polynomial transformation. To mitigate multicollinearity, the model was estimated using themethod of principal components regression with a 50% reduction in dimensionality; i.e., the first K principalcomponents of the covariance matrix of the X’s and Q’s (combined) were the regressors. Those results werethen transformed back into the space of the 2K original variables. The coefficient is underlined and its t-statistic is italicized. Boxed entries indicate at least a 95% level of significance. The number of observations
(countries) is 157 in all regressions.
Regression: A B C D
Coefficient: b c b c b c b c
-1235 -857 -1209 -580 -1147 -902 -1111 -659Trade Barriers
-6.26 -2.61 -6.41 -1.71 -5.95 -2.85 -5.66 -2.09
420 375 330 282 224 108 266 -64Taxes
0.74 0.50 0.61 0.41 0.42 0.14 0.52 -0.09
2476 -394 2071 124 2500 -751 2134 -300
Government Expenditures 5.49 -1.01 4.88 0.321 6.21 -2.10 5.46 -0.86 478.5 -235 281.5 -40.4 522 183 300 312
Government Intervention1.17 -0.41 0.689 -0.726 1.30 0.33 0.77 0.60
-1497 1423 -1550 1239 -1348 1005 -1423 904Monetary Policy
-7.89 4.37 -8.21 3.91 -8.89 3.37 -9.46 3.14
-145 -164 -122 -222 -120 -466 -68 -460Foreign Inv. Barriers
-0.48 -0.23 -0.40 -0.32 -0.40 -0.78 -0.23 -0.78
-437 -1120 -386 -1093 -607 -690 -542 -826Banking Restrictions
-1.66 -1.92 -1.56 -2.13 -3.22 -1.61 -3.07 -1.97
-294 -716 -147 -828 -399 -68 -272 -209Wages and Prices-1.04 -1.33 -0.54 -1.65 -1.60 -0.13 -1.19 -0.41
1778 2205 1778 2277 1728 2067 1735 2146Property Rights
12.6 8.92 11.9 8.79 12.5 8.56 12.1 8.45
-1495 783 -1587 893 -1579 584 -1636 681Regulation
-5.08 1.59 -5.49 1.89 -5.74 1.17 -6.04 1.41
-1607 1981 -1652 1810 -1626 1805 -1643 1736Black Market Activity
-11.1 5.99 -10.4 5.98 -11.5 5.97 -11.2 6.10
533 427 428 437 292 156 191 188Political Rights
3.84 1.99 3.05 2.02 2.02 0.67 1.37 0.81863 1343 715 1216 498 1082 384 984
Civil Liberties5.28 6.66 4.34 6.02 3.10 5.43 2.45 5.07
1074 1696 993 1499 719 1402 648 1304Freedom of the Press
7.16 6.22 6.62 6.48 4.58 5.16 4.39 5.57
1723 -379 1526 -506Ab l t L tit d
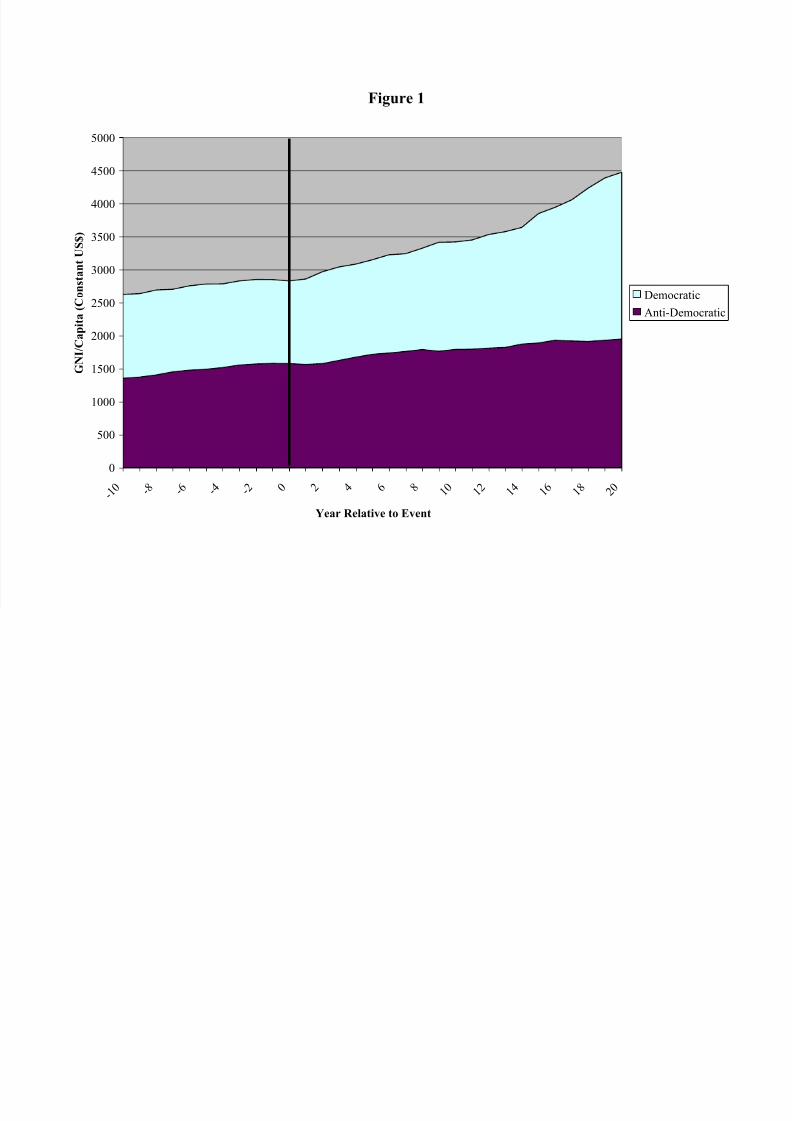
8/7/2019 political freedom and economic prosperity
http://slidepdf.com/reader/full/political-freedom-and-economic-prosperity 56/56
Figure 1
0
500
1000
1500
2000
2500
3000
3500
4000
4500
5000
-10 -8 -6 -4 -2 0 2 4 6 8 10 12 14 16 18 20
Year Relative to Event
GNI/Capita (Constant US$)
Democratic
Anti-Democratic